Assessment of Bacterial Aerosol in a Preschool, Primary School and High School in Poland
by
Ewa Brągoszewska
1, 
Anna Mainka
1,*, 
Józef S. Pastuszka
1, 
Katarzyna Lizończyk
2 and
Yitages Getachew Desta
1,3 1
Department of Air Protection, Silesian University of Technology, 22B Konarskiego St., 44-100 Gliwice, Poland
2
Adam Mickiewicz High School, Mickiewicza St. 11, 40-092 Katowice, Poland
3
Department of Environmental Health Science & Technology, Jimma University, 251 Jimma, Ethiopia
*
Author to whom correspondence should be addressed.
Atmosphere 2018, 9(3), 87; https://doi.org/10.3390/atmos9030087
Submission received: 31 January 2018
/
Revised: 19 February 2018
/
Accepted: 23 February 2018
/
Published: 27 February 2018
(This article belongs to the Special Issue Indoor Air Pollution)
Abstract
:The issue of healthy educational buildings is a global concern because children are particularly at risk of lung damage and infection caused by poor indoor air quality (IAQ). This article presents the results of a preliminary study of the concentration and size distribution of bacterial aerosol in three educational buildings: a preschool, primary school, and high school. Sampling was undertaken in the classrooms with an Andersen six-stage impactor (with aerodynamic cut-off diameters of 7.0, 4.7, 3.3, 2.1, 1.1 and 0.65 μm) during spring 2016 and 2017, as well as the outside of the buildings. After incubation, bioaerosol particles captured on nutrient media on Petri dishes were quantitatively evaluated and qualitatively identified. The highest average concentration of bacterial aerosol was inside the primary school building (2205 CFU/m3), whereas the lowest average concentration of indoor culturable bacteria was observed in the high school building (391 CFU/m3). Using the obtained data, the exposure dose (ED) of the bacterial aerosol was estimated for children attending each educational level. The most frequently occurring species in the sampled bacterial aerosol were Gram-positive cocci in the indoor environment and Gram-positive rod-forming endospores in the outdoor environment.
1. Introduction
Indoor air quality (IAQ) is becoming an increasingly important issue for occupational and public health because people spend more than 90% of the day in indoor environments [1,2,3,4,5]. One group of particular concern are children. They are more vulnerable to environmental pollutants compared to adults since they breathe more air relative to their body weight and they also have a lower ability to deal with the toxic chemicals due to their undeveloped airways [6,7,8].
According to the Central Statistical Office, in 2015 [9] there were more than 6.3 million children being educated in over 52,000 Polish preschools and schools, thus monitoring the air quality in educational buildings is a critical area of research. The studies carried out in educational buildings showed that poor IAQ in classrooms was demonstrated to exert a negative impact on children’s learning performance, with absenteeism and adverse health effects such as increased risk of asthma and other health-related symptoms [6,10]. Aerosol particles are one of the pollutants that can cause a decrease of IAQ in different educational buildings. These buildings offer unique chemical environments, not encountered in the natural world, that may enhance the development of bioaerosols [11]. Bioaerosols are a large category of airborne particles, comprising bacteria, fungi, viruses, pollen, and fragments of these or their metabolic products (e.g., mycotoxins), and endotoxins (part of the outer membrane of the cell wall of Gram-negative bacteria), and they can contribute to around 5–34% of indoor air pollution [12,13,14]. Bioaerosols can become a serious risk to the health of the population, airborne bacteria and fungi, in particular, can cause infectious diseases, allergic and toxic effects [11,15,16,17,18,19]. The majority of bacteria naturally present in air do not cause adverse health effects. Some bacteria are even essential to both the human body and the environment. Health risks appear when the concentrations of some species become abnormally high or for certain people suffering from respiratory problems, exposure to bacteria may promote the appearance of symptoms and illness. The effects felt depend on the species present, the metabolic products produced, the concentration and duration of exposure, and individual susceptibility. The main health effects associated with exposure to bacteria are hypersensitivity reactions (allergy), infections and irritation [20]. The sampling and analysis of the microbiological quality of air in educational buildings has drawn our attention in recent years because the air quality in these buildings is becoming increasingly important. Studies have been conducted all over the world to determine and improve the current state of IAQ knowledge [6,10,21,22,23]. The majority of studies focused only on the total concentration of biological aerosols, however, this information is indispensable for the assessment of population exposure, as well as for the identification of the sources of biological aerosol emissions.
To undertake an effective assessment of the potential public health risks, the exposure to bioaerosols in educational buildings should be included. Exposure refers to any contact between an airborne contaminant and is expressed quantitatively by a description of the duration of the contact and pollutant concentration. Thus, indoors a concentration is a surrogate measurement of exposure, but is valid only to the degree that it approximates the concentrations actually experienced by each individual in the room. Generally, health effect is linked to exposure, defined as the mathematical product of the concentration of the pollutant and the time during which a person is exposed to this concentration. A better tool to evaluate the amount of the pollutant that actually crosses the body’s boundaries and reaches the target tissue (for example, respiratory tract epithelium) is a dose [24,25]. Differences in the ventilation of humans, particularly younger ones, mean that identical exposure may not result in identical dose.
Personal exposure levels and individual susceptibilities are highly variable and this explains why an inhalation dose has not been established to characterize children’s real risk from the exposure to bioaerosols that results from educational activities.
Another important aspect is the size distribution. Bioaerosols vary considerably in size from approximately 0.02 to 100 µm. Given the potential of airborne bioaerosols to cause disease, the information on the total concentration of bioaerosol particles is insufficient. In practice, information related to particle size distribution is critical [26]. The size distribution of bioaerosols depends upon the type of micro-organism species, the age of the spore and nutrient medium, humidity, differences in the aggregation rates of the spores and the type of particles they are associated with, such as mist or dust. It should be noted that bioaerosol particles could occur in the air as single cells or aggregates of cells, as well as in fragments. They are often transported attached to other particles, such as skin flakes, soil, dust, saliva or water droplets [27]. Generally, the term “bioaerosol” refers to a diverse variety of agents from biological sources found in indoor and outdoor environments. These contaminants include (1) viruses; (2) bacteria, including endotoxins from bacteria; (3) allergens, including house dust mite allergens and allergens from animal dander; and (4) fungi which may contain allergens, toxins, and irritants. Moreover, biological particles suspended in the air can be present in viable (culturable and non-culturable) as well as non-viable forms [28,29]. In our study, we concentrated on culturable bacterial aerosol. The level of bacteria was not limited to total concentration, but size distribution was performed because the highest health risk is associated with the presence of a respirable fraction in the air pollutants. Small particles, around the size of a bacterium (<5 µm), deposit in the alveoli, while larger particles (>10 µm) deposit in the upper respiratory tract and can develop allergic symptoms. Thus the importance of respirable particles for infection, microbial survival and deposition are clear.
The study includes four aspects. The first but not principal aim was to investigate the concentration levels of culturable airborne bacteria in three different educational buildings: a preschool (P), primary school (S) and high school (H). The second aim was to determine the size distributions of airborne bacteria, paying particular attention to the respirable fraction. The third aim was to identify the dominant bacterial genera, both indoor and outdoor, in order to examine the difference between the bacterial community structure in the studied educational buildings. The fourth and the most important aim of our study was to compare the dose of inhaled bacterial aerosol between children at different educational levels.
Furthermore, there are currently no formally regulated standards for bioaerosol levels in Poland. Thus, this study can increase awareness and provide references for a better understanding of IAQ in educational buildings.
2. Materials and Methods
2.1. Sampling Sites
The study was carried out in three educational buildings (preschool, primary school, and high school) located in the industrial region of Upper Silesia, Poland. There are 4.5 million people living in the region, including 725,000 children attending school in 5000 buildings (16% of the population) [9]. In all buildings, IAQ is primarily ensured by means of stack ventilation and airing through open and unsealed windows. In school buildings, airing is performed during breaks when children leave the classrooms. In the preschool building, the windows were opened when children went to the toilet. According to Polish legislation, the ventilation system in each educational building is checked each year and should ensure 3–5 air changes per hour. We were unable to measure in this study whether the buildings met this requirement. In both school buildings the deep wet cleaning was made once a day after the occupancy period. The cleaning schedule inside the preschool is different from the primary and high school buildings. The deep cleaning of classrooms occurs in the morning or at the end of the afternoon when children are not in the classrooms, and daily wet cleaning in corridors and common spaces is conducted while children are occupying the classrooms. The basic environmental parameters and a short description of the educational buildings are presented in Table 1.
As can be seen from Table 1, the average RH (relative humidity) measured in the classrooms was less than 30%, which is below the recommended comfort range of 30–60% for indoor air. Although low relative humidity (<60%) is desired to prevent mold formation, too low humidity levels (<30%) also cause a sensation of dryness and irritation and other increased health complaints such as drying mucous membranes and increased risk of catching colds [19]. Moreover, poor humidification tends to favor the proliferation of respirable pathogens and reduces the protection of the respiratory system [30,31]. Low RH was reported in our previous studies [32,33] and is common in other countries [18,19].
2.2. Sampling and Analysis Methods
The research was conducted during the spring of 2016 and 2017, in the classrooms as well as outside of the buildings. Spring was selected because it typically has the highest concentration of bioaerosols. The studies presenting seasonal fluctuations of bioaerosol concentrations, the size distribution of bacterial aerosols and their relationship with different meteorological factors [34,35] as well as our studies performed in the Upper Silesia Region indicate the highest concentration of airborne bacteria aerosols during spring [36,37,38]. In winter, extreme conditions such as low temperatures and the heaviest rainfall and snowfall of the year result in the decrease of bacteria levels. Although summer prevails as the most favorable conditions for the growth of bacteria, during our previous studies we observed a decrease of bacteria concentrations. The reason for this decline is high temperatures and intense UV radiation. As indoor air is predominantly influenced by outdoor air, in this study we concentrated on spring.
The samples of bacterial aerosols were collected in the center of each classroom and taken at the height of the children’s breathing zone, about 1 m from the ground in the preschool and the primary school, and about 1.5 m from the ground in the high school. Three to four sets of measurements were performed in every classroom and also outdoors in the playground of each building between 9–12 a.m. During sampling campaigns, teachers were asked to keep the windows closed. In total, 300 Petri dishes with biological material were analyzed.
Measurement of the bioaerosol concentrations was conducted using a six-stage Andersen impactor (Thermo Fisher Scientific, Waltham, MA, USA)—one of the most popular and frequently-used reference devices in biological aerosol studies—with cut-off diameters of 7.0, 4.7, 3.3, 2.1, 1.1 and 0.65 µm. This sampler works by air aspiration through multiple-hole stages, below which is placed a Petri dish containing the appropriate agar media. Air drawn through a jet is deflected 90 degrees by the agar surface below the jet. Through the inertial impaction, micro-organisms are transferred from the air onto the agar surface. Each stage has 400 round holes with decreasing (from stage to stage) diameters.
During the measurements, the air flow was 28.3 dm3/min and the sampling time, calculated following Nevalainen et al. [39] was 10 min. Before and after sampling, the flow rate was measured using a rotameter. Microorganisms were collected on nutrient media (specific to bacteria) in Petri dishes located at all impactor stages. Trypticase soy agar (TSA) was used, with cycloheximide added to inhibit fungal growth.
The medium was prepared and sterilized in an autoclave prior to being poured into the Petri dishes. Before and between sampling, the impactor was sterilized using methyl alcohol and periodically cleaned using an ultrasonic cleaner.
2.3. Laboratory Analysis
Bioaerosol particles sampled on Petri dishes inside the Andersen impactor were incubated for 48 h at 36 ± 1 °C. Concentrations were counted as the number of grown colonies and expressed as colony-forming units per cubic meter (CFU/m3) using positive-hole corrections.
Microscopic analysis of the collected bacteria was based on Gram strain preparations and on cell size, shape and the appearance of spores. The possibility of cultivating the strains isolated on the agar medium with the addition of blood (trypticase-soy agar with 5% sheep blood) was also estimated. The bacteria were characterized in terms of their metabolic characteristics by using the biochemical test API (analytical profile index), which is supported by APIweb (bioMérieux, Marcy-l’Etoile, France). The following API systems were used: API 20E, API 20NE, API 50CH, API CORYNE, API STAPH, and API STREP.
2.4. Statistical Analysis
All statistical analyses were performed using the Statistica 12 statistical package (StatSoft). The concentration values reported below were presented as the mean values and standard deviation. Due to a nonparametric distribution of the collected data (analyzed with the Shapiro–Wilk test), results were analyzed using the Mann–Whitney U test to assess differences at the sampling sites. Statistically significant differences were determined when the probability p-value was lower than 0.05.
3. Results and Discussion
In order to measure and assess air hygiene in crucial environments such as educational buildings, a simple and low-cost method was used. Impaction-based methods such as those using the Andersen 6-stage cascade sampler have many benefits. Sampling air directly on to agar, means that no post-sampling plating or dilutions have to be carried out. This saves time and also reduces the contamination risk due to minimal post-sampling manipulation of plates [26]. It is worth underlining that the use of TSA agar is cheap, and the results are rapid. Moreover, combining with an active air sampler that distinguishes particles by size, such as the Andersen six-stage impactor, could be a viable and robust method for sampling bioaerosols in a wide range of environments.
3.1. Total Concentration of Bacterial Aerosol
Table 2 presents the average concentrations of bacterial aerosol collected in the indoor and the outdoor air of different educational buildings. The average concentration outside of all buildings was 325 CFU/m3. The highest concentration was found outside the (P) building (551 CFU/m3), whereas the lowest was outside the (H) building (213 CFU/m3). Thus, the difference between the concentrations of bacterial aerosols found outside of the (P) and (H) buildings is statistically significant (p = 0.004) (see Table S1 for p-values). The outdoor concentration of bacterial aerosol between the (S) and (H) buildings was the most similar (p = 0.76), the concentration outside the (S) building was 13% higher than outside the (H) building. However, the outdoor concentrations between the (P) and (S) buildings were not significantly different (p = 0.07).
In the case of indoor air, the differences between buildings were more significant than in the case of outdoor air. The highest average concentration of bacterial aerosol (2205 CFU/m3) was found inside the classroom of the primary school and the lowest value of the total average concentration of bacterial aerosol was found in the high school (391 CFU/m3), whereas the concentration inside the preschool was 1408 CFU/m3. The difference between bacterial aerosol concentrations in the classrooms was statistically significant in the case of the (H) building in comparison to both lower educational buildings. The Mann-Whitney U test confirmed significant differences between the bacterial aerosol concentration in the (P) and the (H), as well as in the (S) and (H) classrooms, with p-values <0.05. The concentrations inside the (P) and (S) buildings were not significantly different (p = 0.57).
The total concentrations of bacterial aerosol obtained in the indoor air of the primary school and the preschool were at a level comparable with the previous study conducted in the 2014 spring season in the preschools, from 2545 to 2890 CFU/m3 [42]. Studies carried out in three elementary schools in the city center of Lisbon (Portugal) during December 2008 showed that the concentration of bacteria monitored by active sampling in the indoor air of classrooms ranged from 500 to 1600 CFU/m3 [43]. A study conducted by Yang, et al. [44] in South Korea in 55 different public schools (nursery schools, elementary schools, middle schools and high schools) from July to December 2004, reported that the average concentration of bacterial aerosol collected using an RCS sampler (Biotest air samplers, Merck Darmstadt, Germany), in selected classrooms ranged from 1260 to 1400 CFU/m3. Studies of indoor air quality using the active sampling method in five primary schools in Malaysia reported that the average bacterial concentration was 1025 CFU/m3 [45]. However, the results obtained in our studies in the high school were lower in comparison with educational buildings dedicated to younger children (primary school, preschool). The smaller number of students in the high school classrooms can explain this difference. The microbial concentration of indoor air in the school is affected by many factors, but the most important of these is the number of children in the classroom and their physical activity [22,46]. Similar results were obtained using open agar plates (passive method), in a college in Saudi Arabia from October to February 2015, where the average concentration of bacteria aerosol in classrooms was 290 CFU/m3 [47]. In 2009, Soto et al. conducted a study during March 2009 in a university in Spain and found that the average concentration of bacteria collected using by a portable MAS-100® air sampler (Merck Darmstadt, Germany) during a lecture was 338 CFU/m3 [48]. Following D’Arcy et al. [26] it should be underlined that with the use of different equipment, sampling methods and environmental conditions, it is impossible to make a successful comparison of the work carried out to build a picture of what is present in the air we breathe. Therefore, a standard and simple method such as the one proposed would be beneficial. Further research must, however, be conducted to test the validity of the proposed method, and it is noted that the type of sampling conducted in any environment is dependent on the goal of the sampling.
In Poland, the legislation governing microbiological standards for air pollution has not been developed and implemented. A wide review of the propositions for public service buildings can be summarized according to the following proposal: mesophilic bacteria of 5000 CFU/m3 [49]. Since appropriate standards and guidelines do not yet exist, expertise must be sought and research must be conducted to determine acceptable contaminant concentrations and exposures. The concentration levels of airborne bioaerosols obtained in our study are below these proposed standards. Research by the Occupational Health and Safety Research Institute Robert Sauvé (IRSST) indicates that microbial contamination is possible in cases where the total airborne bacteria concentrations are above 1000 CFU/m3, a factor that justifies further investigation and action [20].
3.2. Indoor/Outdoor Ratio
During bioaerosol sampling in any indoor environment, outdoor bioaerosol sampling should be performed for comparison of indoor and/or outdoor source strengths. Comparing the bioaerosol levels present in indoor environments with those in outdoor areas can be a useful tool to indicate whether the concentration of indoor bioaerosols is affected by both indoor and outdoor environments [19]. The indoor-to-outdoor ratio (I/O) shows us where the source of bioaerosol might be found. The average I/O ratio calculated for all indoor and outdoor bacteria concentrations was 2.55 for the preschool, 8.96 for the primary school and 1.83 for the high school (Table 2). Since the I/O ratio was >1 it can clearly be concluded that the major sources of bacterial aerosol are internal sources, such as building occupants, in this case, children/students and their activities, as well as building materials that host microbiological growth. The studies carried out in the school’s buildings in Portugal showed that the I/O ratio of bacteria was 16.33 [6]. The I/O ratio value obtained in a kindergarten in Ankara, Turkey was 73.53 [19]. A lower I/O ratio of bacterial aerosol (1.8), similar to the (H) building, was found in the elementary schools in Korea [50]. When bioaerosols have indoor sources, ventilation plays an important role in improving the quality of indoor air [14,18]. Particularly in the (S) building, additional actions should be taken to enforce an effective improvement of IAQ in this school.
3.3. Size Distribution of Bacterial Aerosol
Figure 1 presents the analysis of the number and aerodynamic diameter of viable micro-organisms collected from the different stages of the impactor in all the studied educational buildings. It can be seen that the size distribution of bacterial aerosol in the outdoor air reached a maximum concentration of bacteria at the same range of diameters (3.3–7 µm). The high proportion of bacterial particles with an aerodynamic diameter of >3.3 µm may be partially caused by the aggregation of some fine bacterial cells on the surface of non-biological coarse particles [36,42].
The statistical analysis of the bacterial size distribution in the outdoor air points to significant differences in the first and second stages of impaction (the particles > 4.7 µm) in the samples collected outside the (P) building in comparison with the ambient air of the (S) and (H) buildings. The difference in size distribution outside the (S) and (H) buildings was not statistically different (p > 0.05) (see Table S1 for statistics).
The statistical analysis of the size distribution in the samples collected inside the classrooms revealed significant differences between the high school and the lower educational buildings. At all stages of impaction, the concentration of culturable bacteria was significantly different between those of the (H) and (P) classrooms and those of the (H) and (S), whereas the size distribution of the samples collected in the (P) and (S) buildings were not statistically different. The similar size distribution of bacterial aerosol in lower educational buildings might be connected with the similar activity patterns of children. Younger school children are more physically active than teenagers, who spend most of their time in sedentary or passive positions.
Figure 1 shows that respirable particles, less than 4.7 µm, are more prevalent in indoor air. The contribution of respirable particles in P–S–H was 73%–82%–84%, respectively. Simultaneously, the distribution of respirable particles (smaller than 4.7 µm) was significantly different between all schools (see Table S1 for statistics), These respirable particles mostly deposit in either the tracheal, bronchial or alveolar region of the lungs. Considering the reports [51,52] that the ratio of respirable airborne bacteria inside the public buildings ranged between 30% and 60%, the range reaching 80% revealed through this study is likely to be a serious level.
3.4. Identification of Bacterial Aerosol
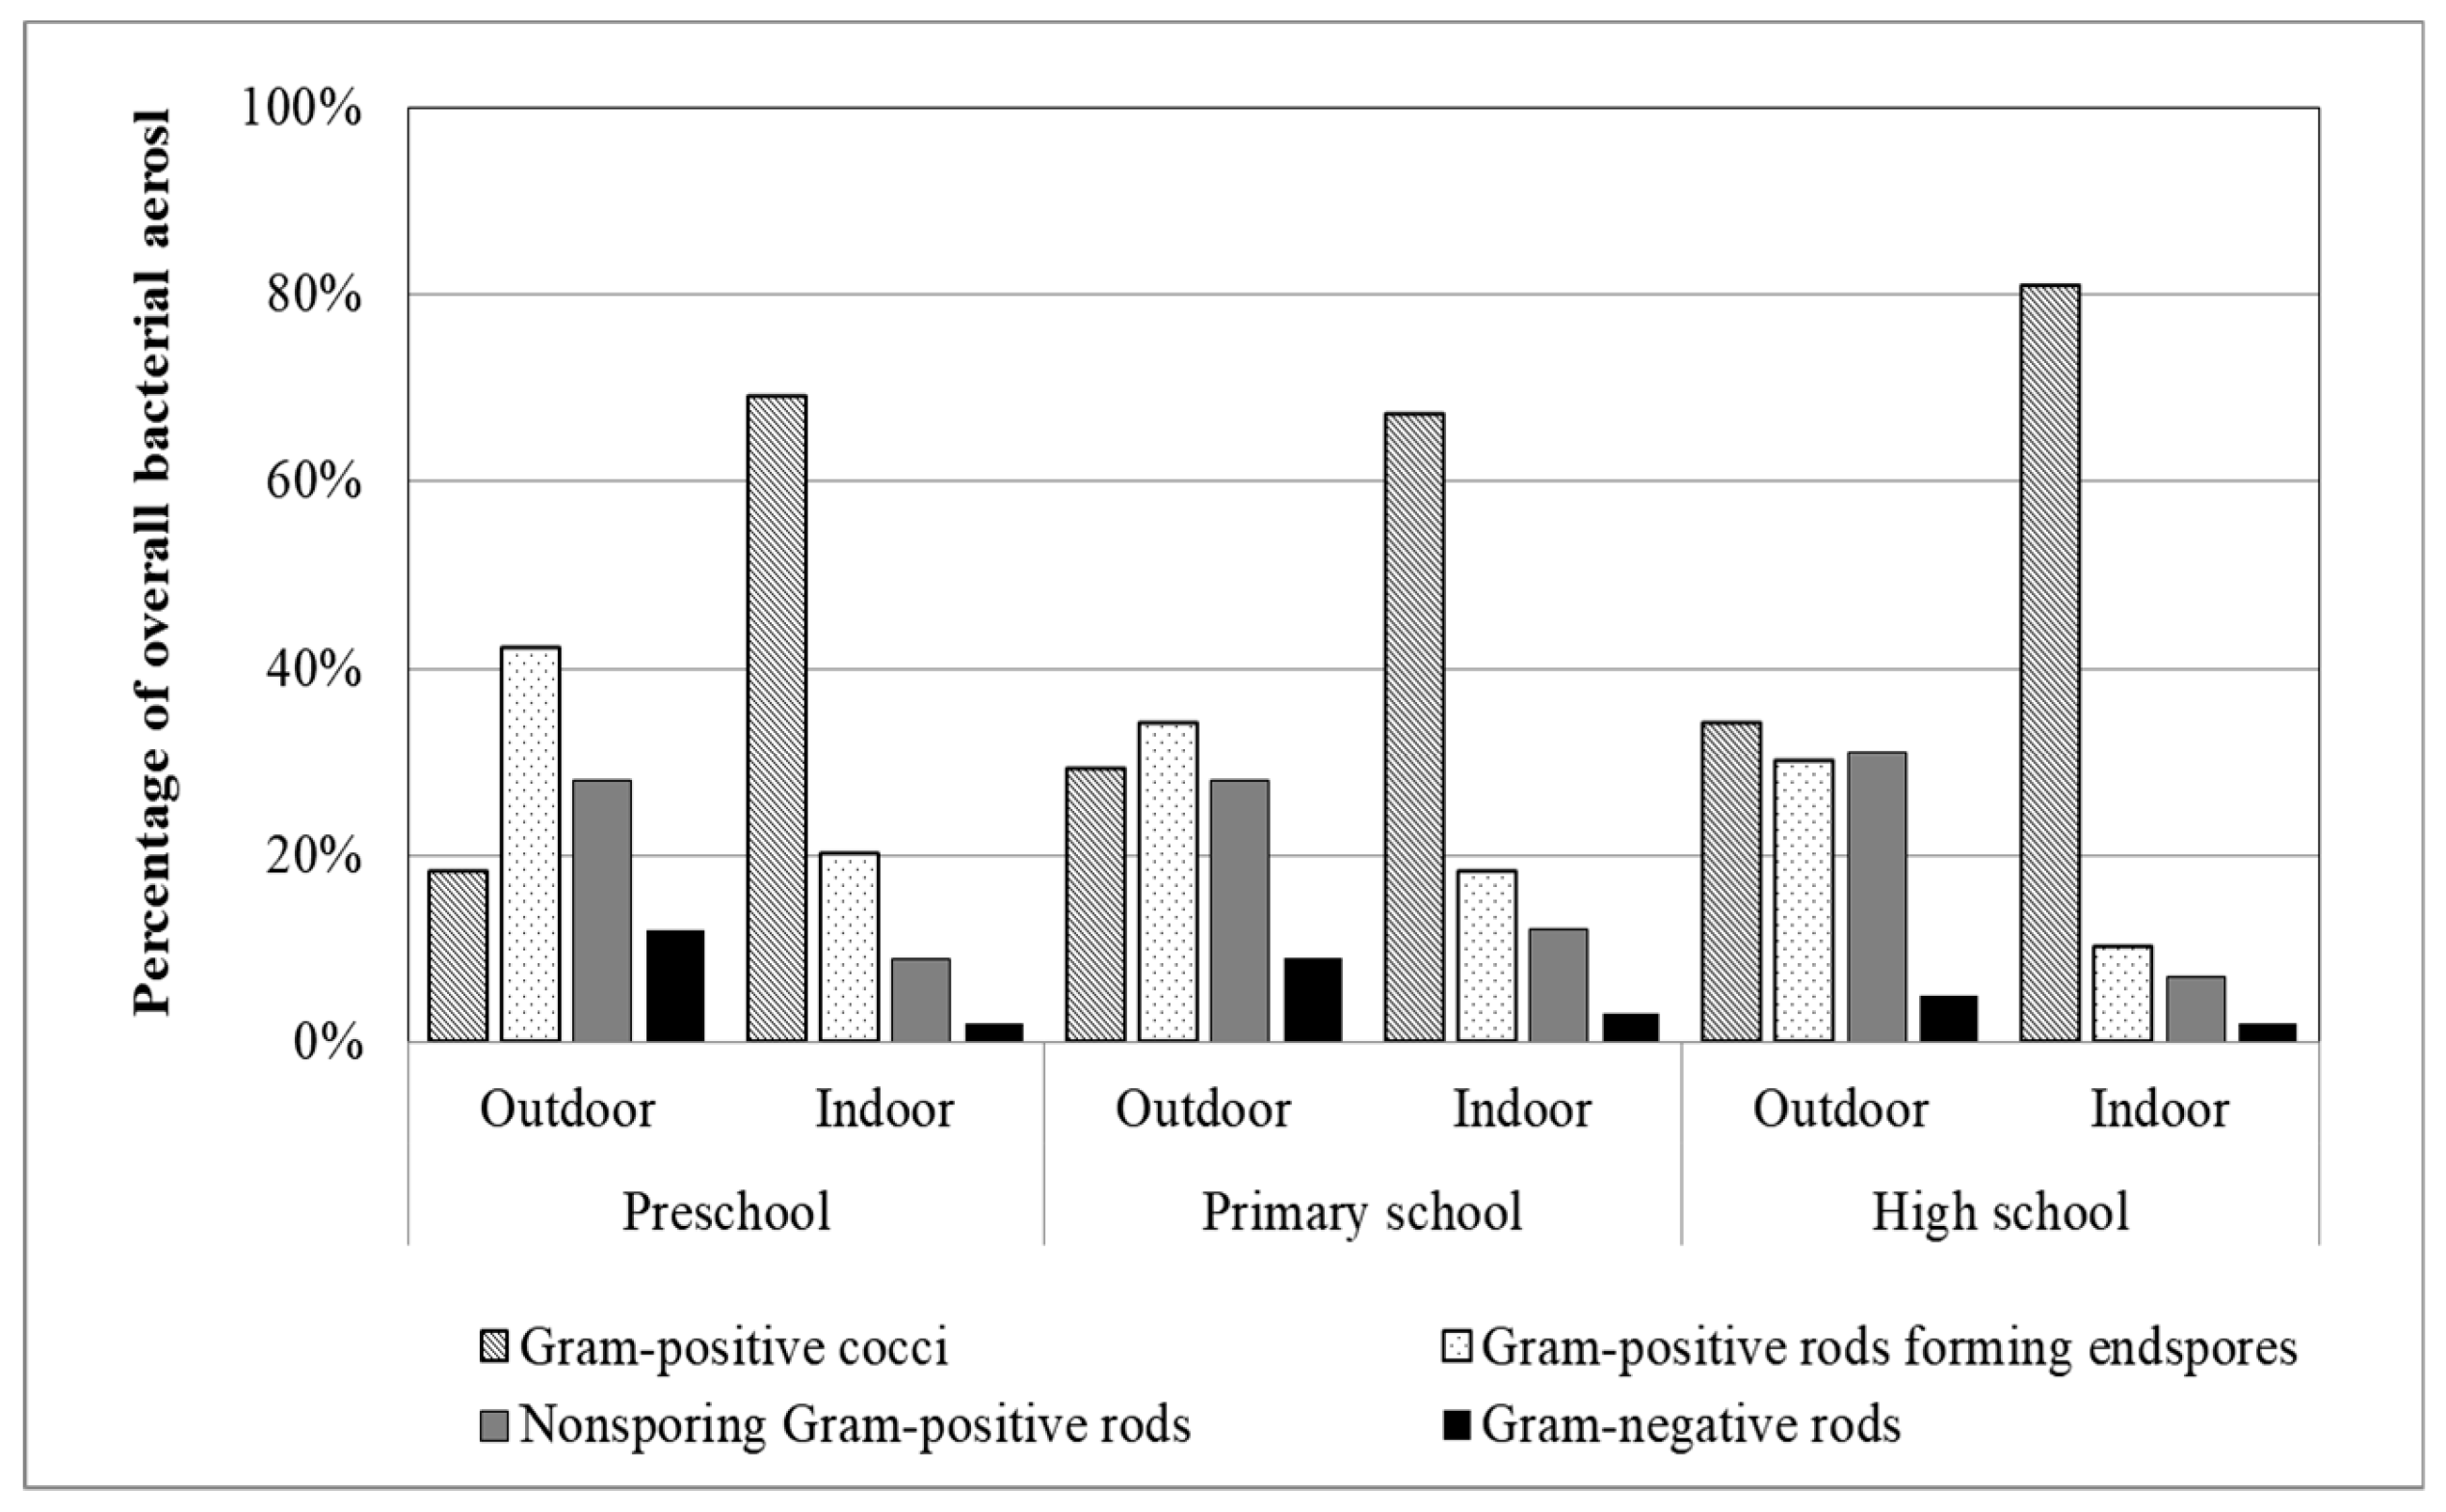
The microbiological indoor air quality of educational buildings is an important factor for children’s health because the school serves as their daily environment. The percentage composition of bacterial aerosols sampled in the studied educational buildings is shown in Figure 2. The results of bacterial species identification for aerosol in the indoor air revealed that the largest groups of bacteria were Gram-positive cocci. Gram-positive cocci were found to be the dominant bacteria group in primary schools in Edirne, Turkey [10], in schools in Ankara, Turkey [18], in Lublin, Poland [22], and in a child care center in Korea [51]. Quality characteristics of bacterial flora composition in university rooms in Poznań, Poland also showed a dominating contribution of Gram-positive cocci [53]. In turn, the most frequently isolated group of bacteria outdoors was Gram-positive rod-forming endospores, which is also in agreement with other reports [10,54,55].
Detailed analysis of the isolated bacteria indicates the occurrence of 16 species, belonging to six genera. The most frequently occurring were the bacteria types Staphylococcus (four species) and Bacillus (five species). Among them, the following bacterial species could be identified: Gram-positive cocci: Staphylococcus lentus, Staphylococcus epidermidis, Staphylococcus sciuri, Staphylococcus chromogens, Kocuria rosea, Micrococcus spp.; endospore-forming Gram-positive bacilli: Bacillus circulans, Bacillus subtilis, Bacillus mycoides, Bacillus cereus, Bacillus pumilus; nonsporing Gram-positive rods: Brevibacterium spp., Corynebacterium auris, Corynebacterium tuberculostearicum, Corynebacterium propinquum; and Gram-negative rods: Pseudomonas spp.
In our study, the most isolated genus of indoor bacteria was Staphylococcus. This genus of bacteria, which causes synthetic disease in humans through either toxin production or penetration, particularly affects children’s health [56]. The results of the bacterial species identification for aerosols in the outdoor air revealed that the largest groups of bacteria were Gram-positive bacilli. Organisms in this group are common in samples of food, water or soil and some of them can cause human infections [57,58]. The virulence of Gram-positive rod-forming endospores is highly variable, many of them have the potential to be opportunistic pathogens, capable of producing disease only in persons with compromised host resistance [10], a particular characteristic of children. The second most-commonly-isolated genus of bacteria in the outdoor air was Corynebacterium, which is widely distributed in soil and water and on the skin of humans and animals [59]. Some species of Corynebacterium have been reported to cause various health hazards in humans. For example, Corynebacterium tuberculostearicum is a dust-borne Corynebacterium that has been found in households [60] and is reported to be one of the main constituents of the skin microbiome [61]. However, the pathogenic potential of C. tuberculostearicum [62] has also been found and confirmed to be associated with childhood asthma [63].
It can be seen that in the interior of all the studied buildings, the peak of the airborne bacteria drifted into smaller particles compared to the size distribution outdoors. Generally, such a process makes the indoor bioaerosol more inhalable and possibly more toxic but, fortunately, the contribution of Gram-negative bacteria decreased indoors. This group of bacteria possesses strong allergens that affect human health and are associated with respiratory diseases. The inhalation of these bacteria and bacterial endotoxins have a recognized association with numerous allergenic responses and respiratory symptoms [56]. Exposure to endotoxins in childhood appears to have had detrimental effects on healthy volunteers, causing asthma and other respiratory conditions [64,65,66].
3.5. Exposure Dose (ED)
The US EPA (Environmental Protection Agency) encourages researchers to assess the risks of environmental exposure for all susceptible populations. This ED has been calculated on the basis of the EPA’s Child-Specific Exposure Factors Handbook [67] and other publications [68,69,70]. Total concentrations were used in the calculation of the inhaled dose of airborne bacteria. Although particles with an aerodynamic diameter of >10 µm cannot usually be inhaled, their total contribution in suspended particles (<100 µm) is not significant. The calculations were based on the following equation:
where:
- ED is the exposure dose for the indoor environment, CFU/kg
- C is the bacterial aerosol concentration, CFU/m³
- IEF is the indoor exposure fraction: hours spent over a day in each educational building, with diverse activity patterns (seven hours)
- IR is the inhalation rate coefficient characteristic for selected activity levels, m³/h [70]
- BW is the mean body weight, kg.
A teachers’ time-budget survey was used to acquire information about children’s activities during the day. A summary of the information obtained from the application of this questionnaire is presented in Table 3.
We calculated the exposure by summing the time-weighted exposures that occurred at each educational stage. This approach increases the accuracy of risk assessments because it takes life-stage differences into account, particularly different activity patterns and body weight.
Children in each building were exposed to different levels of bacterial aerosol. As can be seen (Table 3), the concentration of bacterial aerosols does not determine the magnitude of inhaled dose. The highest concentration of bacterial aerosol was found in the primary school building, while the highest dose was observed in the preschool. Thus, the most important agent is the body weight (from 19 to 62 kg). The second most influencing factor is the difference in activity level. According to the teacher’s survey, during seven hours of presence in educational buildings, each group of children was characterized by different activity patterns. Only the youngest children performed a high-intensity physical activity (gymnastics) in the classroom, while for the older children over 70% of time was spent in a passive position (Table 3).
As adverse health effects strongly depend on the absorbed dose of air pollutants, it could be one of the reasons why children, especially those who started their preschool education, are frequently sick. In addition, the infectious diseases among smaller children spread more rapidly in comparison to adults. Moreover, in the preschool age group, there is no proper awareness of the importance of hygiene in the prevention of infection. Inadequate hand washing, direct contact during the classes, as well as being in constant motion favor the spread of bacterial infections, which increases the risk of exposure to harmful microorganisms [71].
4. Conclusions
To our knowledge, this is the first study in Poland that has investigated the levels and size distribution of airborne bacteria in indoor air in different educational buildings. It was found that in terms of total concentration and size distribution, indoor bioaerosol levels vary between types of educational buildings. The levels in the high school classrooms were particularly different to those found in the other classrooms.
The highest average concentration of bacterial aerosol was found inside the primary school building (2205 CFU/m3), while the lowest average concentration of indoor culturable bacteria was observed in the high school building (391 CFU/m3), whereas the concentration inside the preschool was 1408 CFU/m3. The concentration indoors was two to even nine times higher than outdoors (P–S–H OUT: 551 CFU/m3, 2205 CFU/m3, 391 CFU/m3, respectively). The obtained results indicate the significant role of indoor emission sources in educational buildings.
The size distribution of bacterial aerosols inside the classrooms indicates that smaller particles are more prevalent in indoor air. The highest number of culturable bacteria was isolated for particles <4.7 µm, which is respirable and thus has the potential to be deposited either in the tracheal, bronchial, or alveolar regions of the lungs. Moreover, the distribution of respirable particles were significantly different between all schools. The contribution of respirable particles in P–S–H was 73%–82%–84%, respectively. This results additionally increase the health risk for the exposed users of the educational buildings.
Our results show that the dominant airborne bacteria species detected in the outdoor air differed from those detected in indoor air. Gram-positive cocci were dominant in the indoor air. The contribution of this group of bacteria in P–S–H was 69%–67%–81%, respectively. This group of bacteria migrates from the respiratory system and human body. The outdoor environment is dominated by Gram-positive rod-forming endospores. This group in P–S–H was 42%–32%–30%, respectively. The main source of these bacteria is water and soil.
Evidence continues to emerge showing that poor IAQ in classrooms is playing an important role in the assessment of the effects of children’s personal exposure to air pollution. Moreover, there is agreement on the harmful effects of bioaerosols on children’s health. However, the use of concentration alone to evaluate the absorption of air pollution into the body is not sufficient. In our evaluation, we used an exposure dose—the number of bacteria aerosol to which an individual child is exposed during presence in the preschool, primary school or high school per kg of body weight. The highest intake dose (489 CFU/kg) according to the lowest body weight and the highest inhalation rate was estimated for preschool children, while the lowest was for teenagers in the high school building.
This study was limited to a certain geographic area and cannot be readily generalized to the population of Polish children as a whole. However, this study presents three different locations and three particularly different groups of children, thus assessors may use these data, if appropriate, to assess scenarios characteristic of preschool, primary school and high schools.
Moreover, there are limitations to the culture-based method employed in the present study. This method probably accounts for only ~10% of the total microorganisms, however, the results of this campaign may still be useful in developing control devices for bacterial aerosols and in predicting of the occurrence of diseases caused by bioaerosols.
Nevertheless, to precisely anticipate the adverse health effects caused by the exposure to airborne bacteria, the taxonomic identification of collected bacterial particles should be made. If not, the typical percentage of genera/species in the total bacteria concentration around the sampling point could be assumed using the literature data. It should be noted that such an approach may be applied in the preliminary assessment of the influence of bacterial aerosol on human health only.
Supplementary Materials
The following are available online at https://www.mdpi.com/2073-4433/9/3/87/s1, Table S1: The statistical p-values (Mann-Whitney U Test) of the sample mean difference between two compared groups: primary school–preschool (S–P), preschool–high school (P–H) and primary school–high school (S–H).
Acknowledgments
This work was supported by the Faculty of Power and Environmental Engineering, Silesian University of Technology (statutory research).
Author Contributions
Ewa Brągoszewska performed the experiments and drafted the manuscript. Anna Mainka prepared the final manuscript. Jozef S. Pastuszka helped with the data analysis. Katarzyna Lizończyk and Yitages Desta helped in laboratory analysis.
Conflicts of Interest
The authors declare no conflict of interest.
References
- Reynolds, S.J.; Black, D.W.; Borin, S.S.; Breuer, G.; Burmeister, L.F.; Fuortes, L.J.; Smith, T.F.; Stein, M.A.; Subramanian, P.; Thorne, P.S.; et al. Indoor environmental quality in six commercial office buildings in the midwest United States. Appl. Occup. Environ. Hyg. 2001, 16, 1065–1077. [Google Scholar] [CrossRef] [PubMed]
- Ashmore, M.R.; Dimitroulopoulou, C. Personal exposure of children to air pollution. Atmos. Environ. 2009, 43, 128–141. [Google Scholar] [CrossRef]
- Wichmann, J.; Lind, T.; Nilsson, M.A.M.; Bellander, T. PM2.5, soot and NO2 indoor-outdoor relationships at homes, pre-schools and schools in Stockholm, Sweden. Atmos. Environ. 2010, 44, 4536–4544. [Google Scholar] [CrossRef]
- Wang, Y.F.; Wang, C.H.; Hsu, K.L. Size and seasonal distributions of airborne bioaerosols in commuting trains. Atmos. Environ. 2010, 44, 4331–4338. [Google Scholar] [CrossRef]
- Nasir, Z.A.; Colbeck, I.; Sultan, S.; Ahmed, S. Bioaerosols in residential micro-environments in low income countries: A case study from Pakistan. Environ. Pollut. 2012, 168, 15–22. [Google Scholar] [CrossRef] [PubMed] [Green Version]
- Canha, N.; Almeida, S.M.; do Carmo Freitas, C.; Wolterbeek, H.T. Assessment of bioaerosols in urban and rural primary schools using passive and active sampling methodologies. Arch. Environ. Prot. 2015, 41, 11–22. [Google Scholar] [CrossRef]
- Selgrade, M.K.; Plopper, C.G.; Gilmour, M.I.; Conolly, R.B.; Foos, B.S.P. Assessing the health effects and risks associated with children’s inhalation exposures—Asthma and allergy. J. Toxicol. Environ. Health Part A Curr. Issues 2008, 71, 196–207. [Google Scholar] [CrossRef] [PubMed]
- Branco, P.T.B.S.; Nunes, R.A.O.; Alvim-Ferraz, M.C.M.; Martins, F.G.; Ferraz, C.; Vaz, L.G.; Sousa, S.I.V. Asthma prevalence in Portuguese preschool children: The latest scientific evidence. Rev. Port. Pneumol. 2016, 22, 293–295. [Google Scholar] [CrossRef] [PubMed]
- CSO Central Statistical Office Education in 2015/2016 School Year. 2016. Available online: http://www.stat.gov.pl (accessed on 1 July 2017).
- Aydogdu, H.; Asan, A.; Tatman Otkun, M. Indoor and outdoor airborne bacteria in child day-care centers in Edirne City (Turkey), seasonal distribution and influence of meteorological factors. Environ. Monit. Assess. 2010, 164, 53–66. [Google Scholar] [CrossRef] [PubMed]
- Hewitt, K.M.; Gerba, C.P.; Maxwell, S.L.; Kelley, S.T. Office space bacterial abundance and diversity in three metropolitan areas. PLoS ONE 2012, 7, e37849. [Google Scholar] [CrossRef] [PubMed]
- Srikanth, P.; Sudharsanam, S.; Steinberg, R. Bio-aerosols in indoor environment: Composition, health effects and analysis. Indian J. Med. Microbiol. 2008, 26, 302–312. [Google Scholar] [CrossRef] [PubMed]
- Wang, W.; Ma, Y.; Ma, X.; Wu, F.; Ma, X.; An, L.; Feng, H. Diversity and seasonal dynamics of airborne bacteria in the Mogao Grottoes, Dunhuang, China. Aerobiologia (Bologna) 2012, 28, 27–38. [Google Scholar] [CrossRef]
- Faridi, S.; Hassanvand, M.S.; Naddafi, K.; Yunesian, M.; Nabizadeh, R.; Sowlat, M.H.; Kashani, H.; Gholampour, A.; Niazi, S.; Zare, A.; et al. Indoor/outdoor relationships of bioaerosol concentrations in a retirement home and a school dormitory. Environ. Sci. Pollut. Res. 2015, 22, 8190–8200. [Google Scholar] [CrossRef] [PubMed]
- Di Giulio, M.; Grande, R.; Di Campli, E.; Di Bartolomeo, S.; Cellini, L. Indoor air quality in university environments. Environ. Monit. Assess. 2010, 170, 509–517. [Google Scholar] [CrossRef] [PubMed]
- Adams, R.I.; Bhangar, S.; Pasut, W.; Arens, E.A.; Taylor, J.W.; Lindow, S.E.; Nazaroff, W.W.; Bruns, T.D. Chamber bioaerosol study: Outdoor air and human occupants as sources of indoor airborne microbes. PLoS ONE 2015, 10. [Google Scholar] [CrossRef] [PubMed]
- Nazaroff, W.W. Indoor bioaerosol dynamics. Indoor Air 2016, 26, 61–78. [Google Scholar] [CrossRef] [PubMed]
- Mentese, S.; Arisoy, M.; Rad, A.Y.; Güllü, G. Bacteria and fungi levels in various indoor and outdoor environments in Ankara, Turkey. Clean Soil. Air. Water 2009, 37, 487–493. [Google Scholar] [CrossRef]
- Mentese, S.; Rad, A.Y.; Arisoy, M.; Gullu, G. Seasonal and spatial variations of bioaerosols in indoor urban environments, Ankara, Turkey. Indoor Built Environ. 2012, 21, 797–810. [Google Scholar] [CrossRef]
- Goyer, N.; Lavoie, J.; Lazure, L.; Marchand, G. Bioaerosols in the Workplace: Evaluations, Control and Prevention Guide. Available online: http://www.irsst.qc.ca/en/publications-tools/publication/i/818/n/bioaerosols-in-the-workplace-evaluation-control-and-prevention-guide-t-24 (accessed on 1 July 2017).
- Salleh, N.M.; Kamaruzzaman, S.N.; Sulaiman, R.; Mahbob, N.S. Indoor Air Quality at School: Ventilation Rates and It Impacts Towards Children—A review. In Proceedings of the 2nd International Conference Environmental Science and Technology, Singapore, 26–28 February 2011. [Google Scholar]
- Dumała, S.M.; Dudzińska, M.R. Microbiological indoor air quality in Polish schools. Annu. Set Environ. Prot. 2013, 15, 231–244. [Google Scholar]
- Almeida, S.M.; Canha, N.; Silva, A.; Do Carmo Freitas, M.; Pegas, P.; Alves, C.; Evtyugina, M.; Pio, C.A. Children exposure to atmospheric particles in indoor of Lisbon primary schools. Atmos. Environ. 2011, 45, 7594–7599. [Google Scholar] [CrossRef]
- Watson, A.Y.; Bates, R.R.; Kennedy, D. Assessment of Human Exposure to Air Pollution: Methods, Measurements, and Models; 1988; ISBN 0309568269. Available online: https://www.ncbi.nlm.nih.gov/books/NBK218147/ (accessed on 1 July 2017).
- Zanobetti, A.; Schwartz, J. The effect of particulate air pollution on emergency admissions for myocardial infarction: A multicity case-crossover analysis. Environ. Health Perspect. 2005, 113, 978–982. [Google Scholar] [CrossRef] [PubMed] [Green Version]
- D’Arcy, N.; Canales, M.; Spratt, D.A. Healthy schools: Standardisation of culturing methods for seeking airborne pathogens in bioaerosols emitted from human sources. Aerobiologia (Bologna) 2012, 28, 413–422. [Google Scholar] [CrossRef]
- Nasir, Z.A.; Colbeck, I. Assessment of bacterial and fungal aerosol in different residential settings. Water Air. Soil Pollut. 2010, 211, 367–377. [Google Scholar] [CrossRef]
- Gołofit-Szymczak, M.; Górny, R.L. Bacterial and fungal aerosols in air-conditioned office buildings in Warsaw, Poland—The winter season. Int. J. Occup. Saf. Ergon. 2010, 16, 465–476. [Google Scholar] [CrossRef] [PubMed]
- Daisey, J.M.; Angell, W.J.; Apte, M.G.; Air, I.; Munksgaard, B.; Issn, I.A.I.R. Indoor air quality, ventilation and health symptoms in schools: An analysis of existing information. Indoor Air 2003, 13, 53–64. [Google Scholar] [CrossRef] [PubMed]
- Sato, J.; Denda, M.; Chang, S.; Elias, P.M.; Feingold, K.R. Abrupt decreases in environmental humidity induce abnormalities in permeability barrier homeostasis. J. Investig. Dermatol. 2002, 119, 900–904. [Google Scholar] [CrossRef] [PubMed]
- Limaye, R.B.; Padmalal, D.; Kumaran, K.P.N. Cyanobacteria and testate amoeba as potential proxies for Holocene hydrological changes and climate variability: Evidence from tropical coastal lowlands of SW India. Quat. Int. 2017, 443, 99–114. [Google Scholar] [CrossRef]
- Mainka, A.; Zajusz-Zubek, E.; Kozielska, B.; Bragoszewska, E. Investigation of Air Pollutants in Rural Nursery School—A Case Study. In E3S Web of Conferences; 2018; Volume 28, pp. 1–8. Available online: https://www.researchgate.net/profile/Ewa_Bragoszewska/publication/322360151_Investigation_of_air_pollutants_in_rural_nursery_school_-_a_case_study/links/5a56791045851547b1bf1d81/Investigation-of-air-pollutants-in-rural-nursery-school-a-case-study.pdf (accessed on 10 January 2018).
- Mainka, A.; Zajusz-Zubek, E. Indoor air quality in urban and rural preschools in upper Silesia, Poland: Particulate Matter and Carbon Dioxide. Int. J. Environ. Res. Public Health 2015, 12, 7697–7711. [Google Scholar] [CrossRef] [PubMed]
- Jones, A.M.; Harrison, R.M. The effects of meteorological factors on atmospheric bioaerosol concentrations—A review. Sci. Total Environ. 2004, 326, 151–180. [Google Scholar] [CrossRef] [PubMed]
- Li, Y.; Lu, R.; Li, W.; Xie, Z.; Song, Y. Concentrations and size distributions of viable bioaerosols under various weather conditions in a typical semi-arid city of Northwest China. J. Aerosol Sci. 2017, 106, 83–92. [Google Scholar] [CrossRef]
- Brągoszewska, E. Bacterial Aerosol Occurring in the Atmospheric Air in Gliwice and Its Share of the Total Human Exposure to the Bacteria Absorbed by Inhalation. Ph.D. Thesis, Silesian University of Technology, Gliwice, Poland, 2014. [Google Scholar]
- Brągoszewska, E.; Mainka, A.; Pastuszka, J. Bacterial and fungal aerosols in rural nursery schools in Southern Poland. Atmosphere (Basel) 2016, 7, 142. [Google Scholar] [CrossRef]
- Brągoszewska, E.; Mainka, A.; Pastuszka, J. Concentration and size distribution of culturable bacteria in ambient air during spring and winter in Gliwice: A typical urban area. Atmosphere 2017, 8, 239. [Google Scholar] [CrossRef]
- Nevalainen, A.; Pastuszka, J.; Liebhaber, F.; Willeke, K. Performance of bioaerosol samplers: Collection characteristics and sampler design considerations. Atmos. Environ. Part A Gen. Top. 1992, 26, 531–540. [Google Scholar] [CrossRef]
- PN-EN 12322 In Vitro Diagnostic Medical Devices. Culture Media for Microbiology. Performance Criteria for Culture Media. 2005. Available online: https://ec.europa.eu/growth/single-market/european-standards/harmonised-standards/iv-diagnostic-medical-devices_en (accessed on 1 June 2017).
- ISO 11133 Microbiology of Food, Animal Feed and Water—Preparation, Production, Storage and Performance Testing of Culture Media. 2014. Available online: https://www.iso.org/standard/53610.html (accessed on 1 June 2017).
- Brągoszewska, E.; Mainka, A.; Pastuszka, J.S. Bacterial aerosols in an urban nursery school in Gliwice, Poland: A case study. Aerobiologia (Bologna) 2016, 32, 469–480. [Google Scholar] [CrossRef]
- Pegas, P.N.; Evtyugina, M.G.; Alves, C.A.; Nunes, T.; Cerqueira, M.; Franchi, M.; Pio, C.; Almeida, S.M.; Freitas, M.C. Outdoor/Indoor air quality in primary schools in Lisbon: A Preliminary Study. Quim. Nova 2010, 33, 1145–1149. [Google Scholar] [CrossRef]
- Yang, W.; Sohn, J.; Kim, J.; Son, B.; Park, J. Indoor air quality investigation according to age of the school buildings in Korea. J. Environ. Manag. 2009, 90, 348–354. [Google Scholar] [CrossRef] [PubMed]
- Hussin, N.H.M.; Sann, L.M.; Shamsudin, M.N.; Hashim, Z. Characterization of bacteria and fungi bioaerosol in the indoor air of selected primary schools in Malaysia. Indoor Built Environ. 2011, 20, 607–617. [Google Scholar] [CrossRef]
- Al Mijalli, S.H. Bacterial contamination of indoor air in schools of Riyadh, Saudi Arabia. Air Water Borne Dis. 2017, 6, 1–8. [Google Scholar] [CrossRef]
- Sheik, G.B.; Ismail, A.; Abd, A.; Rheam, A.; Saad, Z.; Shehri, A.; Bin, O.; Al, M. Assessment of Bacteria and Fungi in air from College of Applied Medical Sciences (Male) at AD-Dawadmi, Saudi Arabia. Int. J. Sci. Technol. Res. 2015, 4, 48–53. [Google Scholar]
- Soto, T.; Garcia Murcia, R.M.; Franco, A.; Vicente-Soler, J.; Cansado, J.; Gacto, M. Indoor airborne microbial load in a Spanish university (University of Murcia, Spain). Anales de Biología 2009, 31, 109–115. [Google Scholar]
- Dutkiewicz, J.; Górny, R.L. Biologic factors hazardous to health: Classification and criteria of exposure assessment. Med. Pr. 2002, 53, 29–39. [Google Scholar] [PubMed]
- Jo, W.-K.; Seo, Y.-J. Indoor and outdoor bioaerosol levels at recreation facilities, elementary schools, and homes. Chemosphere 2005, 61, 1570–1579. [Google Scholar] [CrossRef] [PubMed]
- Kim, K.Y.; Kim, C.N. Airborne microbiological characteristics in public buildings of Korea. Build. Environ. 2007, 42, 2188–2196. [Google Scholar] [CrossRef]
- Pastuszka, J.S.; Kyaw Tha Paw, U.; Lis, D.O.; Wlazło, A.; Ulfig, K. Bacterial and fungal aerosol in indoor environment in Upper Silesia, Poland. Atmos. Environ. 2000, 34, 3833–3842. [Google Scholar] [CrossRef]
- Stryjakowska-Sekulska, M.; Piotraszewska-Pajak, A.; Szyszka, A.; Nowicki, M.; Filipiak, M. Microbiological quality of indoor air in university rooms. Pol. J. Environ. Stud. 2007, 16, 623–632. [Google Scholar] [CrossRef]
- Burkowska, A.; Kalwasińska, A.; Walczak, M. Airborne mesophilic bacteria at the ciechocinek health resort. Pol. J. Environ. Stud. 2012, 21, 307–312. [Google Scholar]
- Bartlett, K.H.; Kennedy, S.M.; Brauer, M.; van Netten, C.; Dill, B. Evaluation and determinants of airborne bacterial concentrations in school classrooms. J. Occup. Environ. Hyg. 2004, 1, 639–647. [Google Scholar] [CrossRef] [PubMed]
- Deng, W.; Chai, Y.; Lin, H.; So, W.W.M.; Ho, K.W.K.; Tsui, A.K.Y.; Wong, R.K.S. Distribution of bacteria in inhalable particles and its implications for health risks in kindergarten children in Hong Kong. Atmos. Environ. 2016, 128, 268–275. [Google Scholar] [CrossRef]
- Bavykin, S.G.; Mikhailovich, V.M.; Zakharyev, V.M.; Lysov, Y.P.; Kelly, J.J.; Alferov, O.S.; Gavin, I.M.; Kukhtin, A.V.; Jackman, J.; Stahl, D.A.; et al. Discrimination of Bacillus anthracis and closely related microorganisms by analysis of 16S and 23S rRNA with oligonucleotide microarray. Chem. Biol. Interact. 2008, 171, 212–235. [Google Scholar] [CrossRef] [PubMed]
- Wilson, C.; Brigmon, R.L.; Knox, A.; Seaman, J.; Smith, G. Effects of microbial and phosphate amendments on the bioavailability of lead (Pb) in shooting range soil. Bull. Environ. Contam. Toxicol. 2006, 76, 392–399. [Google Scholar] [CrossRef] [PubMed]
- Koneman, E.W.; Allen, S.D.; Janda, W.M.; Schreckenberger, P.C. Color Atlas and Textbook of Diagnostic Microbiology; 1997; ISBN 0781730147. Available online: europepmc.org/articles/pmc1900441/pdf/amjpathol00176-0005.pdf (accessed on 1 June 2017).
- Pakarinen, J.; Hyvärinen, A.; Salkinoja-Salonen, M.; Laitinen, S.; Nevalainen, A.; Mäkelä, M.J.; Haahtela, T.; Von Hertzen, L. Predominance of Gram-positive bacteria in house dust in the low-allergy risk Russian Karelia. Environ. Microbiol. 2008, 10, 3317–3325. [Google Scholar] [CrossRef] [PubMed]
- Park, H.K.; Han, J.H.; Joung, Y.; Cho, S.H.; Kim, S.A.; Kim, S.B. Bacterial diversity in the indoor air of pharmaceutical environment. J. Appl. Microbiol. 2014, 116, 718–727. [Google Scholar] [CrossRef] [PubMed]
- Abreu, N.A.; Nagalingam, N.A.; Song, Y.; Roediger, F.C.; Pletcher, S.D.; Goldberg, A.N.; Lynch, S.V. Sinus Microbiome Diversity Depletion and Corynebacterium tuberculostearicum Enrichment Mediates Rhinosinusitis. Sci. Transl. Med. 2012, 4, 151ra124. [Google Scholar] [CrossRef] [PubMed]
- Ege, M.J.; Mayer, M.; Schwaiger, K.; Mattes, J.; Pershagen, G.; Van Hage, M.; Scheynius, A.; Bauer, J.; Von Mutius, E. Environmental bacteria and childhood asthma. Allergy Eur. J. Allergy Clin. Immunol. 2012, 67, 1565–1571. [Google Scholar] [CrossRef] [PubMed]
- Schram-Bijkerk, D.; Doekes, G.; Douwes, J.; Boeve, M.; Riedler, J.; Üblagger, E.; Von Mutius, E.; Benz, M.R.; Pershagen, G.; Van Hage, M.; et al. Bacterial and fungal agents in house dust and wheeze in children: The PARSIFAL study. Clin. Exp. Allergy 2005, 35, 1272–1278. [Google Scholar] [CrossRef] [PubMed]
- Gehring, U.; Bolte, G.; Borte, M.; Bischof, W.; Fahlbusch, B.; Wichmann, E.E.; Heinrich, J. Exposure to endotoxin decreases the risk of atopic eczema in infancy: A cohort study. J. Allergy Clin. Immunol. 2001, 108, 847–854. [Google Scholar] [CrossRef] [PubMed]
- Thorne, P.S.; Cohn, R.D.; Mav, D.; Arbes, S.J.; Zeldin, D.C. Predictors of endotoxin levels in U.S. housing. Environ. Health Perspect. 2009, 117, 763–771. [Google Scholar] [CrossRef] [PubMed]
- U.S. EPA. Child-Specific Exposure Factors Handbook; EPA, Environmental Protection Agency: Washington, DC, USA, 2002.
- Johnson-Restrepo, B.; Kannan, K. An assessment of sources and pathways of human exposure to polybrominated diphenyl ethers in the United States. Chemosphere 2009, 76, 542–548. [Google Scholar] [CrossRef] [PubMed]
- Ott, W.R.; Steinemann, A.C.; Wallace, L.A. Exposure Analysis; CRC Press: London, UK, 2006; ISBN 978-1-56670-663-6. [Google Scholar]
- U.S. EPA. Exposure Factors Handbook; EPA, Environmental Protection Agency: Washington, DC, USA, 2011.
- Górny, R.; Gołofit-Szymczak, M.; Stobnicka, A. Biological agents in kindergartens [in Polish Szkodliwe czynniki biologiczne w przedszkolach]. Bezpieczeństwo Pracy Nauka i Praktyka 2014, 2, 16–20. [Google Scholar]
Figure 1.
Size distribution of the bacterial aerosol in the outdoor and indoor air in preschool, primary school and high school; Dae—aerodynamic diameter; ΔC—concentration of bacterial aerosol on the particular stage of 6-stage Andersen impactor; Ctotal—total concentration of bacterial aerosol; Δ log Dae—logarithm of differences of cut-off diameters for a particular stage of 6-stage Andersen impactor.
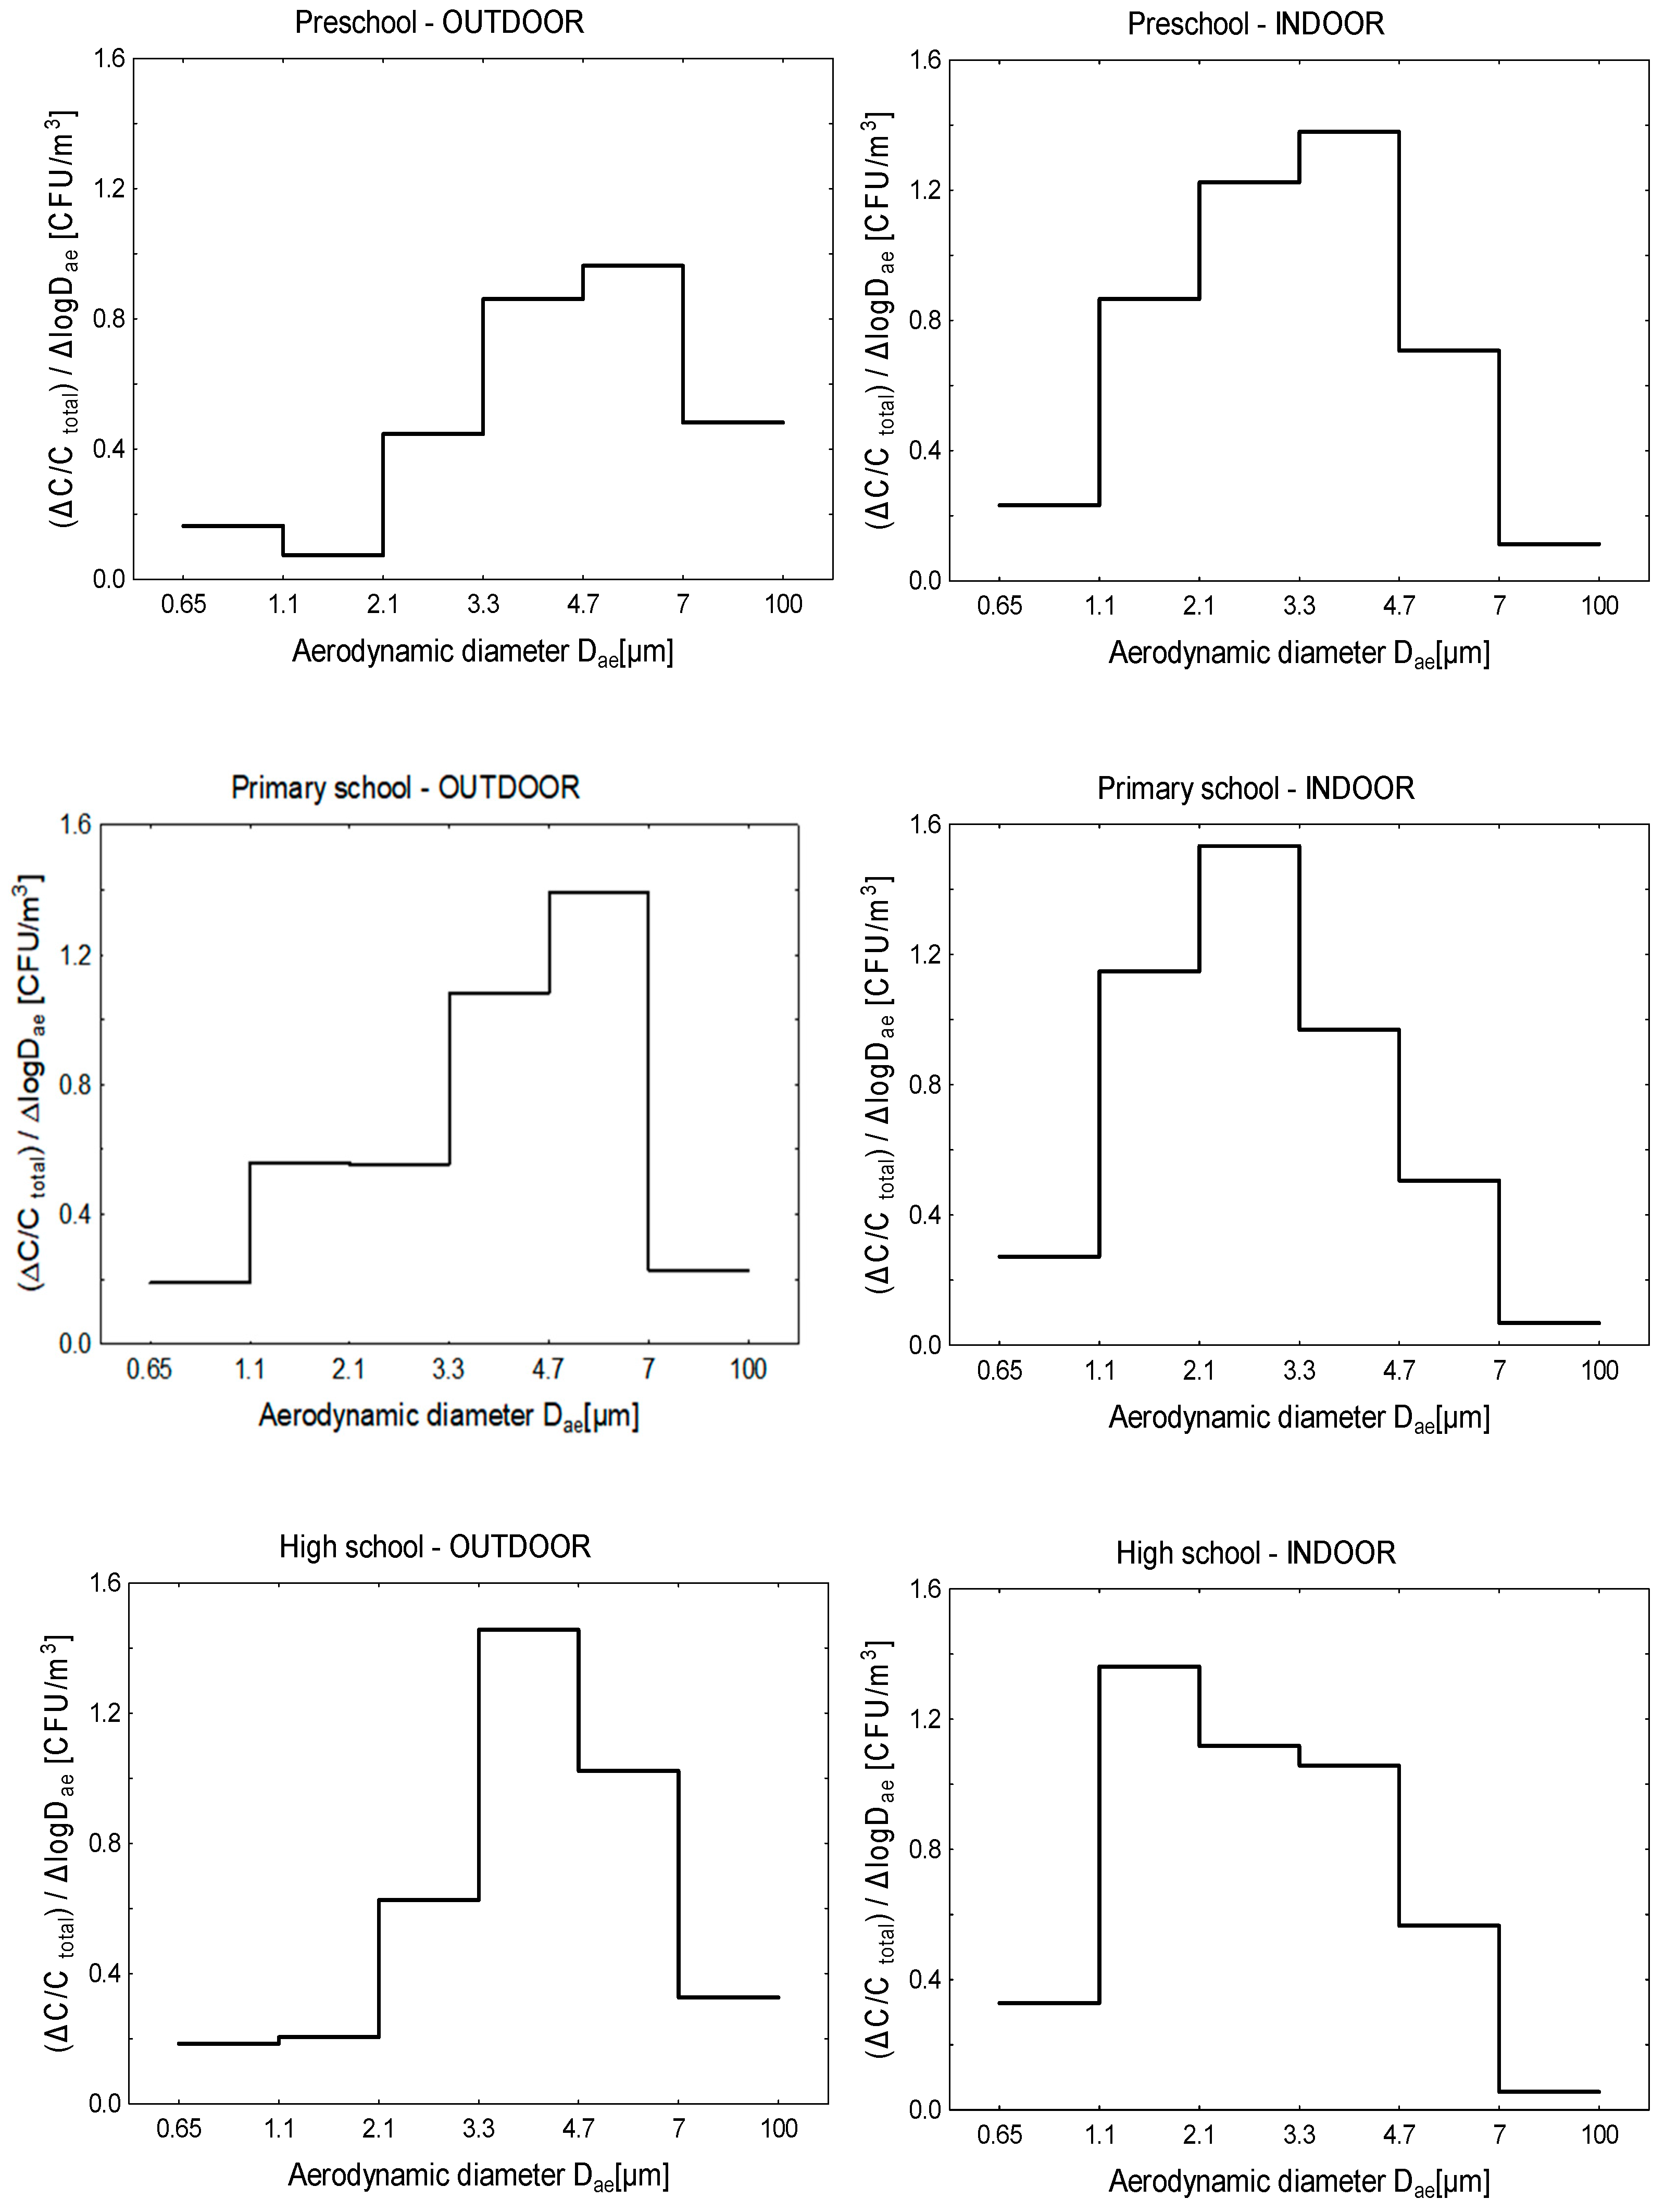
Figure 2.
Viable bacteria genera identified in three educational buildings.

Table 1.
Environmental parameters, and basic description of educational buildings.
| Preschool (P) | Primary school (S) | High school (H) | |
|---|---|---|---|
| School localization | away from the city center, near a quiet street (low traffic), | away from the city center, near a quiet street (low traffic) | in the city center, near a busy street (heavy vehicular traffic) |
| Building built in | 1970s | 1930s | 1930s |
| Classroom localization | on the ground floor | on the ground floor | on the ground floor |
| Equipment | writing desk, tables and chairs toys | 12 double desks, writing desk, blackboard | 20 double desks, writing desk, blackboard |
| Ventilation system | natural | natural | natural |
| Volume, m3 | 210 | 130 | 170 |
| Number of children | 25 | 24 | 16 |
| Age of children | 4–6 | 9–11 | 16–18 |
| Flor covered with | PVC and carpet | PVC | tiles |
| Indoor temperature, °C | 24.1 | 22.1 | 23 |
| Indoor relative humidity (RH), % | 26 | 29 | 31 |
| Outdoor temperature, °C | 20.2 | 18.4 | 19.1 |
| Outdoor relative humidity (RH), % | 32.4 | 31.7 | 38.6 |
Table 2.
Average concentration, CFU/m3 of total bacterial colony-forming units per cubic meter of air inside (IN) and outside of three types of educational buildings: outdoor air (OUT), preschool (P), primary school (S), high school (H).
Table 2.
Average concentration, CFU/m3 of total bacterial colony-forming units per cubic meter of air inside (IN) and outside of three types of educational buildings: outdoor air (OUT), preschool (P), primary school (S), high school (H).
| Location | Average Concentration, CFU/m−3 | SD | Min | Max | I/O Ratio |
|---|---|---|---|---|---|
| OUT | 551 | 119 | 393 | 725 | - |
| IN (P) | 1408 | 406 | 456 | 1984 | 2.55 |
| OUT | 246 | 185 | 54 | 423 | - |
| IN (S) | 2205 | 1468 | 611 | 4388 | 8.96 |
| OUT | 213 | 147 | 52 | 269 | - |
| IN (H) | 391 | 57 | 336 | 453 | 1.83 |
SD: Standard deviation.
Table 3.
Characterization of the time budget and exposure dose in the studied populations of the preschool (P), primary school (S) and high school (H).
Table 3.
Characterization of the time budget and exposure dose in the studied populations of the preschool (P), primary school (S) and high school (H).
| Parameter | Preschool (P) | Primary School (S) | High School (H) | |||
|---|---|---|---|---|---|---|
| Short-Term Inhalation Rates by Activity Level/Hours | ||||||
| Activity levels | m3/min | hour | m3/min | hour | m3/min | hour |
| Sedentary/Passive | 0.0045 | 2 | 0.0048 | 2 | 0.0053 | 5 |
| Light Intensity | 0.011 | 2 | 0.011 | 3 | 0.012 | 1 |
| Moderate Intensity | 0.021 | 2 | 0.022 | 2 | 0.026 | 1 |
| High Intensity | 0.037 | 1 | 0.042 | 0 | 0.049 | 0 |
| BW, kg | 19 | 34 | 62 | |||
| ED, CFU/kg | 489 | 337 | 24 | |||
© 2018 by the authors. Licensee MDPI, Basel, Switzerland. This article is an open access article distributed under the terms and conditions of the Creative Commons Attribution (CC BY) license (http://creativecommons.org/licenses/by/4.0/).
Share and Cite
MDPI and ACS Style
Brągoszewska, E.; Mainka, A.; Pastuszka, J.S.; Lizończyk, K.; Desta, Y.G. Assessment of Bacterial Aerosol in a Preschool, Primary School and High School in Poland. Atmosphere 2018, 9, 87. https://doi.org/10.3390/atmos9030087
AMA Style
Brągoszewska E, Mainka A, Pastuszka JS, Lizończyk K, Desta YG. Assessment of Bacterial Aerosol in a Preschool, Primary School and High School in Poland. Atmosphere. 2018; 9(3):87. https://doi.org/10.3390/atmos9030087
Chicago/Turabian StyleBrągoszewska, Ewa, Anna Mainka, Józef S. Pastuszka, Katarzyna Lizończyk, and Yitages Getachew Desta. 2018. "Assessment of Bacterial Aerosol in a Preschool, Primary School and High School in Poland" Atmosphere 9, no. 3: 87. https://doi.org/10.3390/atmos9030087
Note that from the first issue of 2016, this journal uses article numbers instead of page numbers. See further details here.