A Statistical Investigation of the Impact of the Indian Monsoon on the Eastern Mediterranean Circulation


1
Division of Environmental Physics and Meteorology, Department of Physics, National and Kapodistrian University of Athens, University Campus, Building Phys.-5, 15784 Athens, Greece
2
Sector of Geography and Climatology, Department of Geology and Geoenvironment, National and Kapodistrian University of Athens, Zografou, University Campus, 15784 Athens, Greece
3
Laboratory of Meteorology, Department of Physics, University of Ioannina, 45110 Ioannina, Greece
*
Author to whom correspondence should be addressed.
Atmosphere 2018, 9(3), 90; https://doi.org/10.3390/atmos9030090
Submission received: 30 November 2017
/
Revised: 21 February 2018
/
Accepted: 23 February 2018
/
Published: 1 March 2018
(This article belongs to the Special Issue Advances in Atmospheric Physics: Selected Papers from CEST2017)
Abstract
:The Indian summer monsoon (ISM) is a prominent feature of the summer circulation in the Northern Hemisphere (NH) and has been found to modulate the weather and climate conditions in many remote regions. This study investigates the most recurrent patterns of summertime midlatitude circulation, over the eastern Mediterranean (EM) and also globally, that are most associated with the ISM. Monthly data of 44 summers from the ERA40 dataset are used and two multidimensional statistical methods, the Principal Component Analysis (PCA) and Canonical Correlation Analysis (CCA), are implemented. The ISM is found to be related to subsidence anomalies in the middle and more extendedly in the upper troposphere over the central and eastern Mediterranean and with an Etesian-like pattern regarding the field of the lower troposphere winds. An equatorial Rossby wave pattern, extending westward from an ISM heat source up to EM and N. Africa, was identified to be associated with the variability of ISM. The observed relationship between the ISM and the EM circulation features can be attributed to this equatorial Rossby wave response to the monsoon forcing. CCA implementation revealed the interconnection of the aforementioned PCA results with an ISM action center over the northern Arabian Sea and the monsoon trough region.
Keywords:
Indian summer monsoon; eastern Mediterranean; Rossby waves; Etesians; subsidence; PCA; CCA1. Introduction
The Mediterranean basin lies at the boundary between two very different climate regimes, the arid climate of North Africa to the south (subtropical zone) and the wet climate of central Europe to the north (temperate zone). Due to its location, the basin is influenced by both mid-latitude and subtropical systems and moreover by the interaction of these different source systems [1,2,3]. The climate of the Mediterranean basin is quite unique in comparison to other Mediterranean-type climate zones, in that it is influenced by a wide range of large-scale factors, such as the North Atlantic storm track and the remote effects of the Asian and African monsoon [4,5]. During boreal summer, the western Mediterranean is under the influence of the Atlantic anticyclonic system to its west [6], similar to most Mediterranean-type regions, whereas in the East and Southeast Mediterranean basin the Persian trough dominates; moreover, mobile anticyclones over the Balkans impose a second important influence over the area. The anticyclone over the Balkans is a high pressure system of limited extent, having closed isobars over the Balkans and also causing anticyclonic flow over the Greek mainland. It is considered by many as the expansion of the permanent Azores subtropical anticyclone and by others as a separate system with different origin [7]. The Persian trough, on the other hand, comprises an expansion of the monsoon heat low to the west of the South Asian monsoon region, towards eastern Mediterranean (EM) and the Middle East, through the Persian Gulf. A persistent northerly flow, known since antiquity by the name “Etesians” [8,9,10,11], begins to form over the EM as a sharp east–west pressure gradient builds up over the area, resulting from the combination of the two pressure systems mentioned above. Etesians control many aspects of the summer climate of EM, with their important ventilating effect over the area and the significant role they play in the temperature variability by transporting moist and relatively cool air as they pass over the Mediterranean Sea [12,13]. Extreme cool temperature events over the EM have been found to be associated with the strength of the northwesterly prevailing Etesians [14]. The influence of the ISM (Indian summer monsoon) on the seasonal evolution and the strength of the Etesian winds has received some attention. Tyrlis et al. [15] noticed a remarkable synchronization between the seasonal evolution of the persistent northerly flow in the area and of ISM activity, whereas Ziv et al. [5] found a variation of the Etesian winds on an interdiurnal scale, which they attributed on the effect of the South Asian monsoon.
The EM region is also characterized by some of the highest, mid- and upper-troposphere, subsidence values on a global scale [4,15] during boreal summer, which are responsible for adiabatic warming and dryness over the central and eastern Mediterranean. The existence of subtropical deserts and of the major subtropical zones, that are characterized by enhanced subsidence and arid conditions during summer, has often been attributed to the descending branch of the zonal-mean Hadley circulation cell. However, the Hadley cell has displaced southwards during boreal summer, with subsidence being located in the southern subtropics [16]. During this period, the convection is enhanced over India and very limited over North Africa [17]. Rodwell and Hoskins [4] suggested a monsoon-desert mechanism to explain the summertime climate of major subtropical deserts (East Sahara and Kyzylkum desert) and that of eastern Mediterranean. By using idealized simulations based on a primitive equation model, they found that the remote diabatic heat in the South Asian monsoon region induces an equatorially trapped Rossby wave pattern to its west over the subtropics which extends poleward into midlatitudes and warms the atmosphere [4,6]. The warm thermal structure of the Rossby wave spreads westward causing significant depression of the isentropes and as the air on the southern flanks of the mid-latitude westerlies interacts with this warm structure, it slides down the sloping isentropes and hence it descends.
The localization of this adiabatic descent is attributed to the influence of local up-stream orography, the Atlas mountains in Northwest Africa for the case of eastern Sahara-eastern Mediterranean and similarly the Zagros mountains for the case of Kyzlkum desert, to the east of the Caspian Sea, which focuses the subsidence over specific areas [6,15]. The contribution of elevated surface heating over the high terrain of the dominant mountains results in a depression of the isentropes and a significant contribution in the formation of mid-level subtropical anticyclones over Northwest Africa, central western Saudi Arabia and over the Zagros mountains. Northerly flow and subsidence are enhanced to the east of these mid-level anticyclones. When the local diabatic forcing in the east Sahara/Mediterranean region is removed from the heating in the idealized experiments of Rodwell and Hoskins [4], less than half of the time-mean descent is still observed over the EM. Accordingly, when the Zagros mountains are removed, the descent south of the Aral Sea is reduced. Furthermore, the adiabatic descent, resulting from the combined monsoon and topography forcing, inhibits the local convecting heating and leads to increased longwave radiative cooling in cloud-free atmosphere and consequently to a local “diabatic enhancement” of the descent.
The intensity of the descent produced to the west of the Asian monsoon region as a response to the ISM diabatic heating depends highly on the location of the monsoon center of action. Tyrlis et al. [15] investigated the mean seasonal evolution of the Asian monsoon activity, separately at the main regions of the ISM and the western North Pacific summer monsoon, and of the subsidence and northerly flow over the EM and found a striking synchronicity between the EM circulation and the ISM activity, regarding the onset of the phenomena as well as their maxima. The correlation between EM subsidence and ISM activity was found almost perfect for the case of northern parts of the Bay of Bengal and Arabian Sea, as well as over the northern continental India, giving support to the results of Rodwell and Hoskins [4], who also found that the descent is highly sensitive to the latitudinal position of the heat source. In their study, Rodwell and Hoskins [4] found that for the pre-monsoon heating, which is centered around 10 N, the descent produced to the west of the Asian monsoon region is negligible while as convection and hence the diabatic heating center shifts northward to 25 N, a deep descent is built westward and northward of it.
The origin of the subsiding air over the EM and the region east of the Caspian Sea has been a controversial issue. According to the findings of Rodwell and Hoskins [4] and of Tyrlis et al. [15], the parcels of air subsiding at mid and lower levels of troposphere over the EM region primarily originates from mid-latitudes, whereas in the upper troposphere and lower stratosphere the subsidence over the EM is related to air originating in South Asia. The above results are in opposition with the “Walker-type” closed circulation that has been proposed to connect the two areas [5,18], EM and South Asia, characterized by ascending motion over South Asia, consequent westward flow via the tropical easterly jet and finally descending motion over the EM and the Sahara and Arabian deserts. Moreover, refs. [19,20] also demonstrated that the subsidence over EM is linked with the ISM with a Walker-type east–west circulation driven by a planetary scale east–west differential heating, where heating is located over western tropical Pacific and cooling over N. Africa.
According to Rodwell and Hoskins [6] and the Sverdrup vorticity balance of a steady flow, the Etesians can be considered as the surface equatorward flow that is formed below the region of adiabatic descent in the EM and tends to close off the subtropical anticyclone to the west. Thus, EM main circulation features, excess subsidence and persistent northerly flow, have been found to be significantly correlated with each other and with the South Asian monsoon activity [5,15]. The Etesians, besides being controlled by the South Asian monsoon activity, have also been found to connect the Asian monsoon system with the Sahel monsoon system, by regulating the moisture inflow into the African inter-tropical convergence zone [5,21].
Except for the tropical atmospheric response to the ISM diabatic forcing, which is closely related to the equatorially trapped Rossby wave response to the west of the ISM heating, extratropical response has also been identified in several studies, in the form of a summertime circumglobal teleconnection pattern [22,23]. The formation of this global scale pattern is closely related to the mid-latitude westerly jet stream waveguide [24] and the location of the generated Rossby wave sources relative to the position of the jet.
The present work attempts to confirm and expand the results of the analysis—to date—of the interrelationship between the ISM and the two main dynamic factors governing the EM circulation, via the application of two statistical techniques, Principal Component Analysis (PCA) and Canonical Correlation Analysis (CCA), and the use of gridded Reanalysis data. This study implements a different approach in comparison to the previous studies that have investigated the subject, by focusing on the use of sophisticated exploratory data analysis methods in order to identify the dominant spatial patterns in the examined multivariate datasets (space–time fields) that interconnect with the ISM on intraseasonal as well as on interannual time scales. The analysis is applied for the boreal summer season (June–September). Section 2 describes the datasets and methodology employed in this research. Section 3.1 and Section 3.2 present the results of the PCA analysis and in Section 3.3 the CCA analysis results are given to further elaborate the relationship between ISM and EM features. Section 4 summarizes the major findings of the current study.
2. Data and Methods
Monthly global reanalysis data were used from the ERA-40 dataset of the European Center for Medium-Range Weather Forecast (ECMWF; [25]). The variables used here include geopotential height at 200, 500, 700, 850 and 925 hPa, zonal and meridional winds at 200 and 850 hPa, and vertical velocity at 200 and 500 hPa. In order to describe the tropical convection activity of the ISM, the monthly top thermal radiation (TTR) data were derived from the ERA-40 dataset, which correspond to the net thermal (longwave) radiation at the top of the atmosphere.
All data have a 2.5× 2.5 horizontal resolution, covering boreal summers from 1958 to 2001. In this study, summer refers to the peak ISM season, namely June, July, August, September (JJAS).
The All India Rainfall Index (AIRI) by Parthasarathy et al. [26], Parthasarathy [27] was used to represent the convective activity over India and its variability. AIRI is defined as the area-weighted average of rainfall observed at well-distributed rain-gauge stations all over India and is the most widely used measure of the intensity of the planetary scale monsoon over India.
First, PCA was applied to the monthly time series of circulation data on global and regional domains. The monthly anomalies of the parameters studied were calculated, using the long-term period average at every grid point for the total period. The number of principal components (PCs) retained for each dataset was decided based on a 70% threshold of the total variance explained and on the physical interpretation of the results. The varimax method was used for the PCs’ rotation [28] which maximizes the variance of the squared correlation coefficients between each rotated principal component and each of the original time series (Rotated Principal Component Analysis), thus increasing the discrimination among the loadings and making them easier to interpret. Also, the rotated PCs are less dependent on the domain of the analysis and their spatial patterns more closely resemble observed anomaly fields [28]. Varimax rotation was applied in all cases of PCA performance.
To further assess and quantify the influence of the ISM on the midlatitude circulation, the CCA was applied to the gridded circulation data of EM and Northern Hemisphere (NH) domains on the one hand and to the corresponding TTR data for the ISM region on the other. CCA allows the investigation of the linear relationship between two different fields and determines optimal pairs of concurrently spatial patterns that account for the maximum amount of variance within the two time series separately, and, at the same time, their optimally correlated time components. Prior to the application of CCA, PCA was applied on the time series of each parameter in order to reduce the number of the initial variables. The procedure is followed by many researchers in order to filter the data from noise and to avoid the quasi-degeneracy of the autocovariance matrices of the datasets.
3. Results
3.1. Descending Motions over the EM Region
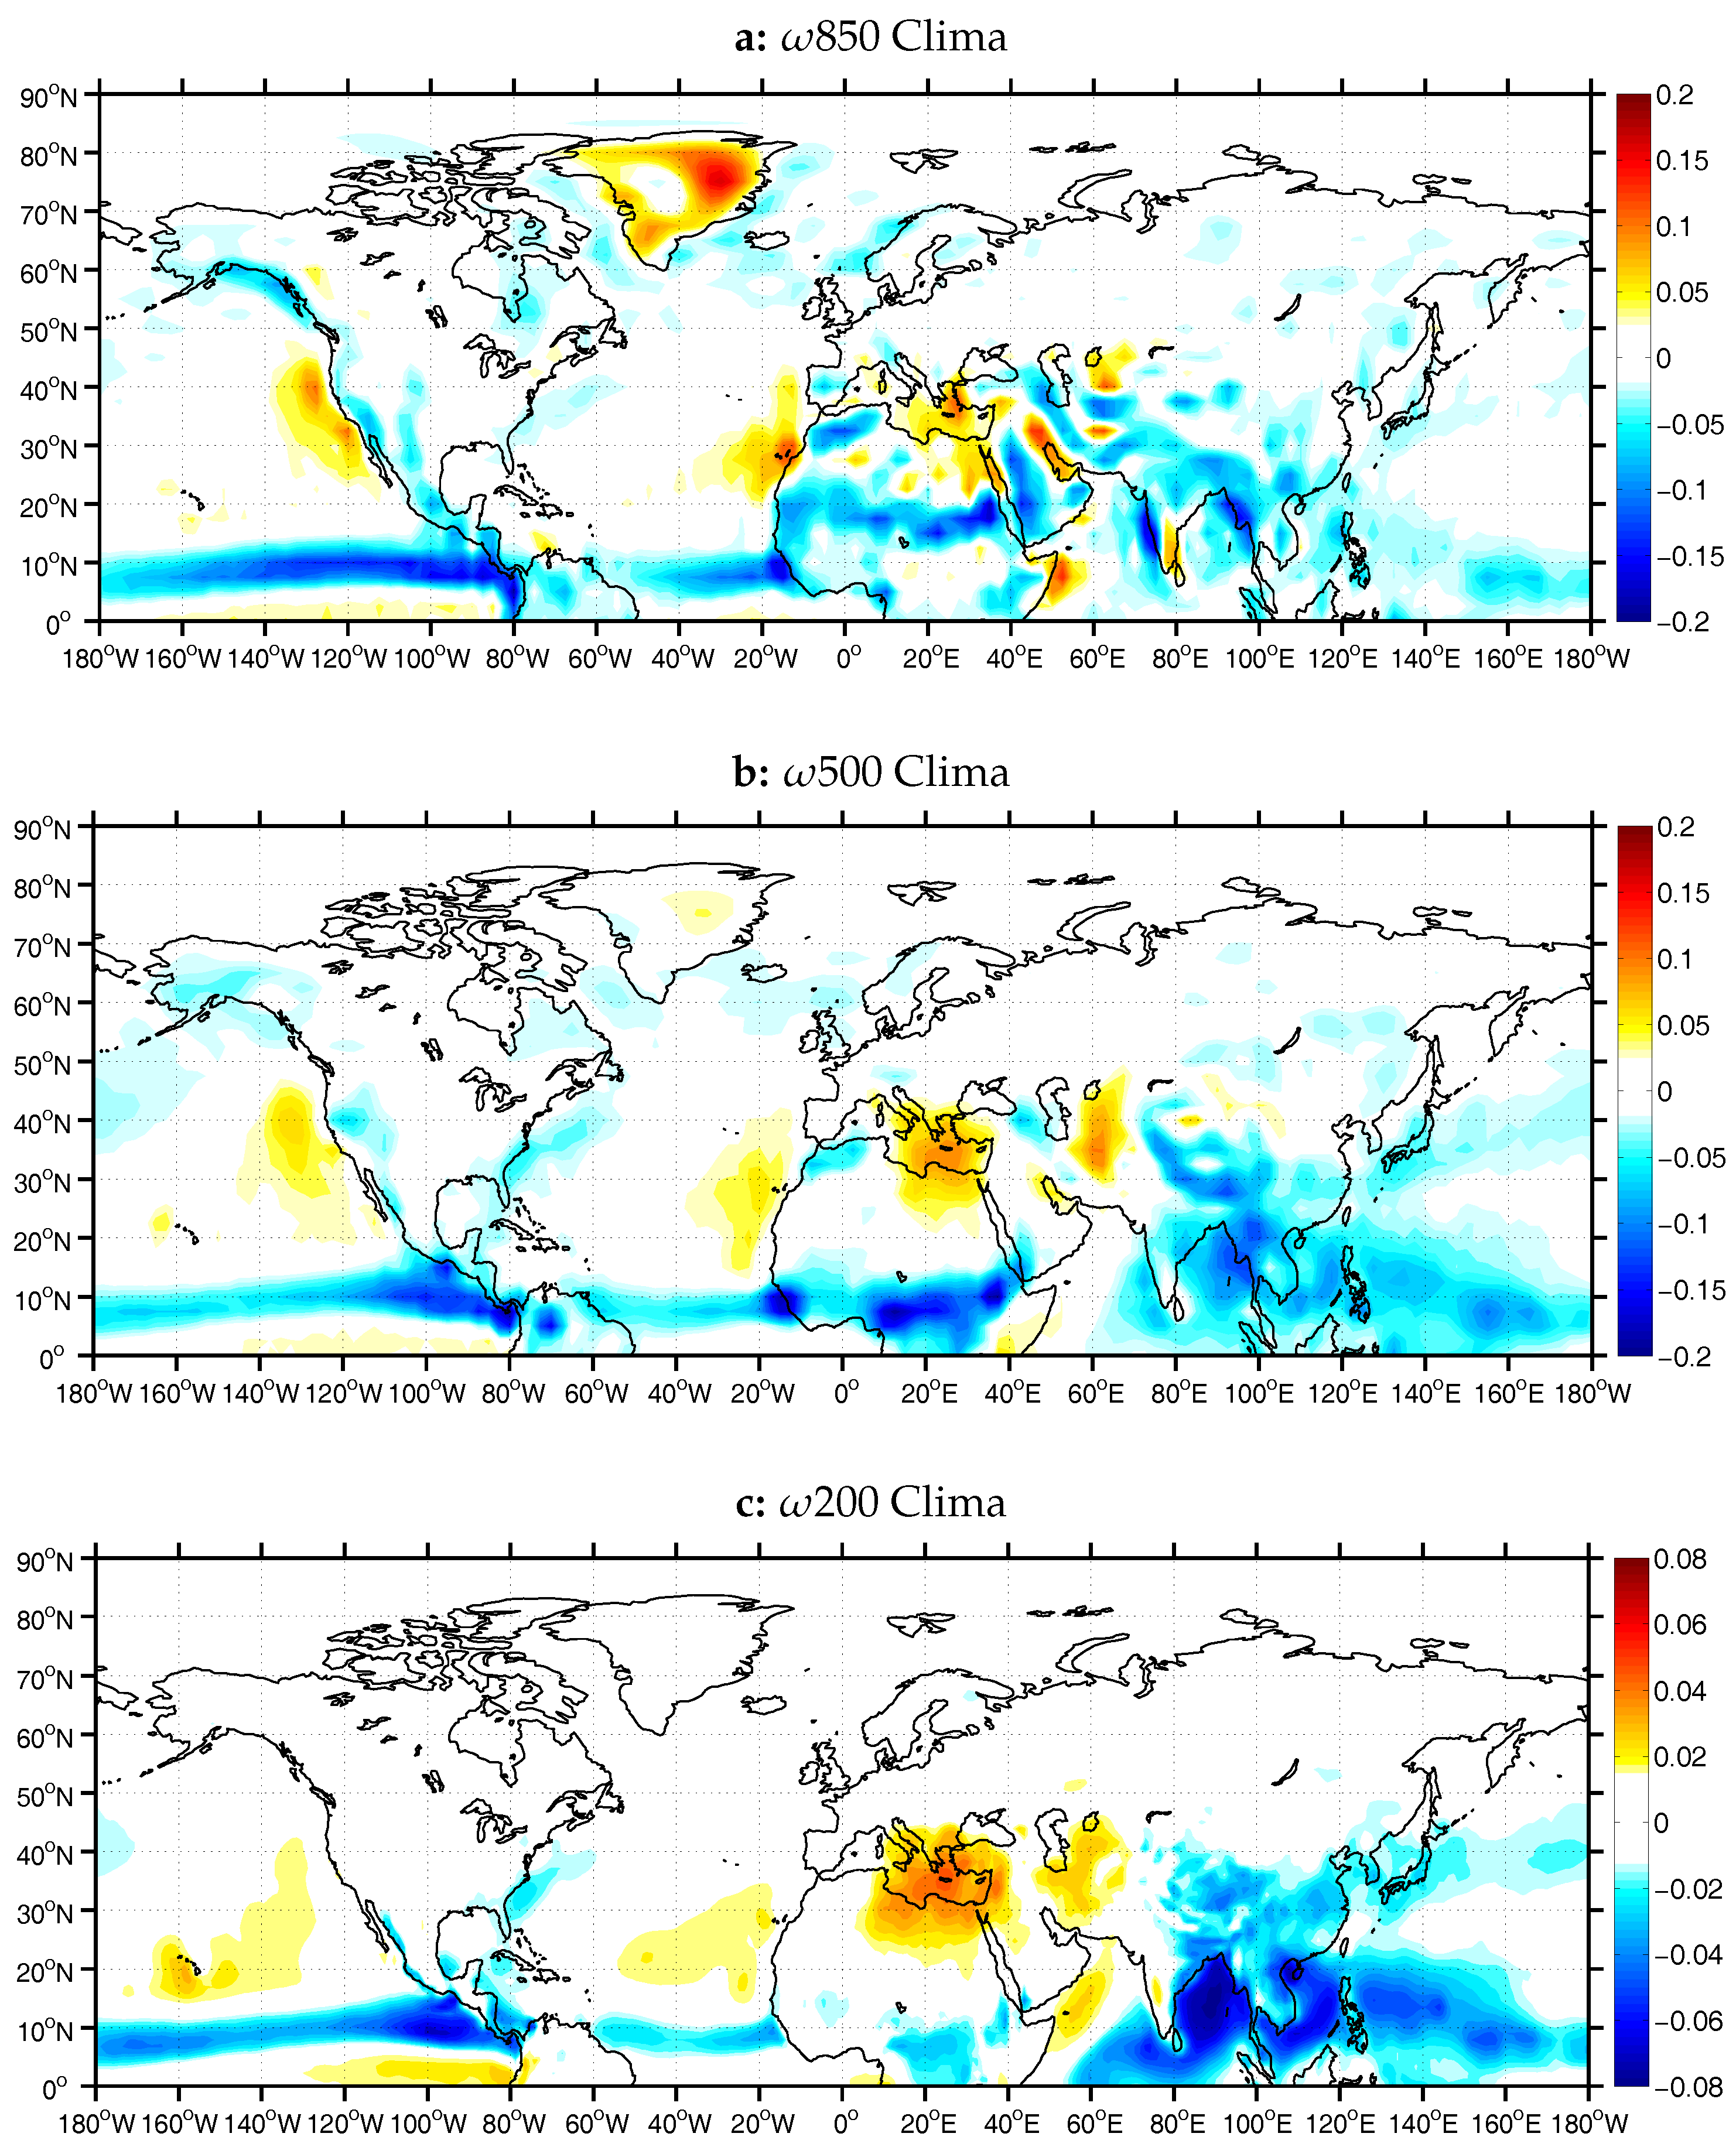
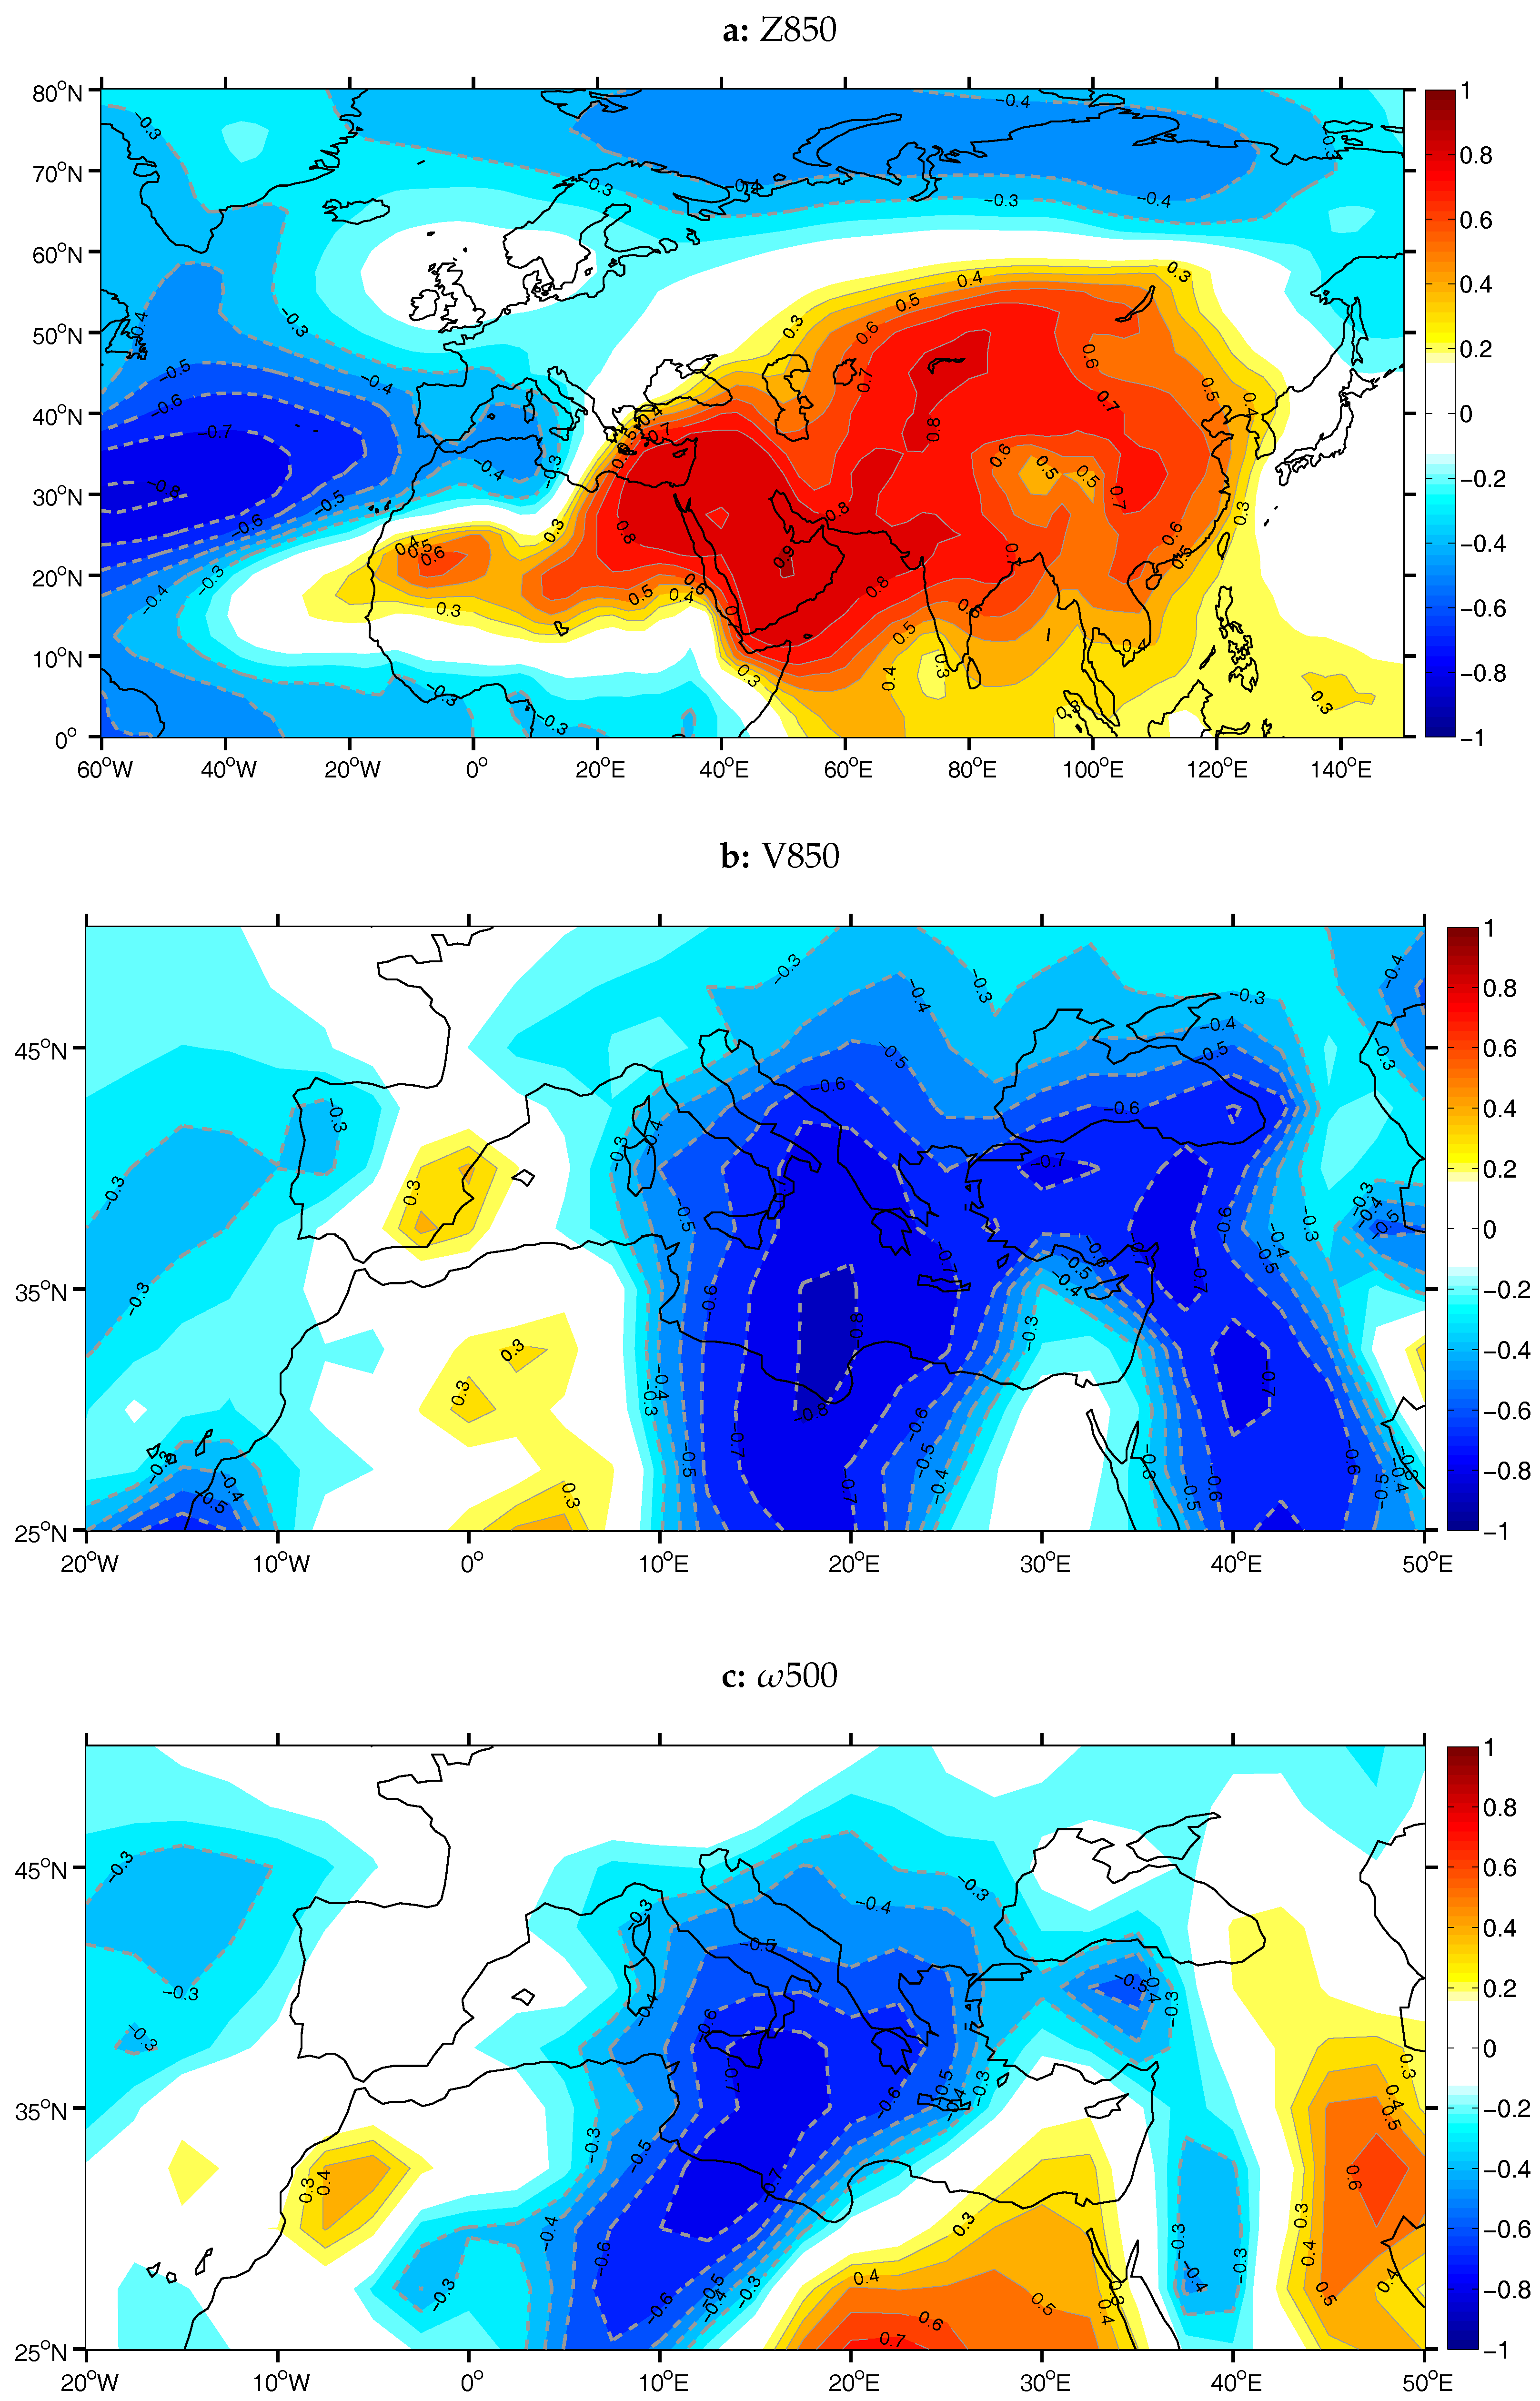
Figure 1 depicts the observed climatology of vertical velocity for boreal summer (JJAS) in the lower (a), middle (b) and upper (c) troposphere. One can notice the band of ascent over the tropics throughout the troposphere, which is interrupted by the West Arabian Sea, and the most prominent regions of ascending motion due to monsoon activity east of 70 E. The deepest monsoon-induced ascent is found over the Bay of Bengal, Myammar and Nepal where a monsoon high forms at the upper levels and a monsoon low at the low levels, being spatially in quadrature along with the divergence regime [19]. On the other hand, subsidence appears to be stronger over the central and eastern Mediterranean in both middle and upper troposphere, whereas a secondary subsidence core is found over Iran, Turkmenistan and Afghanistan. Topography modifies the flow and localizes the EM descending motion in the lower troposphere over the Aegean, the Red Sea and the Persian Gulf regions [4,6,15].
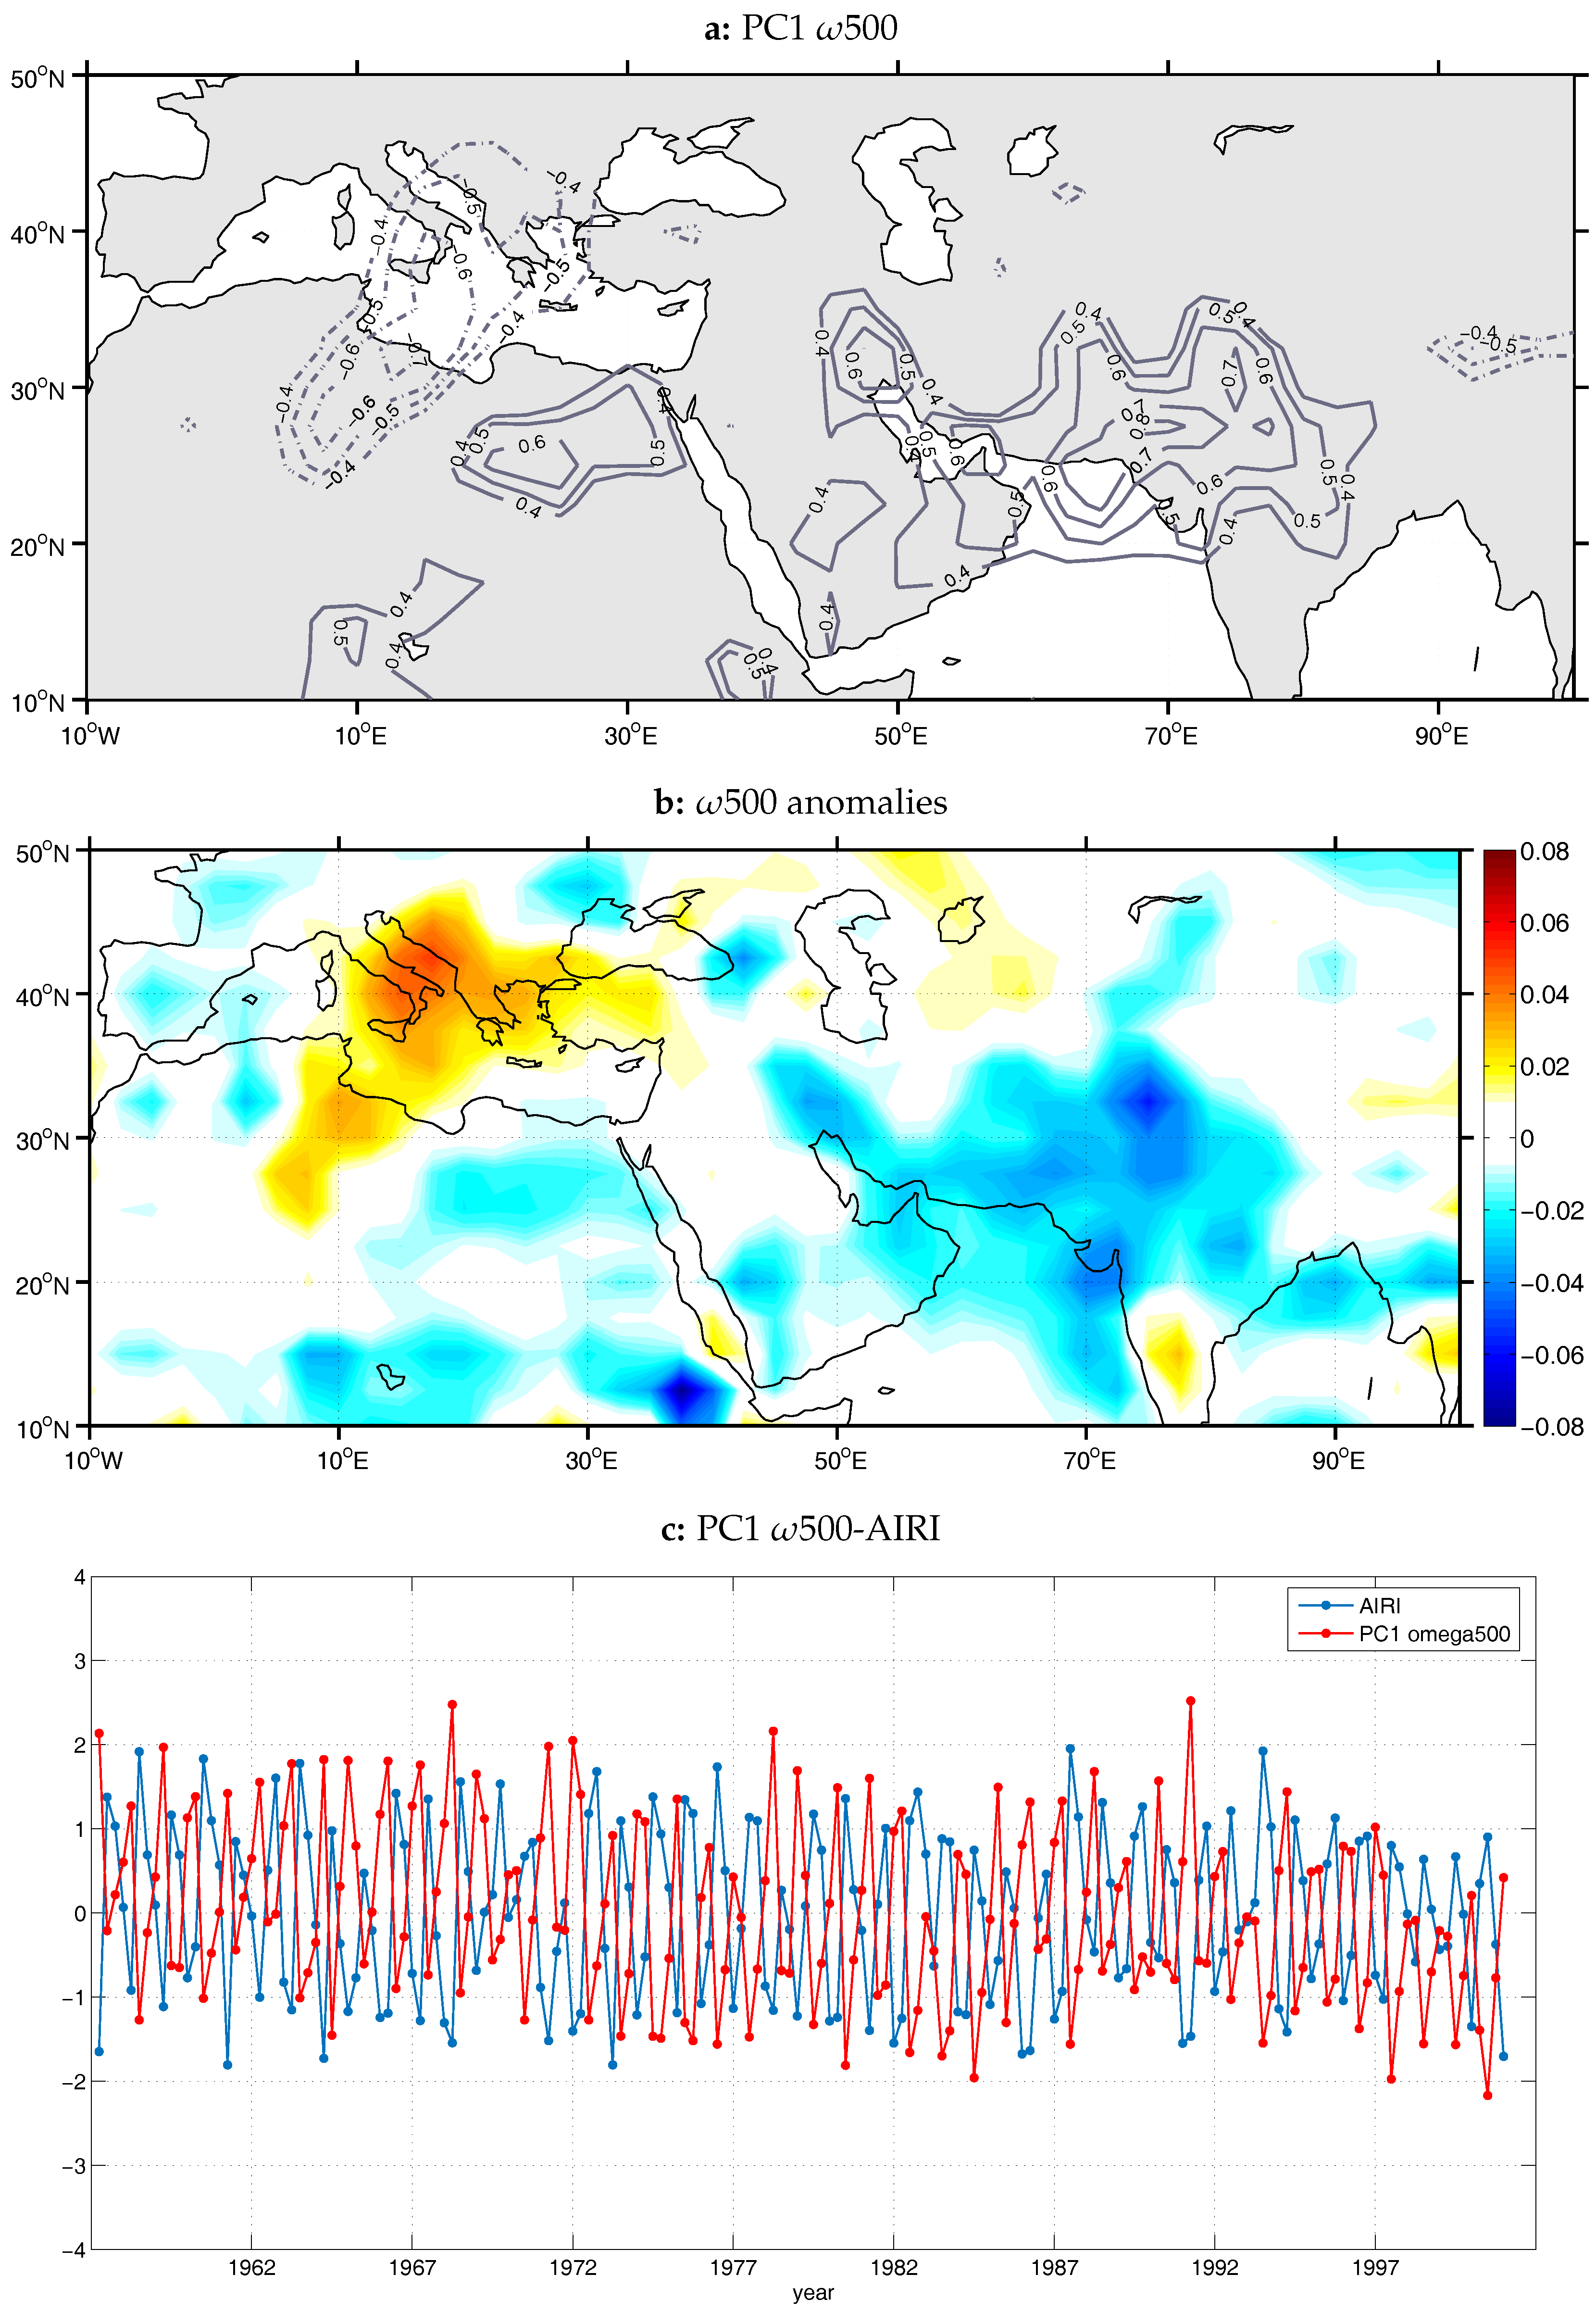
For the case of vertical velocity at the middle troposphere (500 hPa; 500) over the area of the Mediterranean and South Asia (10 W–100 E, 10 N–50 N), PCA led to 42 principal components, which explain about 75% of total variability of the examined field. The time series of the first principal component (PC) was found to be best correlated with the All India Rainfall Index, with r = −0.83 (significant at the 0.05 level), explaining 9.5% of the total variability of 500 on the specific area. The two time series appear to anti-correlate on intraseasonal and interannual time scales (Figure 2c). The spatial pattern of loadings of the first PC is shown in Figure 2a. Loadings indicate the correlation between the anomalies of the initial variable at each grid point and the temporal variation (scores) of the PC, thus the spatial distribution of loadings reveals the regions that are strongly associated with the specific PC. Having in mind that each PC has a positive and a negative phase, every spatial map of loadings can be interpreted in two ways. In Figure 2a, two main poles of opposite sign are apparent, i.e., one center of negative 500 anomalies over the central Mediterranean and west EM, with an expansion to the south over Algeria and Libya as well as a positive anomaly center over an extended area covering Iraq, Iran, the Persian Gulf, Pakistan, NW India and the North Arabian Sea. A secondary positive center is found over Egypt and East Libya, denoting weaker than normal descent over the region. The negative phase of the respective pattern is associated with strong descent over the central Mediterranean and west EM and with stronger than normal ascent over the North Arabian Sea, Northwest India and north central India, north of 20 N. Sixty-nine percent of the variability of the first PC is attributed to ISM activity. The results associated with the first principal component of middle troposphere vertical movements confirm the findings of Tyrlis et al. [15] about the connection of the subsidence over EM with the ISM activity.
In order to obtain a realistic and physical view of the negative phase of the first 500 PC and to confirm the mathematical products of PCA, months with absolute standardized scores greater than 1.5 were selected and the respective maps of 500 composite anomalies were constructed. (The negative phase of PC1 was selected as it is the one that correlates with stronger monsoon activity). Principal component scores reflect the strength of coherence between the monthly pattern of the field and the specific principal component pattern over the examined area, meaning that the higher the score value the greater the resemblance of the one with the other. The value of ±1.5 was defined after a sensitivity test was conducted regarding the coherence and physical interpretation of the composite patterns that resulted from the selection of different threshold values. The chosen threshold is 1.5 times the standard deviation greater than the mean value of the PC time series; therefore, it is associated with the most representative months of the specific principal component. The same threshold value was employed for the construction of all anomaly composites displayed in the following, in accordance with the procedure described above.
The distribution derived from the study of the scores of the first PC (Figure 2b) reveals two distinct regions with opposite signs. One center of positive anomalies is found over the central and eastern Mediterranean, with maximum values over the Italian peninsula and the Adriatic Sea, whereas the center of negative values lies over NW India and the Himalayas, northern Arabian Sea as well as Pakistan and South Iran. The anomalous ascent over the Himalayas and Tibet region represents the orographic rainfall of the area. The specific pattern is in agreement with the results of Tyrlis et al. [15], who found that both the subsidence and northerly flow over the EM start intensifying simultaneously with the appearance of enhanced convection over the northern Arabian Sea and the Indian summer monsoon core.
Similarly, for the case of vertical velocity at the upper troposphere (200 hPa; 200) 35 principal components arose from PCA application, accounting for approximately 74% of the total variance. The corresponding 200 loadings map of the first PC is presented in Figure 3a. This was the PC that exhibited the highest correlation with AIRI (r = 0.79, significant at the 0.05 level), explaining 62% of the variability of 200 at the centers of action of PC1. It is apparent that this pattern resembles the 500 PC1 pattern, where the positive correlation center covers the central and eastern Mediterranean with a SW to NE direction and the negative correlations extend over northern India, Pakistan and Afghanistan. The correlation coefficients are above r = 0.6 over the EM and below r = −0.7 (significant at the 0.05 level) over Pakistan. The PC1 score time series approximates the temporal variations of 200 at the above centers and exhibits similar behavior to the time series of the negative phase of 500 PC1, but in occasions with slightly larger amplitudes (Figure 3c) . In order to facilitate the interpretation of the PC1 pattern, the composite anomaly map for the positive phase of PC1 is displayed in Figure 3b. From this map, it is apparent that the positive phase of PC1 is connected with enhanced subsidence over the central and eastern Mediterranean simultaneously with enhanced ascending motion over NW India and the Himalayas, west-central India, Arabian Sea and West Bay of Bengal. Consistent with 500 hPa and 200 hPa results, the findings from the examined 850 hPa vertical velocity revealed one center of action over the central and eastern Mediterranean and another prominent center over the Arabian Sea and Pakistan (not shown). However, the subsidence center over EM in the lower troposphere is less extensive and with lower loading values than the ones found in the middle and upper troposphere and thus the dipole pattern over EM and India appears to be less coherent.
The results regarding the vertical velocity suggest that, although the strongest magnitude of ascent in the region of the ISM is observed over the Bay of Bengal (Figure 1b,c), ascending motions over the northern Arabian Sea, NW India and Pakistan synchronize the most with the descending motions over the central and eastern Mediterranean. Such off-equatorial heat sources could excite Rossby waves, able to interact with the midlatitude westeries. Tyrlis et al. [15] reached a similar conclusion, i.e., the subsidence over the EM is mostly correlated with the monsoon convection activity over the North Arabian Sea.
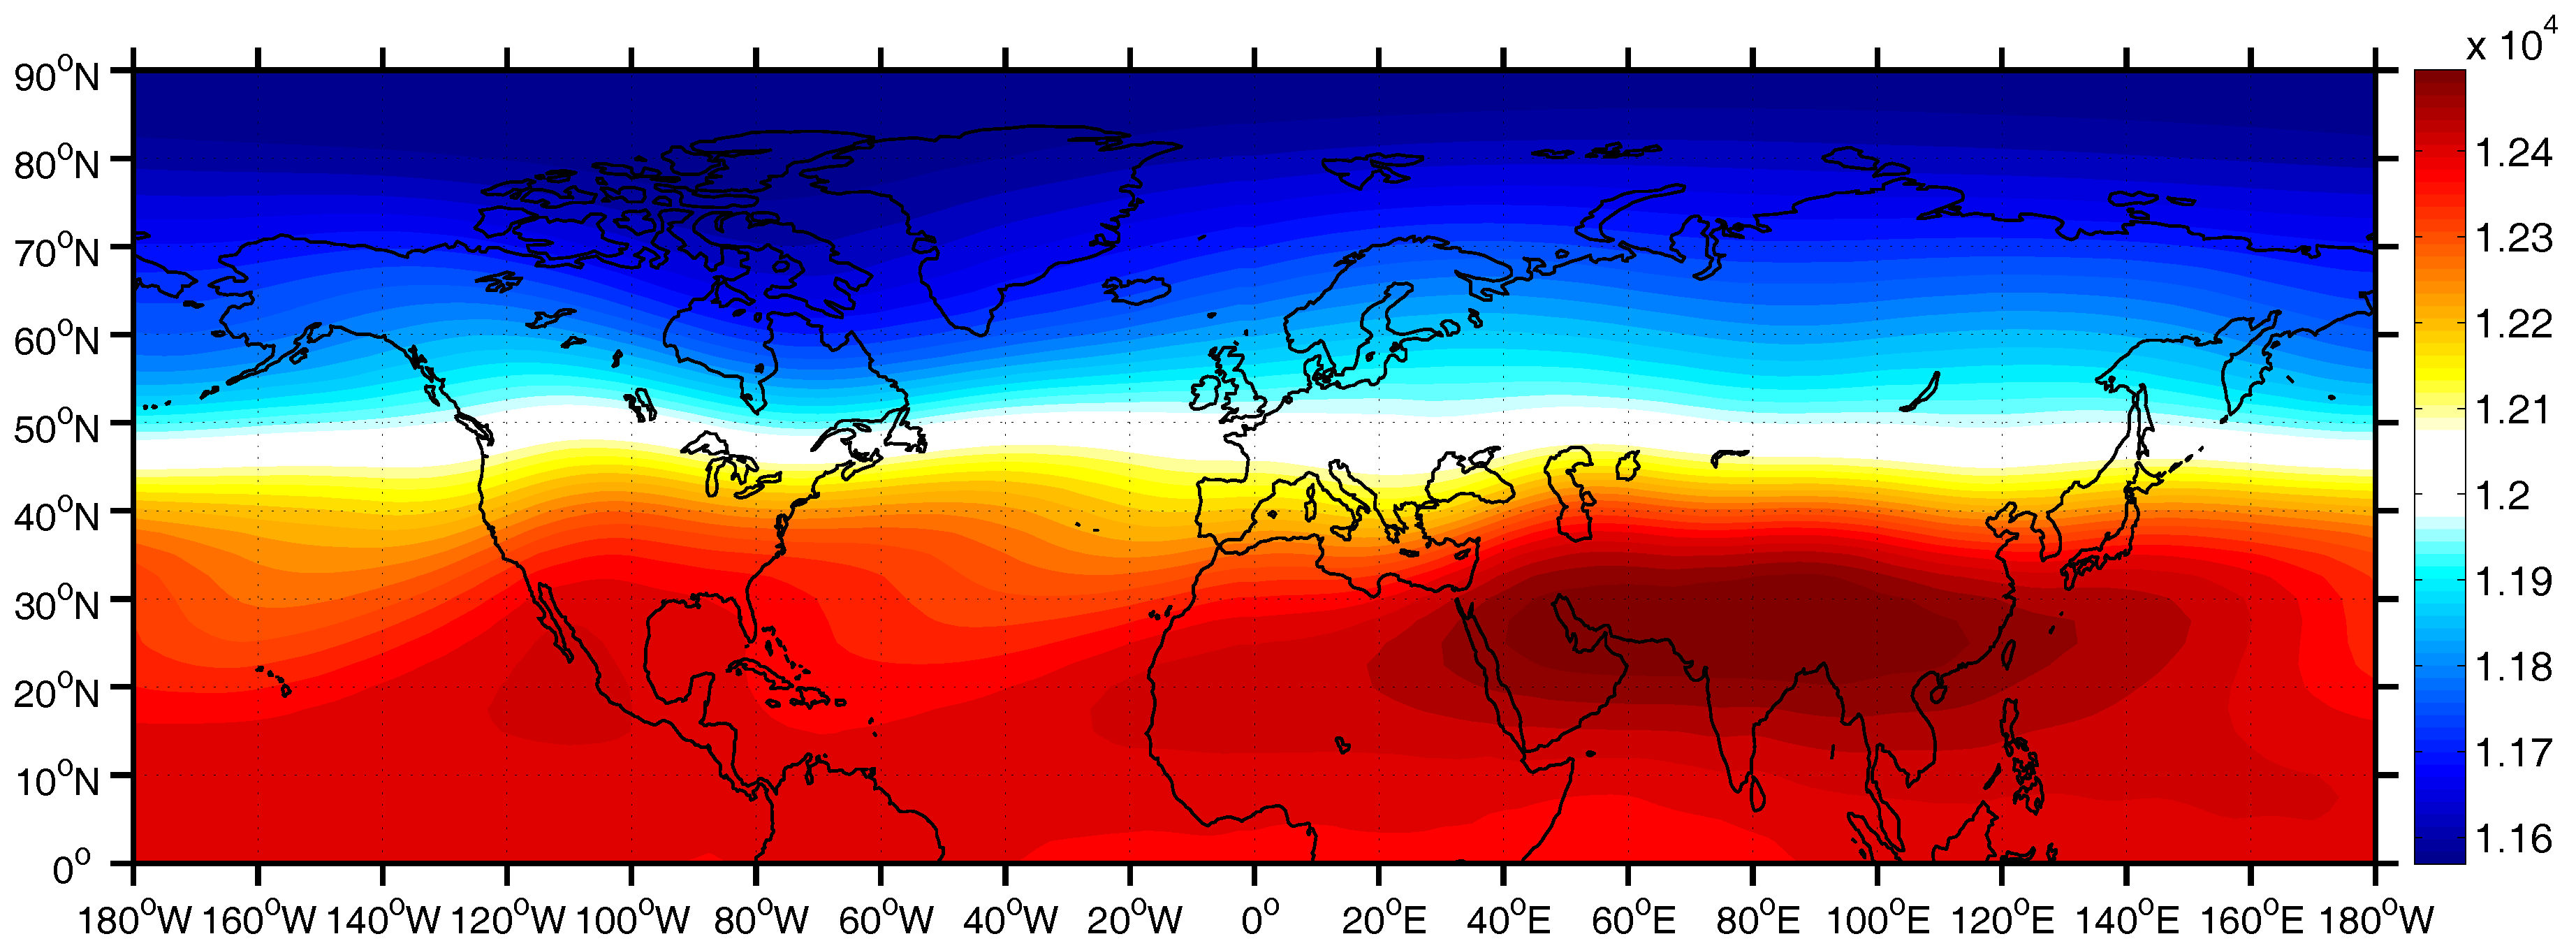
In order to facilitate the investigation of the dynamics related to the subsidence over the EM region, the upper troposphere circulation was examined with the aid of the PCA technique. Many previous researchers have studied the interrelationship between the ISM and the mid-latitude anomalous climate conditions, either by examining the impact of mid-latitudes on the ISM variability [23,29,30,31] or by investigating the influence of the ISM on the climate or weather conditions in the middle latitude regions [4,6,22,32,33]. In most of these cases, Rossby waves were found to regulate the revealed teleconnections. Figure 4 displays the 200 hPa geopotential height climatology. The high pressure band over tropical and subtropical latitudes, whose western flank covers the Middle East and N. Africa, is distinguished and an extended ridge forms over the ISM and the western North Pacific summer monsoon regions, corresponding to divergence areas and following the basic monsoon features described by [19]. Moreover, these ridges coincide with the diabatic heating of the monsoon systems.
PCA resulted in five main components for the case of geopotential height at 200 hPa (Z200) over the NH, which share approximately 80% of total variability. The correlation coefficient between the second and third component and AIRI is r = 0.52 and r = −0.56 respectively (significant at the 0.05 level) and it is worth noting that the Z200 PC3 signal presents larger amplitudes compared to the corresponding Z200 PC2 time series (Figure 5c). The PC2 loadings spatial pattern (22.6% of total variance) is characterized by positive geopotential height anomalies along the subtropical latitudes of the NH (Figure 5a). Specifically, significant correlations appear along subtropical and extratropical latitudes (40–50 N) over the Pacific region, western N. America coast and eastern Asia coast and along 30 N over the Atlantic and Eurasia. This wave pattern, that resulted from the application of RPCA in the Z200 field, looks very similar to the circumglobal teleconnection pattern (CGT) observed by Ding and Wang [22] and Ding and Wang [23] in the summertime midlatitude circulation of the NH, on the interannual and intraseasonal time scales of upper-tropospheric circulation. The third PC for the field of geopotential height at 500 hPa (not shown) was found almost identical, with slightly higher loadings.
The negative phase of PC3 for the Z200 field (21.7% of total variance), which correlates with AIRI, consists of three main anticyclonic anomaly centers over N. Africa, west-central Asia and NE Asia (Figure 5b). The two anticyclonic centers of PC3 located over Asia, belong to the CGT pattern, which is attributed to the combined contribution of both middle latitude circulation and ISM activity. As for the extended anticyclonic center found over N. Africa and west-central Asia, it resembles in structure the NH branch of an equatorially trapped Rossby wave of the upper troposphere, which is regarded as the response to a tropical source of diabatic heating near India [34]. According to previous studies [4,32,35], this wave train is excited due to the perturbation created by the release of massive amounts of diabatic heating in the area of ISM, it is located at the subtropical latitudes of both Hemispheres, symmetric relative to the Equator, and it propagates zonally to the west, reaching the coasts of Central America. The anticyclonic center over west-central Asia is part of the CGT wave, that develops north of the equatorially Rossby wave gyre, along the westerly flow of the midlatitudes.
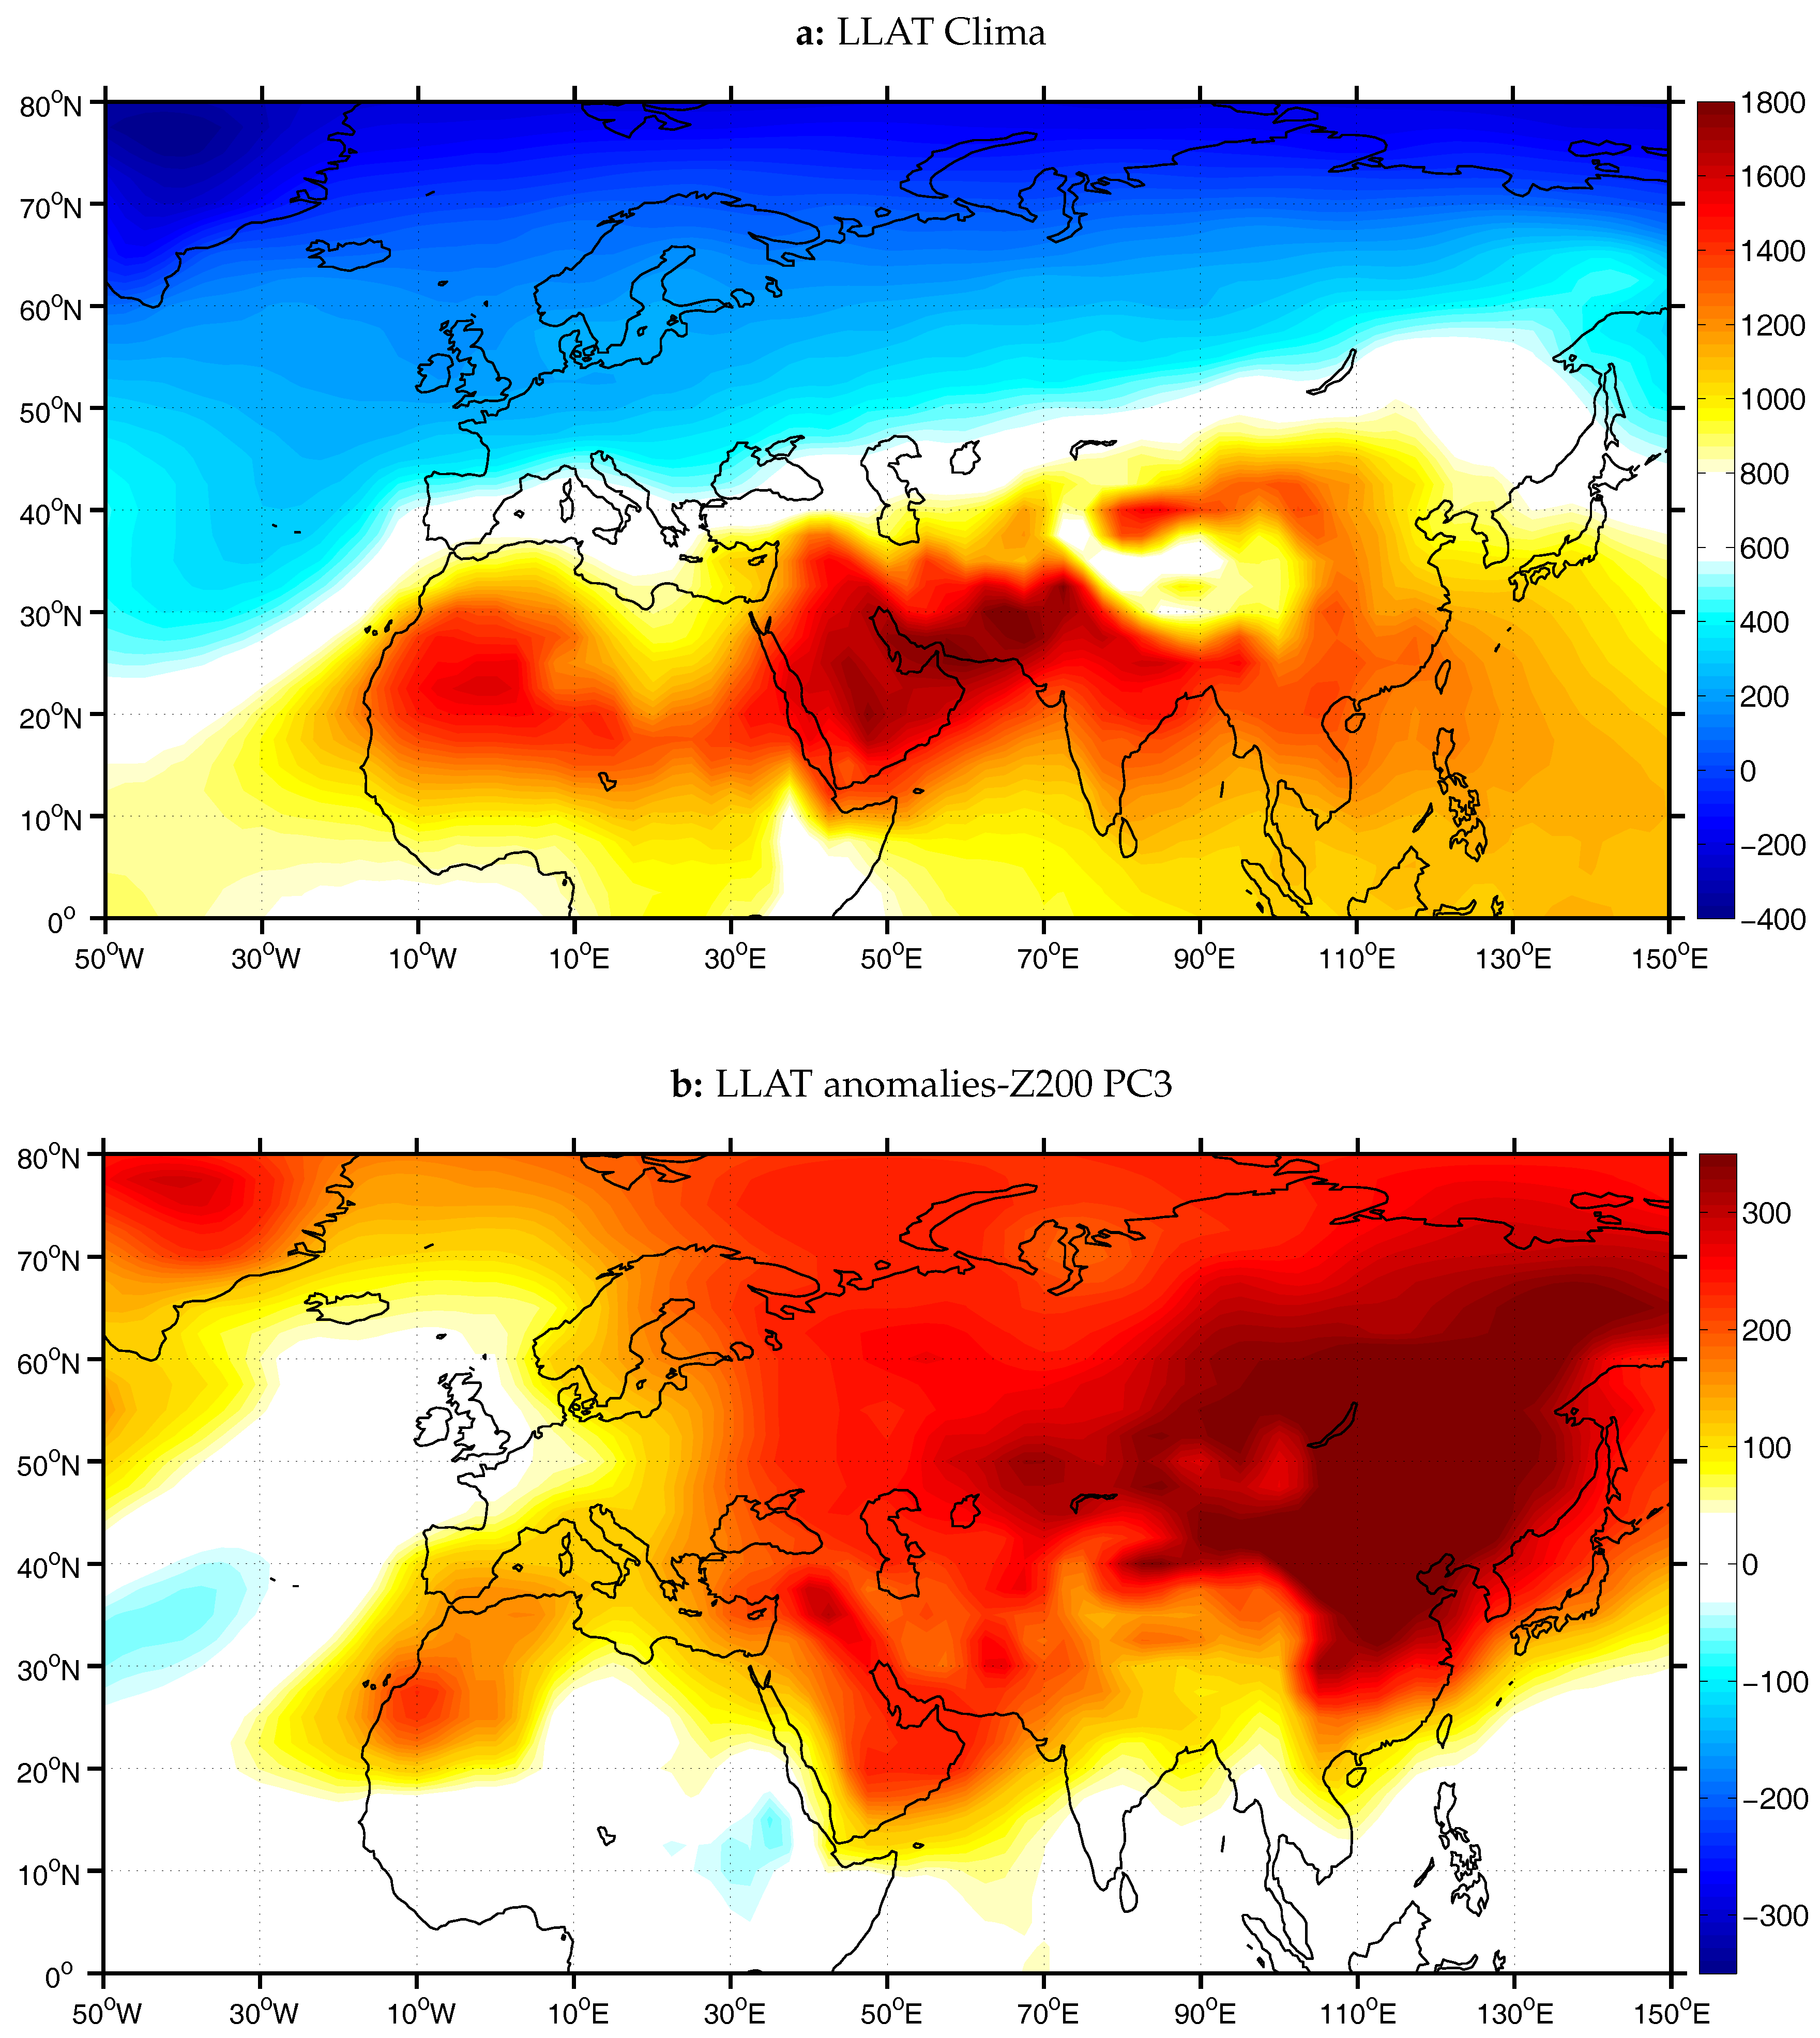
The anomalies of the low-level atmospheric thickness (LLAT) between the pressure levels of 700 hPa and 925 hPa, associated with months when the negative phase of PC3 for Z200 field prevails, are depicted in Figure 6b. The LLAT describes the heat-induced dilatation of the low levels and it is thus utilized to identify the areas where significant heat lows develop near the surface due to the lower troposphere heating [36]. The 0600 UTC reanalysis geopotential fields were used, as suggested by Lavaysse et al. [36], in order to minimize the effect of convective clouds and surface albedo on the radiative budget in the lower troposphere. During months with high Z200 PC3 score values, the Sahara heat low over West Africa appears to be enhanced compared to its climatology (Figure 6a) and moreover positive anomalies of LLAT, and hence of mean temperature of the tropospheric layer, are found over the Anatolian plateau, the Arabian peninsula, the Kyzylkum desert and the region east of the Caspian Sea as well as over the Thar desert in India and Pakistan and over Mongolia (Gobi desert) and China. The thermal influence of the most prominent desert regions of Eurasia, found west of the Indian subcontinent, may be of great importance for the modulation of the westward propagating Rossby waves. Rodwell and Hoskins [4], in their idealized simulations, investigated the effect of the local diabatic forcing of the east Sahara region on the intensity of descent observed over the EM. However, the effect of the desert heat lows on the formation and propagation of these westward moving waves has not been investigated thoroughly.
The development of this westward moving equatorial Rossby wave, which is associated with the ISM forcing, depends primarily on the relative position of the diabatic heating source in respect to the upper easterly jet over South Asia [20], as the amplitude of the tropical disturbance-response is directly related to the basic mean zonal flow. According to Lin [32] calculations and to the Doppler shifting effect of a mean zonal flow on forced equatorial waves [37,38], the Rossby wave response is very strong for a perturbation with wavenumber 6 and basic state zonal wind between O and 15 m/s. When the basic background flow consists of easterlies or strong westerlies, the response to the tropical diabatic heating is quite weak. In line with the above, when the tropical forcing of the ISM is located on latitudes with the aforementioned favorable conditions, that is, near zero or weak westerly background flow, then the NH Rossby wave gyre response can easily develop to the west and have a great intensity. Figure 5 represents the second and third main components of Z200 along with the mean state of the zonal wind speed component at 200 hPa. The colored contours correspond to zonal wind speeds over 15 m/s and below 0 m/s, following the calculations of Lin [32] for simplicity, with dark gray colors corresponding to westerlies and light gray colors to easterlies. The subtropical jet over central Asia and Europe is depicted, as well as the polar jet over N. America and the easterly jet over South Asia. For the case of Z200 PC2, the northern flanks of the wave disturbance lie over the mid-latitude westerlies and follow the movement of the subtropical jet over Eurasia and the polar jet over N. America and northern Atlantic, with a greater consistency over the Eurasia continent. The latter indicates the significant contribution of the subtropical jet stream in the development of the Rossby wave response in the extratropical latitudes [24]. The two anticyclonic centers of Z200 PC3 in the subtropics and especially the Rossby wave gyre over N. Africa are located within the area of weak westerlies, where the equatorial response to the ISM heating anomaly is favored to develop with a high amplitude. In the middle troposphere, no such geopotential pattern as in Z200 PC3 is recognized among its principal components.
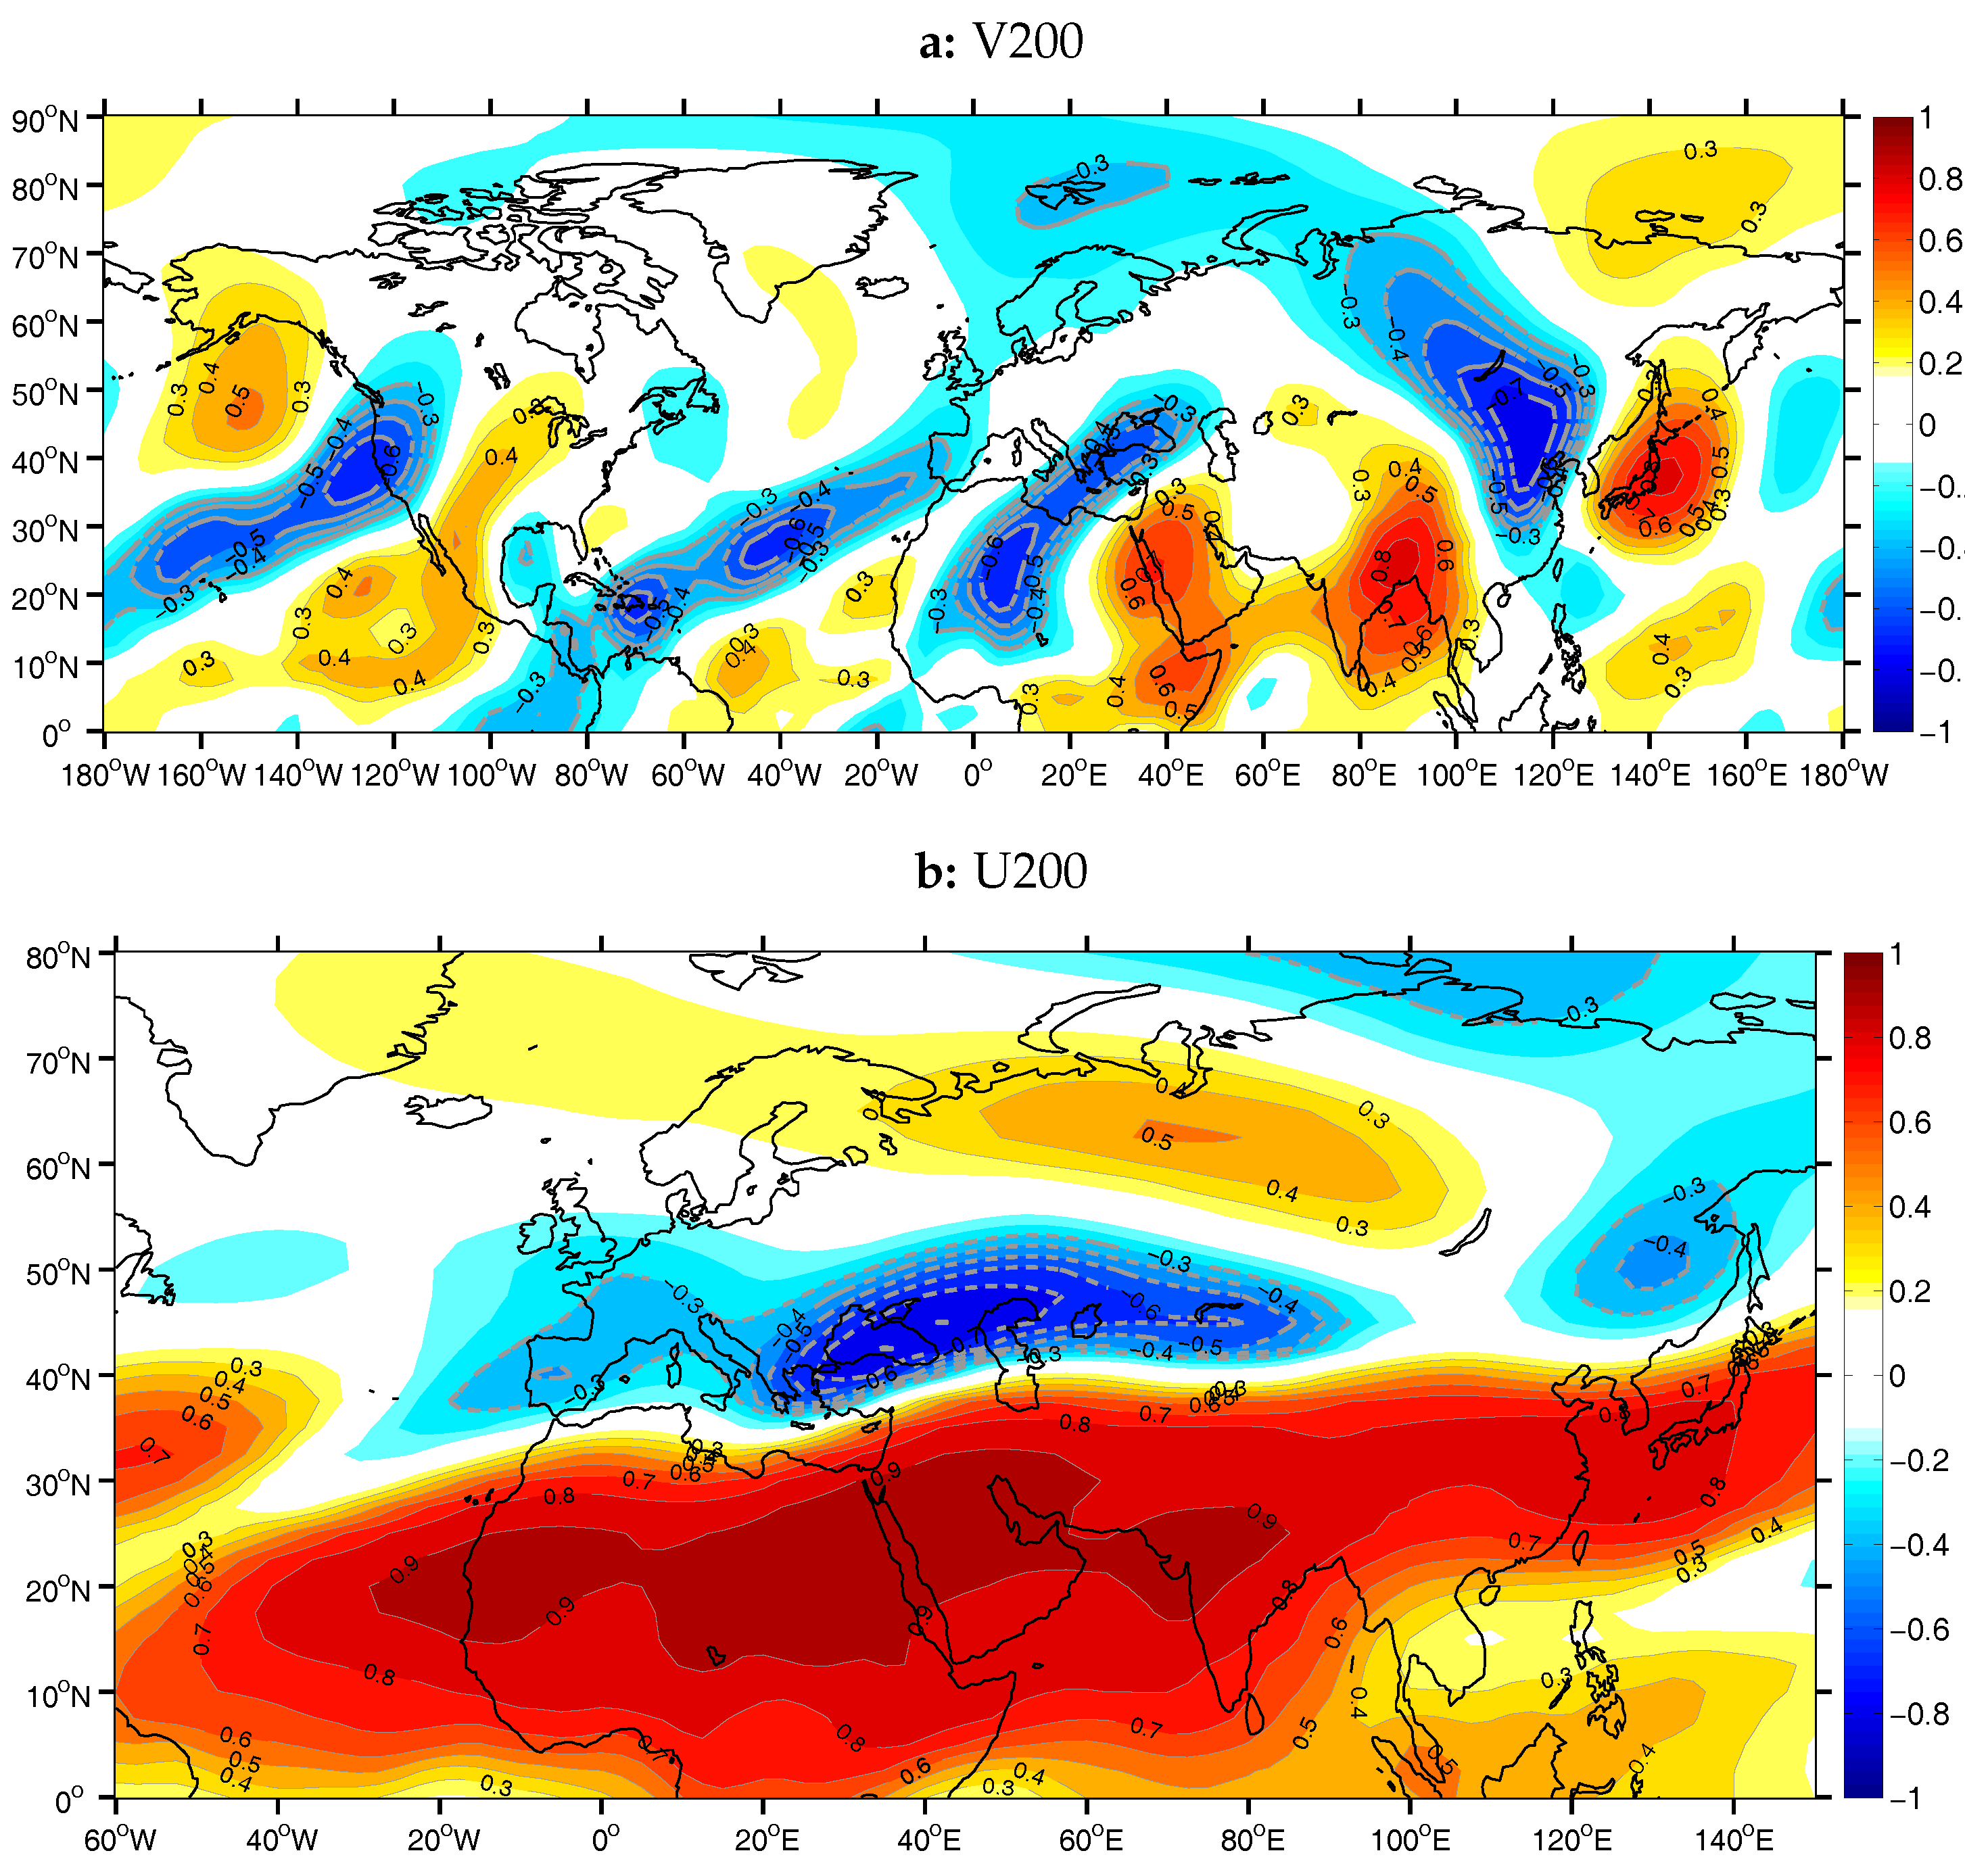
Based on the above analysis, it is inferred that a necessary condition for the development of the equatorial Rossby wave response west of the ISM tropical force source, is the retreat of the Eurasian subtropical jet poleward of its climatological mean position [32]. The retreat of the jet creates a zone of weak westerlies between the subtropical westerly jet and the easterly tropical jet. This phenomenon is depicted on the spatial pattern of the first component (Figure 7a) of zonal wind speed at 200 hPa (U200). PCA was applied on the field of U200 in the domain 0–80 N and 60 W–150 E and from the resultant components the 12 first main PCs were retained (75% of total variance). The first PC was the only one to have a statistically significant correlation with AIRI (r = −0.84, significant at the 0.05 level, Figure 7b).
The pattern of PC1 anomalies is bi-polar, consisting of a center of weak negative anomalies over EM and the Caspian Sea and a center of strong and extended positive anomalies, which covers South Asia, south of 40 N, the Middle East and North Africa, as well as the adjacent Atlantic Ocean, south of 30 N. The negative phase of PC1 can be interpreted as a strengthening and poleward displacement of the subtropical jet core over the EM region and central Asia, in combination with an enhancement of the tropical easterly jet over India, the Arabian Sea, Arabian peninsula and N. Africa along with a slight poleward displacement of it (Figure 7a). The latitudinal displacement of the two jets results in favorable conditions for the equatorial Rossby wave development and propagation towards N. Africa and EM, in an area away from the two jet cores.
The first PC (PC1; 8% of total variance) that arose for the case of meridional wind speed component at 200 hPa (V200) was found to have a very good correlation with AIRI (r = −0.72, significant at the 0.05 level, Figure 8b). From the application of PCA on the data of V200 for the whole NH, 36 components were retained and rotated, corresponding to 76% of the total variance. The PC1 spatial pattern consists of alternating positive and negative meridional wind anomalies (Figure 8), i.e., southerlies and northerlies, extending over almost all the NH. The wave of anomalies is found at the tropical and subtropical latitudes over Asia, Africa, Atlantic Ocean and the American continent, whereas over eastern Asia and the western Pacific Ocean, the wave shifts poleward, over the middle latitudes. The stronger anomaly centers are located over Eurasia, where two systems are detected. One is found over the subtropical latitudes, extending from the northern Bay of Bengal to the central Atlantic to the west, and the other is found over the middle latitudes of eastern Asia, with two action centers along the westerly jet. The system over the India and Africa region is located over an area characterized by low westerlies and easterlies (Figure 8) and it can be concluded that it resembles the tropical Rossby wave response to the monsoon heating of the atmosphere. Accordingly, the two anomaly centers over the eastern Asia are considered to belong to the CGT pattern, that follows the waveguide of the westerly jet.
PCA was once more applied on the Z200 field, but this time, prior to its application, the mean zonal state of Z200 was removed from the initial data, so that the deviation from the mean zonal flow becomes more apparent and the tropical Rossby wave can be isolated. The resulting pattern (Figure 9) is a combination of Z200 PC2 and PC3 that we discussed earlier in Figure 5. The most intense action center is an anomalous subtropical anticyclone over west-central Asia and N. Africa, which represents the tropical Rossby wave—response to the ISM forcing. The secondary anticyclonic center over eastern Asia, constitutes along with the midlatitude cyclonic centers, the footprint of the CGT pattern [22].
3.2. Persistent Northerly Flow over the EM Region
Etesians are the second major climatic feature in the region of EM during summer. As mentioned above, Etesians along with the vertical movement over EM, are considered a manifestation of the remote effect of the ISM [4] and they are also correlated with each other. In Figure 10, the climatology of the lower troposphere circulation components are presented. The two prominent dynamical factors of the lower troposphere geopotential field, the ISM thermal low and the Azores anticyclone, are apparent in Figure 10a. On the other hand, in Figure 10b, a persistent northerly air component over the central and eastern Mediterranean is depicted, with an expansion over western Libya and Egypt, and additionally a respective northerly flow is distinguished over the Red Sea, Iraq and the Persian Gulf as well as over the region south of the Aral Sea. As for the zonal wind speed field (Figure 10c), the values over the EM are significantly low, indicative of the prevailing northerly flow; the wind is of an eastern direction over the Black Sea and of a western direction over the Levantine Sea.
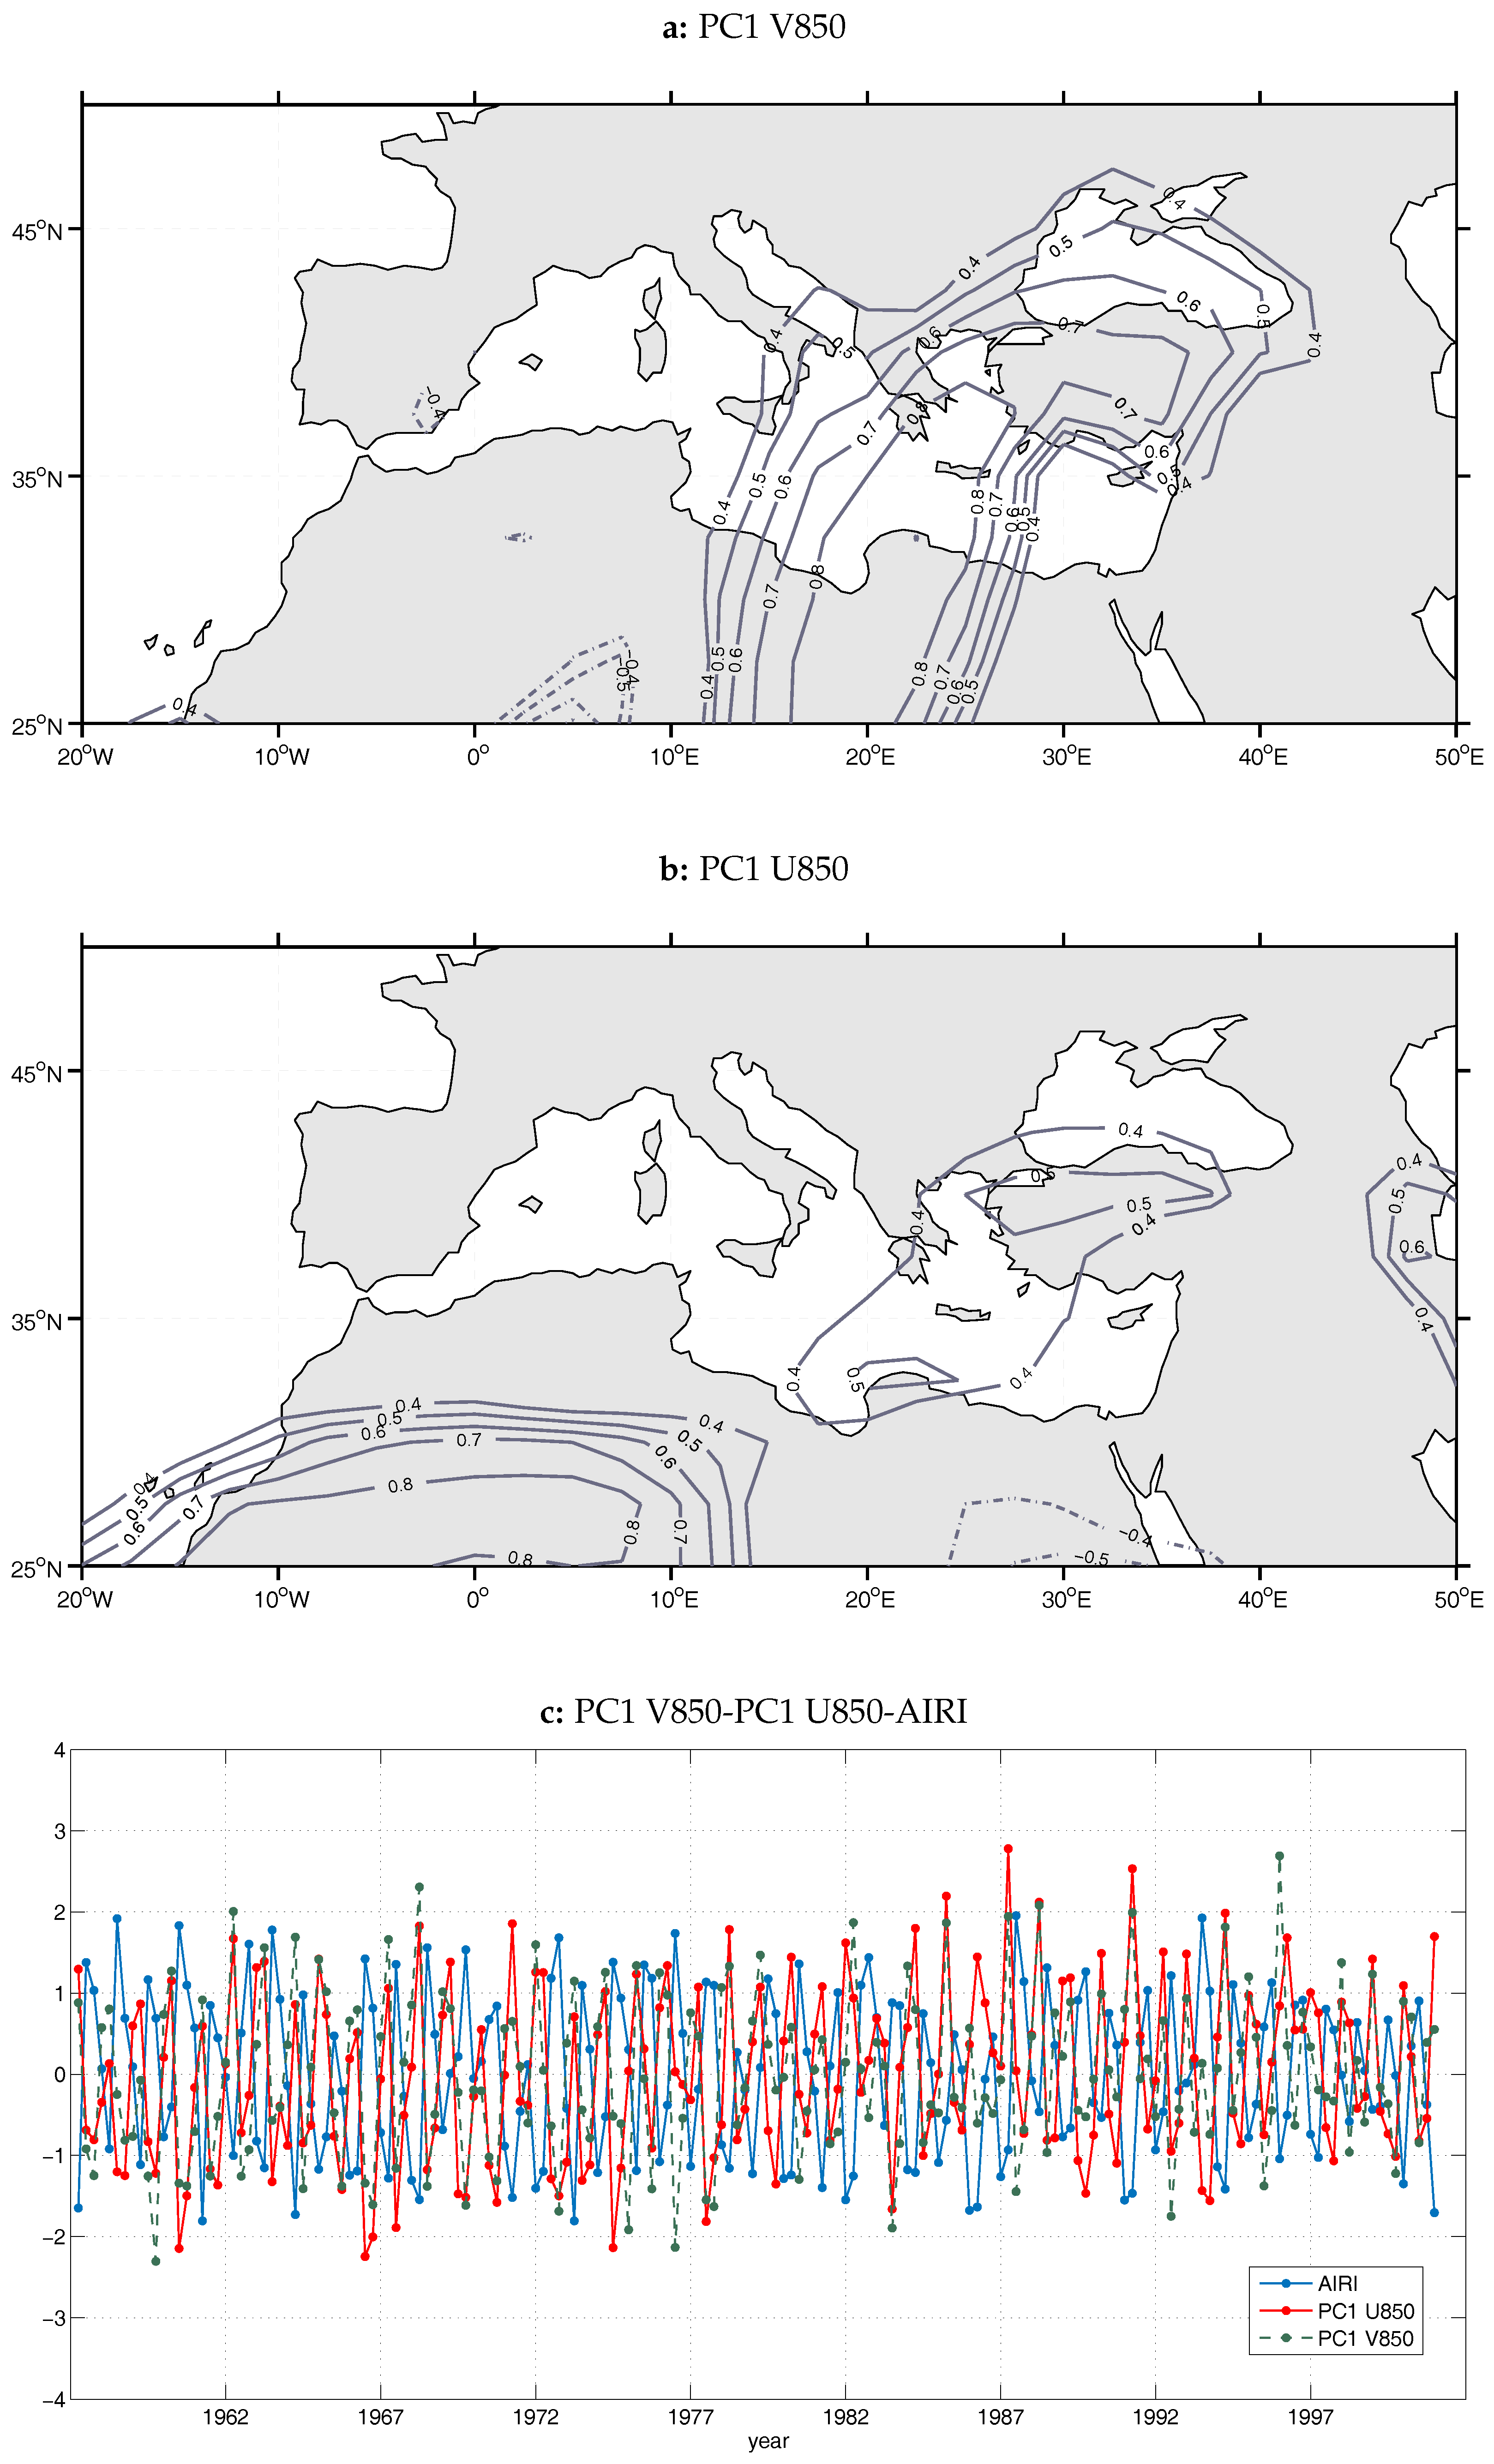
In the case of the meridional wind component at 850 hPa (V850), nine main components were retained and rotated, which together account for 73% of the total variability of the field over the region of 25–50 N and 20 W–50 E. The pattern of the correlation isolines of the first component (13% of total variability) resembles the characteristic pattern of Etesians during summer, which comprises northeasterly winds over the northern Aegean and northerly winds over the central and southern Aegean. Hence, the spatial pattern of PC1 shows that the center of action is located over the Aegean Sea and the western coast of Turkey, extending to the north over the Black Sea and to the south over Libya (Figure 11a). The correlation coefficient between the PC1 scores time series and the monsoon index AIRI is equal to r = −0.71 (significant at the 0.05 level), confirming that there is a connection between the PC1 pattern and the ISM and indicating that the intraseasonal variability of the Etesians is controlled by the ISM activity in accordance with the findings of Tyrlis et al. [15]. The center of action for the case of the Etesians, that is depicted in Figure 11a, is located right beneath the subsidence centers of the middle and upper troposphere (Figure 2a and Figure 3a), as was pointed out in the results of the idealized simulations of Rodwell and Hoskins [6]. According to them and the satisfaction of the Sverdrup vorticity balance, the Etesians can be considered as the equatorward flow that forms below the subsidence region over the EM.
As for the zonal component of wind speed at 850 hPa (U850), nine principal components were retained, which share approximately 77% of total variance. Based upon the loadings of the first component of U850, which exhibited the strongest correlation with AIRI (r = −0.72, significant at the 0.05 level), a spatial pattern with two action centers has resulted. The first and strongest center is located over NW Africa, between latitudes 25 and 30 N and is associated with the Harmattan winds, i.e the northeasterly trade winds that dominate over N. Africa in boreal summer, whereas the secondary center is a much weaker center of positive anomalies over the EM, with a SW–NE direction and with the higher loadings of the pattern being spotted over the southern region of the Black Sea. This means that during the months associated with the negative phase of U850 PC1, enhanced easterlies appear over NW Africa, reflecting the Harmattan circulation over the western Sahara and probably the mid-tropospheric easterly African jet [20]. The first principal components of V850 and U850 fields, which have the highest correlation with AIRI, fluctuate quite concurrently in time (Figure 11c) and thus present a significant correlation coefficient with a magnitude of r = 0.74.
In order to seek out the low-level circulation regime mostly related to the ISM activity, the PCA was performed based on monthly anomalies of 850 hPa geopotential height (Z850) in the domain 0–80 N and 60 W–150 E. Thirteen main components were retained and rotated, accounting for 83% of the total variance. The first and fifth main components exhibited a statistically significant correlation with AIRI (r = −0.6/r = −0.45, significant at the 0.05 level). The first PC depicts a dipole of correlations with an opposite sign (Figure 12a). The most prominent and extended center of the PC1 pattern covers almost all South Asia, south of 50 N, extends to the west over EM at a latitude of 40 N and at even lower latitudes over Africa, at the regions of great descent and deserts (15–25 N). The second pole, which consists of negative correlations, is found over the western Atlantic, between 20 and 30 N and is connected with the inner area of the subtropical Azores anticyclone. The strongest positive correlations are found over the northern Arabian Sea, Pakistan and Afghanistan as well as over Syria, Iraq and the Levantine. The AIRI index is correlated with the negative phase of PC1, thus in the months related to the negative PC1 phase, ISM strengthening coincides with enhanced cyclonic activity over the South Asia thermal low and Anatolian thermal low region and at the same time with enhanced anticyclonic activity over the negative correlation pole of the PC1 pattern. The strengthening of the South Asian thermal low and its expansion to the west, the Persian trough, is naturally connected to the ISM strength. On the other hand, the strengthening of the Azores anticyclone concurrently with the enhancement of ISM could be explained by the influence of a common element of low-frequency variability. The influence of the tropical Atlantic Ocean decadal variability and specifically of the Atlantic Multidecadal Oscillation on the Indian monsoon rainfall, via various physical mechanisms, has been studied extensively [39]. There are various studies that have emphasized the role of the North Atlantic Oscillation (NAO) in the teleconnections of circulation and sea surface temperature anomalies in the North Atlantic with the Indian monsoon [31,40]. More specifically, there is evidence that the Atlantic Multidecadal Oscillation is responsible for the decadal variability of the monsoon by modulating the frequency of occurrence of strong NAO events [41].
The spatial map of Z850 PC5 loadings (Figure 12b) is characterized by a monopole of negative correlations. The center of anomalies stretches over NW Africa, central and northern Europe and further to the east over EM, Greece and the Balkans. The negative phase of the component reflects an anomalous anticyclonic system over the area, which can be associated with the western center of action that contributes to the pressure gradient over the EM, necessary for the appearance of the Etesians. The surface anticyclone over central Europe and the Balkans has been considered by many as an expansion of the Azores anticyclone towards Europe. However, the findings of many researchers [7,9] suggest that, in most cases, the Azores and the central European anticyclones are of different origin and have no connection to each other, but are two separate systems with the central European/Balkan anticyclone being basically the result of negative vorticity advection by a wave disturbance originating over the N. Atlantic [42]. The correlation between the PC5 scores time series and AIRI could be attributed to the upstream influence of mid-latitude systems on the ISM variability on intraseasonal and interannual time scales [22,43,44]. It is interesting to note that no statistically significant correlation was found between the two GP850 principal components, which suggests that the two distinctive patterns they represent are unrelated.
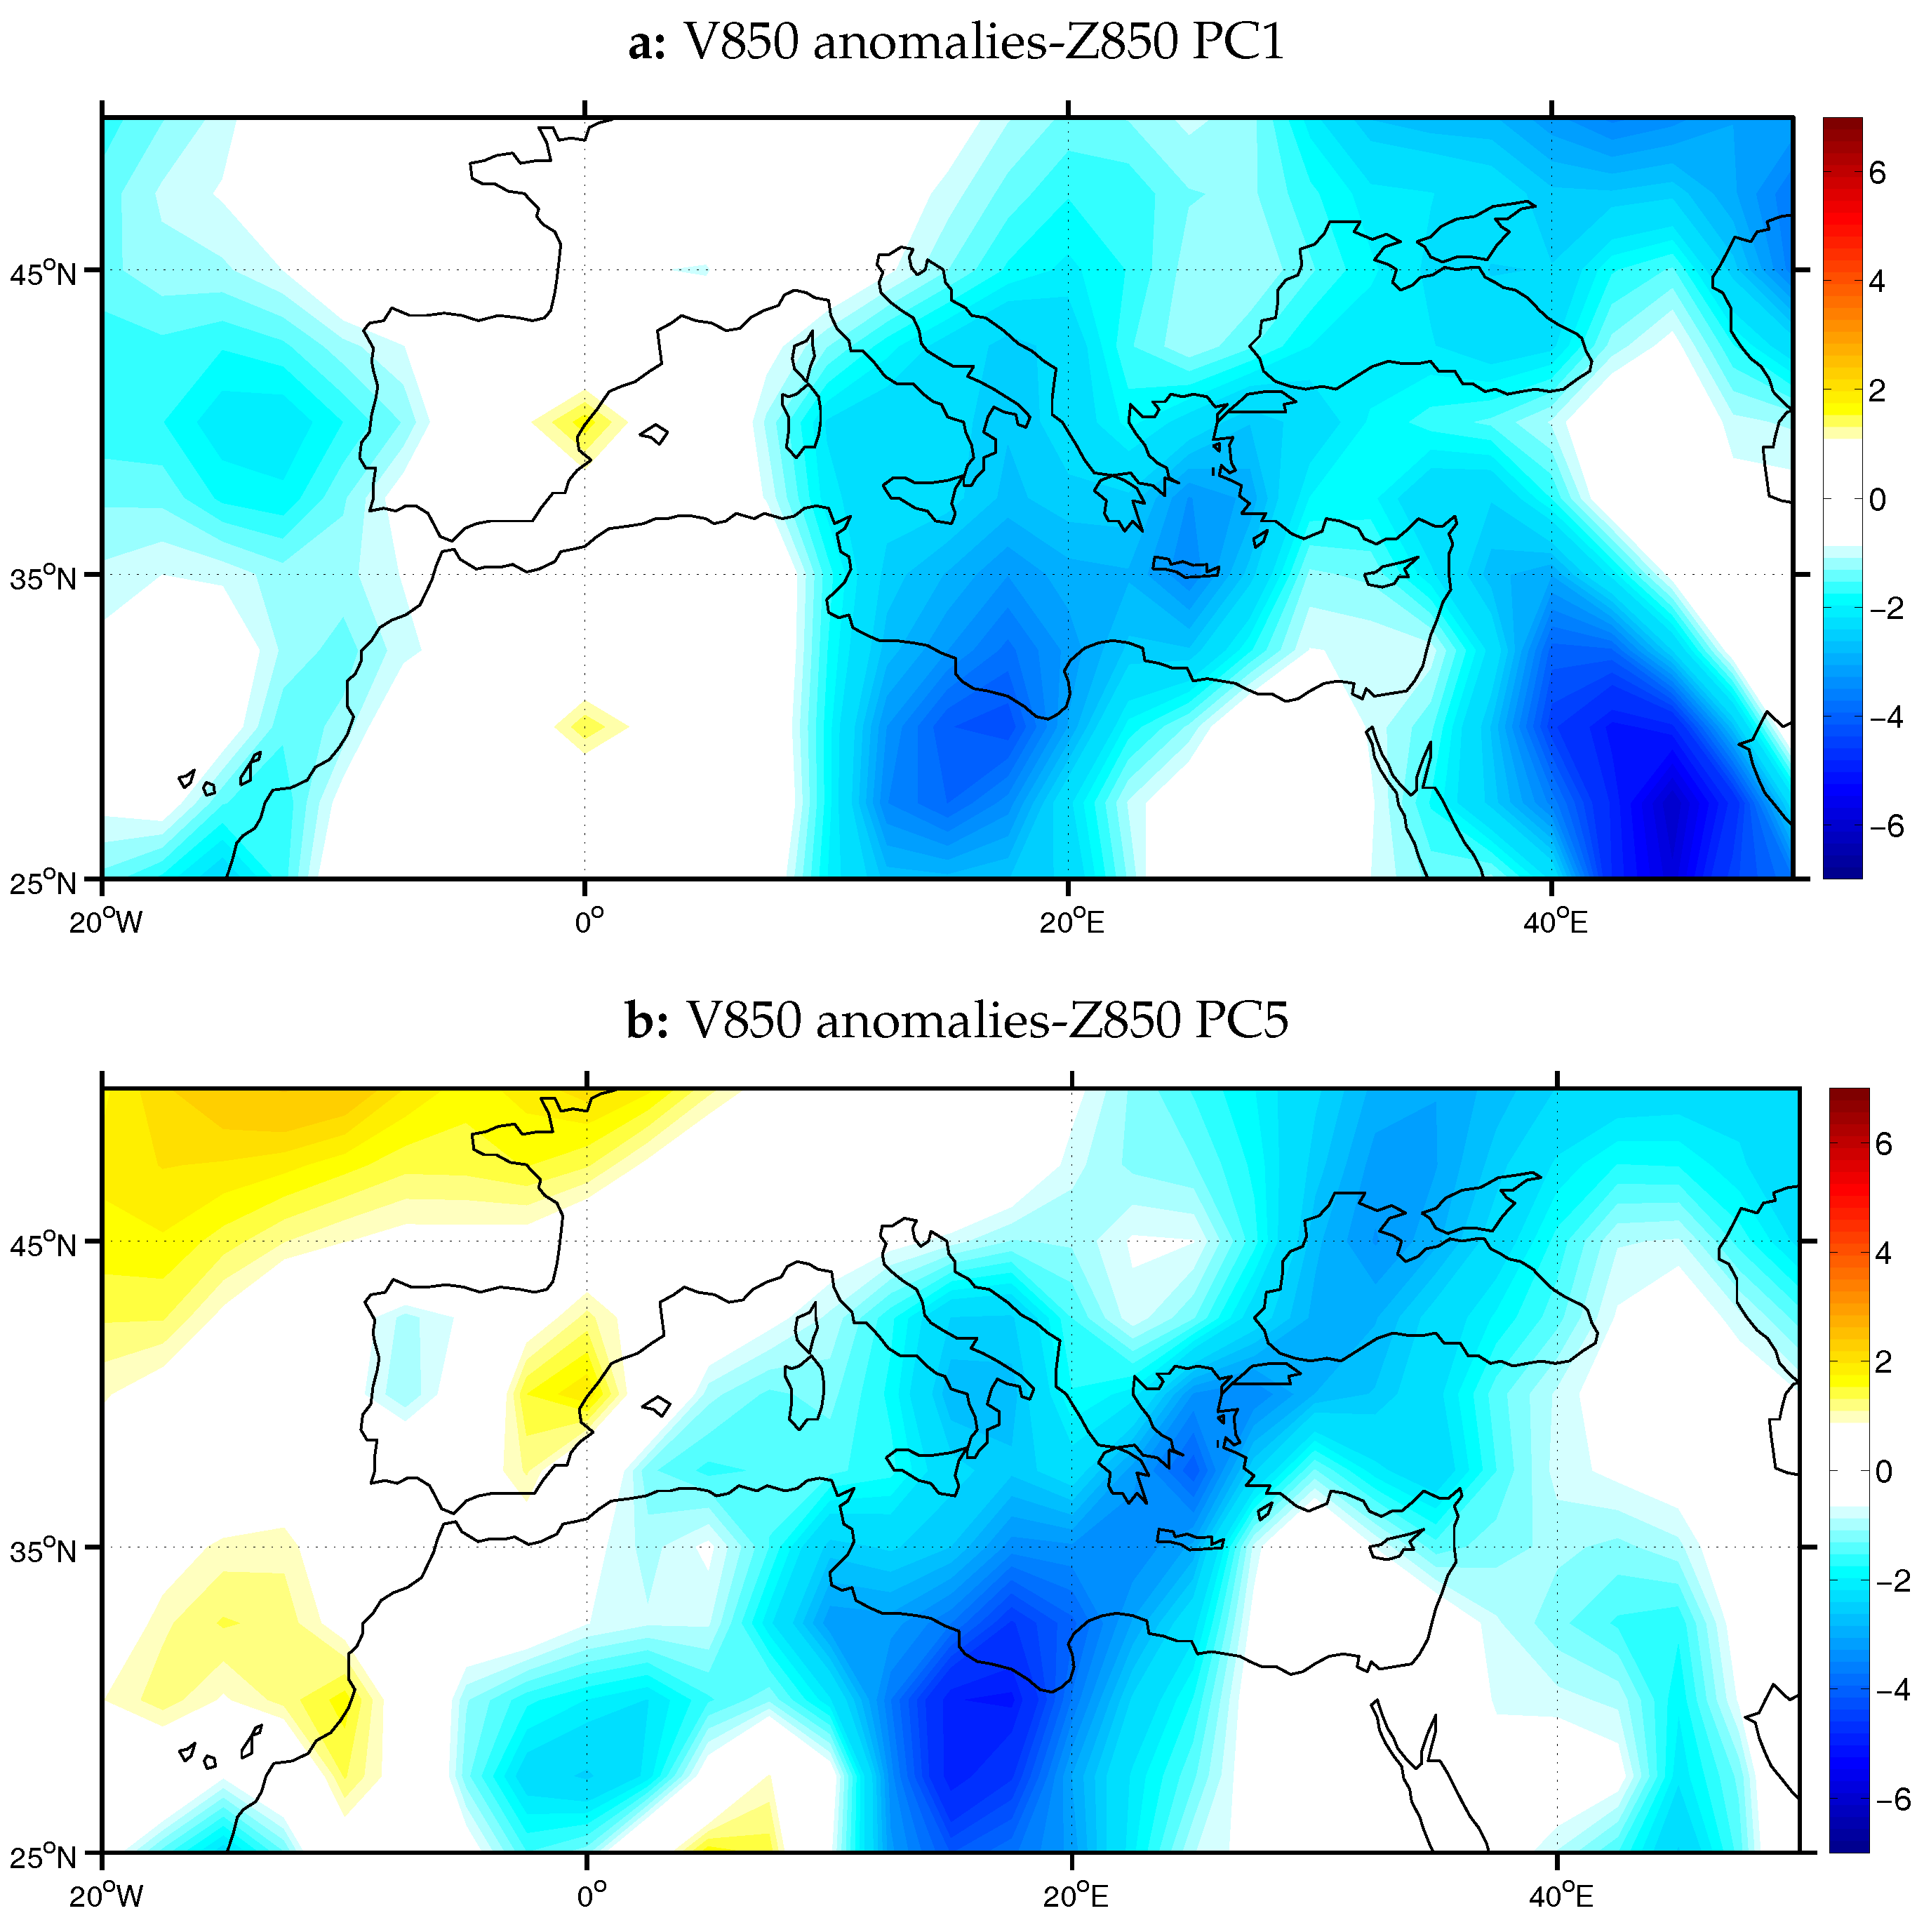
In order to gain insight into the surface wind regimes connected to these two Z850 components, the composite anomalies of V850 were constructed, corresponding to months belonging to the negative phase of the first and fifth PC of Z850 (Figure 13). The two resulting anomaly maps exhibit similar patterns of northerlies over central and eastern Mediterranean, with the main difference that for the case of the PC1 composite map the strongest northerlies appear to be over the Middle East and secondary over the central and eastern Mediterranean and Libya, whereas in the case of the PC5 composite map only the northerly winds over the Aegean and Libya can be seen. The above findings point to the results of Tyrlis et al. [15] and Tyrlis and Lelieveld [42], who in their studies concluded that the South Asian monsoon may indeed control the seasonality and arrival of the Etesian winds and subsidence movements over EM, as well as their interannual variability, but the middle latitude dynamics control the high-frequency variability of the Etesians specifically.
By combining the resulting PCs for the upper troposphere (Z200–Z500), that were mentioned above, and the first component of the lower troposphere (Z850), we can conclude that the Rossby wave response to the Indian monsoon heating has a baroclinic structure. The Rossby wave response is constituted primarily by an upper level ridge that extends over South Asia, North Africa and the Mediterranean, expanding to the west of the monsoon heating source, from the northern Bay of Bengal to the central Atlantic, and by a low level trough that expands westward from the monsoon region towards the EM and N. Africa via the Persian Gulf. The upper level ridge and the mid and upper tropospheric warming, that propagate westward from the diabatic heating source, constitute the structure that facilitates the subsidence over the EM, whereas the low level trough, in conjunction with the Balkan anticyclone, builds the steep gradient of surface pressure that produces the Etesian winds. Thus, both subsidence and Etesians appear to be connected with the atmospheric response to the monsoon activity.
3.3. CCA Results
In order to demonstrate the robustness of the connection found earlier between the ISM and specific circulation features, a cross-validation analysis was performed for the same period with the aid of CCA. CCA was applied on the main components that were derived from the application of PCA on the considered variables discussed earlier (Z200, U200, V200, Z850, V850, 500 and 200) as well as on the TTR field over the region of India. The domains of CCA application were respectively the whole NH for Z200 and V200, 0–80 N and 60 W–150 E for U200 and Z850 fields, the Mediterranean region (25–50 N and 20 W–50 E) for V850, 500 and 200 and 0–30 N and 50–100 E for the TTR data.
CCA results confirmed the previous findings of the PCA method, which detected the spatial patterns that were highly correlated with the ISM activity. Additionally, the CCA application associated the dominant spatial patterns of interest over EM and the NH with a specific monsoon action center over the ISM region. The products of a completed CCA include (i) canonical loading patterns for ‘predictor’ and ‘predictand’ variables separately; (ii) canonical variate time series (canonical scores) for each variate separately; and (iii) eigenvalues whose square roots are the canonical correlations.
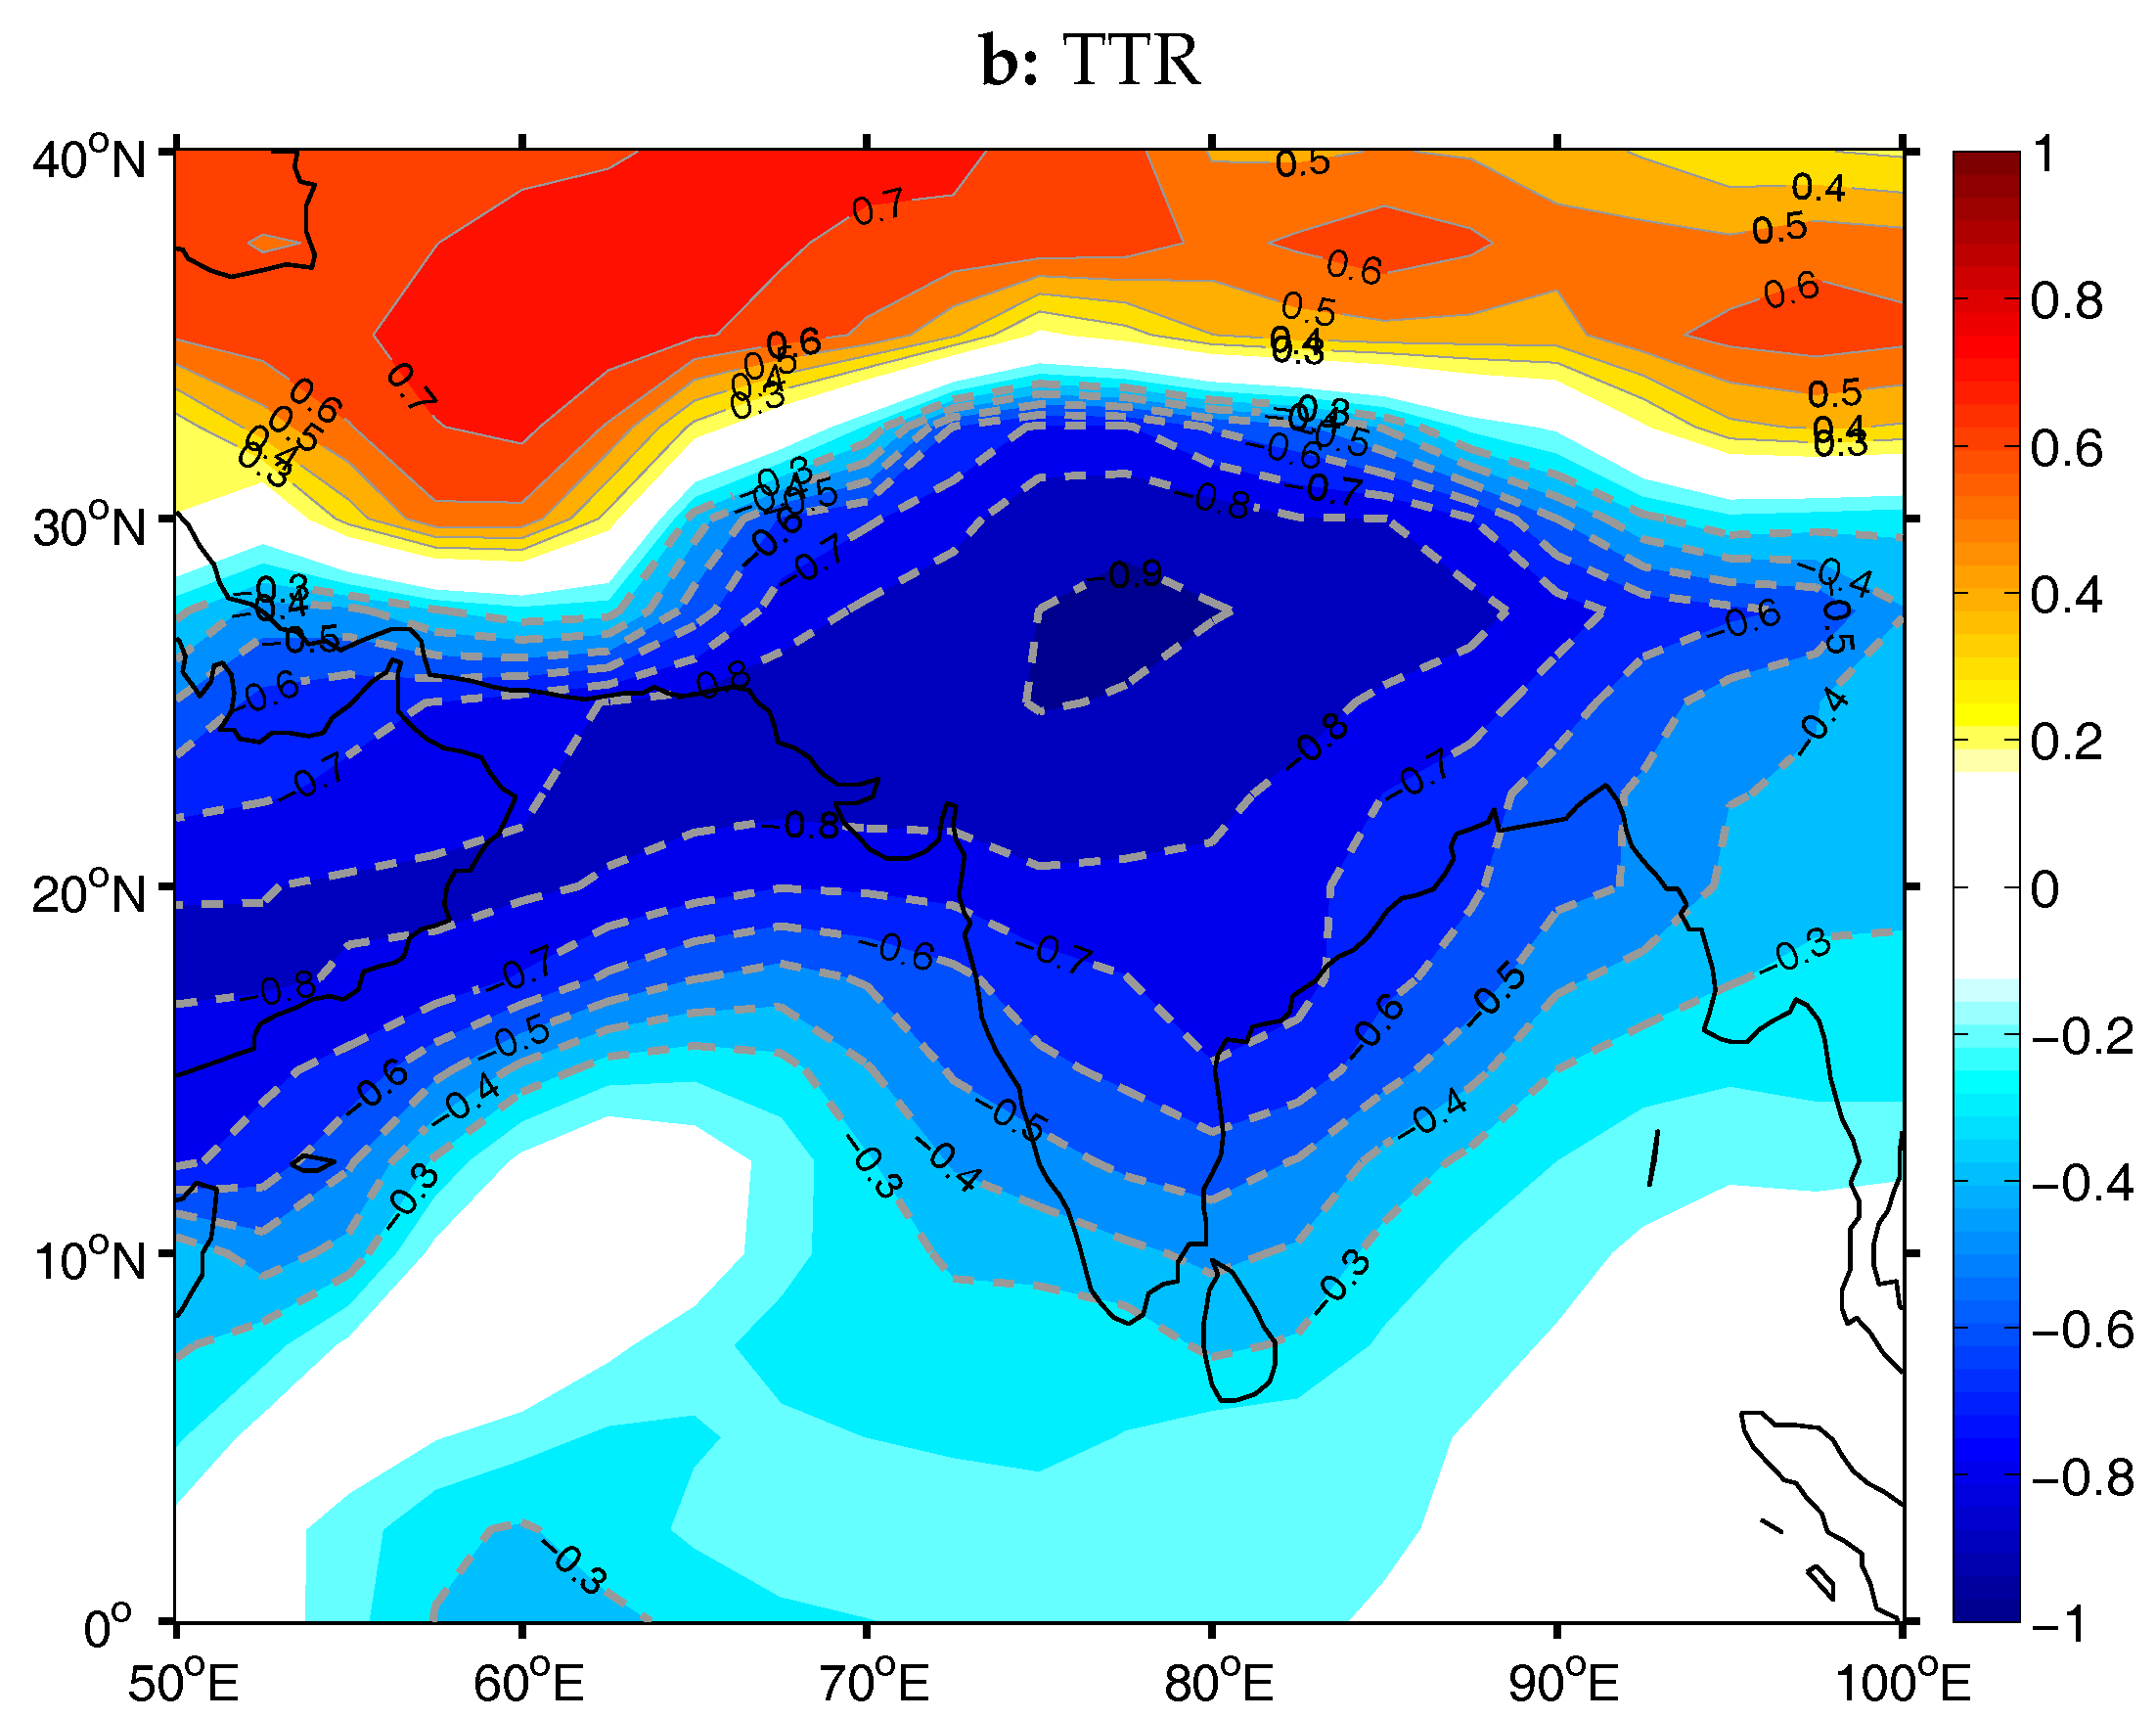
The first canonical pair, that was derived for the case of Z200 and TTR PCs, is depicted in Figure 14. For Z200, the PC depicted at Figure 9 can be identified, where the anticyclonic center over the west-central Asia and N. Africa prevails, whereas for the TTR field, the correlation coefficients between the resulting canonical variate and the TTR time series (canonical loadings) are above r = 0.8 over northwestern India and the northern Arabian Sea, at a range of latitudes between 20 and 25 N. High canonical loadings can be also found over the monsoon trough region in north-central India and the northern Bay of Bengal. The location of the monsoon action center that was identified to be correlated with the Rossby wave response that extends to the west of the monsoon region is in agreement with the findings of previous researchers [4,15]. The canonical correlation between the canonical variates of Z200 and TTR fields is r = 0.92. The spatial pattern of the correlation loadings over India resembles the phase of full development of the monsoon (established monsoon phase) or else the active periods of the monsoon, during which, positive rainfall anomalies cover the central Asia and negative rainfall anomalies appear over the SE Asia.
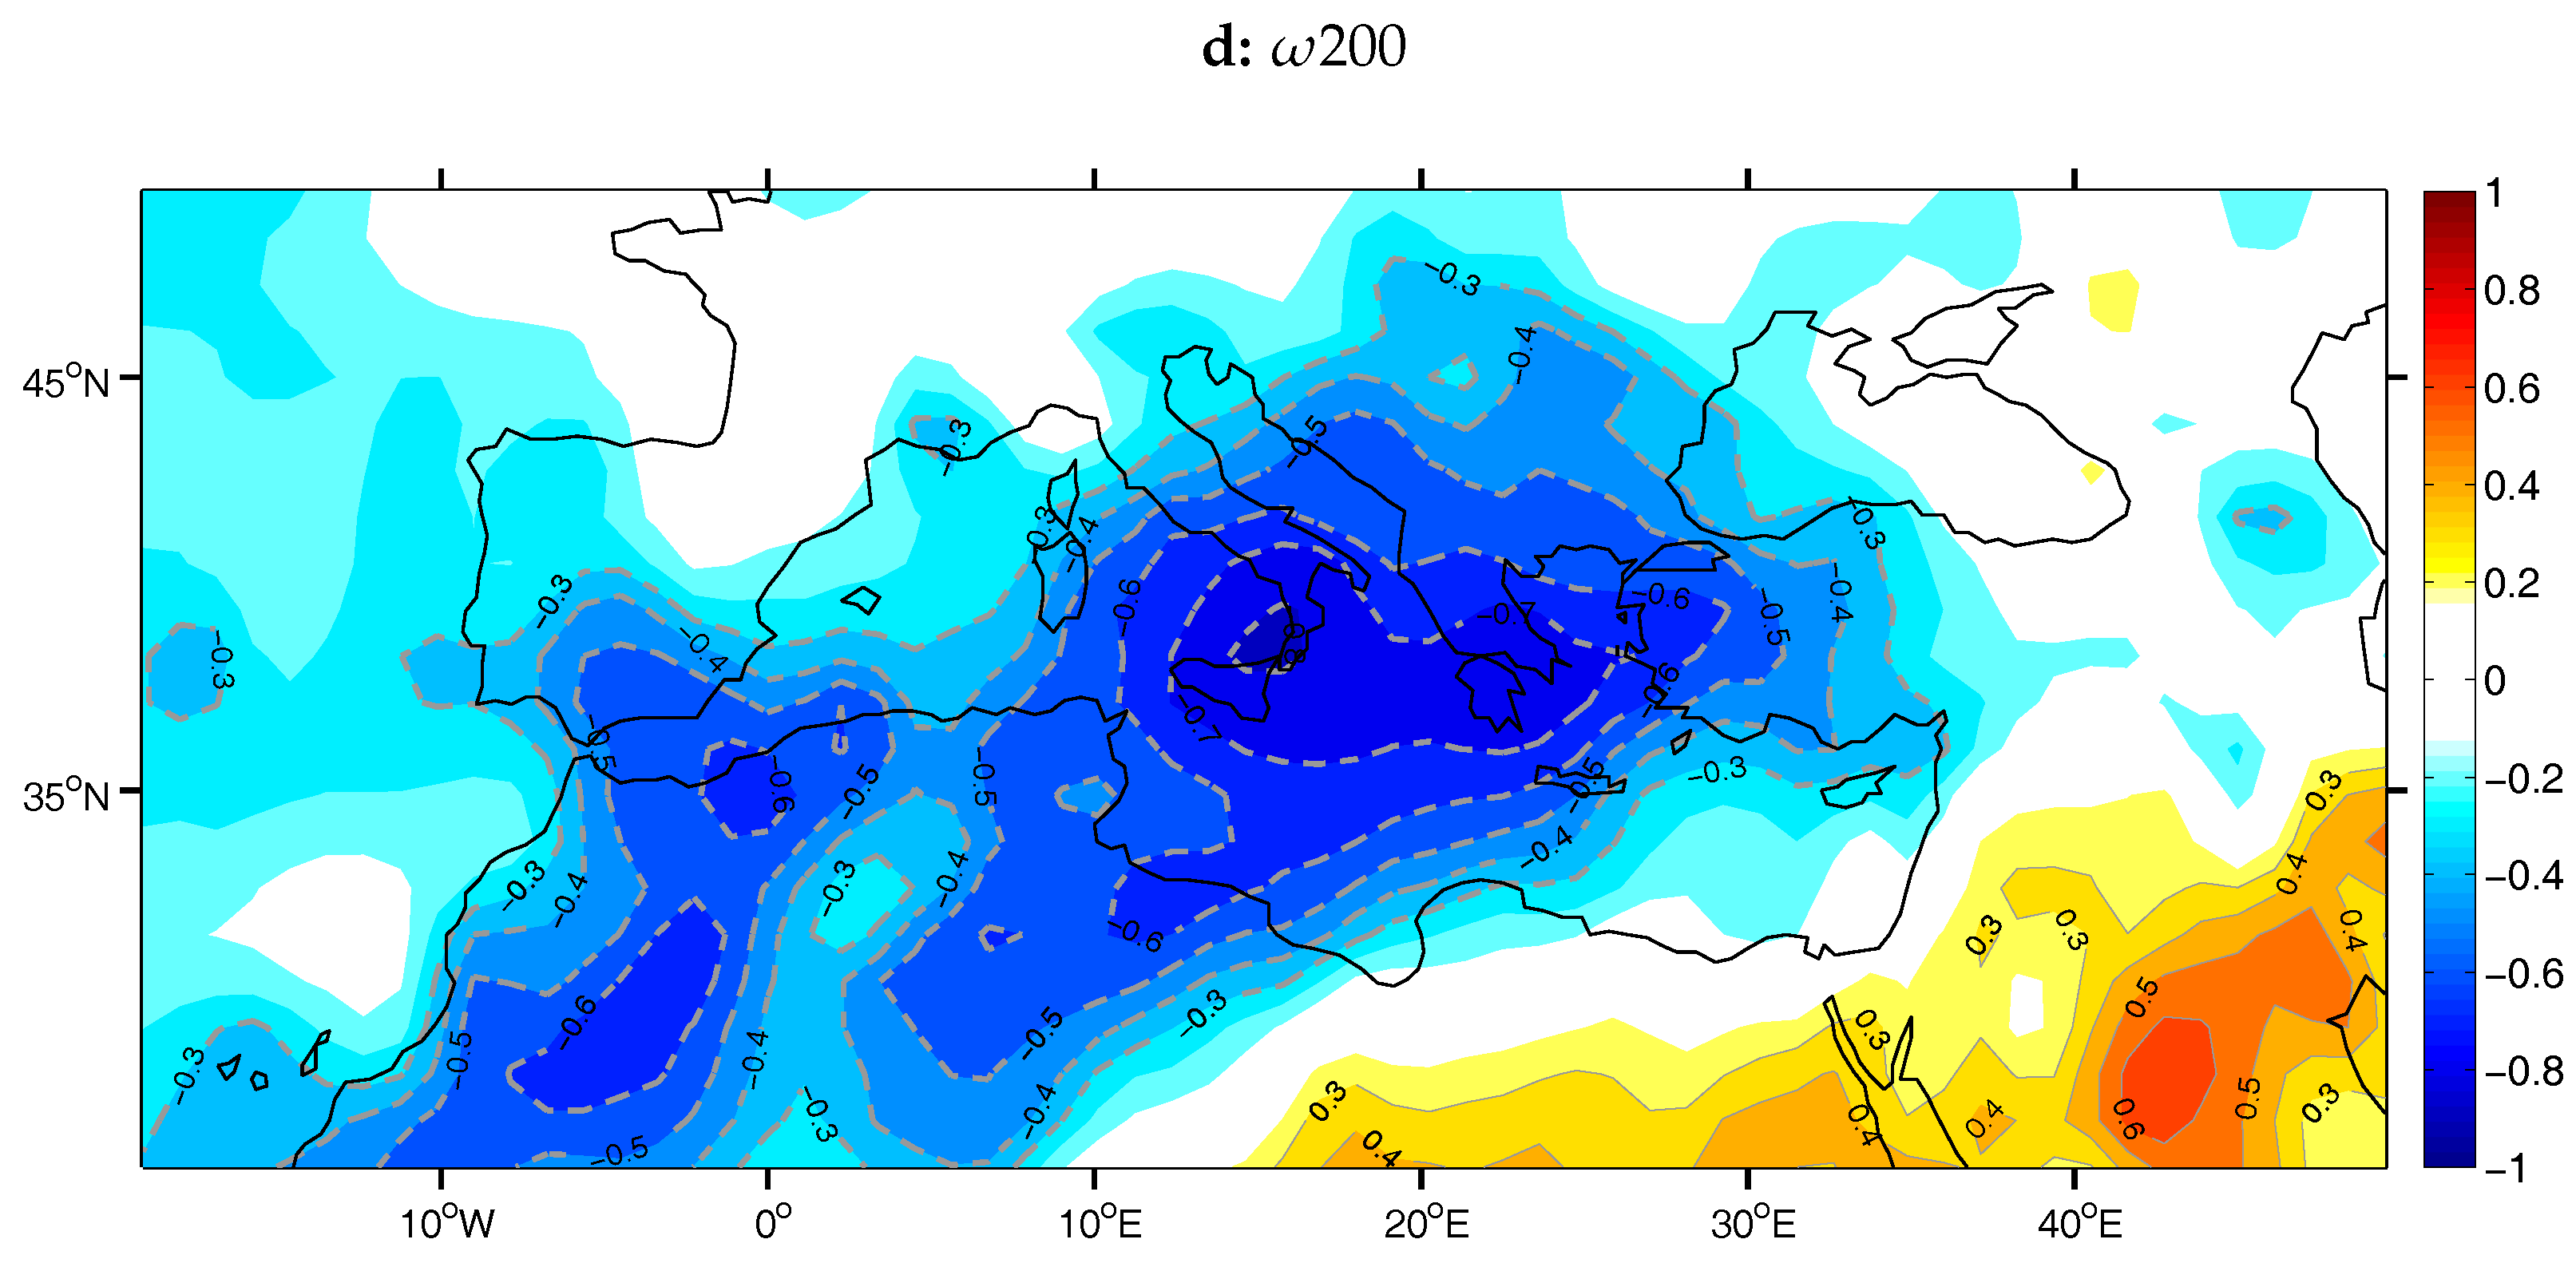
The rest of the variables examined were also found to be highly correlated with the active phase of the monsoon, that was identified in Figure 14b, in one of the first canonical pairs that were derived in each case. The respective canonical variates are presented in Figure 15 for upper troposphere circulation and in Figure 16 for the lower circulation variables. For simplicity, the spatial pattern of the TTR canonical variate is not re-presented, as it is almost identical in each case to that presented in Figure 14b.
4. Conclusions
In this work, the interrelationship of the main circulation patterns during boreal summer (June to September), found with the aid of PCA and the ISM variability, was investigated. The following conclusions can be drawn.
There is a statistically significant relationship between the ISM variability and the subsidence over the central and eastern Mediterranean. The subsidence center is located over the central and west-eastern Mediterranean at the middle troposphere and it is extended over EM in the upper troposphere. The ISM is also found to be related to a pure Etesians pattern, found from the application of PCA on the wind speed field of the lower troposphere (850 hPa). The extended Asian thermal low, which expands over the EM with the form of the Persian trough, is correlated with the ISM as expected, and has been identified to be associated with the persistent northerly flow over central and eastern Mediterranean. An anomalous subtropical system located over central Europe and NW Africa, which reaches the east over EM, has been also found to be associated with the northerly flow over central and eastern Mediterranean. This finding is compatible with previous studies [15,42], that attributed the control of high-frequency variability of Etesians to middle latitude dynamics; the control of their intraseasonal and interannual variability was attributed to the ISM effect.
In the upper atmospheric circulation, a teleconnection pattern is identified, which depicts a structure of an anticyclonic gyre extending over the subtropics, westward from northern India region up to the American continent, and is closely related to the equatorially trapped Rossby wave response to the convective activity of the ISM. The latitudinal displacement of the subtropical westerly jet stream over the EM and central-west Asia regions and the relative positions of the westerly jet and the tropical easterly jet in the Asia region set up the necessary favorable conditions of basic zonal flow for the development of the equatorial Rossby wave.
Furthermore, the coupled patterns that resulted from the application of the CCA on the respective circulation fields over the NH and EM and the top thermal radiation over the broader region of the ISM, suggested the northern Arabian Sea and the NW India, a region at latitudes of around 15 N–25 N, as well as the monsoon trough region, as the centers of monsoon action that are associated with the patterns revealed by the PCA analysis. The position of the monsoon action center over the northern Arabian Sea is in agreement with the findings of previous studies, which elaborated either numerical experiments [32,33] or observational evidence [15,22,23] to conclude that the ISM variability over the specific area acts as a forcing mechanism and significantly influences the extratropical circulation by inducing teleconnection patterns.
Our results confirm and elaborate upon the studies to date that have attempted to shed light on the influence of the ISM on the main circulation features of EM and on the mechanisms explaining this connection. A similar analysis should be conducted on the intraseasonal time scale, regarding the high-frequency variabilities of the Etesians and of subsidence movements over the EM and their connection to ISM activity, in order to understand the interrelation in its full dimension.
Acknowledgments
This research has been co-financed by the European Union (European Social Fund—ESF) and Greek national funds through the Operational Program “Education and Lifelong Learning” of the National Strategic Reference Framework (NSRF)—Research Funding Program: Heracleitus II. Investing in knowledge society through the European Social Fund.
Author Contributions
Despina Rizou gathered data and performed the analyses. Despina Rizou and Helena A. Flocas conceived and designed the study. Maria Hatzaki and Aristides Bartzokas provided input on the interpretation of the statistical analysis. Despina Rizou, Helena A. Flocas, Maria Hatzaki and Aristides Bartzokas contributed to the preparation of the manuscript.
Conflicts of Interest
The authors declare no conflict of interest. The founding sponsors had no role in the design of the study; in the collection, analyses, or interpretation of data; in the writing of the manuscript, and in the decision to publish the results.
Abbreviations
The following abbreviations are used in this manuscript:
| EM | eastern Mediterranean |
| ISM | Indian summer monsoon |
| PCA | Principal Component Analysis |
| CCA | Canonical Correlation Analysis |
| TTR | Top Thermal Radiation |
| JJAS | June-July-August-September |
| AIRI | All India Rainfall Index |
| PC | principal component |
| NH | Northern Hemisphere |
| 500 | vertical velocity at 500 hPa |
| 200 | vertical velocity at 200 hPa |
| Z850 | geopotential height at 850 hPa |
| U850 | zonal wind speed at 850 hPa |
| V850 | meridional wind speed at 850 hPa |
| Z200 | geopotential height at 200 hPa |
| CGT | circumglobal teleconnection pattern |
| U200 | zonal wind speed at 200 hPa |
| V200 | meridional wind speed at 200 hPa |
| LLAT | low-level atmospheric thickness |
| NAO | North Atlantic Oscillation |
References
- Lionello, P.; Malanotte-Rizzoli, P.; Boscolo, R.; Alpert, P.; Artale, V.; Li, L.; Luterbacher, J.; May, W.; Trigo, R.; Tsimplis, M.; et al. The Mediterranean climate: An overview of the main characteristics and issues. Dev. Earth Environ. Sci. 2006, 4, 1–26. [Google Scholar]
- Alpert, P.; Baldi, M.; Ilani, R.; Krichak, S.; Price, C.; Rodo, X.; Saaroni, H.; Ziv, B.; Kishcha, P.; Barkan, J.; et al. Relations between climate variability in the Mediterranean region and the tropics: ENSO, South Asian and African monsoons, hurricanes and Saharan dust. Dev. Earth Environ. Sci. 2006, 4, 149–177. [Google Scholar]
- Trigo, R.; Xoplaki, E.; Zorita, E.; Luterbacher, J.; Krichak, S.; Alpert, P.; Jacobeit, J.; Sáenz, J.; Fernández, J.; González-Rouco, F.; et al. Relations between variability in the Mediterranean region and mid-latitude variability. Dev. Earth Environ. Sci. 2006, 4, 179–226. [Google Scholar]
- Rodwell, M.; Hoskins, B. Monsoons and the dynamics of deserts. Q. J. R. Meteorol. Soc. 1996, 122, 1385–1404. [Google Scholar] [CrossRef]
- Ziv, B.; Saaroni, H.; Alpert, P. The factors governing the summer regime of the eastern Mediterranean. Int. J. Climatol. 2004, 24, 1859–1871. [Google Scholar] [CrossRef]
- Rodwell, M.; Hoskins, B. Subtropical anticyclones and summer monsoons. J. Clim. 2001, 14, 3192–3211. [Google Scholar] [CrossRef]
- Prezerakos, N. Does the extension of the Azores’ anticyclone towards the Balkans really exist? Meteorol. Atmos. Phys. 1984, 33, 217–227. [Google Scholar] [CrossRef]
- Kallos, G.; Kassomenos, P.; Pielke, R. Synoptic and mesoscale weather conditions during air pollution episodes in Athens, Greece. Bound. Layer Meteorol. 1993, 62, 163–184. [Google Scholar] [CrossRef]
- Metaxas, D. The interannual variability of the Etesian frequency as a response of atmospheric circulation anomalies. Bull. Hell. Meteorol. Soc. 1977, 2, 30–40. [Google Scholar]
- Carapiperis, L. On the periodicity of the Etesians in Athens. Weather 1951, 6, 378–379. [Google Scholar] [CrossRef]
- Maheras, P. Le probleme des Etesiens. Mediterranee 1980, 40, 57–66. [Google Scholar] [CrossRef]
- Alpert, P.; Abramsky, R.; Neeman, B. The prevailing summer synoptic system in Israel—Subtropical high, not Persian trough. Isr. J. Earth Sci. 1990, 39, 93–102. [Google Scholar]
- Saaroni, H.; Ziv, B. Summer rain episodes in a Mediterranean climate, the case of Israel: Climatological-dynamical analysis. Int. J. Climatol. 2000, 20, 191–209. [Google Scholar]
- Harpaz, T.; Ziv, B.; Saaroni, H.; Beja, E. Extreme summer temperatures in the east Mediterranean—Dynamical analysis. Int. J. Climatol. 2014, 34, 849–862. [Google Scholar] [CrossRef]
- Tyrlis, E.; Lelieveld, J.; Steil, B. The summer circulation over the eastern Mediterranean and the Middle East: Influence of the South Asian monsoon. Clim. Dyn. 2013, 40, 1103–1123. [Google Scholar] [CrossRef]
- Dima, I.; Wallace, J. On the seasonality of the Hadley cell. J. Atmos. Sci. 2003, 60, 1522–1527. [Google Scholar] [CrossRef]
- Waliser, D.; Somerville, R. Preferred latitudes of the intertropical convergence zone. J. Atmos. Sci. 1994, 51, 1619–1639. [Google Scholar] [CrossRef]
- Webster, P. The role of hydrological processes in ocean-atmosphere interactions. Rev. Geophys. 1994, 32, 427–476. [Google Scholar] [CrossRef]
- Chen, T. Maintenance of summer monsoon circulations: A planetary-scale perspective. J. Clim. 2003, 16, 2022–2037. [Google Scholar] [CrossRef]
- Chen, T. Maintenance of the midtropospheric North African summer circulation: Saharan high and African easterly jet. J. Clim. 2005, 18, 2943–2962. [Google Scholar] [CrossRef]
- Raicich, F.; Pinardi, N.; Navarra, A. Teleconnections between Indian monsoon and Sahel rainfall and the Mediterranean. Int. J. Climatol. 2003, 23, 173–186. [Google Scholar] [CrossRef]
- Ding, Q.; Wang, B. Circumglobal teleconnection in the northern hemisphere summer. J. Clim. 2005, 18, 3483–3505. [Google Scholar] [CrossRef]
- Ding, Q.; Wang, B. Intraseasonal teleconnection between the summer Eurasian wave train and the Indian Monsoon. J. Clim. 2007, 20, 3751–3767. [Google Scholar] [CrossRef]
- Branstator, G. Circumglobal teleconnections, the jet stream waveguide, and the North Atlantic Oscillation. J. Clim. 2002, 15, 1893–1910. [Google Scholar] [CrossRef]
- Uppala, S.; Kållberg, P.; Simmons, A.; Andrae, U.; Bechtold, V.; Fiorino, M.; Gibson, J.; Haseler, J.; Hernandez, A.; Kelly, G.; et al. The ERA-40 re-analysis. Q. J. R. Meteorol. Soc. 2005, 131, 2961–3012. [Google Scholar] [CrossRef]
- Parthasarathy, B.; Munot, A.; Kothawale, D. All-India monthly and seasonal rainfall series: 1871–1993. Theor. Appl. Climatol. 1994, 49, 217–224. [Google Scholar] [CrossRef]
- Parthasarathy, B. Monthly and Seasonal Rainfall Series for All India, Homogeneous Regions and Meteorological Subdivisions: 1871–1994; Indian Institute of Tropical meteorology Research Report; Indian Institute of Tropical meteorology: Maharashtra, Indian, 1995. [Google Scholar]
- Horel, J. A rotated principal component analysis of the interannual variability of the Northern Hemisphere 500 mb height field. Mon. Weather Rev. 1981, 109, 2080–2092. [Google Scholar] [CrossRef]
- Kumar, K.; Rajagopalan, B.; Cane, M. On the weakening relationship between the Indian monsoon and ENSO. Science 1999, 284, 2156–2159. [Google Scholar] [CrossRef] [PubMed]
- Hu, Z.; Latif, M.; Roeckner, E.; Bengtsson, L. Intensified Asian summer monsoon and its variability in a coupled model forced by increasing greenhouse gas concentrations. Geophys. Res. Lett. 2000, 27, 2681–2684. [Google Scholar] [CrossRef]
- Chang, C.; Harr, P.; Ju, J. Possible roles of Atlantic circulations on the weakening Indian monsoon rainfall–ENSO relationship. J. Clim. 2001, 14, 2376–2380. [Google Scholar] [CrossRef]
- Lin, H. Global extratropical response to diabatic heating variability of the Asian summer monsoon. J. Atmos. Sci. 2009, 66, 2697–2713. [Google Scholar] [CrossRef]
- Lin, H.; Wu, Z. Indian summer monsoon influence on the climate in the North Atlantic—European region. Clim. Dyn. 2012, 39, 303–311. [Google Scholar] [CrossRef]
- Gill, A. Some simple solutions for heat-induced tropical circulation. Q. J. R. Meteorol. Soc. 1980, 106, 447–462. [Google Scholar] [CrossRef]
- Cherchi, A.; Annamalai, H.; Masina, S.; Navarra, A. South Asian summer monsoon and the eastern Mediterranean climate: The monsoon—Desert mechanism in CMIP5 simulations. J. Clim. 2014, 27, 6877–6903. [Google Scholar] [CrossRef]
- Lavaysse, C.; Flamant, C.; Janicot, S.; Parker, D.; Lafore, J.; Sultan, B.; Pelon, J. Seasonal evolution of the West African heat low: a climatological perspective. Clim. Dyn. 2009, 33, 313–330. [Google Scholar] [CrossRef]
- Hoskins, B.; Yang, G. The equatorial response to higher-latitude forcing. J. Atmos. Sci. 2000, 57, 1197–1213. [Google Scholar] [CrossRef]
- Lin, H.; Derome, J.; Brunet, G. The nonlinear transient atmospheric response to tropical forcing. J. Clim. 2007, 20, 5642–5665. [Google Scholar] [CrossRef]
- Krishnamurthy, L.; Krishnamurthy, V. Teleconnections of AMO and Atlantic Tripole with the Indian Monsoon Rainfall; Center of Ocean-Land-Atmosphere Studies: Fairfax, VA, USA, 2013. [Google Scholar]
- Srivastava, A.; Rajeevan, M.; Kulkarni, R. Teleconnection of OLR and SST anomalies over Atlantic Ocean with Indian summer monsoon. Geophys. Res. Lett. 2002, 29, 1284. [Google Scholar] [CrossRef]
- Goswami, B.; Madhusoodanan, M.; Neema, C.; Sengupta, D. A physical mechanism for North Atlantic SST influence on the Indian summer monsoon. Geophys. Res. Lett. 2006, 33. [Google Scholar] [CrossRef]
- Tyrlis, E.; Lelieveld, J. Climatology and Dynamics of the Summer Etesian Winds over the Eastern Mediterranean. J. Atmos. Sci. 2013, 70, 3374–3396. [Google Scholar] [CrossRef]
- Liebmann, B.; Hartmann, D. An observational study of tropical—Midlatitude interaction on intraseasonal time scales during winter. J. Atmos. Sci. 1984, 41, 3333–3350. [Google Scholar] [CrossRef]
- Krishnamurti, T.; Bedi, H.; Subramaniam, M. The summer monsoon of 1987. J. Clim. 1989, 2, 321–340. [Google Scholar] [CrossRef]
Figure 1.
Mean seasonal values (June-September) of vertical velocity (Pa/s) at 850 hPa (a), 500 hPa (b) and 200 hPa (c) respectively for the years 1958–2001. Red color denotes descending motion, whereas blue color denotes ascending motion.
Figure 1.
Mean seasonal values (June-September) of vertical velocity (Pa/s) at 850 hPa (a), 500 hPa (b) and 200 hPa (c) respectively for the years 1958–2001. Red color denotes descending motion, whereas blue color denotes ascending motion.

Figure 2.
(a) Spatial distribution of loadings of the first principal component (PC) of vertical velocity at 500 hPa (PC1—9.5% of total variance). Isopleths of positive loadings are depicted with continuous lines and isopleths of negative loadings with dotted lines. For illustration purposes, only isopleths corresponding to loadings over 0.4 are plotted. Absolute values of correlation coefficients greater than 0.2 are statistically significant at the 95% confidence level. (b) Anomalies of vertical velocity at 500 hPa (500) in Pa/s for the months representing the negative phase of PC1 (see text). (c) Monthly time series of PC1 and standardized All India Rainfall Index (AIRI) for the June-September (JJAS) period of the years 1958–2001.

Figure 3.
As in Figure 2, but for the first PC of vertical velocity at 200 hPa (200, PC1—8.9% of total variance).
Figure 3.
As in Figure 2, but for the first PC of vertical velocity at 200 hPa (200, PC1—8.9% of total variance).
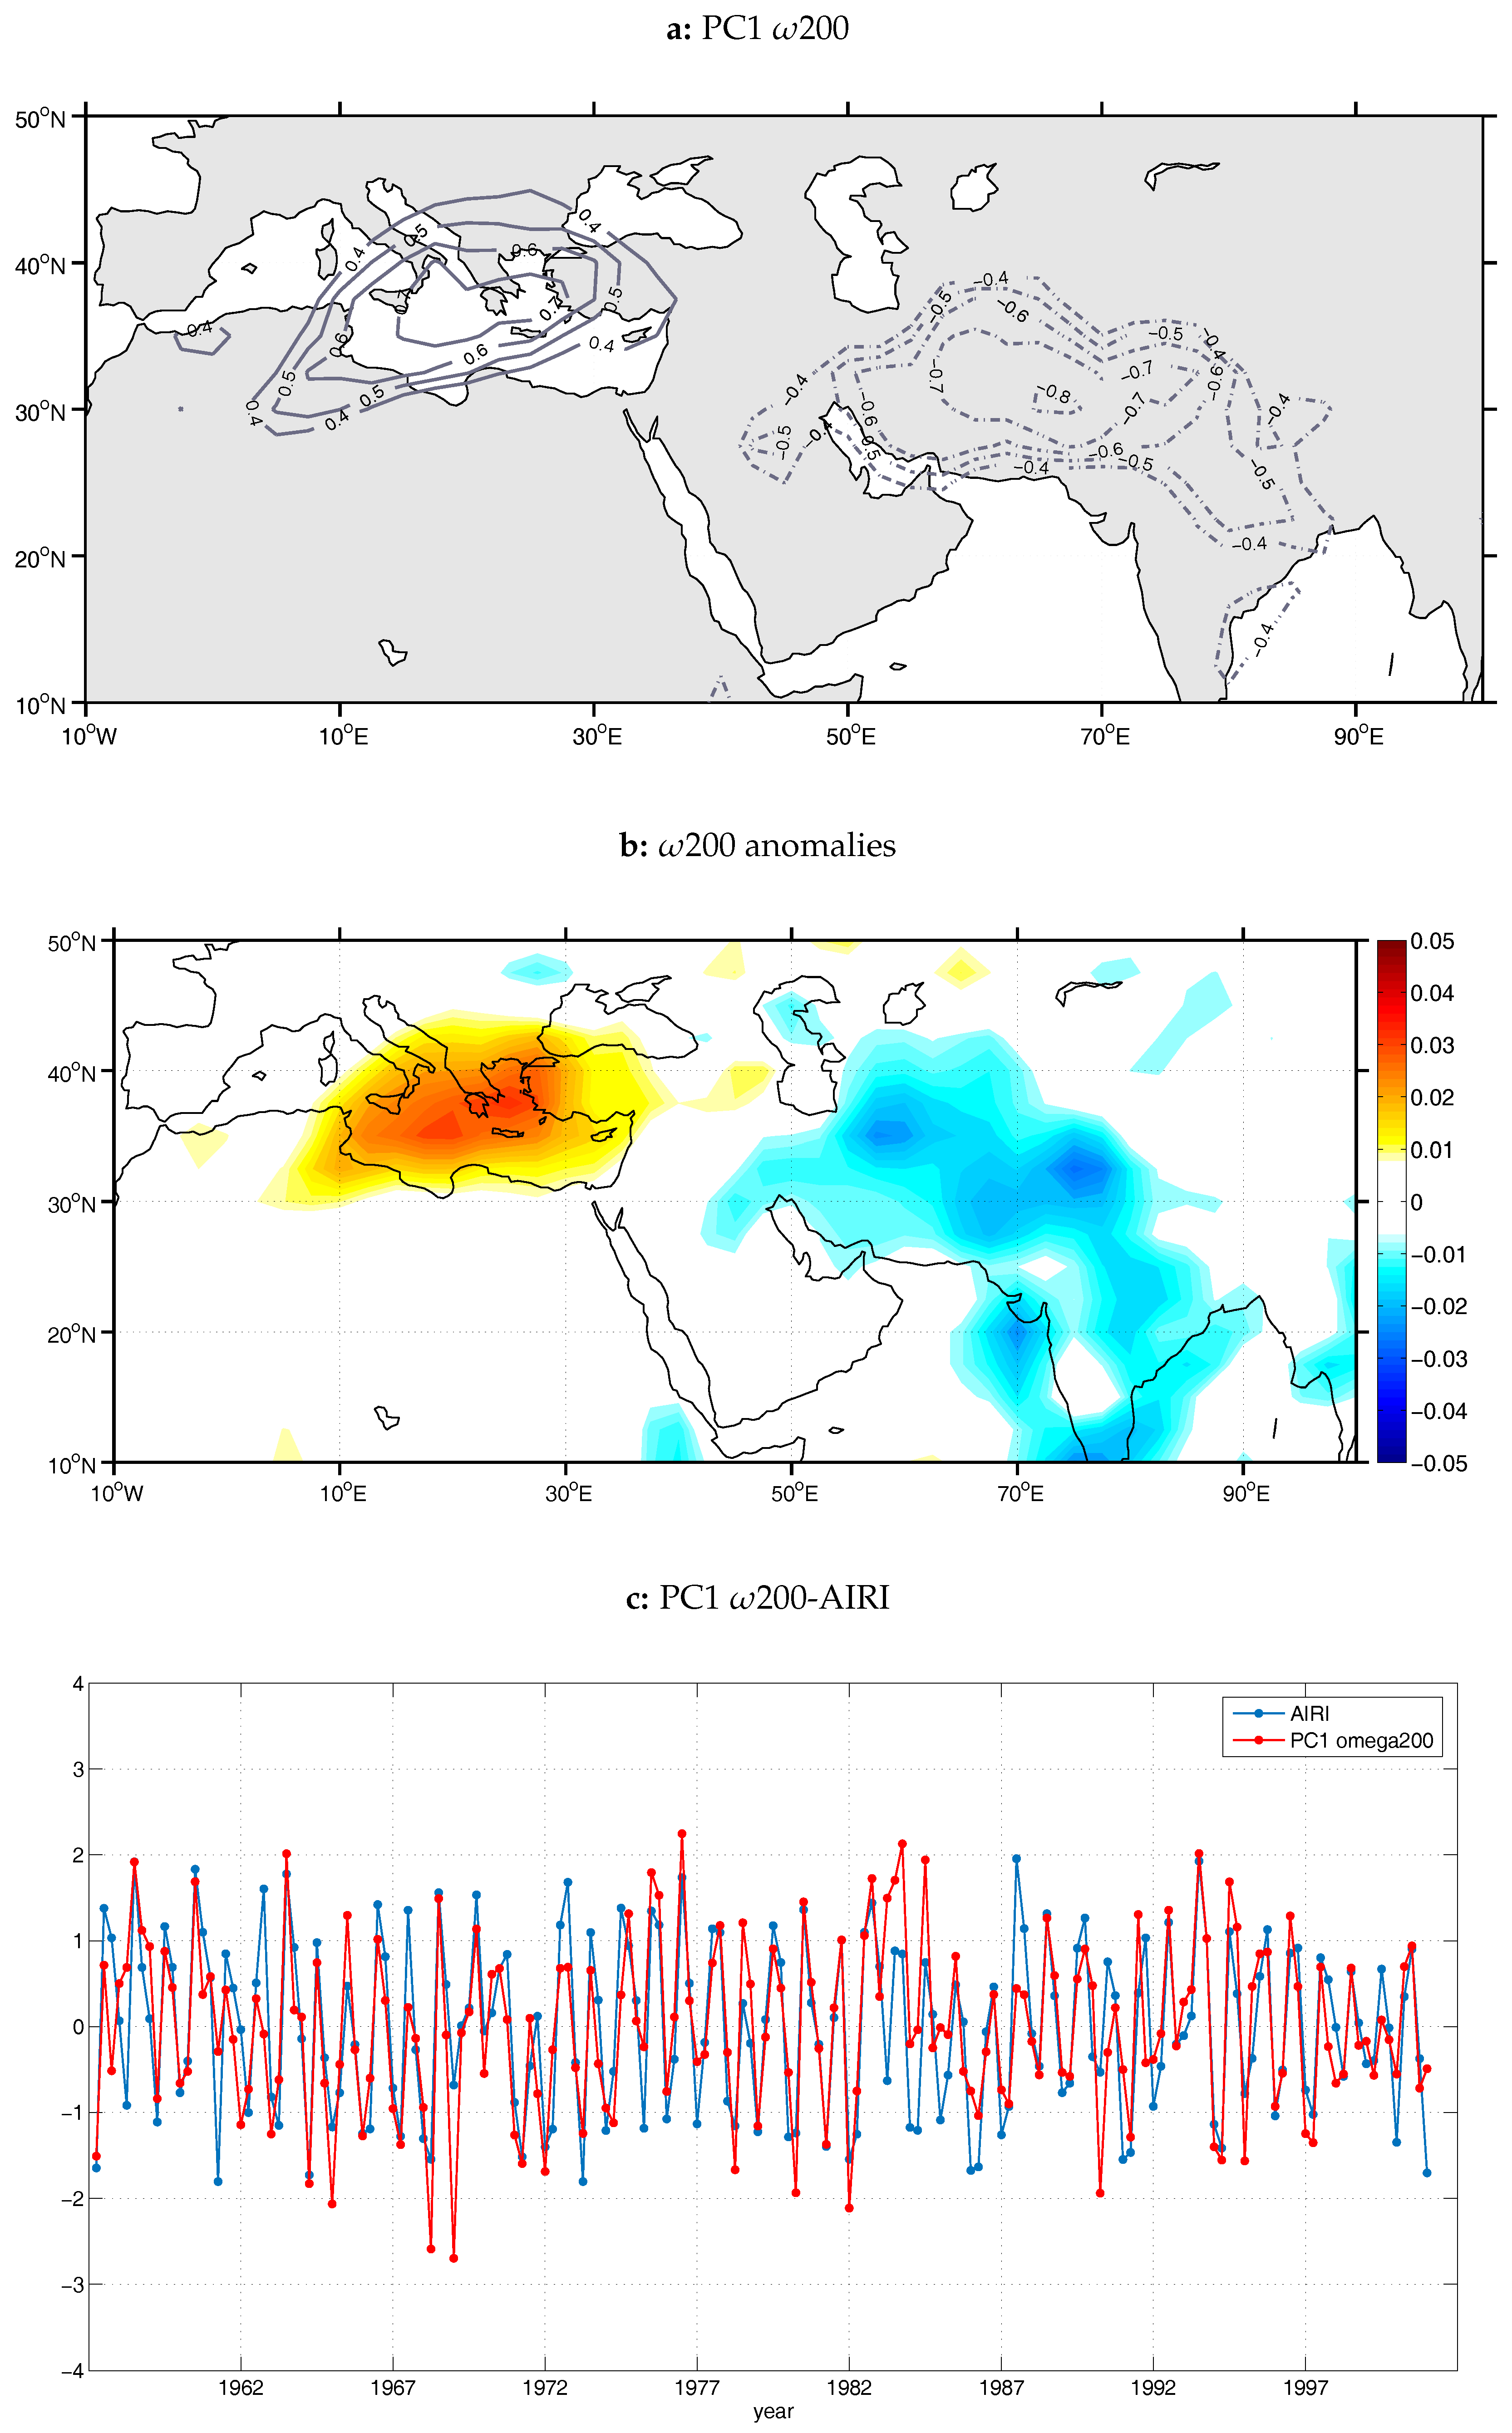
Figure 4.
Mean seasonal values (JJAS) of geopotential height at 200 hPa (Z200, in m).short for lof

Figure 5.
The second (a; PC2—22.6% of total variance) and third (b; PC3—21.7% of total variance) PC spatial patterns of Z200 (blue color isolines) and mean state of large-scale background mean zonal flow at 200 hPa (in m/s) during the positive phase of PC2 and the negative phase of PC3 respectively. Dark gray filled contours correspond to zonal wind speeds with values greater than 15 m/s (westerlies) and light gray filled contours to negative values (easterlies) respectively. The clarifications regarding the loading isopleths in Figure 2 apply here too. (c) Monthly time series of PC2 and PC1 along with standardized AIRI for the JJAS period of the years 1958–2001.
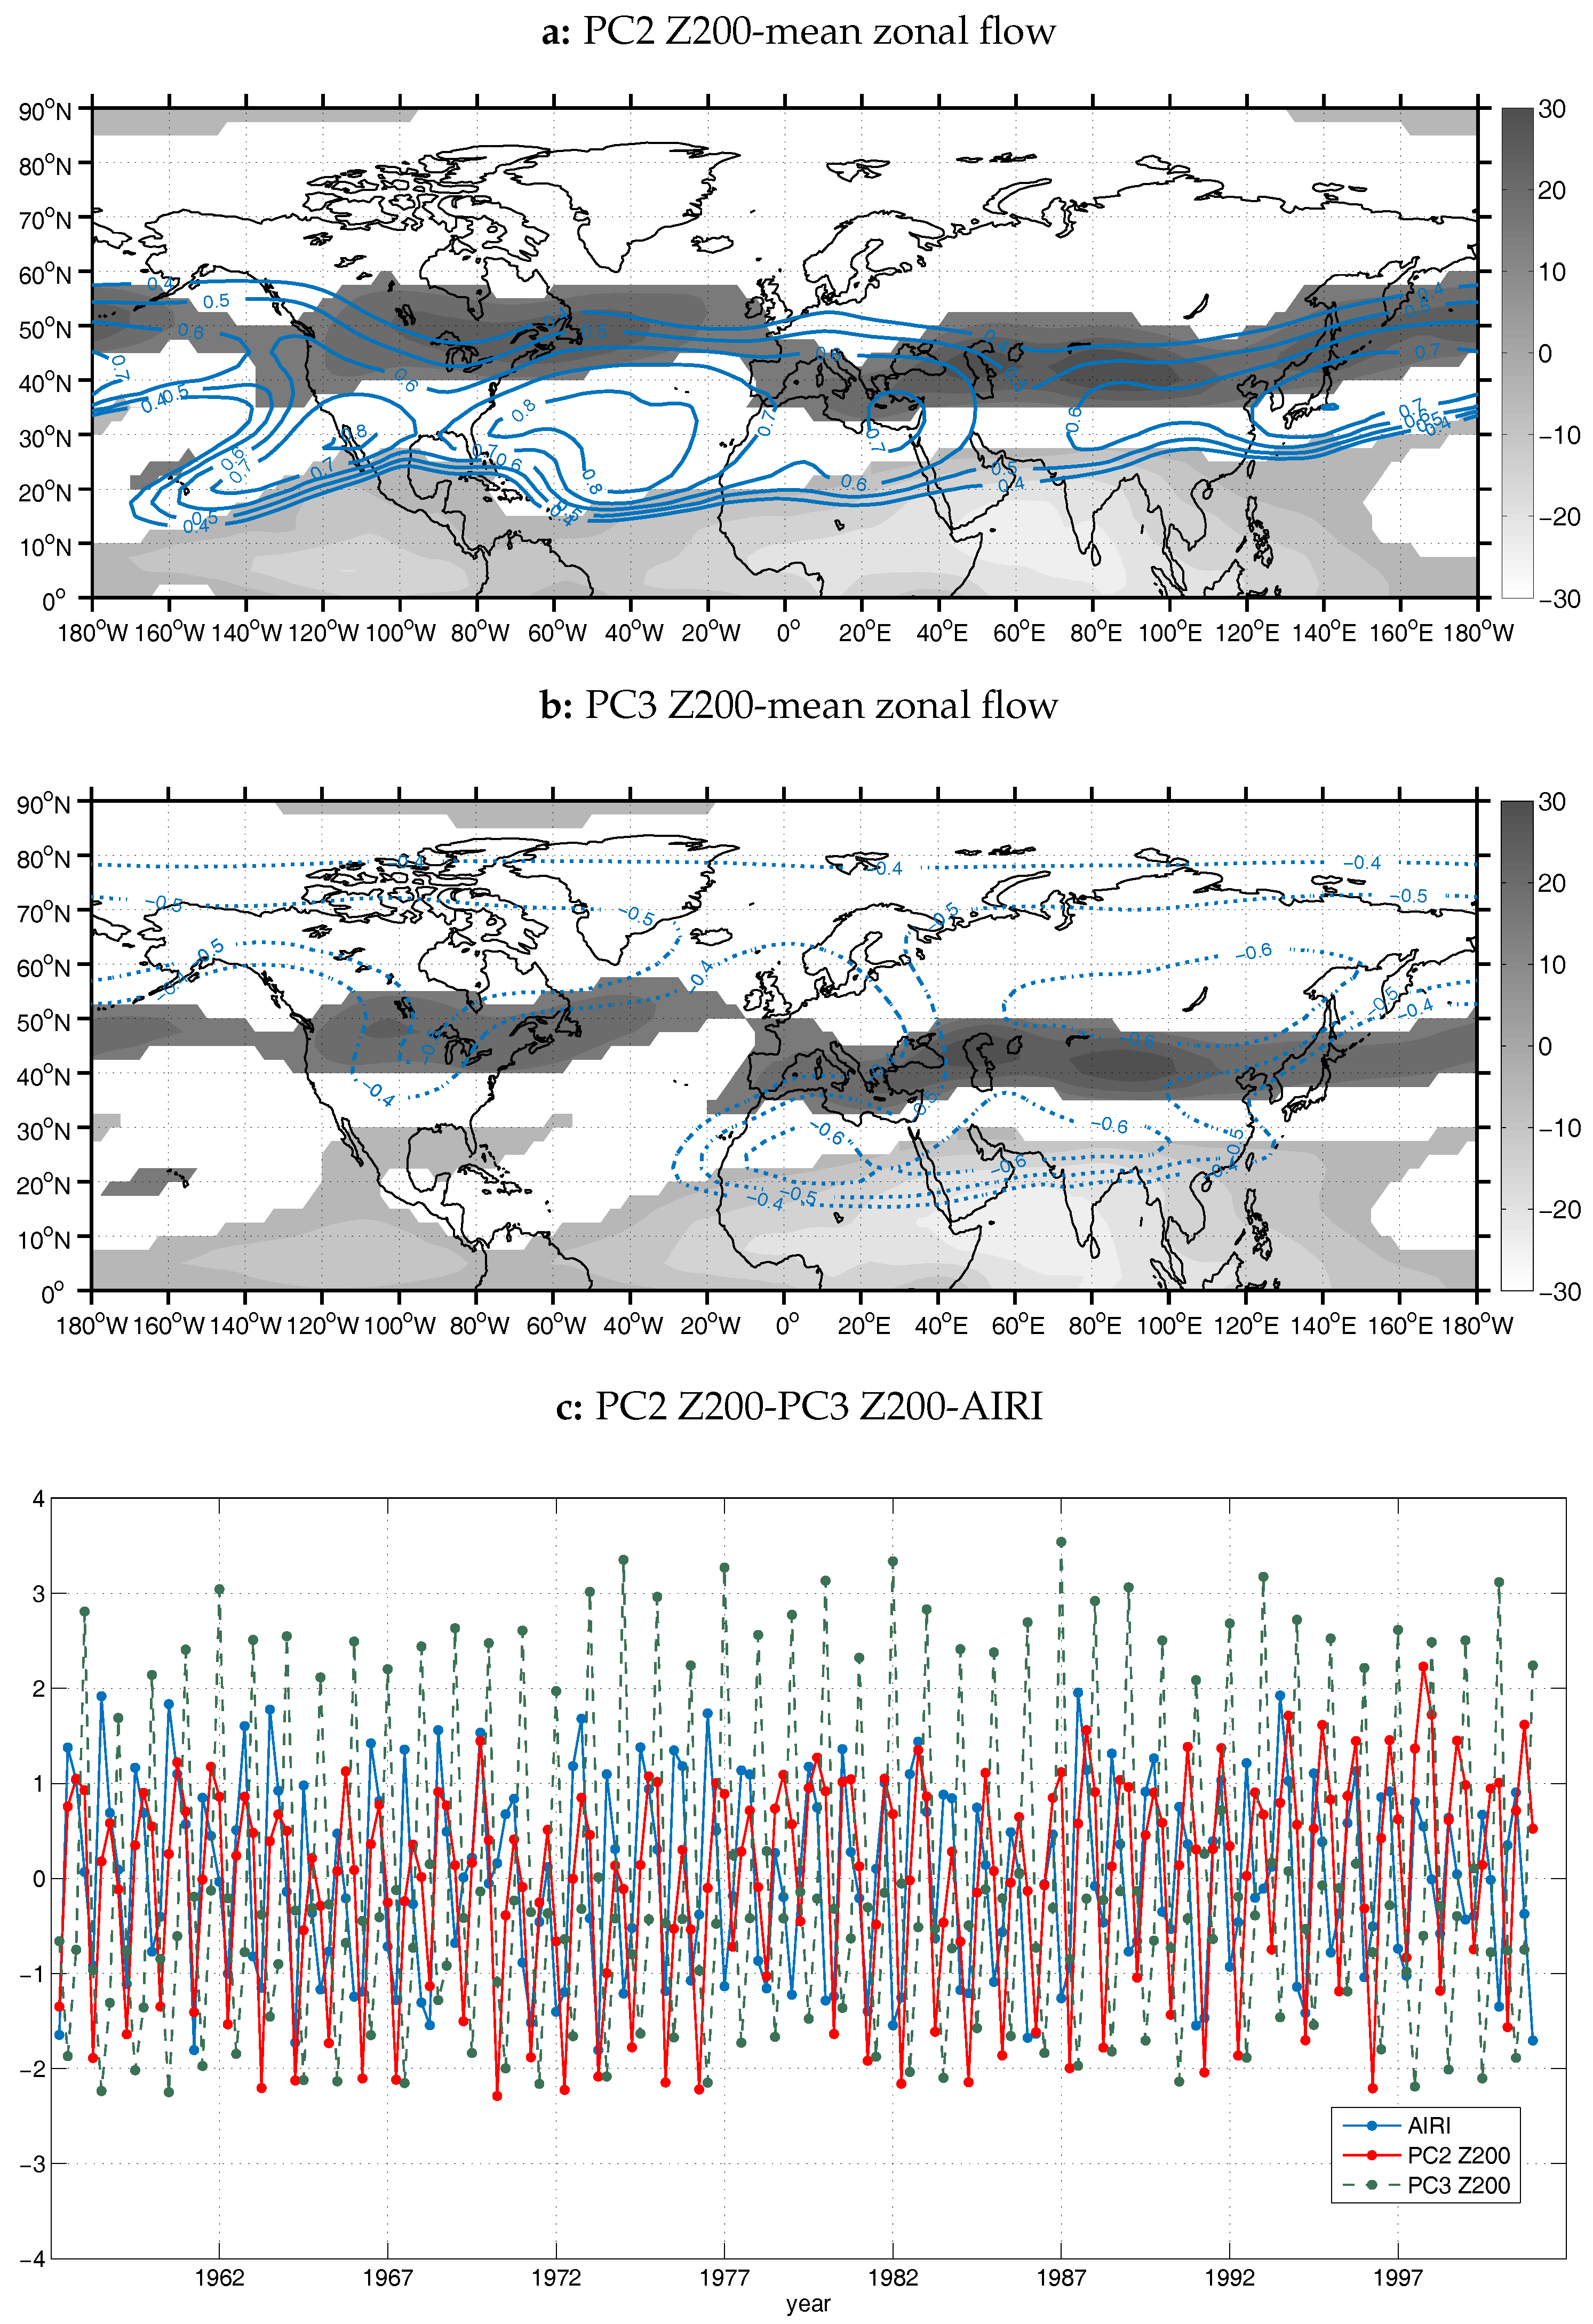
Figure 6.
(a) JJAS climate of low-level atmospheric thickness (LLAT, in m) between the pressure levels of 700 hPa and 925 hPa at 0600 UTC, for years 1958–2001. (b) LLAT anomalies (in m) for the months representing the negative phase of PC3 for the Z200 field.
Figure 6.
(a) JJAS climate of low-level atmospheric thickness (LLAT, in m) between the pressure levels of 700 hPa and 925 hPa at 0600 UTC, for years 1958–2001. (b) LLAT anomalies (in m) for the months representing the negative phase of PC3 for the Z200 field.

Figure 7.
(a) The first PC spatial pattern for zonal wind speed field at 200 hPa (U200, PC1—34% of total variance). The PC spatial pattern (blue color isolines) is plotted on top of the mean state of the large-scale zonal flow at 200 hPa during the negative phase of PC1 (gray filled contours, in m/s). The clarifications regarding the loading isopleths in Figure 2 apply here too. (b) Monthly time series of PC1 along with standardized AIRI for the JJAS period of the years 1958–2001.
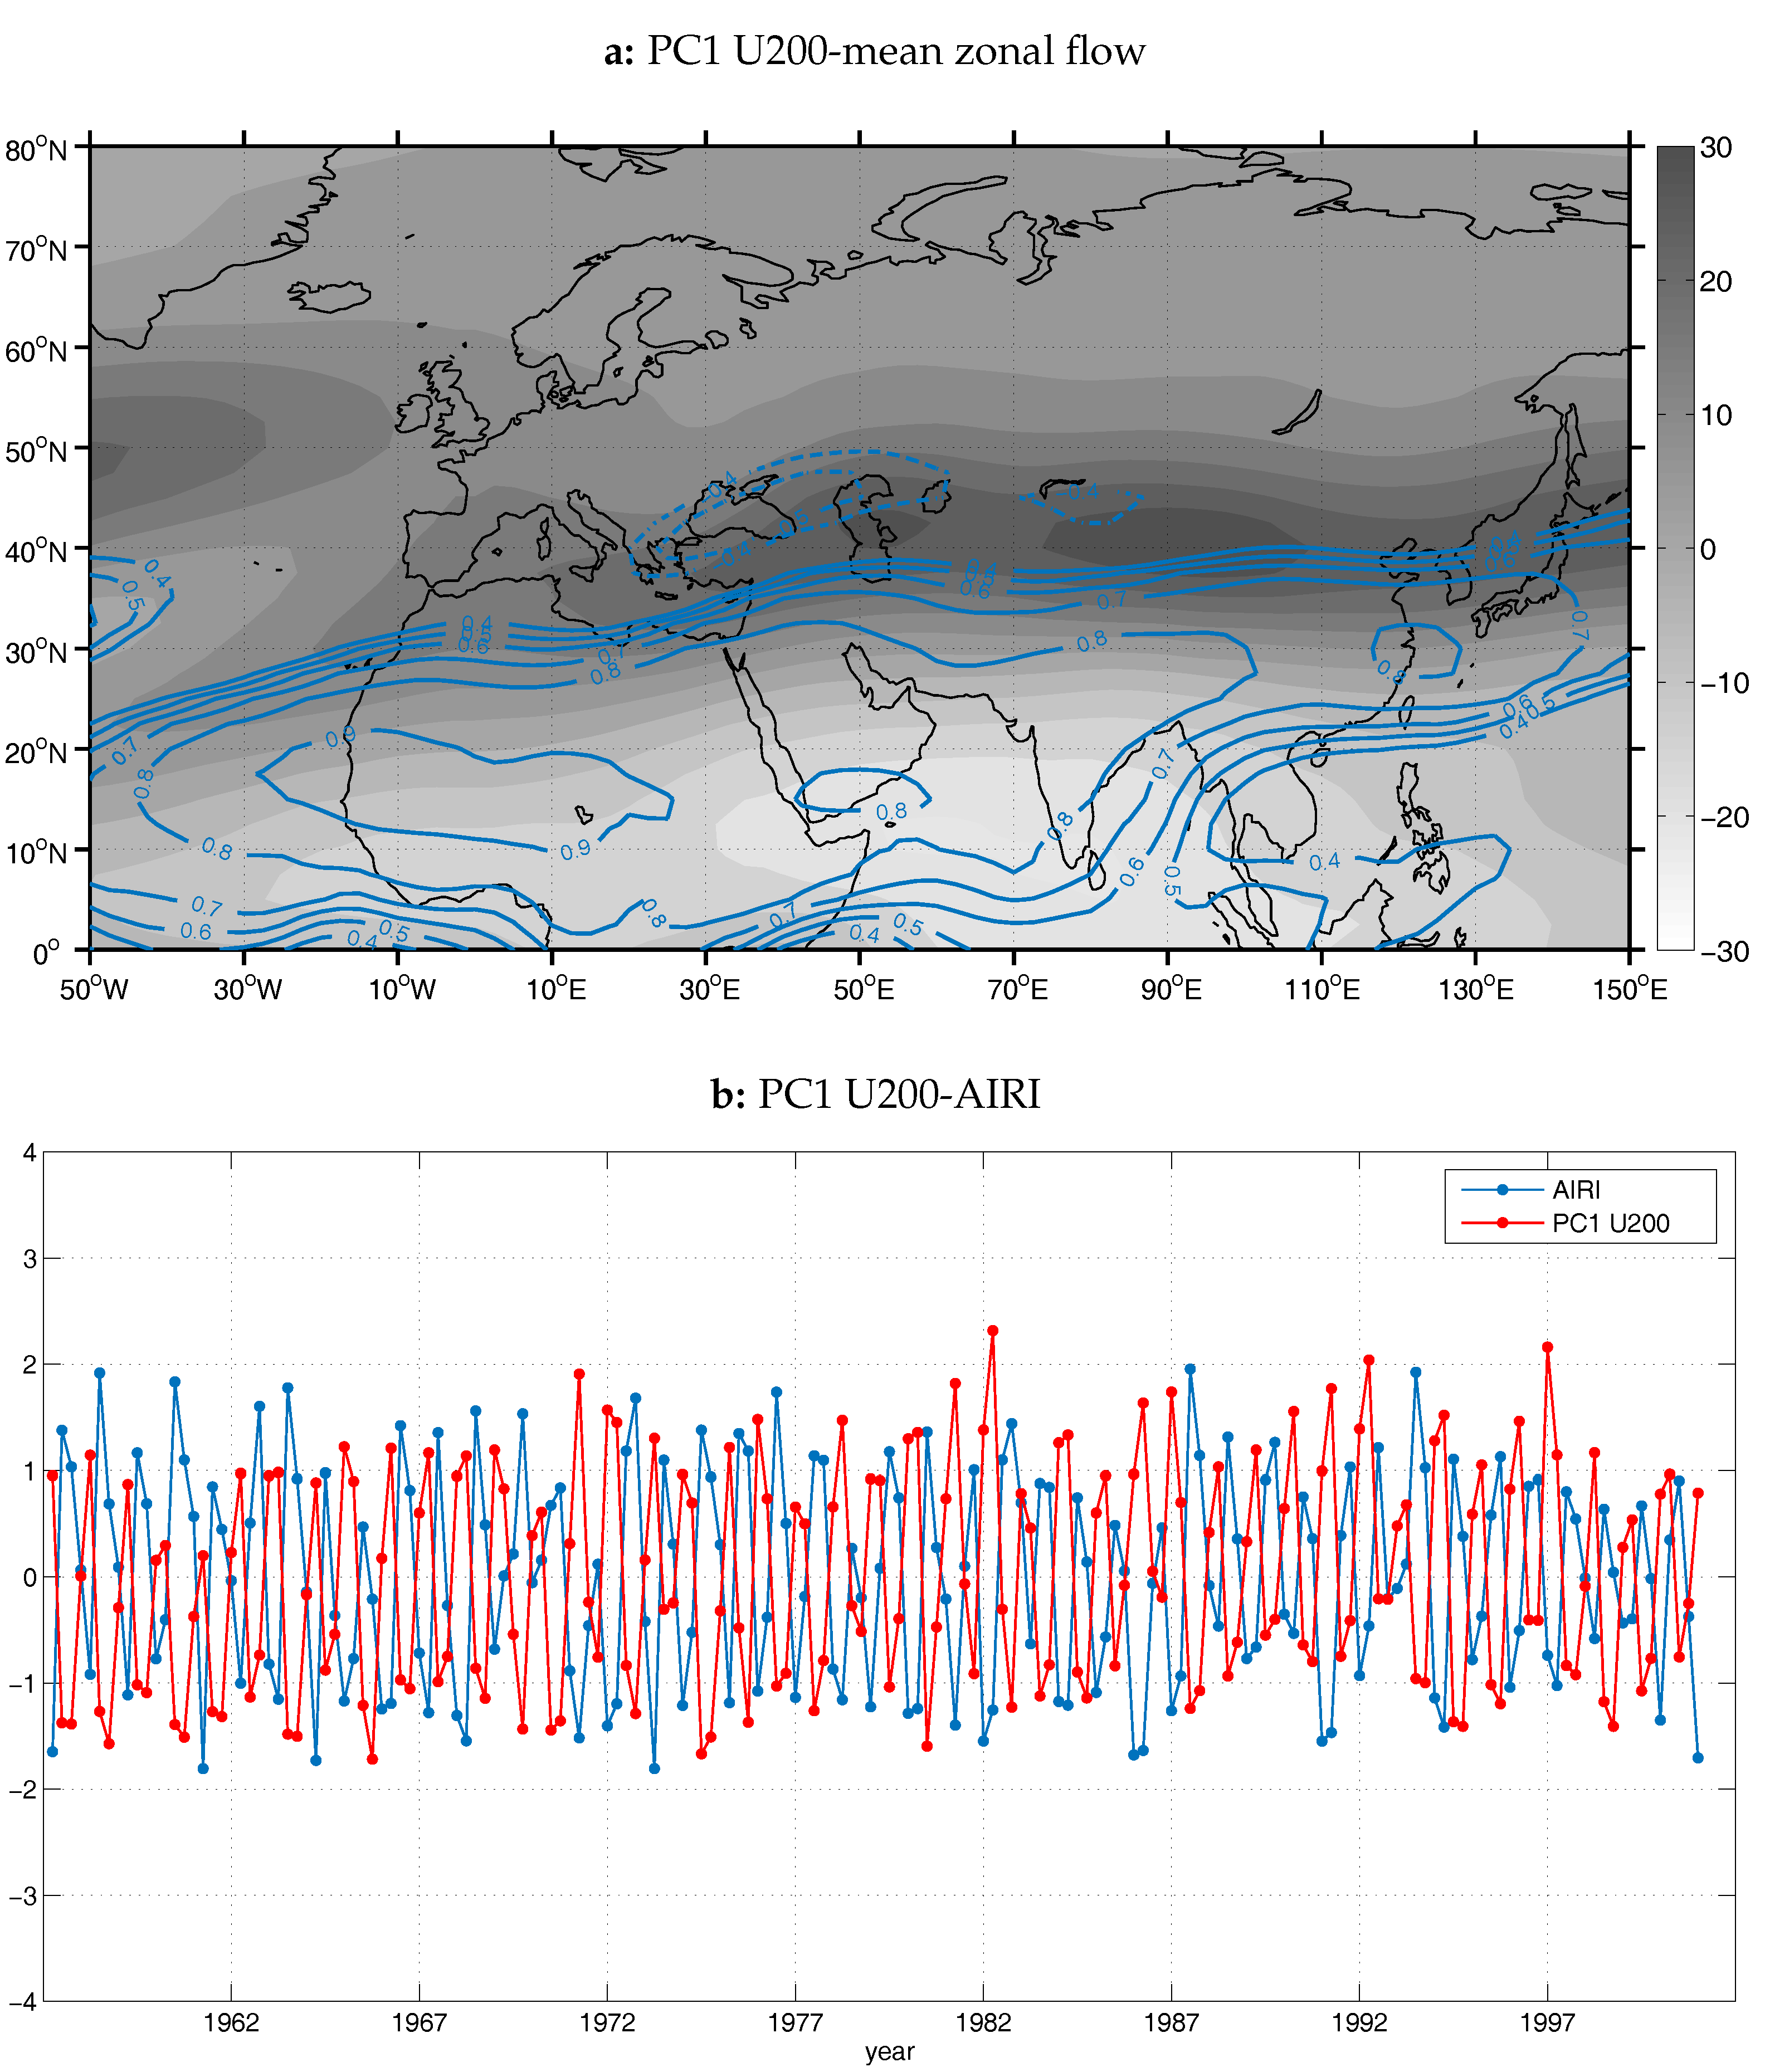
Figure 8.
The spatial pattern of the first PC (a; PC1—8% of total variance) for the field of meridional wind component at 200 hPa (V200, blue color isolines) and mean state of large-scale background mean zonal flow at 200 hPa (in m/s) during the negative phase of PC1. Dark gray filled contours correspond to zonal wind speeds with values greater than 15 m/s (westerlies) and light gray filled contours to negative values (easterlies) respectively. The clarifications regarding the loading isopleths in Figure 2 apply here too. (b) Monthly time series of PC1 along with standardized AIRI for the JJAS period of the years 1958–2001.short for lof
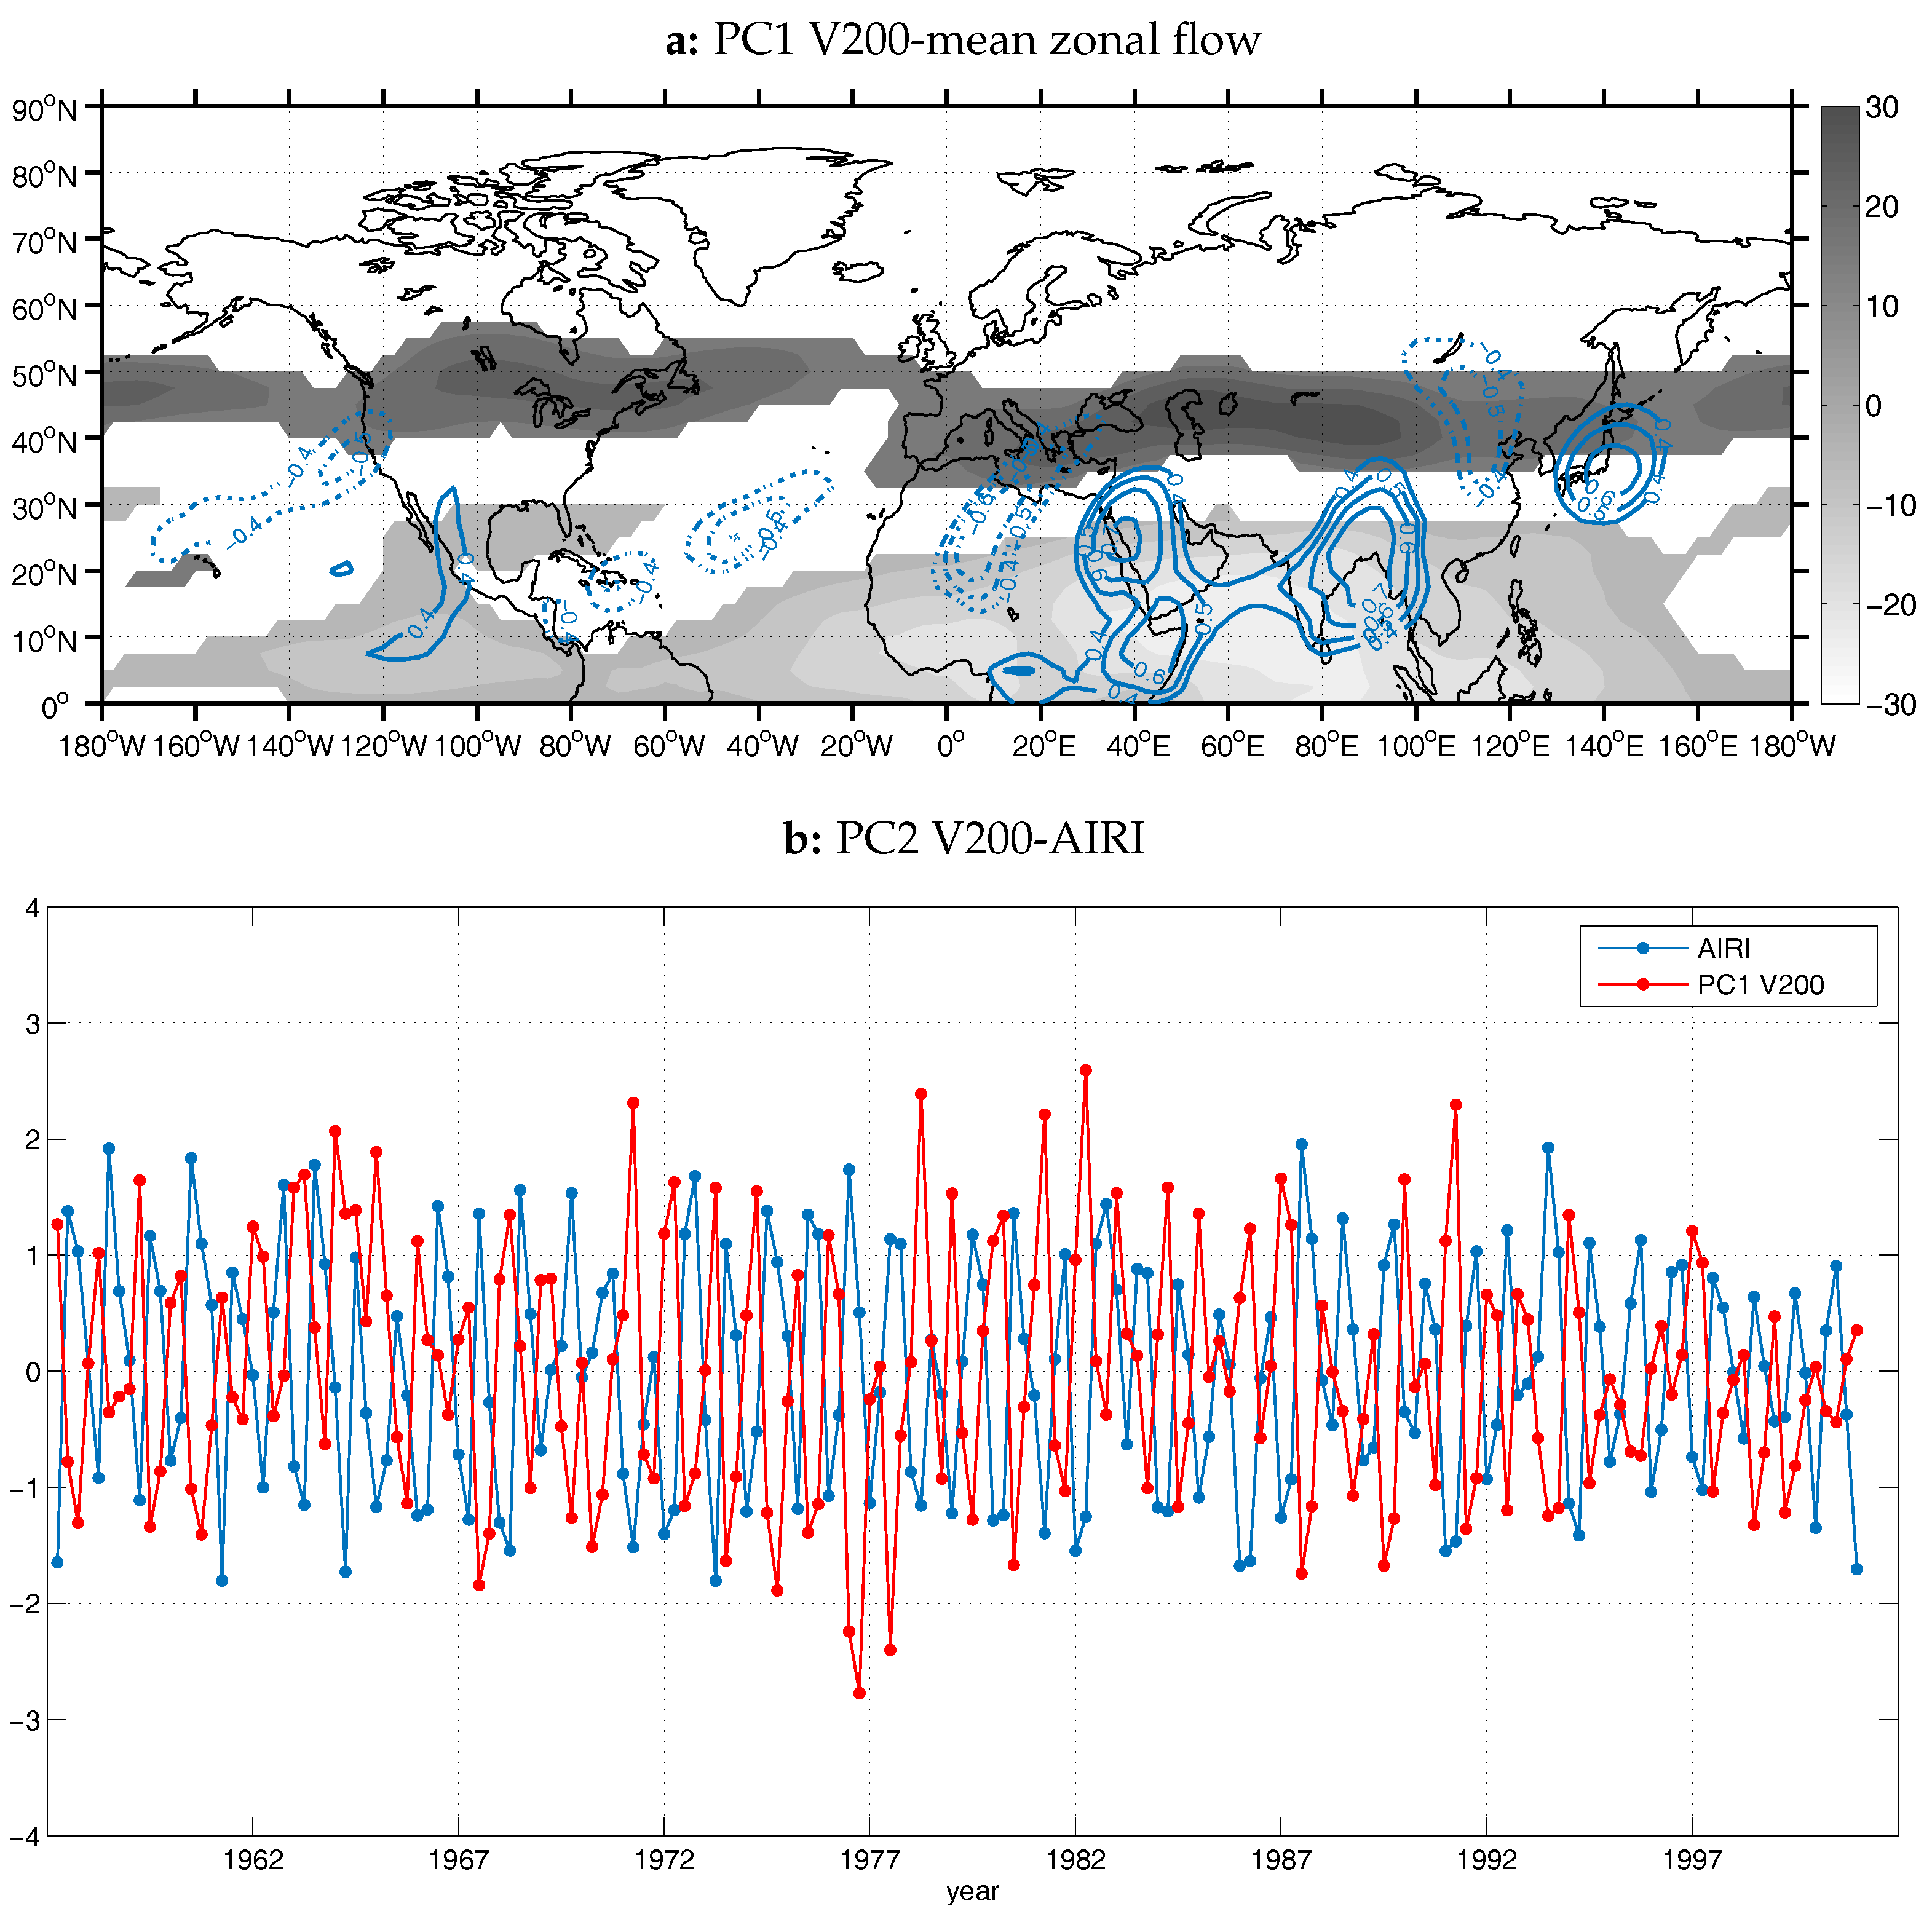
Figure 9.
As in Figure 5a,b, but for the first PC of Z200 after the removal of its mean zonal state (PC1—17.8% of total variance; correlation coefficient with AIRI r = 0.77). The clarifications regarding the loading isopleths in Figure 2 apply here too.
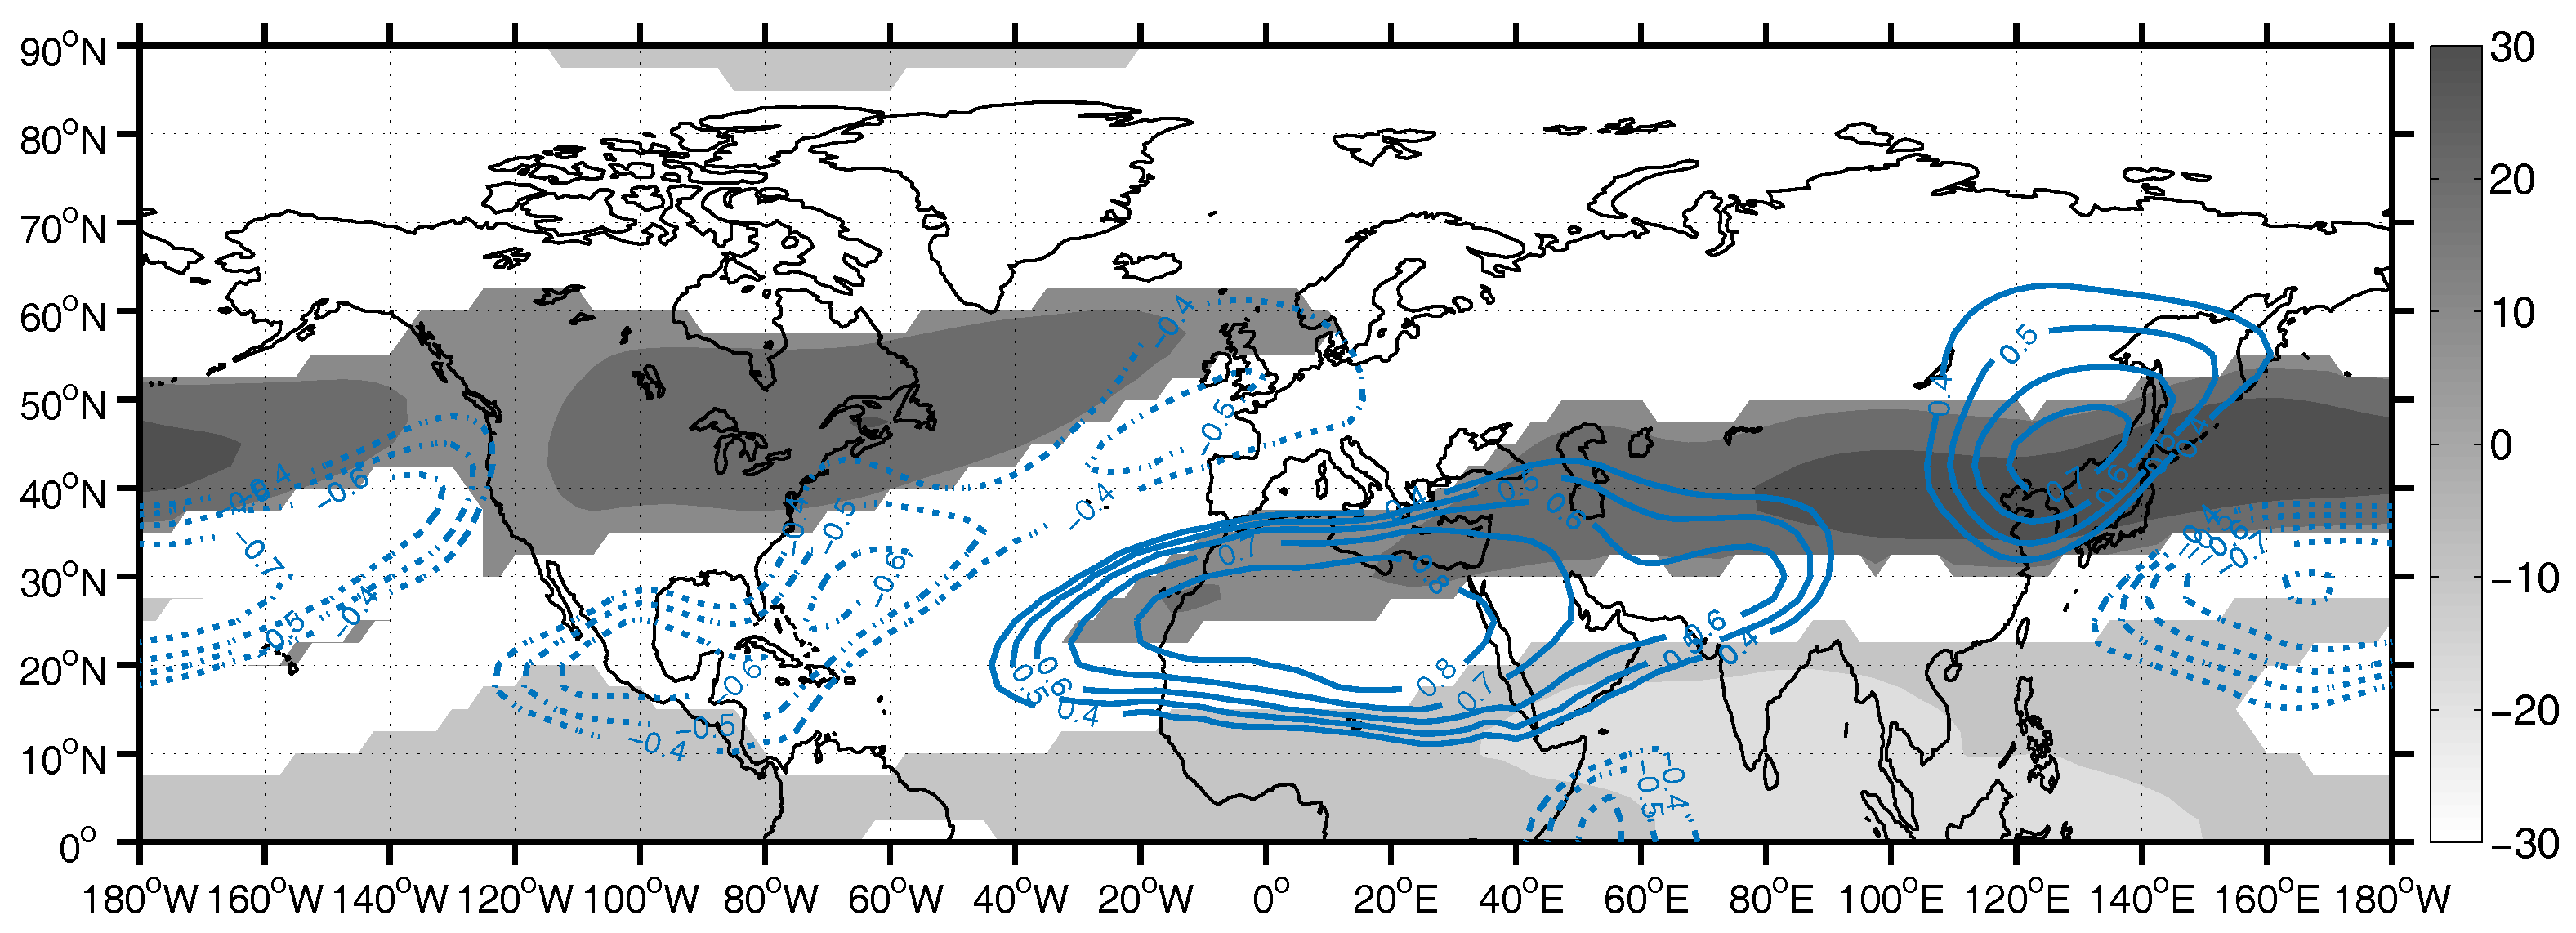
Figure 10.
Mean seasonal values (JJAS) of geopotential height (Z850, in m) (a), meridional wind component (V850, in m/s) (b) and zonal wind component (U850, in m/s) at 850 hPa (c). Blue (red) color denotes northerly (southerly) winds in the case of the climatology of the meridional wind component at 850 hPa (b) and westerly (easterly) winds in the case of the zonal wind component climatology (c).
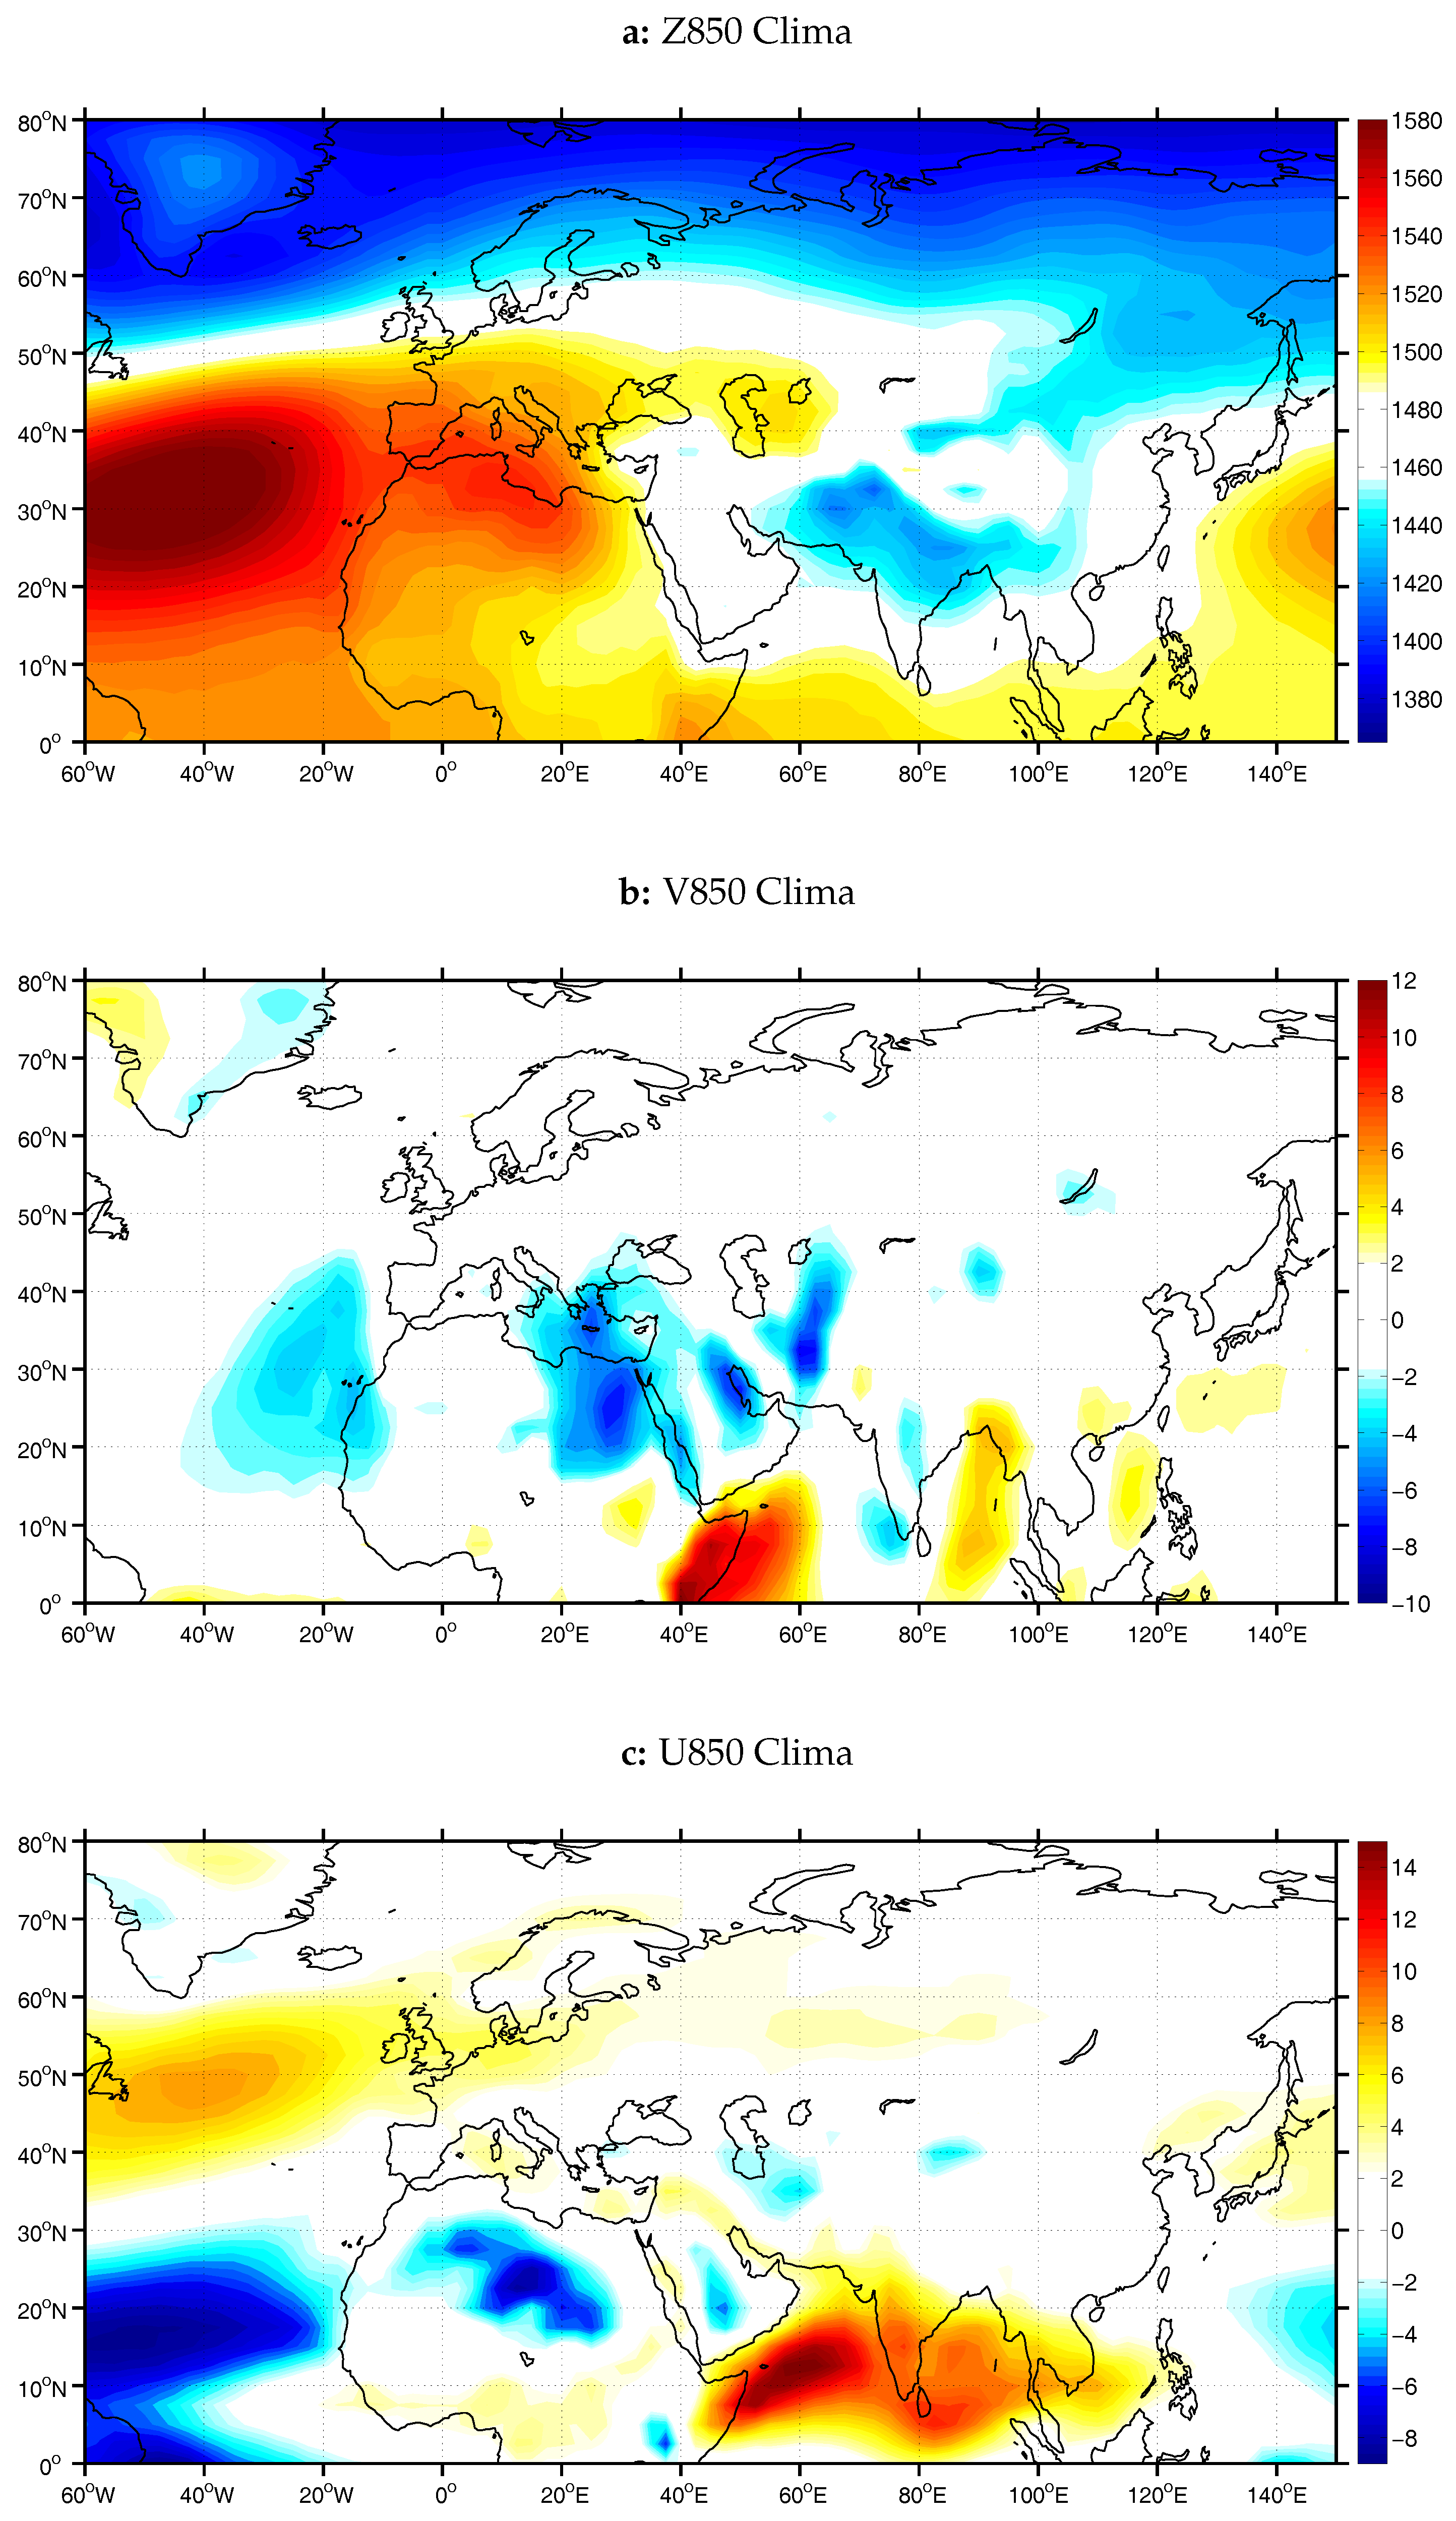
Figure 11.
As in Figure 2a, but for the first PC of V850 (a; PC1—13% of total variance) and U850 respectively (b; PC1—15% of total variance). (c) Monthly time series of the first PCs of V850 and U850 along with standardized AIRI for the JJAS period of the years 1958–2001.
Figure 11.
As in Figure 2a, but for the first PC of V850 (a; PC1—13% of total variance) and U850 respectively (b; PC1—15% of total variance). (c) Monthly time series of the first PCs of V850 and U850 along with standardized AIRI for the JJAS period of the years 1958–2001.

Figure 12.
As in Figure 2a, but for the first (a; PC1—22% of total variance) and fifth PC of Z850 respectively (b; PC5—6% of total variance). (c) Monthly time series of PC1 and PC5 along with standardized AIRI for the JJAS period of the years 1958–2001.
Figure 12.
As in Figure 2a, but for the first (a; PC1—22% of total variance) and fifth PC of Z850 respectively (b; PC5—6% of total variance). (c) Monthly time series of PC1 and PC5 along with standardized AIRI for the JJAS period of the years 1958–2001.
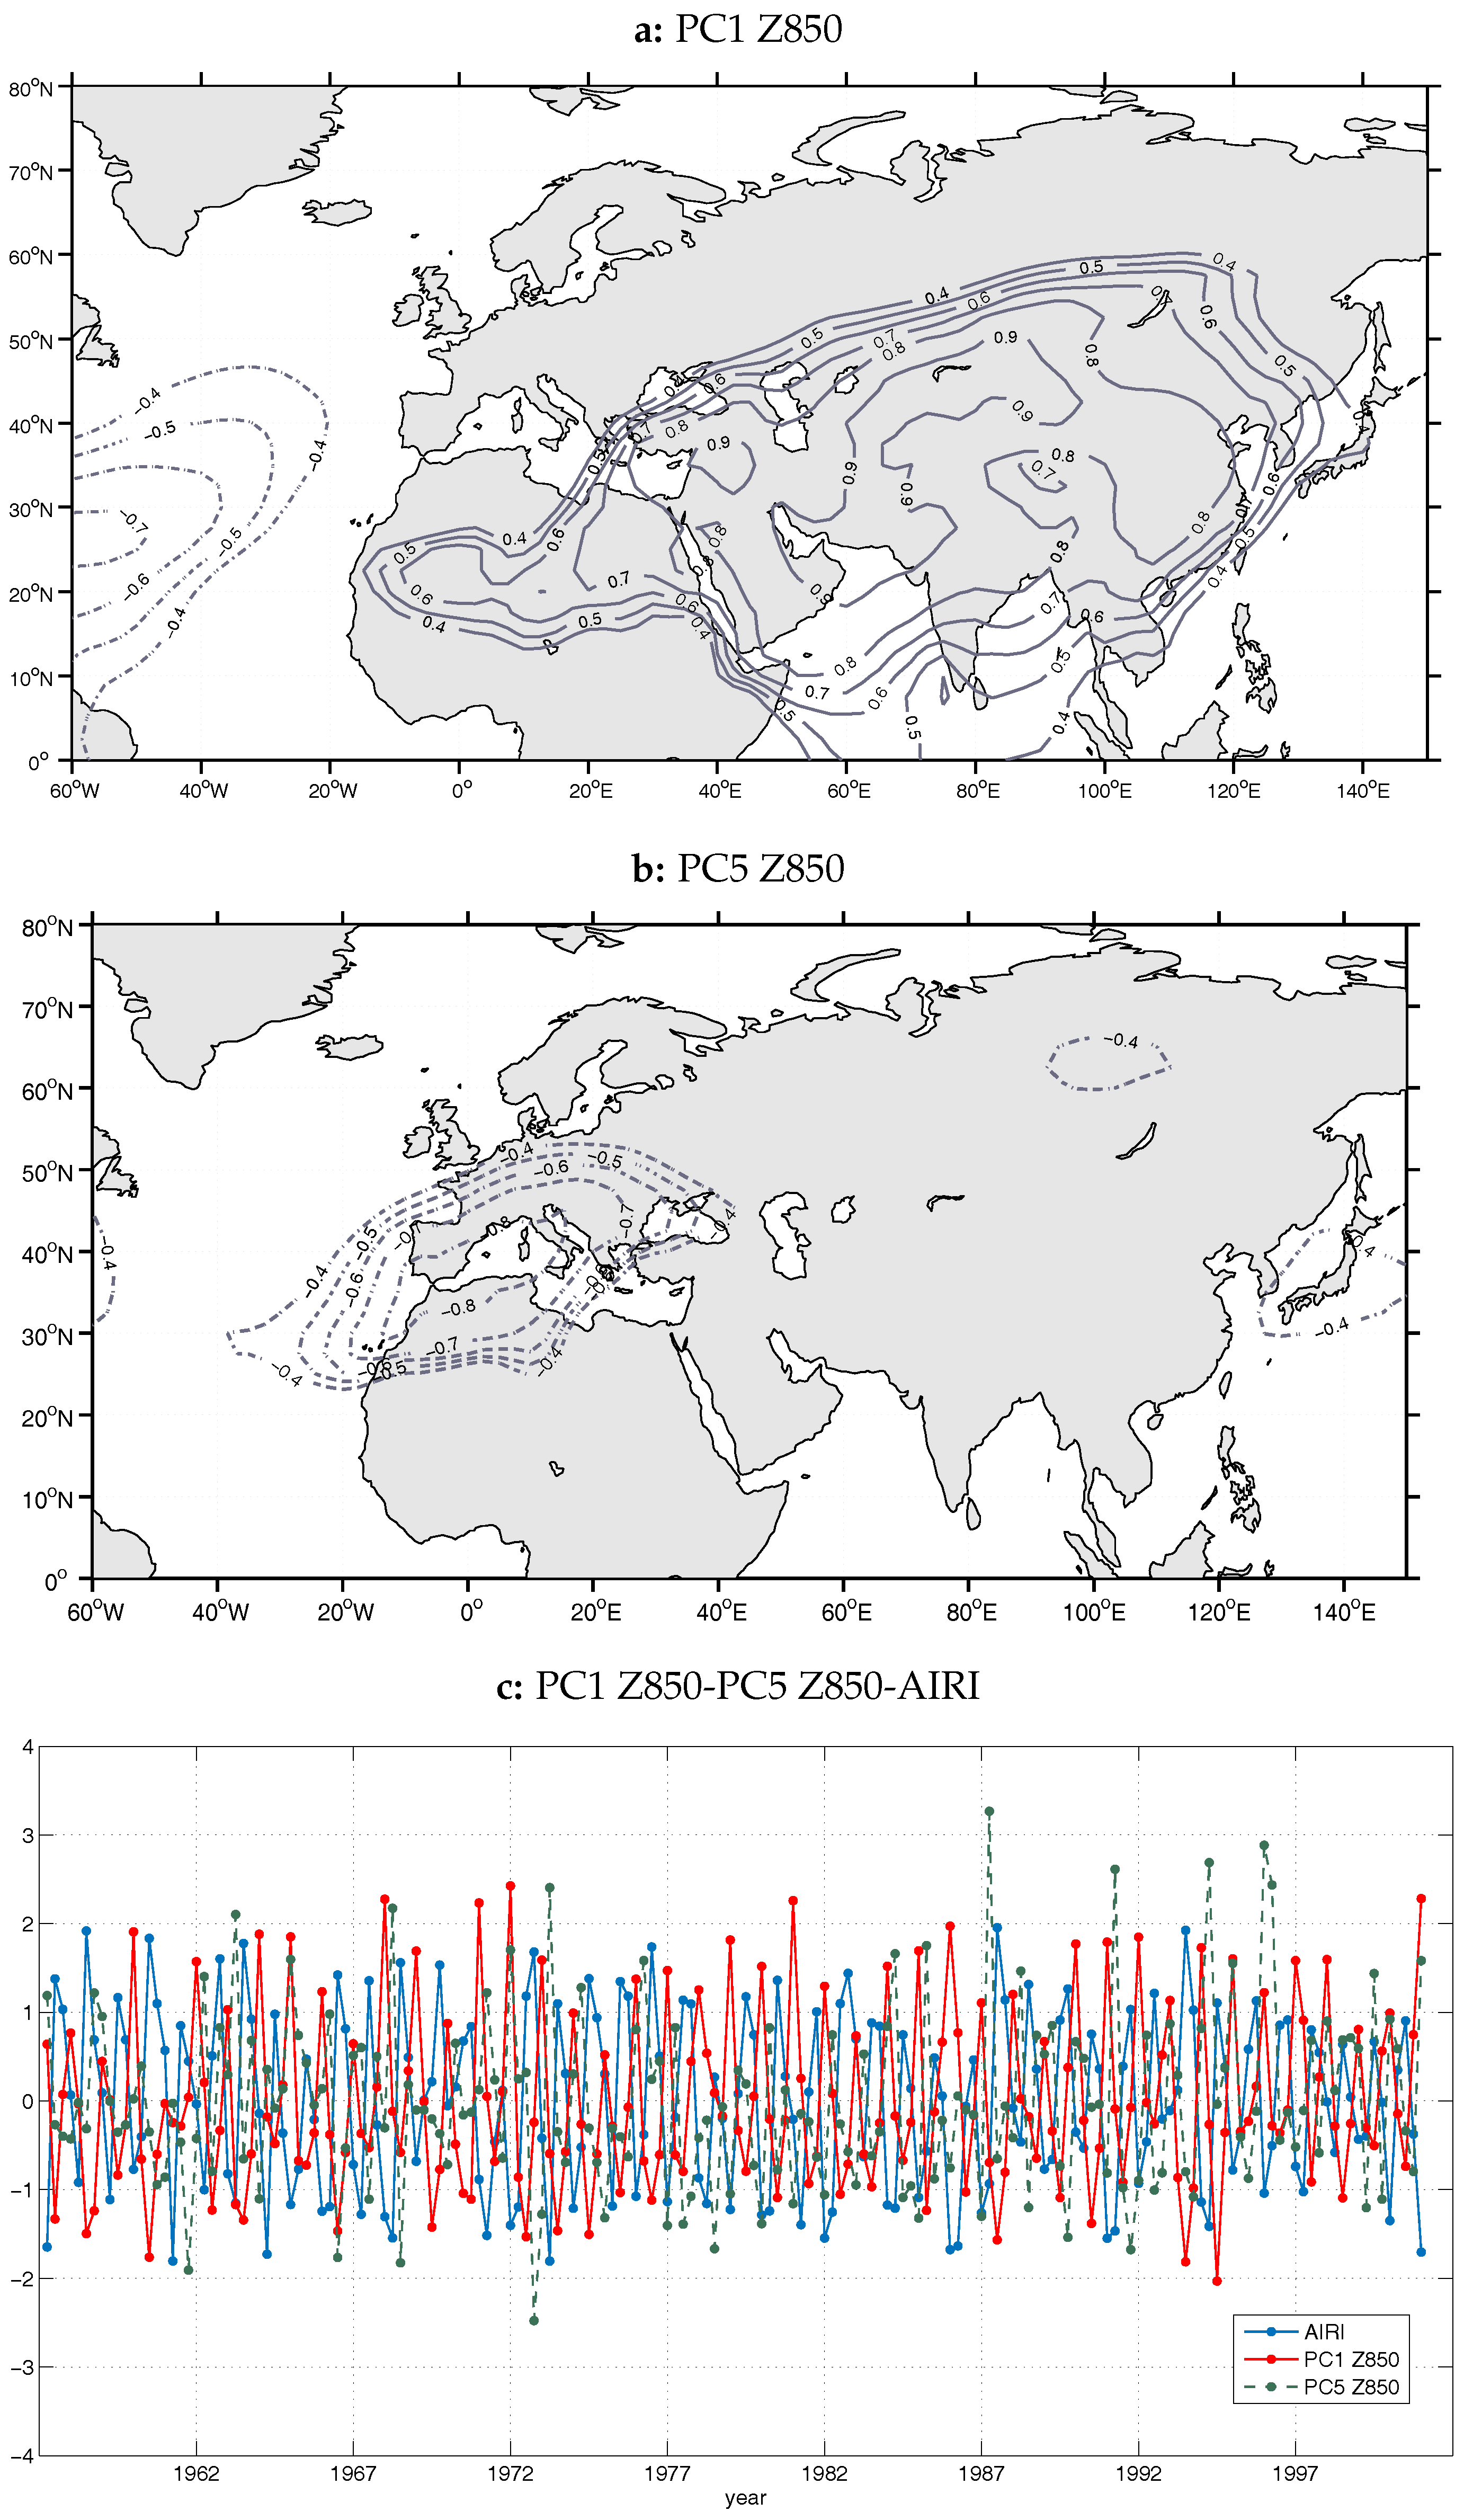
Figure 13.
V850 composite anomalies (m/s) for the months representing the negative phase of the first (a) and fifth (b) PC of Z850 respectively.
Figure 13.
V850 composite anomalies (m/s) for the months representing the negative phase of the first (a) and fifth (b) PC of Z850 respectively.

Figure 14.
Isopleths of correlation between the canonical variates of the first canonical pair and (a) Z200 and (b) TTR time series (canonical correlation = 0.92). Bold isolines correspond to absolute correlation values above 0.3. Dotted isolines correspond to negative correlation coefficient values.
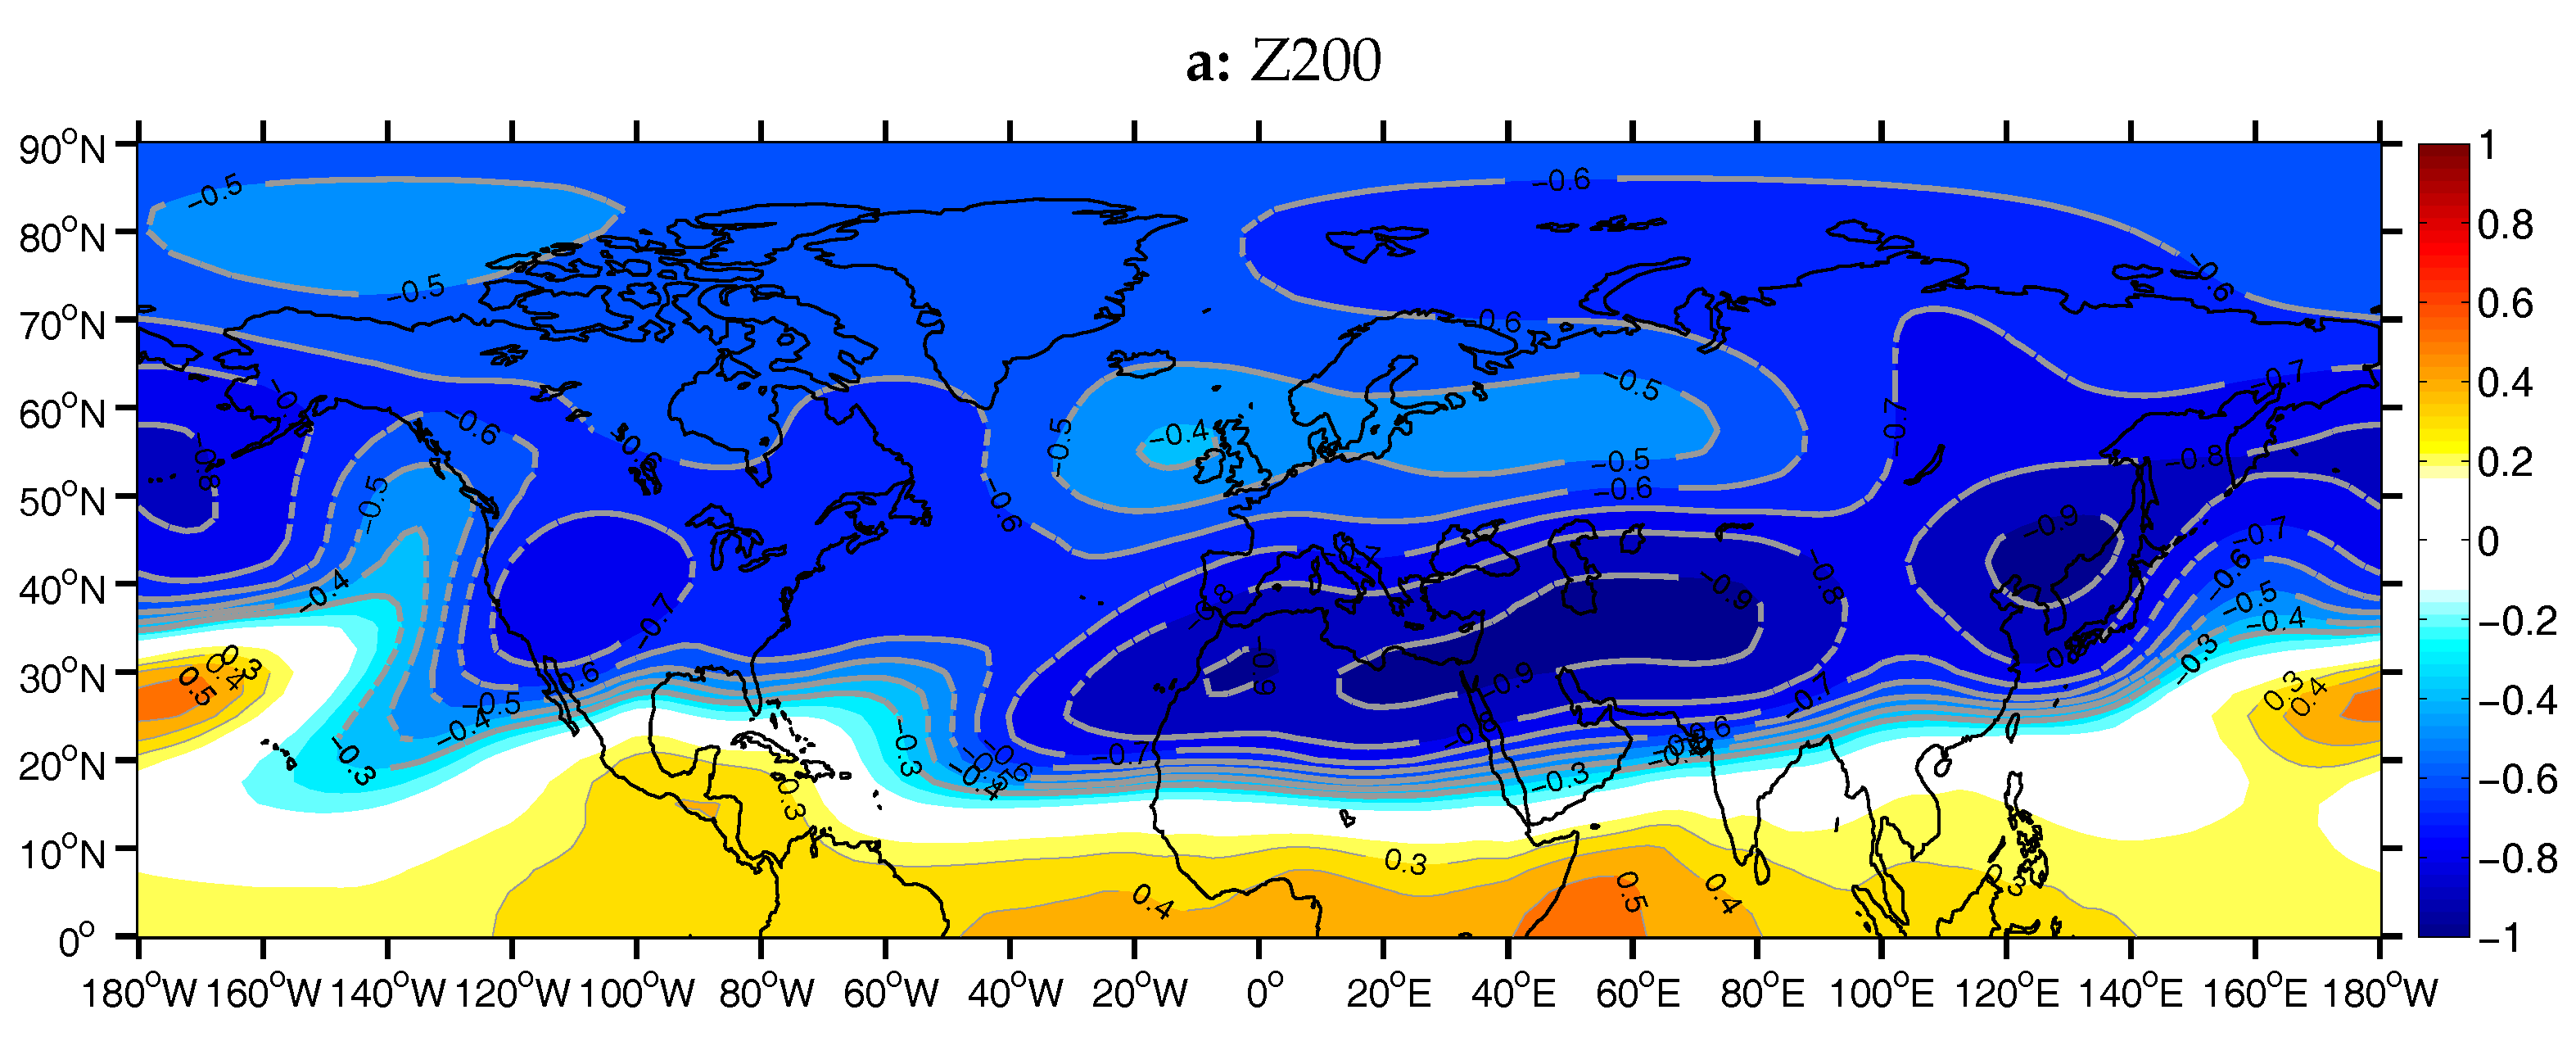

Figure 15.
As in Figure 14a, but for the first canonical pair of V200 (a; canonical correlation = 0.92) and U200 (b; canonical correlation = 0.96).
Figure 15.
As in Figure 14a, but for the first canonical pair of V200 (a; canonical correlation = 0.92) and U200 (b; canonical correlation = 0.96).

Figure 16.
As in Figure 14a, but for the first canonical pair of Z850 over Eurasia (a: canonical correlation = 0.94), of V850 (b: canonical correlation = 0.92), of 500 (c: canonical correlation = 0.89) and of 200 over the Mediterranean respectively (d: canonical correlation = 0.89).
Figure 16.
As in Figure 14a, but for the first canonical pair of Z850 over Eurasia (a: canonical correlation = 0.94), of V850 (b: canonical correlation = 0.92), of 500 (c: canonical correlation = 0.89) and of 200 over the Mediterranean respectively (d: canonical correlation = 0.89).

© 2018 by the authors. Licensee MDPI, Basel, Switzerland. This article is an open access article distributed under the terms and conditions of the Creative Commons Attribution (CC BY) license (http://creativecommons.org/licenses/by/4.0/).
Share and Cite
MDPI and ACS Style
Rizou, D.; Flocas, H.A.; Hatzaki, M.; Bartzokas, A. A Statistical Investigation of the Impact of the Indian Monsoon on the Eastern Mediterranean Circulation. Atmosphere 2018, 9, 90. https://doi.org/10.3390/atmos9030090
AMA Style
Rizou D, Flocas HA, Hatzaki M, Bartzokas A. A Statistical Investigation of the Impact of the Indian Monsoon on the Eastern Mediterranean Circulation. Atmosphere. 2018; 9(3):90. https://doi.org/10.3390/atmos9030090
Chicago/Turabian StyleRizou, Despina, Helena A. Flocas, Maria Hatzaki, and Aristides Bartzokas. 2018. "A Statistical Investigation of the Impact of the Indian Monsoon on the Eastern Mediterranean Circulation" Atmosphere 9, no. 3: 90. https://doi.org/10.3390/atmos9030090
Note that from the first issue of 2016, this journal uses article numbers instead of page numbers. See further details here.