Long-Term Analysis of Aerosol Optical Depth over the Huaihai Economic Region (HER): Possible Causes and Implications

 ,
,
Abstract
:1. Introduction
2. Data and Methods
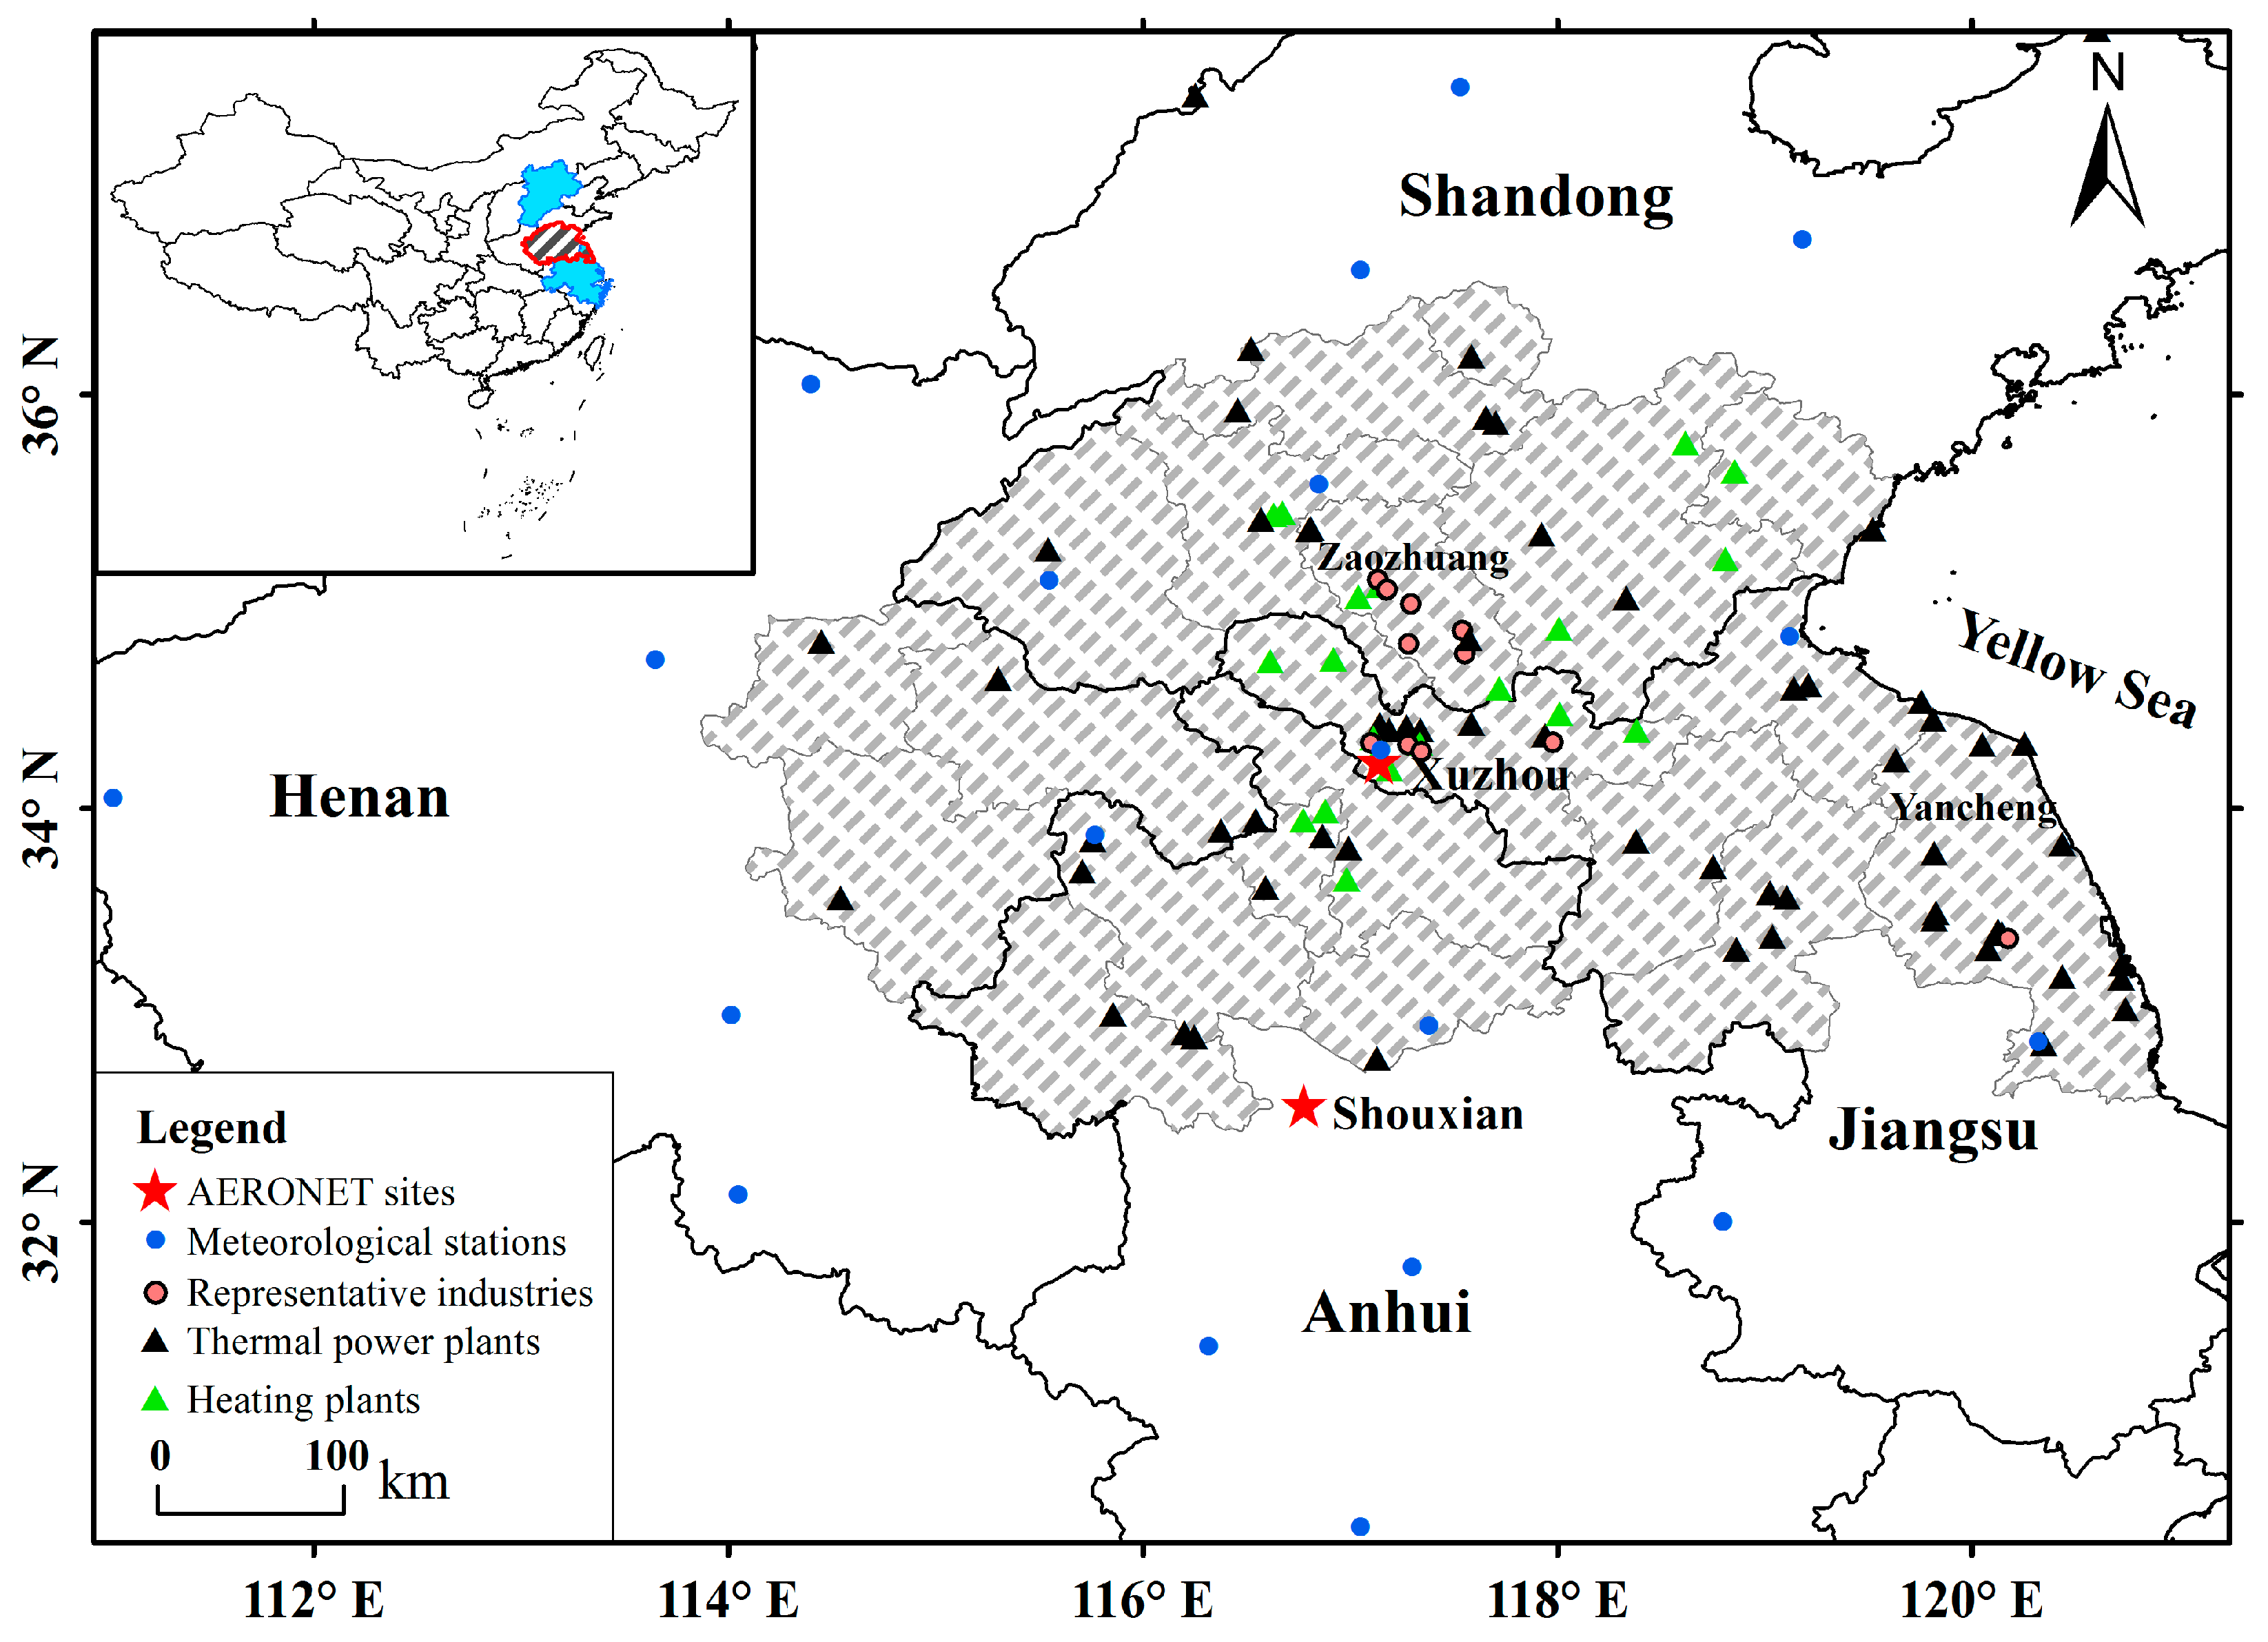
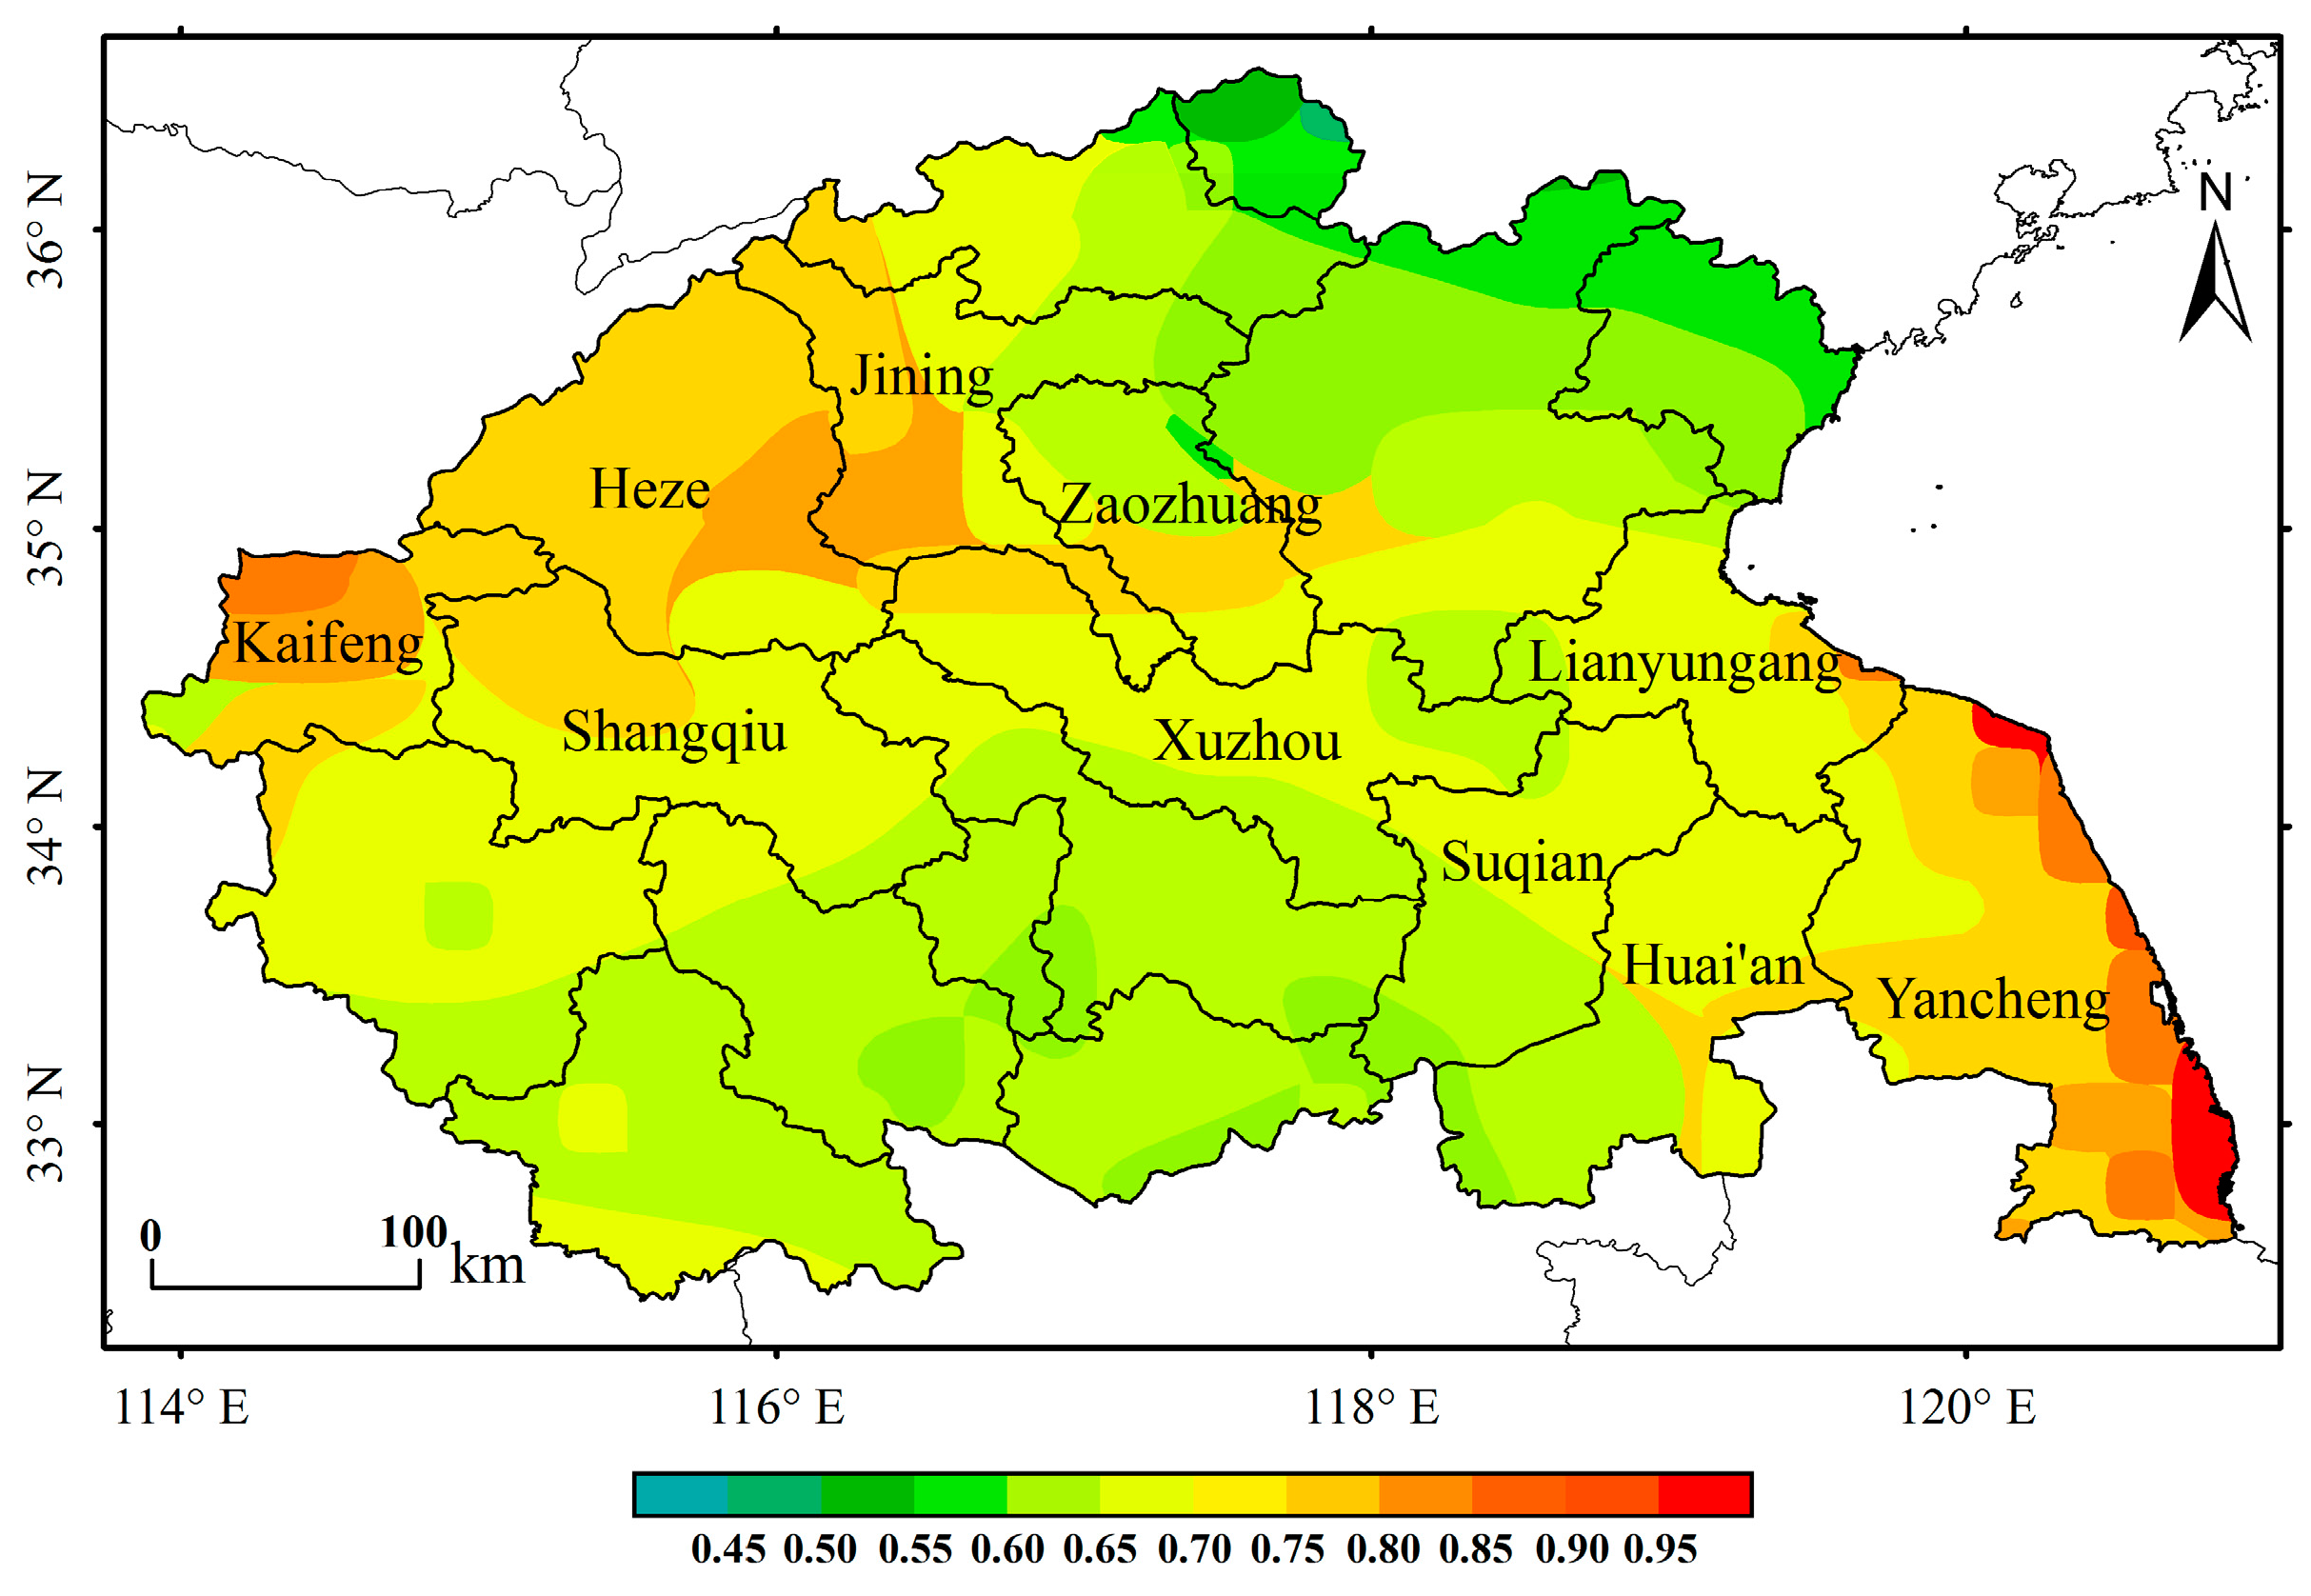
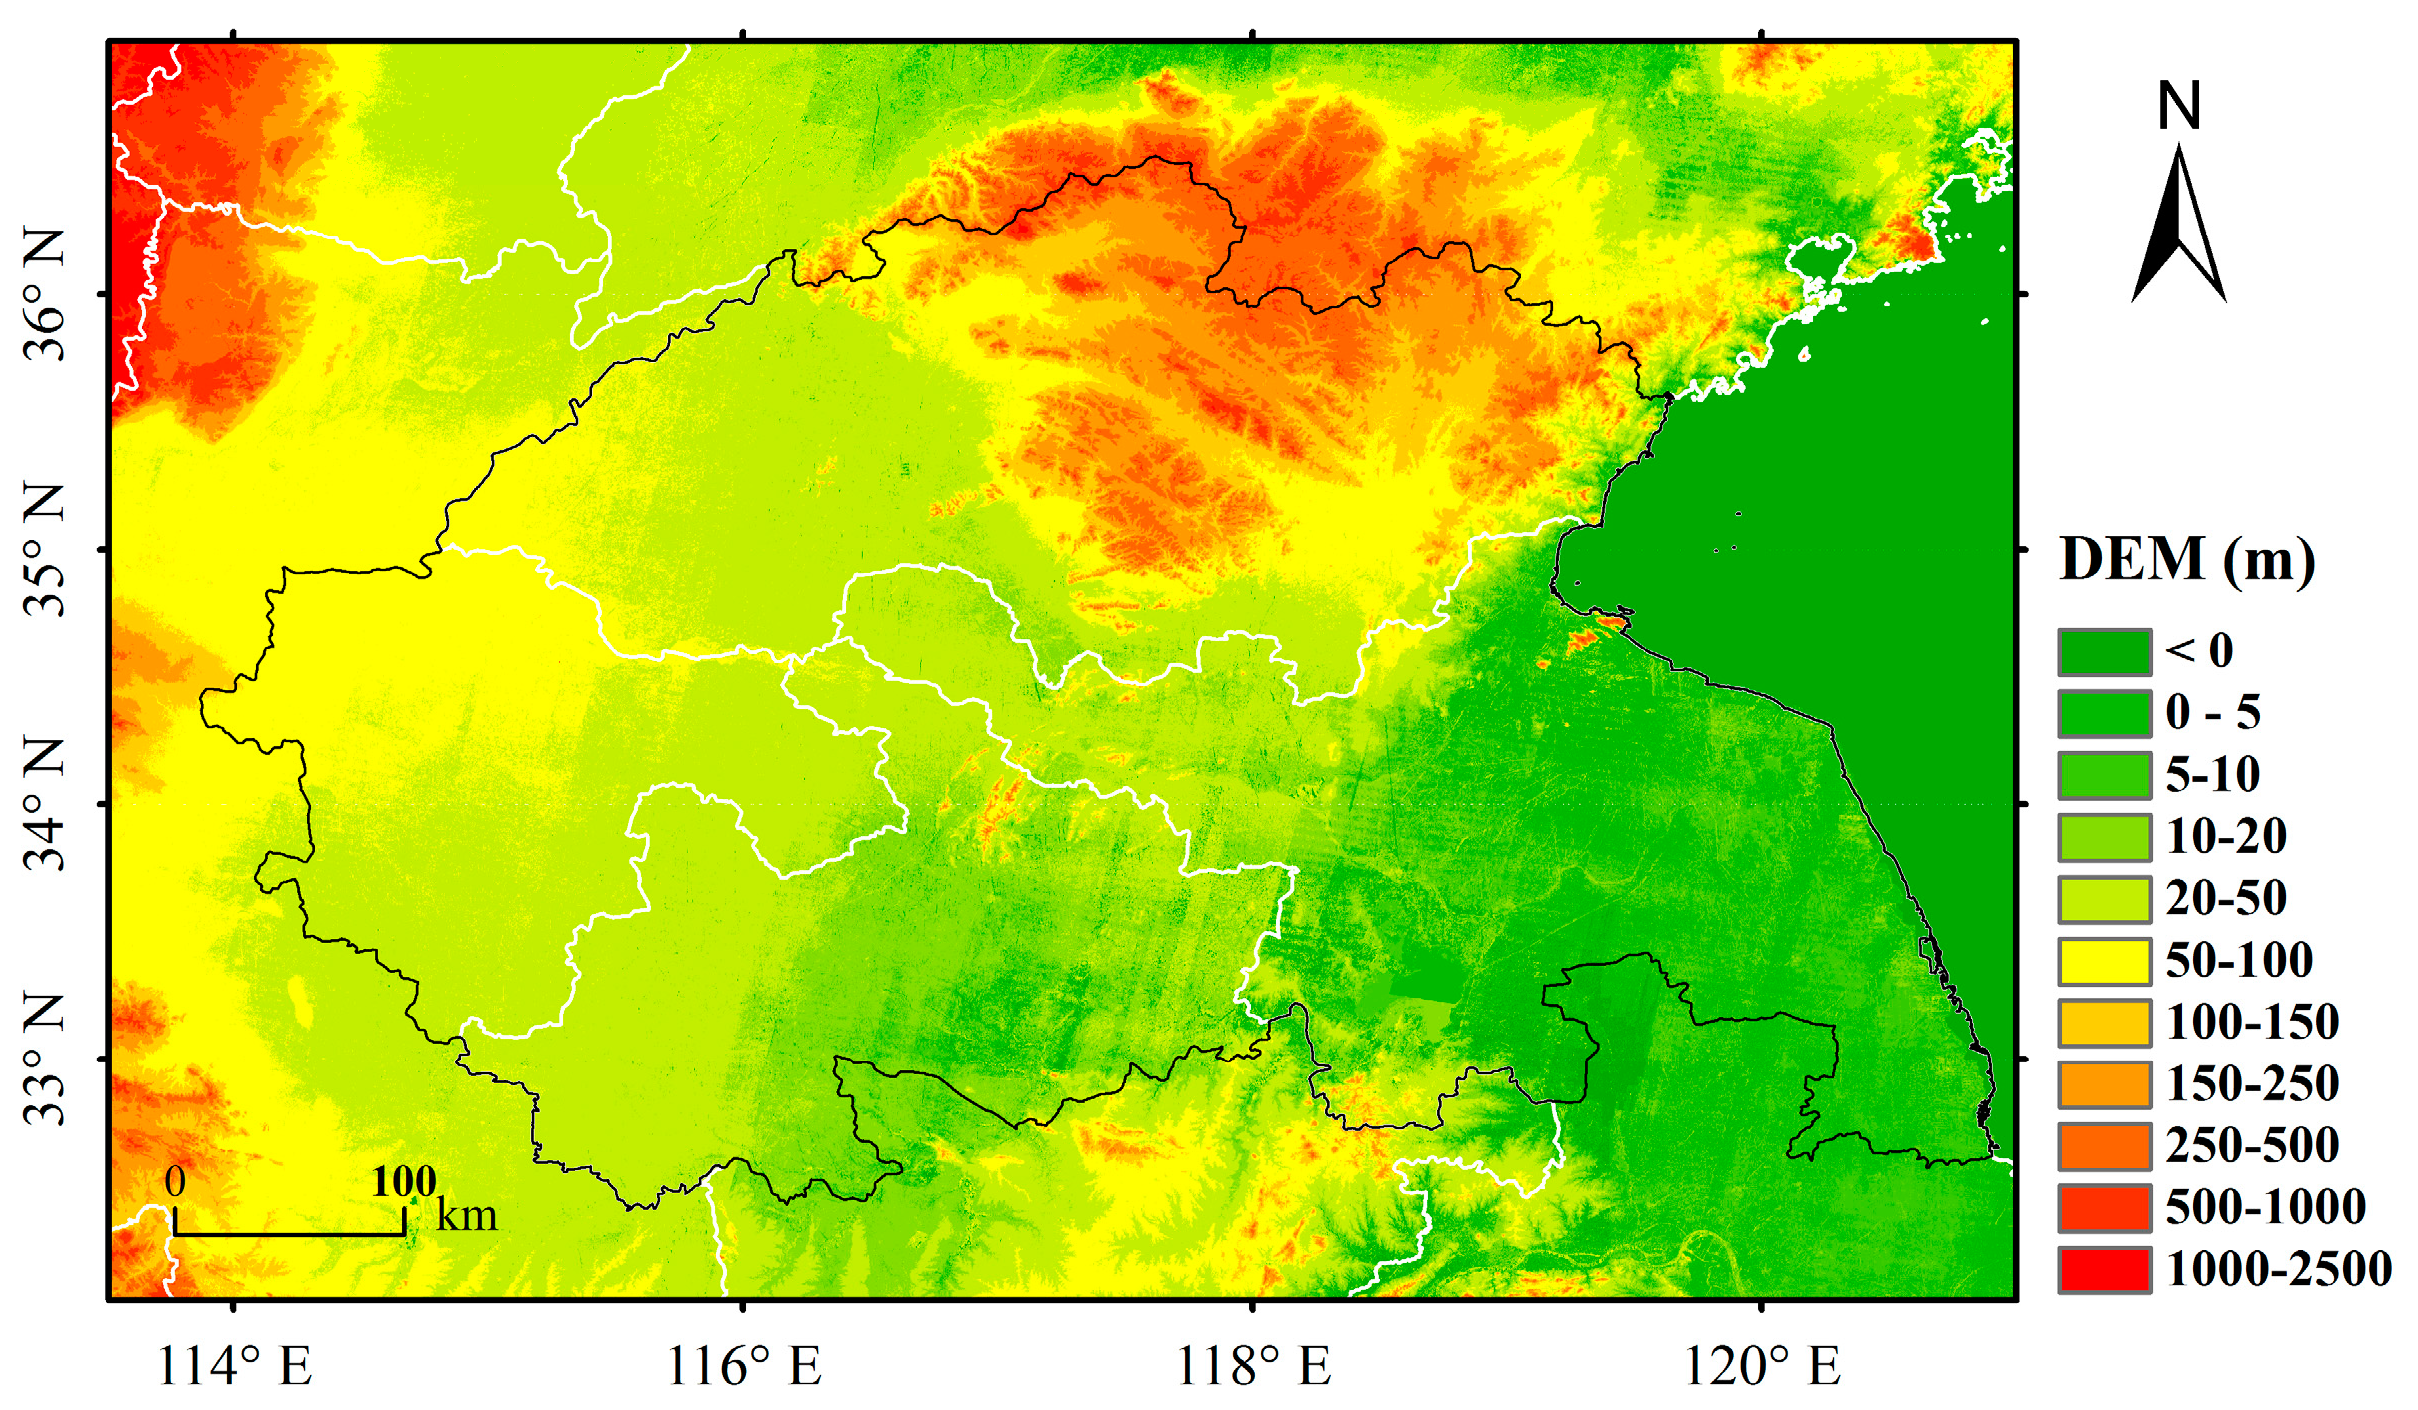
2.1. Study Area
2.2. Data Sources
2.3. Methods
3. Results and Discussion
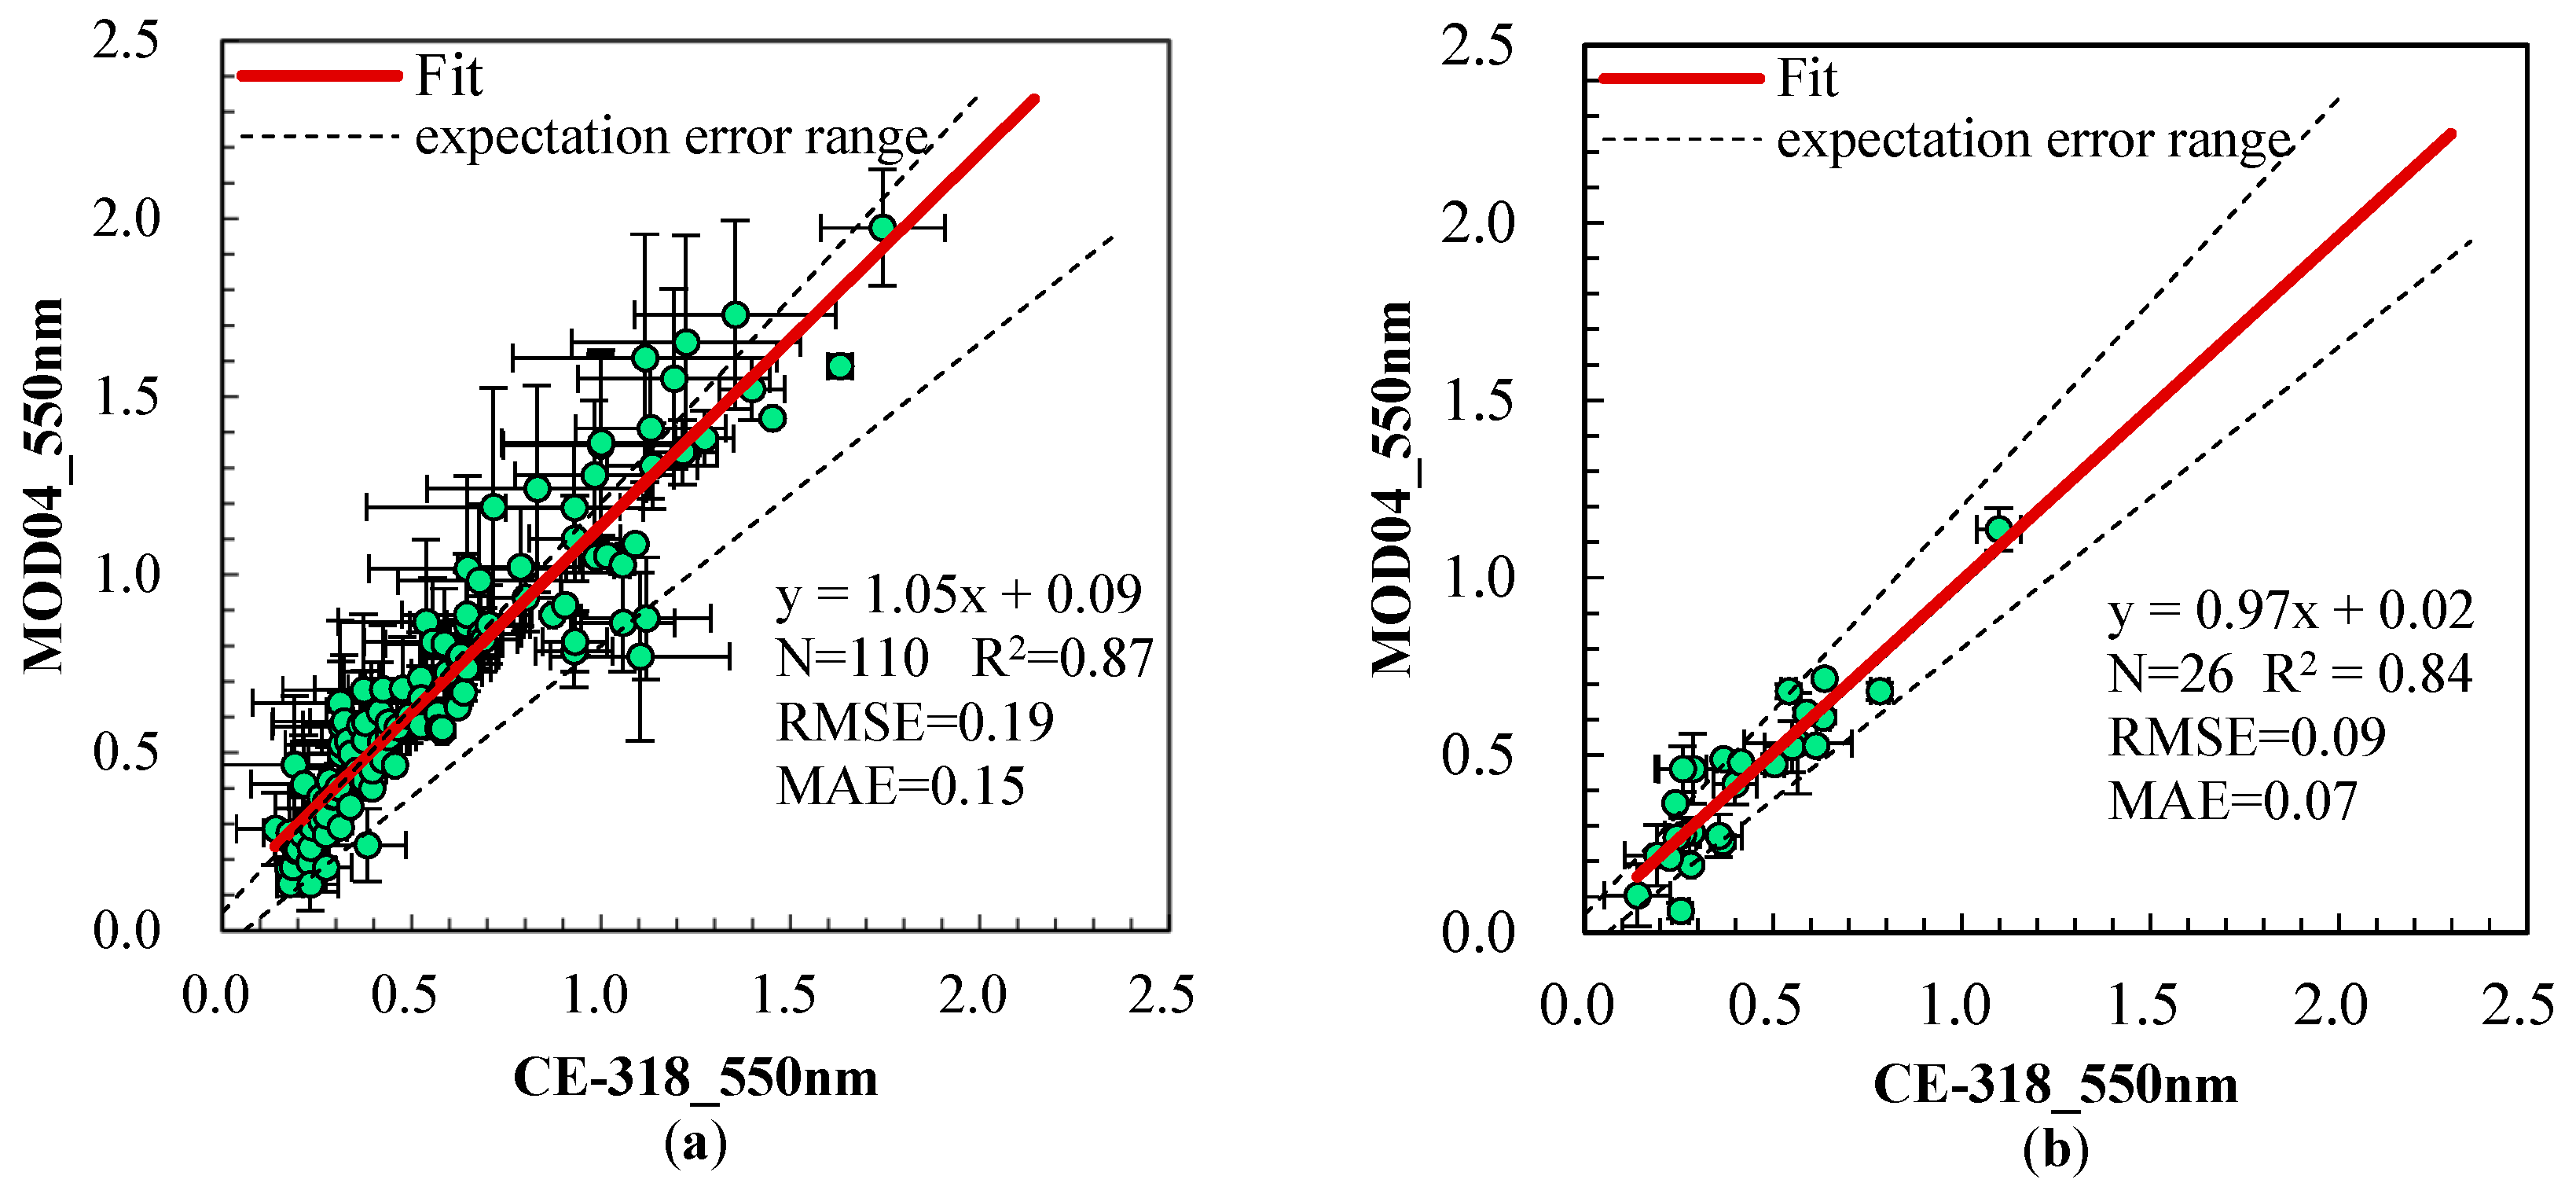
3.1. Comparison and Validation
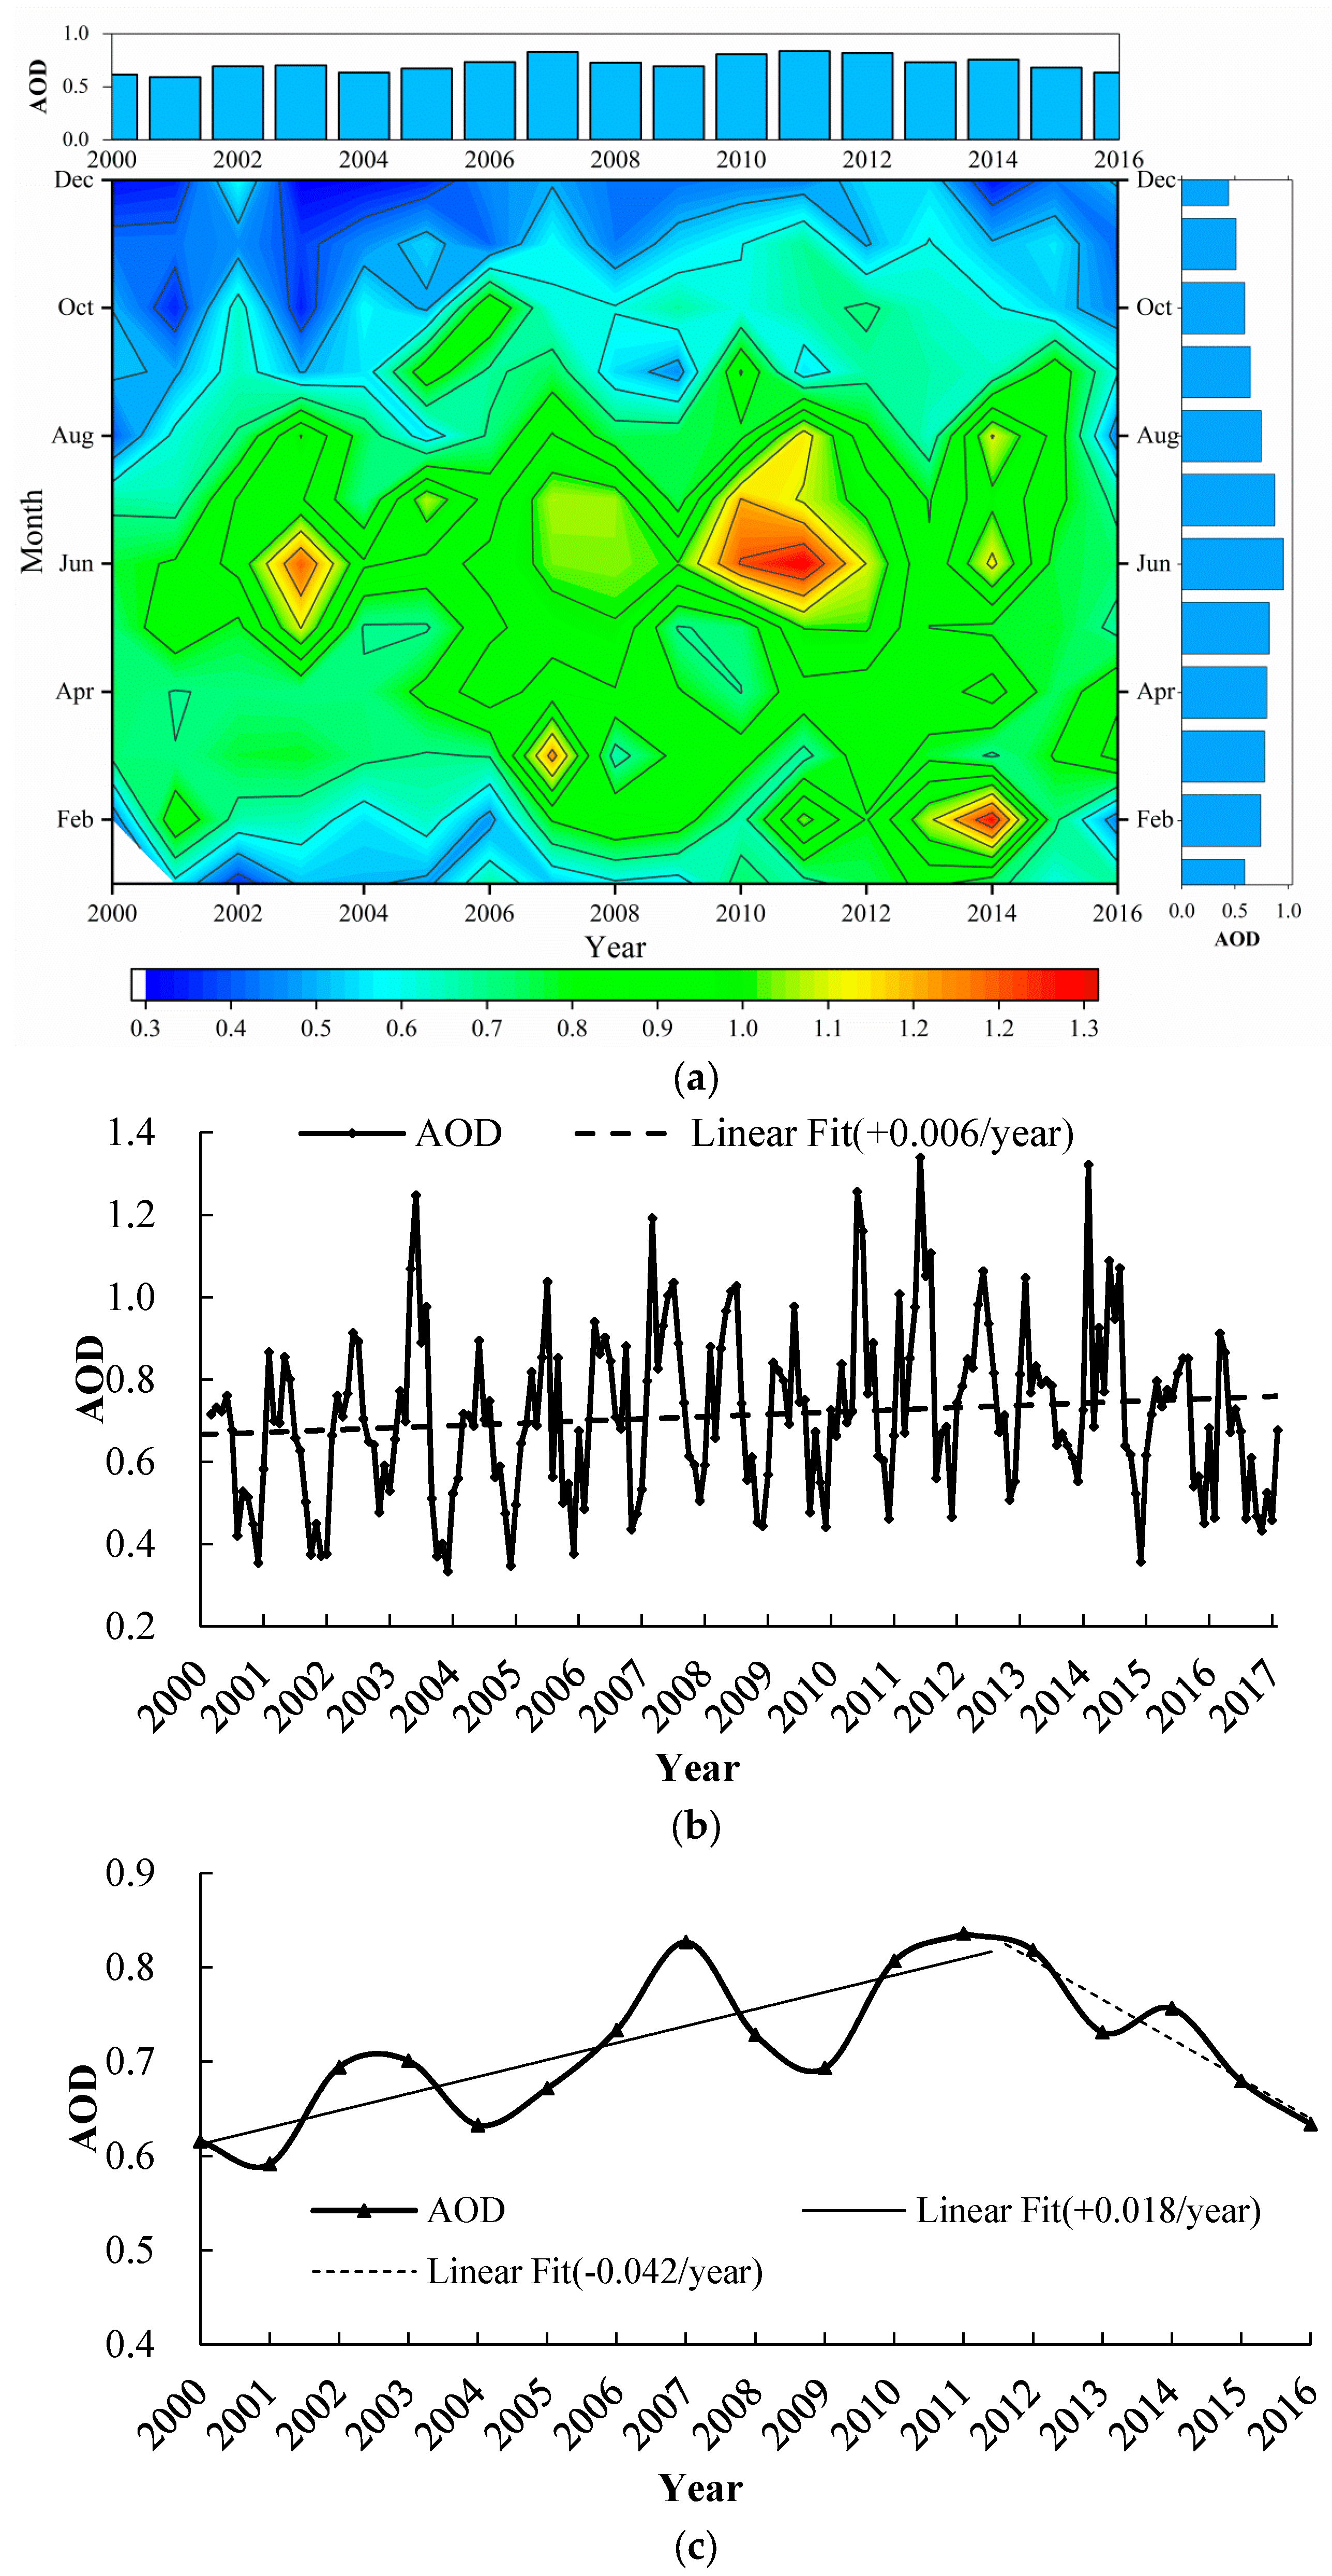
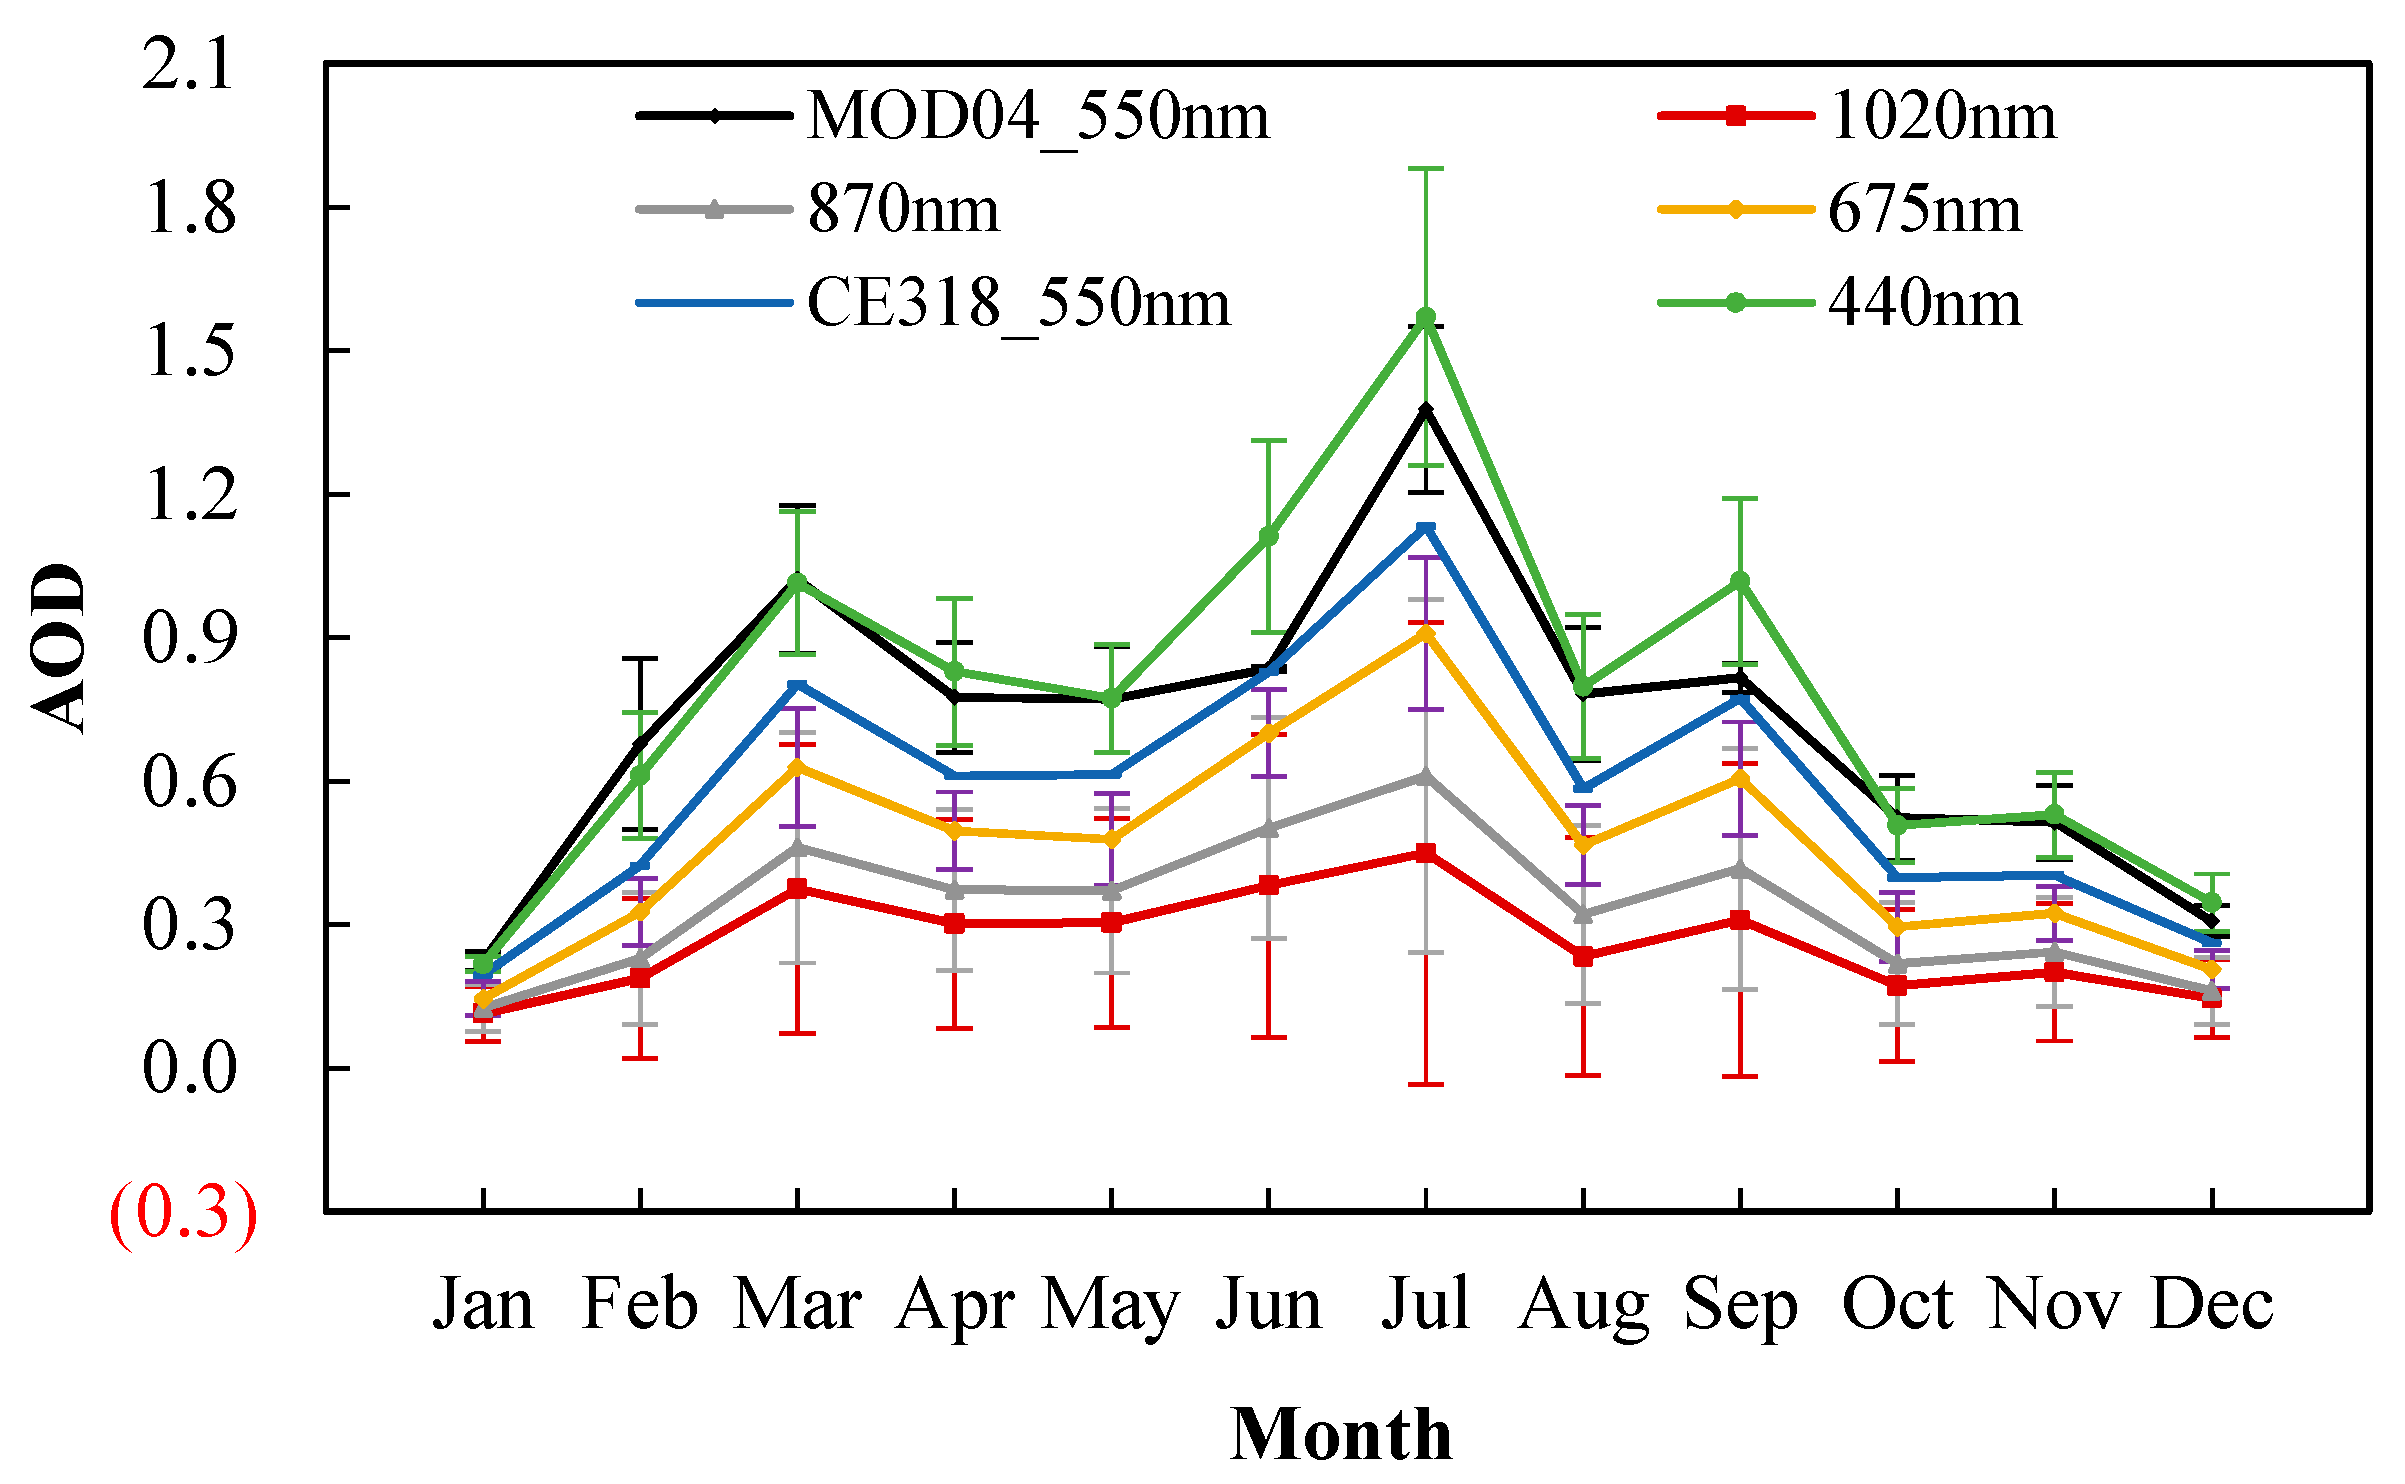
3.2. Annual Variation and Monthly Trend
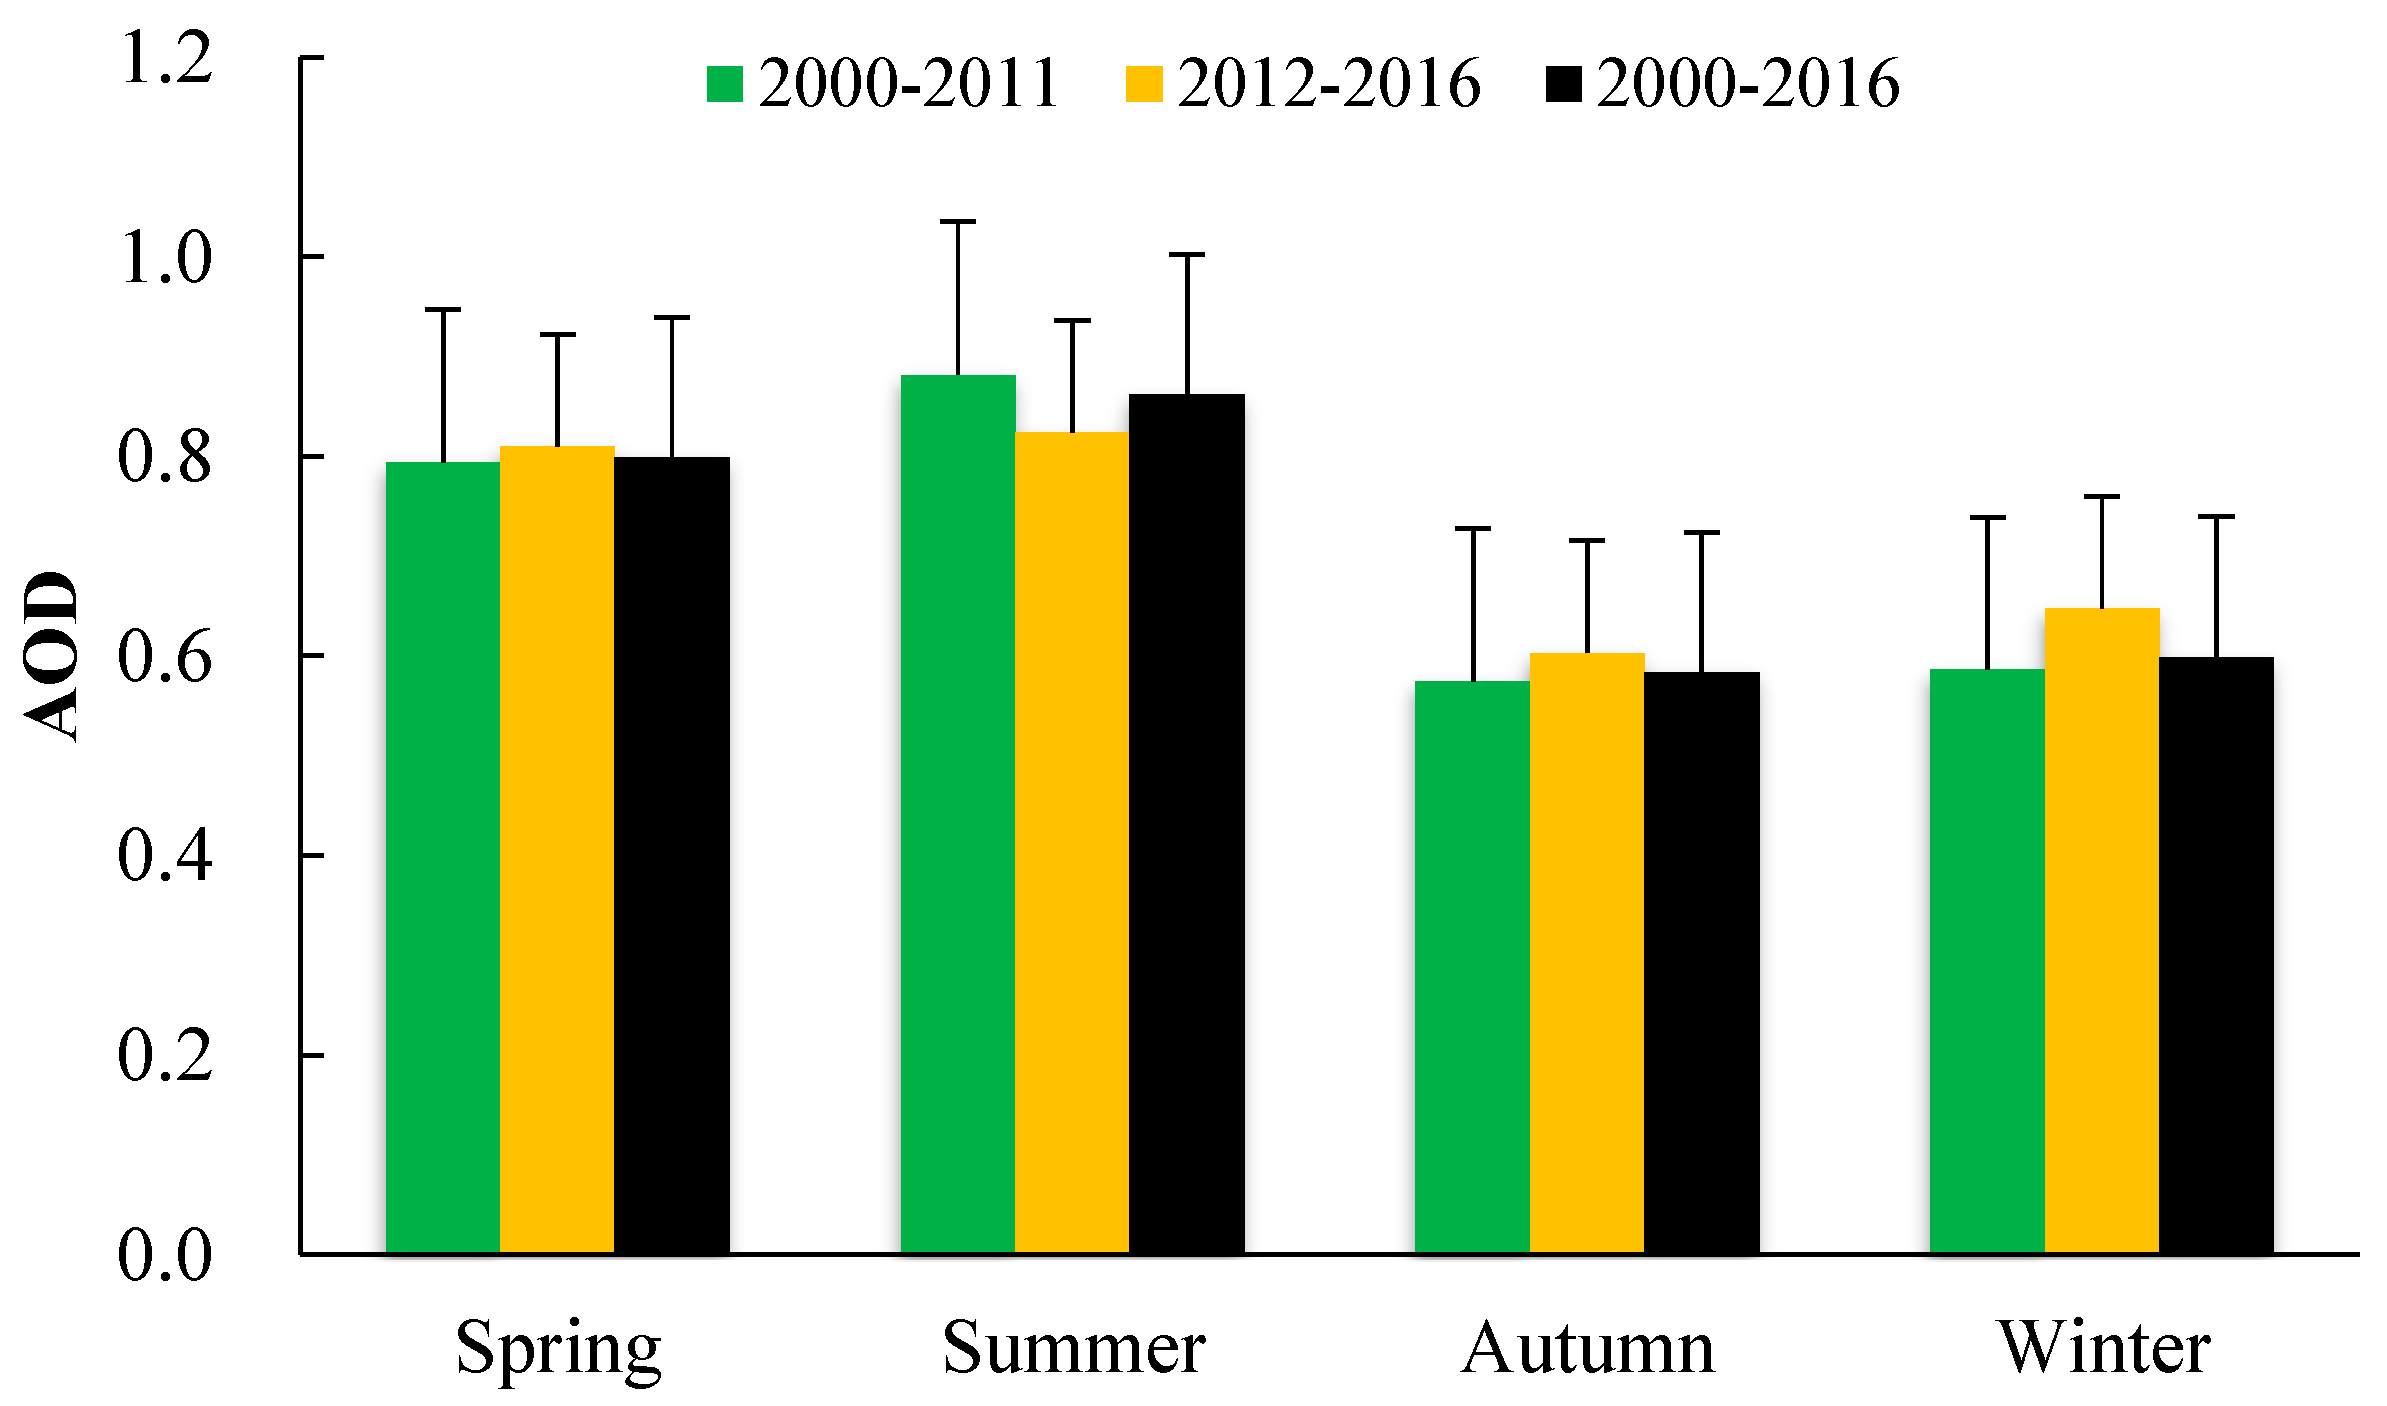
3.3. Seasonal Characteristics
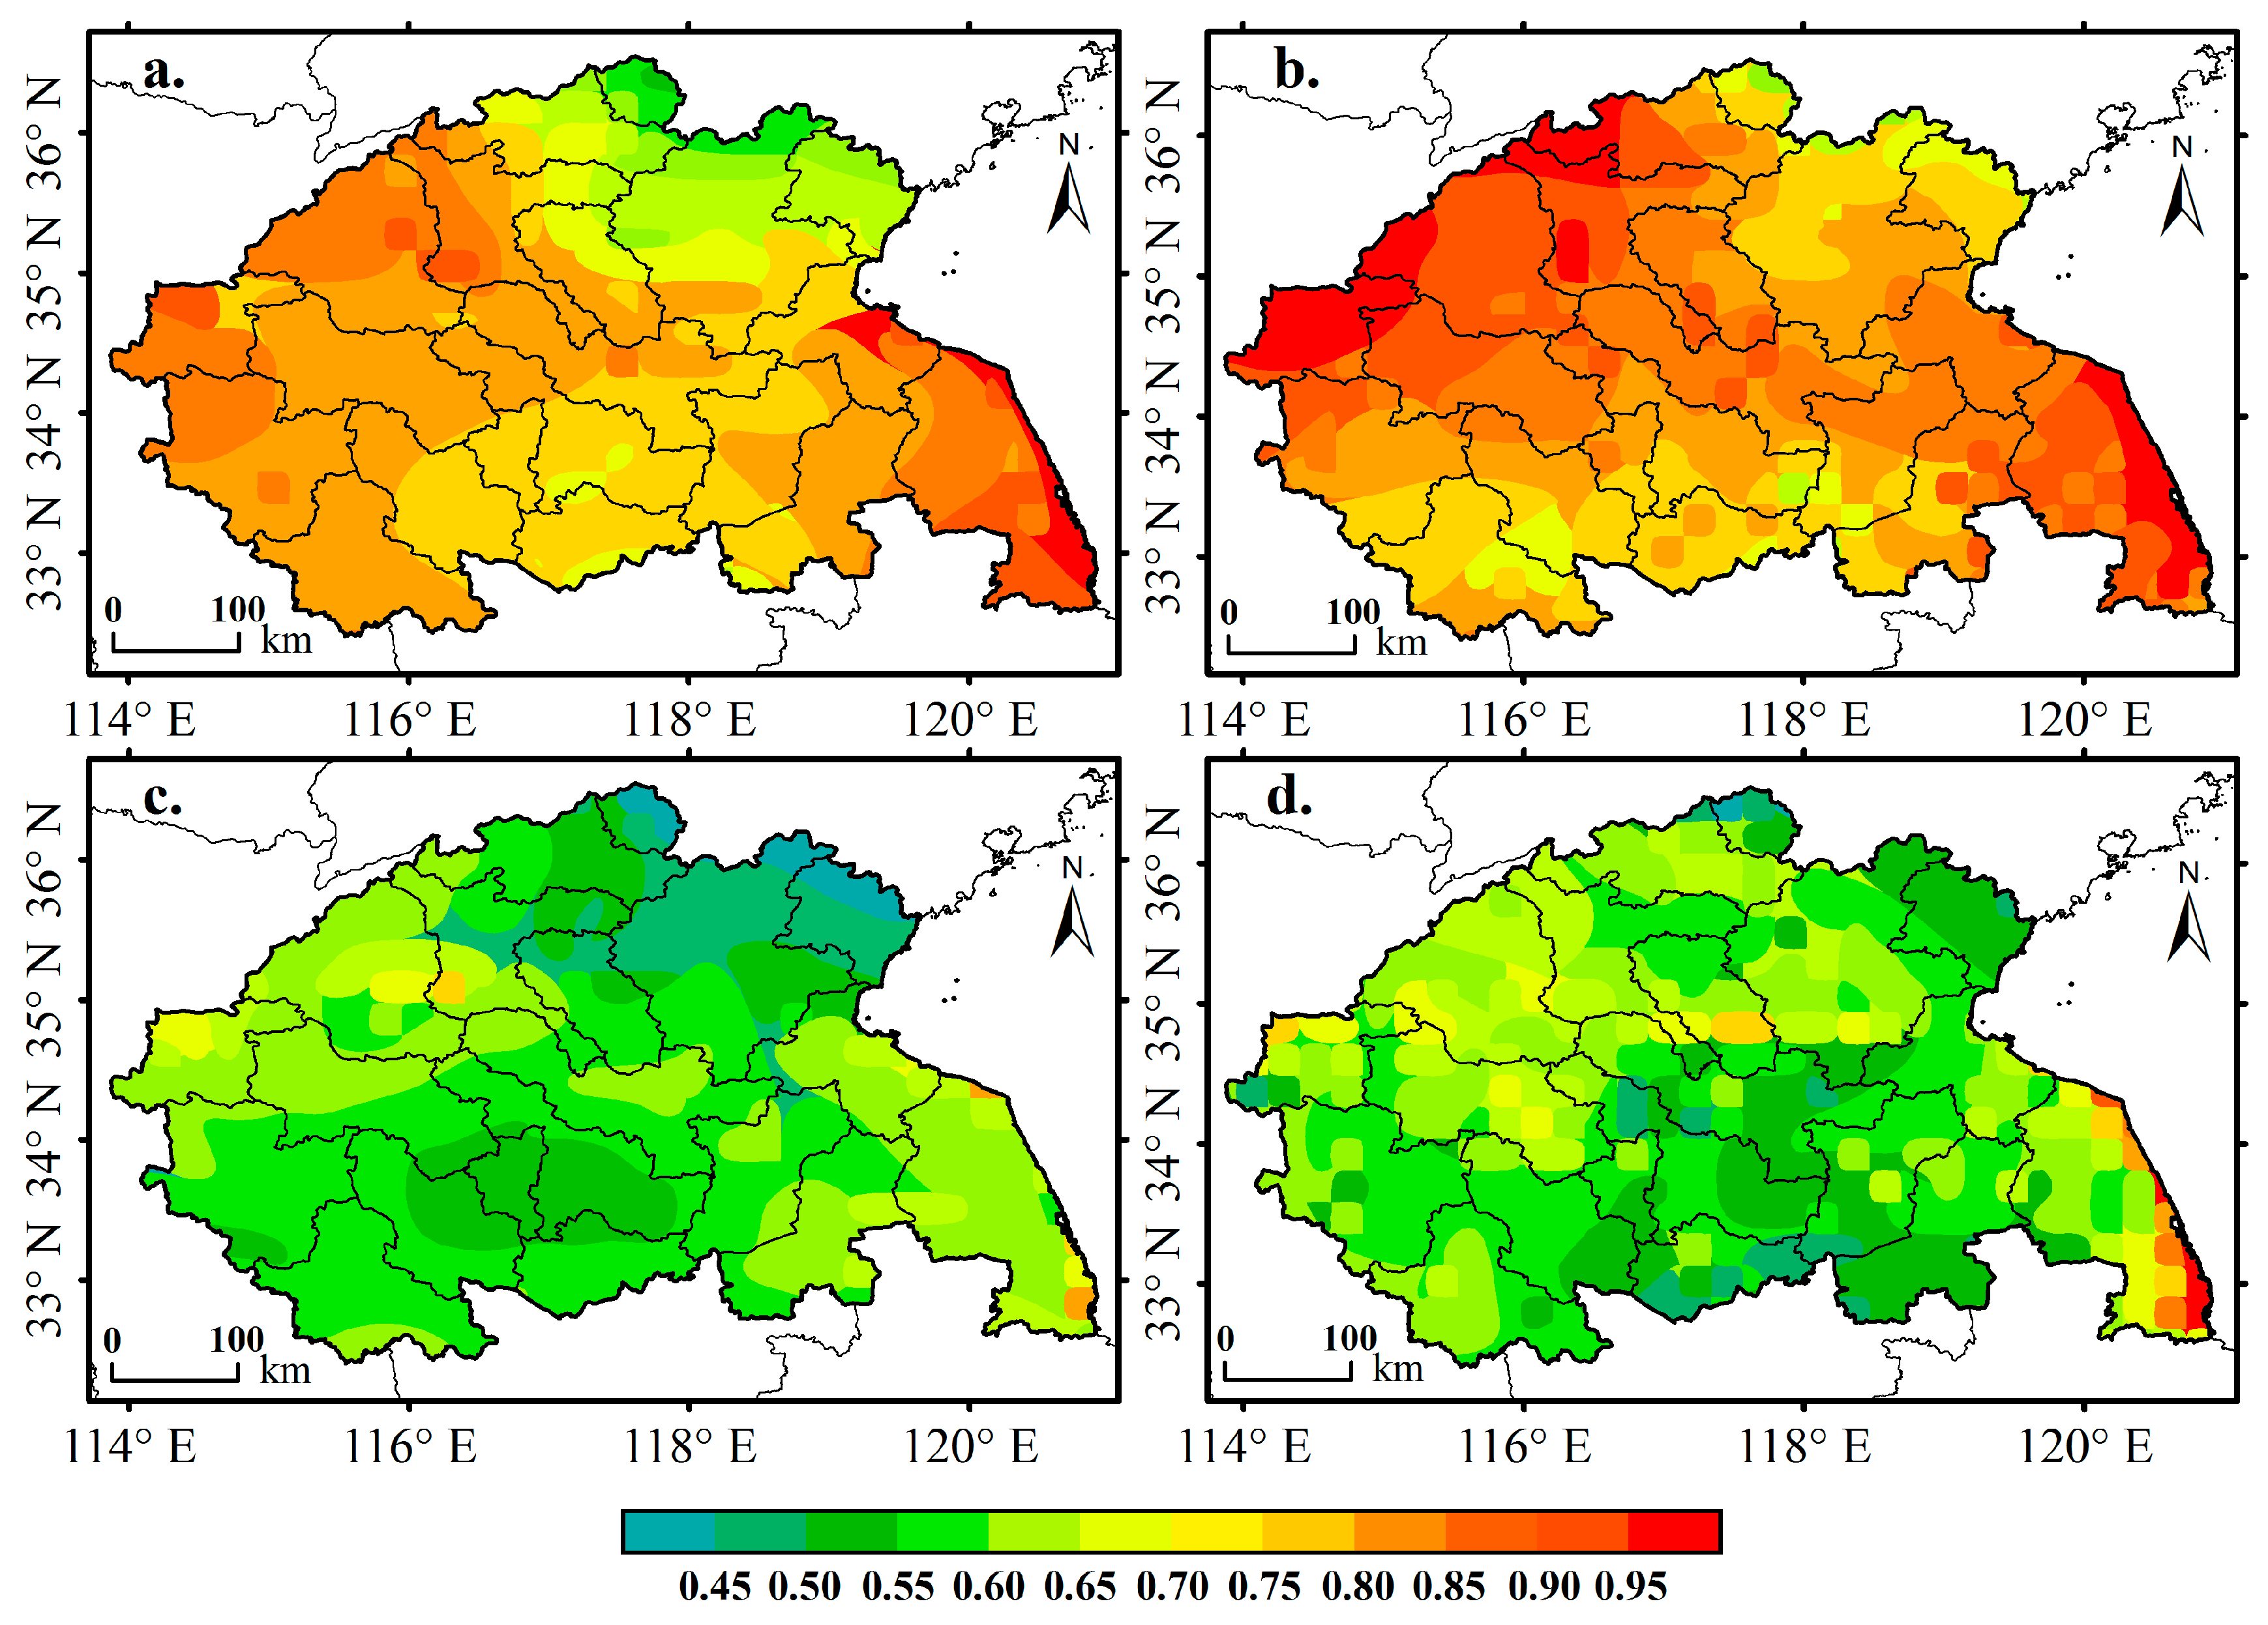
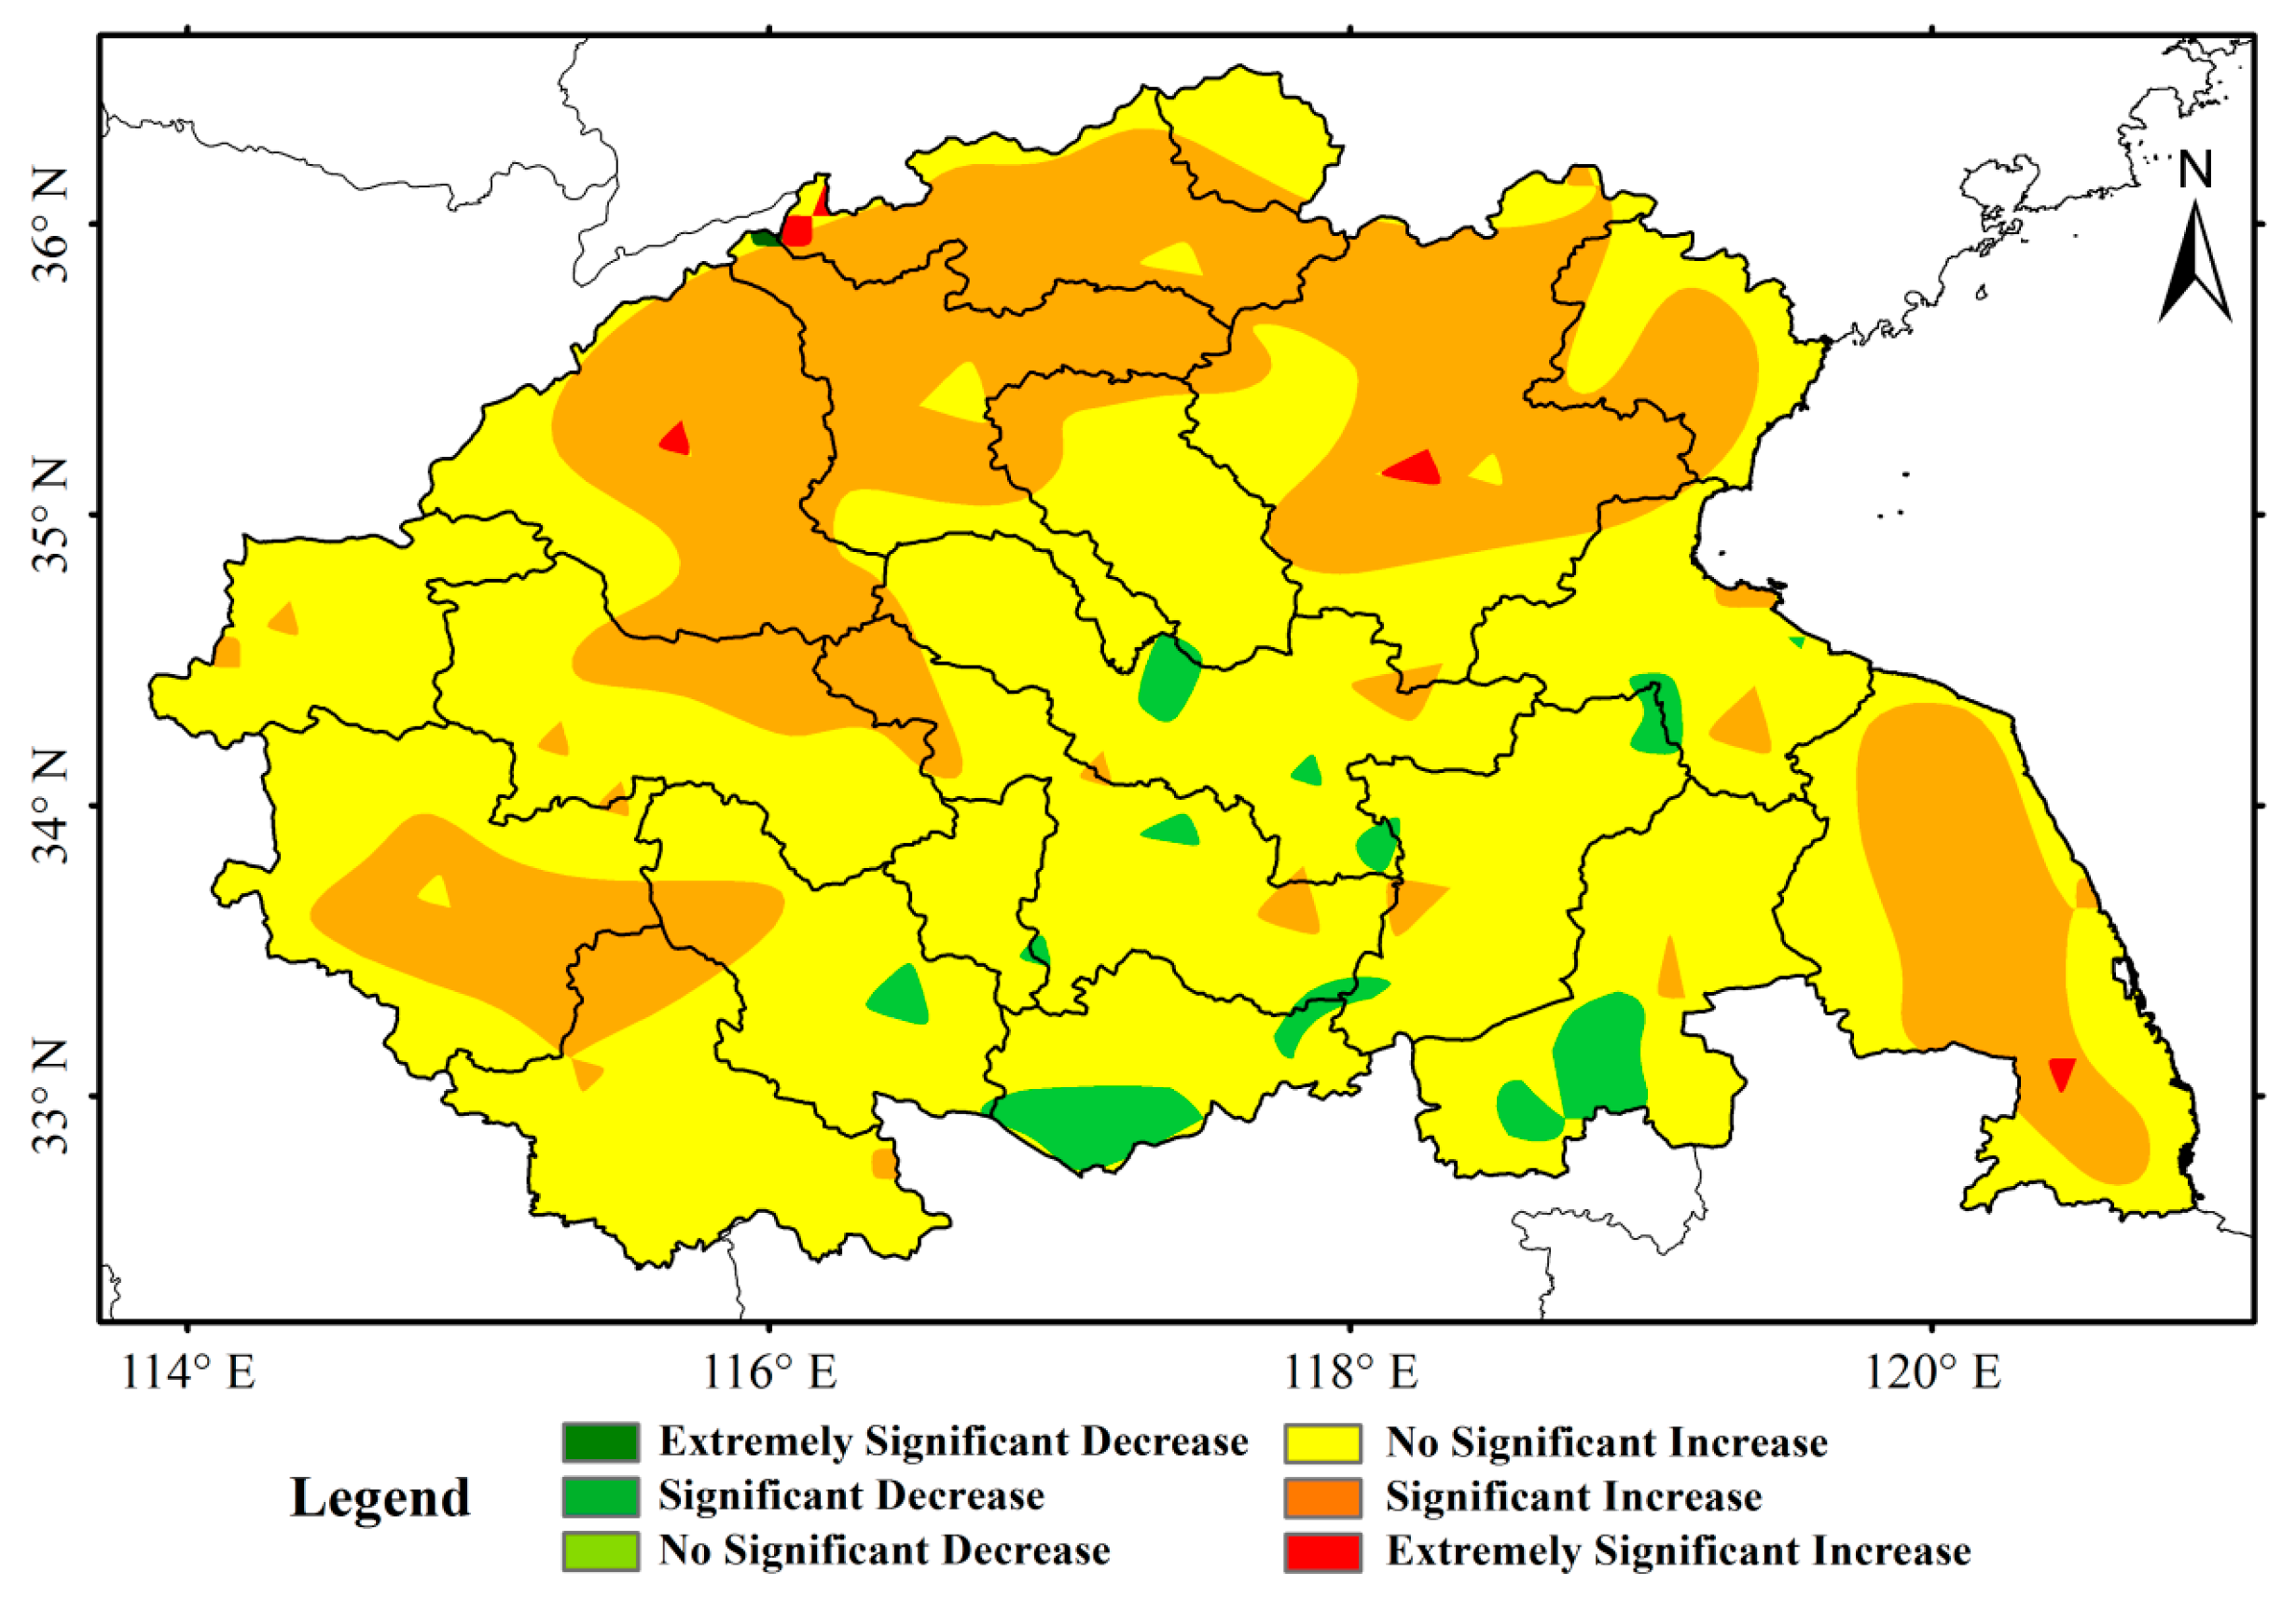
3.4. Spatial Variation of Aerosol Optical Depth (AOD)
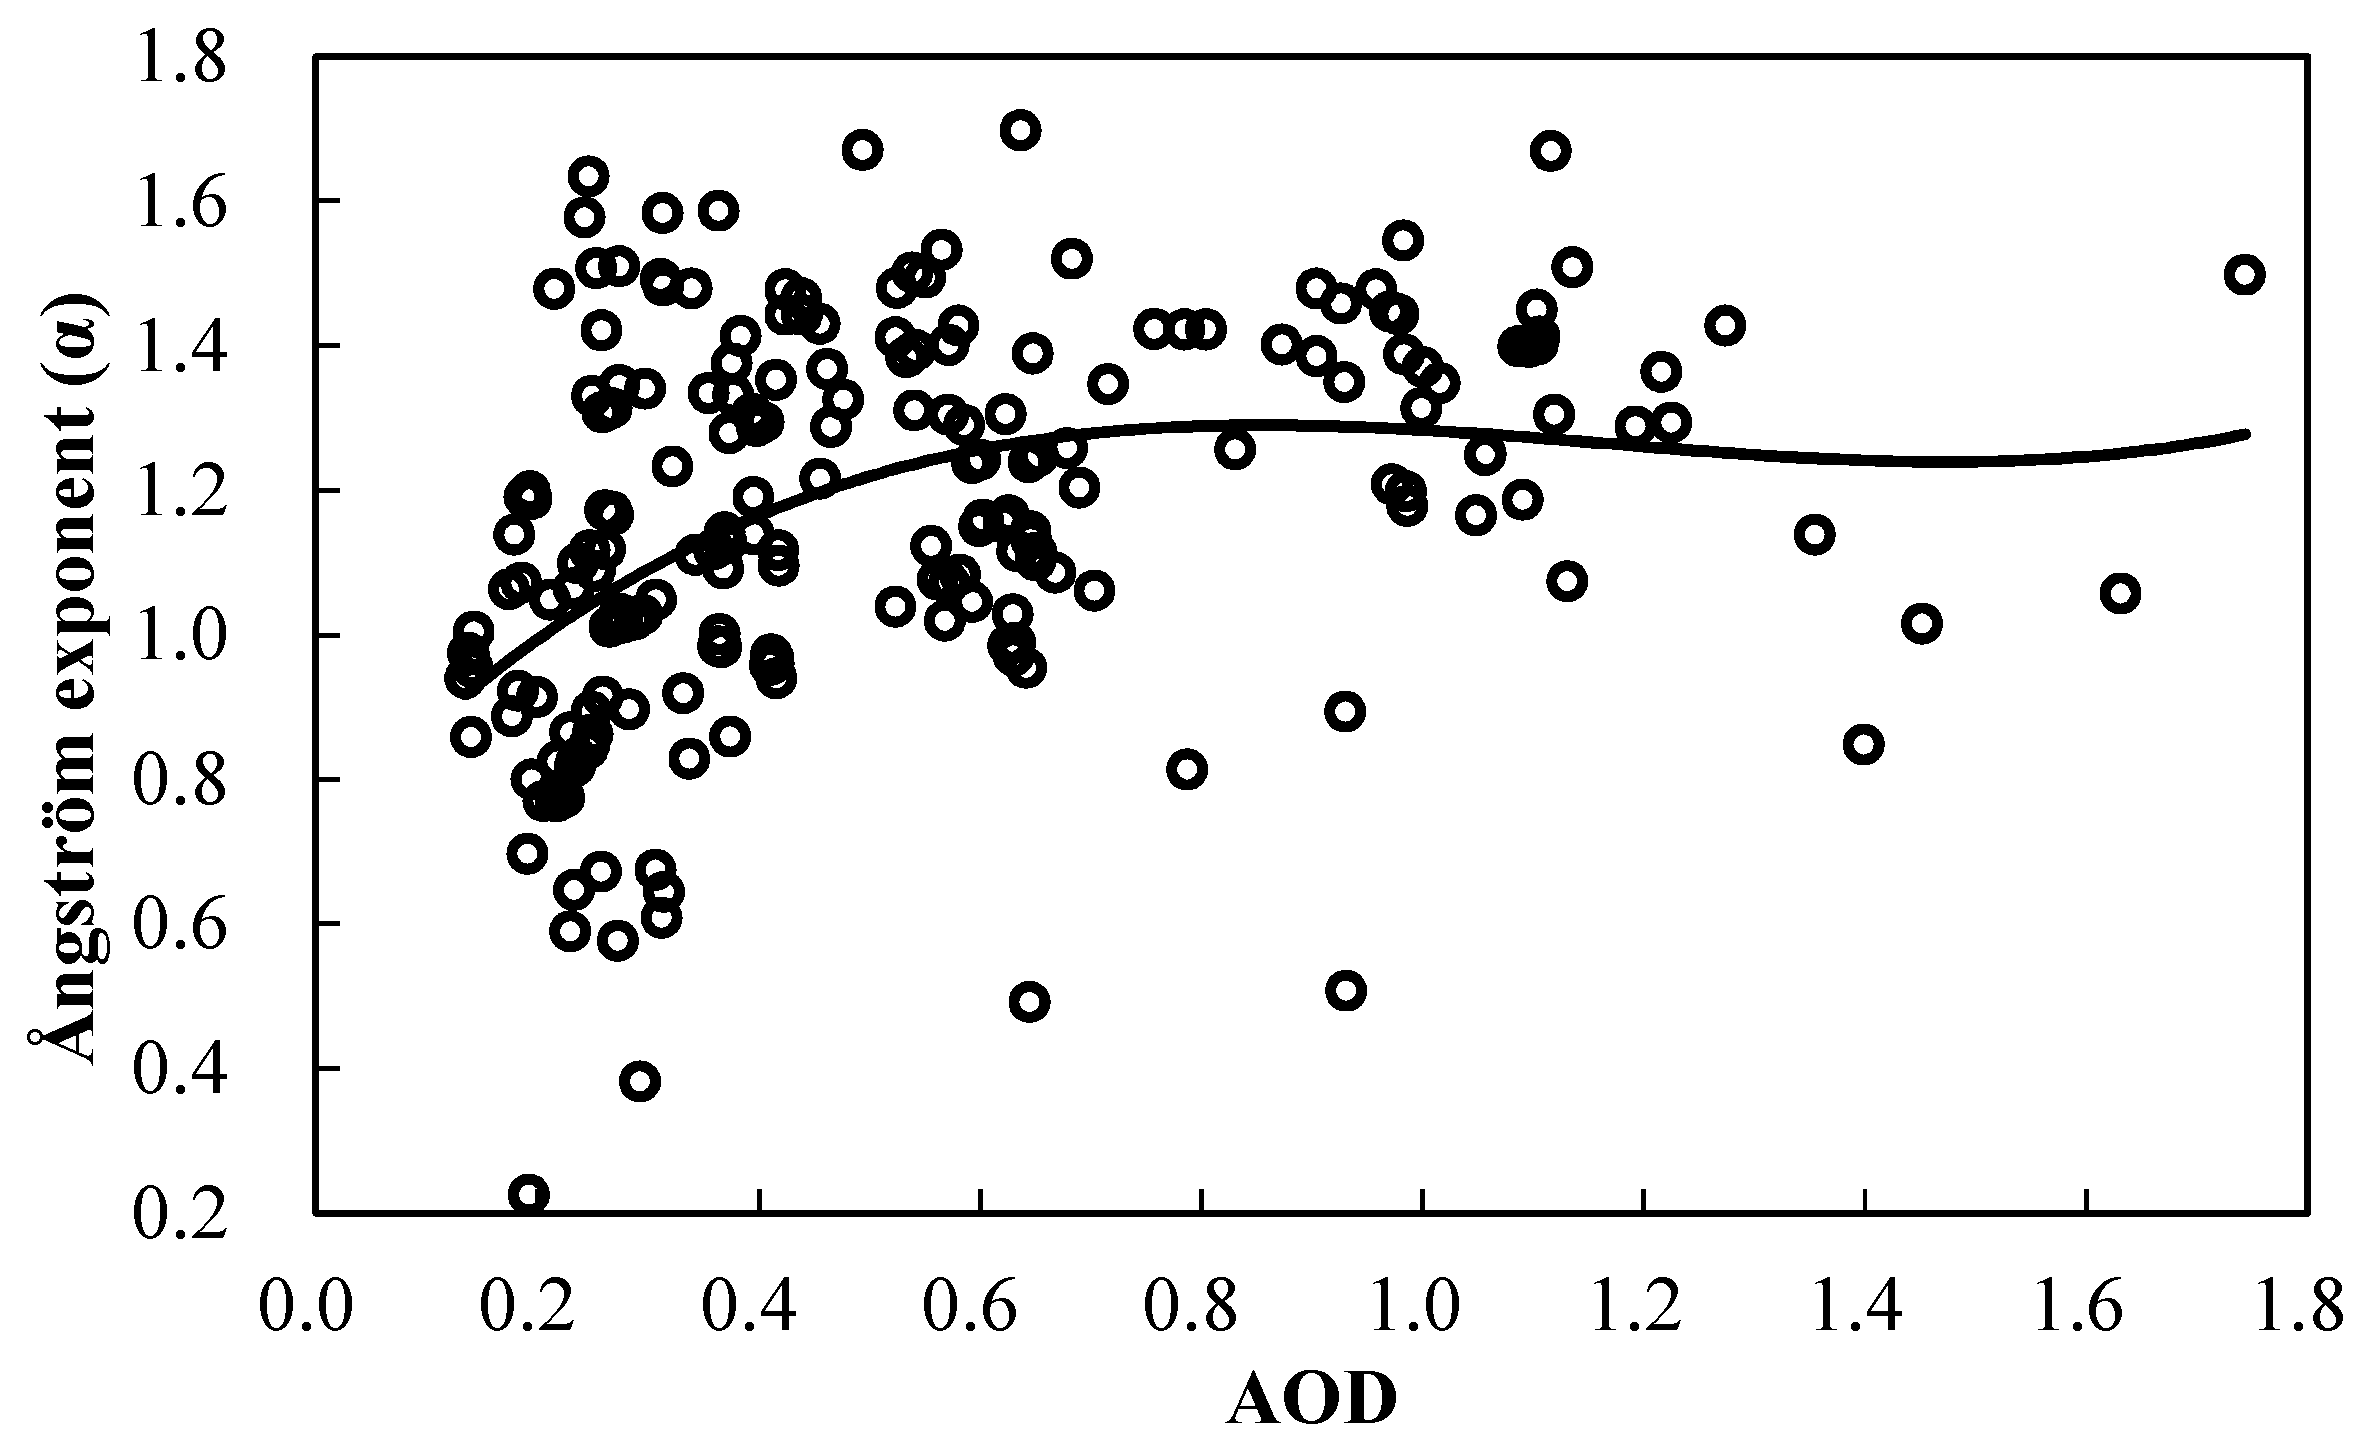
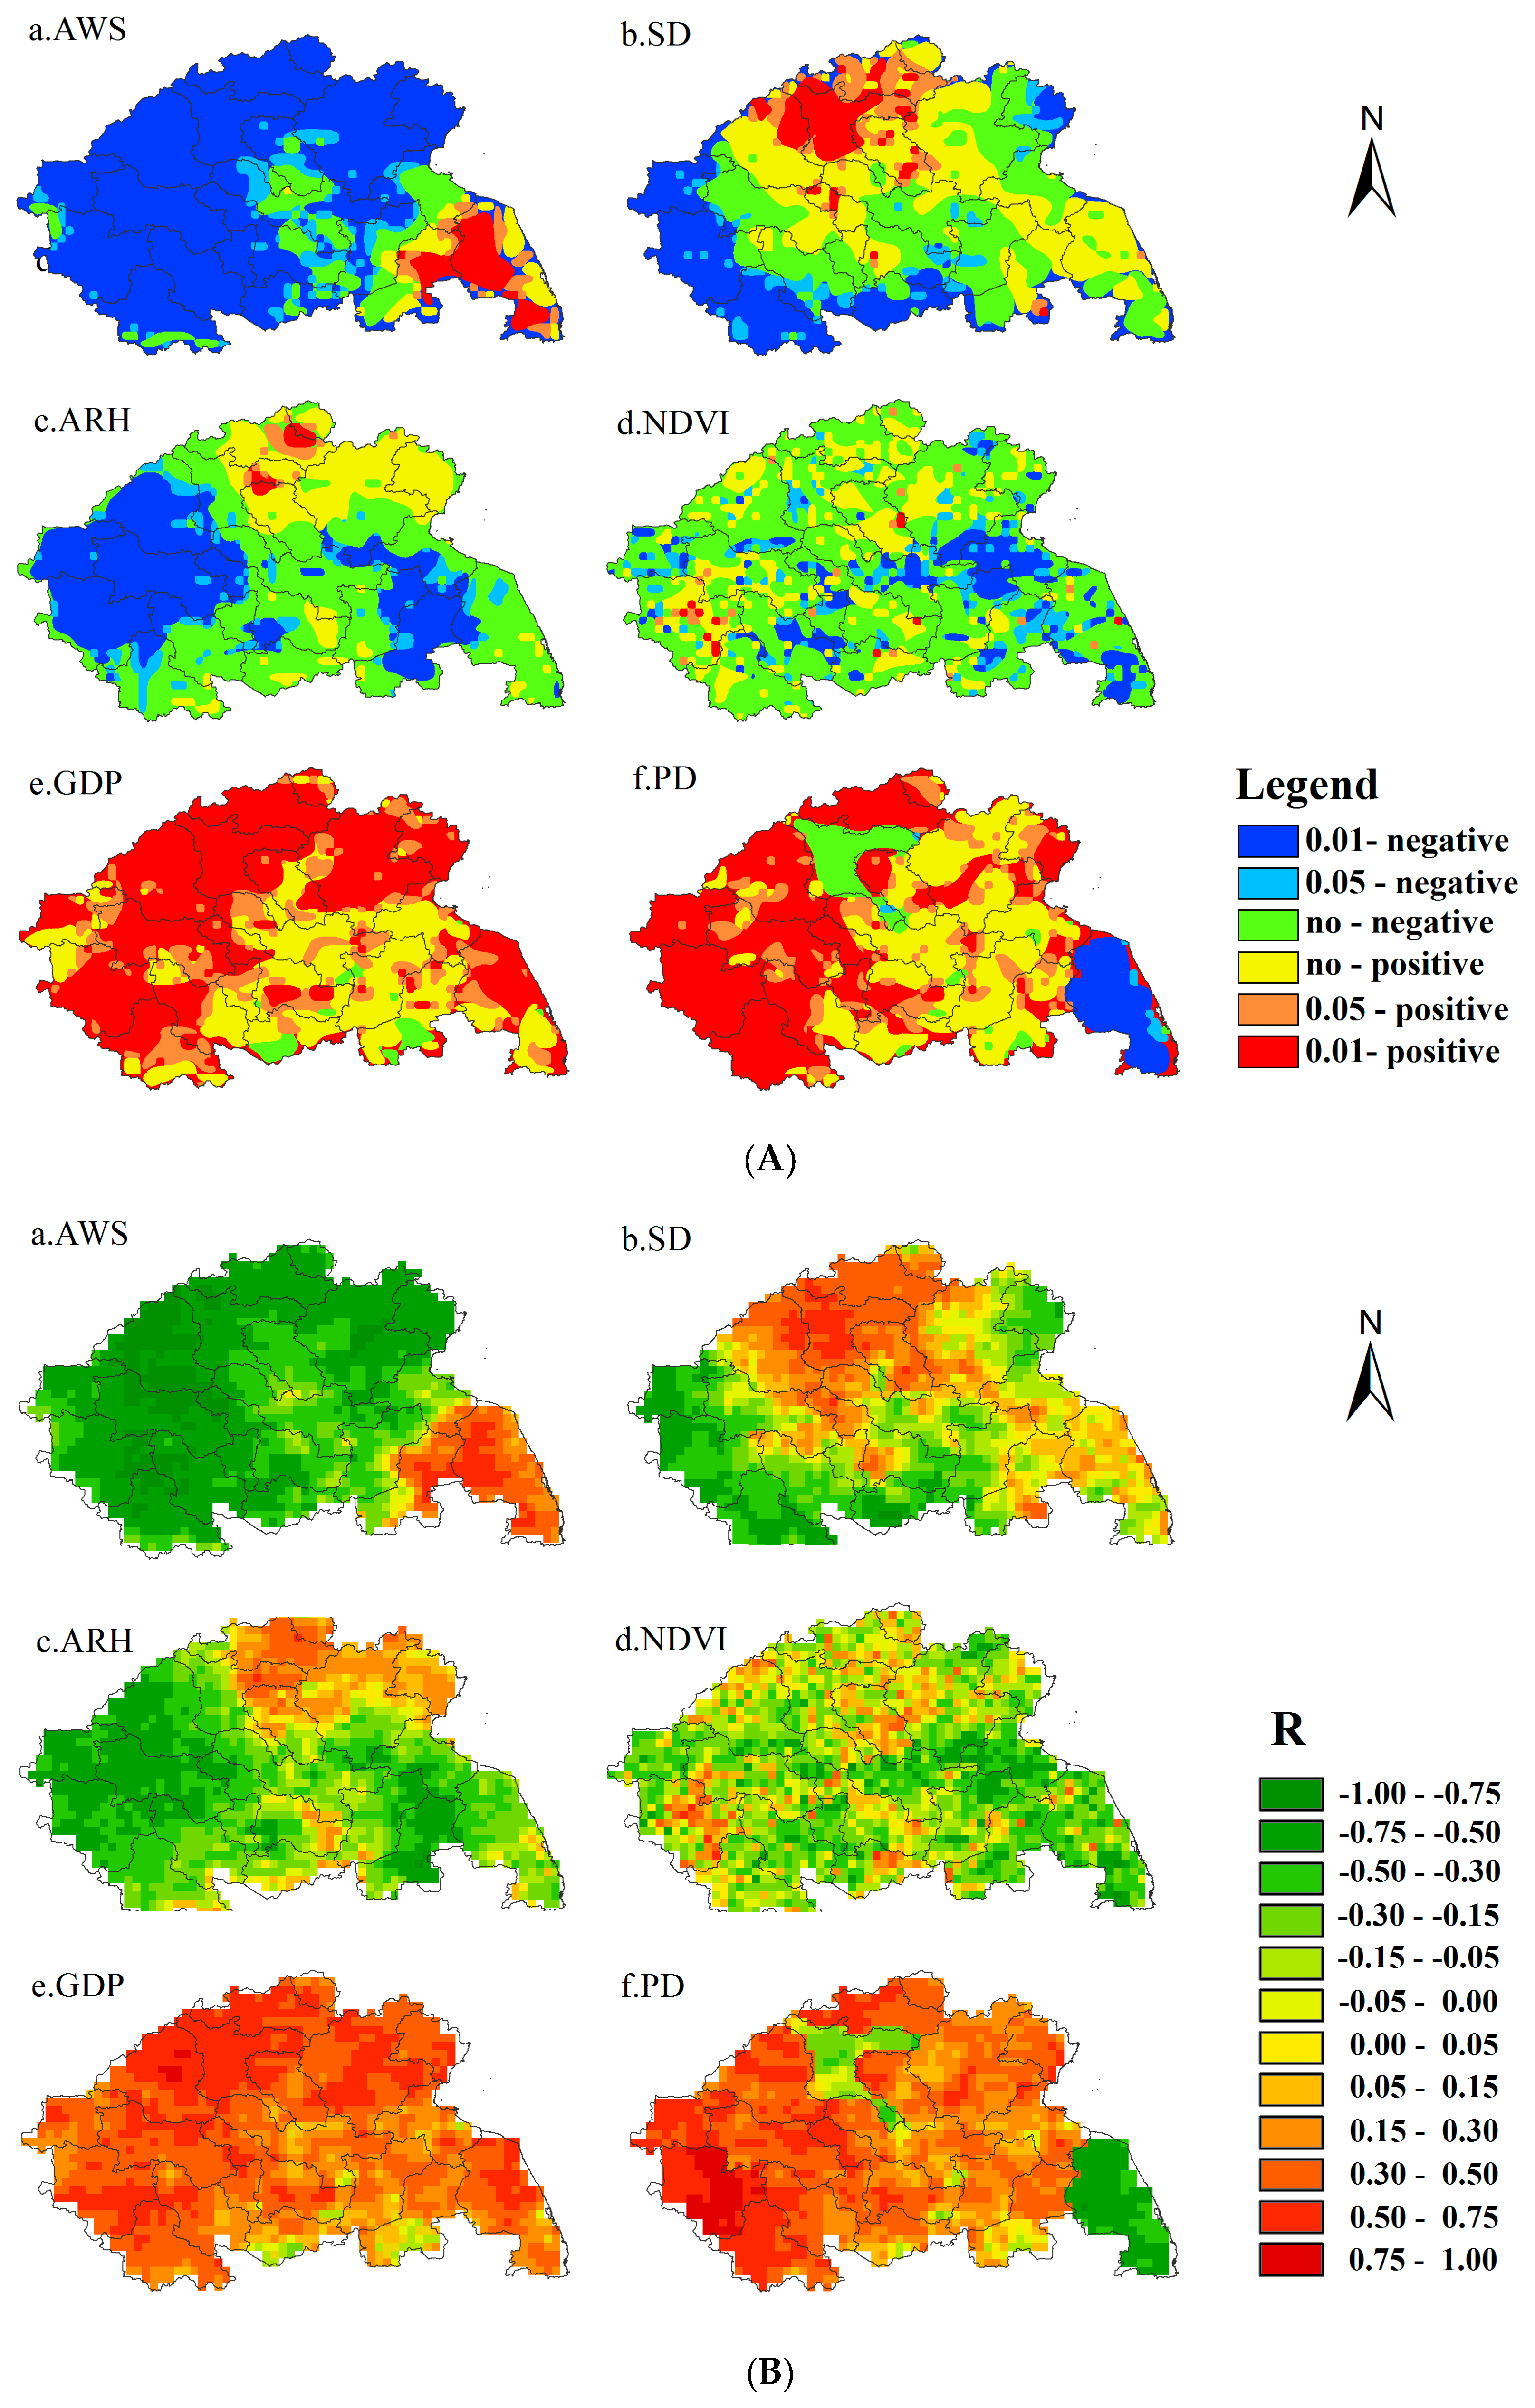
3.5. The Correlation between AOD and Natural Factors
3.6. Correlation between AOD and Anthropogenic Factors
4. Conclusions
Supplementary Materials
Acknowledgments
Author Contributions
Conflicts of Interest
References
- Charlson, R.J.; Schwartz, S.E.; Hales, J.M.; Cess, R.D.; Coakley, J.A., Jr.; Hansen, J.E.; Hofmann, D.J. Climate forcing by anthropogenic aerosols. Science 1992, 255, 423–430. [Google Scholar] [CrossRef] [PubMed]
- Haywood, J.; Boucher, O. Estimates of the direct and indirect radiative forcing due to tropospheric aerosols: A review. Rev. Geophys. 2000, 38, 513–544. [Google Scholar] [CrossRef]
- Liu, X.; Gu, J.; Li, Y.; Cheng, Y.; Qu, Y.; Han, T.; Wang, J.; Tian, H.; Chen, J.; Zhang, Y. Increase of aerosol scattering by hygroscopic growth: Observation, modeling, and implications on visibility. Atmos. Res. 2013, 132–133, 91–101. [Google Scholar] [CrossRef]
- Mahowald, N.M.; Engelstaedter, S.; Luo, C.; Sealy, A.; Artaxo, P.; Benitez-Nelson, C.; Bonnet, S.; Chen, Y.; Chuang, P.Y.; Cohen, D.D.; et al. Atmospheric iron deposition: Global distribution, variability, and human perturbations. Ann. Rev. Mar. Sci. 2009, 1, 245–278. [Google Scholar] [CrossRef] [PubMed]
- Shuying, B.; Jianqiao, S.; Jun, B.; Zhiming, H. Spatio–temporal variations of aerosol optical depth in the yangtze river basinduring 2000–2011. Ecol. Environ. Sci. 2012, 9, 1567–1573. [Google Scholar]
- Lv, X.; Guo, Q.; Xu, J. Analysis of spatio-temporal features of aerosol optical depth of xuzhou city based on remote sensing monitoring. Remote Sens. Inf. 2016, 31, 79–84. (In Chinese) [Google Scholar]
- Kaufman, Y.J.; Tanré, D.; Remer, L.A.; Vermote, E.F.; Chu, A.; Holben, B.N. Operational remote sensing of tropospheric aerosol over land from eos moderate resolution imaging spectroradiometer. J. Geophys. Res. Atmos. 1997, 102, 17051–17067. [Google Scholar] [CrossRef]
- Kaufman, Y.J.; Tanré, D.; Boucher, O. A satellite view of aerosols in the climate system. Nature 2002, 419, 215–223. [Google Scholar] [CrossRef] [PubMed]
- Holben, B.N.; Tanré, D.; Smirnov, A.; Eck, T.F.; Slutsker, I.; Abuhassan, N. An emerging ground-based aerosol climatology: Aerosol optical depth from aeronet. J. Geophys. Res. 2001, 106, 12067–12097. [Google Scholar] [CrossRef]
- Holben, B.N.; Eck, T.F.; Slutsker, I.; Tanré, D.; Buis, J.P.; Setzer, A.; Vermote, E.; Reagan, J.A.; Kaufman, Y.J.; Nakajima, T.; et al. Aeronet—A federated instrument network and data archive for aerosol characterization. Remote Sens. Environ. 1998, 66, 1–16. [Google Scholar] [CrossRef]
- Deng, X.; Shi, C.; Wu, B.; Chen, Z.; Nie, S.; He, D.; Zhang, H. Analysis of aerosol characteristics and their relationships with meteorological parameters over anhui province in china. Atmos. Res. 2012, 109–110, 52–63. [Google Scholar] [CrossRef]
- Xu, J.; Jiang, H.; Zhang, X.; Lu, X.; Peng, W. Study on spatial–temporal variation of aerosol optical depth over the yangtze delta and the impact of land–use/cover. Int. J. Remote Sens. 2014, 35, 1741–1755. [Google Scholar] [CrossRef]
- Liu, X.; Chen, Q.; Che, H.; Zhang, R.; Gui, K.; Zhang, H.; Zhao, T. Spatial distribution and temporal variation of aerosol optical depth in the Sichuan Basin, China, the recent ten years. Atmos. Environ. 2016, 147, 434–445. [Google Scholar] [CrossRef]
- Boiyo, R.; Kumar, K.R.; Zhao, T. Statistical intercomparison and validation of multisensory aerosol optical depth retrievals over three aeronet sites in Kenya, East Africa. Atmos. Res. 2017, 197, 277–288. [Google Scholar] [CrossRef]
- De Meij, A.; Pozzer, A.; Lelieveld, J. Global and regional trends in aerosol optical depth based on remote sensing products and pollutant emission estimates between 2000 and 2009. Atmos. Chem. Phys. Discuss. 2010, 10, 30731–30776. [Google Scholar] [CrossRef]
- He, Q.; Zhang, M.; Huang, B. Spatio-temporal variation and impact factors analysis of satellite-based aerosol optical depth over China from 2002 to 2015. Atmos. Environ. 2016, 129, 79–90. [Google Scholar] [CrossRef]
- Acharya, P.; Sreekesh, S. Seasonal variability in aerosol optical depth over India: A spatio–temporal analysis using the modis aerosol product. Int. J. Remote Sens. 2013, 34, 4832–4849. [Google Scholar] [CrossRef]
- Luo, Y.; Zheng, X.; Zhao, T.; Chen, J. A climatology of aerosol optical depth over China from recent 10 years of MODIS remote sensing data. Ecol. Environ. Sci. 2014, 34, 863–870. [Google Scholar] [CrossRef]
- Guo, J.-P.; Zhang, X.-Y.; Wu, Y.-R.; Zhaxi, Y.; Che, H.-Z.; La, B.; Wang, W.; Li, X.-W. Spatio-temporal variation trends of satellite–based aerosol optical depth in China during 1980–2008. Atmos. Environ. 2011, 45, 6802–6811. [Google Scholar] [CrossRef]
- Bao, Z.; Zhu, C.; Hulugalla, R.; Gu, J.; Di, G. Spatial and temporal characteristics of aerosol optical depth over East Asia and their association with wind fields. Meteorol. Appl. 2008, 15, 455–463. [Google Scholar] [CrossRef]
- Cheng, X.; Zhao, T.; Gong, S.; Xu, X.; Han, Y.; Yin, Y.; Tang, L.; He, H.; He, J. Implications of East Asian summer and winter monsoons for interannual aerosol variations over Central–Eastern China. Atmos. Environ. 2016, 129, 218–228. [Google Scholar] [CrossRef]
- Jeong, J.I.; Park, R.J. Winter monsoon variability and its impact on aerosol concentrations in East Asia. Environ. Pollut. 2017, 221, 285–292. [Google Scholar] [CrossRef] [PubMed]
- Xia, X.A.; Chen, H.; Wang, P.; Zong, X.; Qiu, J.; Philippe, G. Aerosol properties and their spatial and temporal variations over North China in spring 2001. Tellus B 2005, 57, 28–39. [Google Scholar]
- Xiao, R.; Takegawa, N.; Kondo, Y.; Miyazaki, Y.; Miyakawa, T.; Hu, M.; Shao, M.; Zeng, L.M.; Hofzumahaus, A.; Holland, F.; et al. Formation of submicron sulfate and organic aerosols in the outflow from the urban region of the Pearl River Delta in China. Atmos. Environ. 2009, 43, 3754–3763. [Google Scholar] [CrossRef]
- He, Q.; Li, C.; Tang, X.; Li, H.; Geng, F.; Wu, Y. Validation of modis derived aerosol optical depth over the Yangtze River Delta in China. Remote Sens. Environ. 2010, 114, 1649–1661. [Google Scholar] [CrossRef]
- Guo, Y.; Hong, S.; Feng, N.; Zhuang, Y.; Zhang, L. Spatial distributions and temporal variations of atmospheric aerosols and the affecting factors: A case study for a region in Central China. Int. J. Remote Sens. 2012, 33, 3672–3692. [Google Scholar] [CrossRef]
- Li, Y.; Liu, C.; Ma, Q.; Li, Y.; Ji, C.; Song, Q.; Liu, K. Long temporal analysis of aerosol optical depth from 3 km modis aerosol products over Xuzhou area in China. In Proceedings of the 2016 IEEE International Geoscience and Remote Sensing Symposium (IGARSS), Beijing, China, 10–15 July 2016; pp. 5741–5744. [Google Scholar]
- Wu, L.; Lv, X.; Qin, K.; Bai, Y.; Li, J.; Ren, C.; Zhang, Y. Analysis to Xuzhou aerosol optical characteristics with ground–based measurements by sun photometer. Chin. Sci. Bull. 2016, 61, 2287–2298. (In Chinese) [Google Scholar]
- Levy, R.C.; Mattoo, S.; Munchak, L.A.; Remer, L.A.; Sayer, A.M.; Hsu, N.C. The Collection 6 MODIS aerosol products over land and ocean. Atmos. Meas. Tech. Discuss. 2013, 6, 159–259. [Google Scholar] [CrossRef]
- Smirnov, A.; Holben, B.N.; Eck, T.F.; Dubovik, O.; Slutsker, I. Cloud screening and quality control algorithms for the aeronet database. Remote Sens. Environ. 2000, 73, 337–349. [Google Scholar] [CrossRef]
- Zhao, H.; Che, H.; Zhang, X.; Ma, Y.; Wang, Y.; Wang, X.; Liu, C.; Hou, B.; Che, H. Aerosol optical properties over urban and industrial region of northeast China by using ground–based sun–photometer measurement. Atmos. Environ. 2013, 75, 270–278. [Google Scholar] [CrossRef]
- Wei, J.; Sun, L. Comparison and evaluation of different modis aerosol optical depth products over the Beijing–Tianjin–Hebei region in China. IEEE J. Sel. Top. Appl. Earth Obs. Remote Sens. 2017, 10, 835–844. [Google Scholar] [CrossRef]
- Eck, T.F.; Holben, B.N.; Reid, J.S.; Dubovik, O.; Smirnov, A.; O'Neill, N.T.; Slutsker, I.; Kinne, S. Wavelength dependence of the optical depth of biomass burning, urban, and desert dust aerosols. J. Geophys. Res. Atmos. 1999, 104, 31333–31349. [Google Scholar] [CrossRef]
- Zhonghe, Z.; Zengrang, X.; Shengkui, C.; Chunxia, L.; Gaohuan, L. Analysis on dynamic of carbon storage in Tibet attributable to land use and land cover change. J. Nat. Resour. 2016, 31, 755–766. [Google Scholar]
- Zhuang, H.; Savage, E.M. Variation and pearson correlation coefficients of warner–bratzler shear force measurements within broiler breast fillets. Poult. Sci. 2009, 88, 214–220. [Google Scholar] [CrossRef] [PubMed]
- SPSS (Statistical Product and Service Solutions) Tutorials: Pearson Correlation. Available online: https://libguides.library.kent.edu/SPSS/PearsonCorr (accessed on 4 March 2018).
- Remer, L.A.; Kaufman, Y.J.; Tanre, D. The MODIS aerosol algorithm, products, and validation. J. Atmos. Sci. 2005, 62, 947–973. [Google Scholar] [CrossRef]
- Ångström, A. The parameters of atmospheric turbidity. Tellus 1964, 16, 64–75. [Google Scholar] [CrossRef]
- Zhou, C.; Liu, Q.; Tang, Y.; Wang, K.; Sun, L.; He, Y. Comparison between MODIS aerosol product C004 and C005 and evaluation of their applicability in the north of China. J. Remote Sens. 2009, 13, 854–872. [Google Scholar]
- Zhang, Z.; Ding, J.; Wang, J.; Chen, W. Observational study on salt dust aerosol optical properties using the ground–based and satellite remote sensing. J. Remote Sens. 2017. [Google Scholar] [CrossRef]
- Liu, W.; Zhang, H.-R.; Yan, D.-P.; Wang, S.-L. Adaptive surface modeling of soil properties in complex landforms. ISPRS Int. J. Geo-Inf. 2017, 6, 178. [Google Scholar] [CrossRef]
- Liang, L.; Sun, Q.; Luo, X.; Wang, J.; Zhang, L.; Deng, M.; Di, L.; Liu, Z. Long–term spatial and temporal variations of vegetative drought based on vegetation condition index in China. Ecosphere 2017, 8, 1–15. [Google Scholar] [CrossRef]
- Hong, J.; Lu, X.; Wang, L. Quantitative analysis of the factors driving evolution in the Yellow River Delta wetland in the past 40 years. Acta Ecol. Sin. 2016, 36, 924–935. (In Chinese) [Google Scholar] [CrossRef]
- Bilal, M.; Nichol, J.E. Evaluation of modis aerosol retrieval algorithms over the Beijing–Tianjin–Hebei region during low to very high pollution events. J. Geophys. Res. Atmos. 2015, 120, 7941–7957. [Google Scholar] [CrossRef]
- Wang, K.; Sun, X.; Zhou, Y.; Zhang, C. Validation of MODIS–Aqua aerosol products C051 and C006 over the Beijing–Tianjin–Hebei region. Atmosphere 2017, 8, 172. [Google Scholar] [CrossRef]
- Zhang, H.; Ye, X.; Cheng, T.; Chen, J.; Yang, X.; Wang, L.; Zhang, R. A laboratory study of agricultural crop residue combustion in China: Emission factors and emission inventory. Atmos. Environ. 2008, 42, 8432–8441. [Google Scholar] [CrossRef]
- Shi, C.; Wang, S.; Zhou, R.; Li, D.; Zhao, H.; Liu, R.; Li, Z.; Zhou, B. Aerosol optical properties during dust and biomass burning episodes retrieved from sun–photometer over Shanghai. Atmos. Meas. Tech. Discuss. 2013, 6, 11011–11054. [Google Scholar] [CrossRef]
- Wang, S.; Li, G.; Gong, Z.; Du, L.; Zhou, Q.; Meng, X.; Xie, S.; Zhou, L. Spatial distribution, seasonal variation and regionalization of PM2.5 concentrations in China. Sci. China Chem. 2015, 58, 1435–1443. [Google Scholar] [CrossRef]
- Wang, M.; Cao, C.; Li, G.; Singh, R.P. Analysis of a severe prolonged regional haze episode in the Yangtze River Delta, China. Atmos. Environ. 2015, 102, 112–121. [Google Scholar] [CrossRef]
- Qin, K.; Wu, L.; Wong, M.S.; Letu, H.; Hu, M.; Lang, H.; Sheng, S.; Teng, J.; Xiao, X.; Yuan, L. Trans–boundary aerosol transport during a winter haze episode in china revealed by ground–based lidar and CALIPSO satellite. Atmos. Environ. 2016, 141, 20–29. [Google Scholar] [CrossRef]
- Qu, L.; Luo, H.; Chen, J. The adjustment of industrial structure guided by the goal of improving the function of region. Econ. Geogr. 2015, 35, 116–122. (In Chinese) [Google Scholar]
- Zhao, B.; Jiang, J.H.; Gu, Y.; Diner, D.; Worden, J.; Liou, K.-N.; Su, H.; Xing, J.; Garay, M.; Huang, L. Decadal–scale trends in regional aerosol particle properties and their linkage to emission changes. Environ. Res. Lett. 2017, 12, 054021. [Google Scholar] [CrossRef]
- Sun, H.; Pan, Z.; Liu, X. Numerical simulation of spatial–temporal distribution of dust aerosol and its direct radiative effects on East Asian climate. J. Geophys. Res. Atmos. 2012, 117. [Google Scholar] [CrossRef]
- Chen, Z.; Liu, J.; Tao, W.; Tao, S. Spatiotemporal distribution and source attribution of SOA in China. Environ. Sci. 2016, 37, 2815–2822. (In Chinese) [Google Scholar]
- Liu, X.; Yan, L.; Yang, P.; Yin, Z.-Y.; North, G.R. Influence of indian summer monsoon on aerosol loading in East Asia. J. Appl. Meteorol. Climatol. 2011, 50, 523–533. [Google Scholar] [CrossRef]
- Remote Sensing Monitoring for Fire Points of Straw Burning from the Ministry of Environmental Protection of the People’s Republic of China. Available online: http://hjj.mep.gov.cn/jgjs/ (accessed on 4 March 2018).
- Lijuan, Z.; Qing, L.; Hui, C.; Huiqin, M.; Chunyan, Z. Analysis and comparison of straw burning based on remote sensing monitoring data during summer and autumn harvest season from 2014 to 2015 in China. Environ. Sustain. Dev. 2016, 6, 61–65. [Google Scholar]
- Xin, H.; Yachun, L.; Mingming, Z.; Xiaoping, X.; Yifang, R.; Lan, Z. Study on the spatial and temporal distribution of AOD in Jiangsu province influenced by straw burning based on satellite remote sensing. Ecol. Environ. Sci. 2017, 1, 111–118. [Google Scholar]
- Graham, M.H. Confronting multicollinearity in ecological multiple regression. Ecology 2003, 8, 2809–2815. [Google Scholar] [CrossRef]
- Ma, S.; Chai, J.; Jiao, K.; Ma, L.; Zhu, S.; Wu, K. Environmental influence and countermeasures for high humidity flue gas discharging from power plants. Renew. Sustain. Energy Rev. 2017, 73, 225–235. [Google Scholar]
- Hamed, A.; Korhonen, H.; Sihto, S.-L.; Joutsensaari, J.; Järvinen, H.; Petäjä, T.; Arnold, F.; Nieminen, T.; Kulmala, M.; Smith, J.N.; et al. The role of relative humidity in continental new particle formation. J. Geophys. Res. 2011, 116. [Google Scholar] [CrossRef]
- Tijjani, B.I.; Aliyu, A.; Sha’aibu, F. The effect of relative humidity on continental average aerosols. Open J. Appl. Sci. 2014, 4, 399–423. [Google Scholar] [CrossRef]
- Yoon, S.; Kim, J. Influences of relative humidity on aerosol optical properties and aerosol radiative forcing during ACE–Asia. Atmos. Environ. 2006, 40, 4328–4338. [Google Scholar] [CrossRef]


| Site | Lat/Lon | Data Quality | Number of Matched Data | Time Period |
|---|---|---|---|---|
| Xuzhou | 34.22° N/117.14° E | Level 1.5 | 110 | 28 June 2013–31 December 2016 |
| Shouxian | 32.56° N/116.78° E | Level 2.0 | 26 | 10 May 2008–28 December 2008 |
| Year Period | Spring | Summer | Autumn | Winter |
|---|---|---|---|---|
| 2000–2011 | 0.79 | 3.26 | 1.61 | 1.44 |
| 2012–2016 | −1.55 | −6.17 | −2.39 | −7.23 |
| 2000–2016 | 0.39 | 0.56 | 0.73 | 0.78 |
© 2018 by the authors. Licensee MDPI, Basel, Switzerland. This article is an open access article distributed under the terms and conditions of the Creative Commons Attribution (CC BY) license (http://creativecommons.org/licenses/by/4.0/).
Share and Cite
Shen, Y.; Zhang, L.; Fang, X.; Zhao, Z.; Li, X.; Wang, J.; Chai, Q. Long-Term Analysis of Aerosol Optical Depth over the Huaihai Economic Region (HER): Possible Causes and Implications. Atmosphere 2018, 9, 93. https://doi.org/10.3390/atmos9030093
Shen Y, Zhang L, Fang X, Zhao Z, Li X, Wang J, Chai Q. Long-Term Analysis of Aerosol Optical Depth over the Huaihai Economic Region (HER): Possible Causes and Implications. Atmosphere. 2018; 9(3):93. https://doi.org/10.3390/atmos9030093
Chicago/Turabian StyleShen, Yang, Lianpeng Zhang, Xing Fang, Zhuowen Zhao, Xing Li, Jiahui Wang, and Qi Chai. 2018. "Long-Term Analysis of Aerosol Optical Depth over the Huaihai Economic Region (HER): Possible Causes and Implications" Atmosphere 9, no. 3: 93. https://doi.org/10.3390/atmos9030093