Long-Term Rainfall Trends over the Tanzania Coast


Department of Geography and Environmental Sciences, North West University, Mmabatho 2745, South Africa
Atmosphere 2018, 9(4), 155; https://doi.org/10.3390/atmos9040155
Submission received: 28 February 2018
/
Revised: 30 March 2018
/
Accepted: 4 April 2018
/
Published: 20 April 2018
(This article belongs to the Special Issue Precipitation Variability and Change in Africa)
Abstract
:Spatial and temporal rainfall trends over the Tanzanian coast are analysed and trends for over 50 years are investigated. This type of study is crucial at this time because the area under study is now one of the world’s economic hotspots, as major gas fields have been discovered and the area also has high potential for oil field discoveries. Methods applied in this study include the Mann-Kendall test for rainfall data to detect the long-term trends, while Sen’s slope estimator test was used for finding the magnitude of change over time. The results exhibited rainfall trend patterns with substantial variations between the stations. The Z value of the Mann-Kendall test showed various months with negative trend at a significance level ≥95%. The few months that showed a positive trend were not statistically significant. Generally, rainfall trends varied in different months for different stations. However, the most outstanding observation on individual months is July, which showed a highly statistically significant (99.9%) reduction in rainfall for the whole coastal area, including the regions of Mtwara, Dar es Salaam and Tanga. The last part of this paper describes the relationship between July rainfall and the horizontal winds from the National Centre for Environmental Prediction/National Centre for Atmospheric Research (NCEP/NCAR) re-analysis. It is observed that the strength of the anticyclonic flow over the southwest Indian Ocean, which is associated with the westward fluxes of moisture, is responsible for rainfall over the whole coastal area of Tanzania during July.
1. Introduction
In this study, more than 50 years of rainfall data are considered in an effort to determine spatio-temporal trends in Tanzania’s coastal rainfall. This type of study is crucial at this time because the area under study is now an area of significant activities (hotspot) globally, as major gas fields have been discovered and the area has potential for oil field discoveries. Population and agricultural production are also expected to increase. Accordingly, Tanzania’s economy is projected to start accelerating at the rate of nearly 15% annually within the next 12 years, following a massive offshore discovery of natural gas in the country, as explained by Moyo et al. [1]. Currently, about 85% of all economic activity in Tanzania depends on the climate-driven agricultural sector [2]. In all the areas under this study, cashews are the main cash crop, where production is located mainly in Mtwara, which is along the south coast and produces 70% of the national total output, Pwani, which includes Dar es Salaam in the central coast (8%) and Tanga in the north (1%) [3]. However, this sector is troubled by rainfall variability and climate uncertainty will increase with the hydrocarbon discoveries. Tanzania is projecting itself to become a middle-income economy by 2025, and this comes with improvements and growth in industries, manufacturing, consumer goods and agriculture. These developments will form part of a global trend towards increasing the energy in the atmosphere and altering the climate of the area that includes the area rainfall.
Rainfall variability in Tanzania has received considerable attention from previous studies, including [3,4,5,6,7] among others. Trend detection in climate time series is one of the interesting research areas in climatology in recent years, as observed by Zarenistanak et al. [8]. Spatial- and temporal-scale rainfall trend analysis is of great concern since the past century, because of the increased attention given to global climate change by the scientific community [9,10]. Trend analysis of precipitation series research has also gained substantial attention lately [11,12,13,14,15,16,17]. In Tanzania, a long-range trend analysis was performed by Nyenzi et al. in 1997 [18], which is now a decade and half ago. Since then, many economic developments have taken place in the coastal regions of Tanzania, which provide merit to study the rainfall trends of recent years before the anticipated large-scale industrial endeavour takes place. The country is gearing up to become a middle-income economy as noted by Moyo et al. [1], and water resources—and therefore climate knowledge—will be essential for this economic development. This study analyses rainfall time series data at a monthly scale over the Tanzania Coast from the 1950s to 2011, in order to detect potential trends and assess their significance.
2. Data and Methods
2.1. Description of the Study Area
Tanzania has 1424 km of coastline, including islands. The mainland coastline extends from the Tanga region in the north to Mtwara in the south. This paper uses rainfall data from the Tanga Tanga, Dar es Salaam and Mtwara meteorological stations (Figure 1). Tanga and Dar es Salaam are found in a bimodal rainfall zone, with ‘long’ rains centred on March to May (MAM) known in Tanzania as Masika rains, and ‘short’ rains in October to December (OND) known as Vuli rains [2,19]. Mtwara is in a unimodal rainfall zone, with a single maximum in October–April [20]. The rain seasons, i.e., Masika and Vuli, are associated with the northward and southward movements of the Intertropical Convergence Zone (ITCZ), respectively. Much of the coastal region of Tanzania is of relatively low relief and altitude (≤100 m) such that at the medium and large spatial scales topographic influences on rainfall generation are relatively less important than other local and larger-scale atmospheric factors [5].
2.2. Rainfall Data
The data required to undertake this study of trend analysis over coastal Tanzania were actual monthly rainfall amount data spanning approximately 58 years. Data were obtained for the period 1953–2011 for Tanga, Mtwara and Dar es Salaam from the Tanzania Meteorological Agency (TMA). From any station, there is no month where rainfall was not recorded (Figure 2). According to Gamoyo et al. [19], there is a statistically-significant correlation between stations and variability of rainfall except for Mtwara, which is not significantly correlated with the others. This observation is in agreement with [6] in that the Mtwara region exhibits different rainfall variability to elsewhere in coastal Tanzania.
Some rainfall stations had gaps, which were filled using the long-term mean. All acquired data were subjected to a 5-year moving average (Figure 3) in order to filter out climatic forces such as the El Niño southern Oscillation (ENSO), and since it is roughly half the solar cycle it tends to average out sunspot effects that irregularly influence the area’s rainfall [2]. Thereafter, the trends were computed for the approximately 58-year period of monthly rainfall for each station.
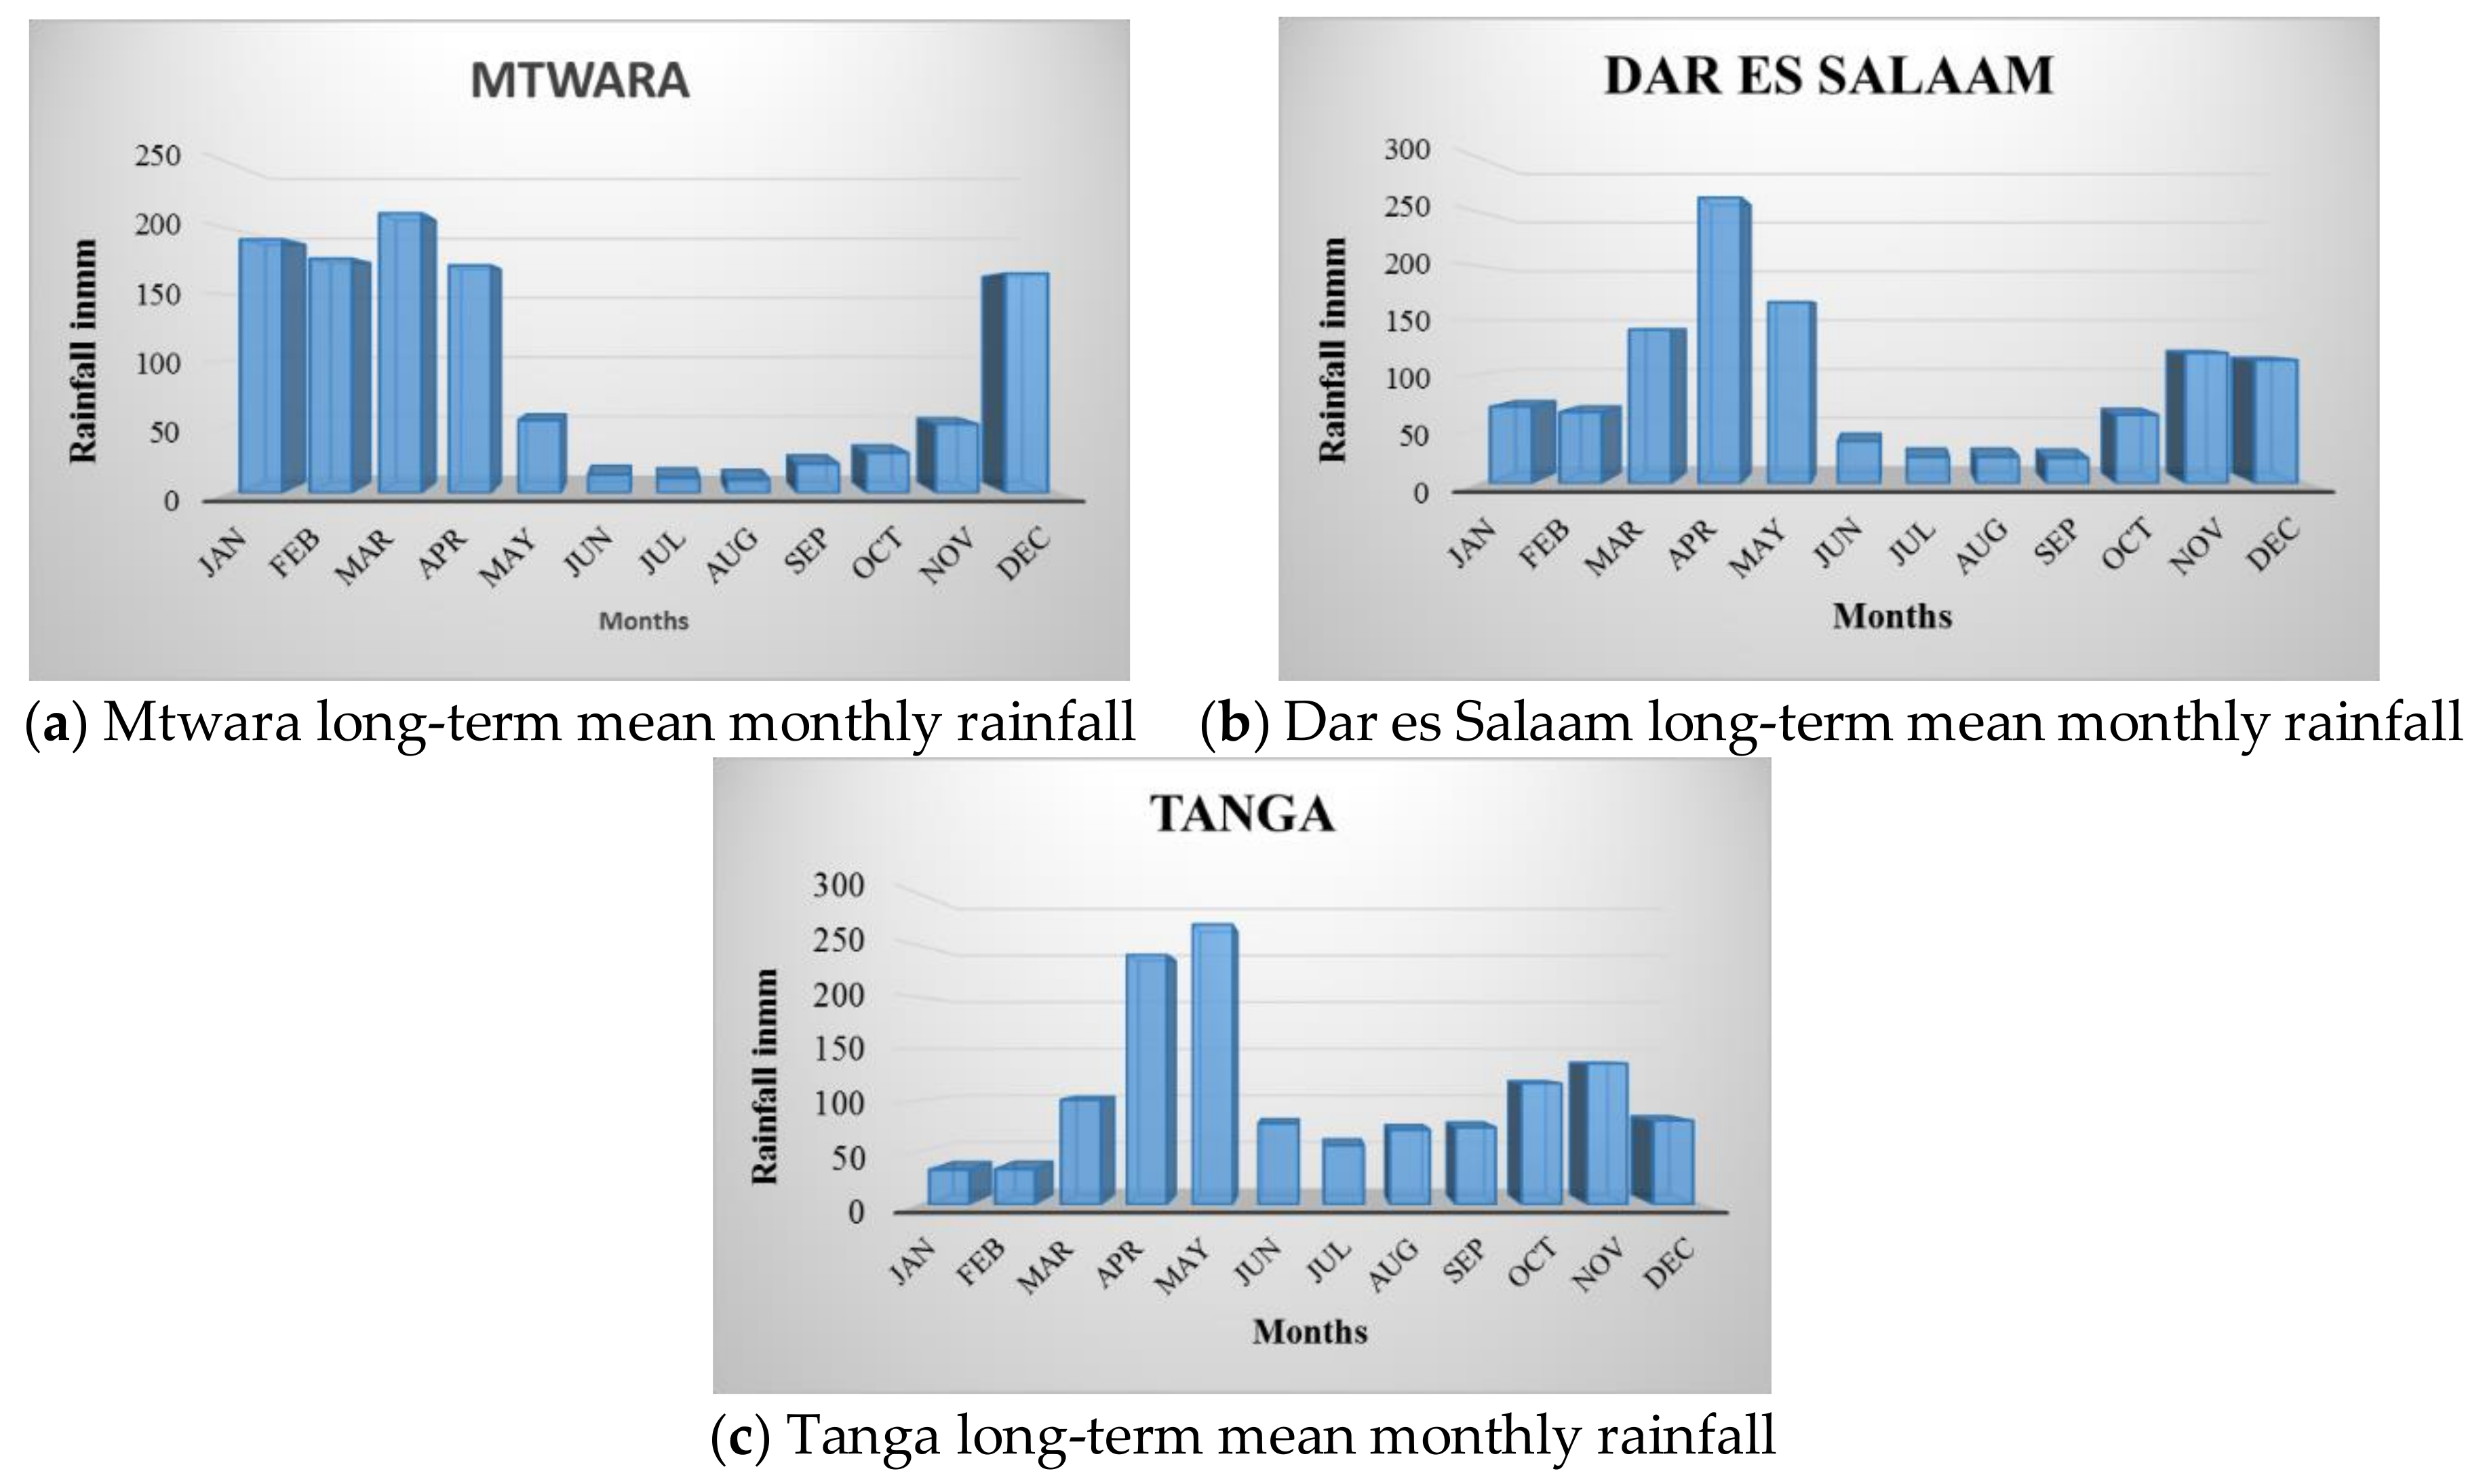
It is evident from Figure 2 that the main rainfall season experienced in Mtwara commences in November and ends in May the following year (unimodal). Dar es Salaam shows distinct bimodal rains, with one mode centred on April and the other on November. Tanga rainfall depicts a quasi-bimodal rainfall pattern, since the rainy season covers most of the year, but with maxima in May and November.
2.3. Reanalysis Products
The US National Centres for Environmental Prediction (NCEP) reanalysis developed by Kalnay et al. [21] is used to establish relationships between significant monthly rainfall in the study area and the corresponding large-scale mean atmospheric circulation. This was accomplished by exploring the time-varying horizontal vector winds that feature during the months that showed a significant rainfall trend (see Section 3.3).
2.4. Techniques for Trend Detection
A non-parametric test is used in this study for studying the spatial variation and temporal trends of monthly rainfall. It is more useful for consideration as it can evade the problem brought by data skew [22]. The Mann-Kendall test was adopted in this study since it is preferred when, according to Hirch et al. [23], more than one station is tested in a single study. It also has a parameter that is of importance to trend detection. This parameter is the significance level that indicates the trend’s strength [24]. Sen’s estimator [25] is used to estimate the direction and magnitude of the trend.
2.4.1. The Mann-Kendall Test
The Mann-Kendall trend analysis is a non-parametric statistical technique that is used to detect monotonic trends in a time series. Partal and Kahya [12] described Mann-Kendall analysis as a well-known statistical method that is effective in the detection of trends in hydrology and climatology studies. In the current study, the Mann-Kendall trend analysis was carried out based on an Excel template MAKESENS application that was developed by Salmi et al. [26] for detecting and estimating trends in the time series of the annual values of atmospheric and precipitation concentrations.
In the computation of the Mann-Kendall trend analysis, the data values are evaluated as an ordered time series. Each data value is compared to all subsequent data values. The initial value of the Mann-Kendall statistic, S, is assumed to be zero (i.e., no trend). If a data value from a later period is higher than a data value from an earlier time, S is incremented by one. On the other hand, if the data value from a later period is lower than a data value sampled earlier, S is decremented by one. The net result of all such increments and decrements yields the final value of S.
The Mann-Kendall trend analysis is performed based on two methods, that is, the S statistics or the normal approximation (Z statistics). The choice of the method is determined by the number of annual values in the analysis, which is represented by n. If n is less than 10, the S statistical test is used, and if n is 10 or more, then the Z statistic is used. The current analysis involved more than 10 annual values, therefore the Z statistic was used.
The Mann-Kendall statistic (S) is given by the formula:
where tp is the number of data values in the pth group.
The values of S and VAR(S), i.e., the number of test statistics, are as follows:
The existence of significance in the time series is determined based on the Z value. An increasing trend is indicated by a positive Z value and a decreasing trend is indicated by a negative Z value.
2.4.2. The Sen’s Estimator of Slope
Climatic data fluctuate and deviate from a normal distribution and exhibit a marked right skewness [27], partly due to the influence of natural phenomena, and do not follow a normal distribution. Hence, the Sen’s slope estimator, which is a nonparametric method, was used to develop the linear models in this study. It is used to estimate the true slope of an existing linear trend as change over time.
The data values of a time series are assumed to obey the model:
where represents the increasing or decreasing trend and (residuals) are assumed to be from the same distribution with a mean of zero.
A true slope of the observed trend is given by:
where Q is the slope and B is a constant.
In order to get a slope estimate of Q, the slopes of all data value pairs are first calculated as:
where j > k.
The median value is taken as the final slope of a trend [28]. During the analyses of trend through MAKESENS, the statistical computation gives a high level of significance with narrow angles between the confidence lines in cases where significant trends are observed [26]. Finally, Q is computed by a two sided test at 100 (1 − α)% confidence interval and then a true slope can be obtained.
3. Results
3.1. Moving Average Rainfall
Moving averages for the coastal rainfall stations considered are presented in Figure 3. The moving average was performed on the rainfall season of each station. In the cases of Tanga and Dar es Salaam, the two seasons, Masika (MAM) and Vuli (OND), were used. Mtwara experienced one rainfall season, and that is what was used. The moving average rainfall trend tended to decrease for Tanga (MAM), Dar es Salaam (MAM and OND) and Mtwara, while it depicted positive trend for Tanga (OND). Another important observation is that the OND season in both Tanga and Dar es Salaam revealed periodic patterns in the plot. This observation suggests that the effect of ENSO obscured the oscillatory effect on Vuli rainfall in the coastal area of Tanzania. This effect was absent in MAM for the two stations and Mtwara rainfall station.
3.2. Monthly Rainfall Trends
In Mtwara (Table 1), January and February rainfall trends were decreasing and statistically significant at 99% and 95%, respectively. January showed a decreasing slope at a rate of 1.29 mm/year while February was decreasing at 0.84 mm/year. On the other hand, the March rainfall trend was increasing, with a Sen’s Slope estimate of 0.955 mm/year, and was statistically significant at 99% level of confidence. The Sen’s slope estimate was −0.901 mm/year in April and statistically significant. A highly significant (α = 0.001) decreasing trend (Z = −3.81) was found in July, with a Sen’s slope estimate of −0.142 mm/year, probably reflecting the south-westerly flow along the east African coast during the Asian Monsoon [2]. They observed that during the dry season, increased trade winds occurred near Mauritius, which enhances westerly anomalies that restrict moisture incursion inland, rendering Mtwara dry. Rainfall trends for September and December were falling and statistically significant (95%) with a slope of −0.198 and −1.096, respectively.
According to Table 2 (Dar es Salaam), the January rainfall trend was statistically significant at 99% with a Sen’s slope estimate of −0.586. Other months (February, November and December) showed insignificant falling trends. A highly statistically significant trend was observed in July, with a Sen’s slope estimate of −0.419 (significant at the 99.9% level). March, May and October rainfall had an insignificant upward trend with slopes 0.410, 0.074 and 0.177 mm/year, respectively. However, April rainfall showed a decreasing trend, which was statistically significant at 90%, while the June rainfall trend—also statistically significant at 90%—was increasing with a Sen’s slope estimate of 0.263 mm/year. Generally, months with a decreasing rainfall trend are many compared with increasing trends, regardless of significance level.
Table 3 lists the Mann-Kendall trend and Sen’s slope values for the monthly rainfall time series for Tanga. Non-significant positive rainfall trends were exhibited in January, February, June, October and December, while negative trends were observed in April, August and November. March and May rainfall showed significant (90%) falling trends with Sen’s slope estimates of 0.443 and 0.926 mm/year, respectively. July and September were observed to have strong negative trend results, which are highly statistically significant (significant at the 99.9% level), depicting negative Sen’s slope estimates of 0.518 and 0.956 mm/year, respectively.
The outstanding observation in this study is that Mann-Kendal test shows a very highly statistically significant (significant at the 99.9% level) decline in the July rainfall, which is reported in all the coastal stations (Mtwara, Dar es Salaam and Tanga). July rainfall is reducing at a rate of 0.14, 0.42 and 0.52 mm/year, respectively, for Mtwara, Dar es Salaam, and Tanga stations. In addition, September showed a significant decline at a level of 0.05 for Mtwara and Dar es Salaam, while Tanga’s decline was at a highly significant level of 0.001. In each station, there are rising rates of rainfall in some months and decreasing trends in other months. Generally, the monthly rising rates of rainfall in all the stations show insignificant changes except March rainfall in Mtwara Station (Z = 2.83), which is 99% significant. July is a relatively dry month and is not studied as much as other months in the calendar year in East Africa. Nevertheless, July rainfall is crucial for major agricultural products—most importantly cashew nuts—in these coastal areas.
According to Martin et al. [29], the dry season in the southern coastal areas in Tanzania starts in June and lasts until November. The cashews reach their main vegetative flush at the start of the dry season and this is then followed by flowering, most of which occurs between July and September.
They also observed that the northern coastal cashew areas have a bimodal rainfall distribution, with rainy seasons from October to December and March to May, and mostly have an annual rainfall in excess of 1000 mm. In the northern sector, (Tanga) cashew flowering occurs about a month later than in the south, and there is considerably more out-of-season flowering because of the bimodal rainfall variability in the area.
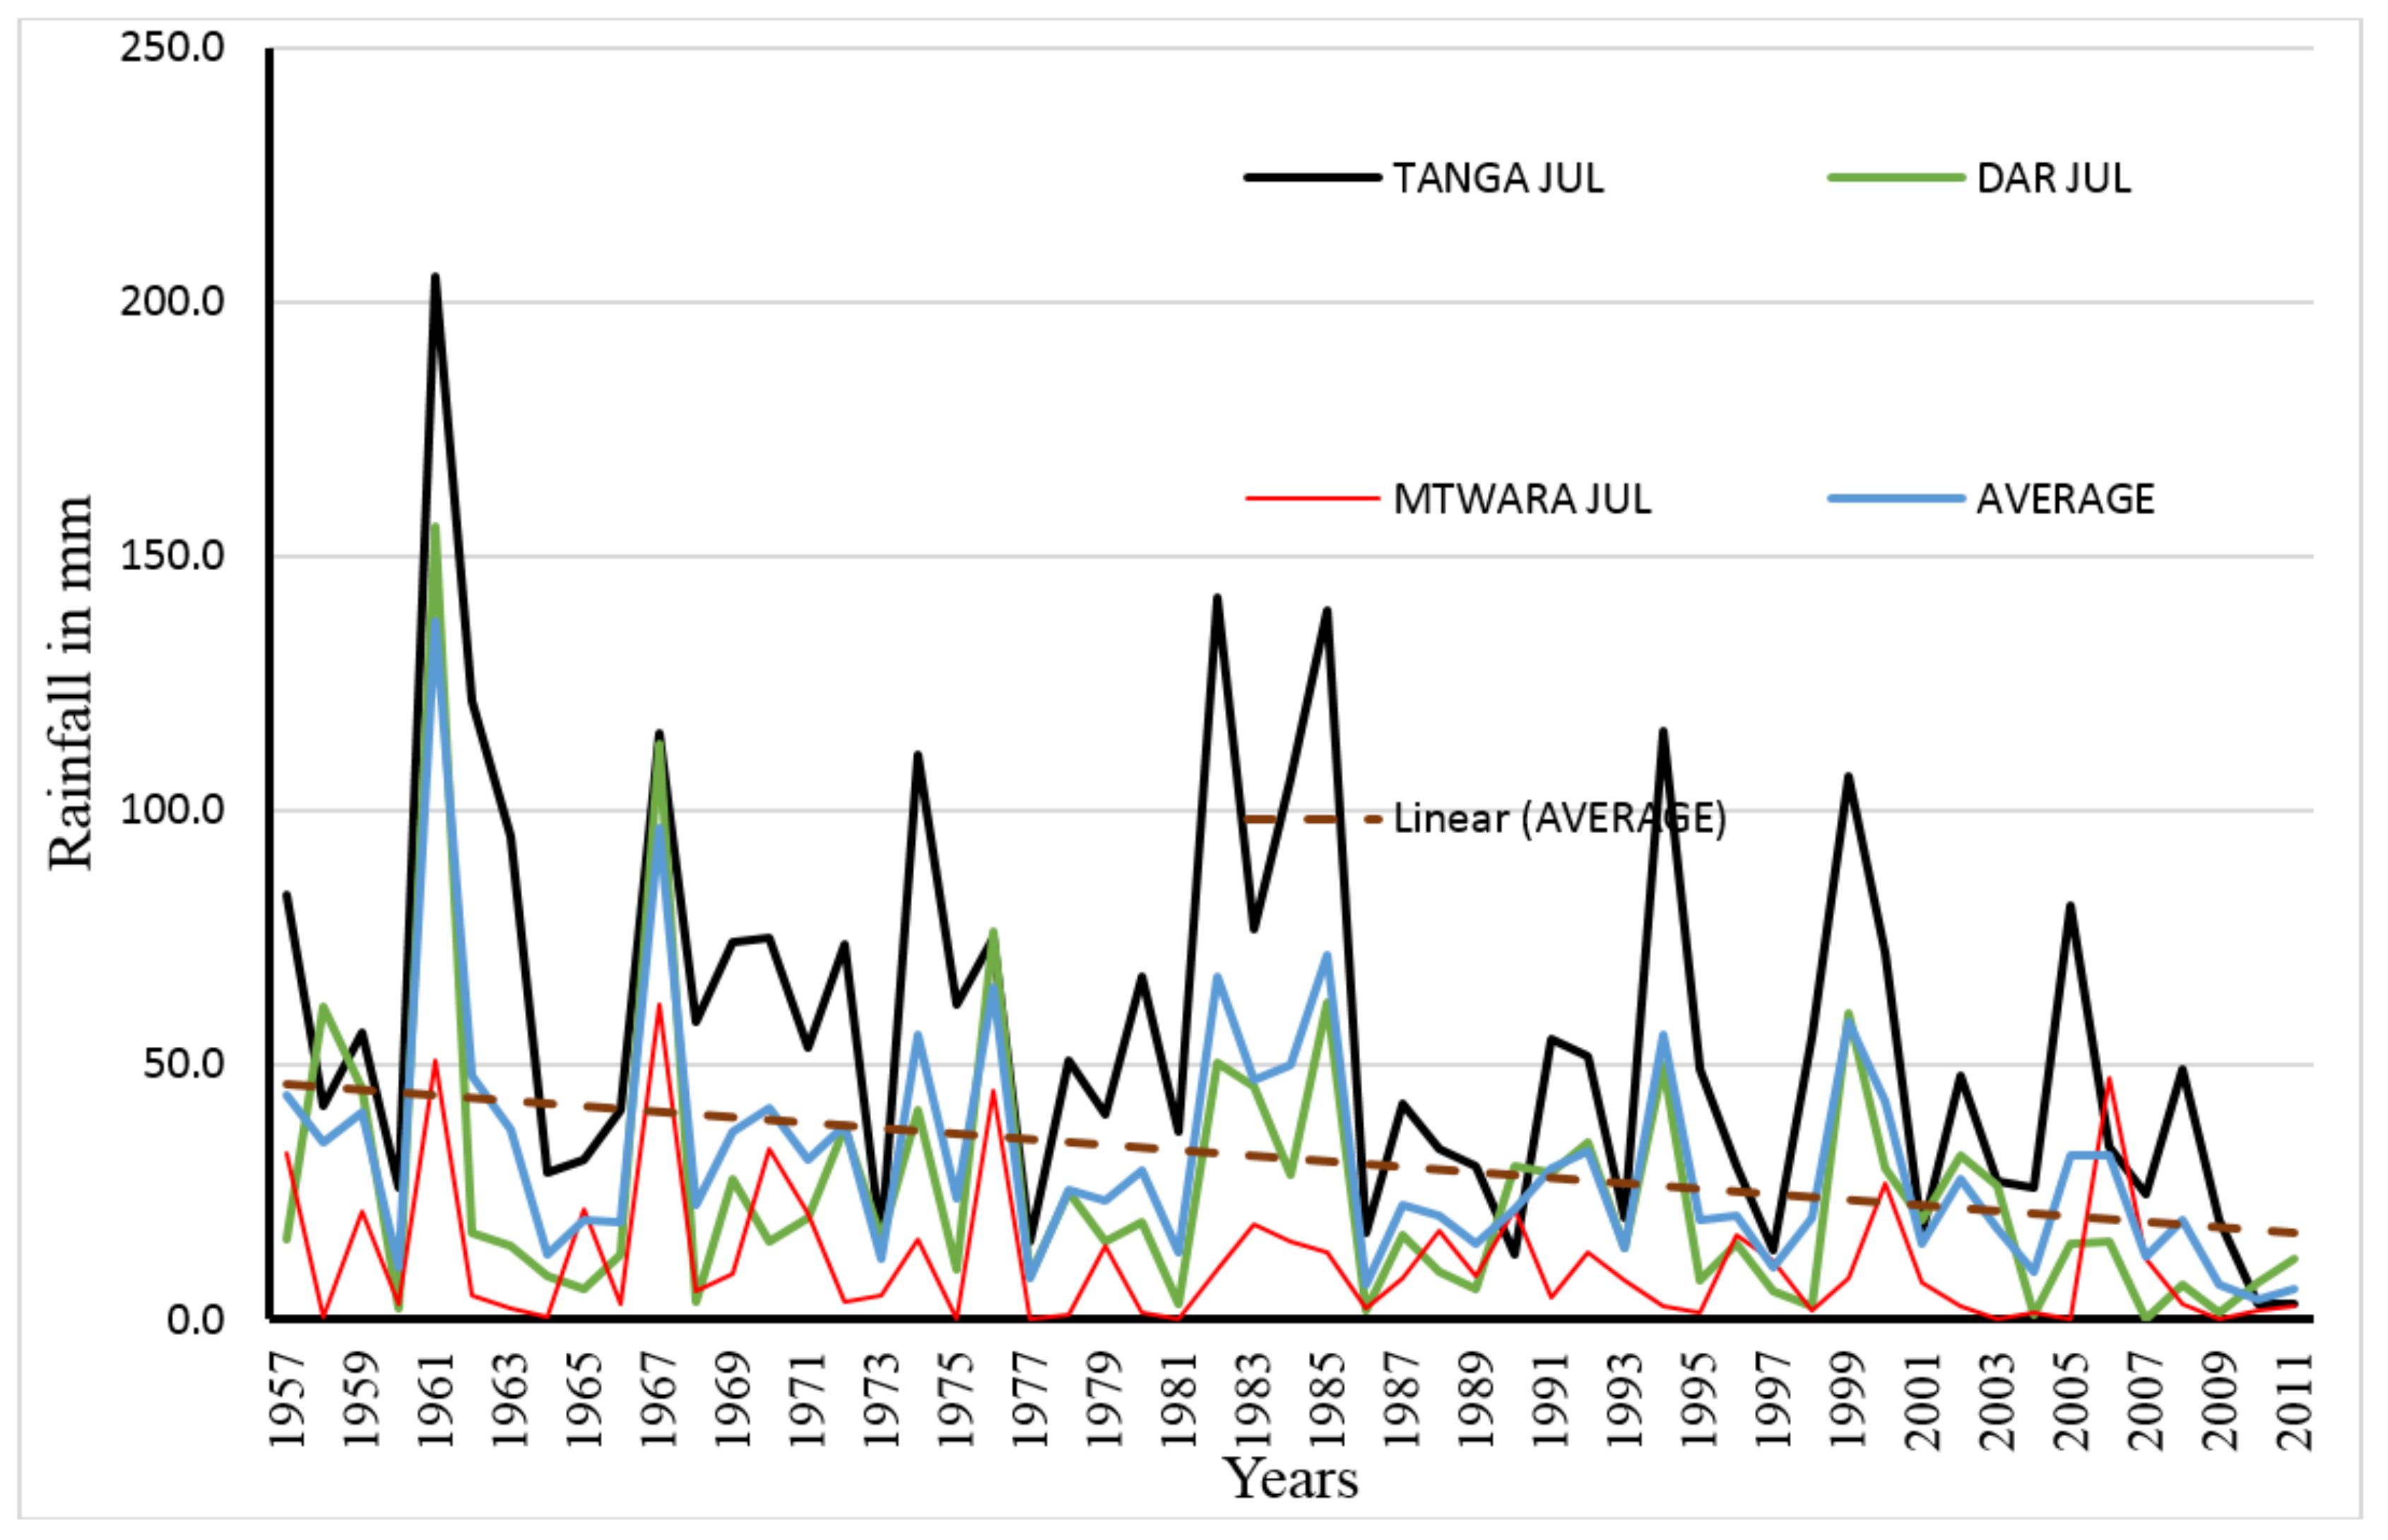
3.3. July Rainfall Pattern
As explained earlier, there is no month in the coastal region that is completely devoid of rainfall. July is the driest month but still has some rainfall. In Figure 4, the average rainfall pattern and its linear trend are based on the composited (average) data obtained from the three stations. The average rainfall pattern for the three stations overlap the Dar es Salaam station rainfall, which is coincidentally halfway between the other two coastal stations. Tanga in the north experiences relatively higher rainfall during July, while the Mtwara station reports the lowest rainfall in July. The coastal July rainfall decreased from the average of nearly 50 mm in the late fifties to <20 mm in 2000s. The anomalously wet July was experienced in 1961, the second wettest in 1982, and July in 2009 was the driest month. The linear trend of the average July rainfall decreases from 1957 to 2011.
3.4. Relations between Vector Wind and July Rainfall
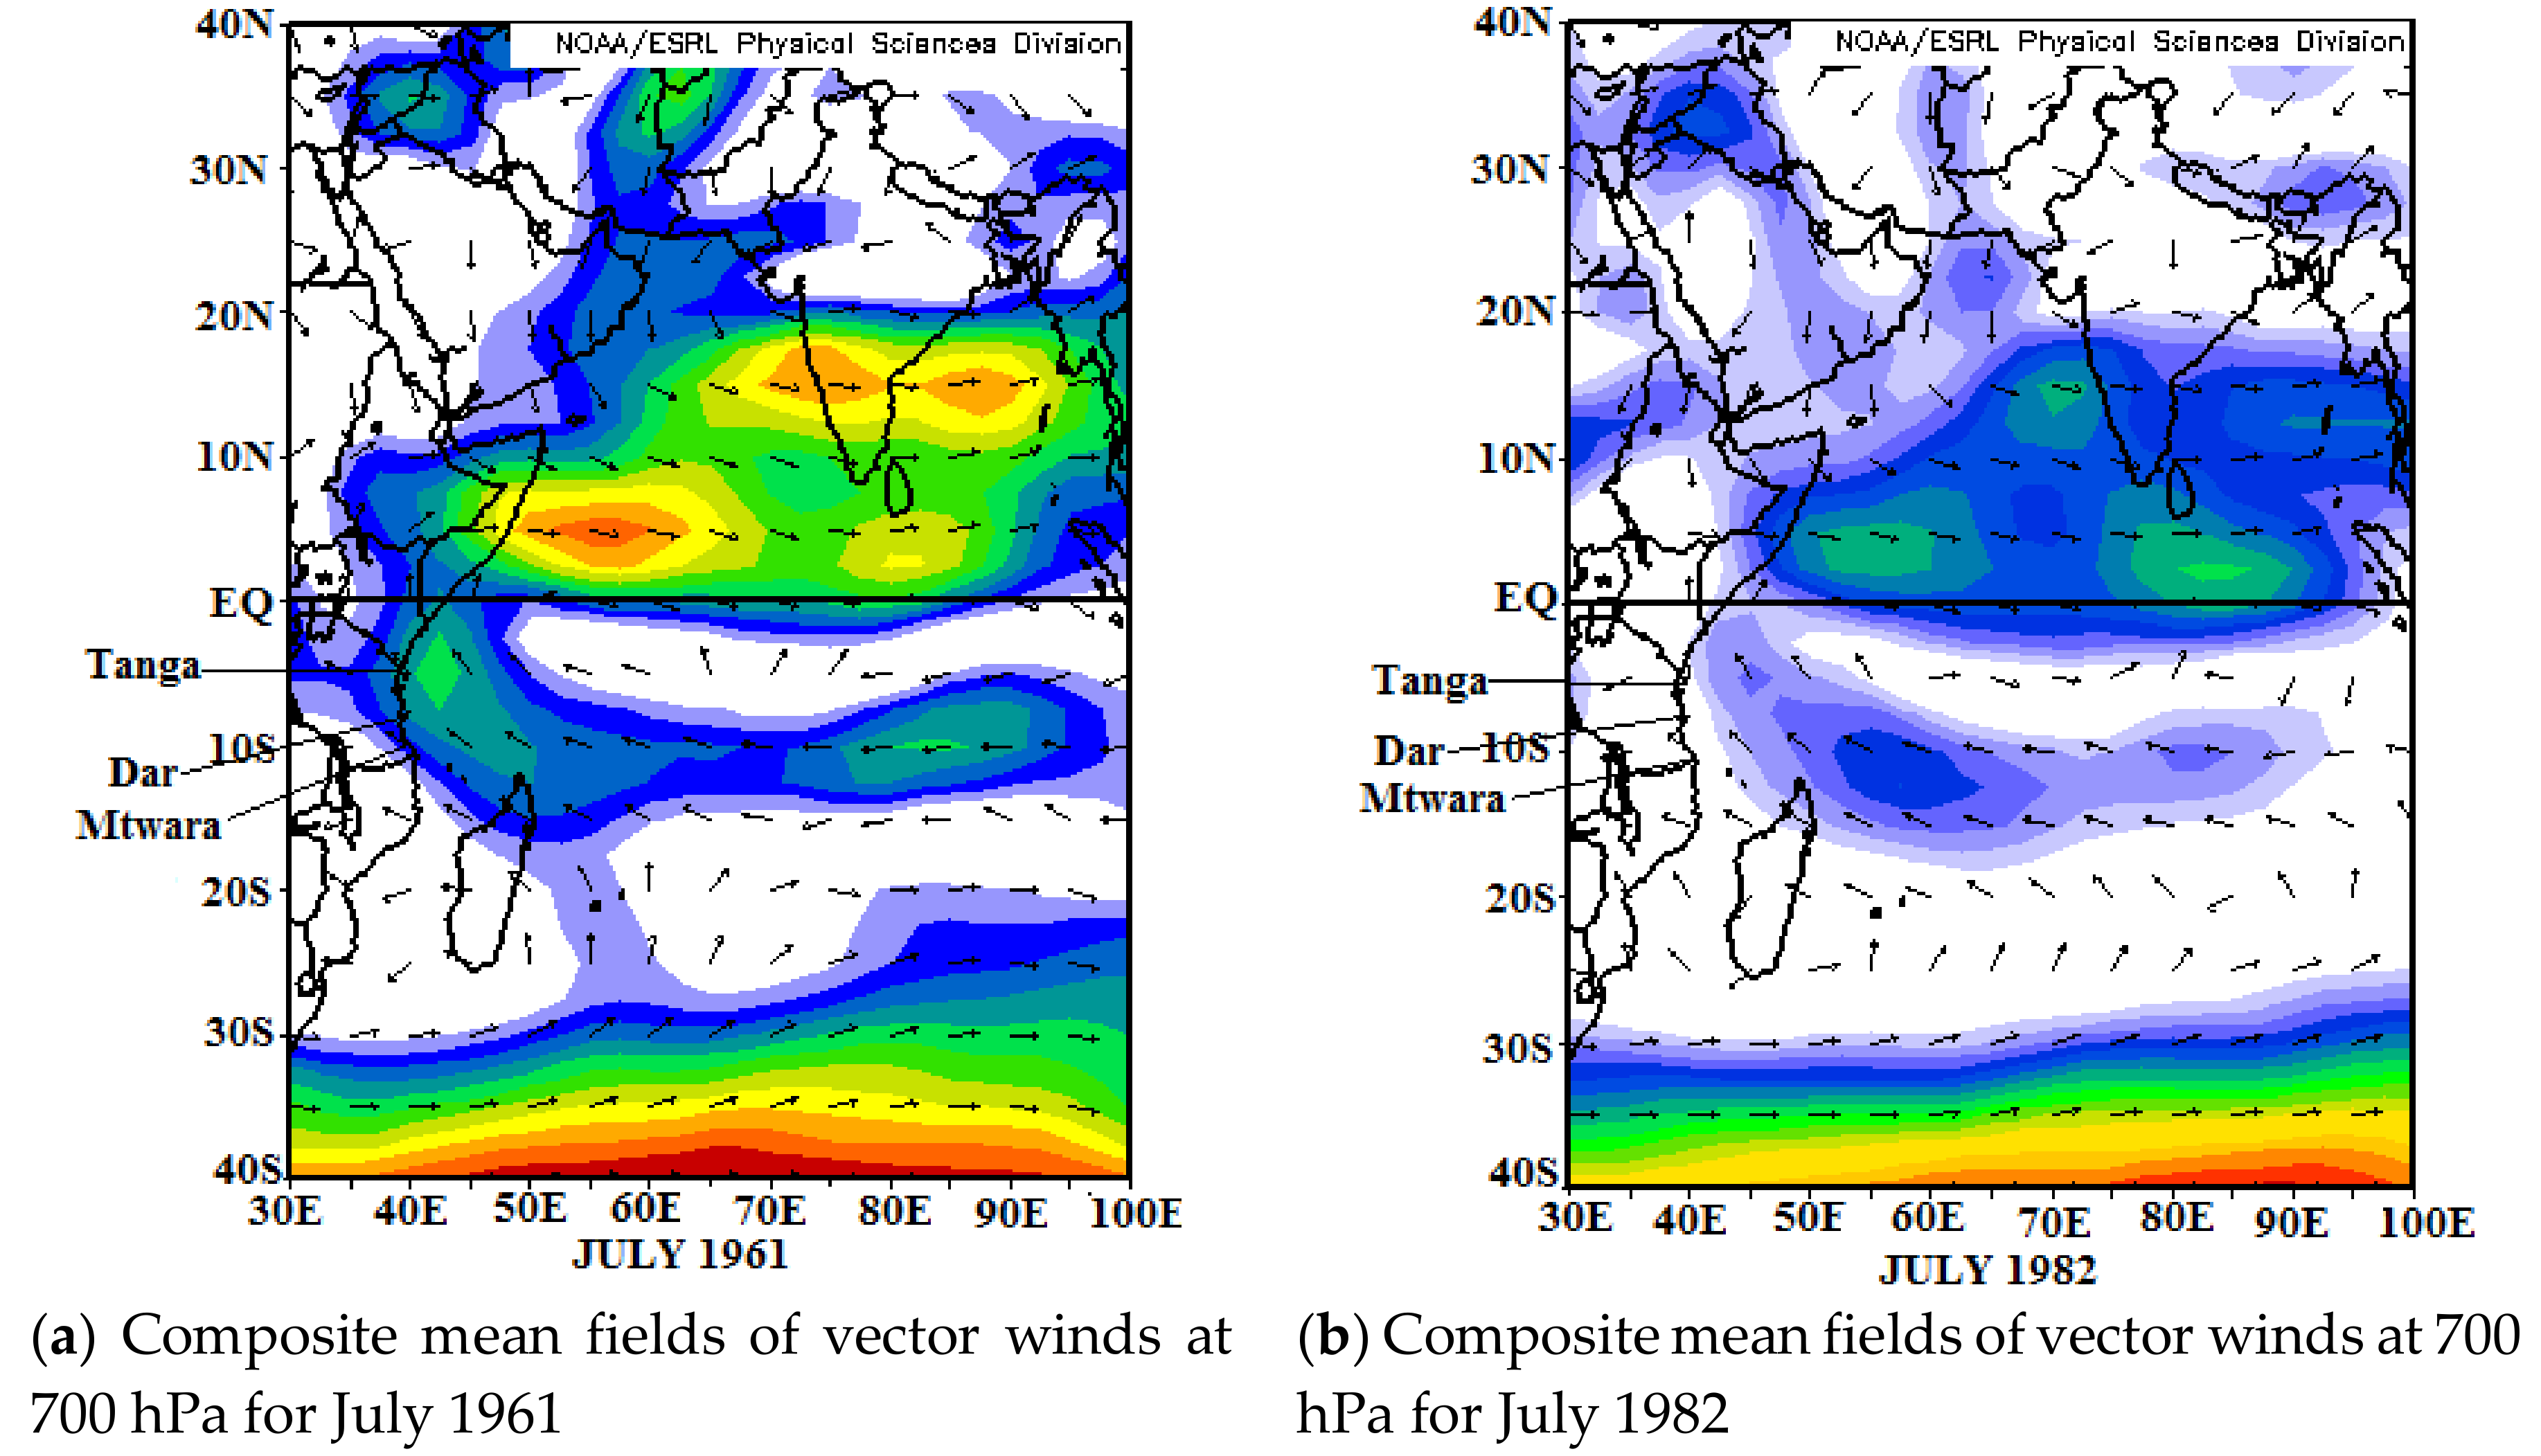
The 700 hPa level—at which moisture is a key element in the tropics—is an important link between regional water vapour transport and water vapour content [30,31]. Therefore, the dynamics of the circulation at the 700 hPa level are important in enhancing or suppressing rainfall as suggested by Hewitson et al. [32]. In this study, composite mean fields of vector winds at 700 hPa for the two wettest July months (1961 and 1982) and one of the driest July months (2009) were subjected to re-analysis.
The July 1961 vector winds of 700 hPa in Figure 5 illustrate a strong flow >10 m/s to the coast of Tanzania as part of the anticyclonic flow through Madagascar. The northern Tanzanian coast was occupied by the flow curvature as the winds changed from south-easterly to south-westerly, indicating that the moisture from the Indian Ocean reached the coastal stations under study before exiting through cross-equatorial flow.
On the other hand, July 1982 experienced a weak divergent flow over the Tanzanian coast and the flow curvature was well over the Somali coast, limiting moisture incursion inland. However, the weak anticyclonic flow centred over Madagascar propelled the flow from the Indian Ocean to the coast.
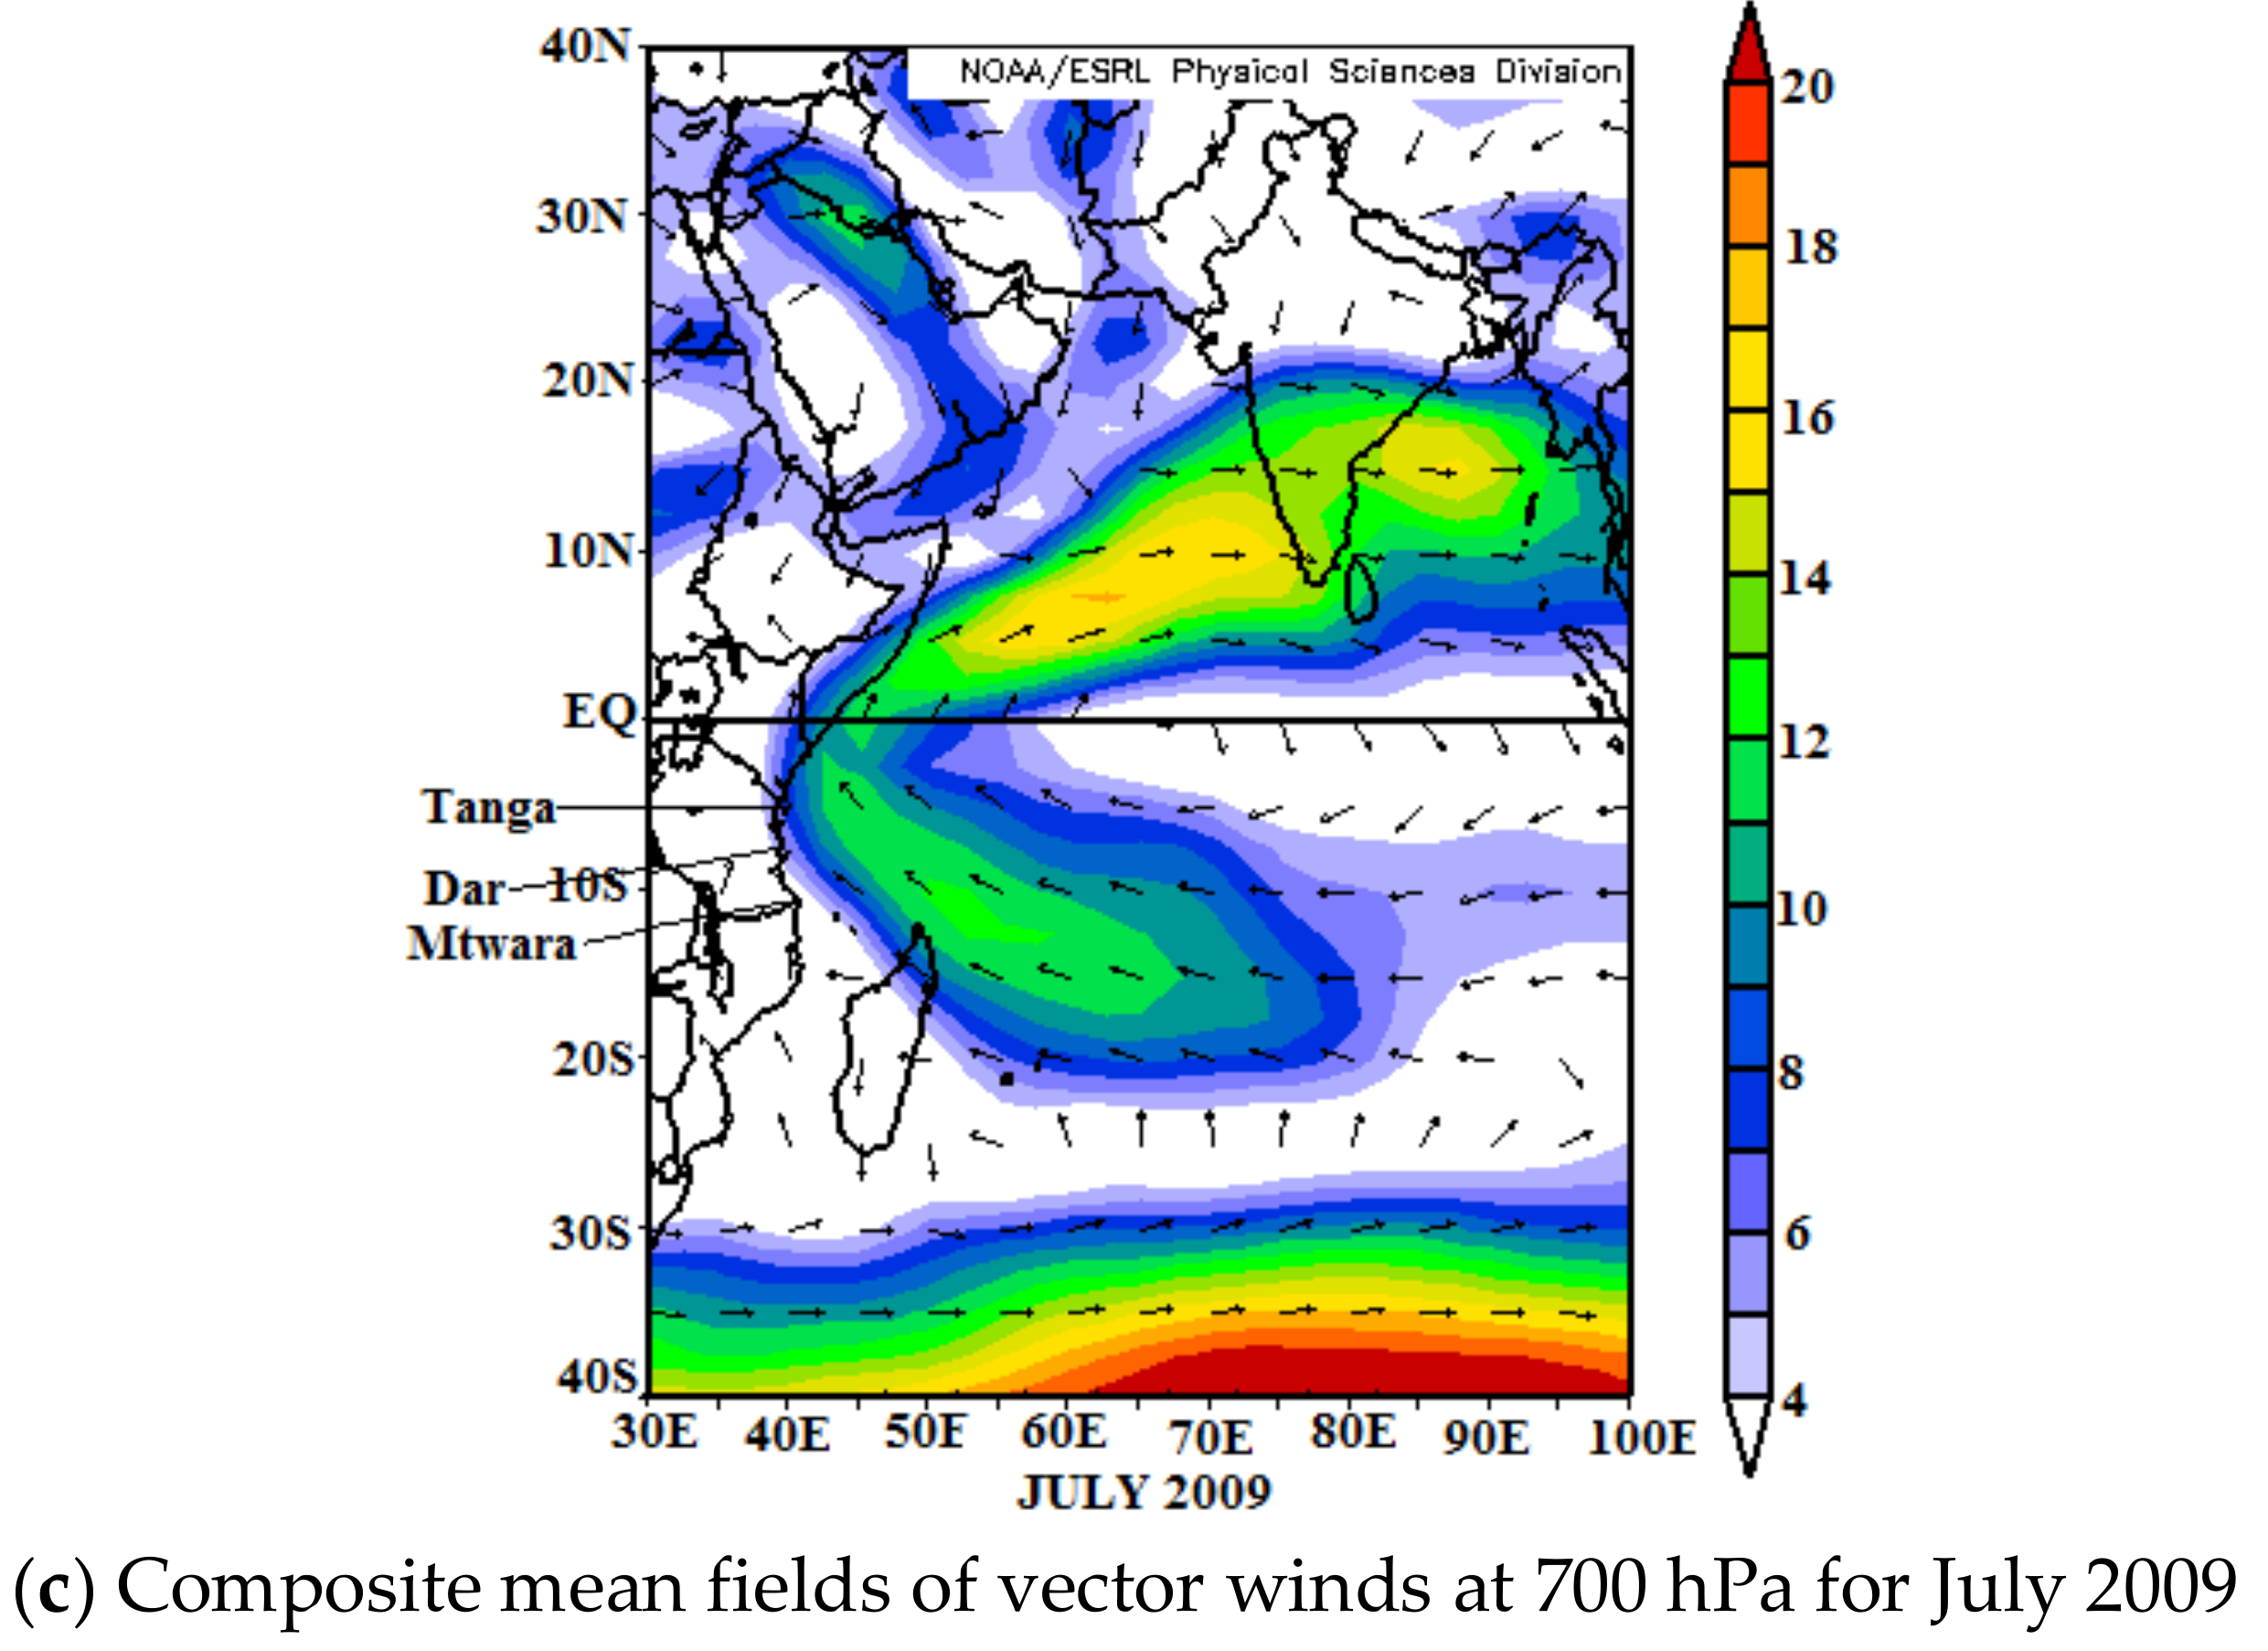
In July 2009, a strong cross-equatorial (southeast/southwest) flow was discernible offshore with a curvature near the Kenya/Somalia border. This is the well-known northern summer cross-equatorial monsoon current [33]. As it strengthens, it deprives the Tanzanian coastal areas of moisture. Meanwhile the anticyclonic flow over Madagascar was inexplicit.
4. Discussion and Summary
Economic development in the coastal area of Tanzania depends mainly on the climate-driven agricultural sector, where cashew nuts are the main cash crop. In the northern coastal area, the rainfall distribution is bimodal, with one season centred on April and the other on November. The southern rainfall is unimodal, starting in November and ending in May of the following year. This paper has focused on the coastal rainfall characteristics (variability and trend) and their relationship with the corresponding large-scale mean atmospheric circulation, and in this case with the horizontal air flow in the Southwest Indian Ocean.
The rainfall trend patterns showed substantial variations between the stations. The Z value of the Mann-Kendall test showed various months with negative trends at significance levels ≥95%. The few months that showed positive trends were not statistically significant. Generally, rainfall trends varied in different months for different stations, which is evident in Table 1, Table 2 and Table 3. Sen’s slope was also indicating decreasing amounts of rainfall in most of the months with significance levels ≥95%. July stands out as having a highly statistically significant declining rainfall trend for the whole coastal area, from Mtwara in the south to Tanga in the north. Although July is not a comparatively rainy month, its rainfall performance is crucial to the agricultural activities in the study area, which depends greatly on cashew production, which is the main cash crop. For example, the main vegetative flush and flowering of cashews begins in July and continues to September according to Martin et al. [30]. For July, the reduction of rainfall is marching from the south coast to north coast. For example, from Mtwara through Dar es Salaam to Tanga, rainfall reduction is 0.14 mm/year, 0.42 mm/year and 0.52 mm/year, respectively.
Further analysis was performed on the mean horizontal air flow of 700 hPa in the southwest Indian Ocean for the wettest July months and one of the driest, the anomalously rainy July of 1961, the second-wettest July in 1982 and one of the driest July months in 2009. The mean horizontal air flow patterns for the anomalously wet July (1961) demonstrate the presence of a strengthened anticyclonic flow over the southwest Indian Ocean, which can be associated with strong westward fluxes of moisture that sustained rainfall over the whole coastal area of Tanzania. During that time, the flow curvature was situated further inland from the Tanzanian coast. In 1982, the flow curvature was offshore, thus creating a weak divergence flow along the coast that supported little moisture inland. On the other hand, the July 2009 flow pattern indicates the curvature was over the coast of Kenya and Somalia, thus leaving the Tanzanian coast dry.
The results offer statistical guidance on monthly rainfall trends along the coastal regions, and dynamical insights are also gained to improve our knowledge of the relationship between large-scale circulations and monthly rainfall. While this study has improved our understanding of rainfall characteristics over the Tanzanian coast, similar research work could be done to better understand the temperature and other climatological parameters prior to the envisaged time of the country becoming a middle-income economy by 2025.
Conflicts of Interest
The author declares no conflict of interest.
References
- Moyo, M.; Simson, R.; Jacob, A.; de Mevius, F. Attaining Middle Income Statu—Tanzania Growth and structural transformation required to reach middle income status by 2025. In Proceedings of the Dar es Salaam, International Growth Centre, Tanzania, 31 March 2012. [Google Scholar]
- Kabanda, T.A.; Jury, M.R. Inter-annual variability of short rains over northern Tanzania. Clim. Res. 1999, 13, 231–241. [Google Scholar] [CrossRef]
- Mitchell, D. Tanzania’s Cashew Sector: Constraints and Challenges in a Global Environment (English); Africa Region Working Paper Series No. 70; World Bank: Washington, DC, USA, 2004. [Google Scholar]
- Zorita, E.; Tilya, F.F. Rainfall variability in northern Tanzania in the March–May season (long rains) and its links to large-scale climate forcing. Clim. Res. 2002, 20, 31–40. [Google Scholar] [CrossRef]
- Kabanda, T.A.; Jury, M.R. Synoptic evolution of composite wet spells over northern Tanzania. Clim. Res. 2000, 15, 239–248. [Google Scholar] [CrossRef]
- Kijazi, A.L.; Reason, C.J.C. Relationships between intraseasonal rainfall variability of coastal Tanzania and ENSO. Theor. Appl. Climatol. 2005, 82, 153–176. [Google Scholar] [CrossRef]
- Mapande, A.T.; Reason, C. Interannual rainfall variability over western Tanzania. Int. J. Climatol. 2005, 25, 1355–1368. [Google Scholar] [CrossRef]
- Zarenistanak, M.; Dhorde, A.G.; Kripalani, R.H. Trend analysis and change point detection of annual and seasonal precipitation and temperature series over southwest Iran. J. Earth Syst. Sci. 2014, 123, 281–295. [Google Scholar] [CrossRef]
- Longobardi, A.; Villani, P. Trend analysis of annual and seasonal rainfall time series in the Mediterranean area. Int. J. Climatol. 2010, 30, 1538–1546. [Google Scholar] [CrossRef]
- Haigh, M.J. Sustainable management of headwater resources: The Nairobi headwater declaration (2002) and beyond. Asian J. Water Environ. Pollut. 2004, 1, 17–28. [Google Scholar]
- Mosmann, V.; Castro, A.; Fraile, R.; Dessens, J.; Sanches, J.L. Detection of statistically significant trends in the summer precipitation of mainland Spain. Atmos. Res. 2004, 70, 43–53. [Google Scholar] [CrossRef]
- Partal, T.; Kahya, E. Trend analysis in Turkish precipitation data. Hydrol. Process. 2006, 20, 2011–2026. [Google Scholar] [CrossRef]
- Smadi, M.M.; Zghoul, A. A sudden change in rainfall characteristics in Amman, Jordan during the Mid 1950’s. Am. J. Environ. Sci. 2006, 2, 84–91. [Google Scholar] [CrossRef]
- Modarres, R.; da Silva, V. Rainfall trends in arid and semi-arid regions of Iran. J. Arid Environ. 2007, 70, 344–355. [Google Scholar] [CrossRef]
- Raziei, T. Investigation of annual precipitation trends in homogeneous precipitation subdivisions of Western Iran. In Proceedings of the BALWOIS 2008, Ohrid, Macedonia, 27–31 May 2008. [Google Scholar]
- Karpouzos, D.K.; Kavalieratou, S.; Babajimopoulos, C. Trend analysis of precipitation data in Pieria Region (Greece). Eur. Water 2010, 30, 31–40. [Google Scholar]
- Nenwiini, S.C.; Kabanda, T.A. Trends and variability assessment of rainfall in Vhembe South Africa. J. Hum. Ecol. 2013, 42, 171–176. [Google Scholar] [CrossRef]
- Nyenzi, B.S.; Kavishe, M.; Tibaijuka, P.F.; Kuluretera, V.; Nassib, I.R.; Tilya, F.F. A Study on Long Range Weather Forecasting in Tanzania; Research Report No. 1/97; Directorate of Meteorology Tanzania: Dodoma, Tanzania, 1997. [Google Scholar]
- Gamoyo, M.; Reason, C.; Obura, D. Rainfall variability over the East African coast. Theor. Appl. Climatol. 2015, 120, 311–322. [Google Scholar] [CrossRef]
- Sumner, G.N. The use of correlation linkages in the assessment of daily rainfall patterns. J. Hydrol. 1983, 66, 169–181. [Google Scholar] [CrossRef]
- Kalnay, E.; Kanamitsu, M.; Kistler, R.; Collins, W.; Deaven, D.; Gandin, L.; Iredell, M.; Saha, S.; White, G.; Woollen, J.; et al. The NCEP/NCAR 40-year Reanalysis Project. Bull. Am. Meteor. Soc. 1996, 77, 437–471. [Google Scholar] [CrossRef]
- Smith, L. Trends in Russian Arctic river-ice formation and breakup. Phys. Geogr. 2000, 20, 46–56. [Google Scholar]
- Hirsch, R.M.; Alexander, R.B.; Smith, R.A. Selection of methods for the detection and estimation of trends in water quality. Water Resour. Res. 1991, 27, 803–813. [Google Scholar] [CrossRef]
- Burn, D.H.; Hag Elnur, M.A. Detection of hydrologic trends and variability. J. Hydrol. 2002, 255, 107–122. [Google Scholar] [CrossRef]
- Sen, P.K. Estimates of the Regression Coefficient Based on Kendall’s Tau. J. Am. Stat. Assoc. 1968, 63, 1379–1389. [Google Scholar] [CrossRef]
- Salmi, T.; Maatta, A.; Anttila, P.; Ruoho-Airola, T.; Amnell, T. Detecting Trends of Annual Values of Atmospheric Pollutants by the Mann–Kendall Test and Sen’s Slope Estimates-the Excel Template Application Makesens. In Air Quality No. 31; Finnish Meteorological Institute: Helsinki, Finland, 2002. [Google Scholar]
- Refat Nasher, N.M.; Uddin, M.N. Maximum and minimum temperature trends variation over northern and southern part of Bangladesh. J. Environ. Sci. Nat. Res. 2013, 6, 83–88. [Google Scholar]
- Sirois, A. A Brief and Biased Overview of Time Series Analysis or How to Find that Evasive Trend. In WMO Report No. 133: WMO/EMEP Workshop on Advanced Statistical Methods and Their Application to Air Quality Data Sets, Helsinki, Finland, 14–18 September 1998; WMO: Geneva, Switzerland, 1998. [Google Scholar]
- Martin, P.J.; Topper, C.P.; Bashiru, R.A.; Boma, F.; de Waal, D.; Harries, H.C.; Kasuga, L.J.; Katanila, N.; Kikoka, L.P.; Lamboll, R.; et al. Cashew nut production in Tanzania: Constraints and progress through integrated crop management. Crop Prot. 1997, 16, 5–14. [Google Scholar] [CrossRef]
- Makarau, A. Intra-Seasonal Oscillatory Modes of the Southern Africa Summer Circulation. Ph.D. Thesis, University of Cape Town, Kapstadt, South Africa, 1995. [Google Scholar]
- D’Abreton, P.C.; Tyson, P.O. Three-dimensional kinematic modelling of water vapour transport over southern Africa. Water SA 1996, 22, 297–306. [Google Scholar]
- Hewitson, B.C.; Tennant, W.; Walawege, R. Atmospheric Moisture Transport and Sources for Southern Africa; WRC Report No. 1012/1/04; Water Research Commission: Pretoria, South Africa, 2004. [Google Scholar]
- Kiangi, P.M.R. The Weather systems affecting eastern-southern Africa. In Seminar on Tropical Meteorology; WMO/TD-No. 277; WMO: Geneva, Switzerland, 1989. [Google Scholar]
Figure 1.
Map of the study area, illustrating the coastal Tanzanian rainfall stations.
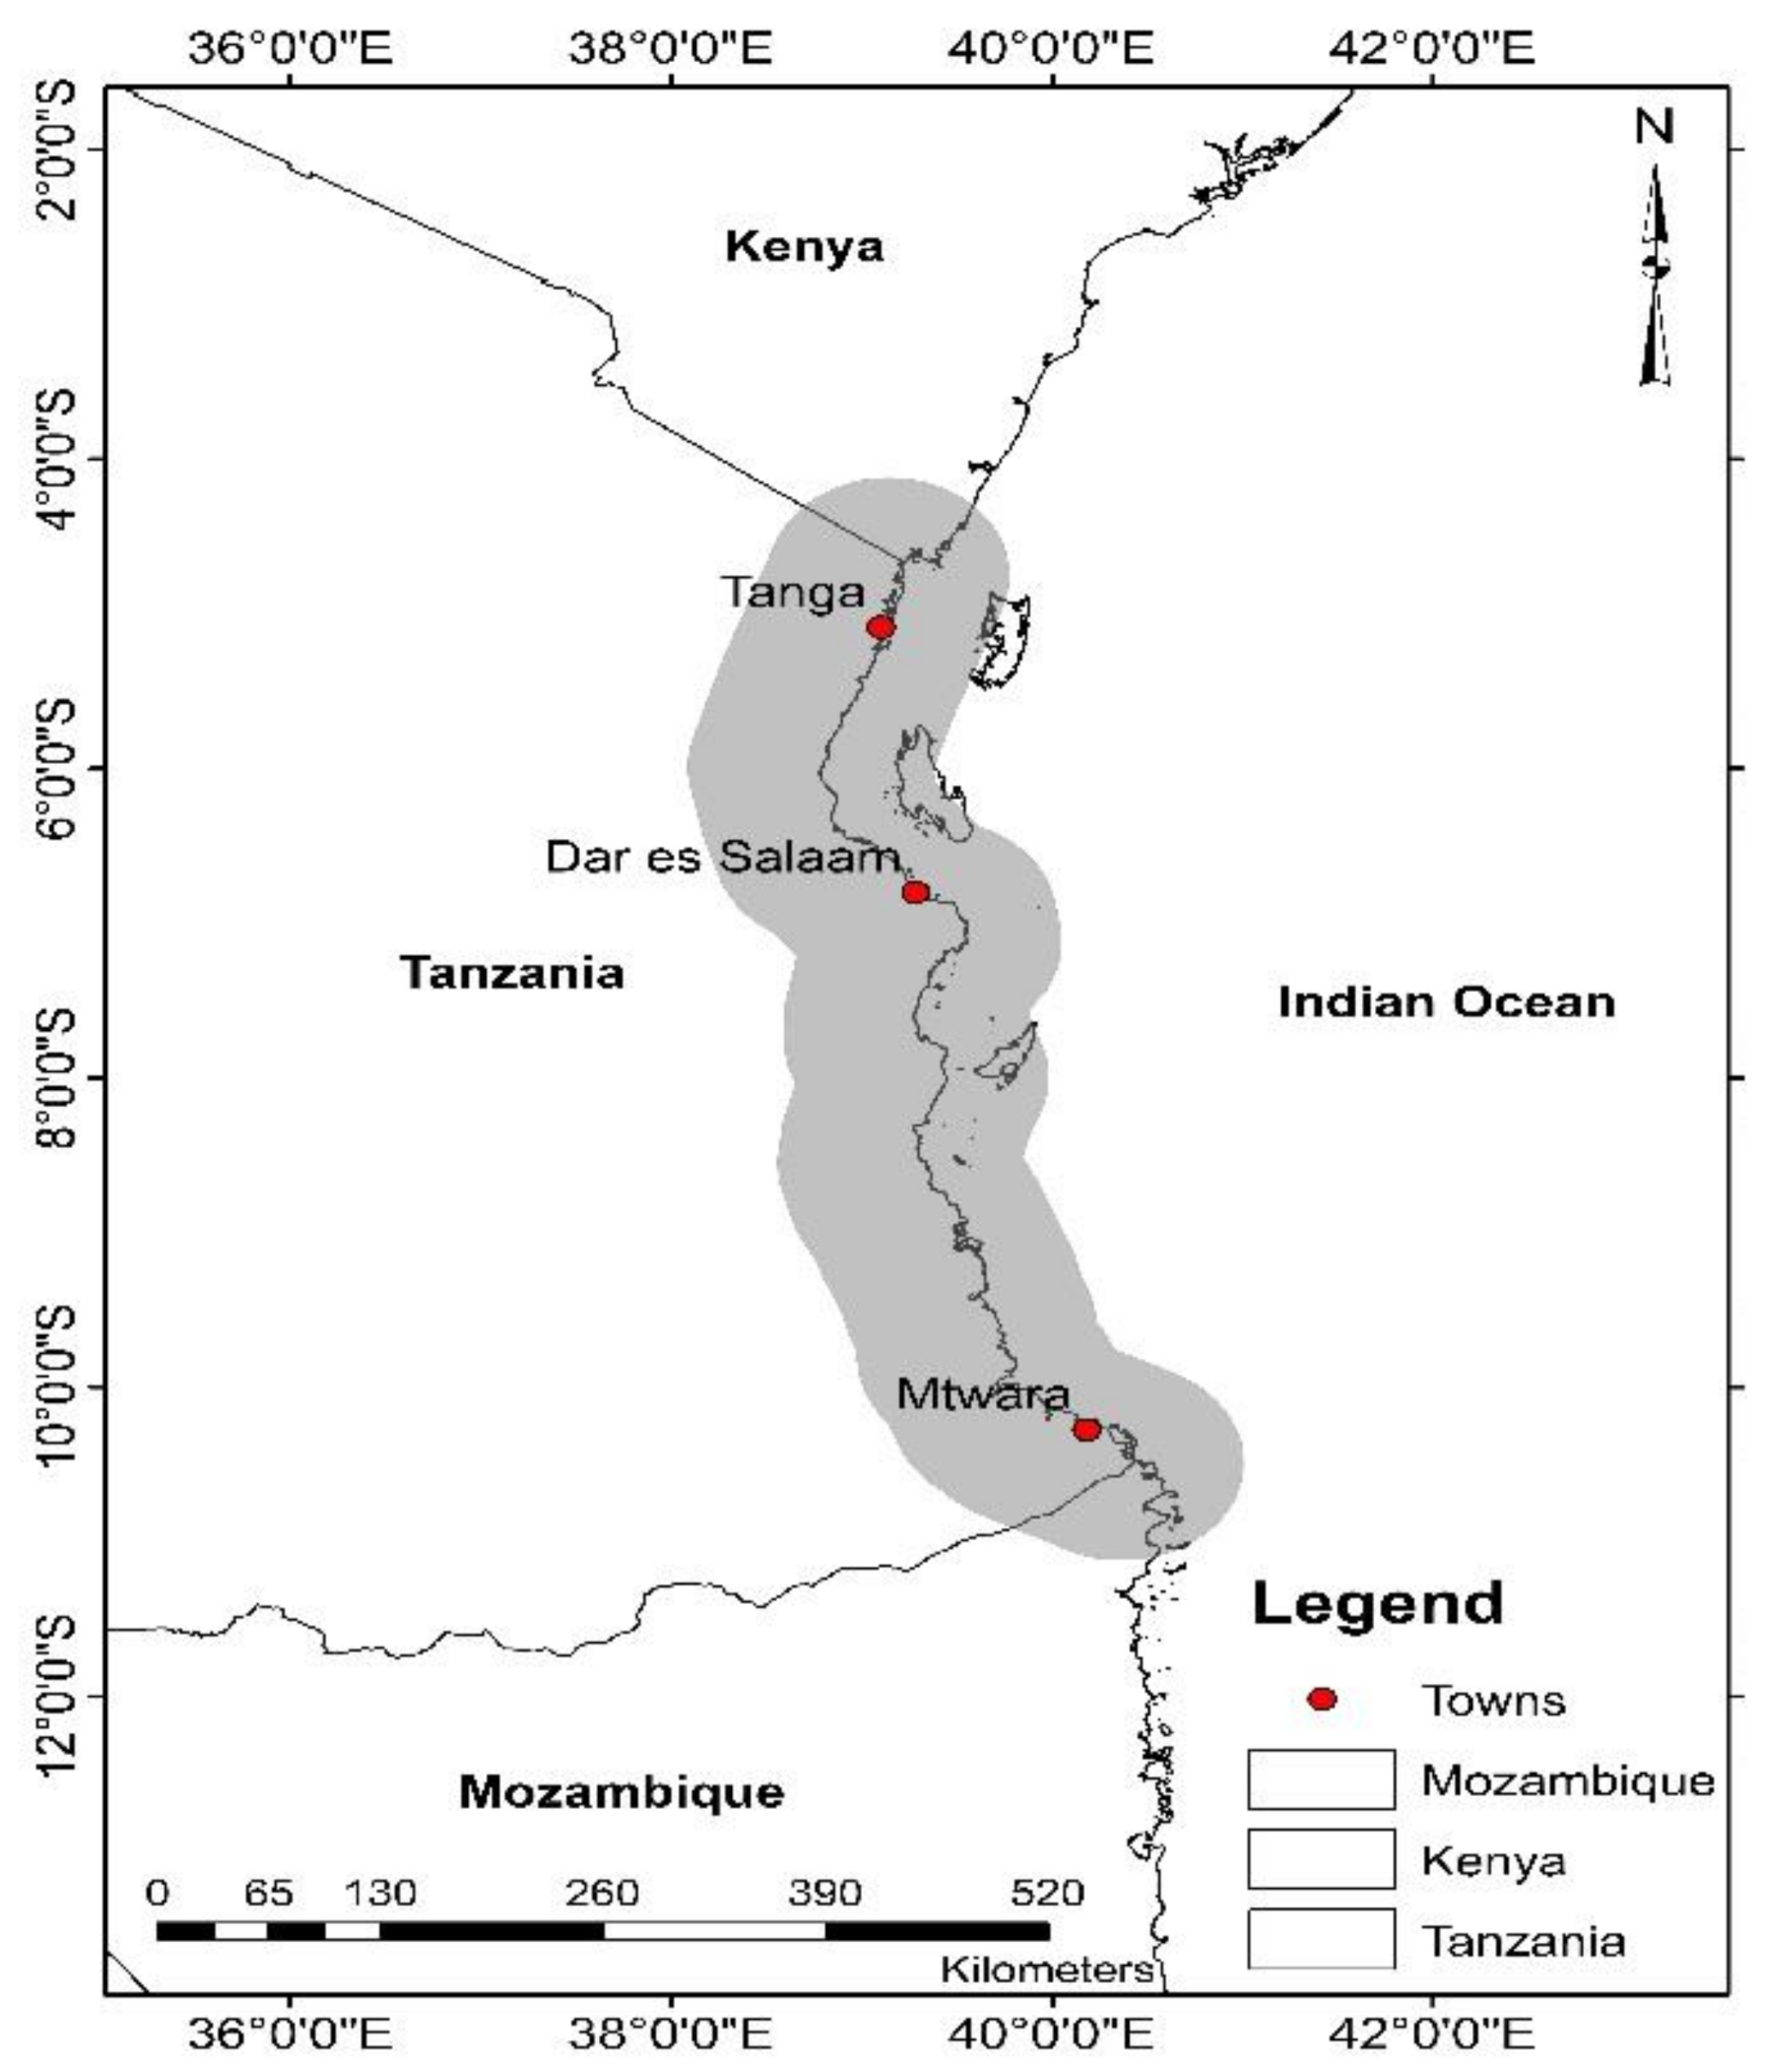
Figure 2.
Long-term means of monthly rainfall amount for the three Tanzanian coastal stations, each in a separate geographic region (Mtwara (a), Dar es Salaam (b), and Tanga (c)).
Figure 2.
Long-term means of monthly rainfall amount for the three Tanzanian coastal stations, each in a separate geographic region (Mtwara (a), Dar es Salaam (b), and Tanga (c)).

Figure 3.
Moving average rainfall for the three Tanzania coastal stations (Tanga, Dar es Salaam and Mtwara). Tanga and Dar es Salaam experiences two rainfall seasons (Masika and Vuli), Mtwara observes one rainfall season. Tanga (a) and Dar es Salaam (b) represent the Masika (MAM) season. Tanga (c) and Dar es Salaam (d) represent Vuli (OND) season. Mtwara rainfall season (e).
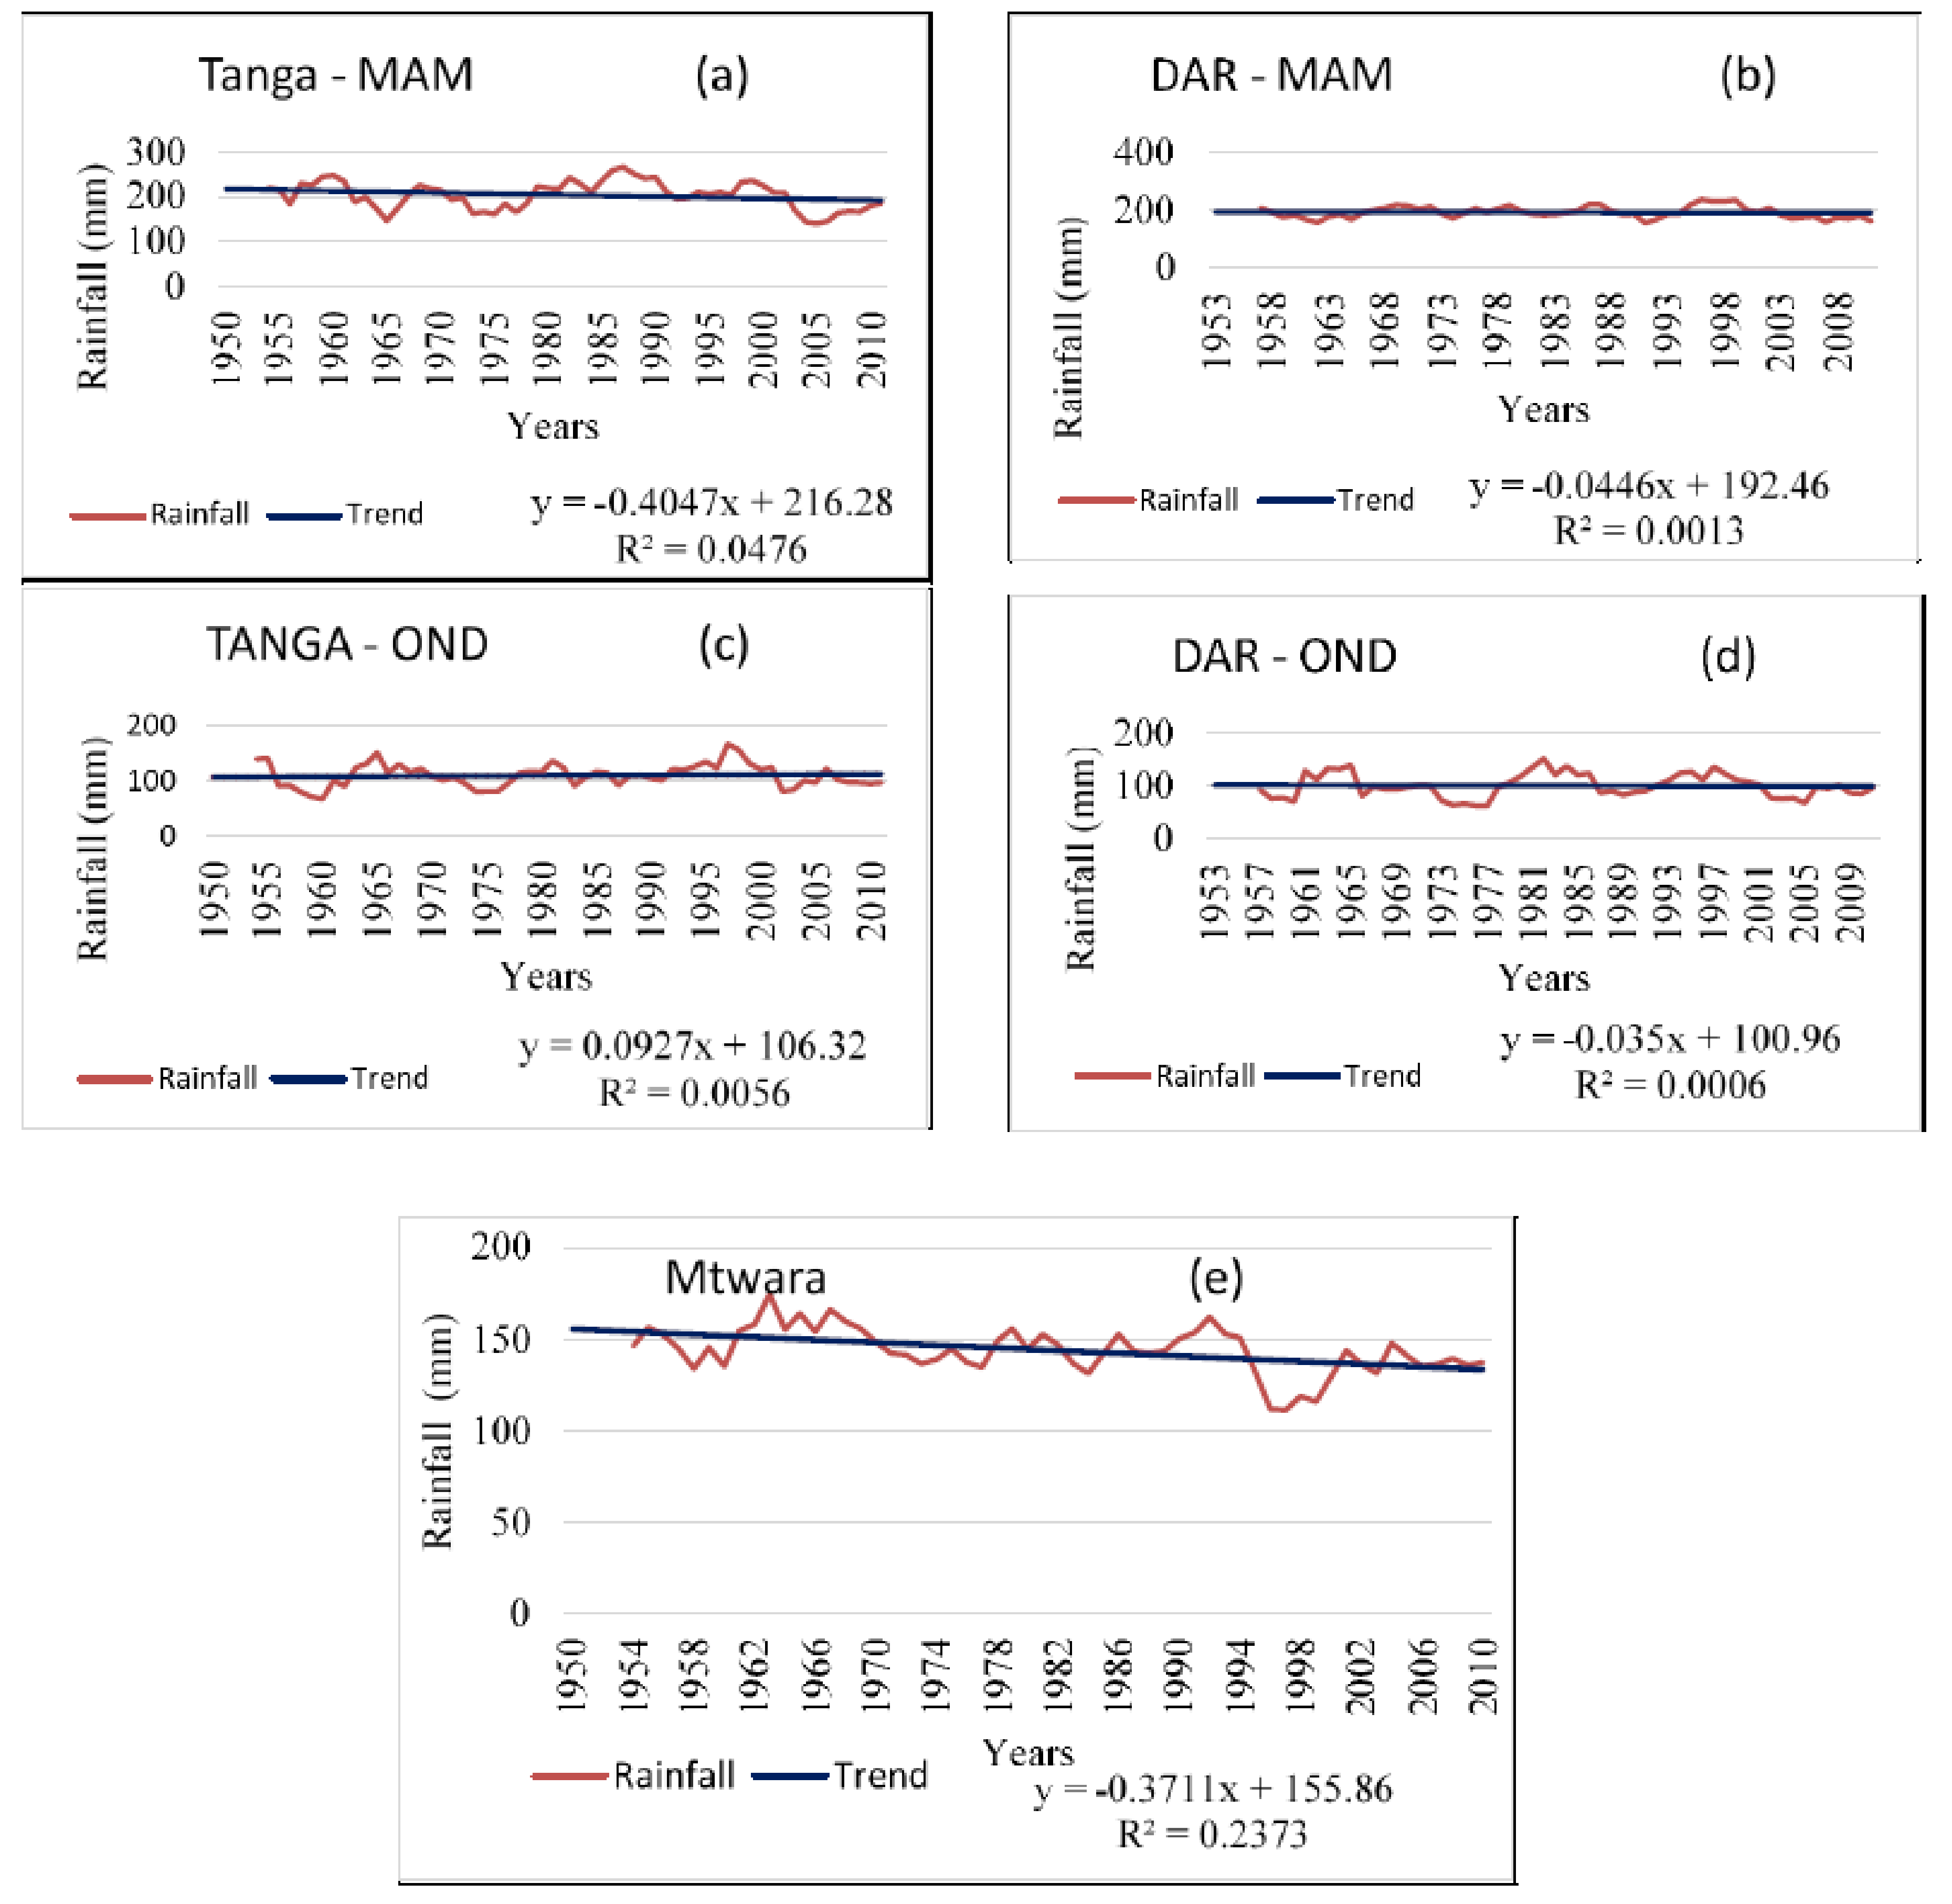
Figure 4.
July rainfall of Tanga, Dar es Salaan, Mtwara and their averages for 55 years. The average linear trend is superimposed.
Figure 4.
July rainfall of Tanga, Dar es Salaan, Mtwara and their averages for 55 years. The average linear trend is superimposed.

Figure 5.
July horizontal wind vector for 1961, 1982, and 2009, representing the anomalously wet July (a), the second wettest (b) and one of the driest July (c) months, respectively.
Figure 5.
July horizontal wind vector for 1961, 1982, and 2009, representing the anomalously wet July (a), the second wettest (b) and one of the driest July (c) months, respectively.


Table 1.
Mann-Kendall trend and Sen’s Slope for Mtwara’s monthly moving average rainfall trend.
| Time Series | First Year | Last Year | n | Test Z | Signific. | Q (mm/Year) |
|---|---|---|---|---|---|---|
| January | 1954 | 2011 | 58 | −3.21 | ** | −1.290 |
| February | 1954 | 2011 | 58 | −2.19 | * | −0.838 |
| March | 1954 | 2011 | 58 | 2.83 | ** | 0.955 |
| April | 1954 | 2011 | 58 | −3.21 | ** | −0.901 |
| May | 1954 | 2011 | 58 | 1.42 | 0.186 | |
| June | 1954 | 2011 | 58 | −0.59 | −0.024 | |
| July | 1954 | 2011 | 58 | −3.81 | *** | −0.142 |
| August | 1954 | 2011 | 58 | 1.62 | 0.061 | |
| September | 1954 | 2011 | 58 | −2.15 | * | −0.198 |
| October | 1954 | 2011 | 58 | 1.33 | 0.221 | |
| November | 1954 | 2011 | 58 | 1.74 | + | 0.370 |
| December | 1954 | 2011 | 58 | −2.58 | * | −1.096 |
*** If trend at α = 0.001 level of significance; ** if trend at α = 0.01 level of significance; * if trend at α = 0.05 level of significance; + if trend at α = 0.1 level of significance.
Table 2.
Mann-Kendall trend and Sen’s slope for Dar es Salaam’s monthly moving average rainfall trend.
Table 2.
Mann-Kendall trend and Sen’s slope for Dar es Salaam’s monthly moving average rainfall trend.
| Time Series | First Year | Last Year | n | Test Z | Signific. | Q (mm/Year) |
|---|---|---|---|---|---|---|
| January | 1957 | 2011 | 55 | −2.70 | ** | −0.586 |
| February | 1957 | 2011 | 55 | −1.18 | −0.315 | |
| March | 1957 | 2011 | 55 | 1.36 | 0.410 | |
| April | 1957 | 2011 | 55 | −1.89 | + | −0.606 |
| May | 1957 | 2011 | 55 | 0.12 | 0.074 | |
| June | 1957 | 2011 | 55 | 1.95 | + | 0.263 |
| July | 1957 | 2011 | 55 | −4.75 | *** | −0.419 |
| August | 1957 | 2011 | 55 | −2.17 | * | −0.169 |
| September | 1957 | 2011 | 55 | −2.12 | * | −0.181 |
| October | 1957 | 2011 | 55 | 0.81 | 0.177 | |
| November | 1957 | 2011 | 55 | −1.10 | −0.428 | |
| December | 1957 | 2011 | 55 | −0.19 | −0.066 |
*** If trend at α = 0.001 level of significance; ** if trend at α = 0.01 level of significance; * if trend at α = 0.05 level of significance; + if trend at α = 0.1 level of significance.
Table 3.
Mann-Kendall trend and Sen’s Slope for Tanga’s monthly moving average rainfall trend.
| Time Series | First Year | Last Year | n | Test Z | Signific. | Q (mm/Year) |
|---|---|---|---|---|---|---|
| January | 1954 | 2011 | 58 | 1.56 | 0.180 | |
| February | 1954 | 2011 | 58 | 0.42 | 0.049 | |
| March | 1954 | 2011 | 58 | −1.66 | + | −0.443 |
| April | 1954 | 2011 | 58 | −0.80 | −0.326 | |
| May | 1954 | 2011 | 58 | −1.95 | + | −0.962 |
| June | 1954 | 2011 | 58 | 1.19 | 0.211 | |
| July | 1954 | 2011 | 58 | −3.51 | *** | −0.518 |
| August | 1954 | 2011 | 58 | −0.98 | −0.120 | |
| September | 1954 | 2011 | 58 | −4.96 | *** | −0.956 |
| October | 1954 | 2011 | 58 | 1.10 | 0.330 | |
| November | 1954 | 2011 | 58 | −1.23 | −0.402 | |
| December | 1954 | 2011 | 58 | 0.71 | 0.155 |
*** If trend at α = 0.001 level of significance; ** if trend at α = 0.01 level of significance; * if trend at α = 0.05 level of significance; + if trend at α = 0.1 level of significance.
© 2018 by the author. Licensee MDPI, Basel, Switzerland. This article is an open access article distributed under the terms and conditions of the Creative Commons Attribution (CC BY) license (http://creativecommons.org/licenses/by/4.0/).
Share and Cite
MDPI and ACS Style
Kabanda, T. Long-Term Rainfall Trends over the Tanzania Coast. Atmosphere 2018, 9, 155. https://doi.org/10.3390/atmos9040155
AMA Style
Kabanda T. Long-Term Rainfall Trends over the Tanzania Coast. Atmosphere. 2018; 9(4):155. https://doi.org/10.3390/atmos9040155
Chicago/Turabian StyleKabanda, Tibangayuka. 2018. "Long-Term Rainfall Trends over the Tanzania Coast" Atmosphere 9, no. 4: 155. https://doi.org/10.3390/atmos9040155
Note that from the first issue of 2016, this journal uses article numbers instead of page numbers. See further details here.