East Asian Summer Monsoon Representation in Re-Analysis Datasets


1
Institute of Meteorology, Freie Universität Berlin, Carl-Heinrich-Becker-Weg 6-10, 12165 Berlin, Germany
2
Industrial Ecology Programme, Department of Energy and Process Engineering, Norwegian University of Science and Technology (NTNU), 7491 Trondheim, Norway
*
Author to whom correspondence should be addressed.
Atmosphere 2018, 9(6), 235; https://doi.org/10.3390/atmos9060235
Submission received: 23 May 2018
/
Revised: 11 June 2018
/
Accepted: 14 June 2018
/
Published: 16 June 2018
(This article belongs to the Special Issue Precipitation: Measurement and Modeling)
Abstract
:Eight current re-analyses—NCEP/NCAR Re-analysis (NCEPI), NCEP/DOE Re-analysis (NCEPII), NCEP Climate Forecast System Re-analysis (CFSR), ECMWF Interim Re-analysis (ERA-Interim), Japanese 55-year Re-analysis (JRA-55), NASA Modern-Era Retrospective Analysis for Research and Applications (MERRA), NOAA Twentieth Century Re-analysis (20CR), and ECMWF’s first atmospheric re-analysis of the 20th century (ERA-20C)—are assessed to clarify their quality in capturing the East Asian summer monsoon (EASM) rainfall structure and its associated general circulation. They are found to present similar rainfall structures in East Asia, whereas they illustrate some differences in rainfall intensity, especially at lower latitudes. The third generation of re-analysis shows a better estimate of rainfall structure than that in the first and extended generation of re-analysis. Given the fact that the rainfall is ingested by the data assimilation system, the re-analysis cannot improve its production of rainfall quality. The mean sea level pressure is generated by re-analysis, showing a significant uncertainty over the Tibetan Plateau and its surrounding area. In that region, the JRA-55 and MERRA have a negative bias (BIAS), while the other six re-analyses present a positive BIAS to the observed mean sea level pressure. The 20CR and the ERA-20C are ancillary datasets to analyse the EASM due to the fact that they only apply limit observations into the data assimilation system. These two re-analyses demonstrate a prominent difference from the observed winds in the upper-air. Although the upper level winds exhibit difference, the EASM index is consistent in the eight re-analyses, which are based upon the zonal wind over 850 hPa.
1. Introduction
The East Asian summer monsoon (EASM) is an important part of the global climate system and plays a vital role in the Asian climate. It influences the livelihood and the socioeconomic status of over a billion residents who live in the EASM dominated region. The EASM is composed of Australian High, cross-equatorial jet, southwest monsoon, monsoon trough (Inter Tropical Convergence Zone), trade wind, west pacific subtropical high, Meiyu/Baiu/Changma and mid-latitudinal turbulence [1].
In the past decades, extensive research has been conducted to increase our knowledge of monsoon variability and predictability, and to improve projections of the impact of human activities on monsoonal systems over East Asia [2,3,4]. This extensive work strongly depends on observations. A global observation network was built up in 20th century [5]. The observation network collects data from in situ stations, ships, buoys, satellite and aircraft etc. It provides the best estimate of the state of the atmosphere, land and ocean. However, the data is inhomogeneous, due to the fact that there are gaps in spatial and temporal coverage. Global atmospheric assimilated datasets, called re-analysis, have been developed, which combine observation and geophysical fluid-dynamical models [6]. Because of the parameterisations for important physical processes (e.g., radiative transfer, convection, turbulent transfer, etc.), the model has its own uncertainty and biases to the real atmosphere. The re-analysis uses observations to constrain the model output to optimise the spatial-temporal coverage and accuracy [6].
Since the early 1990s, several generations of atmospheric re-analyses have been produced at different organisations. The National Centers for Environmental Predictions (NCEP)/National Center for Atmospheric Research (NCAR) Reanalysis (NCEPI; [6]) is the original re-analysis effort. Then NCEP/Department of Energy (DOE) updated the forecast model with better physical parameterisations and fixed the data assimilation errors to produce a new version of re-analysis (i.e., NCEPII; [7]). Both the NCEPI and NCEPII belong to the first generation of re-analysis. The European Centre for Medium Range Weather Forecasts (ECMWF) 45-year Reanalysis (ERA-40; [8]) and the Japanese 25-year Reanalysis (JRA-25; [9]) are the second-generation of re-analysis. These re-analysis datasets have the same data assimilation approach (i.e., 3D-Var; three-dimensional variational data assimilation) as in first-generation re-analysis. The second-generation re-analyses show some errors in climate study, e.g., the JRA-25 illustrates a clod bias in the lower stratosphere [9] and a dry bias in the Amazon basin [10]. Therefore, a third-generation of re-analysis datasets has been developed, which includes the Climate Forecast System Re-analysis (CFSR; [11,12]), the ECMWF Interim Reanalysis (ERA-Interim; [13]), the Japanese 55-year Reanalysis (JRA-55; [14]), and the Modern Era Retrospective-Analysis for Research and Applications (MERRA; [15]). The new generation re-analyses apply a more advanced data assimilation method (e.g., analysis increments and 4D-Var) and models and addressed issues were discovered in the second-generation re-analysis efforts. Subsequently, the ECMWF and the National Oceanic and Atmospheric Administration (NOAA) developed a new-generation re-analysis to provide a long time cover observational validation dataset to assess climate model simulations of the 20th century, the ECMWF’s first atmospheric re-analysis of the 20th century (ERA-20C; [16]) and the Twentieth Century Reanalysis v2 (20CR; [17]), respectively.
The re-analysis datasets have been widely used in studying climate variability and climate change. It is reference data for climate model output [18,19,20] and driving data for regional climate models [21,22,23]. As mentioned, the re-analyses are produced by different organisations, employ various forecast model and data assimilation approaches. There is a distinction between each re-analysis. Newman et al. [24] firstly described the difference between the ECMWF, NCEP and NASA (National Aeronautics and Space Administration’s Goddard Laboratory for Atmospheres) re-analyses. Then, Betts et al. [25] introduced the strengths, weaknesses, and usefulness of re-analysis datasets. Several works assess precipitation in re-analyses because precipitation is a “forecast” variable from the forecast model [10,26]. Both Bosilovich et al. [10] and the Lin et al. [26] compared the re-analysis performance in reproducing precipitation on a large scale. Bosilovich et al. [10] assessed precipitation climatology of five re-analyses in nine sub-regions (North Pacific, Eurasia, Indian monsoon region etc.). Lin et al. [26] evaluated five re-analyses’ performance in capturing global monsoon metrics. The monsoon metrics include climatology of global monsoon modes, interannual variability, and long-term trend of global monsoon precipitation. Huang et al. [27] found that the ERA-Interim and MERRA had better skill than the NCEPI, NCEPII and JRA-25 for producing the climatology of EASM precipitation. Then, Chen et al. [28] found that four re-analyses (i.e., JRA-55, ERA-Interim, CFSR and MERRA) exhibited similar structure and summer progress of mean wind diurnal cycle, but illustrated some differences in the low-level meridional wind. Wang and Zeng [29] analysed six re-analysis products in representing observational precipitation, temperature and radiation over the Tibetan Plateau, which is the surrounding area of the EASM. However, there is little work focusing on re-analysis performance in capturing the EASM rainfall structure and its inter-annual variability.
Based on the relative dependence of the model and the assimilated observational data, Kalnay et al. [6] classified the output variables into four classes. Precipitation is categorised as a “C” variable due its being completely determined by the model during data assimilation. Because the zonal and meridional wind, as well as geopotential height, are directly assimilated from observational data, they are the most reliable variable in the first-, second- and third-generation re-analyses. These data are categorised as “A” variables. However, the extended-generation re-analysis (20CR and ERA-20C) only takes surface data (e.g., surface pressures and surface winds) as part of data assimilation. Therefore, pressure level variables (e.g., wind fields and geopotential height) in extended generation reanalysis is classified as “C” class. These variables should be compared to observational data when they are used for scientific research, especially for studying the EASM.
In this paper, we evaluate eight widely used re-analysis datasets representing EASM rainfall and inter-compare them to capture EASM general circulation. The goal is to clarify their quality and efficiency in describing the EASM. The observational and re-analysis datasets, as well as the analysis method, is described in Section 2. Section 3 presents the inter-comparison results, including rainfall structure, general circulation, and monsoon strength in the re-analyses. The conclusion and discussion are summarised in Section 4.
2. Data and Method
In this study, eight re-analyses are evaluated and inter-compared. A brief overview of the eight re-analyses is presented in Table 1. Because of the spatial (EASM region) and temporal (1979–2010) coverage, monthly data of the eight re-analysis datasets are selected for further analysis. They are the first generation of re-analysis (NCEPI and NCEPII), the third generation of re-analysis (CFSR, ERA-Interim, MERRA, and JRA-55), and the extended-generation re-analysis (20CR and ERA-20C). A brief summary of each re-analysis focusing on its main strengths and limitations is presented in Table 2. A detailed description of each re-analysis dataset can be found at the Climate Data Guide website (https://climatedataguide.ucar.edu/climate-data).
The Global Precipitation Climatology Project (GPCP; [30]) is employed as the precipitation observational data. We choose the extended Hadley Centre’s monthly historical mean sea level pressure dataset (HadSLP2r; [31]) as the reference data for mean sea level pressure. The Integrated Global Radiosonde Archive (IGRA; [32]) is applied to evaluate the spread of multi-pressure level wind fields in re-analysis datasets. Over 1500 globally distributed stations contribute to the IGRA, which consists of radiosonde and pilot balloon observations. More than 150 stations are located in our study area, with the longest record since 1958. The station data is interpolated to grid dataset by iterative improvement objective analysis. To eliminate the uncertainty associated with different data resolutions, the validation data and the re-analysis datasets are remapped onto a common gird of 2.5° × 2.5° by bi-linear interpolation. Four variables are used in the further analysis, i.e., precipitation (pr), mean sea level pressure (SLP), zonal wind (u850) and meridional wind (v850) over 850 hPa.
The quality of re-analysis data is measured by pattern correlation coefficient (PCC), anomaly correlation coefficient (ACC), root-mean-square error (RMSE) and bias (BIAS). The PCC statistical method is the un-centred statistical measure, which is without removal of the regional mean.
3. Results
3.1. Mean Annual Cycle of the EASM Rainfall
The EASM features a prominent seasonal transition of prevailing winds and an abrupt change from dry to wet climate. In climatology, the onset of EASM has four stages: (1) it starts in the central Indo-China peninsula in late April or early May; (2) it propagates eastward to the South China Sea in mid-May; (3) in early June, the EASM arrives at the Yangtze River Basin (Meiyu) and the south of Japan (Baiu); (4) the EASM reaches northward to Northern China, the Korean Peninsula (namely, the Changma rainy season) and even central Japan in early July [33,34].
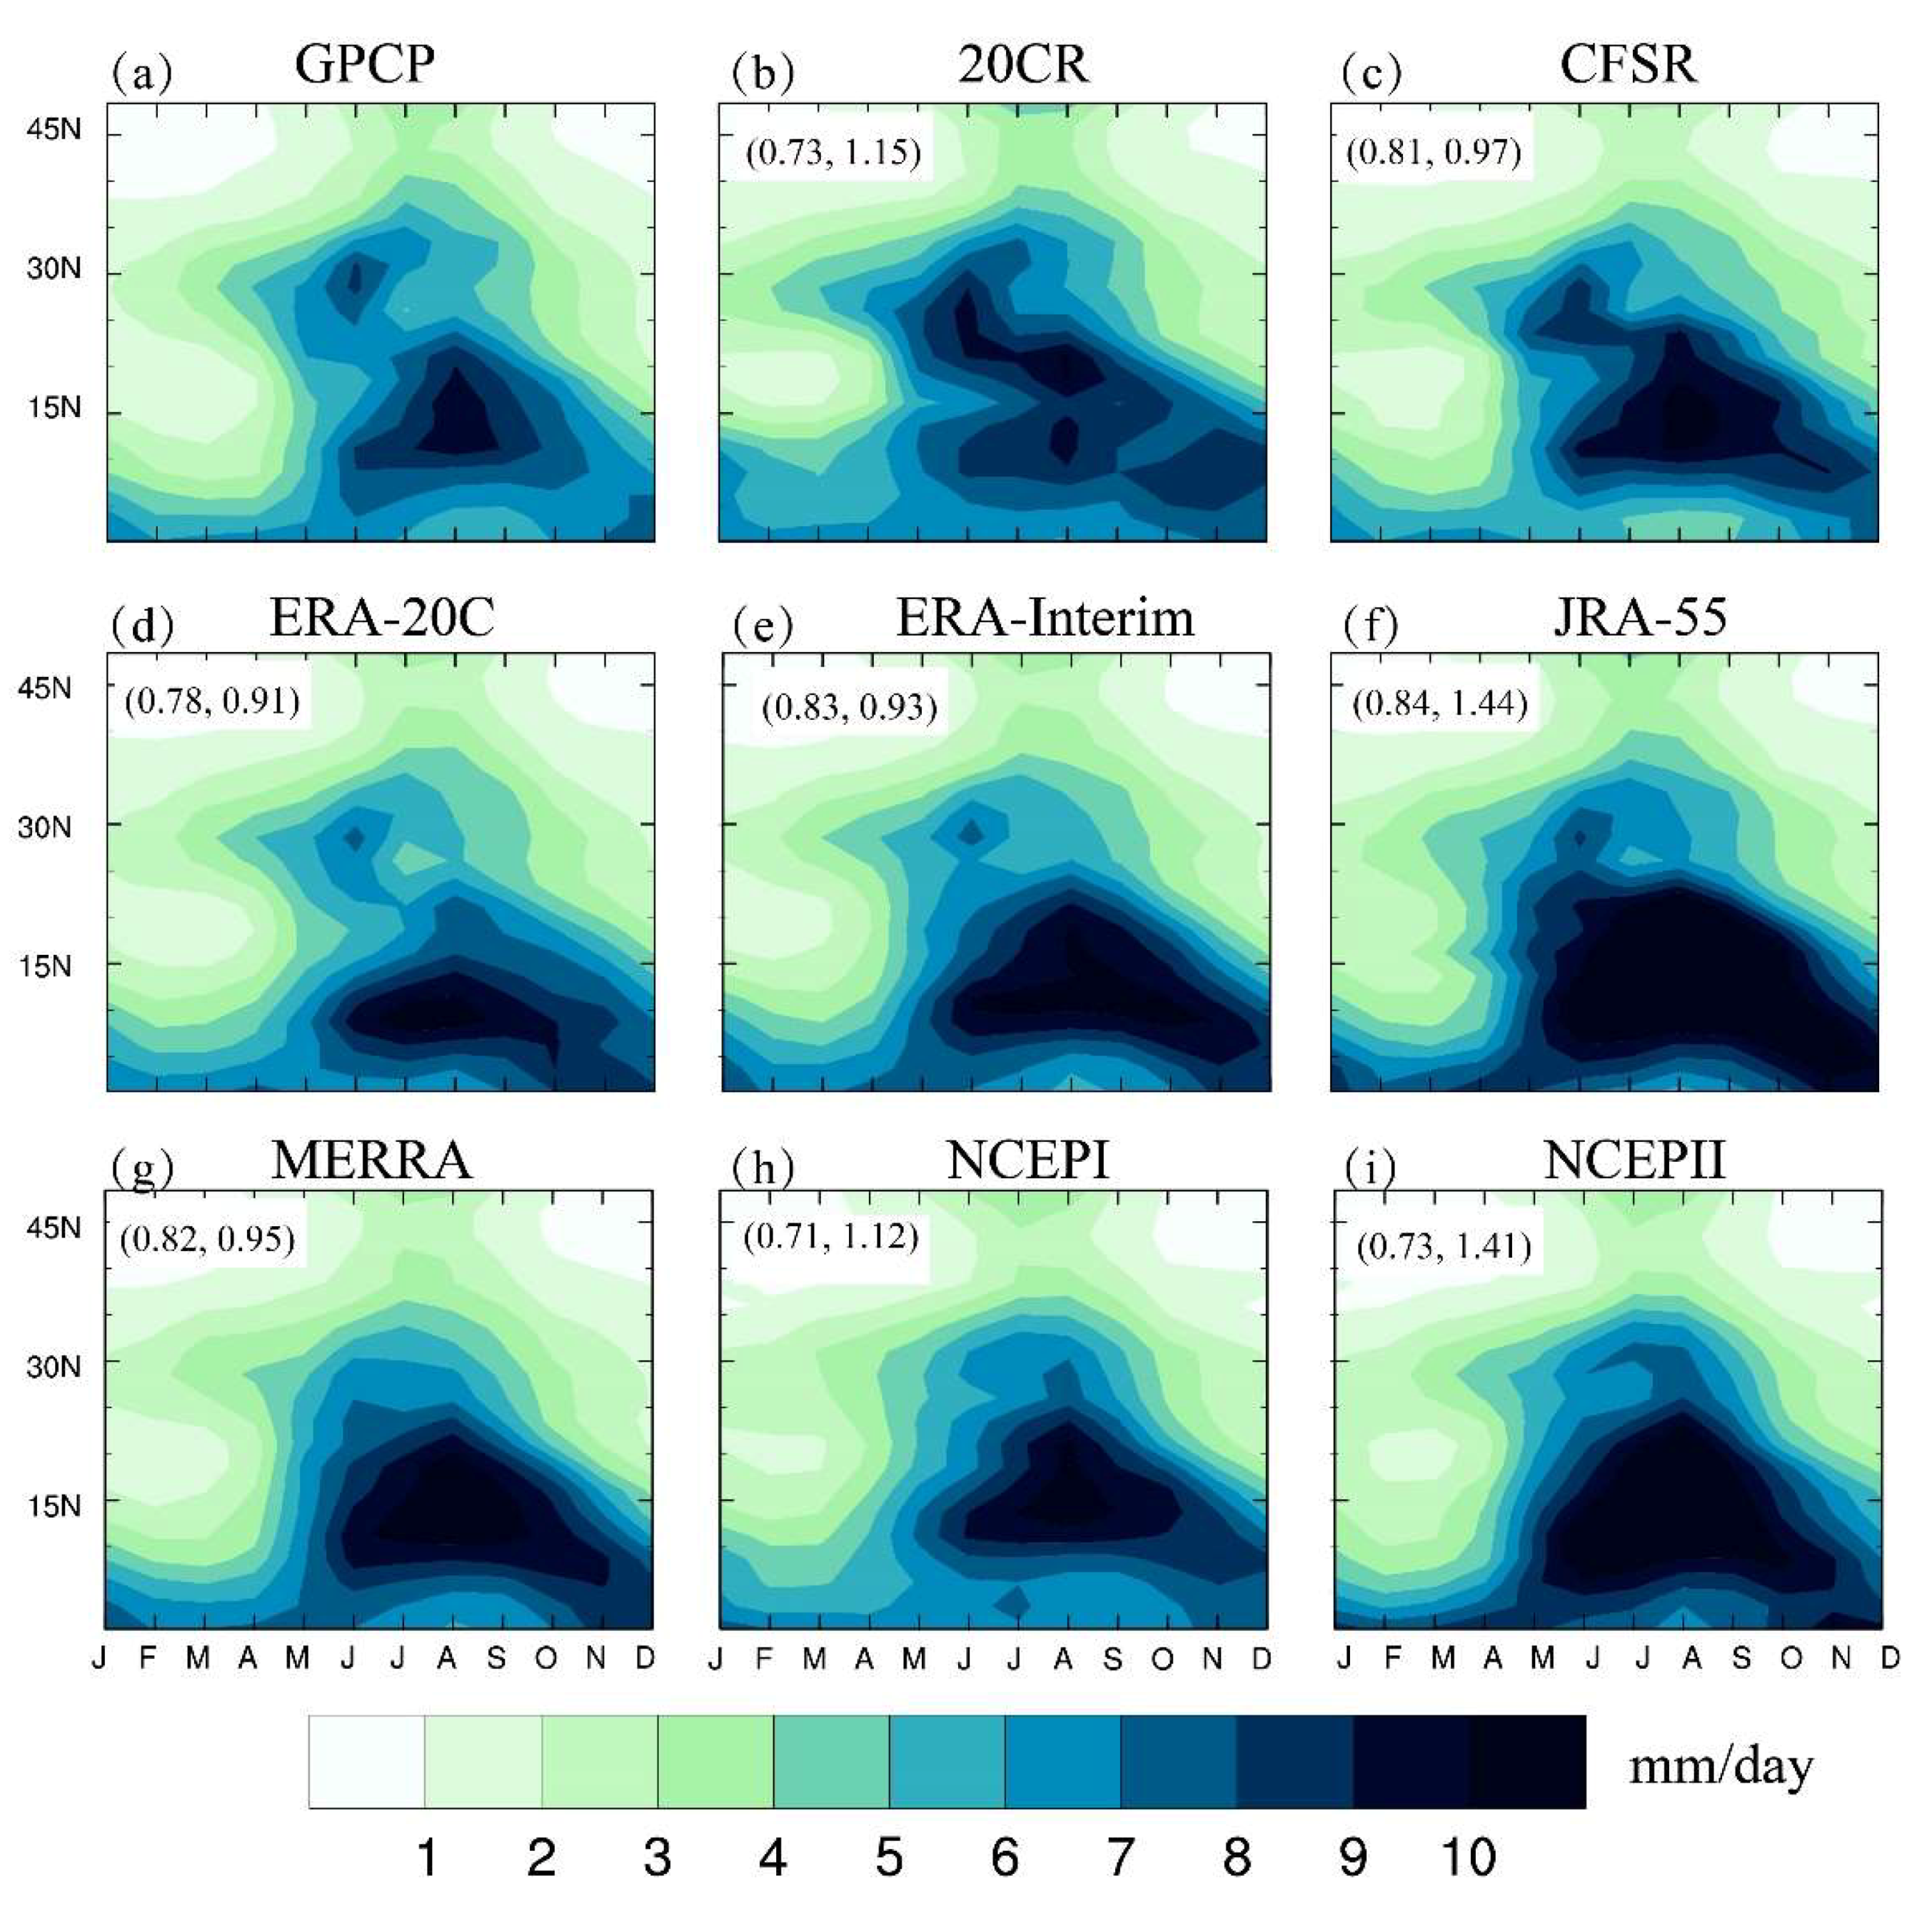
Figure 1 shows the seasonal transition of the EASM rainfall through a time-latitude Hovmoller diagram in GPCP and re-analysis datasets. This corresponds to a northward-southward movement of the Inter Tropical Convergence Zone, which is characterised by successive active and break phases of the convective activity. This meridional cross-section analysis provides a good framework to assess multi-dataset skill in representing mean annual cycle and intra-seasonal variations of the EASM and associated monsoon onset and withdrawal process [35].
The first-generation re-analyses exhibit the worst performance in capturing the latitude-time structure of EASM, with a lower PCC of 0.71 and 0.73 for NCEPI and NCEPII, respectively. There is no doubt that the third-generation reanalyses have better skill at representing the seasonal progress of EASM. Its PCC range is from 0.81 to 0.84, while the RMSE range is from 0.93 to 1.44. We can see that 20CR and ERA-20C exhibit a reasonable performance in describing the EASM rainfall structure. It is worth mentioning that JRA-55 is the best re-analysis dataset in capturing the pattern distribution of monsoon rainfall structure, but it demonstrates the worst performance in representing the amplitude of rainfall, due to its having the largest RMSE (1.44).
3.2. EASM Inter-Annual Variability
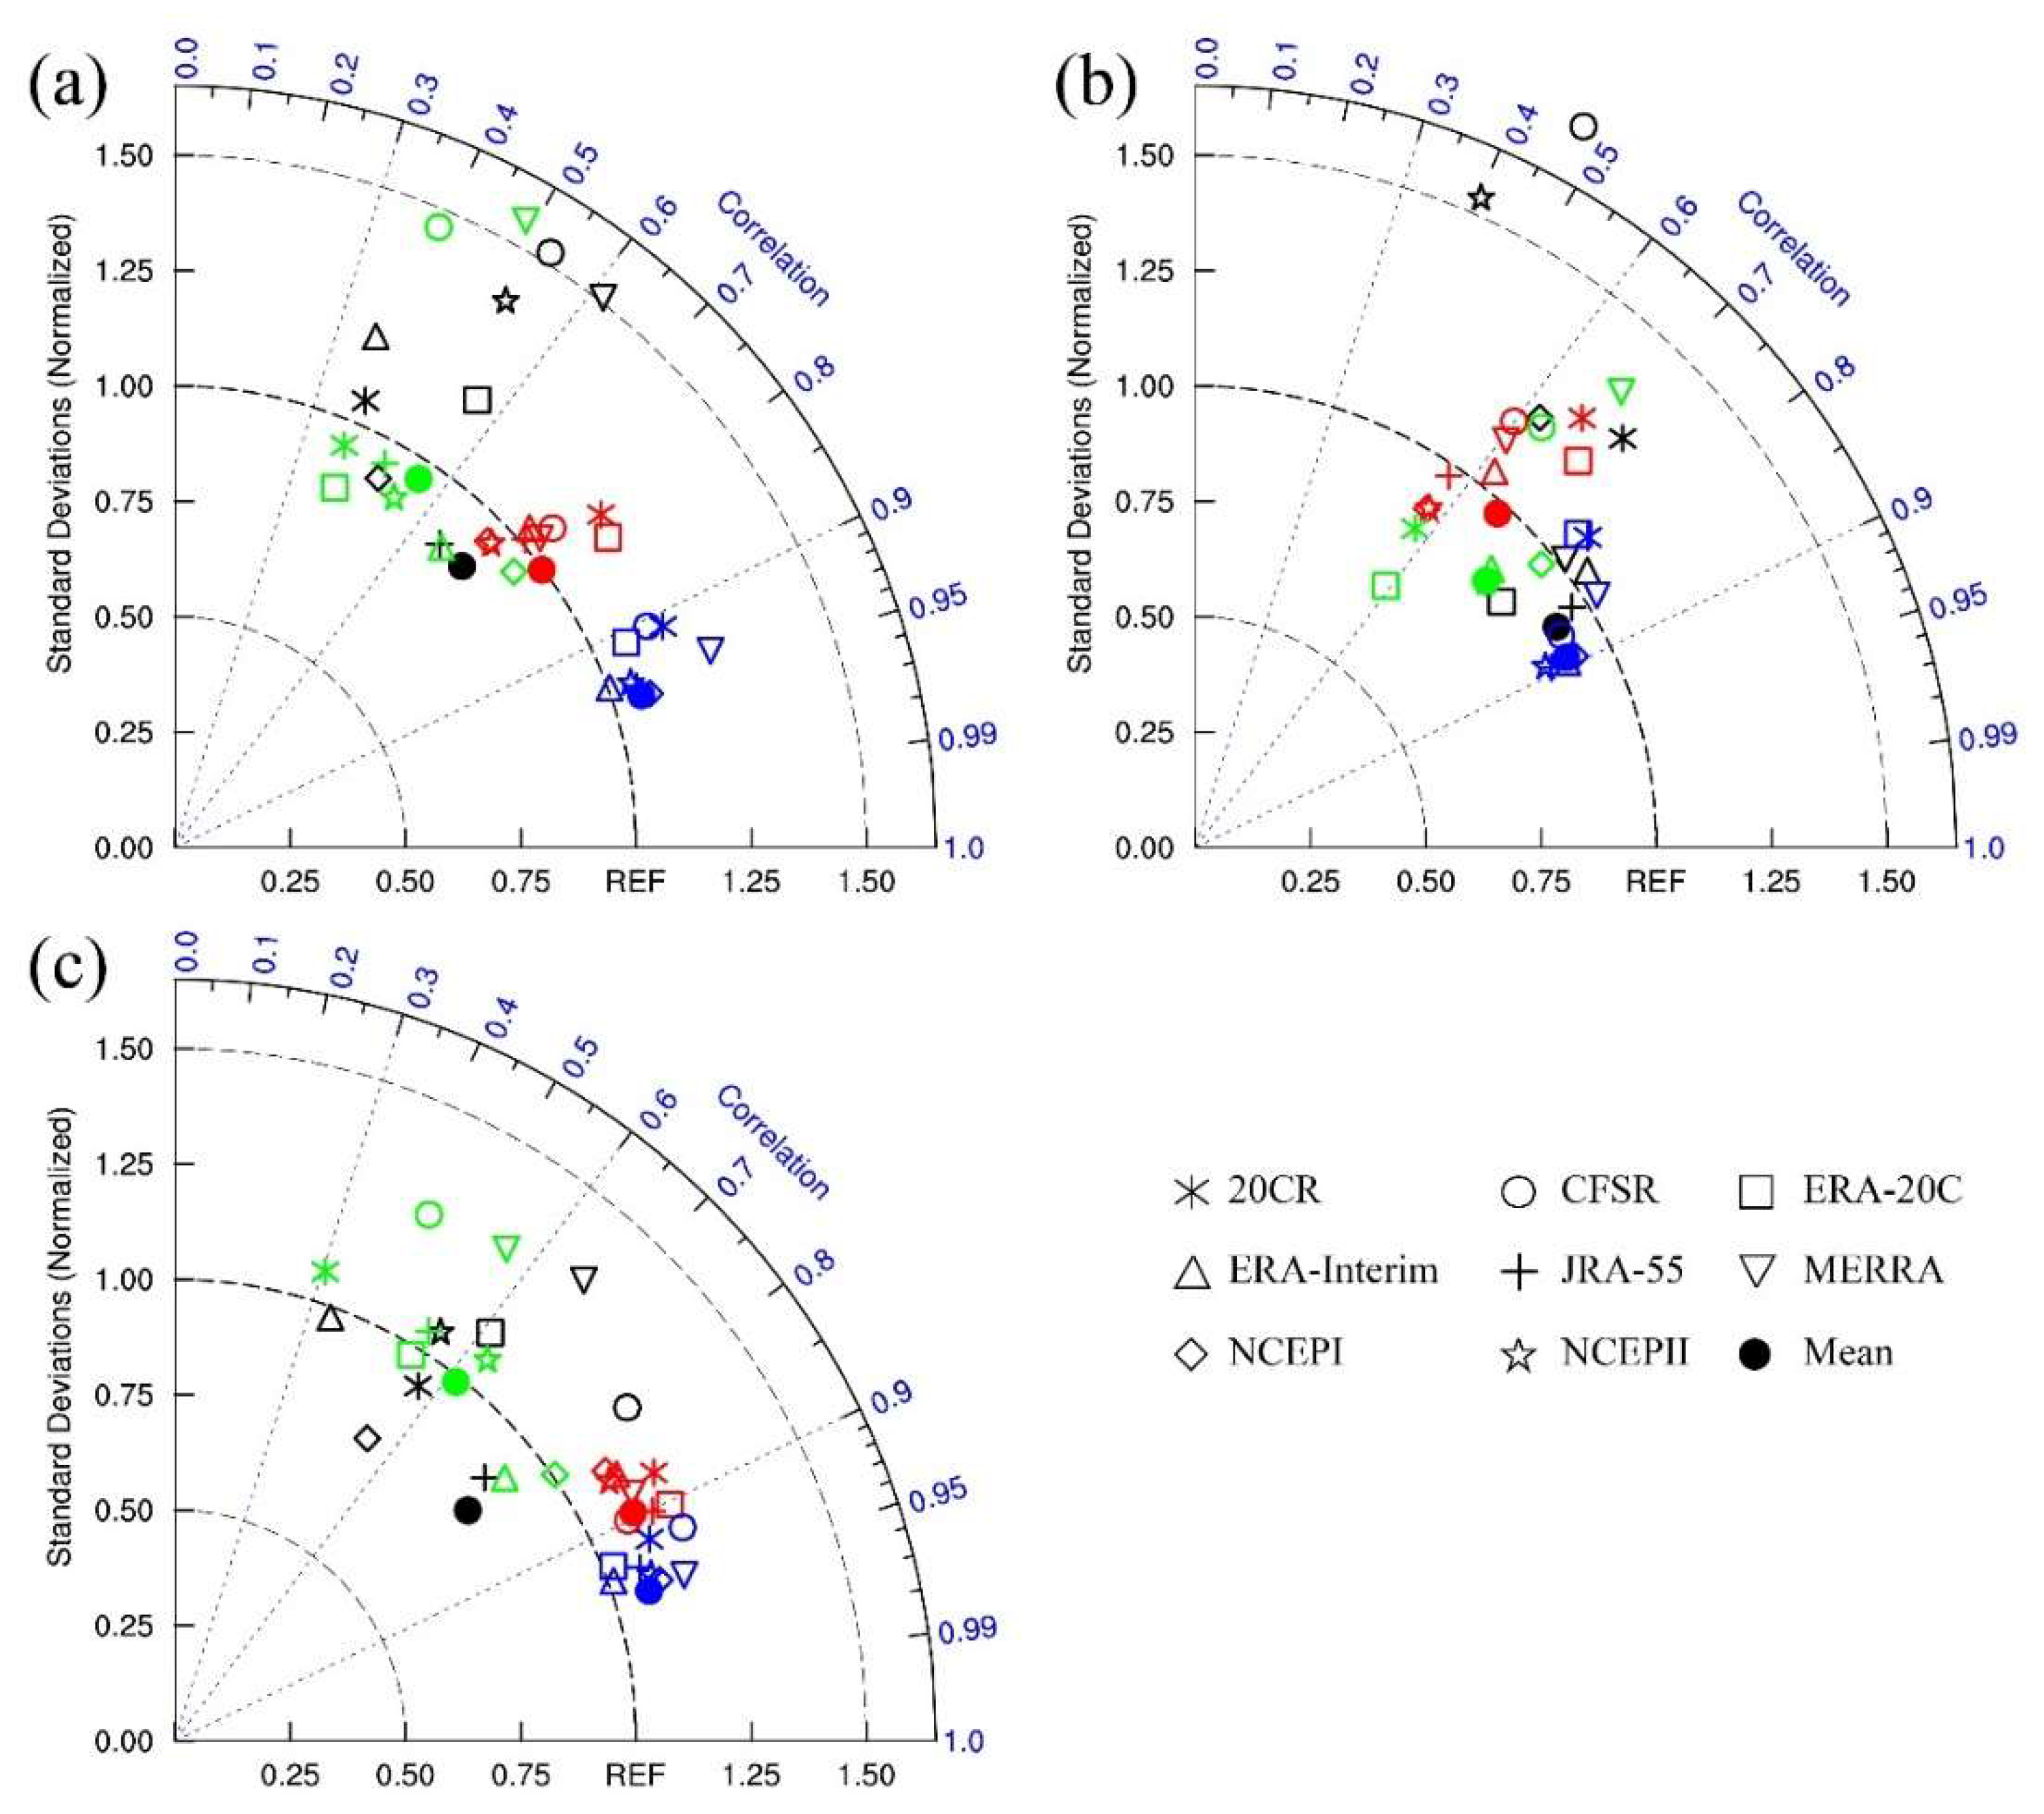
Taylor diagrams are a valuable tool for evaluating model data performance regarding the matching of temporal variability using temporal correlation and standard deviation [36]. Here, we calculate the temporal correlations from summer (June–July–August) mean precipitation and the associated three meteorological fields averaged over the EASM region (0–50° N, 100–140° E) for all re-analyses relative to the reference data (Figure 2). For precipitation, the re-analyses show a large spread, with normalised standard deviations (NSD) from 0.87 to 1.52 and a correlation range from 0.37 to 0.66 for the GPCP. The JRA-55 has the highest correlation (0.66), while the ERA-Interim exhibits the lowest correlation (0.37) with the observed precipitation. The JRA-55 and the NCEPI demonstrate a smaller inter-annual variation than the reference data, with a NSD < 1. The precipitation year-to-year variation is larger in the other six re-analyses than in the GPCP, especially the CFSR and the MERRA, with NSDs of 1.52 and 1.50, respectively.
The re-analysis datasets illustrate high consistency for the SLP and the zonal wind at 850 hPa (i.e., u850). The range of SLP correlation is 0.71 to 0.81, and NSD is 0.95 to 1.17. We found that the re-analyses have the same performance in representing the u850 as the SLP, with a high correlation (0.88–0.93) and an approximate inter-annual variation (NSD: 1.05–1.29) for the IGRA. Obviously, the meridional wind at 850 hPa (v850) presents a lower year-to-year variation than the reference data’s. We observed that the CFSR and the MERRA have a worse performance in capturing v850 variation than the other six re-analyses, with NSDs of 1.48 and 1.58, respectively.
A further evaluation focuses on the re-analysis datasets and their ensemble mean in representing the inter-annual variability of the three variables over land (Figure 2b) and ocean (Figure 2c). In general, the pr and the v850 exhibit better performance (with higher correlation coefficient) over land than over oceans, while the SLP and the u850 show the opposite performance. We find that the CFSR and the NCEPII have a lower correlation and a higher NSD than the other re-analysis datasets. The re-analysis mean captures a more realistic year-to-year variation of the four variables. It shows a higher correlation coefficient than the individual re-analysis dataset.
3.3. Spatial Difference in Re-Analysis Datasets
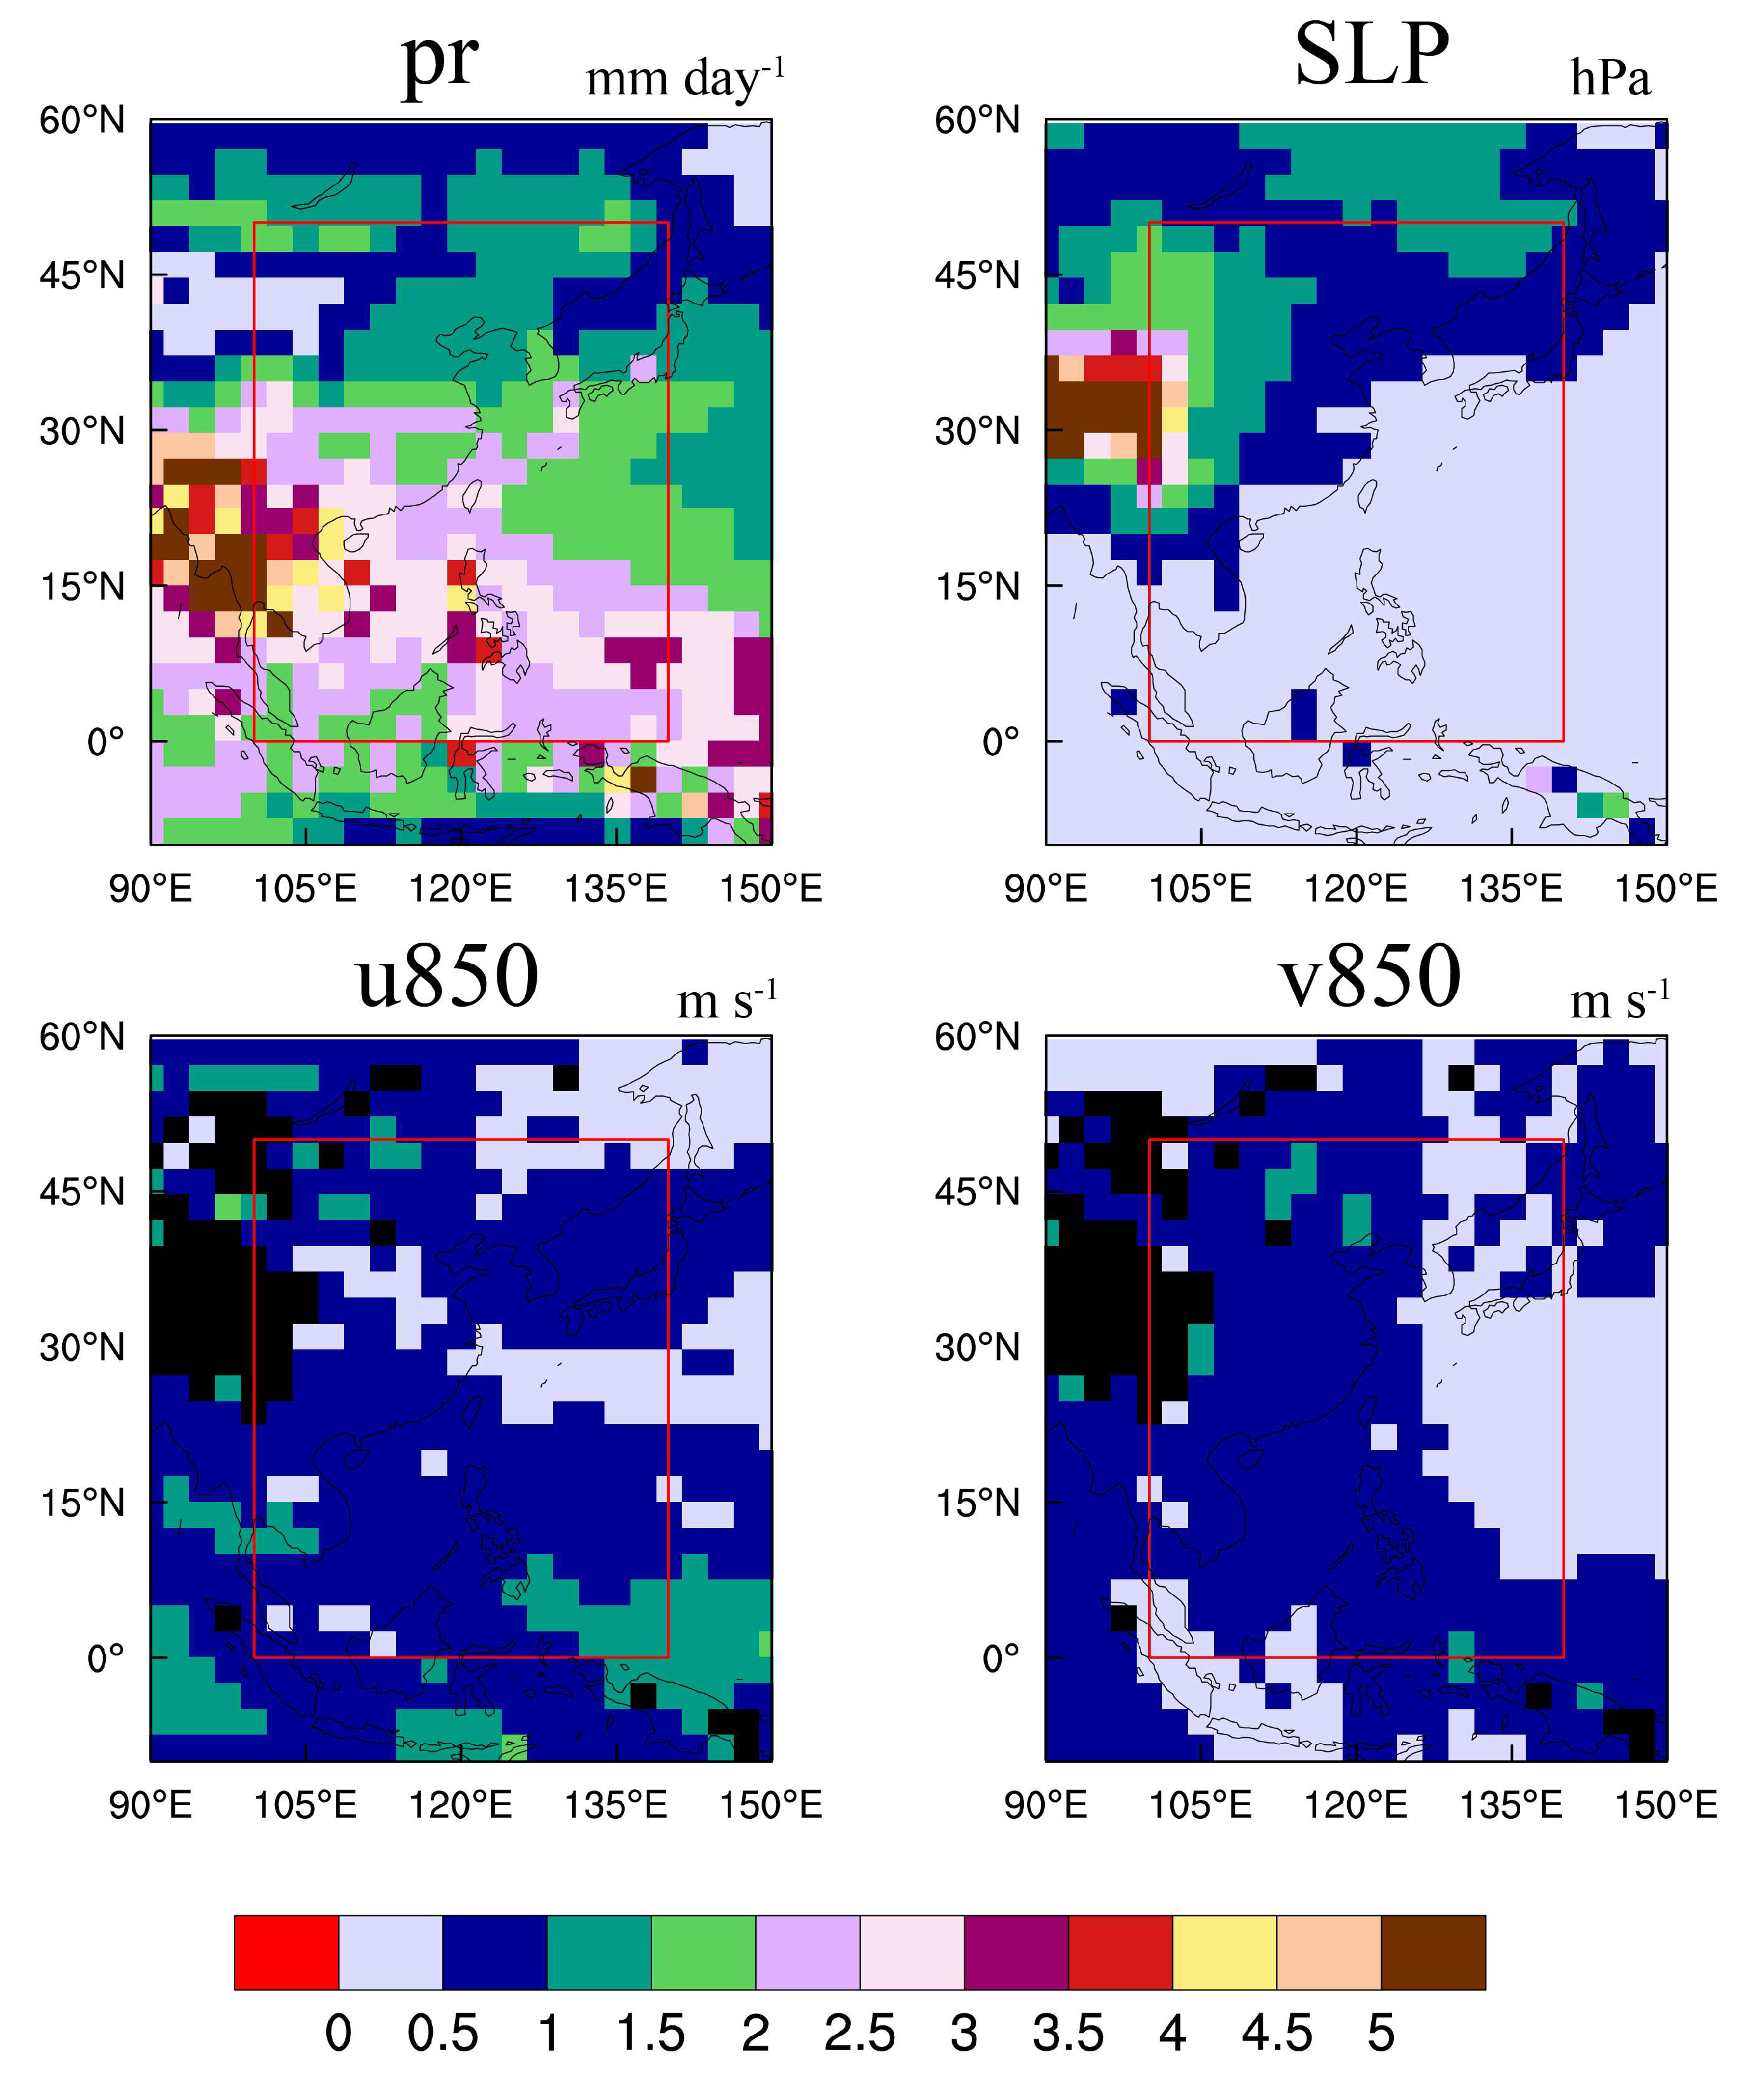
Figure 3 presents the ensemble standard deviation (ESD) of the eight re-analyses for the four meteorological variables. It shows the inter-reanalysis difference. The precipitation spread decreases with increasing latitude. A large ESD (~3 mm day−1) occurs in the low latitude region, especially in the western Indo-China peninsula, where the ESD is >5 mm day−1. For the u850 and v850, the re-analyses show high consistency, with ESD ~1 mm s−1 in the entire EASM region. There is no prominent difference among the re-analyses in representing SLP over ocean. However, we found a large ESD of SLP over land, especially in the western EASM region (i.e., Tibetan Plateau; ESD > 3 hPa). The ESD of ua200 shows a “sandwich” pattern, with high-low-high distribution in our study region.
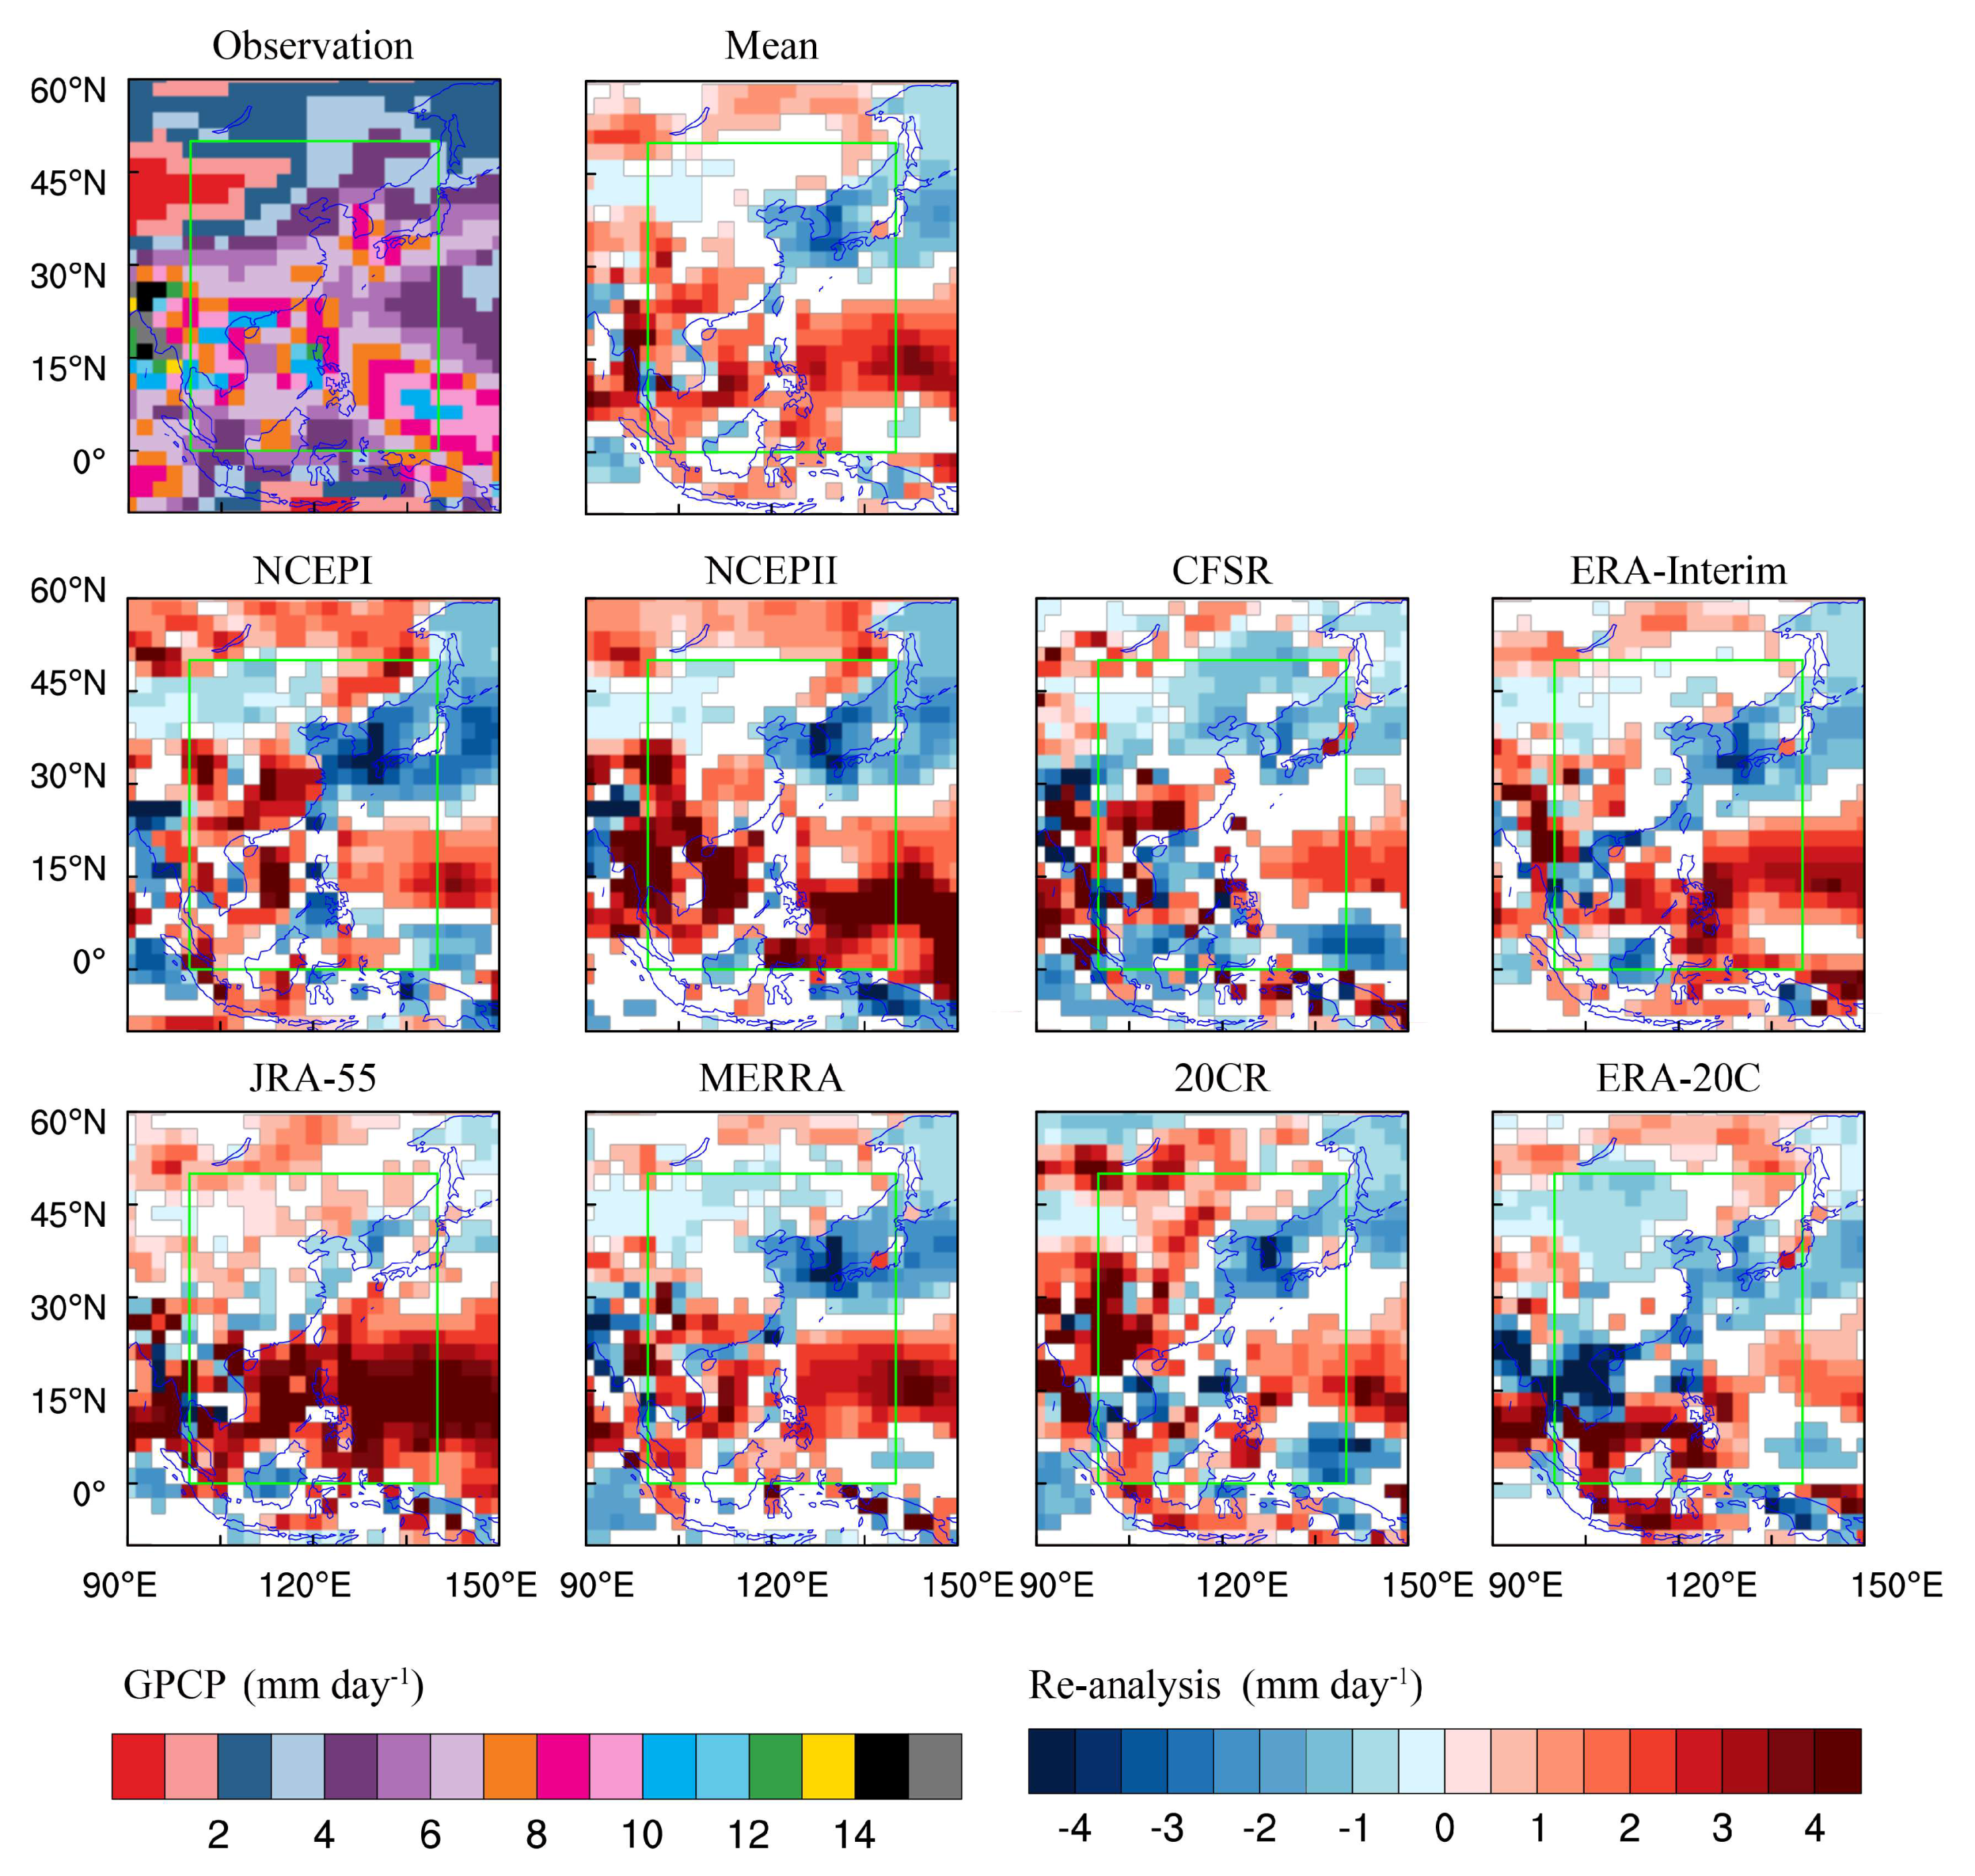
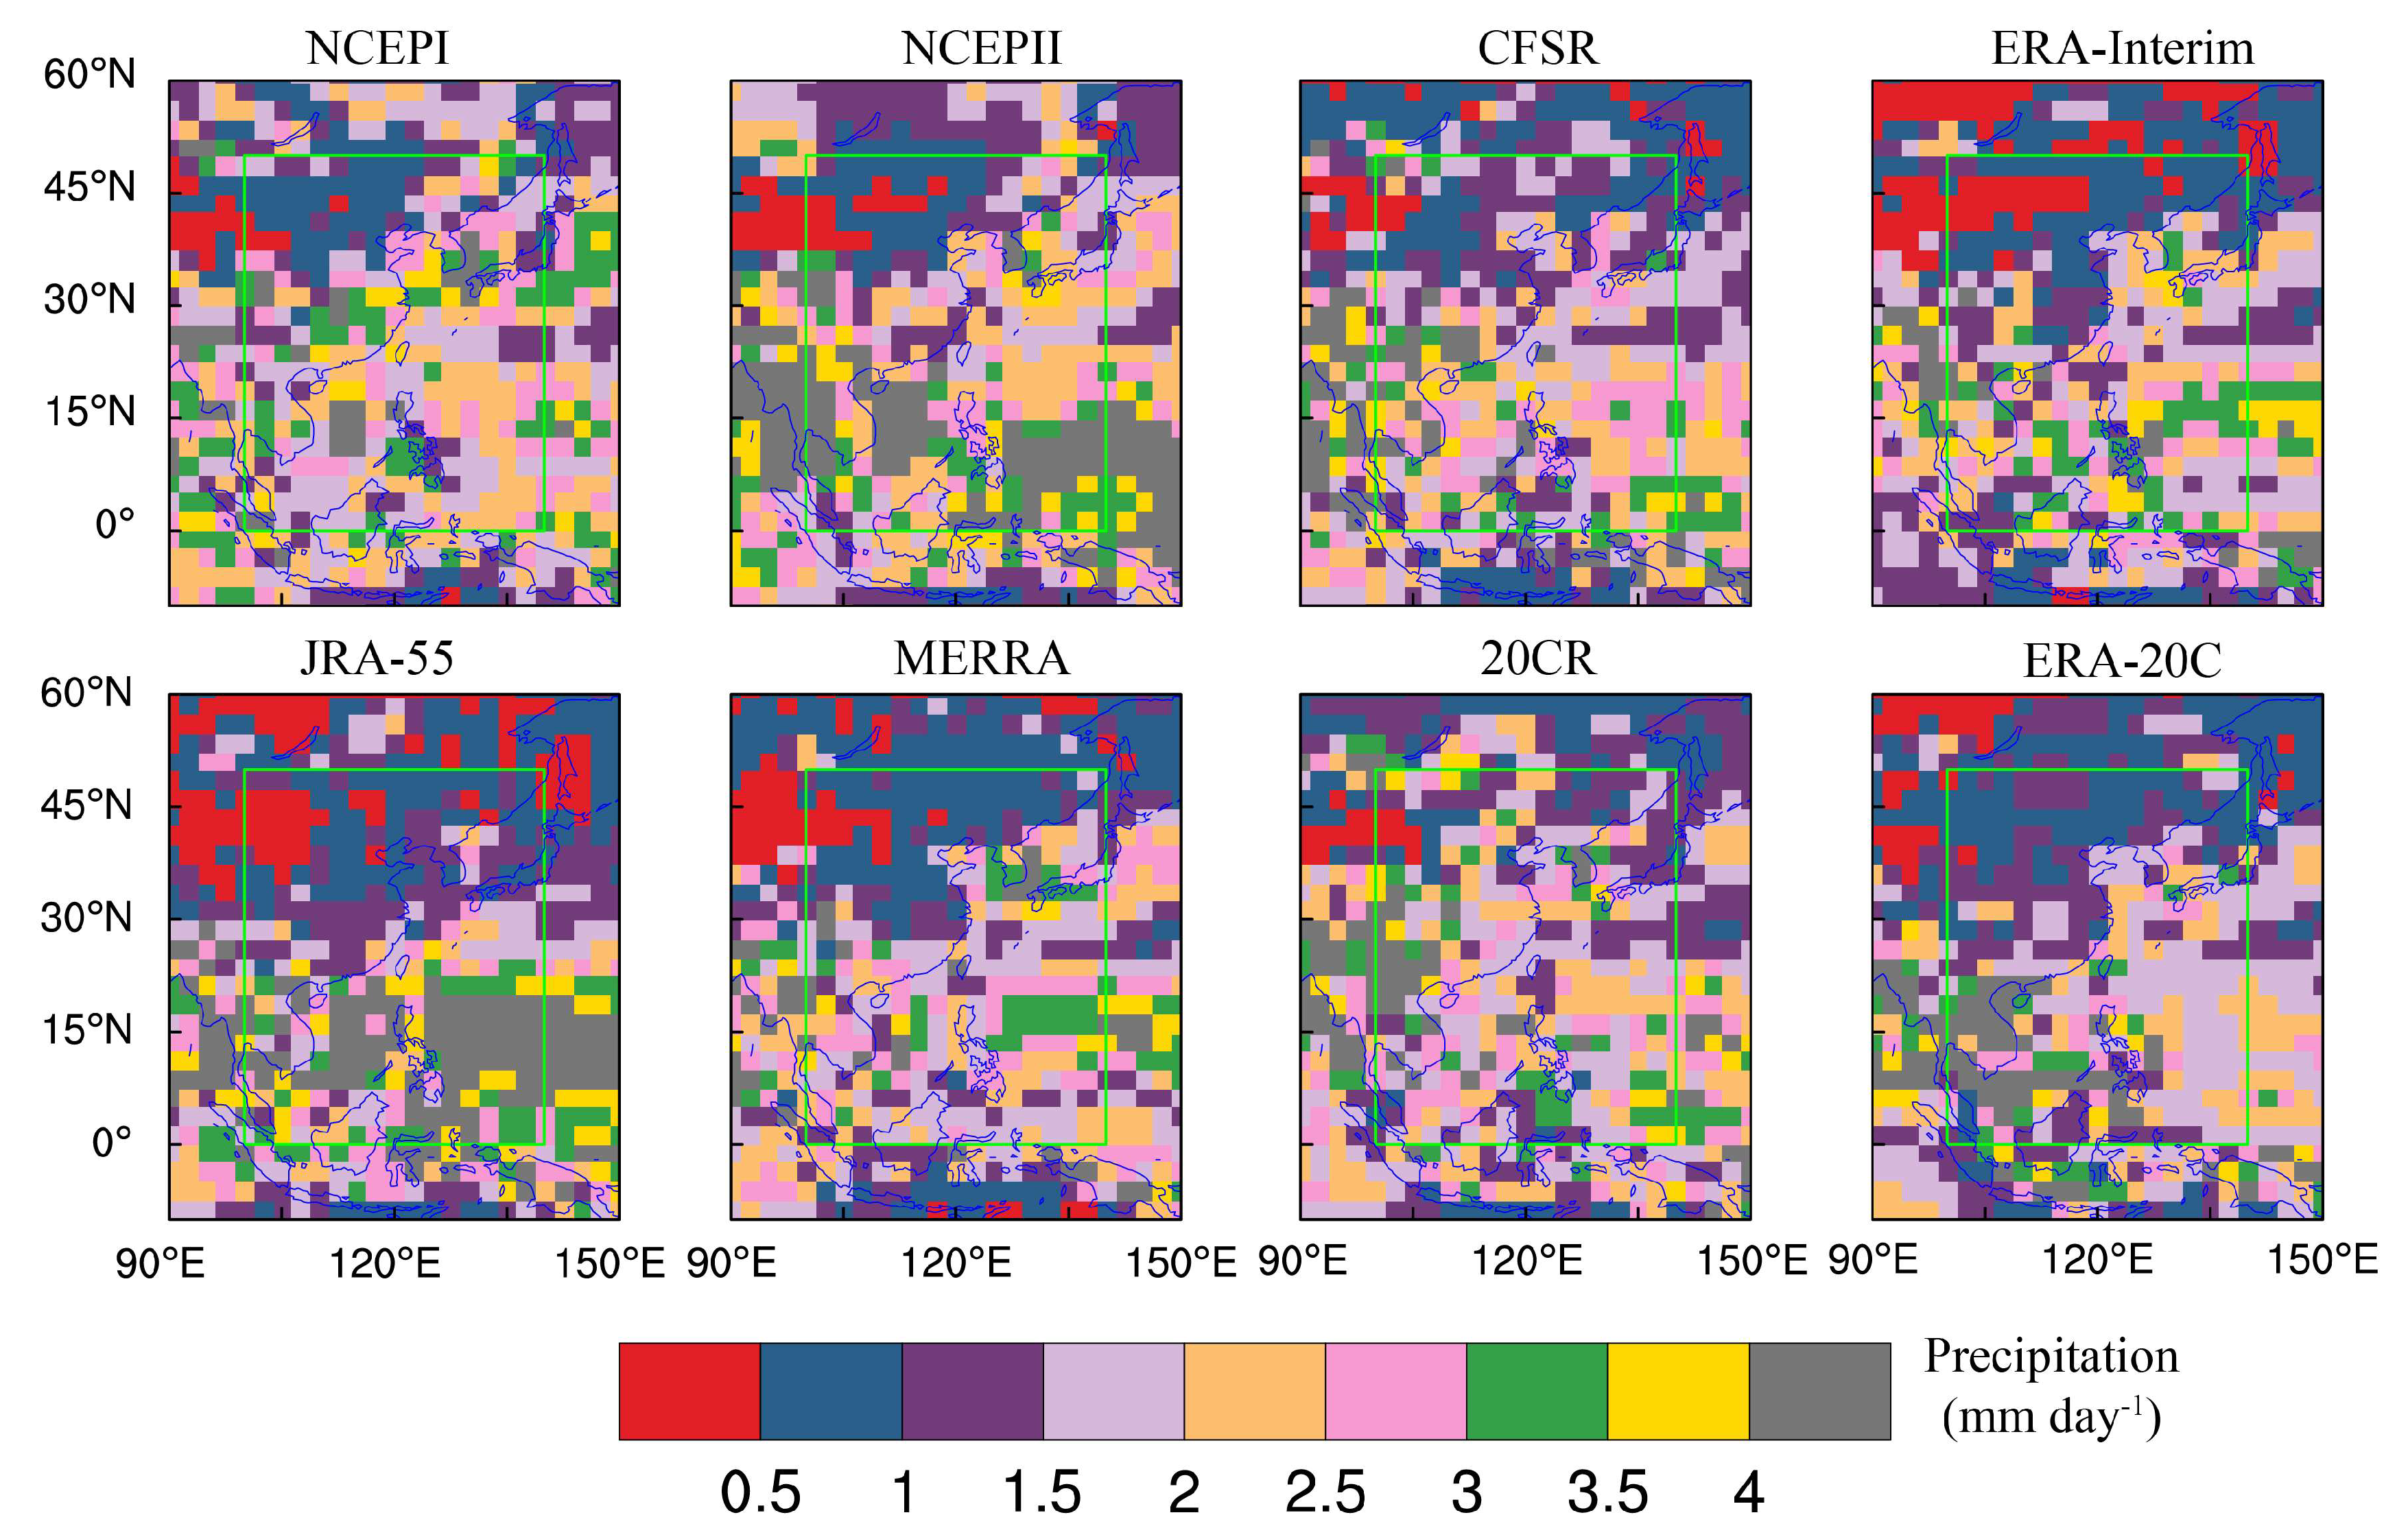
For a specific variable (e.g., pr and SLP) and region, the re-analysis members show significant disagreement among them. We employ the BIAS analysis to quantify their magnitude of deviation from observation (Figure 4 and Figure 5). In monsoon season, the inter-tropical convergence zone reaches its northernmost location. The water moisture is transported by northward wind from ocean to land. Two rainfall belts are located in the East Asia; the south branch stretches from the Bay of Bengal, over the Indo-China peninsula and the Philippine Sea, and the north branch occurs over the east of China, the Korean peninsula and the south of Japan (Figure 4; cf. observation).
The eight re-analysis datasets capture the major features of the spatial distribution of rainfall in the monsoon season. However, these datasets tend to generate significantly wetter conditions in the southern EASM region (i.e., the South China Sea and the Philippines) and much drier conditions over the Korean peninsula and Japan. The third generation of re-analysis datasets presents a better performance (with small BIAS) in capturing the summer rainfall, especially in mainland China, the Korean peninsula and Japan than the first- and the extended-generation re-analysis datasets. It is worth mentioning that only the ERA-Interim and the ERA-20C produce more rainfall in the Indo-China peninsula, whereas the other six re-analysis datasets generate less rainfall. The large rainfall BIAS occurs along with the lower level of general circulation (i.e., wind fields at 850 hPa) BIAS. There is a significant wind BIAS over the South China Sea and the Philippine Sea. In northern China, the 20CR shows a larger northwestward wind than the observation, but the other seven re-analysis datasets illustrate a good agreement with the observation (Figure 4).
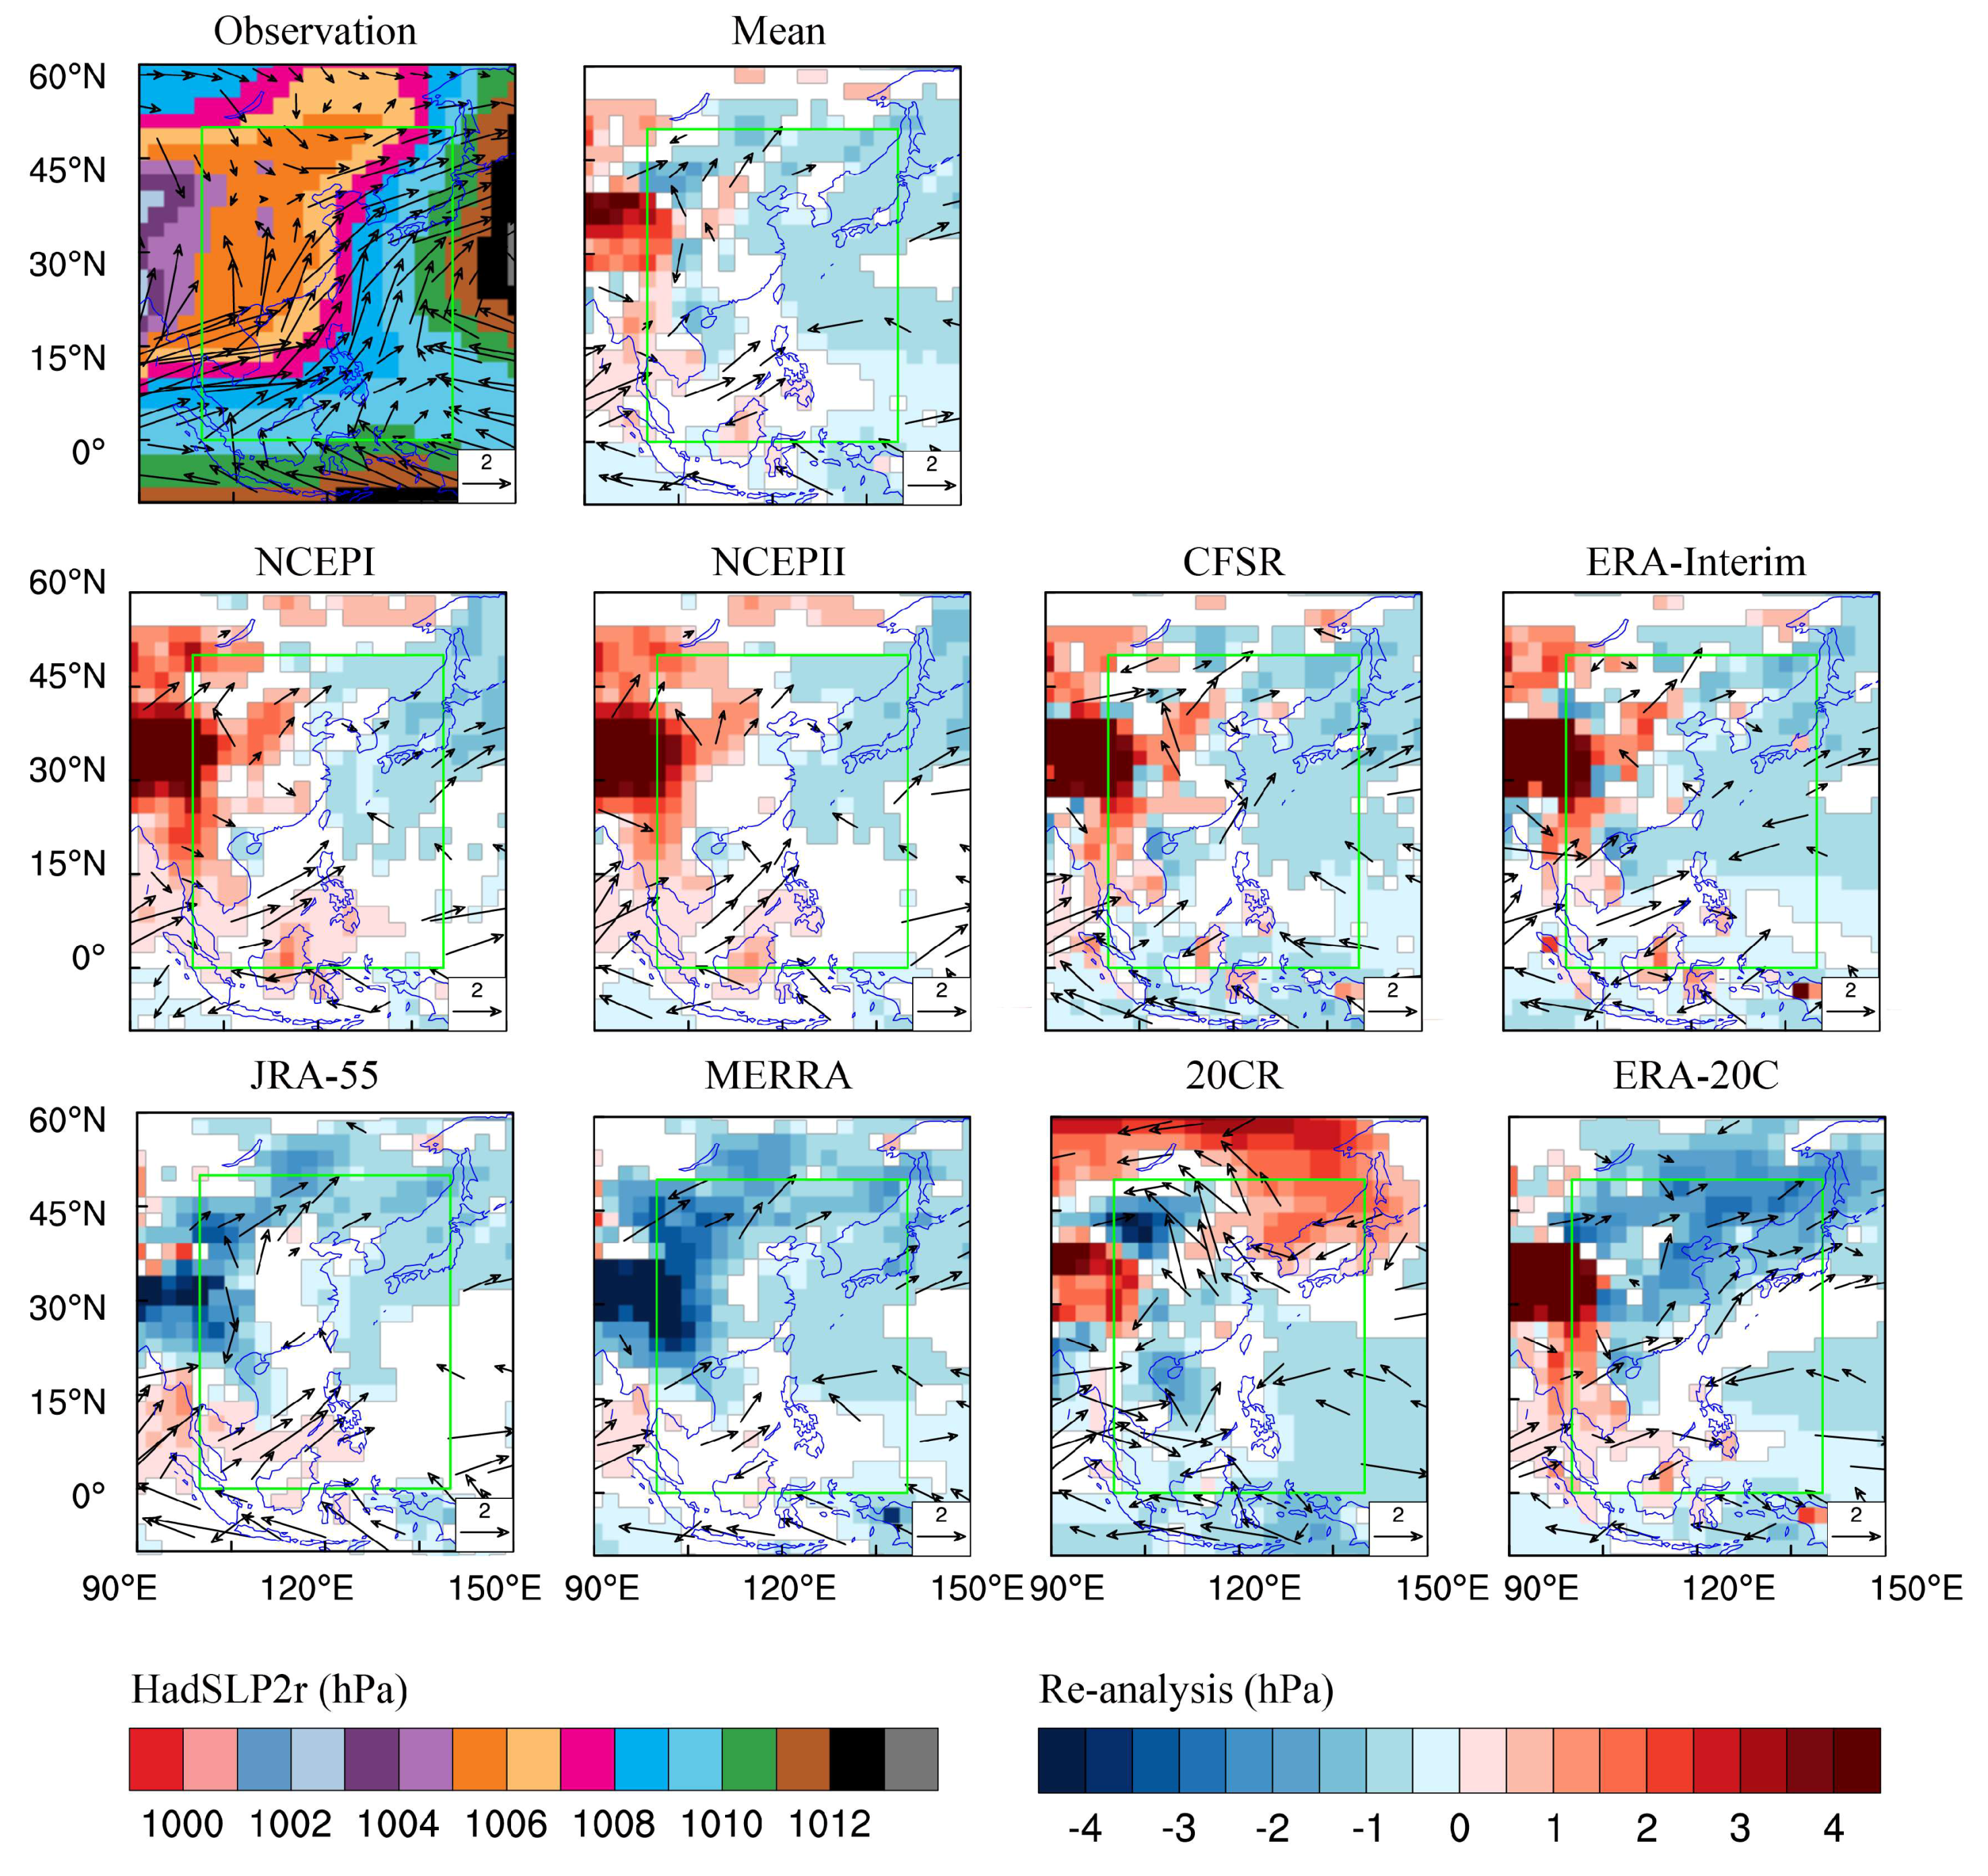
In the summer season, the land (ocean) is a heat source (sink), with lower (higher) mean sea surface pressure (Figure 5; cf. observation). The Tibetan Plateau presents a prominent low pressure centre due to its huge topography. The first-generation re-analysis datasets produce higher SLP in the Tibetan Plateau, the western part of the Indo-China peninsula and Indonesia, and lower SLP in Japan and the Sea of Japan (Figure 5; cf. NCEPI and NCEPII). The CFSR and the ERA-Interim have the same performance in presenting SLP in the Tibetan Plateau and Japan, but illustrate no significant BIAS in the Indo-China peninsula and Indonesia. However, these two datasets generate less SLP in the East China Sea. Both the JRA-55 and the MERRA show the prominent negative BIAS of SLP in the western (e.g., Tibetan Plateau, southwest of China etc.) and the northern (e.g., Mongolia, northern of China etc.) EASM region. The 20CR demonstrates positive BIAS at the centre of SLP in the south of the Tibetan Plateau, the northeast of China and the northern Sea of Japan, but produces less SLP in the western South China Sea and the Philippine Sea. Compared to the HadSLP2r, the ERA-20C generates more SLP in the Tibetan Plateau and the western Indo-China peninsula, but less SLP in the northern EASM region.
RMSE is widely used to measure the difference between two datasets. Figure 6 illustrates the RMSE skill of the eight re-analyses in representing the precipitation. The RMSE of precipitation shows a various distribution in the eight re-analyses. In general, the RMSE centre is associated with a large BIAS centre. All the re-analysis datasets demonstrate a larger RMSE of precipitation in the southern than in the northern part of the EASM region. However, the amplitude of RMSE is different in specific areas. The NCEPI, the CFSR, the 20CR and the ERA-20C have an RMSE of ~2 mm day−1 in the Philippine Sea, where the NCEPII, the ERA-Interim, the JRA-55 and the MERRA produce RMSE > 4 mm day−1. In the south and east of China, the NCEPI, the CFSR and the 20CR generate a significantly large RMSE centre (3–4 mm day−1), while the other five re-analyses’ RMSE is ~1 mm day−1. Obviously, the RMSE of precipitation is inconsistent in the Korean peninsula and the south of Japan. In that area, the NCEPI, the NCEPII, the ERA-Interim, the MERRA and the 20CR have a large RMSE centre (RMSE > 4 mm day−1); the CFSR, the JRA-55 and the ERA-20C show good agreement with the observed precipitation (with RMSE ~1 mm day−1).
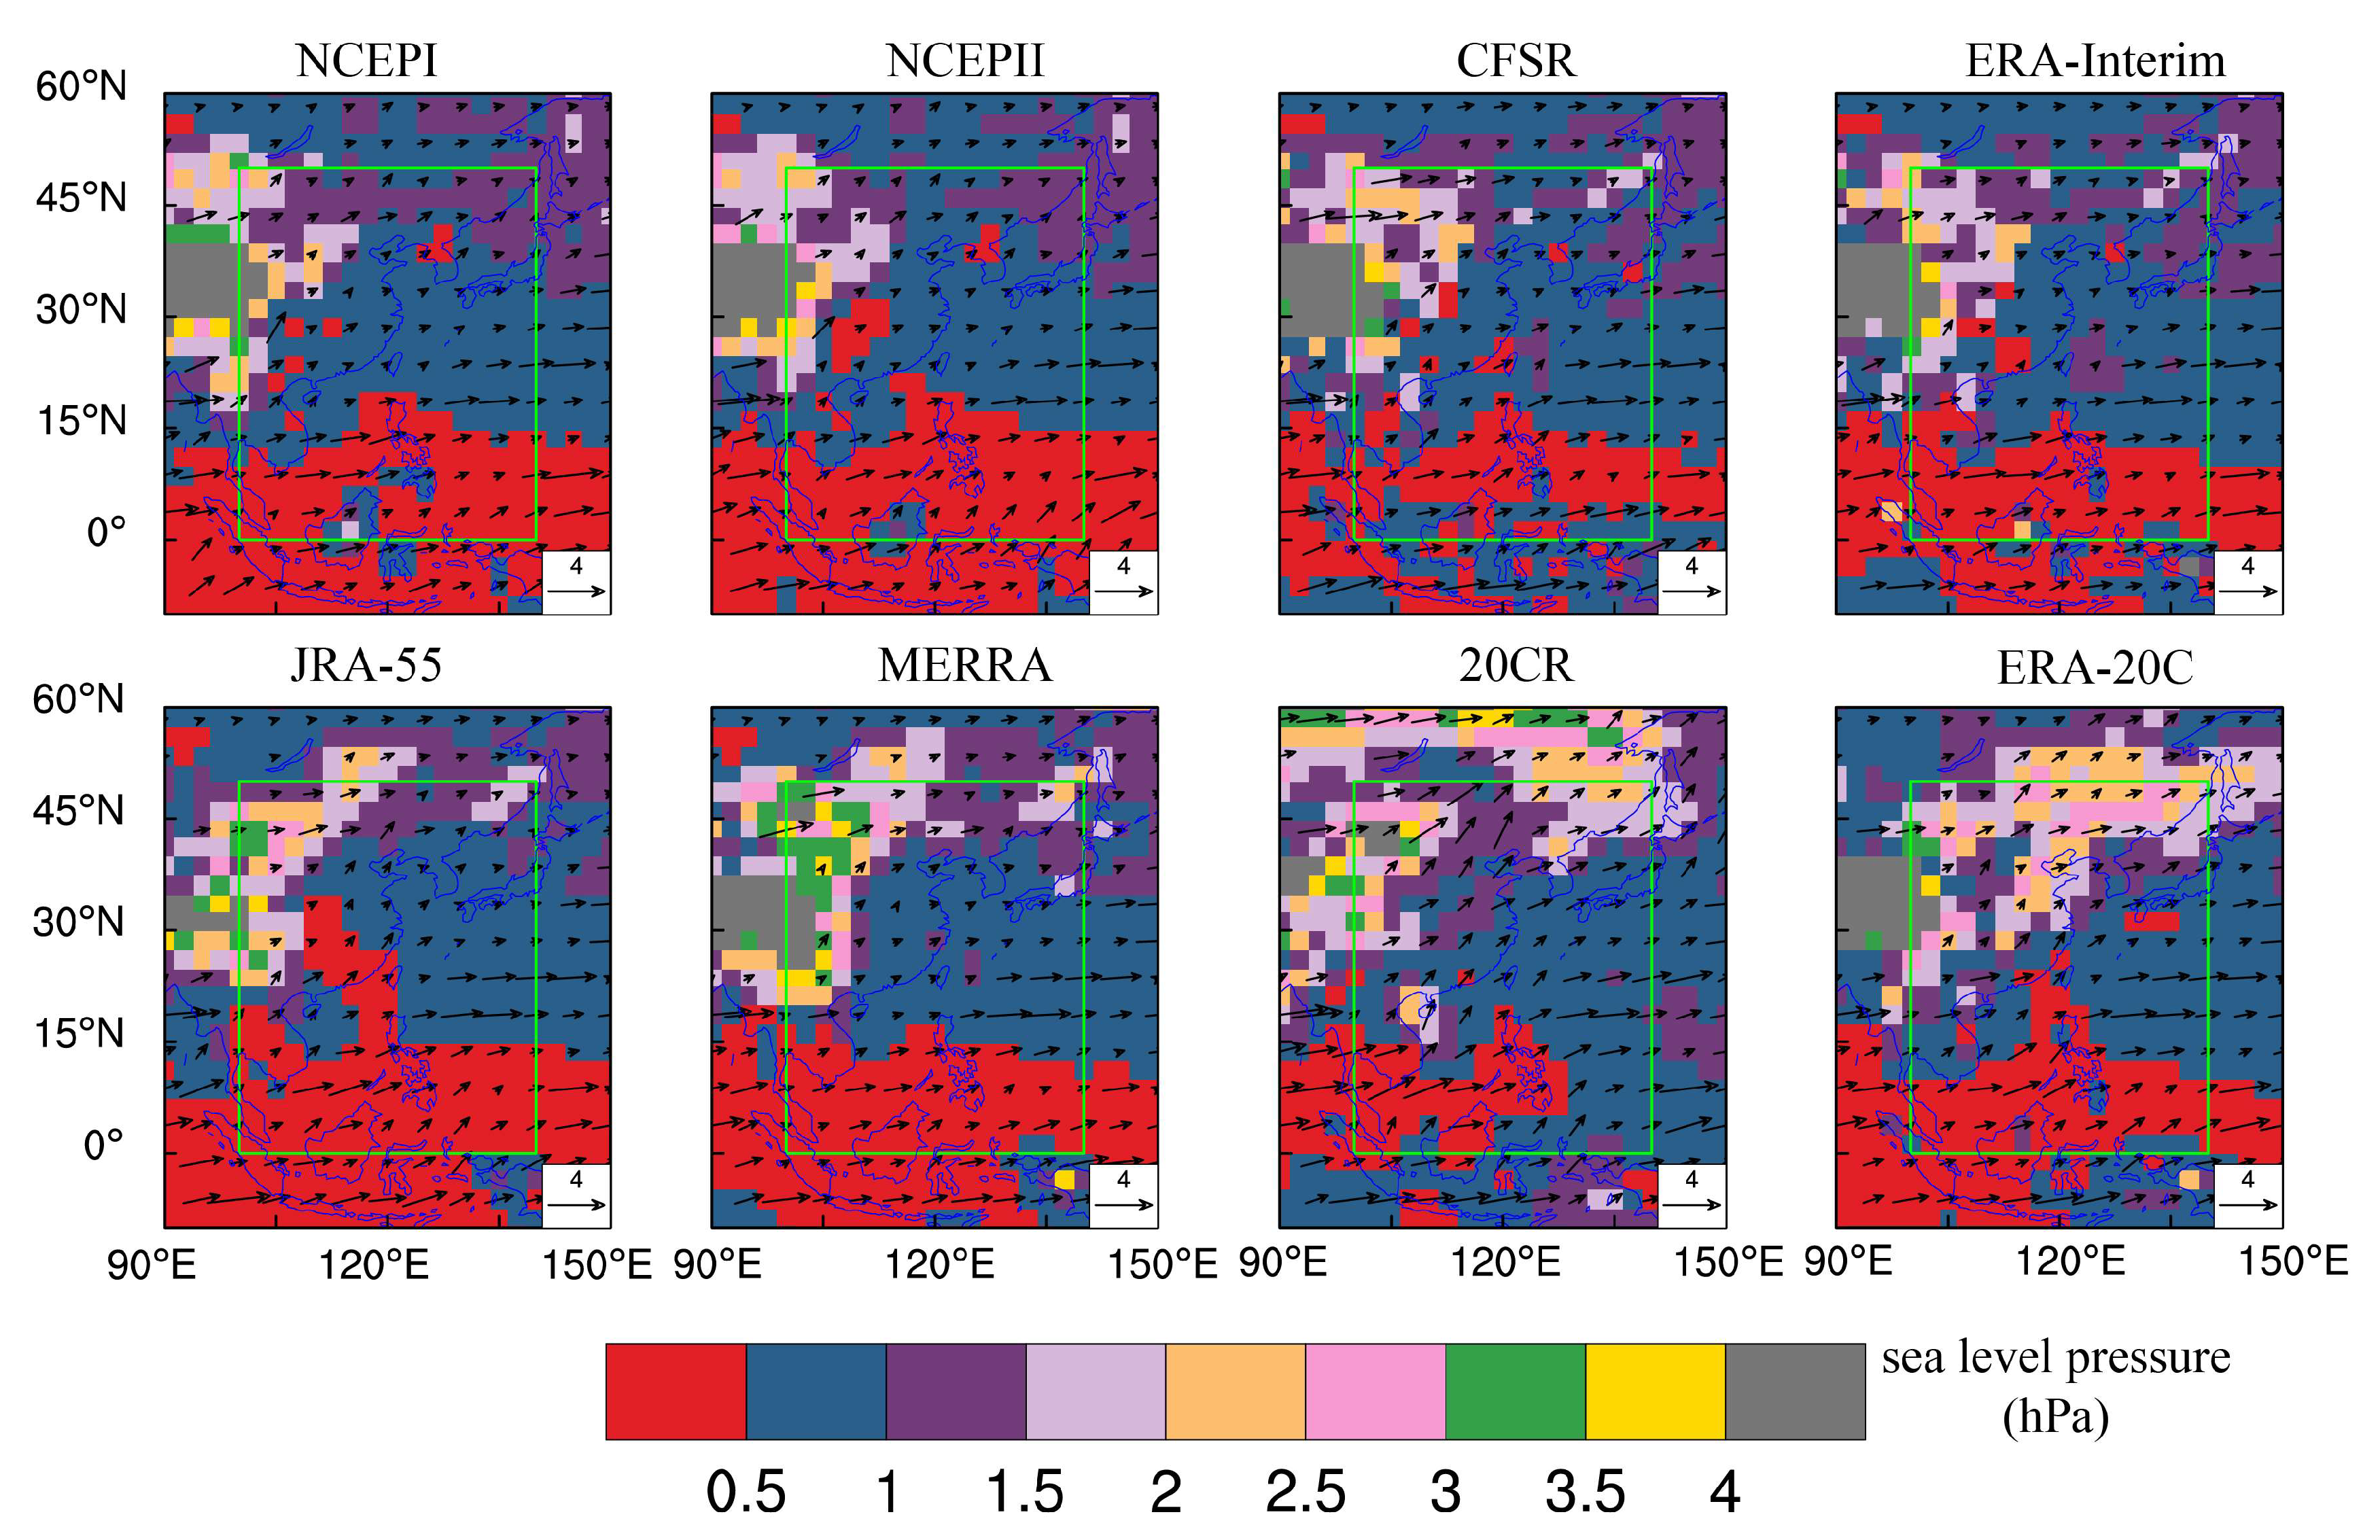
At low latitudes, the re-analyses show good agreement with the observation in presenting the year-to-year variation of SLP (with RMSE ~0 hPa; Figure 7). There is no doubt that all the re-analyses have a large RMSE of SLP over the Tibetan Plateau. In northern China and Mongolia, the re-analyses exhibit a larger RMSE score (~1 hPa) than at low latitudes. The ERA-20C calculates the RMSE centre of SLP (RMSE > 2 hPa) from northern China to the northeast of China. For the u850 and v850, the re-analyses demonstrate distinct RMSE scores in the northwest of China, Mongolia, the South China Sea and the Philippine Sea. In these areas, u850 and v850 exhibit a significant difference between the re-analysis datasets, and also from the observation.
3.4. Monsoon Strength
The EASM is characterised by strong year-to-year variability. To measure the strength and study the long-term change of the EASM, more than 25 monsoon indices have been produced in the last few decades. Wang et al. [37] classified these monsoon indices into five categories and analysed their performance in capturing the main features of the EASM. They found that the Wang and Fan index [38] outperforms the other 24 monsoon indices in capturing the three-dimensional circulation and total variance of the precipitation over East Asia. Following Wang et al. [37], we select the Wang and Fan index in our further study. The definition of the Wang and Fan index is the standardised average zonal wind at 850 hPa at (5–15° N, 90–130° E) minus that at (22.5–32.5° N, 110–140° E).
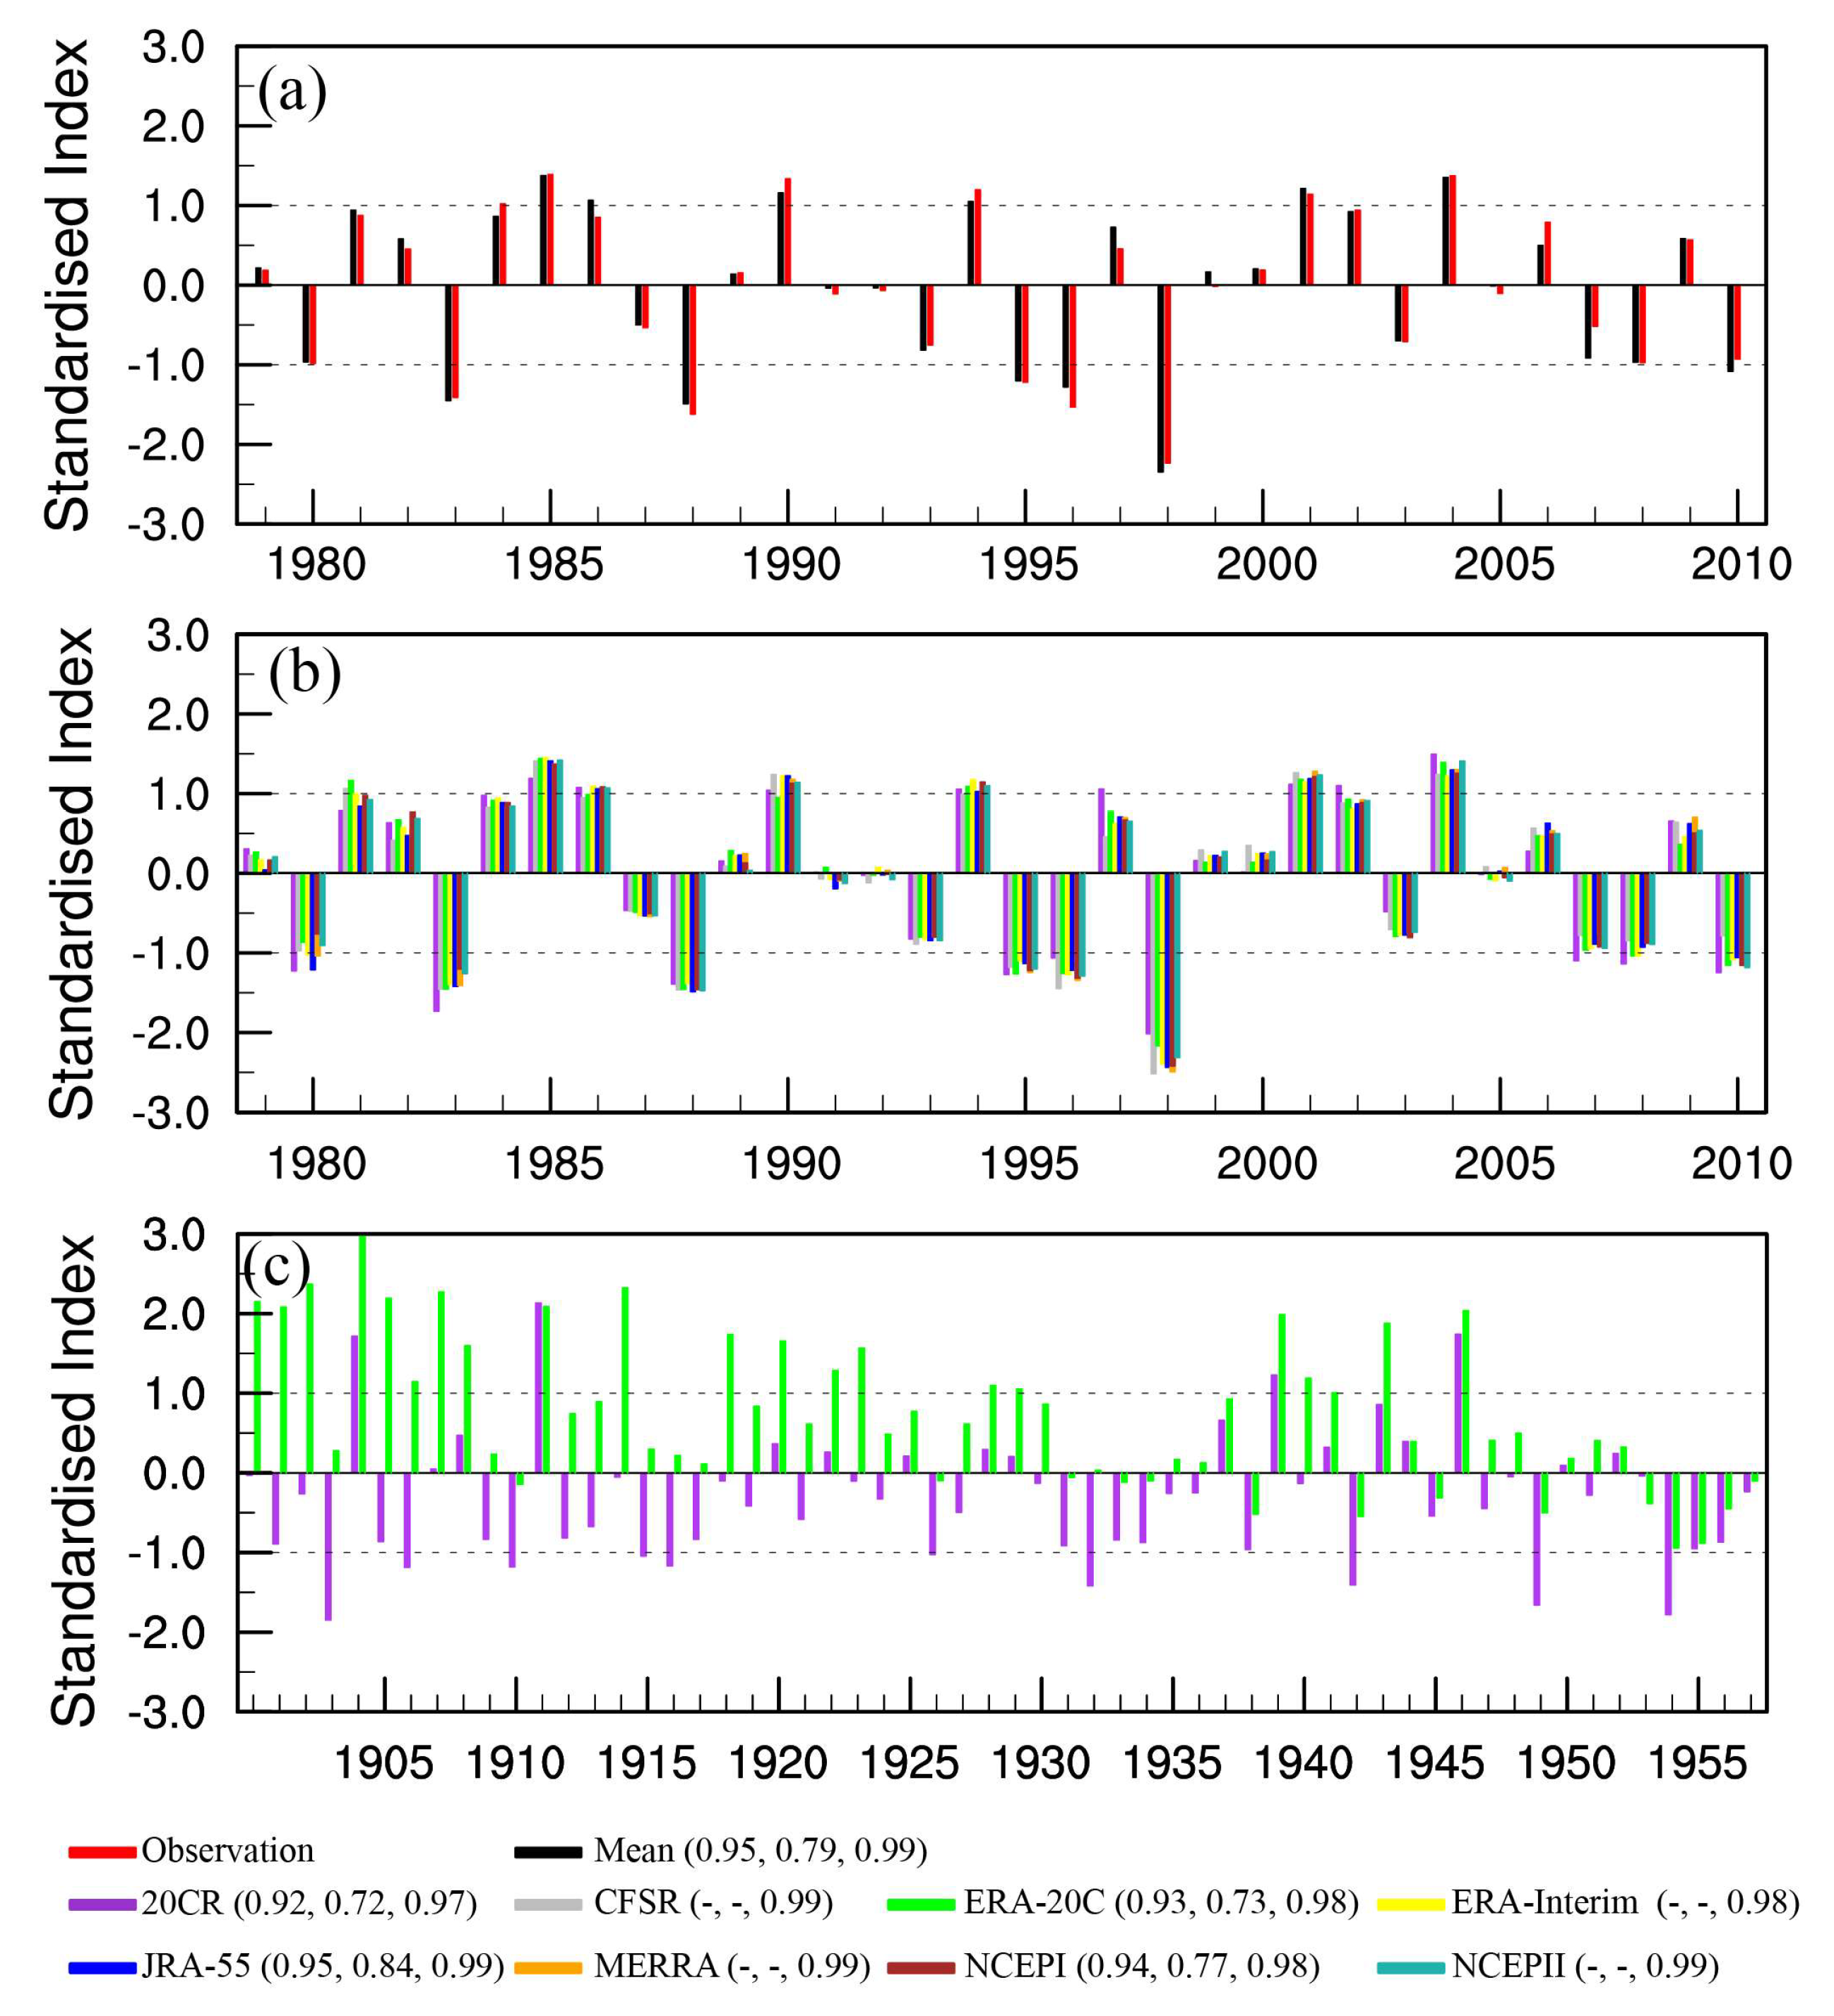
Figure 8a illustrates the observed (IGRA) and the multi-reanalysis ensemble mean produced EASM index (EASMI). The re-analysis ensemble mean shows good agreement with the observation in representing the EASMI. For the individual re-analysis, it can capture the phase of EASMI, only showing a slight difference in capturing the EASMI magnitude (Figure 8b). The range of correlation coefficient between the EASMI in observation and in the re-analyses is from 0.97 to 0.99 during the satellite era (1979–2010). A lower correlation coefficient (0.72–0.84) can be found in the pre-satellite era (1958–1978). The 20CR indicates an extremely strong monsoon year (EASMI > 1) in 1997 and 2007, but the observation and the other re-analysis datasets show a normal monsoon year (EASMI > −1 and EASMI < 1). The 20CR and ERA-20C show good agreement from the mid-1930s to the end 1950s (Figure 8c). However, the two datasets present different monsoon phases from 1900 to the early 1930s. They produce the same monsoon phases and similar monsoon magnitudes in two strong monsoon years (1904 and 1911).
4. Summary and Discussion
In this study, eight current re-analysis datasets (20CR, CFSR, ERA-20C, ERA-Interim, JRA-55, MERRA, NCEPI, and NCEPII) have been inter-compared to identify their uncertainties in representing the EASM rainfall and general circulation. We have analysed the precipitation structure, and the inter-annual variability of six variables which contribute to the EASM. The third generation of re-analysis datasets show better performance in capturing the rainfall structure (with higher PCC) than the first- and extended-generation re-analysis datasets in the study region. The re-analyses illustrate a close correlation ability and normalised standard deviation to the observed regional mean zonal winds (i.e., u850) and mean sea level pressure, but a large spread of these abilities for rainfall and meridional winds (i.e., v850). There is no doubt that the re-analyses generate different rainfall because the rainfall is a “forecast” variable. MERRA is the only dataset which assimilates the rain rate from SSM/I and TRMM. However, it is not the best re-analysis at capturing the rainfall structure and inter-annual variability of rainfall in the study region. The quality of precipitation strongly depends upon the numerical weather models and data assimilation system [10,26]. The CFSR shows a better estimate of observed precipitation due to the fact that it employs a more advanced model and an updated convection parameterisation (modified Tiedtke shallow convection) in comparison to the NCEPI and NCEPII [12].
The re-analyses exhibit a larger spread in producing the pr and SLP than the u850 and v850. The BIAS skill and RMSE skill of each variable in the different re-analysis datasets have been inter-compared. Because of model performance, the precipitation generated by re-analysis demonstrates significant differences. The mean sea level pressure is directly assimilated from observation. However, we found prominent discrepancies among the re-analyses occurring in the west and northeast of China, where the topography is complex. In these regions, the JRA-55 and the MERRA present a negative BIAS to the observed SLP, while the other six re-analyses exhibit a positive BIAS. A possible reason is the different re-analysis datasets using different land-surface models. A different land-surface process might lead to a significant BIAS in regions where surface pressure observations are sparse [14,39]. We suggest that evaluation of the mean sea level pressure-based monsoon index before it is used for further analysis.
The re-analyses produce a consistent wind field at lower levels (850 hPa). Previous studies have concluded the same thing [28,40]. However, the 20CR and ERA-20C generate a large departure from the observed winds, because their data assimilation system only ingests surface observations and excludes the upper-air variables [16,17]. Therefore, the 20CR and ERA-20C are ancillary comparison datasets in the satellite era. Overall, ERA-Interim has the highest skill in capturing EASM precipitation transition, followed by MERRA. JRA-55 outperforms in presenting the SLP. MERRA shows the best performance for producing the low-level monsoon general circulation.
The EASM index is calculated by zonal wind at 850 hPa, which can indicate the monsoon strength and precipitation distribution in East Asia. The EASM index in re-analysis shows good agreement with that perceived in observation, with a higher correlation coefficient. Only the 20CR exhibits a slight difference in representing the magnitude of the EASM index in specific years (e.g., 1997 and 2007). We can thus omit re-analysis uncertainty in representing the EASM strength. The 20CR and ERA-20C are optional datasets to analyse the variability/change of EASM since the mid-1930s. In the early 20th century, the two datasets showed less agreement. The 20CR illustrates a better monsoon variation than the ERA-20C in this period. We suggest that the 20CR is the best dataset for calibration of model-simulated EASM strength in the early 20th century.
Author Contributions
B. H. , and U. C. conceived of the study. B. H., and Y. L. analysed the data and produced the figures. All authors wrote the paper.
Funding
This research received no external funding.
Acknowledgments
This work was supported by the China Scholarship Council (CSC) and the Center for International Cooperation in Freie Universität Berlin (CIC FU-Berlin). We thank the organisations listed in Table 1 of this paper for producing and making these datasets available. The authors acknowledge two anonymous reviewers for their useful inputs to the manuscript. We acknowledge support by the Open Access Publication Fund of Freie Universität Berlin.
Conflicts of Interest
The authors declare no conflict of interest.
Abbreviations
| 20CR | Twentieth Century Reanalysis |
| 3D-Var | three-dimensional variational data assimilation |
| 4D-Var | four-dimensional variational data assimilation |
| AMSU-A | Advanced Microwave sounding Unit-A |
| BOM | Bureau of Meteorology |
| CFSR | Climate Forecast System Re-analysis |
| CIRES | Cooperative Institute for Research Environmental Sciences |
| DOE | Department of Energy |
| ECMWF | European Centre for Medium Range Weather Forecasts |
| ENSO | El Niño-Southern Oscillation |
| ERA-20C | ECMWF’s first atmospheric re-analysis of the 20th century |
| ERA-40 | ECMWF 45-year Reanalysis |
| ERA-Interim | ECMWF Interim Re-analysis |
| ERS | European Remote Sensing Satellite |
| ESA | European Space Agency |
| ESRL | Earth System Research Laboratory |
| EUMETSAT | European Organisation for the Exploitation of Meteorological Satellites |
| GEOS | Goddard Earth Observing System |
| GMAO | Global Modeling and Assimilation Office |
| GPCP | Global Precipitation Climatology Project |
| HadISST | Hadley Centre Sea Ice and SST dataset |
| HadSLPr2r | extended Hadley Centre’s monthly historical mean sea level pressure dataset |
| ICOADS | International Comprehensive Ocean-Atmosphere Data Set |
| IFS | Integrated Forecasting System |
| IGRA | Integrated Global Radiosonde Archive |
| ISPD | International Surface Pressure Databank |
| JMA | Japan Meteorological Agency |
| JRA-25 | Japanese 25-year Reanalysis |
| JRA-55 | Japanese 55-year Re-analysis |
| MERRA | Modern Era Retrospective-Analysis for Research and Applications |
| MSU | Microwave Sounding Unit |
| NCAR | National Center for Atmospheric Research |
| NCEP | National Centers for Environmental Predictions |
| NOAA | National Oceanic and Atmospheric Administration |
| PSD | Physical Sciences Division |
| SBUV | Solar Backscattered Ultra Violet |
| SSM/I | Special Sensing Microwave/Imager |
| TIROS | Television Infrared Observation Satellite |
| TOVS | TIROS Operational Vertical Sounder |
| TRMM | Tropical Rainfall Measuring Mission |
References
- Tao, S.Y.; Chen, L.X. A Review of Recent Research On the East Asian Summer Monsoon in China, in Monsoon Meterology; Chang, C.-P., Krishnamurti, T.N., Eds.; Oxford University Press: Oxford, UK, 1987; pp. 60–92. [Google Scholar]
- Wang, B.; Ding, Q.; Liu, J. Concept of Global Monsoon. In The Global Monsoon System; World Scientific: Singapore, 2012; pp. 3–14. [Google Scholar]
- He, J.H.; Zhu, Z.W. The relation of South China Sea monsoon onset with the subsequent rainfall over the subtropical East Asia. Int. J. Climatol. 2015, 35, 4547–4556. [Google Scholar] [CrossRef]
- Zhu, Z.W.; He, J.H.; Qi, L. Seasonal Transition of East Asian Subtropical Monsoon and Its Possible Mechanism. J. Trop. Meteorol. 2012, 18, 305–313. [Google Scholar]
- Peterson, T.C.; Vose, R.S. An overview of the global historical climatology network temperature database. Bull. Am. Meteorol. Soc. 1997, 78, 2837–2849. [Google Scholar] [CrossRef]
- Kalnay, E.; Kanamitsu, M.; Kistler, R.; Collins, W.; Deaven, D.; Gandin, L.; Iredell, M.; Saha, S.; White, G.; Woollen, J.; et al. The NCEP/NCAR 40-Year Reanalysis Project. Bull. Am. Meteorol. Soc. 1996, 77, 437–471. [Google Scholar] [CrossRef] [Green Version]
- Kanamitsu, M.; Ebisuzaki, W.; Woollen, J.; Yang, S.-K.; Hnilo, J.J.; Fiorino, M.; Potter, G.L. NCEP–DOE AMIP-II Reanalysis (R-2). Bull. Am. Meteorol. Soc. 2002, 83, 1631–1643. [Google Scholar] [CrossRef]
- Uppala, S.M.; Kallberg, P.W.; Simmons, A.J.; Andrae, U.; Bechtold, V.D.; Fiorino, M.; Gibson, J.K.; Haseler, J.; Hernandez, A.; Kelly, G.A.; et al. The ERA-40 re-analysis. Q. J. R. Meteorolog. Soc. 2005, 131, 2961–3012. [Google Scholar] [CrossRef] [Green Version]
- Onogi, K.; Tslttsui, J.; Koide, H.; Sakamoto, M.; Kobayashi, S.; Hatsushika, H.; Matsumoto, T.; Yamazaki, N.; Kaalhori, H.; Takahashi, K.; et al. The JRA-25 reanalysis. J. Meteor. Soc. Jpn. 2007, 85, 369–432. [Google Scholar] [CrossRef]
- Bosilovich, M.G.; Chen, J.Y.; Robertson, F.R.; Adler, R.F. Evaluation of global precipitation in reanalyses. J. Appl. Meteorol. Clim. 2008, 47, 2279–2299. [Google Scholar] [CrossRef]
- Saha, S.; Nadiga, S.; Thiaw, C.; Wang, J.; Wang, W.; Zhang, Q.; Van den Dool, H.M.; Pan, H.L.; Moorthi, S.; Behringer, D.; et al. The NCEP Climate Forecast System. J. Clim. 2006, 19, 3483–3517. [Google Scholar] [CrossRef]
- Saha, S.; Moorthi, S.; Pan, H.-L.; Wu, X.; Wang, J.; Nadiga, S.; Tripp, P.; Kistler, R.; Woollen, J.; Behringer, D.; et al. The NCEP Climate Forecast System Reanalysis. Bull. Am. Meteorol. Soc. 2010, 91, 1015–1057. [Google Scholar] [CrossRef]
- Dee, D.P.; Uppala, S.M.; Simmons, A.J.; Berrisford, P.; Poli, P.; Kobayashi, S.; Andrae, U.; Balmaseda, M.A.; Balsamo, G.; Bauer, P.; et al. The ERA-Interim reanalysis: Configuration and performance of the data assimilation system. Q. J. R. Meteorolog. Soc. 2011, 137, 553–597. [Google Scholar] [CrossRef]
- Kobayashi, S.; Ota, Y.; Harada, Y.; Ebita, A.; Moriya, M.; Onoda, H.; Onogi, K.; Kamahori, H.; Kobayashi, C.; Endo, H.; et al. The JRA-55 Reanalysis: General Specifications and Basic Characteristics. J. Meteorol. Soc. Jpn. Ser. II 2015, 93, 5–48. [Google Scholar] [CrossRef] [Green Version]
- Rienecker, M.M.; Suarez, M.J.; Gelaro, R.; Todling, R.; Bacmeister, J.; Liu, E.; Bosilovich, M.G.; Schubert, S.D.; Takacs, L.; Kim, G.-K.; et al. MERRA: NASA’s Modern-Era Retrospective Analysis for Research and Applications. J. Clim. 2011, 24, 3624–3648. [Google Scholar] [CrossRef]
- Stickler, A.; Brönnimann, S.; Valente, M.A.; Bethke, J.; Sterin, A.; Jourdain, S.; Roucaute, E.; Vasquez, M.V.; Reyes, D.A.; Allan, R.; et al. ERA-CLIM: Historical Surface and Upper-Air Data for Future Reanalyses. Bull. Am. Meteorol. Soc. 2014, 95, 1419–1430. [Google Scholar] [CrossRef] [Green Version]
- Compo, G.P.; Whitaker, J.S.; Sardeshmukh, P.D.; Matsui, N.; Allan, R.J.; Yin, X.; Gleason, B.E.; Vose, R.S.; Rutledge, G.; Bessemoulin, P.; et al. The Twentieth Century Reanalysis Project. Q. J. R. Meteorol. Soc. 2011, 137, 1–28. [Google Scholar] [CrossRef] [Green Version]
- Flato, G.; Marotzke, J.; Abiodun, B.; Braconnot, P.; Chou, S.C.; Collins, W.; Cox, P.; Driouech, F.; Emori, S.; Eyring, V.; et al. Ealuation of Climate Models. In Climate Change 2013: The Physical Science Basis. Contribution of Working Group I to the Fifth Assessment Report of the Intergovernmental Panel on Climate Change; Stocker, T.F., Qin, D.H., Plattner, G.-K., Tignor, M., Allen, S.K., Boschung, J., Nauels, A., Xia, Y., Bex, V., Midgley, P.M., Eds.; Cambridge University Press: Cambridge, UK; New York, NY, USA, 2013; pp. 810–815. [Google Scholar]
- Shang, W.; Ren, X.; Huang, B.; Cubasch, U.; Yang, X.-Q. Subseasonal intensity variation of the South Asian high in relationship to diabatic heating: Observation and CMIP5 models. Clim. Dyn. 2018. [Google Scholar] [CrossRef]
- Huang, B.; Cubasch, U.; Kadow, C. Seasonal prediction skill of East Asian summer monsoon in CMIP5-Models. Earth Syst. Dyn. Discuss. 2017, 2017, 1–25. [Google Scholar] [CrossRef]
- Giorgi, F.; Jones, C.; Asrar, G.R. Addressing climate information needs at the regional level: The CORDEX framework. WMO Bull. 2009, 58, 175–183. [Google Scholar]
- Huang, B.; Polanski, S.; Cubasch, U. Assessment of precipitation climatology in an ensemble of CORDEX-East Asia regional climate simulations. Clim. Res. 2015, 64, 141–158. [Google Scholar] [CrossRef]
- Francesco, C.; Bo, H.; Xiangping, H.; Merja, T.; Anders Hammer, S. Quantifying the climate response to extreme land cover changes in Europe with a regional model. Environ. Res. Lett. 2018. [Google Scholar] [CrossRef]
- Newman, M.; Sardeshmukh, P.D.; Bergman, J.W. An Assessment of the NCEP, NASA, and ECMWF Reanalyses over the Tropical West Pacific Warm Pool. Bull. Am. Meteorol. Soc. 2000, 81, 41–48. [Google Scholar] [CrossRef] [Green Version]
- Betts, A.K.; Zhao, M.; Dirmeyer, P.A.; Beljaars, A.C.M. Comparison of ERA40 and NCEP/DOE near-surface data sets with other ISLSCP-II data sets. J. Geophys. Res. 2006, 111, D22S04. [Google Scholar] [CrossRef]
- Lin, R.; Zhou, T.; Qian, Y. Evaluation of Global Monsoon Precipitation Changes based on Five Reanalysis Datasets. J. Clim. 2014, 27, 1271–1289. [Google Scholar] [CrossRef]
- Huang, D.Q.; Zhu, J.; Zhang, Y.C.; Huang, Y.; Kuang, X.Y. Assessment of summer monsoon precipitation derived from five reanalysis datasets over East Asia. Q. J. R. Meteorolog. Soc. 2016, 142, 108–119. [Google Scholar] [CrossRef]
- Chen, G.; Iwasaki, T.; Qin, H.; Sha, W. Evaluation of the Warm-Season Diurnal Variability over East Asia in Recent Reanalyses JRA-55, ERA-Interim, NCEP CFSR, and NASA MERRA. J. Clim. 2014, 27, 5517–5537. [Google Scholar] [CrossRef]
- Wang, A.; Zeng, X. Evaluation of multireanalysis products with in situ observations over the Tibetan Plateau. J. Geophys. Res. Atmos. 2012, 117, D05102. [Google Scholar] [CrossRef]
- Adler, R.F.; Huffman, G.J.; Chang, A.; Ferraro, R.; Xie, P.-P.; Janowiak, J.; Rudolf, B.; Schneider, U.; Curtis, S.; Bolvin, D.; et al. The Version-2 Global Precipitation Climatology Project (GPCP) Monthly Precipitation Analysis (1979–Present). J. Hydrometeorol. 2003, 4, 1147–1167. [Google Scholar] [CrossRef] [Green Version]
- Allan, R.; Ansell, T. A New Globally Complete Monthly Historical Gridded Mean Sea Level Pressure Dataset (HadSLP2): 1850–2004. J. Clim. 2006, 19, 5816–5842. [Google Scholar] [CrossRef] [Green Version]
- Durre, I.; Vose, R.S.; Wuertz, D.B. Overview of the Integrated Global Radiosonde Archive. J. Clim. 2006, 19, 53–68. [Google Scholar] [CrossRef] [Green Version]
- Ding, Y. Seasonal march of the East-Asian summer monsoon. In East Asian Monsoon; Chang, C.-P., Ed.; World Scientific: Singapore, 2004; p. 560. [Google Scholar]
- Ding, Y.H.; Chan, J.C.L. The East Asian summer monsoon: An overview. Meteorol. Atmos. Phys. 2005, 89, 117–142. [Google Scholar]
- Sperber, K.; Annamalai, H.; Kang, I.S.; Kitoh, A.; Moise, A.; Turner, A.; Wang, B.; Zhou, T. The Asian summer monsoon: An intercomparison of CMIP5 vs. CMIP3 simulations of the late 20th century. Clim. Dyn. 2013, 41, 2711–2744. [Google Scholar] [CrossRef]
- Taylor, K.E. Summarizing multiple aspects of model performance in a single diagram. J. Geophys. Res. Atmos. 2001, 106, 7183–7192. [Google Scholar] [CrossRef] [Green Version]
- Wang, B.; Wu, Z.W.; Li, J.P.; Liu, J.; Chang, C.P.; Ding, Y.H.; Wu, G.X. How to measure the strength of the East Asian summer monsoon. J. Clim. 2008, 21, 4449–4463. [Google Scholar] [CrossRef]
- Wang, B.; Fan, Z. Choice of south Asian summer monsoon indices. Bull. Am. Meteorol. Soc. 1999, 80, 629–638. [Google Scholar] [CrossRef]
- Yi, Y.; Kimball, J.S.; Jones, L.A.; Reichle, R.H.; McDonald, K.C. Evaluation of MERRA Land Surface Estimates in Preparation for the Soil Moisture Active Passive Mission. J. Clim. 2011, 24, 3797–3816. [Google Scholar] [CrossRef]
- Bao, X.; Zhang, F. Evaluation of NCEP–CFSR, NCEP–NCAR, ERA-Interim, and ERA-40 Reanalysis Datasets against Independent Sounding Observations over the Tibetan Plateau. J. Clim. 2013, 26, 206–214. [Google Scholar] [CrossRef]
Figure 1.
Precipitation latitude-time cross section of observation ((a) Global Precipitation Climatology Project; GPCP) and different re-analysis datasets (b–i) in the East Asian summer monsoon region (0–50° N, 100–140° E) from 1979 to 2010. The number in the upper-left corner of each panel indicates the pattern correlation coefficient (left) and the root-mean-square error (right) skill of the observed precipitation.

Figure 2.
Temporal statistics describing inter-annual variability of the re-analysis datasets and the multi-datasets ensemble mean in terms of June–July–August (JJA) mean precipitation (black), zonal winds (blue) and meridional winds (green) at 850 hPa, and mean sea level pressure (red) over the East Asian summer monsoon (EASM) region (0–50° N, 100–140° E) (a), the EASM land only (b), and the EASM ocean only (c) from 1979 to 2010. The Global Precipitation Climatology Project (GPCP) was employed as the reference data for precipitation, while the mean sea level pressure was compared by extended the Hadley Centre’s monthly historical mean sea level pressure dataset (HadSLPr2), and the wind fields were evaluated by the Integrated Global Radiosonde Archive (IGRA).

Figure 3.
Spatial distribution of the multi-reanalysis ensemble deviation for June–July–August mean precipitation (pr), mean sea level pressure (SLP), and winds at 850 hPa (u850 and v850) from 1979 to 2010. The red box represents the East Asian summer monsoon region (0–50° N, 100–140° E).
Figure 3.
Spatial distribution of the multi-reanalysis ensemble deviation for June–July–August mean precipitation (pr), mean sea level pressure (SLP), and winds at 850 hPa (u850 and v850) from 1979 to 2010. The red box represents the East Asian summer monsoon region (0–50° N, 100–140° E).

Figure 4.
Summer (JJA) precipitation of the Global Precipitation Climatology Project (GPCP) and the precipitation anomalies ‘re-analysis minus GPCP’ in 1979–2010. The presented anomalies of precipitation pass Student’s t-test at 0.05 level. The green box represents the East Asian summer monsoon region (0–50° N, 100–140° E).

Figure 5.
Summer (JJA) mean sea level pressure (observation shaded) of the extended Hadley Centre monthly historical mean sea level pressure dataset (HadSLPr2) and wind fields at 850 hPa (Observation vector) of the Integrated Global Radiosonde Archive (IGRA) and the mean sea level pressure anomalies ‘re-analysis minus HadSLPr2; shaded’, and the wind anomalies ‘re-analysis minus IGRA; vector’ in 1979–2010. The presented anomalies of precipitation pass Student’s t-test at 0.05 level. The green box represents the East Asian summer monsoon region (0–50° N, 100–140° E).

Figure 6.
Root-mean-square error skill score for summer (June–July–August) rainfall during 1979–2010. The Global Precipitation Climatology Project (GPCP) is employed as the reference data for rainfall. The green box is the East Asian summer monsoon region (0–50° N, 100–140° E).
Figure 6.
Root-mean-square error skill score for summer (June–July–August) rainfall during 1979–2010. The Global Precipitation Climatology Project (GPCP) is employed as the reference data for rainfall. The green box is the East Asian summer monsoon region (0–50° N, 100–140° E).

Figure 7.
As in Figure 6, but for mean sea level pressure (SLP; shaded) and lower level winds (at 850 hPa; vector). The reference data for mean sea level pressure is the extended Hadley Centre monthly historical mean sea level pressure dataset (HadSLPr2). The Integrated Global Radiosonde Archive (IGRA) is selected to evaluate the winds. The green box is the East Asian summer monsoon region (0–50° N, 100–140° E).

Figure 8.
East Asian summer monsoon index of observation (IGRA) and multi-reanalysis ensemble mean (a), individual re-analysis dataset (b), and the 20CR and ERA-20C in 1900–1957 (c). The number following the re-analysis presents the correlation coefficient between the East Asian summer monsoon index produced by re-analysis and the observed one during 1958–2010 (left), during 1958–1978 (middle), and during 1979–2010 (right).


Table 1.
Basic information of re-analyses investigated in this study.
| Name | Standard Name | Organisation | Resolution | Data Assimilation Method | Generation | Reference |
|---|---|---|---|---|---|---|
| 20CR | Twentieth Century Reanalysis v2 | NOAA ESRL/PSD and CIRES | T62 L28 | Ensemble Kalman Filter | Extended | Compo et al. [17] |
| CFSR | Climate Forecast System Reanalysis | NCEP | T382 L64 | 3D-VAR | 3rd | Saha et al. [12] |
| ERA-20C | ECMWF’s first atmospheric reanalysis of the 20th century | ECMWF | T159 L91 and N80 reduced Gaussian | 4D-VAR | Extended | Stickler et al. [16] |
| ERA-Interim | ECMWF reanalysis | ECMWF | T255 L60 and N128 reduced Gaussian | 4D-VAR | 3rd | Dee et al. [13] |
| JRA-55 | Japanese 55-year Reanalysis | JMA | T319 L60 | 4D-VAR | 3rd | Kobayashi et al. [14] |
| MERRA | NASA Modern Era Reanalysis for Research and Applications | NASA GMAO | 1/2 lat × 2/3 lon; 72 sigma levels | 3D-VAR, with incremental analysis update | 3rd | Rienecker et al. [15] |
| NCEPI | NCEP/NCAR Reanalysis | NCEP/NCAR | T62 L28 | 3D-VAR | 1st | Kalnay et al. [6] |
| NCEPII | NCEP/DOE Reanalysis | NCEP/DOE | T62 L28 | 3D-VAR | 1st | Kanamitsu et al. [7] |
Table 2.
Brief summary of the eight re-analysis datasets in this study with their strength and limitation.
Table 2.
Brief summary of the eight re-analysis datasets in this study with their strength and limitation.
| Name | Temporal Coverage | Strength | Limitation | Data source |
|---|---|---|---|---|
| 20CR | 1850–2014 | The longest re-analysis record | Data assimilation with few observations | https://www.esrl.noaa.gov/psd/data/20thC_Rean/ |
| CFSR | 1979–2011 | Improved and finer resolution model, and advanced assimilation schemes (4D-Var) | Little comparison | https://rda.ucar.edu/pub/cfsr.html |
| ERA-20C | 1900–2010 | Higher horizontal and vertical resolution than 20CR | Shorter than 20CR, and few observations for data assimilation | www.ecmwf.int/en/research/climate/reanalysis/era-20C |
| ERA-Interim | 1979–to–present | High horizontal and vertical resolution; improved low-frequency variability and stratospheric circulation than ERA40 | Large intensity of water cycling over the oceans, positive biases in temperature and humidity at the lower troposphere (below 850 hPa) and no capture of low-level inversions in the Arctic | www.ecmwf.int/en/research/climate-reanalysis/era-interim |
| JRA-55 | 1958–to–present | Longest third-generation re-analysis with full observations | Dry bias in upper and middle troposphere and in regions of deep convection, time-varying warm bias in the upper troposphere | www.jra.kishou.go.jp/JRA-55/index_en.html |
| MERRA | 1979–to–present | Improved the precipitation and water vapour climatology | Assimilation routine is “frozen” and will not be updated for new satellite instruments | https://gmao.gsfc.nasa.gov/reanalysis/MERRA/ |
| NCEPI | 1948–to–present | First effort of re-analysis and the longest running re-analysis that uses rawindsonde data | Low spatial and temporal moisture variability over oceans and a relatively poor climate state in Southern Hemisphere | https://www.esrl.noaa.gov/psd/data/gridded/data.ncep.reanalysis.html |
| NCEPII | 1979–to–present | Improvement of surface flux files, hydrological budget, short wave radiation flux | Drawbacks in the outgoing long-wave radiation over tropical warm pool and upper-level tropical moisture | https://www.esrl.noaa.gov/psd/data/gridded/data.ncep.reanalysis.html |
© 2018 by the authors. Licensee MDPI, Basel, Switzerland. This article is an open access article distributed under the terms and conditions of the Creative Commons Attribution (CC BY) license (http://creativecommons.org/licenses/by/4.0/).
Share and Cite
MDPI and ACS Style
Huang, B.; Cubasch, U.; Li, Y. East Asian Summer Monsoon Representation in Re-Analysis Datasets. Atmosphere 2018, 9, 235. https://doi.org/10.3390/atmos9060235
AMA Style
Huang B, Cubasch U, Li Y. East Asian Summer Monsoon Representation in Re-Analysis Datasets. Atmosphere. 2018; 9(6):235. https://doi.org/10.3390/atmos9060235
Chicago/Turabian StyleHuang, Bo, Ulrich Cubasch, and Yan Li. 2018. "East Asian Summer Monsoon Representation in Re-Analysis Datasets" Atmosphere 9, no. 6: 235. https://doi.org/10.3390/atmos9060235
Note that from the first issue of 2016, this journal uses article numbers instead of page numbers. See further details here.