Next Issue
Volume 9, September
Previous Issue
Volume 9, July


Atmosphere, Volume 9, Issue 8 (August 2018) – 39 articles

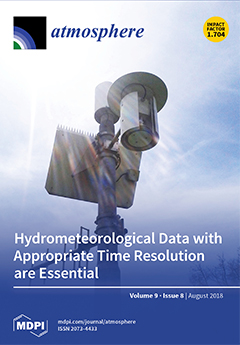
Cover Story (view full-size image): Precipitation knowledge is important for many hydrological studies. Rainfall data may be available with temporal aggregation that varies depending on the technologies used and the procedures followed by the rain gauge station manager. To avoid wrong conclusions, the quantification and characterization of the errors in extreme rainfall conditions caused by coarse temporal aggregation of data, is essential. View this paper.
  • Issues are regarded as officially published after their release is announced to the table of contents alert mailing list.
  • You may sign up for e-mail alerts to receive table of contents of newly released issues.
  • PDF is the official format for papers published in both, html and pdf forms. To view the papers in pdf format, click on the "PDF Full-text" link, and use the free Adobe Reader to open them.
Order results
Result details
Section
Select all
Export citation of selected articles as:
15 pages, 3770 KiB  
Article
Impacts of Atmospheric Rivers in Extreme Precipitation on the European Macaronesian Islands
by Alexandre M. Ramos, Ricardo M. Trigo, Ricardo Tomé and Margarida L. R. Liberato
Atmosphere 2018, 9(8), 325; https://doi.org/10.3390/atmos9080325 - 20 Aug 2018
Cited by 13 | Viewed by 4402
Abstract
The European Macaronesia Archipelagos (Azores, Madeira and Canary Islands) are struck frequently by extreme precipitation events. Here we present a comprehensive assessment on the relationship between atmospheric rivers and extreme precipitation events in these three Atlantic Archipelagos. The relationship between the daily precipitation [...] Read more.
The European Macaronesia Archipelagos (Azores, Madeira and Canary Islands) are struck frequently by extreme precipitation events. Here we present a comprehensive assessment on the relationship between atmospheric rivers and extreme precipitation events in these three Atlantic Archipelagos. The relationship between the daily precipitation from the various weather stations located in the different Macaronesia islands and the occurrence of atmospheric rivers (obtained from four different reanalyses datasets) are analysed. It is shown that the atmospheric rivers’ influence over extreme precipitation (above the 90th percentile) is higher in the Azores islands when compared to Madeira or Canary Islands. In Azores, for the most extreme precipitation days, the presence of atmospheric rivers is particularly significant (up to 50%), while for Madeira, the importance of the atmospheric rivers is reduced (between 30% and 40%). For the Canary Islands, the occurrence of atmospheric rivers on extreme precipitation is even lower. Full article
(This article belongs to the Special Issue Atmospheric Rivers)
Show Figures

Figure 1

17 pages, 6525 KiB  
Article
Analysis on the Extreme Sea Levels Changes along the Coastline of Bohai Sea, China
by Jianlong Feng, Delei Li, Hui Wang, Qiulin Liu, Jianli Zhang, Yan Li and Kexiu Liu
Atmosphere 2018, 9(8), 324; https://doi.org/10.3390/atmos9080324 - 20 Aug 2018
Cited by 10 | Viewed by 3716
Abstract
Using hourly sea level data from four tide gauges, the changes of the extreme sea level in the Bohai Sea were analyzed in this work. Three components (i.e., mean sea level, tide and surge) as well as the tide–surge interaction were studied to [...] Read more.
Using hourly sea level data from four tide gauges, the changes of the extreme sea level in the Bohai Sea were analyzed in this work. Three components (i.e., mean sea level, tide and surge) as well as the tide–surge interaction were studied to find which component was important in the changes of extreme sea levels. Significant increasing trends exist in the mean sea level at four tide gauges from 1980 to 2016, and the increase rate ranges from 0.2 to 0.5 cm/year. The mean high tide levels show positive trends at four tide gauges, and the increasing rate (0.1 to 0.3 cm/year) is not small compared with the long-term trends of the mean sea levels. However, the mean tidal ranges show negative trends at Longkou, Qinhuangdao and Tanggu, with the rate from about −0.7 to −0.2 cm/year. At Qinhuangdao and Tanggu, the annual surge intensity shows explicit long-term decreasing trend. At all four tide gauges, the storm surge intensity shows distinct inter-annual variability and decadal variability. All four tide gauges show significant tide–surge interaction, the characteristics of the tide–surge interaction differ due to their locations, and no clear long-term change was found. Convincing evidence implies that the extreme sea levels increase during the past decades from 1980 to 2016 at all tide gauges, with the increasing rate differing at different percentile levels. The extreme sea level changes in the Bohai Sea are highly affected by the changes of mean sea level and high tide level, especially the latter. The surge variation contributes to the changes of extreme sea level at locations where the tide–surge interaction is relatively weak. Full article
(This article belongs to the Special Issue Storms, Jets and Other Meteorological Phenomena in Coastal Seas)
Show Figures

Figure 1

15 pages, 3825 KiB  
Article
Analysis on the Changes of Agro-Meteorological Thermal Indices in Northeast China under RCP4.5 Scenario Using the PRECIS2.1
by Xinhua Li, Yinlong Xu, Chunchun Meng, Lei Zhang and Changgui Wang
Atmosphere 2018, 9(8), 323; https://doi.org/10.3390/atmos9080323 - 20 Aug 2018
Cited by 6 | Viewed by 3001
Abstract
As a main grain production area in China, Northeast China (NEC) is highly influenced by the higher warming trend than elsewhere in China or even the globe. As the warming trend goes on, scientific understanding of the changes of thermal conditions in NEC [...] Read more.
As a main grain production area in China, Northeast China (NEC) is highly influenced by the higher warming trend than elsewhere in China or even the globe. As the warming trend goes on, scientific understanding of the changes of thermal conditions in NEC will be essential for taking agricultural adaptation measures. In this paper, the high-resolution (25 km) corrected outputs of PRECIS (Providing Regional Climates for Impacts Studies) under the Representative Concentration Pathway 4.5 (RCP4.5) scenario were used to analyze the changes of the agro-climatic thermal resources in NEC. Results showed that accumulated temperature ≥10 °C (AT10) could increase by 300–500 °C·day, 500–900 °C·day, and 750–1000 °C·day in 2011–2040 (2020s), 2041–2070 (2050s), and 2071–2100 (2080s), respectively, relative to the baseline period of 1961–1990. The potential growing season (PGS) would then be prolonged by 11–19 days, 23–35 days, and 25–37 days in 2020s, 2050s and 2080s, respectively, compared to baseline. The spatial features for the changes of thermal indices would show a large increase of AT10 and an extension of PGS and Frost-free period (FFP) in mountainous areas compared to plains; the increment of AT10 would be greater in southern NEC than that in the north, with over 1000 °C·day in the southern parts and 700–800 °C·day in the northern parts in the 2080s. Additionally, the three thermal indices would increase rapidly from 2020s to 2050s compared to the period from 2050s to the 2080s, coincides with the greenhouse gas concentrations peak around the mid-period of the 21st century, and the decline towards the end of the 21st century under RCP4.5 forcing. The results of this paper could act as a guide to taking advantage of increasing thermal resources in NEC, and would be helpful for local practitioners in decision-making. Full article
(This article belongs to the Section Biometeorology)
Show Figures

Figure 1

20 pages, 4822 KiB  
Article
An Analysis of Precipitation Extremes in the Inner Mongolian Plateau: Spatial-Temporal Patterns, Causes, and Implications
by Chunlan Li, Walter Leal Filho, Jun Wang, Hubert Fudjumdjum, Mariia Fedoruk, Richa Hu, Shan Yin, Yuhai Bao, Shan Yu and Julian Hunt
Atmosphere 2018, 9(8), 322; https://doi.org/10.3390/atmos9080322 - 19 Aug 2018
Cited by 14 | Viewed by 4056
Abstract
To improve how extreme events and climate variations are managed, there is a need to foster a deeper understanding of their interconnections. Consistent with this objective, this paper describes how precipitation extremes change both temporally and spatially in the Inner Mongolian Plateau (IMP), [...] Read more.
To improve how extreme events and climate variations are managed, there is a need to foster a deeper understanding of their interconnections. Consistent with this objective, this paper describes how precipitation extremes change both temporally and spatially in the Inner Mongolian Plateau (IMP), China and explains their causal factors. The paper refers to data collected from 43 meteorological stations in IMP and describes how precipitation extremes formed and how they influence agriculture. Data gathered and presented in this paper may be useful in understanding the extent to which the IMP is being influenced by global environmental change. This study reveals that the eleven precipitation extremes indices, except the number of precipitation days with over 0.5 mm (R0.5), number of heavy precipitation days (R10), and total precipitation in wet days (PRCPTOT), decreased in the IMP between 1959 and 2014, and most of them were non-significant in temporal. But the dry index has a larger magnitude decreasing trend than that of the wet indices, which can indicate that the dry situation was alleviated in IMP during the study interval. This study also indicated that precipitation extremes have strong relationships with elevation, latitude, and longitude. Atmospheric circulation and topography may be further primary reasons which result in the spatial variation characteristics in precipitation extremes over the IMP. Decreases in precipitation extremes, together with human activities such as livestock improvement and ecological restoration programs, has a positive effect in gross output value of agriculture and animal husbandry in the IMP. The results contribute to a deeper insight on the possible impacts of precipitation extremes and support the development of appropriate adaptation and mitigation strategies to cope with climate extremes. This paper further proposes science-based policies for grassland protection, agriculture, and animal husbandry on the national or regional and herdsman scales. Full article
(This article belongs to the Section Meteorology)
Show Figures

Figure 1

17 pages, 1793 KiB  
Article
Outdoor Thermal Comfort during Anomalous Heat at the 2015 Pan American Games in Toronto, Canada
by Alexandria J. Herdt, Robert D. Brown, Ian Scott-Fleming, Guofeng Cao, Melissa MacDonald, Dave Henderson and Jennifer K. Vanos
Atmosphere 2018, 9(8), 321; https://doi.org/10.3390/atmos9080321 - 18 Aug 2018
Cited by 9 | Viewed by 6037
Abstract
Mass sporting events in the summertime are influenced by underlying weather patterns, with high temperatures posing a risk for spectators and athletes alike. To better understand weather variations in the Greater Toronto Area (GTA) during the Pan American Games in 2015 (PA15 Games), [...] Read more.
Mass sporting events in the summertime are influenced by underlying weather patterns, with high temperatures posing a risk for spectators and athletes alike. To better understand weather variations in the Greater Toronto Area (GTA) during the Pan American Games in 2015 (PA15 Games), Environment and Climate Change Canada deployed a mesoscale monitoring network system of 53 weather stations. Spatial maps across the GTA demonstrate large variations by heat metric (e.g., maximum temperature, humidex, and wet bulb globe temperature), identifying Hamilton, Ontario as an area of elevated heat and humidity, and hence risk for heat-related illness. A case study of the Hamilton Soccer Center examined on-site thermal comfort during a heat event and PA15 Soccer Games, demonstrating that athletes and spectators were faced with thermal discomfort and a heightened risk of heat-related illness. Results are corroborated by First Aid and emergency response data during the events, as well as insight from personal experiences and Twitter feed. Integrating these results provides new information on potential benefits to society from utilizing mesonet systems during large-scale sporting events. Results further improve our understanding of intra-urban heat variability and heat-health burden. The benefits of utilizing more comprehensive modeling approaches for human heat stress that coincide with fine-scale weather information are discussed. Full article
(This article belongs to the Special Issue Urban Design and City Microclimates)
Show Figures

Graphical abstract

16 pages, 2170 KiB  
Article
Rate Constants for the Reaction of OH Radicals with Hydrocarbons in a Smog Chamber at Low Atmospheric Temperatures
by Lei Han, Frank Siekmann and Cornelius Zetzsch
Atmosphere 2018, 9(8), 320; https://doi.org/10.3390/atmos9080320 - 18 Aug 2018
Cited by 12 | Viewed by 5629
Abstract
The photochemical reaction of OH radicals with the 17 hydrocarbons n-butane, n-pentane, n-hexane, n-heptane, n-octane, n-nonane, cyclooctane, 2,2-dimethylbutane, 2,2-dimethylpentane, 2,2-dimethylhexane, 2,2,4-trimethylpentane, 2,2,3,3-tetramethylbutane, benzene, toluene, ethylbenzene, p-xylene, and o-xylene was investigated at 288 and 248 K [...] Read more.
The photochemical reaction of OH radicals with the 17 hydrocarbons n-butane, n-pentane, n-hexane, n-heptane, n-octane, n-nonane, cyclooctane, 2,2-dimethylbutane, 2,2-dimethylpentane, 2,2-dimethylhexane, 2,2,4-trimethylpentane, 2,2,3,3-tetramethylbutane, benzene, toluene, ethylbenzene, p-xylene, and o-xylene was investigated at 288 and 248 K in a temperature controlled smog chamber. The rate constants were determined from relative rate calculations with toluene and n-pentane as reference compounds, respectively. The results from this work at 288 K show good agreement with previous literature data for the straight-chain hydrocarbons, as well as for cyclooctane, 2,2-dimethylbutane, 2,2,4-trimethylpentane, 2,2,3,3-tetramethylbutane, benzene, and toluene, indicating a convenient method to study the reaction of OH radicals with many hydrocarbons simultaneously. The data at 248 K (k in units of 10−12 cm3 s−1) for 2,2-dimethylpentane (2.97 ± 0.08), 2,2-dimethylhexane (4.30 ± 0.12), 2,2,4-trimethylpentane (3.20 ± 0.11), and ethylbenzene (7.51 ± 0.53) extend the available data range of experiments. Results from this work are useful to evaluate the atmospheric lifetime of the hydrocarbons and are essential for modeling the photochemical reactions of hydrocarbons in the real troposphere. Full article
(This article belongs to the Section Aerosols)
Show Figures

Figure 1

18 pages, 2764 KiB  
Article
Observed Response of the Raindrop Size Distribution to Changes in the Melting Layer
by Patrick N. Gatlin, Walter A. Petersen, Kevin R. Knupp and Lawrence D. Carey
Atmosphere 2018, 9(8), 319; https://doi.org/10.3390/atmos9080319 - 18 Aug 2018
Cited by 17 | Viewed by 5542
Abstract
Vertical variability in the raindrop size distribution (RSD) can disrupt the basic assumption of a constant rain profile that is customarily parameterized in radar-based quantitative precipitation estimation (QPE) techniques. This study investigates the utility of melting layer (ML) characteristics to help prescribe the [...] Read more.
Vertical variability in the raindrop size distribution (RSD) can disrupt the basic assumption of a constant rain profile that is customarily parameterized in radar-based quantitative precipitation estimation (QPE) techniques. This study investigates the utility of melting layer (ML) characteristics to help prescribe the RSD, in particular the mass-weighted mean diameter (Dm), of stratiform rainfall. We utilize ground-based polarimetric radar to map the ML and compare it with Dm observations from the ground upwards to the bottom of the ML. The results show definitive proof that a thickening, and to a lesser extent a lowering, of the ML causes an increase in raindrop diameter below the ML that extends to the surface. The connection between rainfall at the ground and the overlying microphysics in the column provide a means for improving radar QPE at far distances from a ground-based radar or close to the ground where satellite-based radar rainfall retrievals can be ill-defined. Full article
(This article belongs to the Special Issue Precipitation: Measurement and Modeling)
Show Figures

Figure 1

17 pages, 4360 KiB  
Article
Long-Term Atmospheric Visibility Trends and Characteristics of 31 Provincial Capital Cities in China during 1957–2016
by Weicong Fu, Ziru Chen, Zhipeng Zhu, Qunyue Liu, Jinda Qi, Emily Dang, Minhua Wang and Jianwen Dong
Atmosphere 2018, 9(8), 318; https://doi.org/10.3390/atmos9080318 - 17 Aug 2018
Cited by 12 | Viewed by 3658 | Correction
Abstract
Millions of pulmonary diseases, respiratory diseases, and premature deaths are caused by poor ambient air quality in developing countries, especially in China. A proven indicator of ambient air quality, atmospheric visibility (AV), has displayed continuous decline in China’s urban areas. A better understanding [...] Read more.
Millions of pulmonary diseases, respiratory diseases, and premature deaths are caused by poor ambient air quality in developing countries, especially in China. A proven indicator of ambient air quality, atmospheric visibility (AV), has displayed continuous decline in China’s urban areas. A better understanding of the characteristics and the factors affecting AV can help the public and policy makers manage their life and work. In this study, long-term AV trends (from 1957–2016, excluding 1965–1972) and spatial characteristics of 31 provincial capital cities (PCCs) of China (excluding Taipei, Hong Kong, and Macau) were investigated. Seasonal and annual mean values of AV, percentage of ‘good’ (≥20 km) and ‘bad’ AV (<10 km), cumulative percentiles and the correlation between AV, socioeconomic factors, air pollutants and meteorological factors were analyzed in this study. Results showed that annual mean AV of the 31 PCCs in China were 14.30 km, with a declining rate of −1.07 km/decade. The AV of the 31 PCCs declined dramatically between 1973–1986, then plateaued between 1987–2006, and rebounded slightly after 2007. Correlation analysis showed that impact factors (e.g., urban size, industrial activities, residents’ activities, urban greening, air quality, and meteorological factors) contributed to the variation of AV. We also reveal that residents’ activities are the primary direct socioeconomic factors on AV. This study hopes to help the public fully understand the characteristics of AV and make recommendations about improving the air environment in China’s urban areas. Full article
(This article belongs to the Special Issue Air Quality in China: Past, Present and Future)
Show Figures

Figure 1

14 pages, 2347 KiB  
Article
The Three-Dimensional Locating of VHF Broadband Lightning Interferometers
by Hengyi Liu, Shi Qiu and Wansheng Dong
Atmosphere 2018, 9(8), 317; https://doi.org/10.3390/atmos9080317 - 13 Aug 2018
Cited by 18 | Viewed by 3805
Abstract
VHF (Very High Frequency) lightning interferometers can locate and observe lightning discharges with a high time resolution. Especially the appearance of continuous interferometers makes the 2-D location of interferometers further improve in time resolution and completeness. However, there is uncertainty in the conclusion [...] Read more.
VHF (Very High Frequency) lightning interferometers can locate and observe lightning discharges with a high time resolution. Especially the appearance of continuous interferometers makes the 2-D location of interferometers further improve in time resolution and completeness. However, there is uncertainty in the conclusion obtained by simply analyzing the 2-D locating information. Without the support of other 3-D total lightning locating networks, the 2-station interferometer becomes an option to obtain 3-D information. This paper introduces a 3-D lightning location method of a 2-station broadband interferometer, which uses the theodolite wind measurement method for reference, and gives the simulation results of the location accuracy. Finally, using the multi-baseline continuous 2-D locating method and the 3-D locating method, the locating results of one intra-cloud flash and the statistical results of the initiation heights of 61 cloud-to-ground flashes and 80 intra-cloud flashes are given. The results show that the two-station interferometer has high observation accuracy on both sides of the connection between the two sites. The locating accuracy will deteriorate as the distance between the radiation source and the two stations increases or the height decreases. The actual locating results are similar to those of the existing VHF TDOA (Time Difference of Arrival) lightning locating network. Full article
(This article belongs to the Section Meteorology)
Show Figures

Figure 1

15 pages, 3391 KiB  
Article
Extreme Wave Storms and Atmospheric Variability at the Spanish Coast of the Bay of Biscay
by Domingo Rasilla, Juan Carlos García-Codron, Carolina Garmendia, Sixto Herrera and Victoria Rivas
Atmosphere 2018, 9(8), 316; https://doi.org/10.3390/atmos9080316 - 13 Aug 2018
Cited by 6 | Viewed by 3853
Abstract
This paper examines the characteristics and long-term variability of storminess for the Spanish coast of the Bay of Biscay for the period 1948 to 2015, by coupling wave (observed and modelled) and atmospheric datasets. The diversity of atmospheric mechanisms that are responsible for [...] Read more.
This paper examines the characteristics and long-term variability of storminess for the Spanish coast of the Bay of Biscay for the period 1948 to 2015, by coupling wave (observed and modelled) and atmospheric datasets. The diversity of atmospheric mechanisms that are responsible for wave storms are highlighted at different spatial and temporal scales: synoptic (cyclone) and low frequency (teleconnection patterns) time scales. Two types of storms, defined mostly by wave period and storm energy, are distinguished, resulting from the distance to the forcing cyclones, and the length of the fetch area. No statistically significant trends were found for storminess and the associated atmospheric indices over the period of interest. Storminess reached a maximum around the decade of the 1980s, while less activity occurred at the beginning and end of the period of study. In addition, the results reveal that only the WEPI (West Europe Pressure Anomaly Index), EA (Eastern Atlantic), and EA/WR (Eastern Atlantic/Western Russia) teleconnection patterns are able to explain a substantial percentage of the variability in storm climate, suggesting the importance of local factors (W-E exposition of the coast) in controlling storminess in this region. Full article
(This article belongs to the Special Issue Storms, Jets and Other Meteorological Phenomena in Coastal Seas)
Show Figures

Graphical abstract

19 pages, 1215 KiB  
Article
Identification and Characterization of an Anomaly in Two-Dimensional Video Disdrometer Data
by Michael L. Larsen and Michael Schönhuber
Atmosphere 2018, 9(8), 315; https://doi.org/10.3390/atmos9080315 - 13 Aug 2018
Cited by 8 | Viewed by 3370
Abstract
The two-dimensional video distrometer (2DVD) is a well known ground based point-monitoring precipitation gauge, often used as a ground truth instrument to validate radar or satellite rainfall retrieval algorithms. This instrument records a number of variables for each detected hydrometeor, including the detected [...] Read more.
The two-dimensional video distrometer (2DVD) is a well known ground based point-monitoring precipitation gauge, often used as a ground truth instrument to validate radar or satellite rainfall retrieval algorithms. This instrument records a number of variables for each detected hydrometeor, including the detected position within the sample area of the instrument. Careful analyses of real 2DVD data reveal an artifact—there are time periods where hydrometeor detections within parts of the sample area are artificially enhanced or diminished. Here, we (i) illustrate this anomaly with an exemplary 2DVD data set, (ii) describe the origin of this anomaly, (iii) develop and present an algorithm to help flag data potentially partially corrupted by this anomaly, and (iv) explore the prevalence and quantitative impact of this anomaly. Although the anomaly is seen in every major rain event studied and by every 2DVD the authors have examined, the anomaly artificially induces less than 3% of all detected drops and typically alters estimates of rain rates and accumulations by less than 2%. Full article
(This article belongs to the Special Issue Precipitation: Measurement and Modeling)
Show Figures

Figure 1

11 pages, 5351 KiB  
Article
Variations of Haze Pollution in China Modulated by Thermal Forcing of the Western Pacific Warm Pool
by Yingchang You, Xugeng Cheng, Tianliang Zhao, Xiangde Xu, Sunling Gong, Xiaoye Zhang, Yu Zheng, Huizheng Che, Chao Yu, Jiacheng Chang, Guoxu Ma and Ming Wu
Atmosphere 2018, 9(8), 314; https://doi.org/10.3390/atmos9080314 - 11 Aug 2018
Cited by 10 | Viewed by 4002
Abstract
In addition to the impact of pollutant emissions, haze pollution is connected with meteorology and climate change. Based on the interannual change analyses of meteorological and environmental observation data from 1981 to 2010, we studied the relationship between the winter haze frequency in [...] Read more.
In addition to the impact of pollutant emissions, haze pollution is connected with meteorology and climate change. Based on the interannual change analyses of meteorological and environmental observation data from 1981 to 2010, we studied the relationship between the winter haze frequency in central-eastern China (CEC) and the interannual variations of sea surface temperature (SST) over Western Pacific Warm Pool (WPWP) and its underlying mechanism to explore the thermal effect of WPWP on haze pollution variation in China. The results show a significant positive correlation coefficient reaching up to 0.61 between the interannual variations of SST in WPWP and haze pollution frequency in the CEC region over 1981–2010, reflecting the WPWP’s thermal forcing exerting an important impact on haze variation in China. The anomalies of thermal forcing of WPWP could induce to the changes of East Asian winter monsoonal winds and the vertical thermal structures in the troposphere over the CEC region. In the winter with anomalously warm SST over the WPWP, the near-surface winds were declined, and vertical thermal structure in the lower troposphere tended to be stable over the CEC-region, which could be conducive to air pollutant accumulation leading to the more frequent haze occurrences especially the heavy haze regions of Yangtze River Delta (YRD) and Pearl River Delta (PRD); In the winter with the anomalously cold WPWP, it is only the reverse of warm WPWP with the stronger East Asian winter monsoonal winds and the unstable thermal structure in the lower troposphere, which could attribute to the less frequent haze pollution over the CEC region. Our study revealed that the thermal forcing of the WPWP could have a modulation on air environment change in China. Full article
(This article belongs to the Special Issue Air Quality in China: Past, Present and Future)
Show Figures

Figure 1

14 pages, 2851 KiB  
Article
Trends, Variability, and Seasonality of Maximum Annual Daily Precipitation in the Upper Vistula Basin, Poland
by Dariusz Młyński, Marta Cebulska and Andrzej Wałęga
Atmosphere 2018, 9(8), 313; https://doi.org/10.3390/atmos9080313 - 10 Aug 2018
Cited by 35 | Viewed by 3827
Abstract
The aim of this study was to detect trends in maximum annual daily precipitation in the Upper Vistula Basin. We analyzed data from 51 weather stations between 1971 and 2014. Then we used the Mann–Kendall test to detect monotonical trends of the precipitation [...] Read more.
The aim of this study was to detect trends in maximum annual daily precipitation in the Upper Vistula Basin. We analyzed data from 51 weather stations between 1971 and 2014. Then we used the Mann–Kendall test to detect monotonical trends of the precipitation for three significance levels: 1, 5, and 10%. Our analysis of weather conditions helped us describe the mechanism behind the formation of maximum annual daily precipitation. To analyze precipitation seasonality, we also used Colwell indices. Our study identified a significant trend of the highest daily precipitation for the assumed significance levels (0.01, 0.05, 0.1) for 22% of the investigated weather stations at different elevations. The significant trends found were positive and an increase in precipitation is expected. From 1971 to 2014, the maximum daily total precipitation most often occurred in the summer half-year, i.e., from May until September. These months included a total of 88% of days with the highest daily precipitation. The predictability index for the highest total precipitation within the area was high and exceeded 5%. It was markedly affected by the coefficient of constancy (C) and to a lesser degree by the seasonality index (M). Our analysis demonstrated a convergence of the Colwell indices and frequency of cyclonic situation and, therefore, confirmed their usability in the analysis of precipitation seasonality. Full article
(This article belongs to the Special Issue Precipitation: Measurement and Modeling)
Show Figures

Figure 1

10 pages, 2794 KiB  
Article
Difference in PM2.5 Variations between Urban and Rural Areas over Eastern China from 2001 to 2015
by Changqing Lin, Alexis K. H. Lau, Ying Li, Jimmy C. H. Fung, Chengcai Li, Xingcheng Lu and Zhiyuan Li
Atmosphere 2018, 9(8), 312; https://doi.org/10.3390/atmos9080312 - 10 Aug 2018
Cited by 25 | Viewed by 5513
Abstract
To more effectively reduce population exposure to PM2.5, control efforts should target densely populated urban areas. In this study, we took advantage of satellite-derived PM2.5 data to assess the difference in PM2.5 variations between urban and rural areas over [...] Read more.
To more effectively reduce population exposure to PM2.5, control efforts should target densely populated urban areas. In this study, we took advantage of satellite-derived PM2.5 data to assess the difference in PM2.5 variations between urban and rural areas over eastern China during the past three Five-Year Plan (FYP) periods (2001–2015). The results show that urban areas experienced less of a decline in PM2.5 concentration than rural areas did in more than half of the provinces during the 11th FYP period (2006–2010). In contrast, most provinces experienced a greater reduction of PM2.5 concentration in urban areas than in rural areas during the 10th and 12th FYP periods (2001–2005 and 2011–2015, respectively). During the recent 12th FYP period, the rates of decline in PM2.5 concentration in urban areas were more substantial than in rural areas by as much as 1.5 μg·m−3·year−1 in Beijing and 2.0 μg·m−3·year−1 in Tianjin. These results suggest that the spatial difference in PM2.5 change was conducive to a reduction in the population exposure to PM2.5 in most provinces during recent years. Full article
(This article belongs to the Special Issue Air Quality in China: Past, Present and Future)
Show Figures

Figure 1

14 pages, 1559 KiB  
Article
Post-Monsoon Season Precipitation Reduction over South Asia: Impacts of Anthropogenic Aerosols and Irrigation
by Wei-Ting Chen, Kung-Tzu Huang, Min-Hui Lo and L. H. LinHo
Atmosphere 2018, 9(8), 311; https://doi.org/10.3390/atmos9080311 - 09 Aug 2018
Cited by 7 | Viewed by 4453
Abstract
A significant declining trend of post-monsoon season precipitation in South Asia is observed between 2000–2014. Two major anthropogenic climate change drivers, aerosols and irrigation, have been steadily increasing during this period. The impacts of their regional and seasonal forcings on the post-monsoon precipitation [...] Read more.
A significant declining trend of post-monsoon season precipitation in South Asia is observed between 2000–2014. Two major anthropogenic climate change drivers, aerosols and irrigation, have been steadily increasing during this period. The impacts of their regional and seasonal forcings on the post-monsoon precipitation reduction is investigated in this study through using idealized global climate simulations. The increased post-monsoon aerosol loadings lead to surface cooling downwind of the source areas by reduced surface shortwave flux. The addition of post-monsoon irrigation induces a stronger temperature decrease mainly around the irrigation hotspots by enhanced evaporation. Precipitation over West and North India is reduced post-monsoon by either aerosol or irrigation, which is mainly contributed by the anomalous subsidence. With concurrent forcings, the surface cooling and precipitation decrease are stronger and more extended spatially than the response to the separate forcing, with nonlinear amplification in surface cooling, but nonlinear damping in precipitation reduction. The anomalous vertical motion accelerates the transition of the regional meridional circulation, and hence the earlier withdrawal of the summer monsoon, which is consistent with the observed signals. The current results highlight the importance of including anthropogenic aerosol and irrigation effects in present and future climate simulations over South Asia. Full article
(This article belongs to the Special Issue Monsoons)
Show Figures

Figure 1

18 pages, 2005 KiB  
Article
The FuGas 2.3 Framework for Atmosphere–Ocean Coupling: Comparing Algorithms for the Estimation of Solubilities and Gas Fluxes
by Vasco M. N. C. S. Vieira, Pavel Jurus, Emanuela Clementi and Marcos Mateus
Atmosphere 2018, 9(8), 310; https://doi.org/10.3390/atmos9080310 - 09 Aug 2018
Cited by 3 | Viewed by 3168
Abstract
Accurate estimates of the atmosphere–ocean fluxes of greenhouse gases and dimethyl sulphide (DMS) have great importance in climate change models. A significant part of these fluxes occur at the coastal ocean which, although much smaller than the open ocean, have more heterogeneous conditions. [...] Read more.
Accurate estimates of the atmosphere–ocean fluxes of greenhouse gases and dimethyl sulphide (DMS) have great importance in climate change models. A significant part of these fluxes occur at the coastal ocean which, although much smaller than the open ocean, have more heterogeneous conditions. Hence, Earth System Modelling (ESM) requires representing the oceans at finer resolutions which, in turn, requires better descriptions of the chemical, physical and biological processes. The standard formulations for the solubilities and gas transfer velocities across air–water surfaces are 36 and 24 years old, and new alternatives have emerged. We have developed a framework combining the related geophysical processes and choosing from alternative formulations with different degrees of complexity. The framework was tested with fine resolution data from the European coastal ocean. Although the benchmark and alternative solubility formulations generally agreed well, their minor divergences yielded differences of up to 5.8% for CH4 dissolved at the ocean surface. The transfer velocities differ strongly (often more than 100%), a consequence of the benchmark empirical wind-based formulation disregarding significant factors that were included in the alternatives. We conclude that ESM requires more comprehensive simulations of atmosphere–ocean interactions, and that further calibration and validation is needed for the formulations to be able to reproduce it. We propose this framework as a basis to update with formulations for processes specific to the air–water boundary, such as the presence of surfactants, rain, the hydration reaction or biological activity. Full article
(This article belongs to the Special Issue Physical Chemistry of the Air-Water Interface)
Show Figures

Figure 1

15 pages, 6580 KiB  
Article
Seasonal Changes of Extremes in Isolated and Mesoscale Precipitation for the Southeastern United States
by Thomas Rickenbach
Atmosphere 2018, 9(8), 309; https://doi.org/10.3390/atmos9080309 - 09 Aug 2018
Cited by 6 | Viewed by 3006
Abstract
The association between instantaneous extreme precipitation and mesoscale organization over the southeastern United States is not well known. This study addresses whether isolated precipitation features have a distinct distribution and spatial pattern of extreme rain compared to mesoscale precipitation features, and how these [...] Read more.
The association between instantaneous extreme precipitation and mesoscale organization over the southeastern United States is not well known. This study addresses whether isolated precipitation features have a distinct distribution and spatial pattern of extreme rain compared to mesoscale precipitation features, and how these distributions and spatial patterns change from spring to summer. Using a four-year surface radar precipitation data set, hourly images of instantaneous extreme rain rates were separated into isolated and mesoscale precipitation features from March through August for the four-year period of 2009–2012. Results show that that compared to isolated convection, mesoscale precipitation organization is more commonly associated with higher extremes in instantaneous rainfall in the southeastern U.S. Extreme rain values tied to mesoscale organization shift eastward and toward the coasts from spring to summer, while extreme rain from isolated convection is mainly a summer phenomenon concentrated in Florida and along the coastal plain. The implication is that dynamical processes favoring mesoscale organization such as high shear associated with baroclinic circulations are more associated with higher values of extreme rain, while thermodynamic forcing and local circulations favoring isolated convection are associated with lower values of extreme rain. Full article
(This article belongs to the Special Issue Weather and Climate Extremes: Current Developments)
Show Figures

Figure 1

14 pages, 1315 KiB  
Article
Changes of Soil C Stock under Establishment and Abandonment of Arable Lands in Permafrost Area—Central Yakutia
by Alexey R. Desyatkin, Shinya Iwasaki, Roman V. Desyatkin and Ryusuke Hatano
Atmosphere 2018, 9(8), 308; https://doi.org/10.3390/atmos9080308 - 08 Aug 2018
Cited by 6 | Viewed by 3833
Abstract
Central Yakutia is in one of the most northern agricultural centers of the world. In this territory a notable area of arable land was made by removing the boreal Taiga with the primary purpose of crop cultivation. Such a method of cultivation significantly [...] Read more.
Central Yakutia is in one of the most northern agricultural centers of the world. In this territory a notable area of arable land was made by removing the boreal Taiga with the primary purpose of crop cultivation. Such a method of cultivation significantly changes soil total carbon (STC, soil organic carbon + soil carbonate carbon) balance, because of the destroyed upper humus horizon. Soil organic carbon (SOC) of cultivated arable lands is almost a half of that in forest. In abandoned arable lands with grass vegetation, the recovery of SOC has increased to 30% in comparison with cultivated arable lands. On arable lands recovering with new growth of trees, the SOC is related to the abandonment period. Soil carbonates carbon (SCC) content was significantly lower than SOC and showed significant difference among abandoned and other types of arable lands. Objectives of this study are to identify how STC stocks change in response to conversion of the forests to agricultural land and to analyze the arable land system’s recovery process after abandonment. Furthermore, after transformation of forest to arable land, a significant decrease of STC was observed, primarily due to mechanical loss after plant residue removal. It was also identified that the restoration and self-recovery of STC in abandoned arable lands of Central Yakutia continuously and slightly increase. Grass vegetation regenerates STC for 20 years. While the difference of average STC of forests and cultivated arable lands reached 41%, a new growth of forest on some abandoned arable land follows the tendency of STC decrease due to a low productivity level and suppressing effect on grass vegetation. Full article
(This article belongs to the Special Issue C and N Cycling and Greenhouse Gases Emission in Agroecosystem)
Show Figures

Figure 1

11 pages, 1969 KiB  
Article
Abundance of Biological Ice Nucleating Particles in the Mississippi and Its Major Tributaries
by Bruce F. Moffett, Tom C. J. Hill and Paul J. DeMott
Atmosphere 2018, 9(8), 307; https://doi.org/10.3390/atmos9080307 - 07 Aug 2018
Cited by 17 | Viewed by 4171
Abstract
Ice nucleating particles (INPs) are rare among atmospheric aerosols. However, through their ability to induce freezing of cloud droplets in cold clouds, they affect cloud lifetime, cloud albedo, and the efficiency and distribution of precipitation. While terrestrial sources of INPs are the focus [...] Read more.
Ice nucleating particles (INPs) are rare among atmospheric aerosols. However, through their ability to induce freezing of cloud droplets in cold clouds, they affect cloud lifetime, cloud albedo, and the efficiency and distribution of precipitation. While terrestrial sources of INPs are the focus of much research, the potential of rivers and lakes to be significant INP reservoirs has been neglected. In the first survey of a major river system, surface waters from the Mississippi, Missouri, Platte, and Sweetwater Rivers, all draining east and south from the Great Divide in the United States of America (USA), were tested for their INP concentrations. The survey comprised 49 samples, taken approximately every 150–250 km along 90% of the Mississippi (from Natchez, MS to the source at Bemidji, MN), the full length of the Missouri, 90% of the North Platte, and all of the Sweetwater. Samples were analysed using the immersion freezing method. The highest freezing temperature varied between −4 and −6 °C, and the concentration of INPs active at −10 °C or warmer ranged from 87 to 47,000 mL−1. The average INP concentration at −10 °C was 4950 mL−1, almost four orders of magnitude greater than the numbers of INPs typically found active at this temperature in seawater. The majority of INPs (69 to >99%) were heat labile (deactivated by heating to 95 °C) and therefore likely to be biological. Although the surface area of rivers is limited, their significant concentrations of INPs suggest that freshwater emissions should be investigated for their potential impact on regional cloud processes. Full article
(This article belongs to the Special Issue Ice Nucleation in the Atmosphere)
Show Figures

Figure 1

1 pages, 153 KiB  
Correction
Correction: Bärfuss et al. New Setup of the UAS ALADINA for Measuring Boundary Layer Properties, Atmospheric Particles and Solar Radiation. Atmosphere, 2018, 9, 28
by Konrad Bärfuss, Falk Pätzold, Barbara Altstädter, Endres Kathe, Stefan Nowak, Lutz Bretschneider, Ulf Bestmann and Astrid Lampert
Atmosphere 2018, 9(8), 306; https://doi.org/10.3390/atmos9080306 - 07 Aug 2018
Viewed by 3270
Abstract
The authors would like to correct the published article [1] concerning acknowledgments as follows[...] Full article
(This article belongs to the Special Issue Atmospheric Measurements with Unmanned Aerial Systems (UAS))
14 pages, 2285 KiB  
Article
Phytoplankton and Bacterial Response to Desert Dust Deposition in the Coastal Waters of the Southeastern Mediterranean Sea: A Four-Year In Situ Survey
by Eyal Rahav, Natalia Belkin, Adina Paytan and Barak Herut
Atmosphere 2018, 9(8), 305; https://doi.org/10.3390/atmos9080305 - 03 Aug 2018
Cited by 23 | Viewed by 4353
Abstract
Atmospheric dust/aerosol deposition is an important source of external nutrients for the surface of the ocean. This study shows high-resolution observational data gathered in situ over a period of four years on bacterial and phytoplankton abundance and activity during typical background atmospheric conditions [...] Read more.
Atmospheric dust/aerosol deposition is an important source of external nutrients for the surface of the ocean. This study shows high-resolution observational data gathered in situ over a period of four years on bacterial and phytoplankton abundance and activity during typical background atmospheric conditions and during intense dust storm events in the low-nutrient, low-chlorophyll (LNLC) coastal waters of the southeastern Mediterranean Sea (SEMS). Chlorophyll a (an estimate for phytoplankton biomass) and bacterial abundance show moderate changes in response to dust deposition/events (−10% and +20%, respectively), while primary production, bacterial production, and N2 fixation rates were all significantly and positively affected by deposition (+25 to +40%; p < 0.05). The rapid changes in bacterial and/or phytoplankton rate parameters suggest that the released micro-/macronutrients from atmospheric deposition are tunneled directly in metabolic processes and, to a lesser extent, for biomass accumulation. The predicted expansion of LNLC areas in oceans in the future, and the projected increase in dust emission due to desertification, may affect the production of marine microbial communities in the surface of the ocean, yet only moderately affect their biomass or standing stock. Such alterations may impact carbon sequestration to the deep ocean. Full article
Show Figures

Figure 1

23 pages, 23673 KiB  
Article
Using the Weather Research and Forecasting (WRF) Model for Precipitation Forecasting in an Andean Region with Complex Topography
by Gonzalo Yáñez-Morroni, Jorge Gironás, Marta Caneo, Rodrigo Delgado and René Garreaud
Atmosphere 2018, 9(8), 304; https://doi.org/10.3390/atmos9080304 - 02 Aug 2018
Cited by 49 | Viewed by 10607
Abstract
The Weather Research and Forecasting (WRF) model has been successfully used in weather prediction, but its ability to simulate precipitation over areas with complex topography is not optimal. Consequently, WRF has problems forecasting rainfall events over Chilean mountainous terrain and foothills, where some [...] Read more.
The Weather Research and Forecasting (WRF) model has been successfully used in weather prediction, but its ability to simulate precipitation over areas with complex topography is not optimal. Consequently, WRF has problems forecasting rainfall events over Chilean mountainous terrain and foothills, where some of the main cities are located, and where intense rainfall occurs due to cutoff lows. This work analyzes an ensemble of microphysics schemes to enhance initial forecasts made by the Chilean Weather Agency in the front range of Santiago. We first tested different vertical levels resolution, land use and land surface models, as well as meteorological forcing (GFS/FNL). The final ensemble configuration considered three microphysics schemes and lead times over three rainfall events between 2015 and 2017. Cutoff low complex meteorological characteristics impede the temporal simulation of rainfall properties. With three days of lead time, WRF properly forecasts the rainiest N-hours and temperatures during the event, although more accuracy is obtained when the rainfall is caused by a meteorological frontal system. Finally, the WSM6 microphysics option had the best performance, although further analysis using other storms and locations in the area are needed to strengthen this result. Full article
(This article belongs to the Special Issue Precipitation: Measurement and Modeling)
Show Figures

Figure 1

17 pages, 3263 KiB  
Article
Characteristics of the Underestimation Error of Annual Maximum Rainfall Depth Due to Coarse Temporal Aggregation
by Renato Morbidelli, Carla Saltalippi, Alessia Flammini, Tommaso Picciafuoco, Jacopo Dari and Corrado Corradini
Atmosphere 2018, 9(8), 303; https://doi.org/10.3390/atmos9080303 - 02 Aug 2018
Cited by 8 | Viewed by 3165
Abstract
This study analyzed all characteristics of the error committed in evaluating annual maximum rainfall depth, Hd, associated with a given duration, d, when data with coarse temporal aggregation, ta, were used. It is well known that when t [...] Read more.
This study analyzed all characteristics of the error committed in evaluating annual maximum rainfall depth, Hd, associated with a given duration, d, when data with coarse temporal aggregation, ta, were used. It is well known that when ta = 1 min, this error is practically negligible while coarser temporal aggregations can determine underestimation for a single Hd up to 50% and for the average value of sufficiently numerous series of Hd up to 16.67%. By using a mathematical relation between average underestimation error and the ratio ta/d, each Hd value belonging to a specific series could be corrected through deterministic or stochastic approaches. With a deterministic approach, an average correction was identically applied to all Hd values with the same ta and d while, for a stochastic correction, a thorough knowledge of the statistical characteristics of the underestimation error was required. Accordingly, in this work, rainfall data derived from many stations in central Italy were analyzed and it was assessed that single and average errors, which were both assumed as random variables, followed exponential and normal distributions, respectively. Furthermore, the single underestimation error was also found inversely correlated to the corresponding annual maximum rainfall depth. Full article
(This article belongs to the Special Issue Precipitation: Measurement and Modeling)
Show Figures

Figure 1

22 pages, 6317 KiB  
Article
Surface and Tropospheric Water Vapor Variability and Decadal Trends at Two Supersites of CO-PDD (Cézeaux and Puy de Dôme) in Central France
by Dani Hadad, Jean-Luc Baray, Nadège Montoux, Joël Van Baelen, Patrick Fréville, Jean-Marc Pichon, Pierre Bosser, Michel Ramonet, Camille Yver Kwok, Nelson Bègue and Valentin Duflot
Atmosphere 2018, 9(8), 302; https://doi.org/10.3390/atmos9080302 - 01 Aug 2018
Cited by 8 | Viewed by 3899
Abstract
We present an analysis of decadal in situ and remote sensing observations of water vapor over the Cézeaux and puy de Dôme, located in central France (45° N, 3° E), in order to document the variability, cycles and trends of surface and tropospheric [...] Read more.
We present an analysis of decadal in situ and remote sensing observations of water vapor over the Cézeaux and puy de Dôme, located in central France (45° N, 3° E), in order to document the variability, cycles and trends of surface and tropospheric water vapor at different time scales and the geophysical processes responsible for the water vapor distributions. We use meteorological stations, GPS (Global Positioning System), and lidar datasets, supplemented with three remote sources of water vapor (COSMIC-radio-occultation, ERA-interim-ECMWF numerical model, and AIRS-satellite). The annual cycle of water vapor is clearly established for the two sites of different altitudes and for all types of measurement. Cezeaux and puy de Dôme present almost no diurnal cycle, suggesting that the variability of surface water vapor at this site is more influenced by a sporadic meteorological system than by regular diurnal variations. The lidar dataset shows a greater monthly variability of the vertical distribution than the COSMIC and AIRS satellite products. The Cézeaux site presents a positive trend for the GPS water vapor total column (0.42 ± 0.45 g·kg−1/decade during 2006–2017) and a significant negative trend for the surface water vapor mixing ratio (−0.16 ± 0.09 mm/decade during 2002–2017). The multi-linear regression analysis shows that continental forcings (East Atlantic Pattern and East Atlantic-West Russia Pattern) have a greater influence than oceanic forcing (North Atlantic Oscillation) on the water vapor variations. Full article
(This article belongs to the Section Meteorology)
Show Figures

Figure 1

17 pages, 5853 KiB  
Article
Influence of Wave State and Sea Spray on the Roughness Length: Feedback on Medicanes
by Umberto Rizza, Elisa Canepa, Antonio Ricchi, Davide Bonaldo, Sandro Carniel, Mauro Morichetti, Giorgio Passerini, Laura Santiloni, Franciano Scremin Puhales and Mario Marcello Miglietta
Atmosphere 2018, 9(8), 301; https://doi.org/10.3390/atmos9080301 - 01 Aug 2018
Cited by 26 | Viewed by 4797
Abstract
Occasionally, storms that share many features with tropical cyclones, including the presence of a quasi-circular “eye” a warm core and strong winds, are observed in the Mediterranean. Generally, they are known as Medicanes, or tropical-like cyclones (TLC). Due to the intense wind forcings [...] Read more.
Occasionally, storms that share many features with tropical cyclones, including the presence of a quasi-circular “eye” a warm core and strong winds, are observed in the Mediterranean. Generally, they are known as Medicanes, or tropical-like cyclones (TLC). Due to the intense wind forcings and the consequent development of high wind waves, a large number of sea spray droplets—both from bubble bursting and spume tearing processes—are likely to be produced at the sea surface. In order to take into account this process, we implemented an additional Sea Spray Source Function (SSSF) in WRF-Chem, model version 3.6.1, using the GOCART (Goddard Chemistry Aerosol Radiation and Transport) aerosol sectional module. Traditionally, air-sea momentum fluxes are computed through the classical Charnock relation that does not consider the wave-state and sea spray effects on the sea surface roughness explicitly. In order to take into account these forcing, we implemented a more recent parameterization of the sea surface aerodynamic roughness within the WRF surface layer model, which may be applicable to both moderate and high wind conditions. The implemented SSSF and sea surface roughness parameterization have been tested using an operative model sequence based on COAWST (Coupled Ocean Atmosphere Wave Sediment Transport) and WRF-Chem. The third-generation wave model SWAN (Simulating Waves Nearshore), two-way coupled with the WRF atmospheric model in the COAWST framework, provided wave field parameters. Numerical simulations have been integrated with the WRF-Chem chemistry package, with the aim of calculating the sea spray generated by the waves and to include its effect in the Charnock roughness parametrization together with the sea state effect. A single case study is performed, considering the Medicane that affected south-eastern Italy on 26 September 2006. Since this Medicane is one of the most deeply analysed in literature, its investigation can easily shed some light on the feedbacks between sea spray and drag coefficients. Full article
(This article belongs to the Special Issue Mediterranean Tropical-Like Cyclones (Medicanes))
Show Figures

Graphical abstract

18 pages, 10196 KiB  
Article
Prediction Skill for the East Asian Winter Monsoon Based on APCC Multi-Models
by Sun-Hee Shin and Ja-Yeon Moon
Atmosphere 2018, 9(8), 300; https://doi.org/10.3390/atmos9080300 - 31 Jul 2018
Cited by 9 | Viewed by 4469
Abstract
The prediction skill for the East Asian winter monsoon (EAWM) has been analyzed, using the observations and different climate models that participate in the APEC Climate Center (APCC) multi-model ensemble (MME) seasonal forecast. The authors first examined the characteristics of the existing EAWM [...] Read more.
The prediction skill for the East Asian winter monsoon (EAWM) has been analyzed, using the observations and different climate models that participate in the APEC Climate Center (APCC) multi-model ensemble (MME) seasonal forecast. The authors first examined the characteristics of the existing EAWM indices to find a suitable index for the APCC seasonal forecast system. This examination revealed that the selected index shows reasonable prediction skill of EAWM intensity and well-represents the characteristics of wintertime temperature anomalies associated with the EAWM, especially for the extreme cold winters. Although most models capture the main characteristics of the seasonal mean circulation over East Asia reasonably well, they still suffer from difficulty in predicting the interannual variability (IAV) of the EAWM. Fortunately, the POAMA has reasonable skill in capturing the timing and strength of the EAWM IAV and reproduces the EAWM-related circulation anomalies well. The better performance of the POAMA may be attributed to the better skill in simulating the high-latitude forcing including the Siberian High (SH) and Artic Oscillation (AO) and the strong links of the ENSO to the EAWM, compared to other models. Full article
(This article belongs to the Special Issue Monsoons)
Show Figures

Figure 1

13 pages, 2032 KiB  
Article
The Effect of Nonlocal Vehicle Restriction Policy on Air Quality in Shanghai
by Junjie Li, Xiao-Bing Li, Bai Li and Zhong-Ren Peng
Atmosphere 2018, 9(8), 299; https://doi.org/10.3390/atmos9080299 - 30 Jul 2018
Cited by 16 | Viewed by 7470
Abstract
In recent years, road space rationing policies have been increasingly applied as a traffic management solution to tackle congestion and traffic emission problems in big cities. Existing studies on the effect of traffic policy on air quality have mainly focused on the odd–even [...] Read more.
In recent years, road space rationing policies have been increasingly applied as a traffic management solution to tackle congestion and traffic emission problems in big cities. Existing studies on the effect of traffic policy on air quality have mainly focused on the odd–even day traffic restriction policy or one-day-per-week restriction policy. There are few studies paying attention to the effect of nonlocal license plate restrictions on air quality in Shanghai. Restrictions toward nonlocal vehicles usually prohibit vehicles with nonlocal license plates from entering certain urban areas or using certain subsets of the road network (e.g., the elevated expressway) during specific time periods on workdays. To investigate the impact of such a policy on the residents’ exposure to pollutants, CO concentration and Air Quality Index (AQI) were compared during January and February in 2015, 2016 and 2017. Regression discontinuity (RD) was used to test the validity of nonlocal vehicle restriction on mitigating environmental pollution. Several conclusions can be made: (1) CO concentration was higher on ground-level roads on the restriction days than those in the nonrestriction days; (2) the extension of the restriction period exposed the commuters to high pollution for a longer time on the ground, which will do harm to them; and (3) the nonlocal vehicle restriction policy did play a role in improving the air quality in Shanghai when extending the evening rush period. Additionally, some suggestions are mentioned in order to improve air quality and passenger health and safety. Full article
(This article belongs to the Special Issue Air Quality in China: Past, Present and Future)
Show Figures

Figure 1

13 pages, 1932 KiB  
Article
Chemical Composition and Sources of Marine Aerosol over the Western North Pacific Ocean in Winter
by Hong-Wei Xiao, Hua-Yun Xiao, Chun-Yan Shen, Zhong-Yi Zhang and Ai-Min Long
Atmosphere 2018, 9(8), 298; https://doi.org/10.3390/atmos9080298 - 30 Jul 2018
Cited by 21 | Viewed by 5485
Abstract
Atmospheric deposition of long-range transported continental substances from natural and anthropogenic sources affects biogeochemical processes in marine systems. Emissions of sea spray contribute aerosol particles to the marine atmosphere. Despite the importance of continental dispersion and atmospheric processes involving aerosol particles within remote [...] Read more.
Atmospheric deposition of long-range transported continental substances from natural and anthropogenic sources affects biogeochemical processes in marine systems. Emissions of sea spray contribute aerosol particles to the marine atmosphere. Despite the importance of continental dispersion and atmospheric processes involving aerosol particles within remote marine atmosphere, knowledge of the sources of various water-soluble ions is limited because of insufficient observations. Concentrations of Total suspended particulates (TSPs) and major inorganic ions (Cl, Na+, SO42−, Mg2+, Ca2+, K+, NO3, NH4+), as well as organic nitrogen (ON-N) values, were measured in marine aerosol collected over the western north Pacific (WNP) during a cruise from 3 December 2014 to 13 March 2015. Aerosol samples were analyzed to determine their chemical characteristics and a source apportionment for this region and the continental influence on the open ocean when air masses are from continent in winter. TSP mass concentrations ranged from 14.1 to 136.0 μg/m3 with an average of 44.8 ± 28.1 μg/m3. Concentrations of TSPs and major ions were higher near the coast (close to Qingdao and Xiamen) and lower over the open ocean. The total mass of inorganic ions and organic nitrogen accounted for 51.1% of the total TSP. Cl had highest concentrations among the major inorganic ions, followed by SO42−, NO3, Mg2+, Ca2+, K+, and NH4+, respectively. However, Cl showed a deficit relative to Na+ in most samples, likely related to heterogeneous reactions within the marine atmosphere. Most SO42−, Mg2+, Ca2+, and K+ were from sea salt, while other major ions were from continental sources. The non-sea-salt (nss) fractions of Ca2+, Mg2+ and K+ were derived from continental crust, while nss-SO42− and NO3 were derived from anthropogenic sources. ON had several sources, including reactions of NOx with volatile organic compounds (anthropogenic sources) or NH3 with gaseous hydrocarbons, as well as crustal and marine biogenic sources. Full article
(This article belongs to the Section Aerosols)
Show Figures

Figure 1

18 pages, 5833 KiB  
Article
Sources Profiles of Volatile Organic Compounds (VOCs) Measured in a Typical Industrial Process in Wuhan, Central China
by Longjiao Shen, Ping Xiang, Shengwen Liang, Wentai Chen, Ming Wang, Sihua Lu and Zuwu Wang
Atmosphere 2018, 9(8), 297; https://doi.org/10.3390/atmos9080297 - 30 Jul 2018
Cited by 80 | Viewed by 7661
Abstract
Industrial emission is an important source of ambient volatile organic compounds (VOCs) in Wuhan City, Hubei Province, China. We collected 53 VOC samples from petrochemical, surface coating, electronic manufacturing, and gasoline evaporation using stainless canisters to develop localized source profiles. Concentrations of 86 [...] Read more.
Industrial emission is an important source of ambient volatile organic compounds (VOCs) in Wuhan City, Hubei Province, China. We collected 53 VOC samples from petrochemical, surface coating, electronic manufacturing, and gasoline evaporation using stainless canisters to develop localized source profiles. Concentrations of 86 VOC species, including hydrocarbons, halocarbons, and oxygenated VOCs, were quantified by a gas chromatography–flame ionization detection/mass spectrometry system. Alkanes were the major constituents observed in the source profile from the petrochemical industry. Aromatics (79.5~81.4%) were the largest group in auto-painting factories, while oxygenated VOCs (82.0%) and heavy alkanes (68.7%) were dominant in gravure printing and offset printing factories, respectively. Acetone was the largest contributor and the most frequently monitored species in printed circuit board (PCB) manufacturing, while VOC species emitted from integrated chip (IC) were characterized by high contents of isopropanol (56.4–98.3%) and acetone (30.8%). Chemical compositions from vapor of gasoline 92#, 93#, and 98# were almost identical. Alkanes were the dominant VOC group, with i-pentane being the most abundant species (31.4–37.7%), followed by n-butane and n-pentane. However, high loadings of heavier alkanes were observed in the profile of diesel evaporation. Full article
(This article belongs to the Special Issue Air Quality in China: Past, Present and Future)
Show Figures

Graphical abstract

34 pages, 7557 KiB  
Article
Experimental Design of a Prescribed Burn Instrumentation
by Adam K. Kochanski, Aimé Fournier and Jan Mandel
Atmosphere 2018, 9(8), 296; https://doi.org/10.3390/atmos9080296 - 29 Jul 2018
Cited by 8 | Viewed by 4657
Abstract
Observational data collected during experiments, such as the planned Fire and Smoke Model Evaluation Experiment (FASMEE), are critical for evaluating and transitioning coupled fire-atmosphere models like WRF-SFIRE and WRF-SFIRE-CHEM into operational use. Historical meteorological data, representing typical weather conditions for the anticipated burn [...] Read more.
Observational data collected during experiments, such as the planned Fire and Smoke Model Evaluation Experiment (FASMEE), are critical for evaluating and transitioning coupled fire-atmosphere models like WRF-SFIRE and WRF-SFIRE-CHEM into operational use. Historical meteorological data, representing typical weather conditions for the anticipated burn locations and times, have been processed to initialize and run a set of simulations representing the planned experimental burns. Based on an analysis of these numerical simulations, this paper provides recommendations on the experimental setup such as size and duration of the burns, and optimal sensor placement. New techniques are developed to initialize coupled fire-atmosphere simulations with weather conditions typical of the planned burn locations and times. The variation and sensitivity analysis of the simulation design to model parameters performed by repeated Latin Hypercube Sampling is used to assess the locations of the sensors. The simulations provide the locations for the measurements that maximize the expected variation of the sensor outputs with varying the model parameters. Full article
(This article belongs to the Special Issue Fire and the Atmosphere)
Show Figures

Figure 1

Previous Issue
Next Issue
Back to TopTop