Article

Sources Profiles of Volatile Organic Compounds (VOCs) Measured in a Typical Industrial Process in Wuhan, Central China

1
School of Resource and Environmental Science, Wuhan University, Wuhan 430079, China
2
Environmental Monitoring Center of Wuhan, Wuhan 430022, China
3
Nanjing Intelligent Environmental Sci-Tech Company Limited, Nanjing 211800, China
4
College of Environmental Science and Engineering, Nanjing University of Information Science and Technology, Nanjing 210044, China
5
State Joint Key Laboratory of Environmental Simulation and Pollution Control, College of Environmental Sciences and Engineering, Peking University, Beijing100871, China
*
Author to whom correspondence should be addressed.
Atmosphere 2018, 9(8), 297; https://doi.org/10.3390/atmos9080297
Submission received: 30 June 2018 / Revised: 16 July 2018 / Accepted: 24 July 2018 / Published: 30 July 2018
(This article belongs to the Special Issue Air Quality in China: Past, Present and Future)

Abstract

:
Industrial emission is an important source of ambient volatile organic compounds (VOCs) in Wuhan City, Hubei Province, China. We collected 53 VOC samples from petrochemical, surface coating, electronic manufacturing, and gasoline evaporation using stainless canisters to develop localized source profiles. Concentrations of 86 VOC species, including hydrocarbons, halocarbons, and oxygenated VOCs, were quantified by a gas chromatography–flame ionization detection/mass spectrometry system. Alkanes were the major constituents observed in the source profile from the petrochemical industry. Aromatics (79.5~81.4%) were the largest group in auto-painting factories, while oxygenated VOCs (82.0%) and heavy alkanes (68.7%) were dominant in gravure printing and offset printing factories, respectively. Acetone was the largest contributor and the most frequently monitored species in printed circuit board (PCB) manufacturing, while VOC species emitted from integrated chip (IC) were characterized by high contents of isopropanol (56.4–98.3%) and acetone (30.8%). Chemical compositions from vapor of gasoline 92#, 93#, and 98# were almost identical. Alkanes were the dominant VOC group, with i-pentane being the most abundant species (31.4–37.7%), followed by n-butane and n-pentane. However, high loadings of heavier alkanes were observed in the profile of diesel evaporation.

Graphical Abstract

1. Introduction

Study on volatile organic compounds (VOCs) has attracted increasing attention because of their important roles in the formation of ozone and secondary organic aerosols, which can impact climate change and air quality and are hazardous to human health and production [1,2,3,4]. Recent studies indicated that urban areas in China are suffering from serious haze and photochemical smog, which is associated with the reactive VOC components [5,6]. This implies that the control of VOCs emissions should be one of the priorities for China’s air quality improvement. Due to the diversity, complexity, and disorganized characteristics of VOC emission sources, control of VOCs has been challenging [7,8,9]. Accurate and reliable VOCs source profiles are fundamental tools for research on the establishment of speciated VOC emission inventory and for other studies such as source apportionment, assessments of human exposure to toxic and hazardous substances, and simulation of regional air quality [10,11]. On the other hand, local source profile is also essential for policy makers to conduct reactivity-based VOC emission abatement and formulate efficient O3 control strategies.
VOC source profiles explain the composition pattern of species emitted from a specified source category and are usually expressed as the weight fraction of individual VOC species relative to the total mass concentration of all VOC species measured [12]. The SPECIATE database established and integrated by the US Environmental Protection Agency (EPA) is currently the most comprehensive repository for source category-specific emission speciation profiles, with almost 2000 VOC species and 1700 profiles included [13]. Europe, Korea, and other countries and regions have also developed their own domestic source profiles. However, studies on emission characteristic of VOCs from anthropogenic sources in China are incomplete and unorganized and mainly focus on densely populated and economically developed regions such as the Yangtze River Delta region (YRD), the Pearl River Delta region (PRD), and Beijing [11,14]. VOC sources in China are quite complex because of the diversity of energy use and industry structures in different cities. Therefore, local VOC source profiles are necessary for the further work on local VOCs control. Industrial activities are considered as the major anthropogenic VOCs emission sources in China [15,16,17]. In this study, Wuhan was chosen as the typical city in central China, and measurements of local VOC emission sources were performed with a focus on industrial process.
Wuhan is the largest megacity in central China and is also an important transport hub [18], with large industrial activity concentrated at the southwest and northeast of the downtown. According to the emission inventory established in 2015 by the local environmental monitoring center, industries constituted the top emitter of VOCs in Wuhan, reaching 38.7% of the total VOC emissions. Three major industrial source categories including petroleum refinery, surface coating and painting, and the electronics manufacturing industry were selected because they have been known to emit significant quantities of VOCs. The source profile of fuel evaporation from gas stations was measured since gasoline and diesel vapor were also an important contributor to ambient VOCs.
The main objectives of this manuscript are (1) to develop local VOCs source profile with a focus on industrial process, (2) to identify the characteristic species of different industrial sector, and (3) to compare this study with other similar researches so that recognizing the similarities and differences of typical industrial VOC source profiles in China. The results and implications from this study are fundamental for the establishment of a speciated VOC emission inventory that can help the Wuhan local government conduct reactivity-based VOC abatement and further alleviate O3 pollution.

2. Materials and Methods

2.1. Source Sampling

A total of 53 samples covered four major VOCs source categories in Wuhan were collected during 2016–2017 to build the localized source profiles. The standard operating procedures (SOPs) issued by Ministry of Environmental Protection (2013) were followed to ensure consistent procedures throughout the field sampling. Samples were collected in 3.2 L electro-polished stainless-steel canisters and 86 VOCs species were quantified with a gas chromatography–mass spectrometry/flame ionization detection (GC–MS/FID, Agilent GC7820A, MS5977B). In this study, source samples were instantaneously collected into canisters. The sampling time was about 2 min. A brief description of the source sampling is shown below.

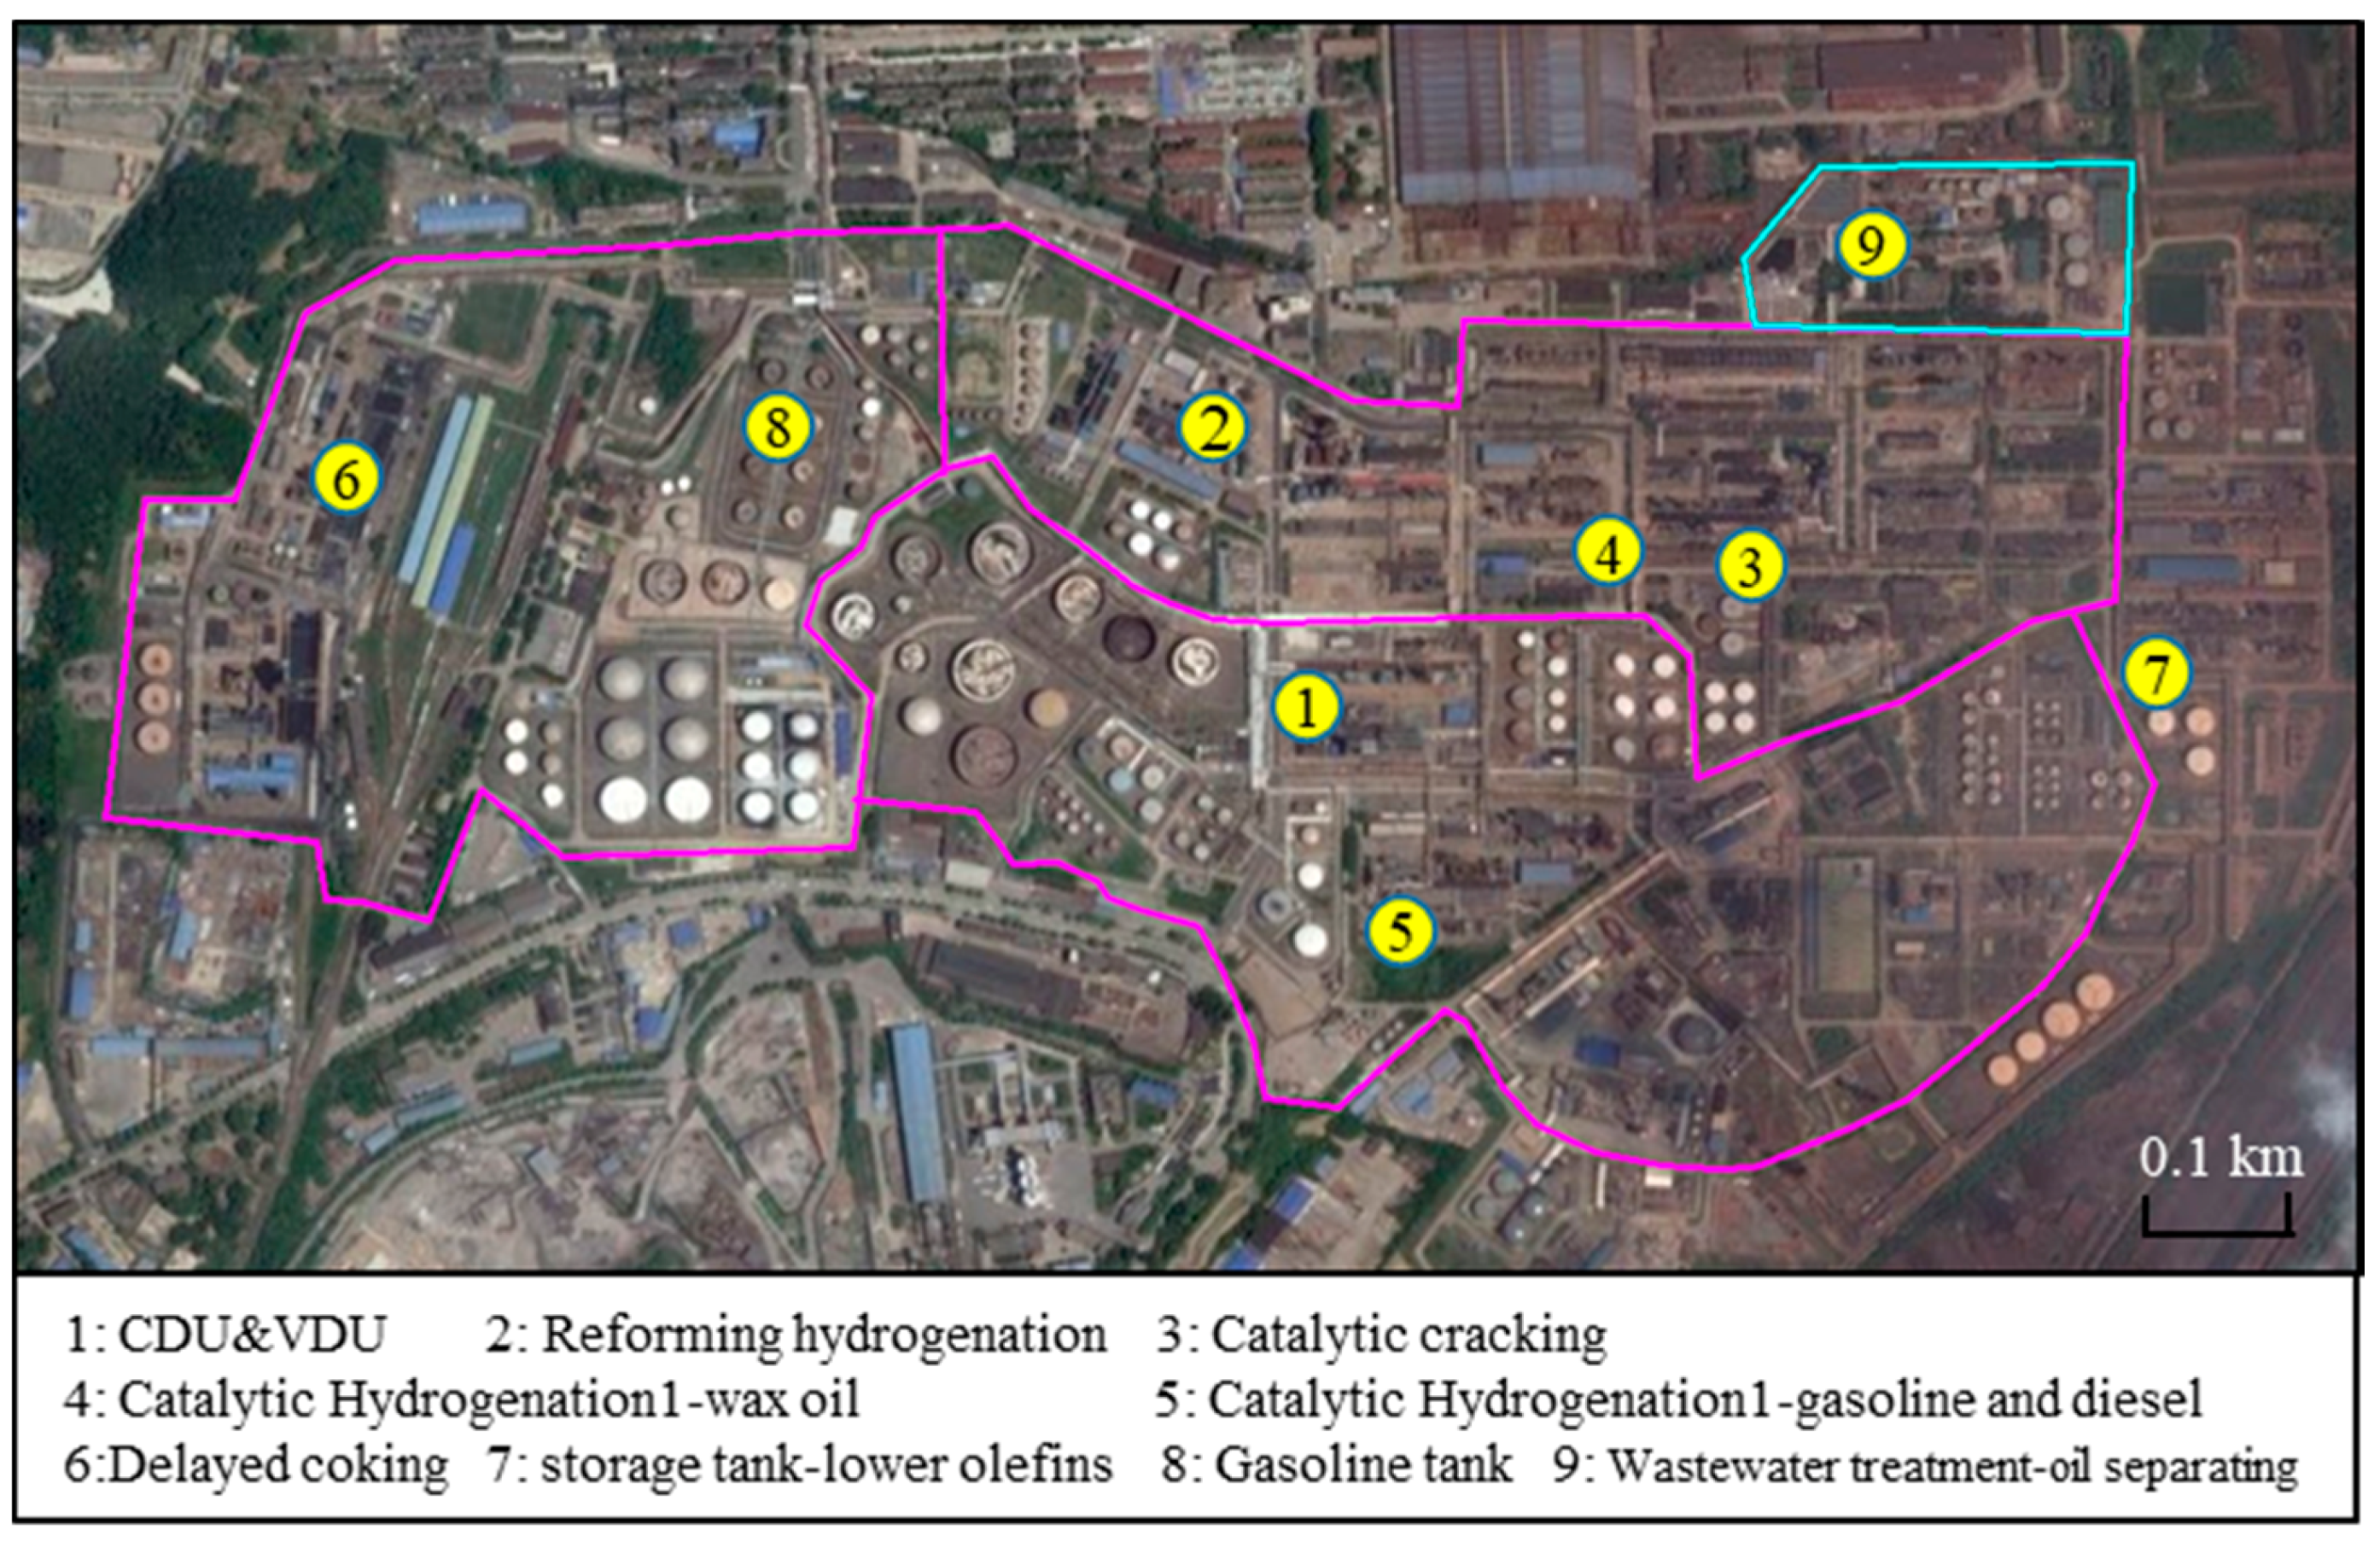
2.1.1. Petrochemical Industry

To characterize the chemical speciation of VOCs from the petroleum refinery, a total of nine samples were collected inside the manufacturing facilities as depicted in Figure 1. All of the units could be divided into three categories: oil refinery (OR), storage tank (ST), and wastewater treatment (WT). Six samples including regular and reduced pressure distillation (CDU & VDU, OR1), reforming hydrogenation (OR2), catalytic cracking (OR3), catalytic hydrogenation (OR4 with wax oil and OR5 with gasoline and diesel), and delayed coking (OR6) were taken in the oil refinery sector. Leakage of storage tanks and wastewater treatment facilities were also previously identified as the major fugitive emission sources [19,20,21]. Therefore, samples from two tanks where lower olefins (ST1) and gasoline stored (ST2) and one wastewater treatment sector for oil separating (WT) were collected.

2.1.2. Surface Coating and Printing

Industrial solvent use is an important source for anthropogenic VOCs emissions, which includes paint application, printing processes, dry cleaning, solvent evaporation from household products, and other industrial processes [14]. In this study, compositions of VOCs emitted from surface coating (auto manufacturing and equipment coating) and printing were sampled and measured according to the local industrial structure and VOCs emissions.
Specifically, a total of 16 valid emission samples covering the major crafting processes were collected from four sectors of a local automobile manufacturing enterprise: three samples (EC1–EC3) were taken in different processes in primer coating section, which is the first step of auto painting, and the electro-coating method was used to create an organic binding layer to modify the car surface in preparation for subsequent coating processes. Three samples were collected in the sealing section (S1–S3), in which composition ratios of VOCs were not adequately measured by previous studies. Moreover, since top-coating was regarded as the major source in auto industry due to the volatilization of organic solvents during spraying, flash-off, and drying processes, a large emphasis was given to the measurement of VOCs from this sector where six source samples (TC1–TC6) were collected. Finally, VOCs emitted from baking room after treating by regenerative thermal oxidation (RTO) technology were also sampled (RTO1–RTO4).
For the equipment coating industry, an air-conditioning facility was selected, and four samples from coating process were measured. Meanwhile, samples of two kind of printing, namely gravure printing and offset printing, were also collected in two printing facilities.

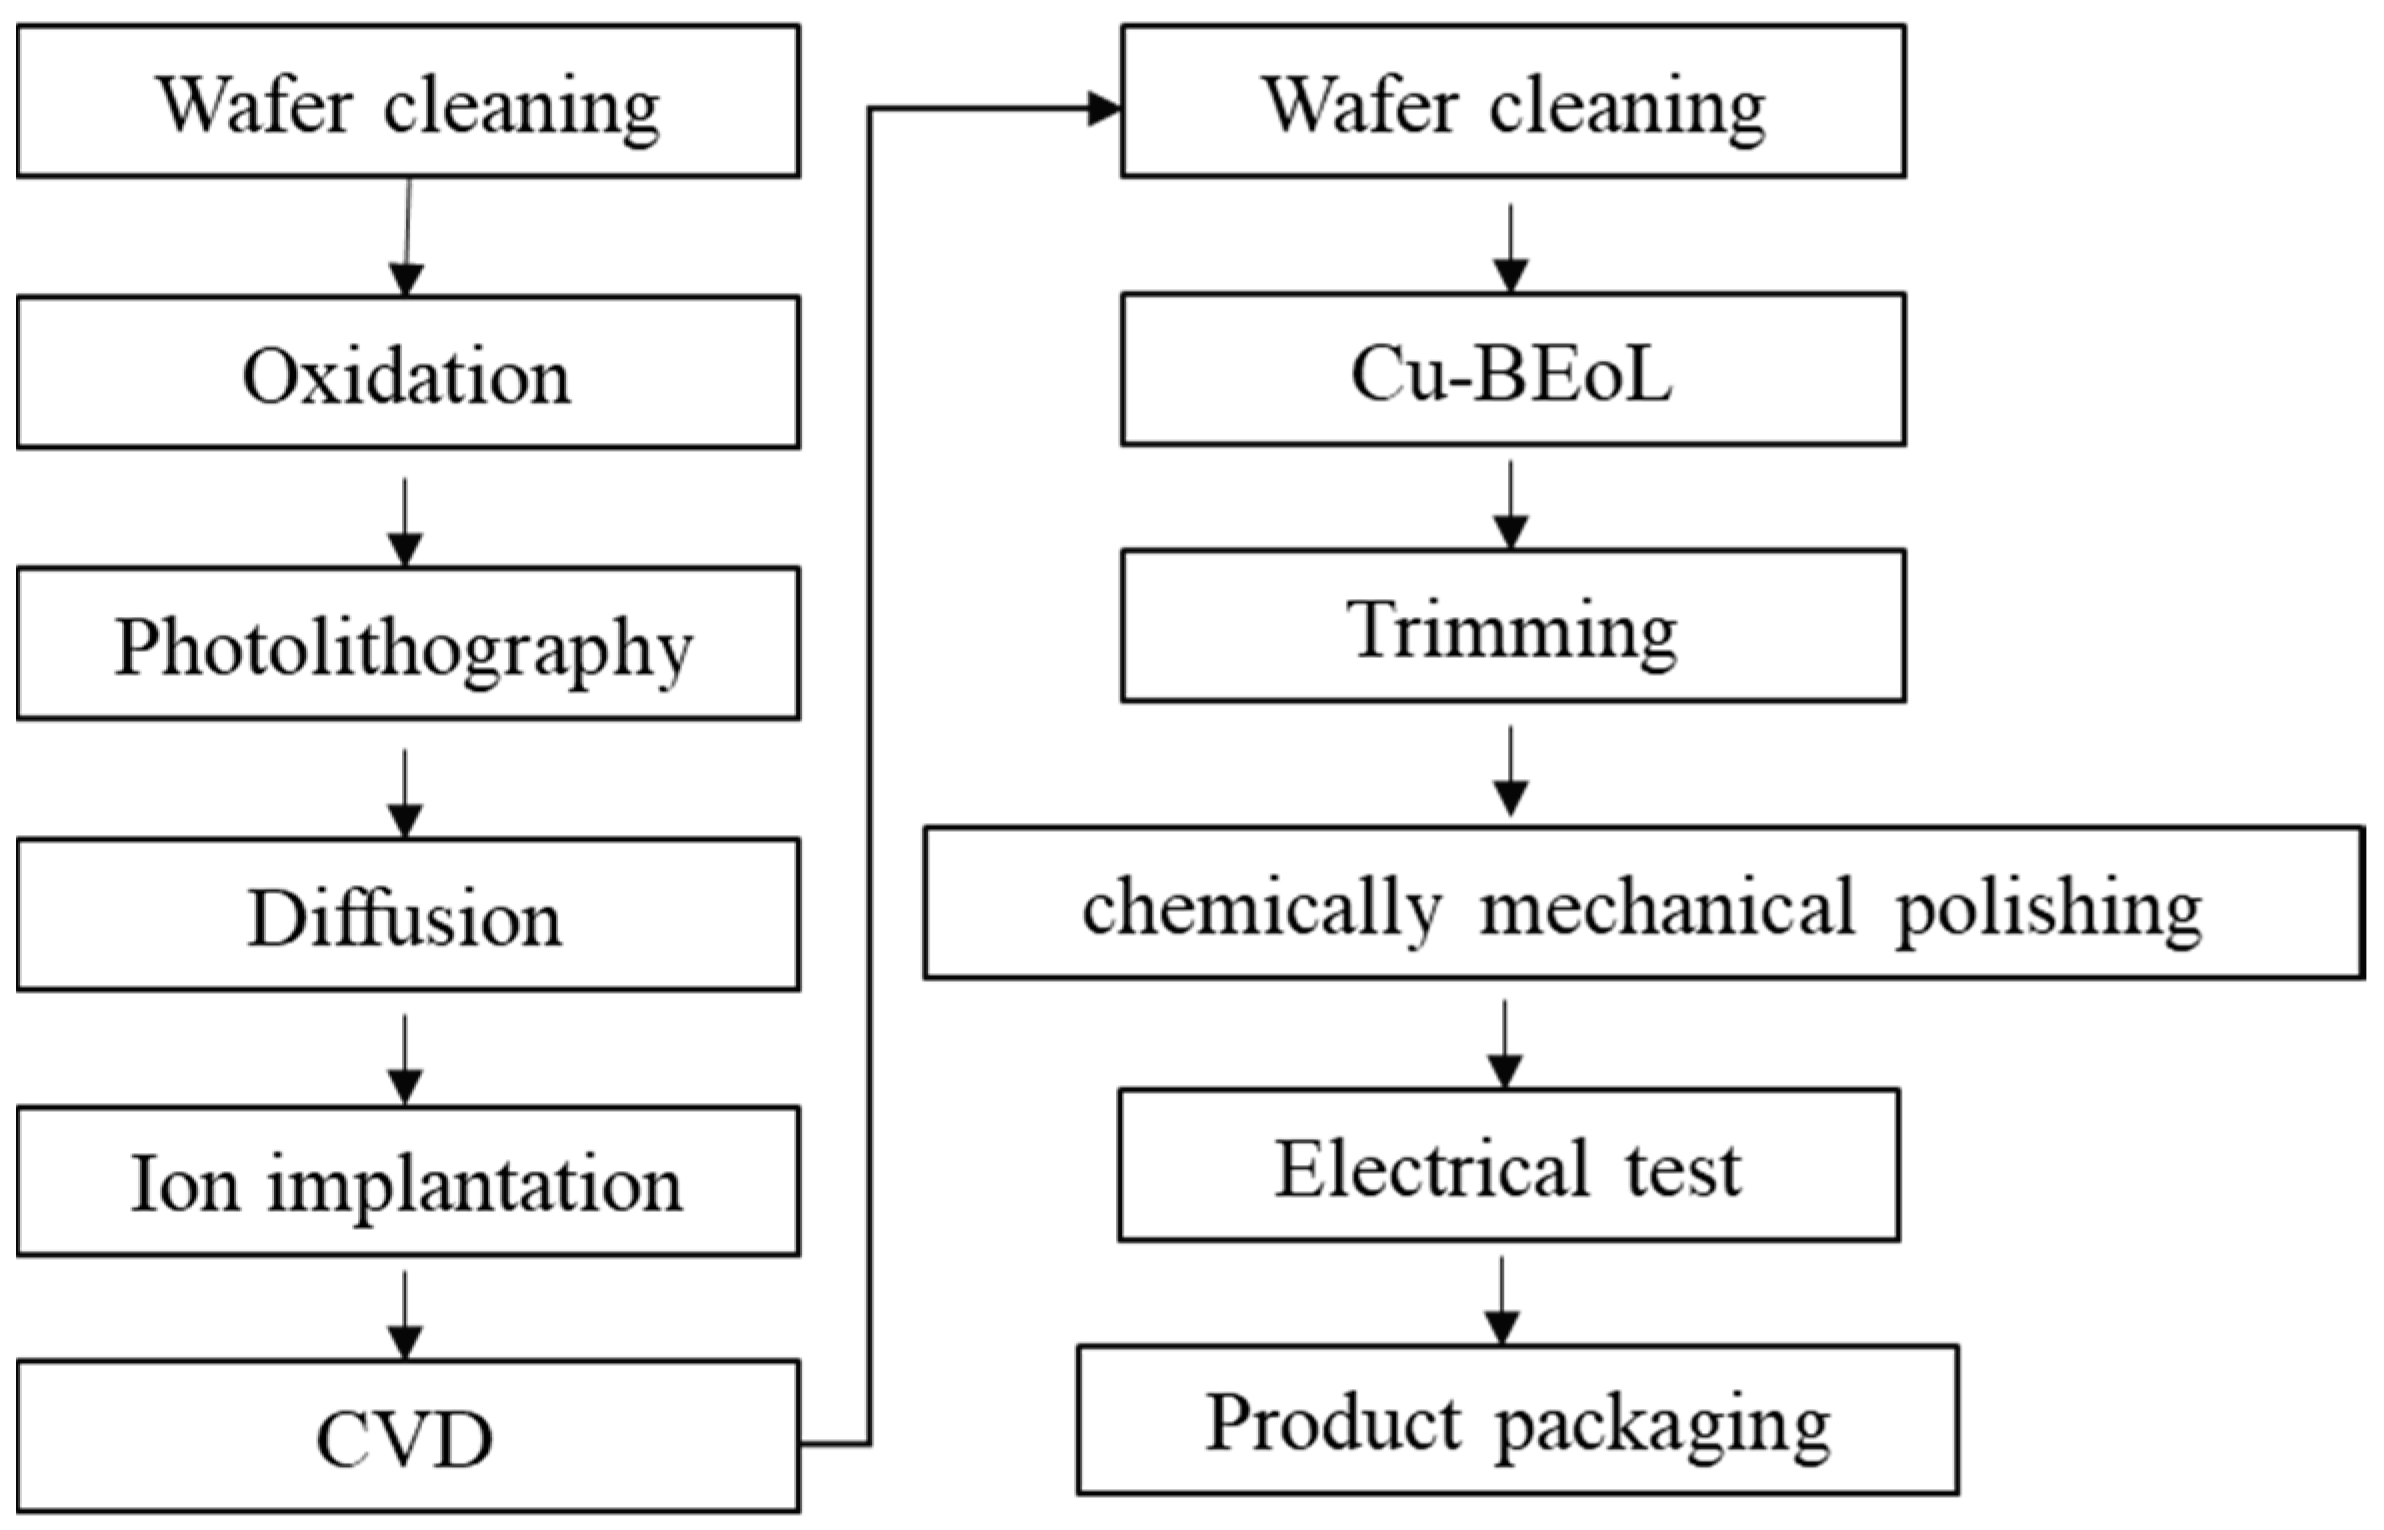
2.1.3. Electronic Manufacturing Industry

According to the work flows and electronic product processes, painting and cleaning workshops are two major sectors involved VOCs release due to the use of coatings and detergent. In this study, typical electronic industries in Wuhan City including PCB and integrated circuit chip (IC) manufacturing were experimentally investigated.

2.1.4. Emission from Gas Station

Fugitive emissions from oil production, usages, storage, and delivery are the major sources of emissions from fuels [22]. There are usually four kinds of methods to experimentally measure the structures of VOCs emissions from gasoline and diesel evaporation: (1) hot soak experiment, which is driven by residual engine heat; (2) 24 h day-and-night evaporation test from the vehicle at rest due to the diurnal variation of temperature; (3) headspace analysis, in which ample direct fuel vapor was taken from a sealed bottle with the fuels half filled; and (4) refueling loss measurement, which occurs during the refueling process due to dripping and vapors displacement [12]. In this paper, source profile of fuels evaporation in Wuhan City was measured and estimated by samples collected during filling vehicles tanks at the gas station. Based on urban fleet and gasoline sales, three types of widely consumed gasoline (grade 92#, 95#, and 98# octane) and one type of diesel fuel (0# diesel) were chosen for source profile measurements.
Canister sampling was performed 1 m downwind of the refueling gun to measure the evaporation from oil. A total of nine samples in accordance with China V were collected including three for Grade 92# gasoline and two samples for each of the other fuels (Grade 95#, 98#, and 0# diesel).

2.2. VOCs Analysis and QA/QC

The VOC chemical speciation of these samples was analyzed by GC-MS/FID system, and 86 VOC species were quantified. The VOC analysis procedures followed US EPA methods TO-14 and TO-15. Sources samples was collected using 3.2 L fused silica stainless-steel canisters that had been pre-cleaned with high-purity nitrogen (purity N 99.999%) and evacuated with an automated canister cleaning system (Entech 7100; Entech Instruments Inc., Simi Valley, CA, USA). Each sample was concentrated using a three-stage cryofocusing pre-concentration system (Entech 7200; Entech Instruments Inc., Simi Valley, CA, USA). H2O and CO2 were removed in the first two cryotraps using glass beads and Tenax-TA adsorbents, respectively. VOCs were then trapped at −180 °C in the final stage, and the trap was rapidly heated, after which VOCs were transferred into the gas chromatography–mass spectrometry/flame ionization detection (GC–MS/FID) system for analysis (GC, HP-7820; MSD, HP-5977B; Hewlett-Packard, Palo Alto, CA, USA). This system used a Dean Switch™ (Agilent Technologies, Santa Clara, CA, USA) to introduce the effluent into a DB-624 column (60 m × 0.25 mm × 1.4 μm; J&W Scientific, Folsom, CA, USA) with an MSD to separate and analyze compounds (C6–C12 hydrocarbons, Halogenated hydrocarbons and OVOCs) and a PLOT (Al2O3) column (15 m × 0.32 mm × 5.0 μm; Dikma Technologies Inc., Massier Ln, CA, USA) with an FID to measure the C2–C6 hydrocarbons. The GC oven temperature was programmed initially at 37 °C for 5 min, increasing to 120 °C at 5 °C/min and holding for 5 min, and then increasing to 180 °C at 6 °C/min and holding for 5min. The entire process took ~41.6 min. The carrier gas was pure helium (purity N 99.999%). The MSD was operated in the scan mode with amass range of 29–350 amu. The ionization method was electron impact (EI, 70 eV).
During the analysis process, strict protocols for quality control and quality assurance were used. The standard gas including Photochemical Assessment Monitoring Stations (PAMS) standard mixture (57NMHCs) and TO-15 standard mixture (65 compounds, from Linde Spectra Environment Gases, Alpha, NJ, USA) was used to calibrate the C2–C12 VOCs. Calibration was performed at five different concentrations from 0.5 to 8 ppbv by the 57 PAMS gas standard and 65 TO-15 gas standard. Bromochloromethane, 1,4-difluorobenzene, Chlorobenzene-d5, and 4-Bromofluorobenzene were used as internal standards for each sample to calibrate the system. The precision of each species was within 10%. A gas standard (diluting from 1 ppm to 2 ppbv) was measured each day to check the stability of the system. The method detection limits (MDL) for various compounds ranged from 2 to 50 pptv.
The species list composed of 28 alkanes, 11 alkenes, 1 alkyne, 16 aromatic compounds, and 24 halocarbons was presented in Table 1.

3. Results and Discussion

Source profiles were obtained by averaging the weighted percentages of individual VOC species relative to the sum of all quantified VOCs. The numbers in the source profiles correspond with the number per compound as given in Table 1. Detailed emission values appear in the Supplementary Materials.

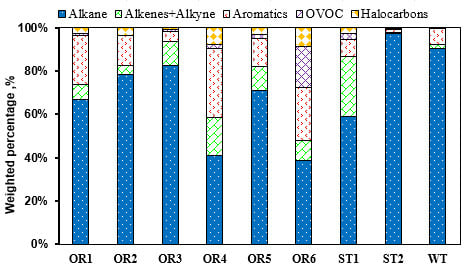
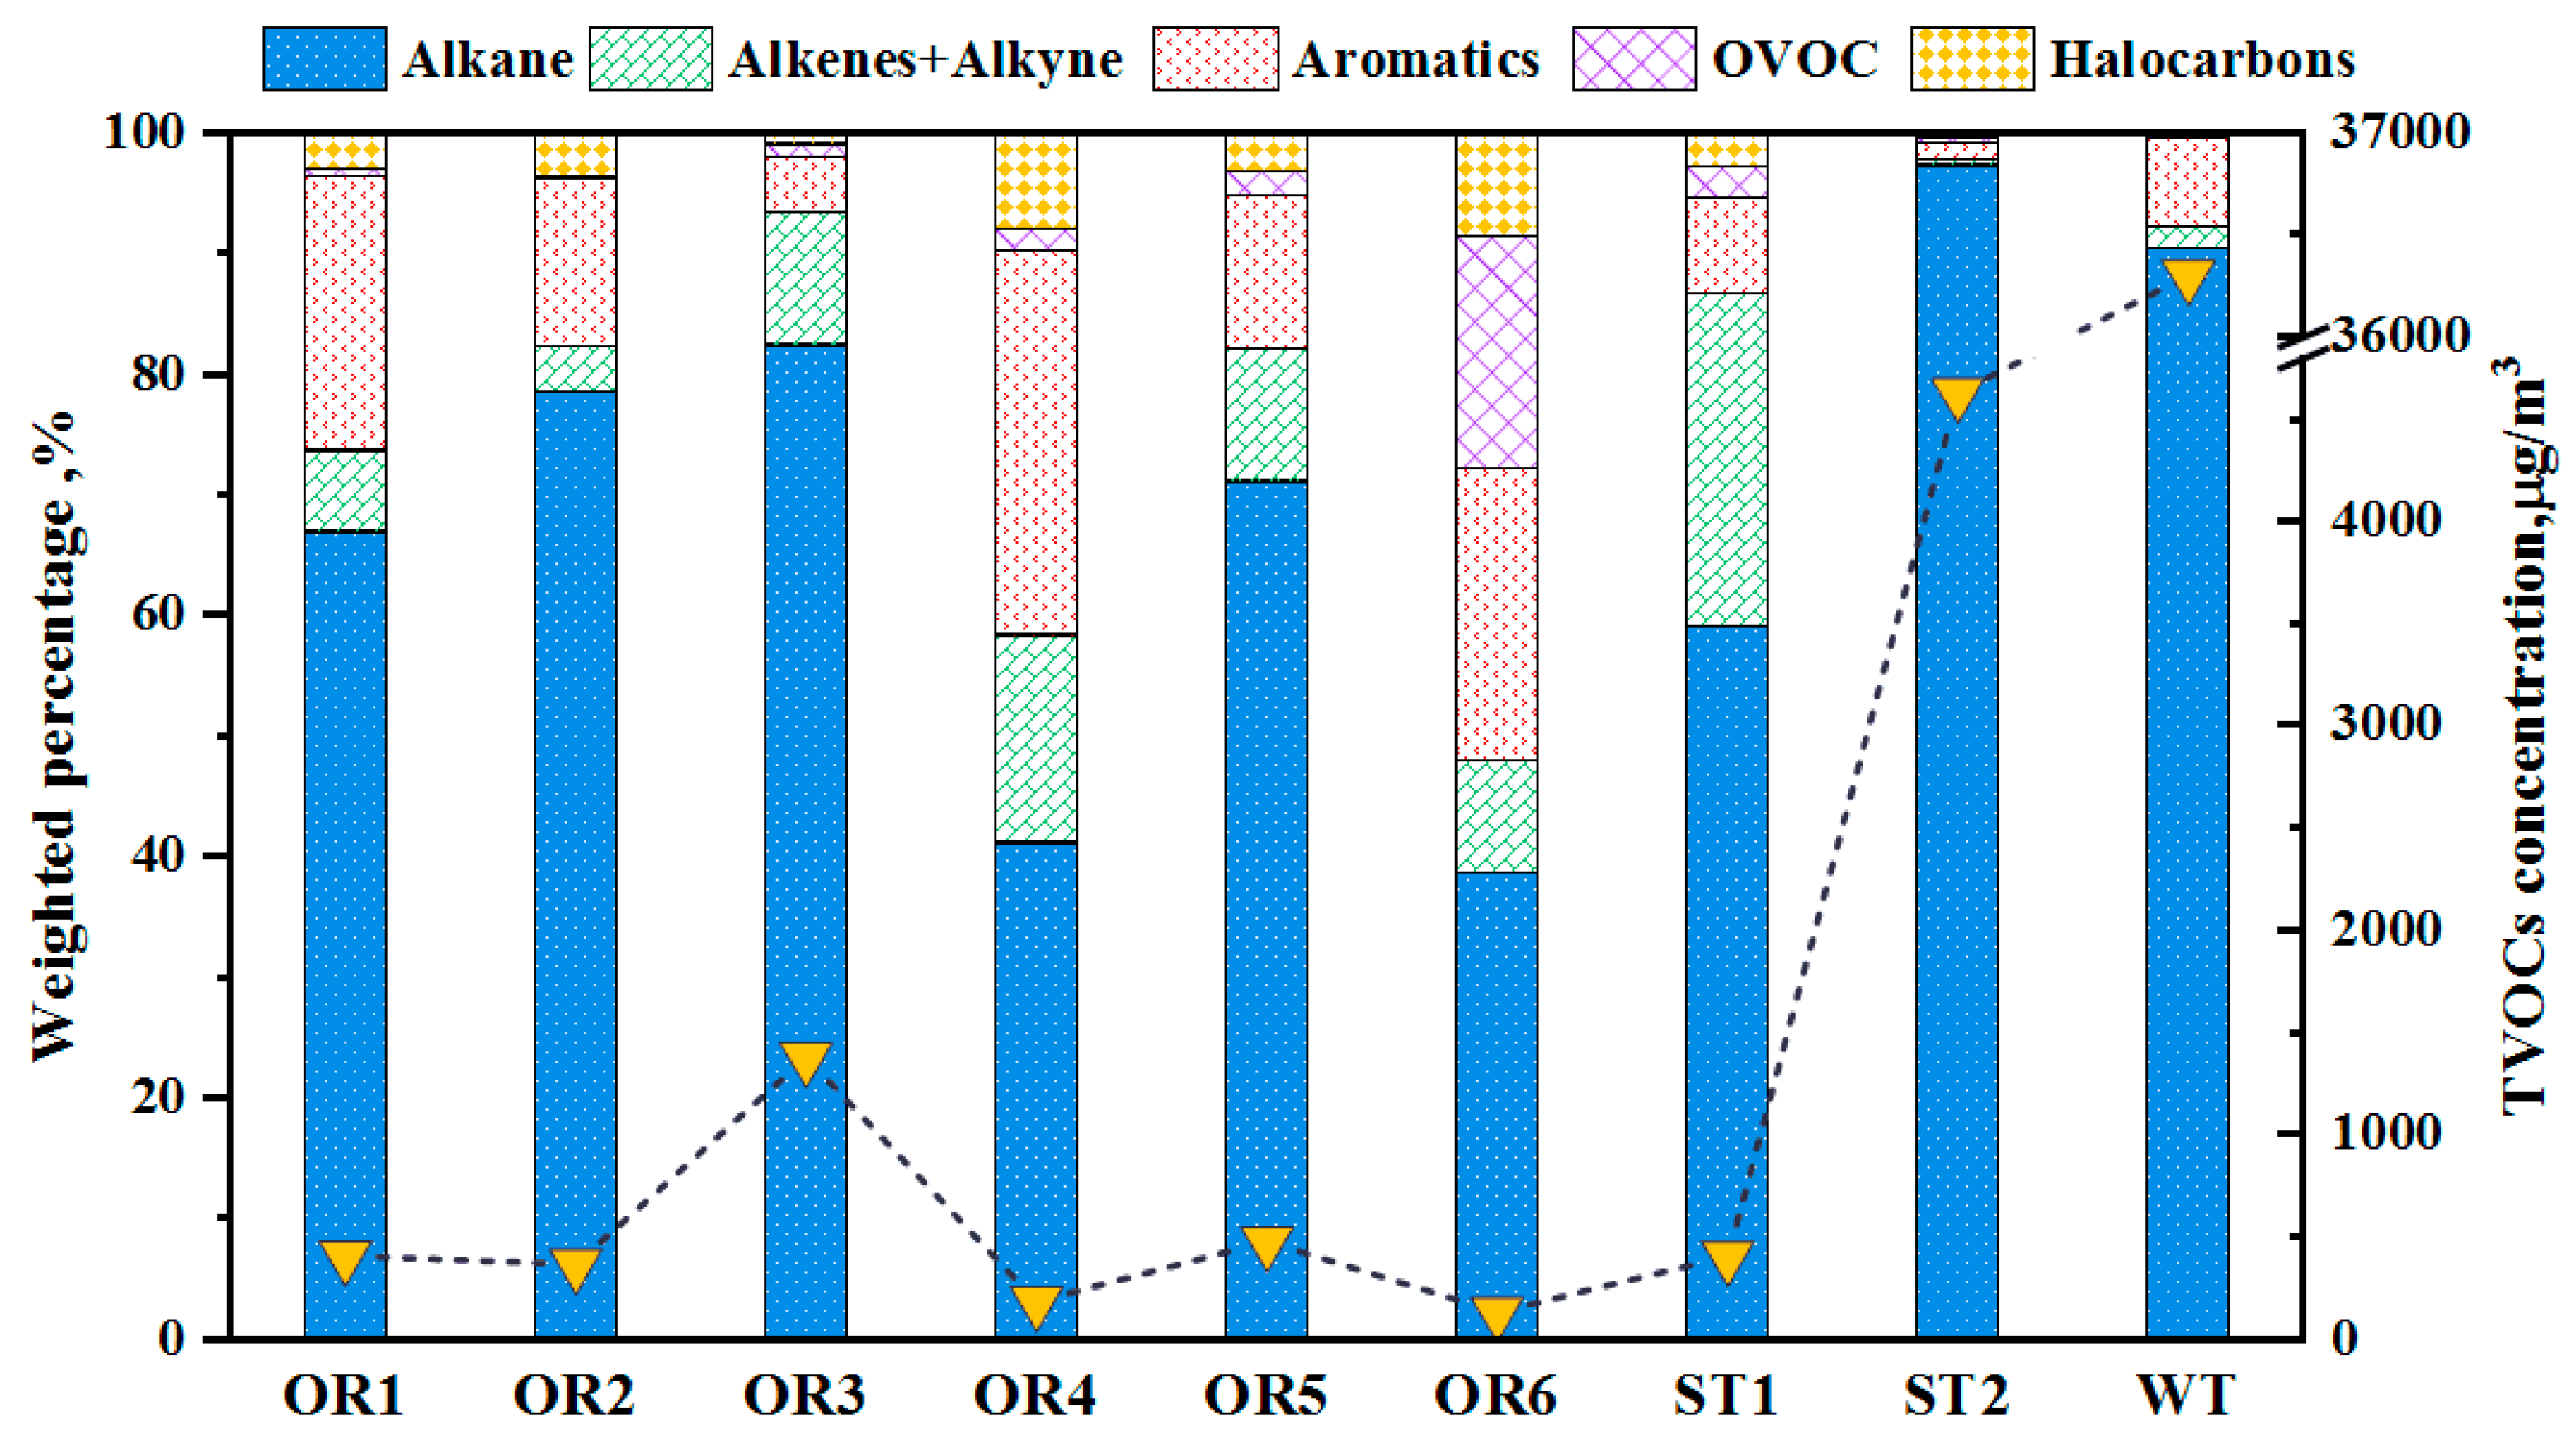
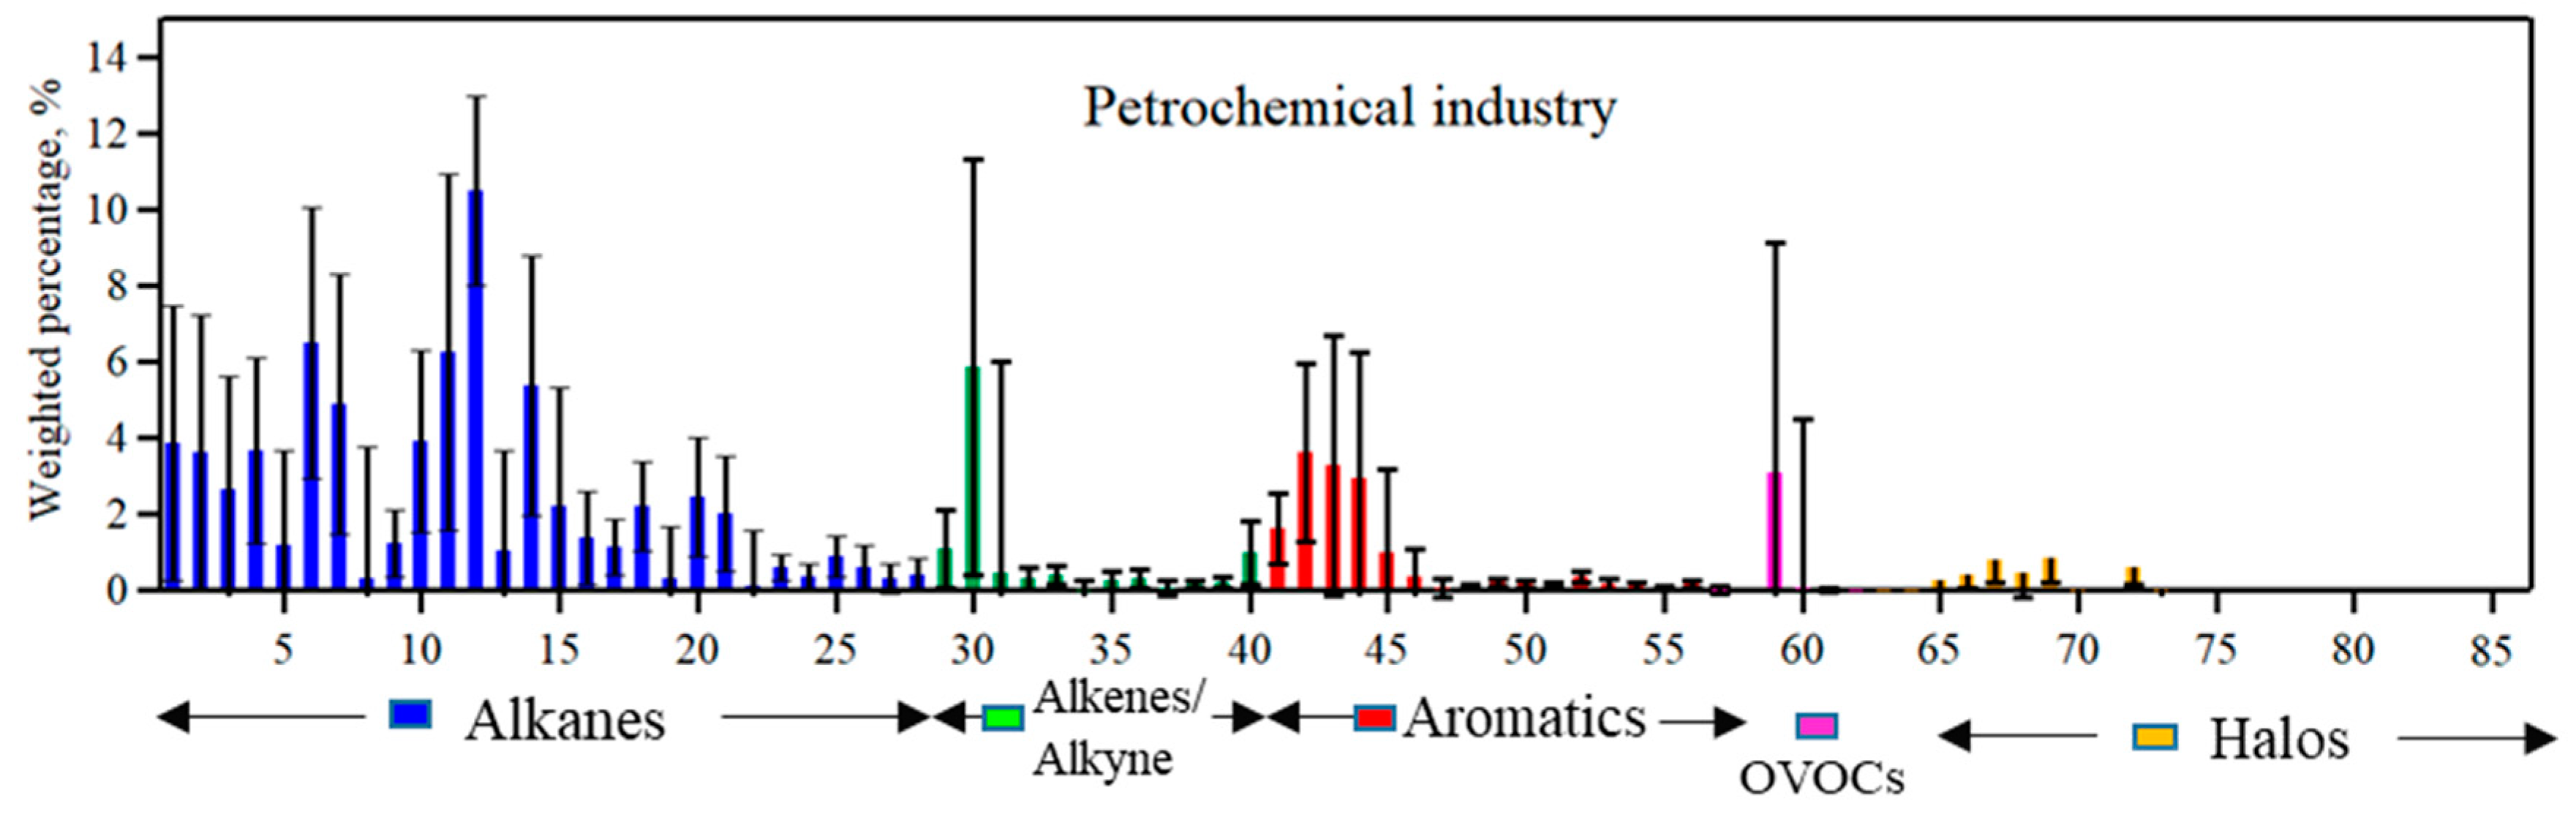
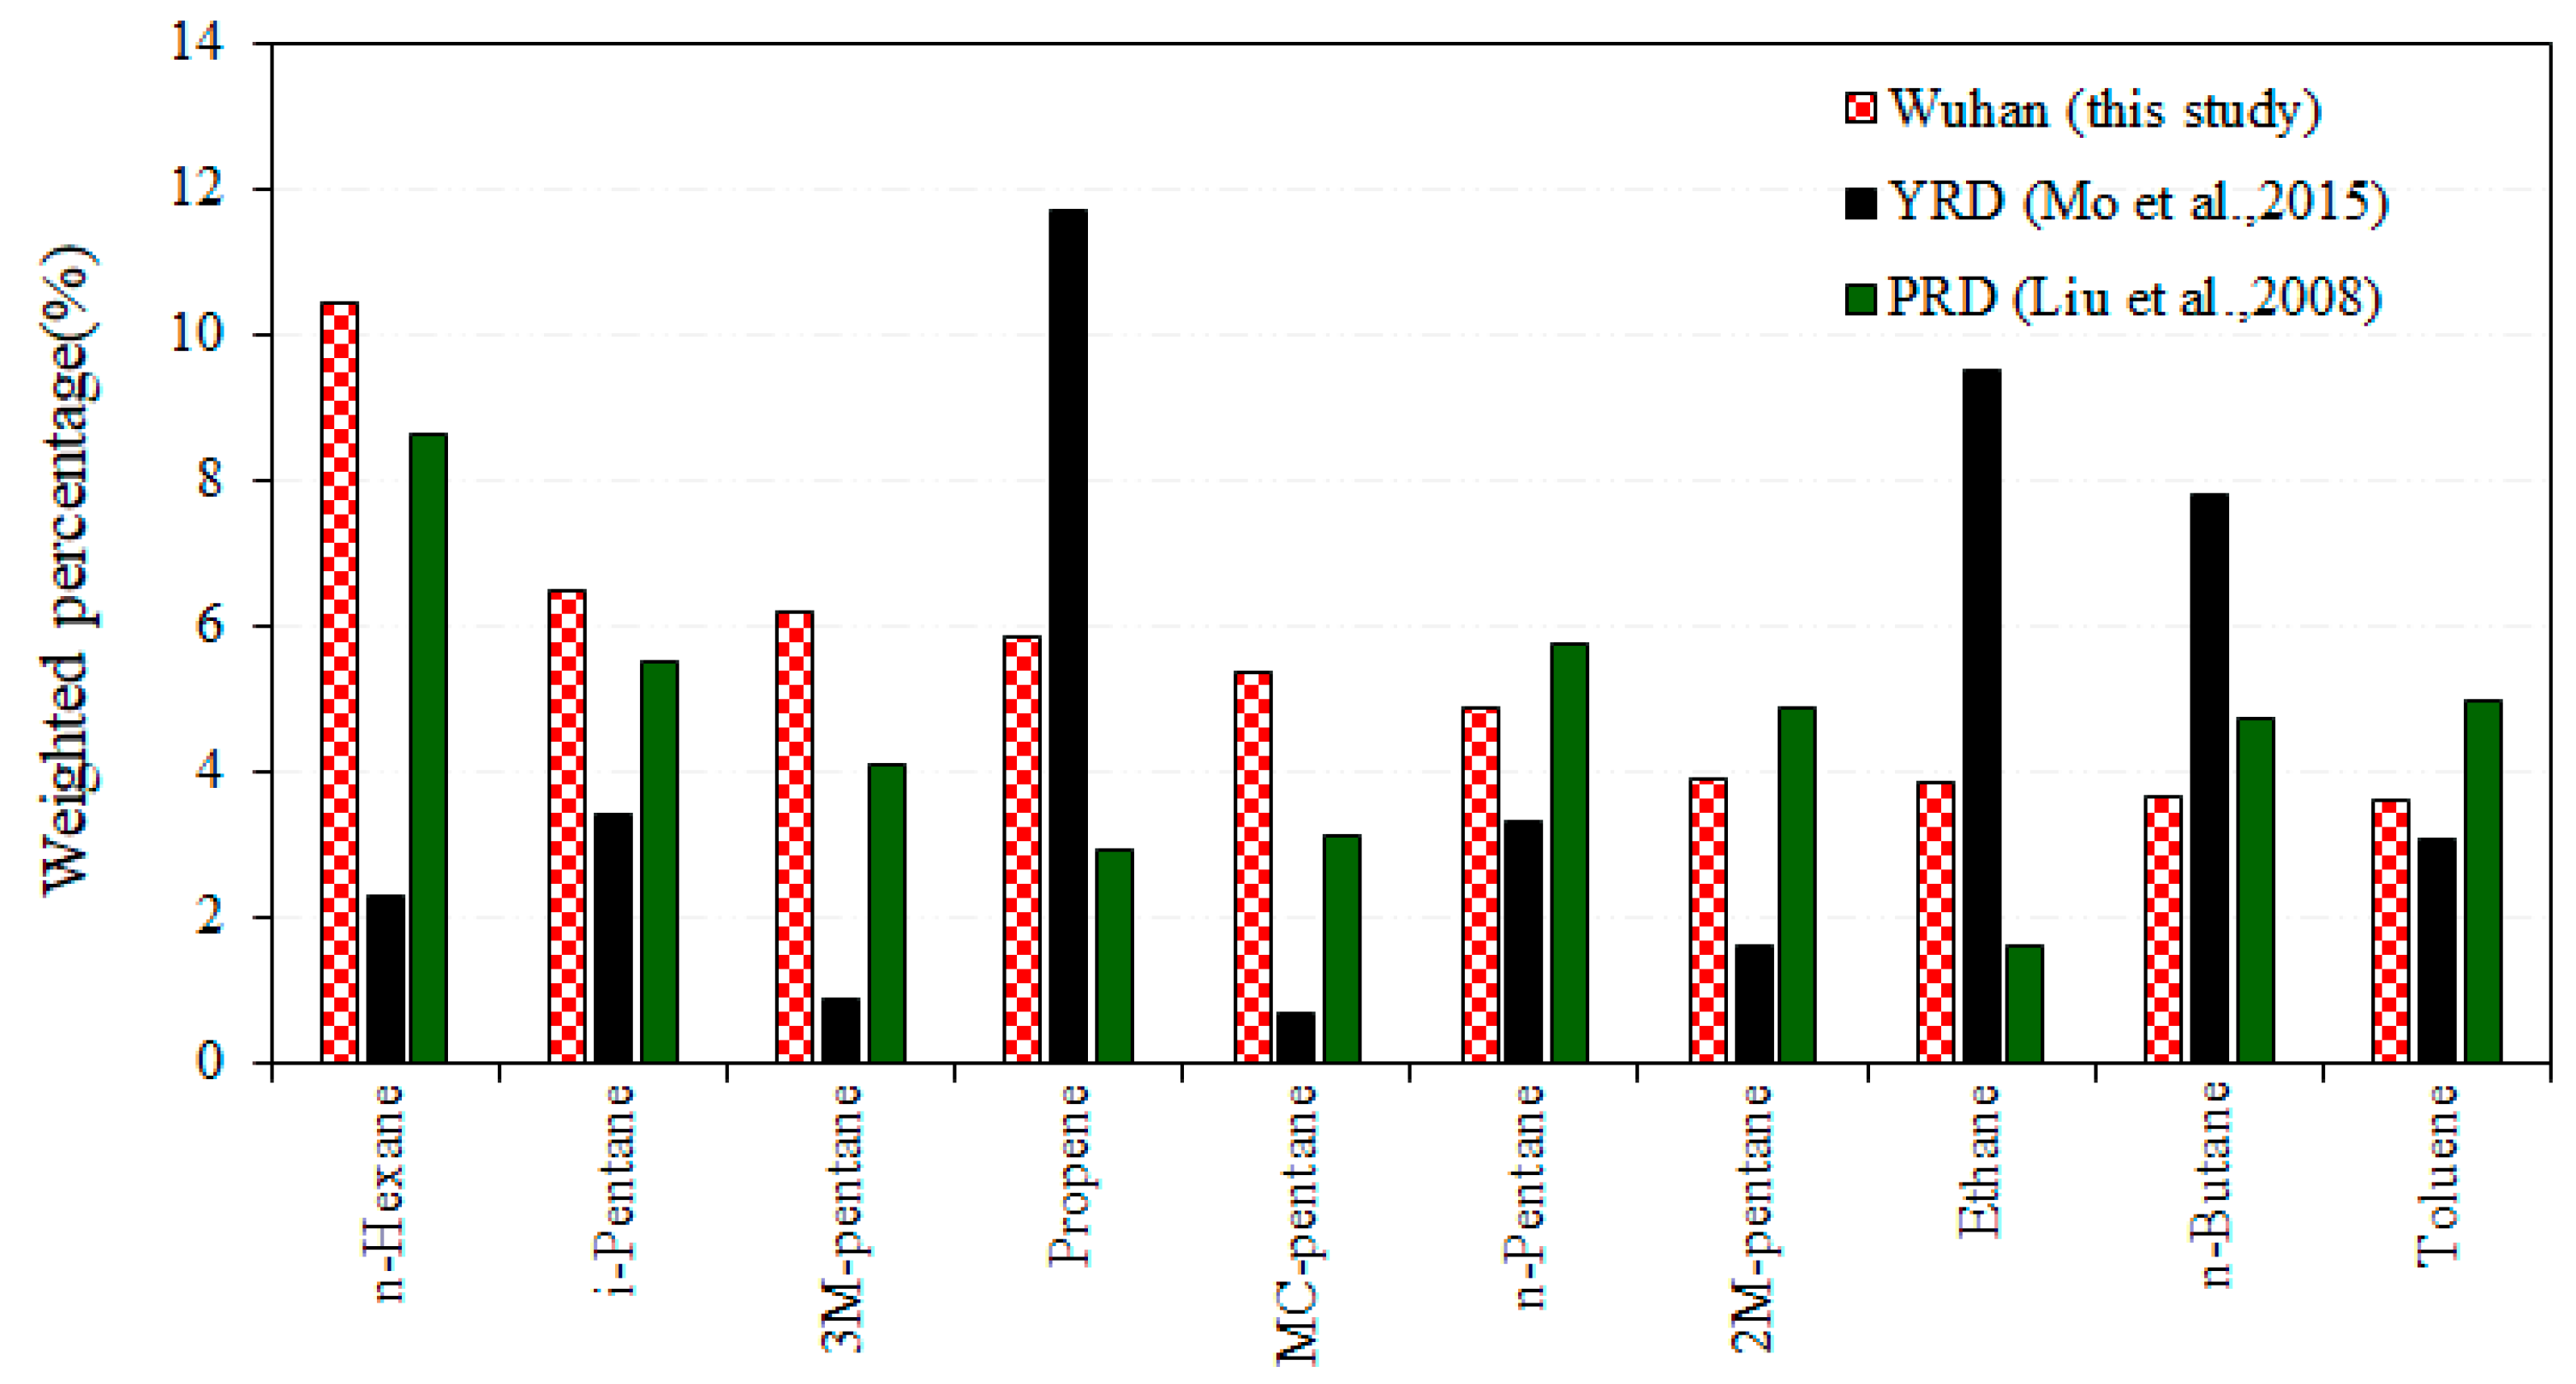
3.1. Petrochemical Industry

The total mass concentrations and chemical structures of the 86 analyzed VOC species measured at various process units are depicted in Figure 2. Figure 2 illustrated the overall VOC group patterns and the sum of all measured VOCs (TVOCs) mass concentration from different processes including oil refinery (OR1–OR6), storage tank (ST1,ST2), and wastewater treatment (WT). The highest mass concentration of TVOCs reaching 36,302 μg/m3 was observed in the WT sector, confirming that wastewater treatment facilities were important in the process of VOC emissions. The mass concentrations of VOCs varied from 132 to 1377 μg/m3 in oil refinery units, while significant variations were found between the olefin tank and gasoline tank, where 405 μg/m3 and 4630 μg/m3 of TVOCs were detected, respectively. This obvious difference may attributed to the different emission strength and diffusion conditions during sampling.
Chemical structures of the various processes showed that alkanes were the dominant VOC group in all sectors, accounting for 41.1–97.4% of the total VOCs mass concentration (Figure 2). To be specific, in the refining process of CDU&VDU (OR1), reforming hydrogenation (OR2), and catalytic cracking (OR3), alkanes were the most abundant VOC group with a range of 67.0–82.5%, followed by aromatics (4.6–22.8%) and alkenes (3.8–11.0%). Emission from two catalytic hydrogenation units with different raw materials (OR4 with wax oil and OR5 with gasoline and diesel) exhibited some discrepancies. Aromatics and alkenes represent much higher percentages of the total VOCs in OR4 rather than that in OR5. Coking units (OR6) had a different chemical structure where the highest levels of OVOCs contributed to the total mass. Due to the fact that the raw materials and products stored in the two tanks were different, a higher percentage of alkenes were detected at the olefins tank (accounting for 22.9% of the total) rather than that of the other units, while alkanes contributed over 97% to the total VOCs from the gasoline tank. For the wastewater treatment of oil separating, alkanes were also the most prevalent species (90.5%), followed by aromatics, which accounted for 7.3% of the total VOC emissions, similar to that (6.1–7.7%) of wastewater treatment reported by Mo et al. (2015).
The top five VOC species measured in each unit are list in Table 2, and the source profile for petrochemical facilities as a whole is compiled and introduced in Figure 3. In addition, major species in the profile and their percentage in the total mass are also list in the last column of Table 2. Generally, C4–C6 alkanes, propylene, C6–C8 aromatics, and MTBE were the major composition for the petroleum refinery industry. n-Hexane and iso-pentane were the most frequently monitored species in different process units and accounted for a large part of the total VOCs emissions.
In detail, for OR1-OR3, n-Hexane was in the first grade with a range of 9.8–17.5%, followed by C4–C5 alkanes, C6 branched alkanes, and toluene. Catalytic hydrogenation by wax oil (OR4) was characterized by high loadings of aromatics such as toluene, ethylbenzene and m/p-Xylene. In compare, aromatics were negligible in OR5 unit whereas C4–C6 n-alkane were the most significant. For the two storage tanks, propylene were richest species (21.0%), followed by C2–C4 alkanes (5.9–11.5%) in ST1 while C6 linear and branched alkanes were most abundant in ST2. Major species emitted from wastewater treatment were found to be C4–C6 linear alkanes.
VOCs from petrochemical facilities were characterized by previous studies with a focus on assessing their impact on the environment [23,24,25]. Recent research has been devoted to the establishment of the source profile of the petrochemical industry and to identify specific VOC emissions originating from the various manufacturing processes. Liu et al. (2008) collected seven ambient samples in a selected petrochemical industrial area (PRD) and reported the VOC chemical structures of different oil refinery sections [26]. Mo et al. (2015) investigated emission characteristics of VOCs from various process units in the petrochemical, basic chemical, and chlorinated chemical plants in the YRD region and compiled the composite profiles for each sectors. The top-10 species in the composite profiles of petrochemical in this study and their proportions in other studies are compared and listed in Figure 4.
Major VOC species for the petrochemical industry measured in this study were similar to the profile reported by Liu et al. (2008), in which n-hexane was consistently the most abundant species in both studies. However, the levels of individual species varied across studies. The proportions of n-pentane and toluene were slightly lower than that in the PRD region, while levels of ethane and propene were much higher in Wuhan rather than those found in the PRD region. In comparison, a clear difference could be found between this study and results given by Mo et al. (2015). The chemical composition of VOCs in the YRD region exhibited a higher abundance of lighter components, especially ethane, propene, and n-butane, which were not obvious in Wuhan. Such discrepancy may be caused by different sampling locations in the petrochemical complex.

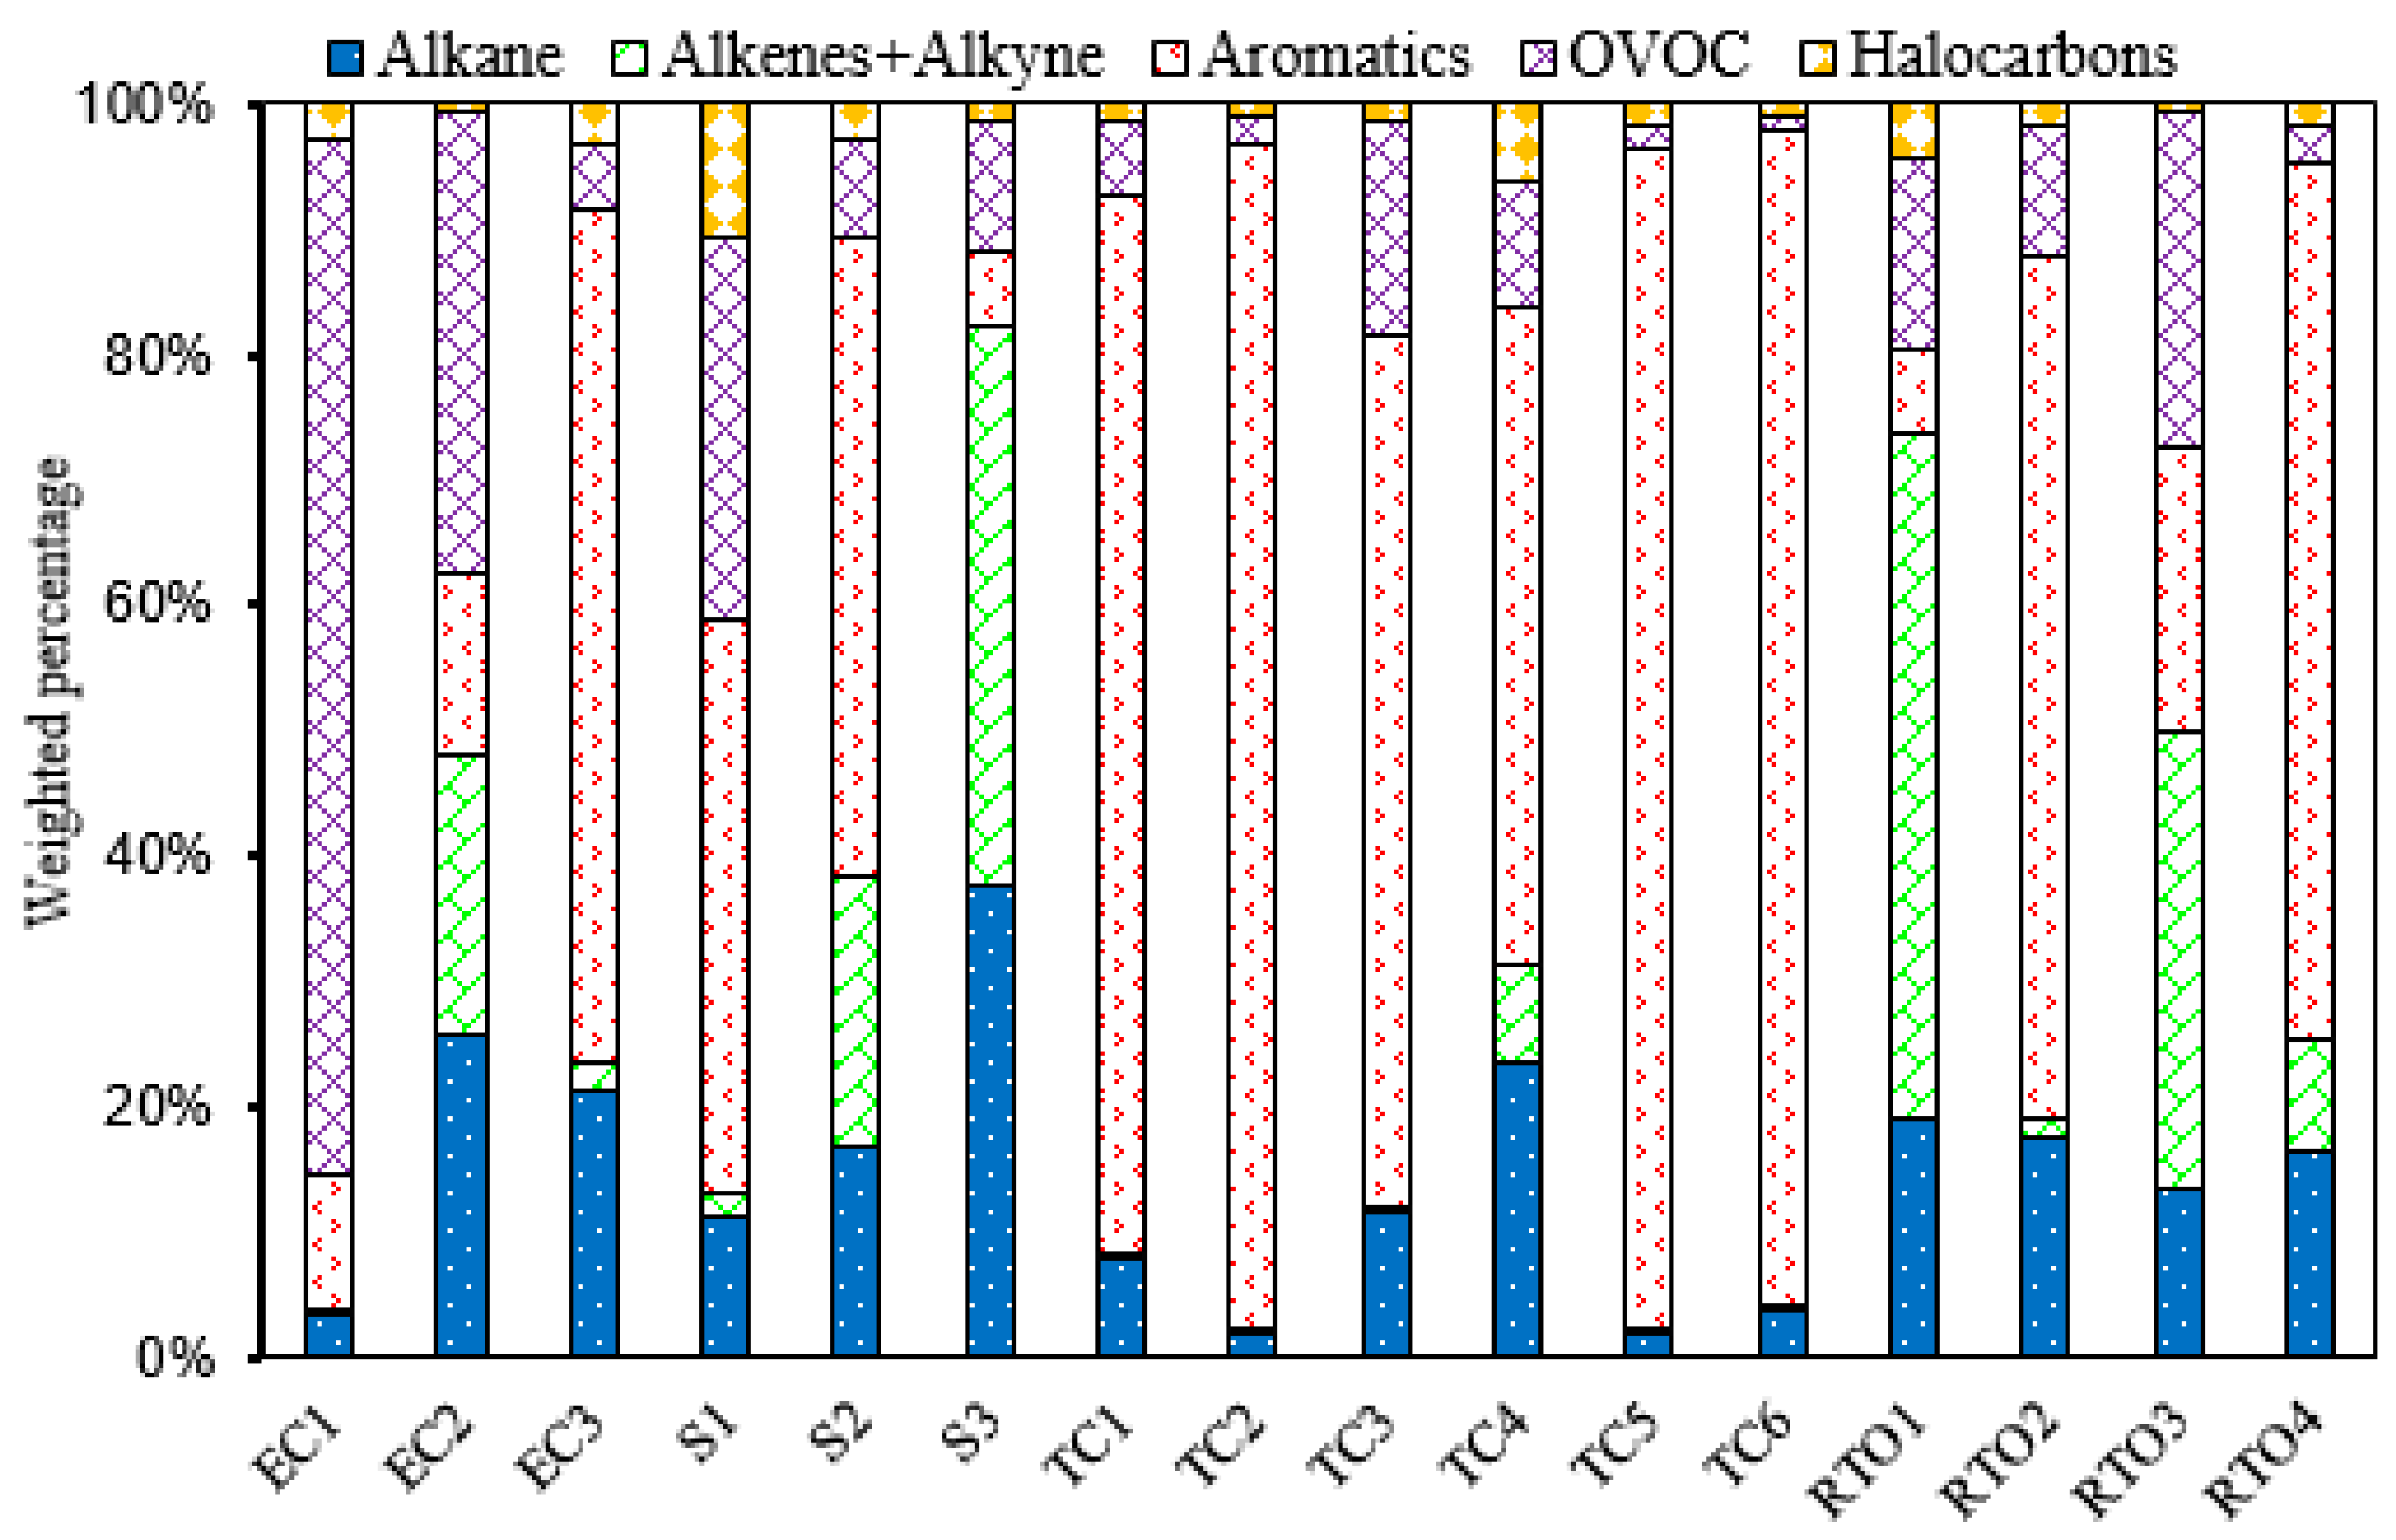
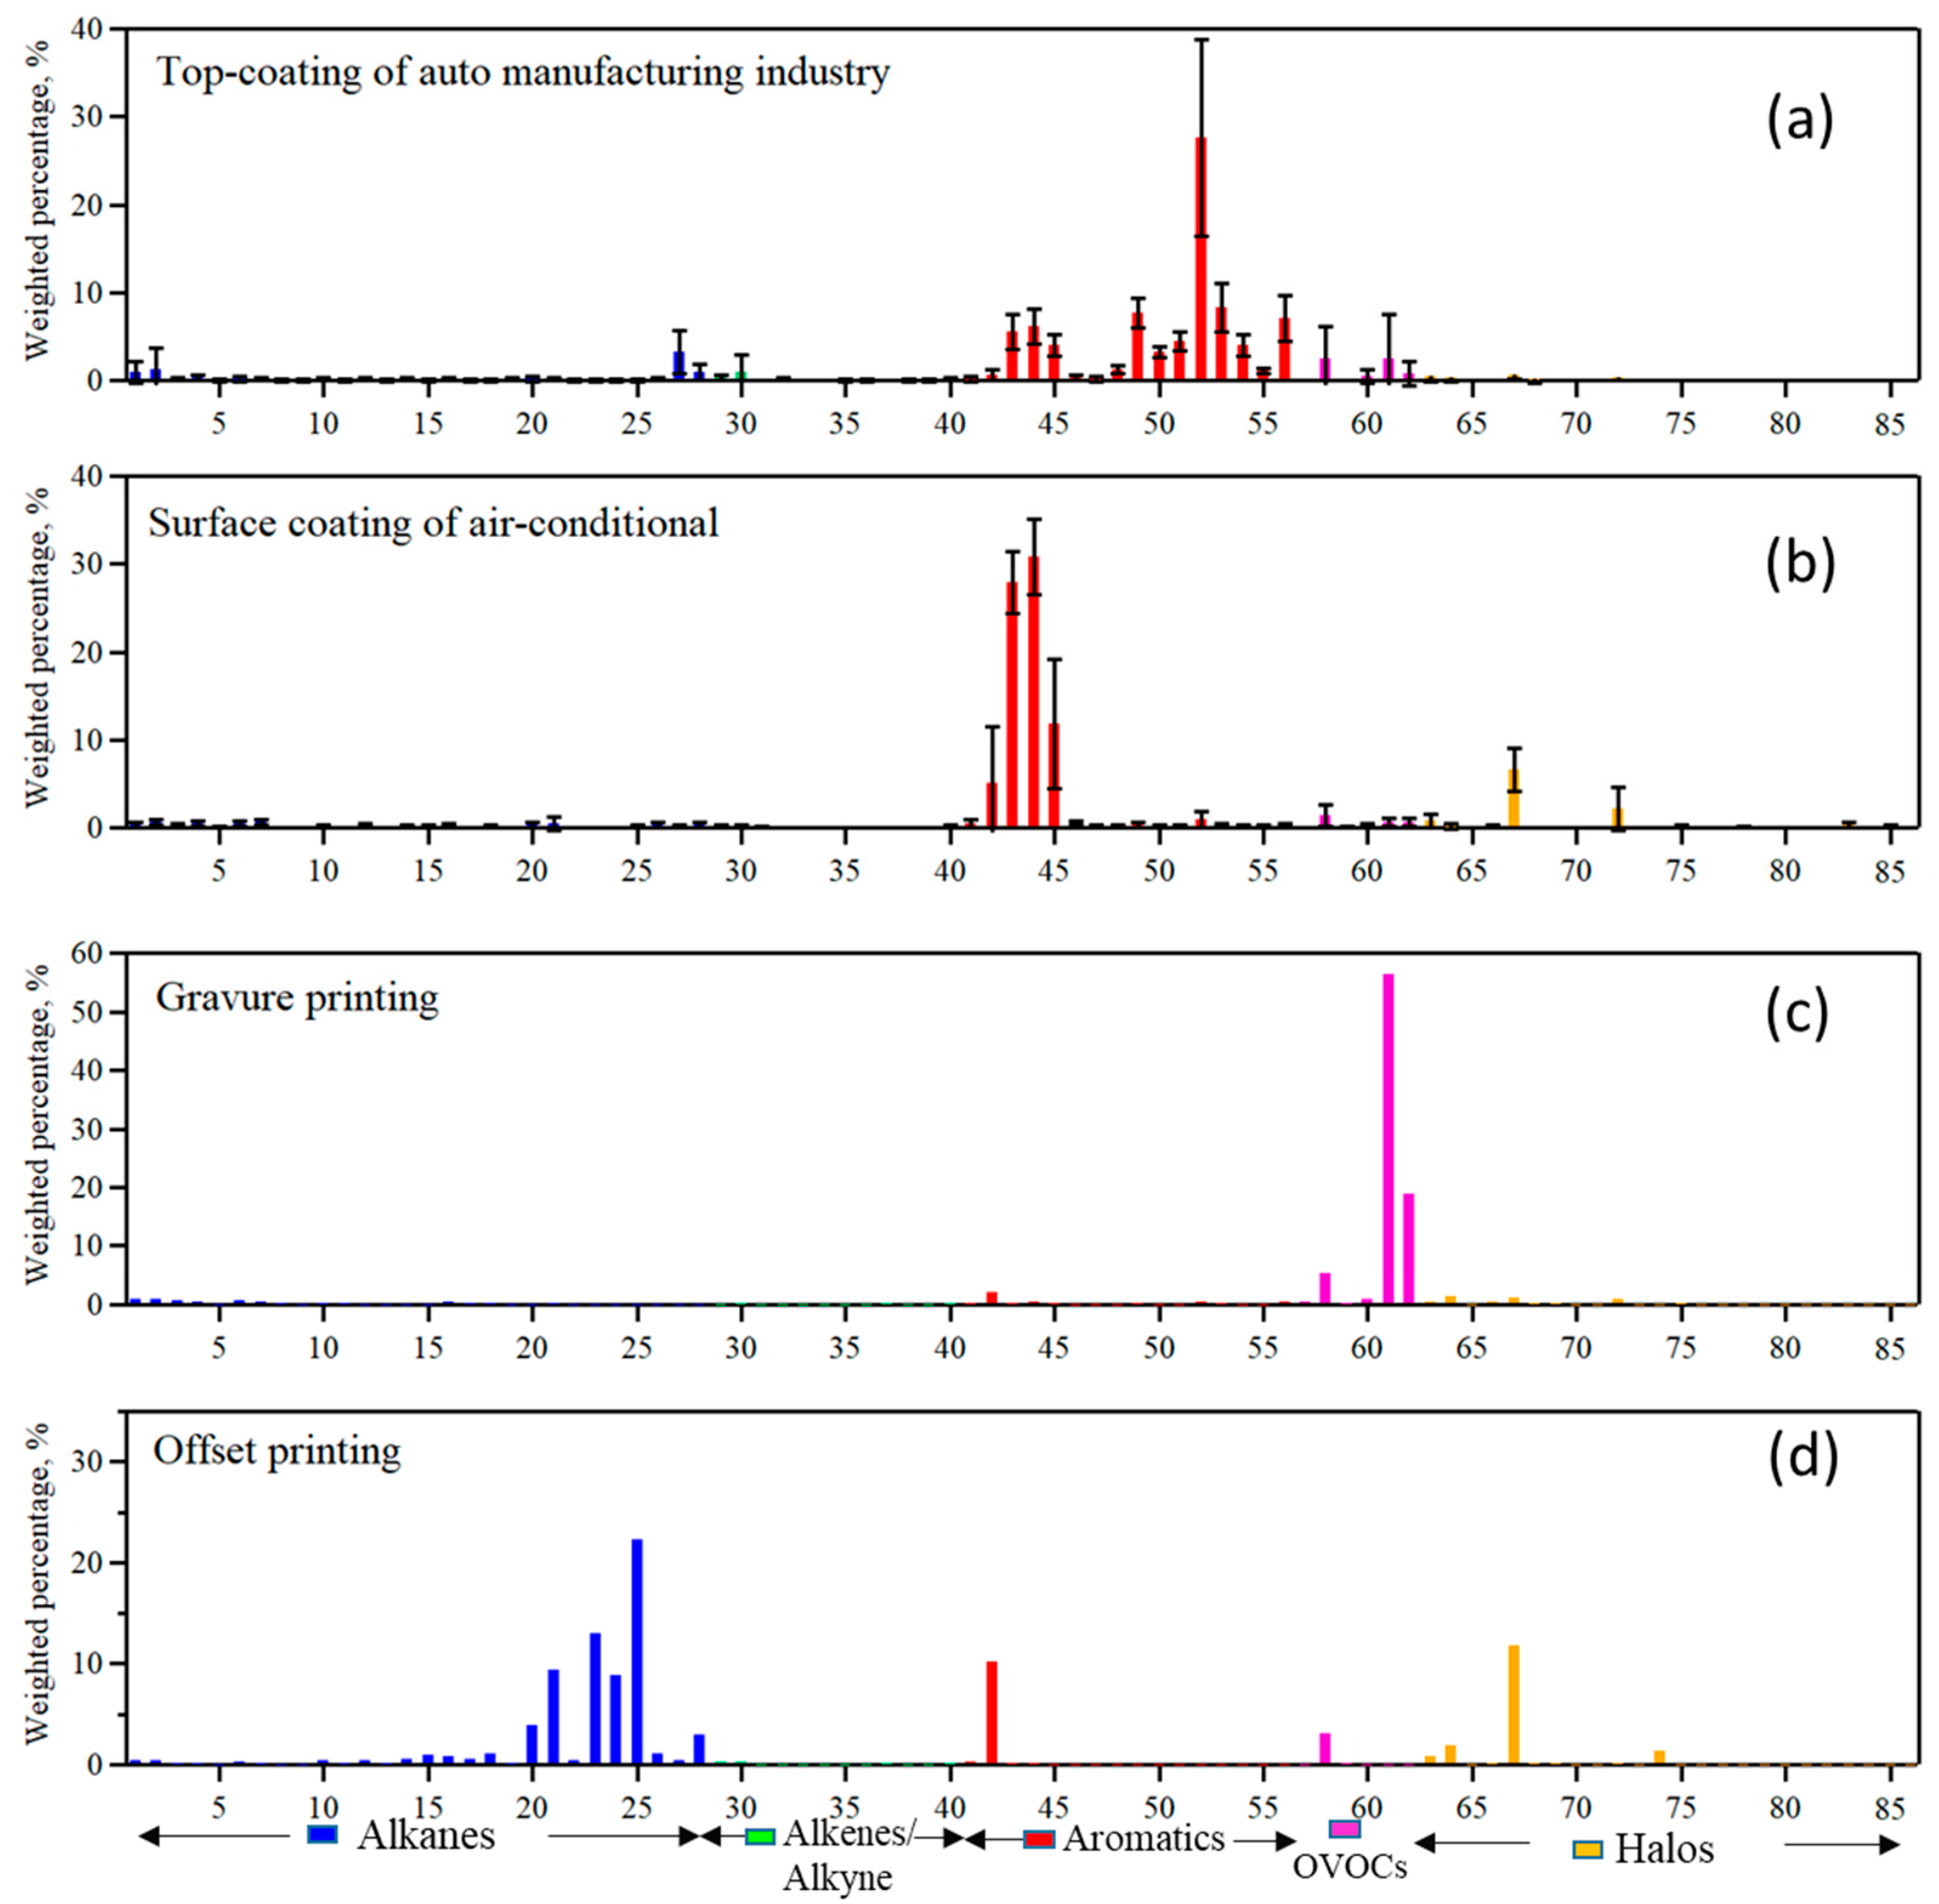
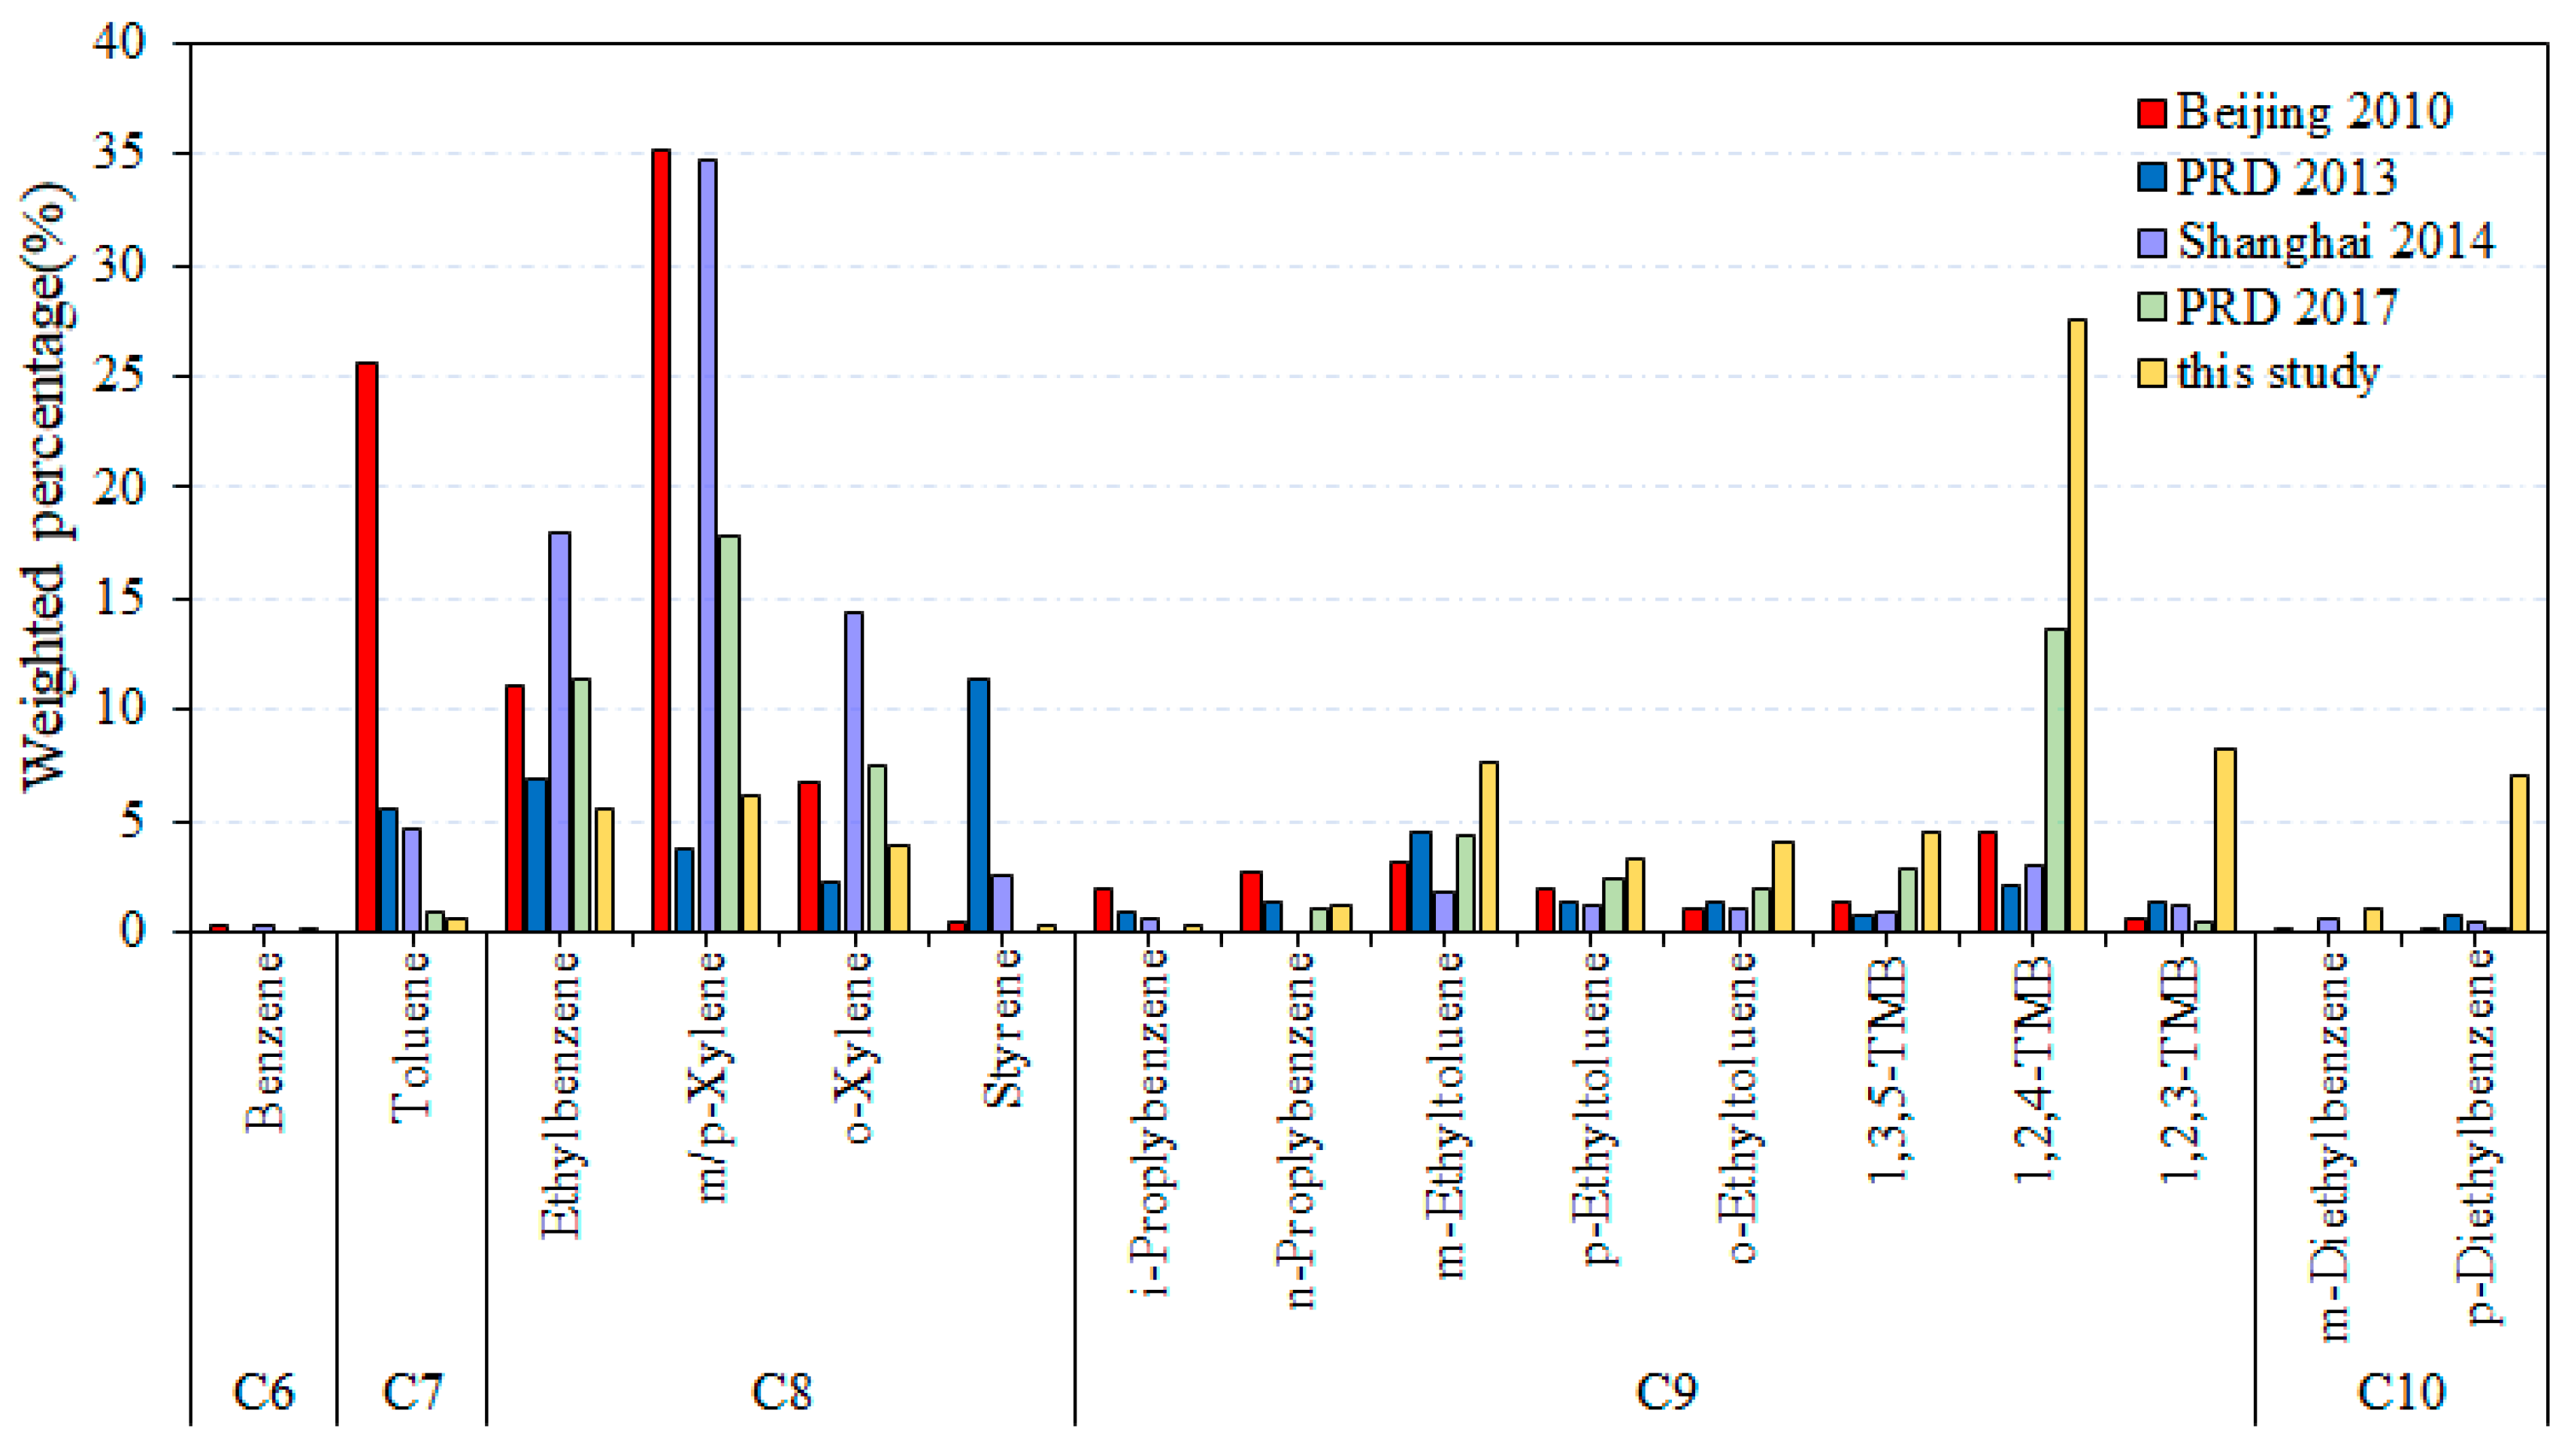
3.2. Surface Coating and Printing

According to Wuhan statistics, auto manufacturing is the leading source of surface coating in Wuhan, with vehicle products reached 1.768 million in 2016, yielding a 23.9% increase compared to 2015. The complete auto painting processes includes primer coating, sealing unit, intermediate coating, and top coating. Primer coating aims to create an organic binding layer to modify the car surface in preparation for subsequent coating processes, followed by under body coating (UC) and stone guard coating (SGC) with sealing material (mainly consisting of PVC). Intermediate coating was conducted between primer coating and top coating, the latter of which is the last step in the auto coating process that is required for final car aesthetics and protection to add color, light refection, and waterproofing. A detailed process flow chart can be found elsewhere [27]. Measurements demonstrated that the emissions from coating and baking processes in auto manufacturing were significant sources to ambient VOCs [27]. In this study, samples from intermediate coating were not collected because of the difficulties in sampling, while VOC emissions from the other major process units were measured and studied.
As shown in Figure 5, emission characteristics of the four sectors in automobile manufacturing workshops differed from each other. The possible reasons were the differences in raw and auxiliary materials used, manufacturing processes, and treatment strategies. OVOCs were the largest group in EC1 and EC2, while aromatics were most abundant in EC3, reflecting the fact that both water-based and oil-based paints may be used in the electro-coating process. For the PVC sealing unit, aromatics dominate the chemical compositions of S1and S2, while S3 was characterized by high loadings of alkanes, alkenes, and alkyne. This is because S3 was collected at the funnel of the baking room where exhaust was collected and treated by catalytic combustion. Therefore, VOC compositions measured in this sample embodied the character of the combustion process, which broke down macromolecular organic chemical components into smaller molecules. Similarities in terms of VOC composition patterns were observed in the top-coating sector (TC1–TC6), and aromatics were consistently the largest VOC group with contributions up to 52.6–94.6% of the total mass weight. RTO facilities were equipped in each baking room to collect the exhaust after the drying process. Among them RTO1–RTO4 were sampled at the funnel of the baking units in the top coating system. Therefore, chemical structures of VOCs emitted from the RTO exhibited the combination of solvent use and combustion characters.
Differences between emission compositions from top coating and those from other process units were significant, and in consideration of sample’s representativeness, the profiles of six top coating samples were averaged into an integrated source profile to represent the average emission from auto coating industry. Figure 6 illustrates the source profile of the auto industry (Figure 6a) together with chemical compositions of VOCs from surface-coating of air-conditioning (Figure 6b), gravure printing (Figure 6c), and offset printing (Figure 6d).
In general, aromatics (79.5~81.4%) were the largest group in auto-painting factories, while oxygenated VOCs (82.0%) and heavy alkanes (68.7%) were dominant in gravure printing and offset printing factories, respectively. However, the major species of aromatic VOCs in the two surface coating processes were different. C9 aromatics contributed a large part in the top-coating sector of the auto industry, with 1,2,4-trimethylbenzene being the top species with contributions of 27.5%. Instead, ethylbenzene, m/p-xylen,e and o-xylene were the major VOCs species in air-conditional surface coating, with a combined contribution of 70.5% in the total, which were much lower in the auto-coating sector. These discrepancies reflected that different raw materials in paints, thinners, and adhesives were employed in the industry coating sectors. To further understand the local source profile for auto coating, results in this study was compared with similar research in other regions, as shown in Figure 7.
The main species of VOCs differed remarkably between gravure printing and offset printing. For example, alkanes, especially heavy compounds (more than C7), namely methylcyclohexane, 2-methylheptane, 3-methylheptane, and octane, exhibited high loadings in the source profile of offset printing, which accounted for 9.4%, 13.0%, 8.9%, and 22.3% of the total mass, respectively. In comparison, ethyl acetate and isopropanol were the highest contributing species in gravure printing, accounting for 56.4% and 18.9% of the total VOCs. Since emissions from printing factories are mainly from ink evaporation, this observation reflected the fact that isopropanol was used solvent for thinners in the gravure printing process. This finding was in agreement with the research by Zheng et al. (2013) [9].
All the profiles presented in the literature agree that aromatics were consistently the largest VOCs group in the automobile coating industry, but the proportions of individual compounds were different. Therefore, to better understand the local emission characteristics, major aromatic VOCs and their contributions to the total emissions were compared and are illustrated in Figure 7.
Figure 7 compared the main aromatics species measured in Wuhan with those reported in Beijing [14], the PRD region [9,28], and Shanghai [29]. The auto coating source profile witnessed the significant improvement of raw materials used in the paint coating practices. Toluene, ethylbenzene, m/p-xylene, and o-xylene were consistently the major constituents detected in studies before 2014. However, these species showed an obvious decrease, while the percentage of 1,2,4-trimethylbenzene increased significantly. In our study, the coating profile for Wuhan had considerable amounts of 1,2,4-trimethylbenzene (27.5%), 1,2,3-trimethylbenzene (8.3%), and p-diethybenzene (7.0%), which were negligible in previous studies. Similar results could be found in the PRD region in 2017, where 1,2,4-trimethylbenzene was the second-largest VOC species in the auto profile. The decreasing trend of toluene and C8 aromatics, whereas the gradually increasing of 1,2,4-trimethylbenzene may be a result of different paints and solvent formulations and standards promulgated by the local governments. Meanwhile, these changes indicated that VOCs emissions source profiles need to be updated and localized.

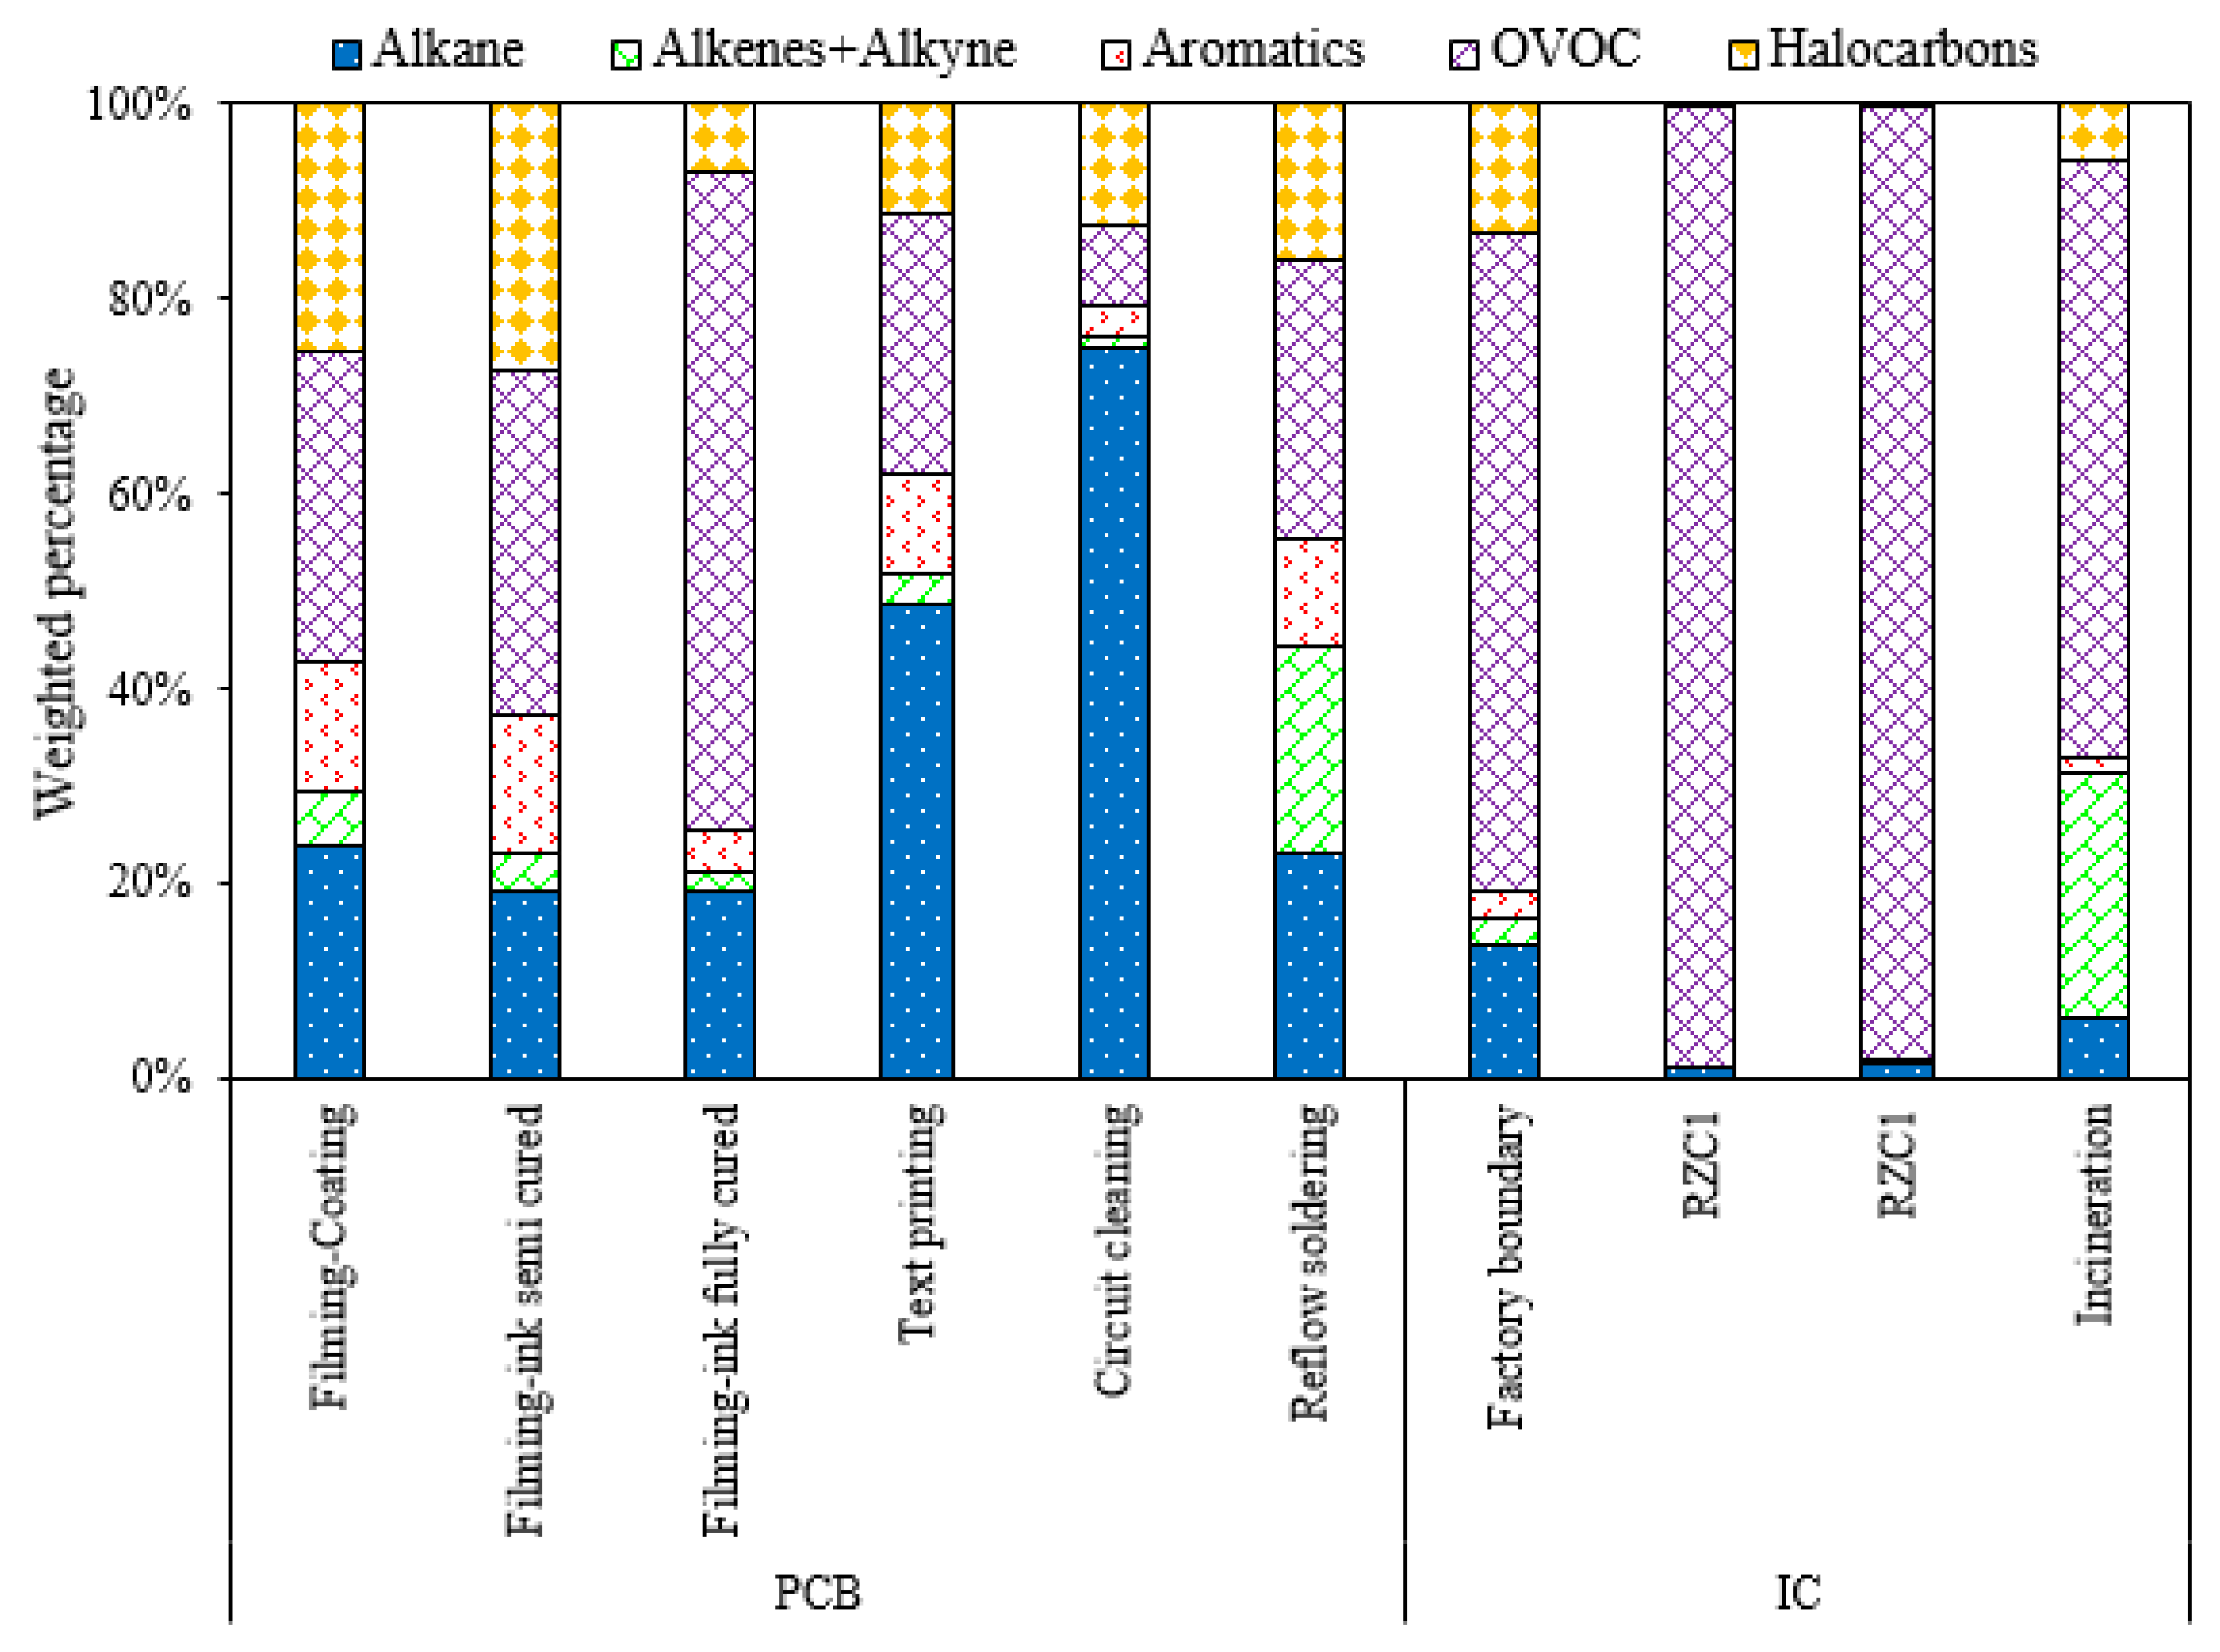
3.3. Emissions from Electronics Manufacturing Industries

The electronics industry, emitting 437,300 tons VOCs in 2010, has become an important source of VOCs in China [30]. In addition, VOCs emitted by the electronics industry present a severe hazard to both the environment and human health [31]. However, there has been relatively little empirical research devoted to investigating the chemical compositions of VOCs emitted from the electronics manufacturing process. This article provides a detailed review of VOCs that are emitted from different processes in the electronics industry. To be specific, six samples covered the main process units involved in VOCs emissions were taken in a local printed circuit boards (PCB) manufacturing enterprise. Meanwhile, three samples were collected in a semiconductor manufacturing factory where integrated circuits (IC) were the main products, and one sample of ambient air around the factory boundary was also collected as a background sample.
The process flow charts of the PCB and IC manufacturing are shown in Figure 8 and Figure 9, and the results of VOCs emissions are illustrated in Figure 10. VOCs emissions from PCB manufacturing mainly produced in the process of Filming (inner loop formation), liquid photoimageable solder mask (LPSM), test printing, and weld coating, while the main emission section in the IC industry was the lithography process due to the use of photoresist and organic solvent [31].
The results indicated that all these electronics manufacturing industries give middle or low emissions, with total VOCs concentration less than 20 mg/m3 at each exhaust pipe, probably due to the VOCs released from this industry usually being at low concentrations but with a high flow rate. However, since the absolute value of VOC emissions may be affected by the sampling conditions, the chemical structure and the major individual species were studied to characterize the emission source, as shown in Figure 10 and Table 3.
There was a large difference in VOCs composition among the different sectors in PCB manufacturing, while a similar composition of VOC emissions was observed for four units in IC industry. In case of the coating process in the filming sector of PCB manufacturing, OVOCs and halocarbons dominated the chemical structure, with acetone being the largest contributing species (13.3%), followed by ethyl acetate (12.8%) and dichloromethane (9.3%), as shown in Table 3. The composition of VOCs from the ink semi-cured process in the filming process was similar to that of coating units, and acetone was consistently the most abundant species (28.5%), whereas 1,2-dichloroethane was the second largest contributor, accounting for 11.7% to the total mass concentration. OVOCs emissions were much more significant form ink fully-cured process than that in ink semi-cured unit because the high loading of acetone in this section, which contributed 62.4% of the total emissions. Variations can be observed among the composition of VOCs from text printing, circuit cleaning, and the filming process. For example, the alkanes’ contribution was higher in the VOC emissions from text printing and circuit cleaning. Iso-pentane was one of the major species emitted from text printing sector except for acetone, 7.0% of the total, and may be used as a solvent in the printing process. I-Pentane and cyclohexane were the two largest contributing species in circuit cleaning, accounting for 17.0% and 12.0%, respectively. For reflow soldering, the most important species were acetone (23.2%), acetylene (17.1%), and propane (6.3%), and the light hydrocarbons were mainly attributable to the high temperature and combustion process.
In terms of IC manufacturing, OVOCs provided the largest contribution to VOCs emitted from factory boundary and exhaust funnels after treating by rotary zeolite concentrating-incinerating technology, accounting for 61.6–98.5% of the total mass. The most important OVOCs species were isopropanol (56.4–98.3%) and acetone (30.8%), while the others accounted for less than 20% of the total measured VOCs.

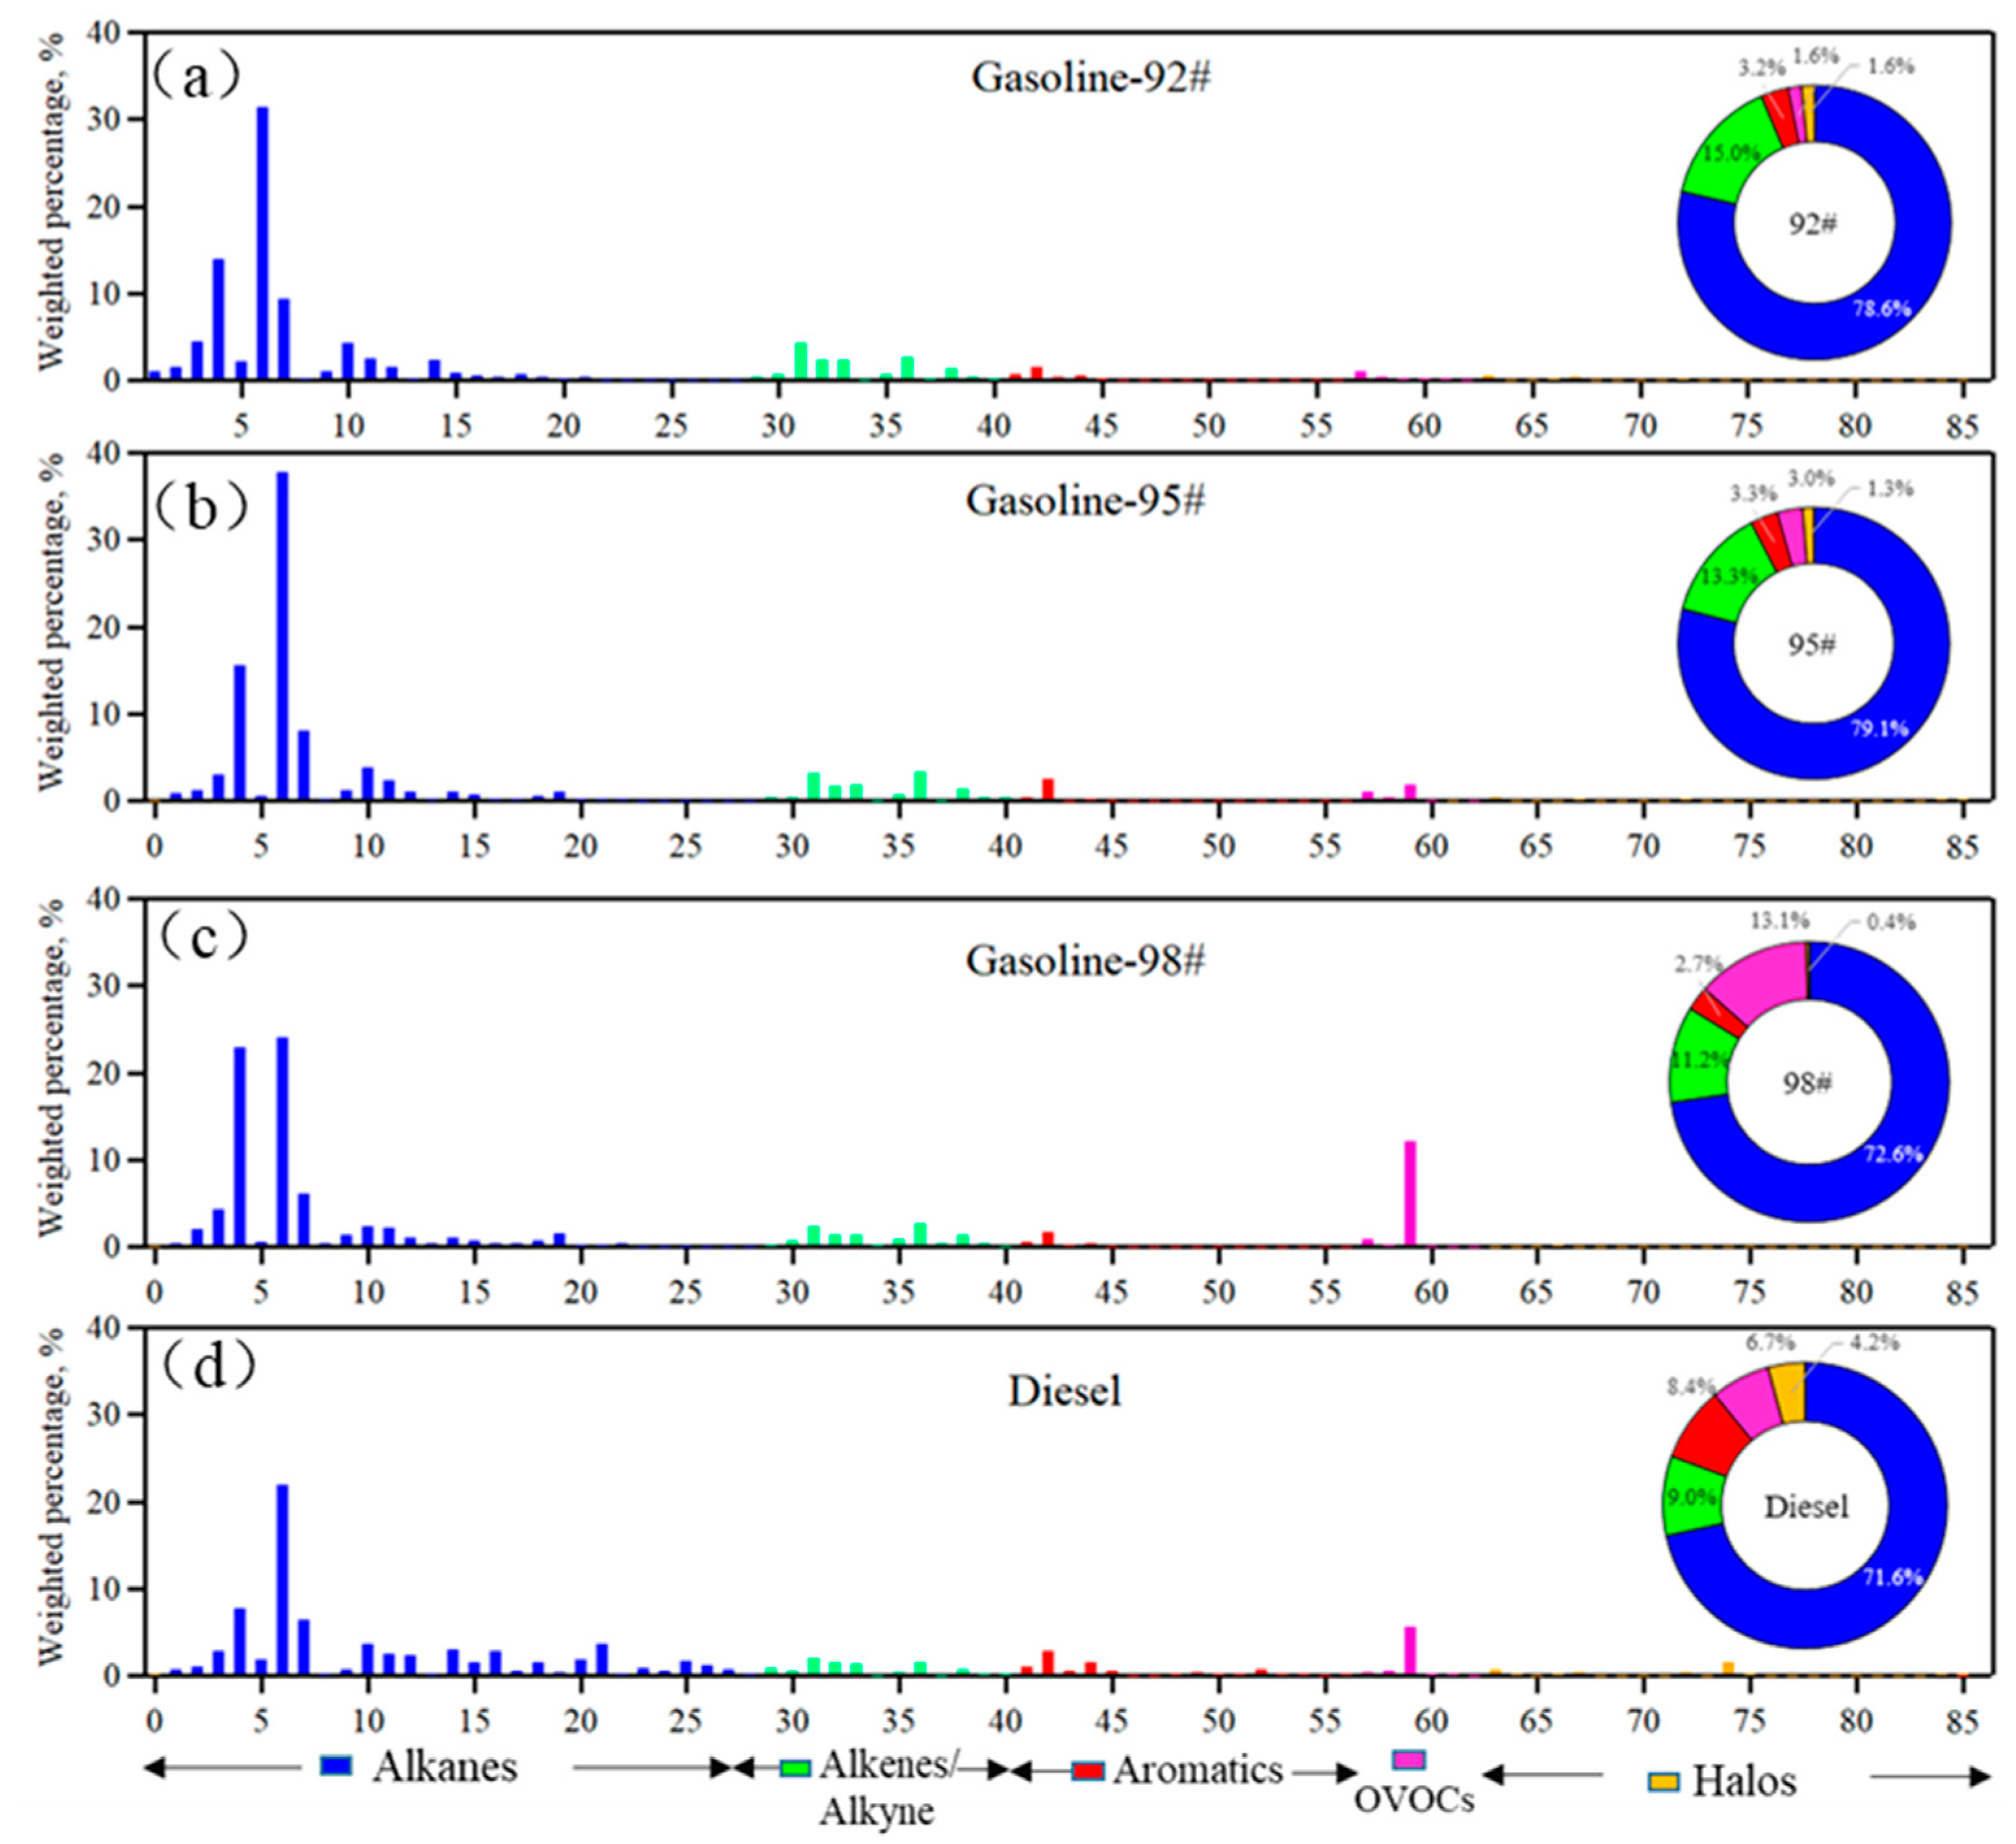
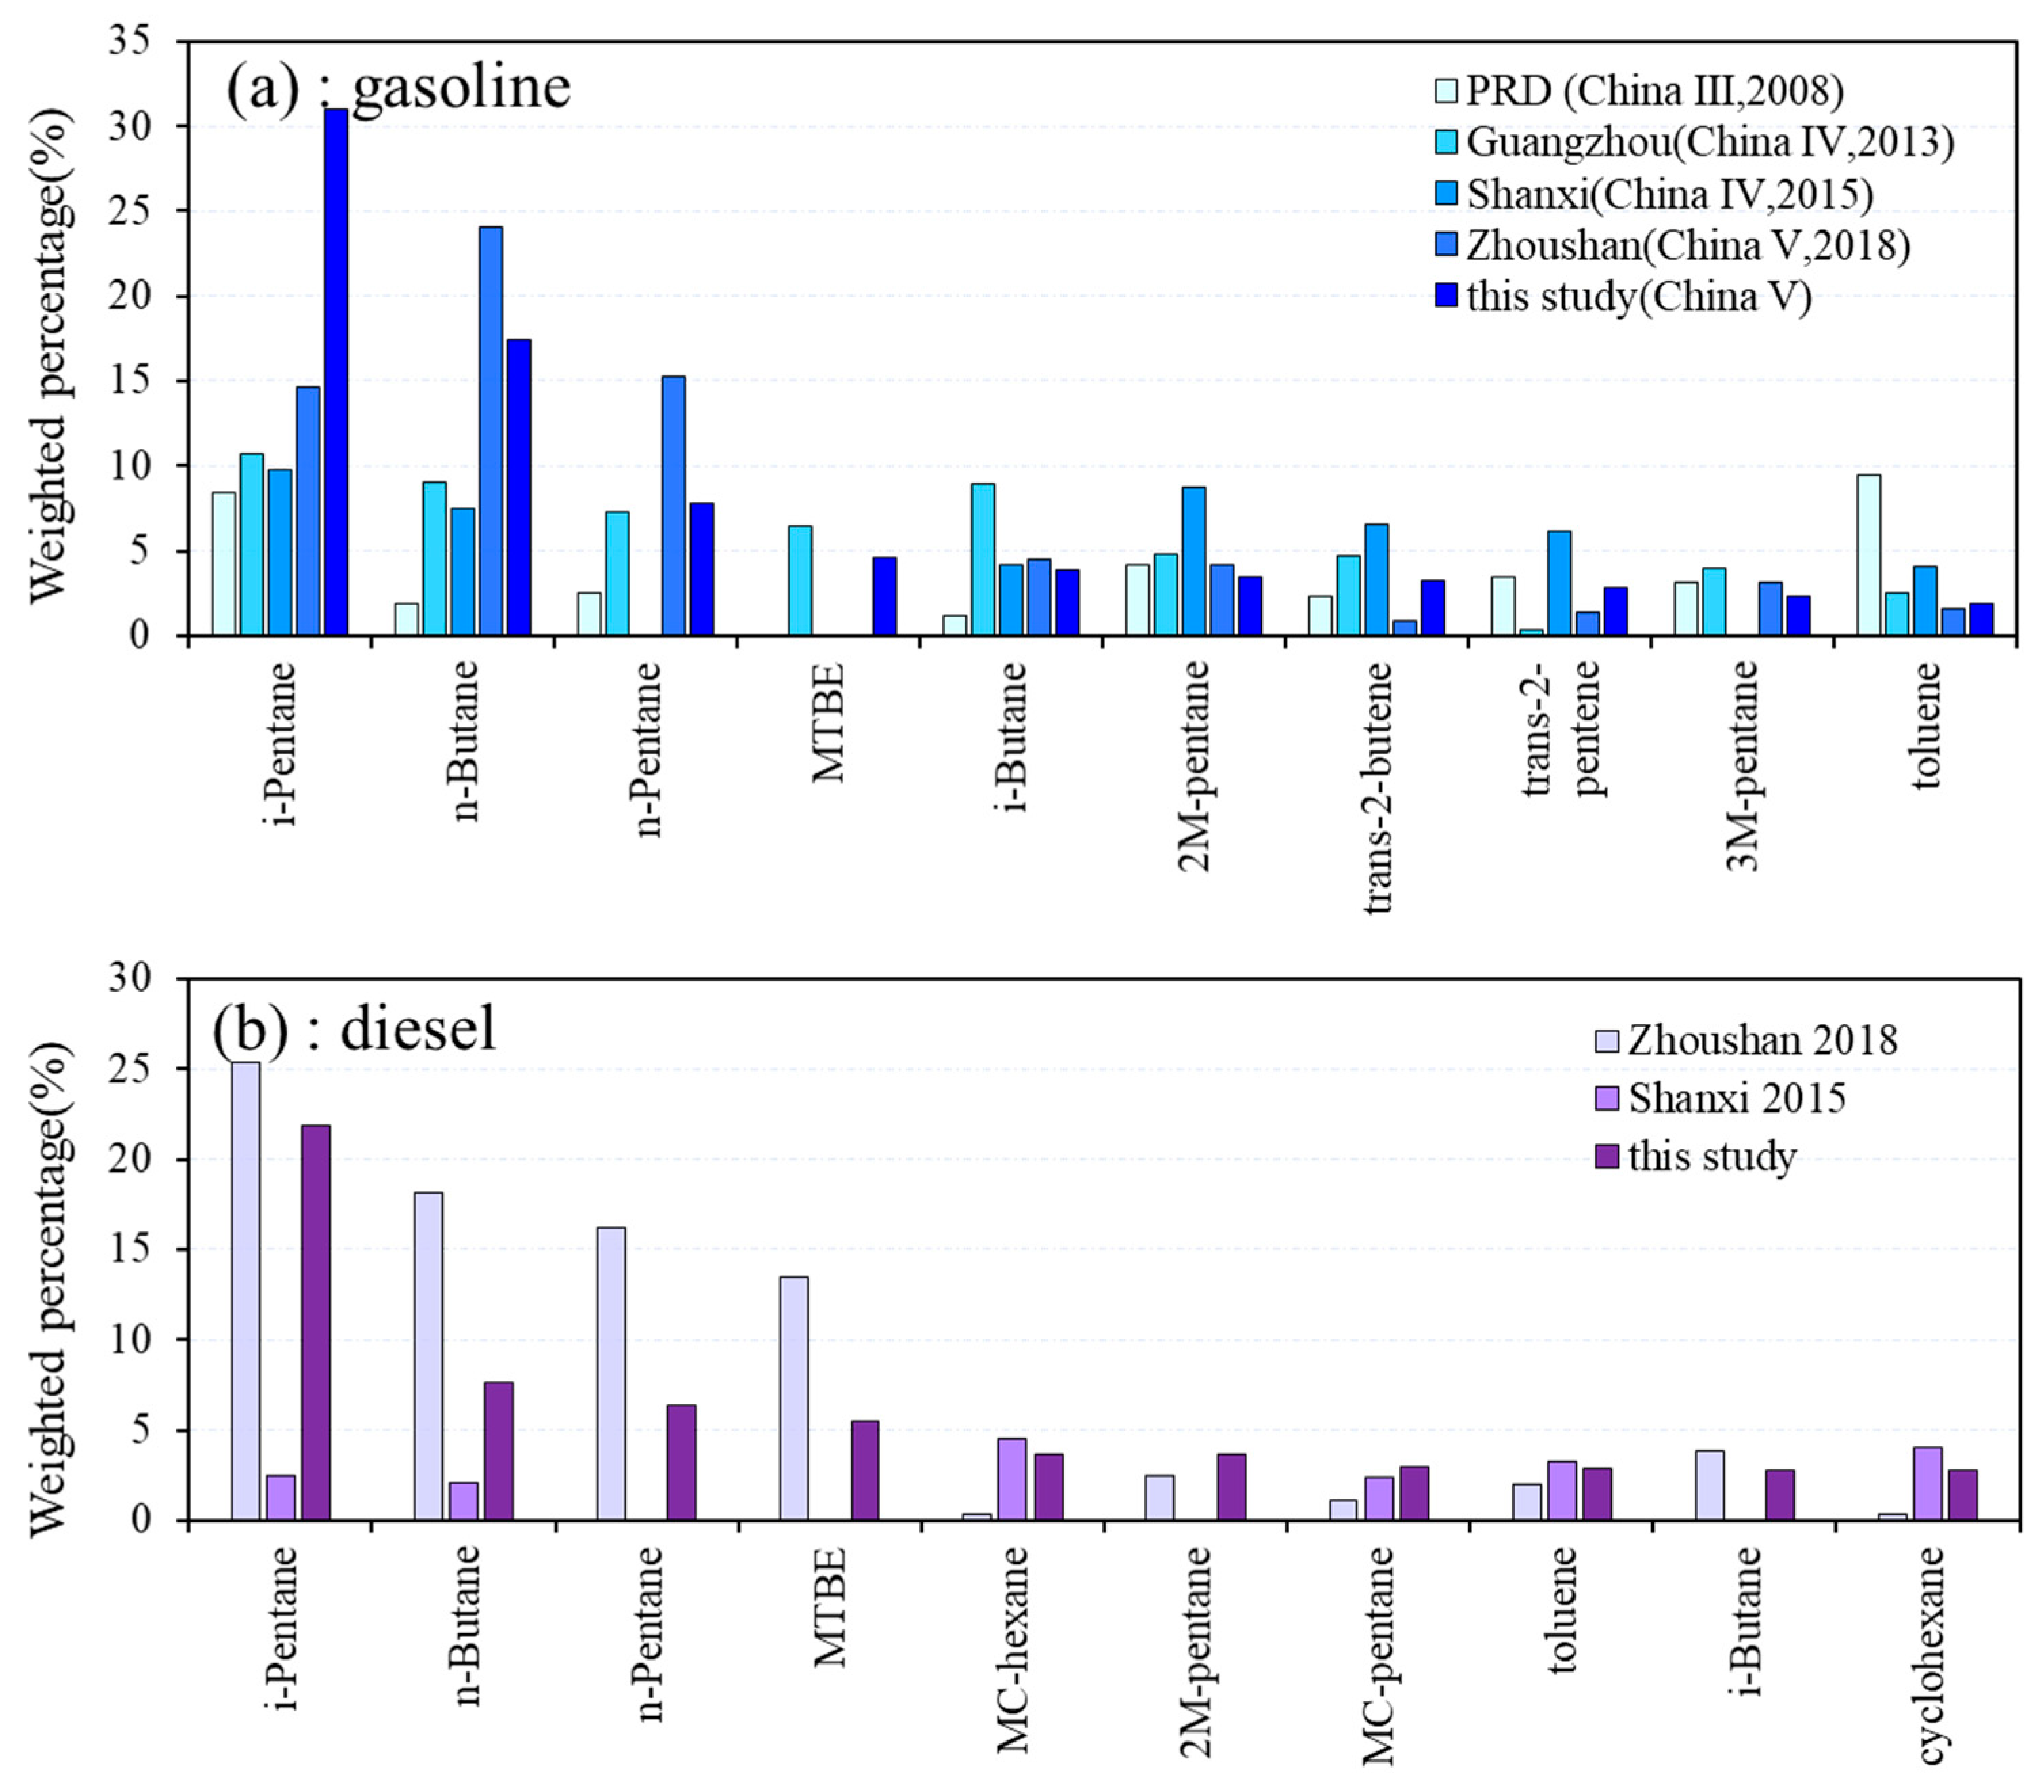
3.4. Gas Station Emissions

Gasoline evaporation that occurs during refueling operations was thought to be the main pathway of evaporative loss in China, while the other two pathways were headspace displacement from storage tank and spillage/leakage in the course of loading and transportation [32]. Gasoline vapors emitted when refueling cars in gas stations were measured in this study, and the results of group weight percentages and individual chemical compositions of VOCs from gasoline and diesel evaporation are illustrated in Figure 11.
It can be seen that chemical structures and composition profiles of VOCs emissions from gasoline 92# and 95# were almost identical. Alkanes were the dominant VOC group, with i-pentane being the most abundant species (31.4–37.7%), followed by n-butane and n-pentane. Aromatics accounted for a small part (1.6–3.0%) in the vapor of gasoline 92# and 95#. This founding was similar to the research by Zhang 2013, who reported that aromatics were the main components in fuel [32] and took up high proportions in gasoline and diesel vehicle exhausts [33] but little in headspace vapors and refueling emissions for their relative low vapor pressure [32,34]. VOC emissions from gasoline 98# had slightly higher levels of n-butane and relatively lower loadings of i-pentane. However, the fractions of MTBE in vapor of gasoline 98# was distinctly higher than that in gasoline 92# and 95#, which may be attributed to differences in the oil refinery process. VOC composition from diesel fuel evaporation was quite different from that of gasoline. Diesel fuel had a higher abundance of heavier alkanes, especially C6-C8 species such as methylcyclohexane and n-heptane. This founding was a little different from the observations in Liu et al. (2008) which reported that heavier alkanes were consistently more abundant in diesel vapor, but the characteristic compounds were major >C8 species, namely, n-nonane, n-decane, and n-undecane. This discrepancy reflected that the composition of VOCs may change through oil-upgrading campaigns.
Quality of the fuel to a large extent influences the engine efficiency and exhaust emissions. Therefore, upgrading fuel quality to lower vehicle emissions is crucial to improve air quality in China. Since 2000, the Chinese government has made a great effort to improve the oil quality and organized 5 times oil upgrading campaigns to promote the emission legislation vary from China I to China V. Each campaign was accompanied with more strict emission standards on sulfur and olefins in terms of gasoline and higher requirement on octane number of diesel. Wuhan completed the oil upgrading from China IV to China V during this study. As noted above, source profiles associated with gasoline evaporation may vary from the oil quality and emission standards, and results in the present study were compared to species profiles in other regions and in different stage of emission legislations with the purpose to obtain an in-depth understanding of VOCs emissions from gasoline evaporation.
Figure 12 shows the top 10 species in gasoline and diesel vapor measured in this paper and their contributions in previous studies. In terms of gasoline, it can be found that all these profiles show the same three major compounds: n-butane, i-pentane, and n-pentane. However, fractions of these species were much more enriched in the gasoline vapor in accordance with China V (this study and Wang 2018) [35]. Instead, the percentage of toluene has been reduced gradually, from 9.5 wt % in PRD (China III) to 1.9 wt % in this study (China V). Source profiles data of diesel evaporation within last 10 years were hard to obtain, and only two sets of composition data were available and illustrated in Figure 11b [34,35]. In the case of diesel refueling emissions, the percentage of C4–C5 alkanes from our study were much higher than that reported by Wang et al. (2018) measured in Zhoushan City, and He et al. (2015) investigated in Shanxi Province. It should note that n-undecane was the most abundant species in the source profile of diesel vapor measured by He et al., accounting for 49.2% of the total mass. The great difference may attributed to the high uncertainty in the data due to the limited number of samples tested. Therefore, more work is needed in order to generate local source profiles that are more representative.

4. Conclusions

The chemical composition of major VOCs anthropogenic sources in Wuhan were experimentally measured with a focus on industrial processes. The local VOC source profiles of the petrochemical industry, surface coating, printing, and gasoline evaporation were obtained in the present study. VOCs emitted from PCB and integrated chip (IC) were also investigated but not averaged into an integrated source profile due to the limit of samples and the great difference observed in each process unit.
Emission compositions from the petrochemical industry were much more complex than those from other factories. Alkanes were the dominant VOC group in all petrochemical units, accounting for 41.1–97.4% of the total VOCs mass concentration with an average fraction of 69.6%, followed by aromatics (14.1%) and alkenes (9.9%). Major VOC species for the petrochemical industry measured in this study were similar to the profile reported by Liu et al. (2008), in that n-hexane was consistently the most abundant species in both cases. However, levels of individual species varied across studies.
The source profile patterns were found to be similar from auto coating and equipment coating, with aromatics being the most abundant group. However, the characteristic species varied among processes due to the difference in raw materials and solvents used. C9 aromatics contributed a large part in the auto industry, with 1,2,4-trimethylbenzene being the top species with contributions of 27.5%. Instead, ethylbenzene, m/p-xylene, and o-xylene were the major VOCs species in air-conditional surface coating. OVOCs (mainly ethyl acetate and isopropanol) dominated the profile of gravure printing, while heavy compounds (more than C7), namely methylcyclohexane, 2-methylheptane, 3-methylheptane, and octane, were the most abundant compounds emitted from offset printing.
Acetone was the largest contributor and the most frequently monitored species in PCB manufacturing, while VOC species emitted from IC were characterized as high content of isopropanol (56.4–98.3%) and acetone (30.8%). In terms of gasoline evaporation, composition profiles of VOCs emissions from gasoline 92# and 95# were almost identical. Alkanes were the dominant VOC group, with i-pentane being the most abundant species (31.4–37.7%), followed by n-butane and n-pentane. VOCs emissions from gasoline 98# had slightly higher levels of n-butane and relatively lower loadings of i-pentane. However, the fractions of MTBE in vapor of gasoline 98# was distinctly higher than that in gasoline 92# and 95#. Diesel fuel had a higher abundance of heavier alkanes, especially C6-C8 species such as methylcyclohexane and n-heptane. Compared to similar studies in different stages of emission legislation, fractions of C4-C5 alkanes were much more enriched in the gasoline vapor in accordance with China V, while percentage of toluene has been reduced gradually, from 9.5 wt % in PRD (China III) to 1.9 wt % in this study (China V).

Supplementary Materials

Supplementary data to this article can be found online at https://www.mdpi.com/2073-4433/9/8/297/s1.

Author Contributions

The work has been performed in collaboration among all the authors. L.S. designed the experiment, analyzed the data, and wrote the manuscript. Z.W. and S.L. (Sihua Lu) contributed to research design and paper reviewing and revising. S.L. (Shengwen Liang) took part in the source sampling and chemical analysis by GC–FID/MS. P.X., W.C. and M.W. worked on data analysis and the interpretation and discussion of the results. All authors agreed to submit this paper.

Funding

This research was funded by the National Key R&D Program of China (2017YFC0212600) and The APC was funded by the special environmental research project of Hubei (project number 2014HB06).

Acknowledgments

We are grateful for financial support from the National Key R&D Program of China (2017YFC0212600) and the special environmental research project of Hubei (project number 2014HB06). And we would like to show deep thankfulness to the editors who have contributed valuable comments to improve the quality of the paper.

Conflicts of Interest

All authors declare that there is no conflict of interest.

References

  1. Atkinson, R. Atmospheric chemistry of VOCs and NOx. Atmos. Environ. 2000, 34, 2063–2101. [Google Scholar] [CrossRef]
  2. Kroll, J.H.; Ng, N.L.; Murphy, S.M.; Flagan, R.C.; Seinfeld, J.H. Secondary Organic Aerosol Formation from Isoprene Photooxidation. Environ. Sci. Technol. 2006, 40, 1869–1877. [Google Scholar] [CrossRef] [PubMed] [Green Version]
  3. An, T.; Huang, Y.; Li, G.; He, Z.; Chen, J.; Zhang, C. Pollution profiles and health risk assessment of VOCs emitted during e-waste dismantling processes associated with different dismantling methods. Environ. Int. 2014, 73, 186–194. [Google Scholar] [CrossRef] [PubMed] [Green Version]
  4. Wu, X.; Lu, Y.; Zhou, S.; Chen, L.; Xu, B. Impact of climate change on human infectious diseases: Empirical evidence and human adaptation. Environ. Int. 2016, 86, 14–23. [Google Scholar] [CrossRef] [PubMed]
  5. Guo, S.; Hu, M.; Zamora, M.L.; Peng, J.; Shang, D.; Zheng, J.; Du, Z.; Wu, Z.; Shao, M.; Zeng, L.; et al. Elucidating severe urban haze formation in China. Proc. Natl. Acad. Sci. USA 2014, 111, 17373–17378. [Google Scholar] [CrossRef] [PubMed] [Green Version]
  6. Huang, R.J.; Zhang, Y.; Bozzetti, C.; Ho, K.F.; Cao, J.J.; Han, Y.; Daellenbach, K.R.; Slowik, J.G.; Platt, S.M.; Canonaco, F.; et al. High secondary aerosol contribution to particulate pollution during haze events in China. Nature 2014, 514, 218–222. [Google Scholar] [CrossRef] [PubMed] [Green Version]
  7. Mo, Z.; Shao, M.; Lu, S.; Qu, H.; Zhou, M.; Sun, J.; Gou, B. Process-specific emission characteristics of volatile organic compounds (VOCs) from petrochemical facilities in the Yangtze River Delta, China. Sci. Total Environ. 2015, 533, 422–431. [Google Scholar] [CrossRef] [PubMed]
  8. Shi, J.; Deng, H.; Bai, Z.; Kong, S.; Wang, X.; Hao, J.; Han, X.; Ning, P. Emission and profile characteristic of volatile organic compounds emitted from coke production, iron smelt, heating station and power plant in Liaoning Province, China. Sci. Total Environ. 2015, 515, 101–108. [Google Scholar] [CrossRef] [PubMed]
  9. Zheng, J.; Yu, Y.; Mo, Z.; Zhang, Z.; Wang, X.; Yin, S.; Peng, K.; Yang, Y.; Feng, X.; Cai, H. Industrial sector-based volatile organic compound (VOC) source profiles measured in manufacturing facilities in the Pearl River Delta, China. Sci. Total Environ. 2013, 456–457, 127–136. [Google Scholar] [CrossRef] [PubMed]
  10. Yao, Z.; Zhang, Y.; Shen, X.; Wang, X.; Wu, Y.; He, K. Impacts of temporary traffic control measures on vehicular emissions during the Asian Games in Guangzhou, China. J. Air Waste Manag. Assoc. 2012, 63, 11–19. [Google Scholar] [CrossRef] [Green Version]
  11. Wang, H.-L.; Jing, S.-A.; Lou, S.-R.; Hu, Q.-Y.; Li, L.; Tao, S.-K.; Huang, C.; Qiao, L.-P.; Chen, C.-H. Volatile organic compounds (VOCs) source profiles of on-road vehicle emissions in China. Sci. Total Environ. 2017, 607–608, 253–261. [Google Scholar]
  12. Na, K.; Kim, Y.P.; Moon, I.; Moon, K.C. Chemical composition of major VOC emission sources in the Seoul atmosphere. Chemosphere 2004, 55, 585–594. [Google Scholar] [CrossRef] [PubMed]
  13. Simon, H.; Beck, L.; Bhave, P.V.; Divita, F.; Hsu, Y.; Luecken, D.; Mobley, J.D.; Pouliot, G.A.; Reff, A.; Sarwar, G.; et al. The development and uses of EPA’s SPECIATE database. Atmos. Pollut. Res. 2010, 1, 196–206. [Google Scholar] [CrossRef]
  14. Yuan, B.; Shao, M.; Lu, S.; Wang, B. Source profiles of volatile organic compounds associated with solvent use in Beijing, China. Atmos. Environ. 2010, 44, 1919–1926. [Google Scholar] [CrossRef]
  15. Wei, W.; Wang, S.; Chatani, S.; Klimont, Z.; Cofala, J.; Hao, J. Emission and speciation of non-methane volatile organic compounds from anthropogenic sources in China. Atmos. Environ. 2008, 42, 4976–4988. [Google Scholar] [CrossRef]
  16. Huang, C.; Chen, C.H.; Li, L.; Cheng, Z.; Wang, H.L.; Huang, H.Y.; Streets, D.G.; Wang, Y.J.; Zhang, G.F.; Chen, Y.R. Emission inventory of anthropogenic air pollutants and VOC species in the Yangtze River Delta region, China. Atmos. Chem. Phys. 2011, 11, 4105–4120. [Google Scholar] [CrossRef] [Green Version]
  17. Ou, J.; Zheng, J.; Li, R.; Huang, X.; Zhong, Z.; Zhong, L.; Lin, H. Speciated OVOC and VOC emission inventories and their implications for reactivity-based ozone control strategy in the Pearl River Delta region, China. Sci. Total Environ. 2015, 530–531, 393–402. [Google Scholar] [CrossRef] [PubMed]
  18. Lyu, X.P.; Chen, N.; Guo, H.; Zhang, W.H.; Wang, N.; Wang, Y.; Liu, M. Ambient volatile organic compounds and their effect on ozone production in Wuhan, central China. Sci. Total Environ. 2016, 541, 200–209. [Google Scholar] [CrossRef] [PubMed]
  19. Kalabokas, P.D.; Hatzianestis, J.; Bartzis, J.G.; Papagiannakopoulos, P. Atmospheric concentrations of saturated and aromatic hydrocarbons around a Greek oil refinery. Atmos. Environ. 2001, 35, 2545–2555. [Google Scholar] [CrossRef]
  20. Chen, C.-L.; Fang, H.Y.; Shu, C.-M. Source Location and Characterization of Volatile Organic Compound Emissions at a Petrochemical Plant in Kaohsiung, Taiwan. J. Air Waste Manag. Assoc. 2012, 55, 1487–1497. [Google Scholar] [CrossRef]
  21. Yen, C.H.; Horng, J.J. Volatile organic compounds (VOCs) emission characteristics and control strategies for a petrochemical industrial area in middle Taiwan. J. Environ. Sci. Health. Part A Toxic/Hazard. Subst. Environ. Eng. 2009, 44, 1424–1429. [Google Scholar] [CrossRef] [PubMed]
  22. Liu, Y.; Shao, M.; Zhang, J.; Fu, L.; Lu, S. Distributions and source apportionment of ambient volatile organic compounds in Beijing city, China. J. Environ. Sci. Health. Part A Toxic/Hazard. Subst. Environ. Eng. 2005, 40, 1843–1860. [Google Scholar] [CrossRef] [PubMed]
  23. Cetin, E.; Odabasi, M.; Seyfioglu, R. Ambient volatile organic compound (VOC) concentrations around a petrochemical complex and a petroleum refinery. Sci. Total Environ. 2003, 312, 103–112. [Google Scholar] [CrossRef]
  24. Lin, T.-Y.; Sree, U.; Tseng, S.-H.; Chiu, K.H.; Wu, C.-H.; Lo, J.-G. Volatile organic compound concentrations in ambient air of Kaohsiung petroleum refinery in Taiwan. Atmos. Environ. 2004, 38, 4111–4122. [Google Scholar] [CrossRef]
  25. Ras, M.R.; Marce, R.M.; Borrull, F. Characterization of ozone precursor volatile organic compounds in urban atmospheres and around the petrochemical industry in the Tarragona region. Sci. Total Environ. 2009, 407, 4312–4319. [Google Scholar] [CrossRef] [PubMed]
  26. Liu, Y.; Shao, M.; Fu, L.; Lu, S.; Zeng, L.; Tang, D. Source profiles of volatile organic compounds (VOCs) measured in China: Part I. Atmos. Environ. 2008, 42, 6247–6260. [Google Scholar] [CrossRef]
  27. Wang, H.; Nie, L.; Li, J.; Wang, Y.; Wang, G.; Wang, J.; Hao, Z. Characterization and assessment of volatile organic compounds (VOCs) emissions from typical industries. Chin. Sci. Bull. 2013, 58, 724–730. [Google Scholar] [CrossRef] [Green Version]
  28. Zhong, Z.; Sha, Q.; Zheng, J.; Yuan, Z.; Gao, Z.; Ou, J.; Zheng, Z.; Li, C.; Huang, Z. Sector-based VOCs emission factors and source profiles for the surface coating industry in the Pearl River Delta region of China. Sci. Total Environ. 2017, 583, 19–28. [Google Scholar] [CrossRef] [PubMed]
  29. Wang, H. Source Profiles and Chemical Reactivity of Volatile Organic Compounds from Solvent Use in Shanghai, China. Aerosol Air Qual. Res. 2014, 14, 301–310. [Google Scholar] [CrossRef]
  30. Qiu, K.; Yang, L.; Lin, J.; Wang, P.; Yang, Y.; Ye, D.; Wang, L. Historical industrial emissions of non-methane volatile organic compounds in China for the period of 1980–2010. Atmos. Environ. 2014, 86, 102–112. [Google Scholar] [CrossRef]
  31. Babar, Z.B.; Shareefdeen, Z. Management and control of air emissions from electronic industries. Clean Technol. Environ. Policy 2013, 16, 69–77. [Google Scholar] [CrossRef]
  32. Zhang, Y.; Wang, X.; Zhang, Z.; Lü, S.; Shao, M.; Lee, F.S.C.; Yu, J. Species profiles and normalized reactivity of volatile organic compounds from gasoline evaporation in China. Atmos. Environ. 2013, 79, 110–118. [Google Scholar] [CrossRef] [Green Version]
  33. Guo, H.; Zou, S.C.; Tsai, W.Y.; Chan, L.Y.; Blake, D.R. Emission characteristics of nonmethane hydrocarbons from private cars and taxis at different driving speeds in Hong Kong. Atmos. Environ. 2011, 45, 2711–2721. [Google Scholar] [CrossRef]
  34. He, Q.; Yan, Y.; Li, H.; Zhang, Y.; Chen, L.; Wang, Y. Characteristics and reactivity of volatile organic compounds from non-coal emission sources in China. Atmos. Environ. 2015, 115, 153–162. [Google Scholar] [CrossRef]
  35. Wang, Q.; Li, S.; Dong, M.; Li, W.; Gao, X.; Ye, R.; Zhang, D. VOCs emission characteristics and priority control analysis based on VOCs emission inventories and ozone formation potentials in Zhoushan. Atmos. Environ. 2018, 182, 234–241. [Google Scholar] [CrossRef]
Figure 1. Location of the nine sampling sites in the petroleum plants.
Atmosphere 09 00297 g001
Figure 2. Overall chemical group patterns of VOC emissions from each petroleum unit. (Note: OR1: CDU&VDU; OR2: reforming hydrogenation; OR3: catalytic cracking; OR4: catalytic hydrogenation with wax oil; OR5: catalytic hydrogenation with gasoline and diesel; OR6: delayed coking; ST1: olefins tank; ST2: gasoline tank; WT: wastewater treatment).
Atmosphere 09 00297 g002
Figure 3. VOCs source profile for petrochemical industry.
Atmosphere 09 00297 g003
Figure 4. Comparison of major VOC species from the petrochemical industry in different regions.
Atmosphere 09 00297 g004
Figure 5. Overall VOC chemical group patterns of four major sectors in auto manufacturing industry. (Note: EC1–EC3: electro-coating; S1–S3: sealing process; TC1–TC6: top coating).
Atmosphere 09 00297 g005
Figure 6. VOCs source profile for surface coating and printing (a) auto manufacturing (b) air-conditional industry (c) gravure printing (d) offset printing.
Atmosphere 09 00297 g006
Figure 7. Comparison of major aromatics from auto coating in different regions.
Atmosphere 09 00297 g007
Figure 8. Process flow chart of a typical printed circuit board (PCB) manufacturing enterprise. (Note: CAM: Computer aided manufacturing; LPSM: liquid photoimageable solder mask).
Atmosphere 09 00297 g008
Figure 9. Process flow chart of a typical integrated circuits manufacturing enterprise. (Note: CVD: chemical vapor deposition, Cu-BEol: copper wiring).
Atmosphere 09 00297 g009
Figure 10. Overall VOC chemical group patterns of PCB and IC manufacturing (Note: RZC: exhaust was treated by rotary zeolite concentrator).
Atmosphere 09 00297 g010
Figure 11. VOC source profile for gasoline and diesel; (a) gasoline-92#; (b) gasoline-95#; (c) gasoline-98#; (d) diesel-0#.
Atmosphere 09 00297 g011
Figure 12. Top 10 VOCs species in gasoline and diesel vapor and their contributions in other studies in different regions and studying periods, (a) gasoline; (b) diesel.
Atmosphere 09 00297 g012
Table 1. Volatile organic compound (VOC) species measured in emission samples.
No.SpeciesNo.SpeciesNo.Species
Alkanes(28)31trans-2-Butene61Ethyl acetate
1Ethane321-Butene62i-Propanol
2Propane33cis-2-Butene Halocarbons(24)
3i-Butane341,3-Butadiene63Freon11(CFCl3)
4n-Butane351-Pentene64Freon12(CF2Cl2)
5Cyclopentane36trans-2-Pentene65Freon114(C2F4Cl2)
6i-pentane37Isoprene66Chloromethane
7n-Pentane38cis-2-Pentene67Dichloromethane
82,2-Dimethylbutane391-Hexene68Chloroform
92,3-Dimethylbutane40Acetylene69Carbontetrachloroide
102-Methylpentane Aromatics(16)70Chloroethane
113-Methylpentane41Benzene711,1-Dichloroethane
12n-Hexane42Toluene721,2-Dichloroethane
132,4-Dimethylpentane43Ethylbenzene731,1,1-Trichloroethane
14Methylcyclopentane44m/p-Xylene741,1,2-Trichloroethane
152-Methylhexane45o-Xylene751,2-Dichloropropane
16Cyclohexane46Styrene761,1-Dichloroethylene
172,3-Dimethylpentane47i-Propylbenzene77Trichloroethylene
183-Methylhexane48n-Propylbenzene78Tetrachloroethylene
192,2,4-Trimethylpentane493-Ethyltoluene79trans-1,3-Dichloropropene
20n-Heptane504-Ethyltoluene80Bromomethane
21Methylcyclohexane511,3,5-Trimethylbenzene81Bromoform
222,3,4-Trimethylpentane521,2,4-Trimethylbenzene82Bromodichloromethane
232-Methylheptane531,2,3-Trimethylbenzene83Chlorobenzene
243-Methylheptane542-Ethyltoluene841,3-Dichlorobenzene
25Octane551,3-Diethylbenzene851,4-Dichlorobenzene
26n-Nonane561,4-Diethylbenzene861,2-Dichlorobenzene
27n-Decane OVOCs(6)
28n-Undecane57Acrolein
Alkenes(11)/Alkyne(1)58Acetone
29Ethylene59MTBE
30Propylene60Methyl ethyl ketone
Table 2. The top five VOC species and their contributions to total VOC mass concentration measured in each unit.
SpeciesOR1OR2OR3OR4OR5OR6ST1ST2WTWhole
Alkanes
Ethane 6.1%11.5% 3.8%
Propane 13.0% 3.6%
i-Butane 6.2% 2.6%
n-Butane5.3% 7.6% 5.9% 7.0%3.7%
i-Pentane5.6% 10.5%6.0%8.8%7.0% 10.7%6.5%
n-Pentane 9.8% 7.8% 11.0%4.9%
2,3-Dimethylbutane 3.8% 1.2%
n-Hexane9.8%17.5%12.9% 5.3% 28.7%11.0%10.5%
2-Methylpentane 5.3% 9.6% 3.9%
3-Methylpentane4.9%9.5%7.6% 20.0% 6.2%
Methylcyclopentane 7.9%6.6% 12.7%6.5%5.4%
Alkenes
Propylene 13.5%5.5% 21.0% 5.9%
Aromatics
Toluene9.6%5.9% 6.0% 3.6%
Ethylbenzene 10.6% 9.1% 3.3%
m/p-Xylene 8.6% 5.4% 2.9%
OVOCs
MTBE 19.0% 3.0%
Table 3. The top three VOC species and their percentage in total VOC mass concentration measured in each unit.
Industry SectorTOP 1TOP 2TOP3
PCBspeciesw%speciesw%speciesw%
Filming-CoatingAcetone13.3Ethyl acetate12.8Dichloromethane9.3
Filming-ink semi curedAcetone28.51,2-dichloroethane11.7Dichloromethane6.6
Filming-ink fully curedAcetone62.4Iso-pentane2.3Acrolein1.9
Text printingAcetone15.3Iso-pentane7.0Isopropanol6.4
Circuit cleaningIso-pentane17.0cyclohexane12.02,3-dimethylpentane10.6
Reflow solderingAcetone23.2Acetylene17.1Propane6.3
IC
Factory boundaryIsopropanol56.4Acetone8.2Ethane6.4
RZC1Isopropanol98.3n-Nonane0.3Acetone0.2
RZC1Isopropanol97.6n-Nonane0.8Propene0.4
IncinerationAcetone30.8Isopropanol27.8Ethene14.5

