Article

An Analysis of Precipitation Extremes in the Inner Mongolian Plateau: Spatial-Temporal Patterns, Causes, and Implications

1
Key Laboratory of Geographic Information Science of Ministry of Education, East China Normal University, Shanghai 200241, China
2
School of Geographical Sciences, East China Normal University, Shanghai 200241, China
3
School of Science and the Environment, Manchester Metropolitan University, Manchester M1 5GD, UK
4
Research and Transfer Centre “Sustainability and Climate Change Management”, Hamburg University of Applied Sciences, Ulmenliet 20, D-21033 Hamburg, Germany
5
Institute for Ecological Economics and Management, Ukrainian National Forestry University, Lviv 79057, Ukraine
6
College of Geographical Sciences, Inner Mongolia Normal University, Hohhot 010022, China
7
Key Laboratory of Remote Sensing and Geographic Information System, Inner Mongolia, Hohhot 010022, China
8
International Institute for Applied systems Analysis (IIASA), Schlossplatz 1, Laxenburg A-2361, Austria
*
Authors to whom correspondence should be addressed.
Atmosphere 2018, 9(8), 322; https://doi.org/10.3390/atmos9080322
Submission received: 4 July 2018 / Revised: 3 August 2018 / Accepted: 7 August 2018 / Published: 19 August 2018
(This article belongs to the Section Meteorology)

Abstract

:
To improve how extreme events and climate variations are managed, there is a need to foster a deeper understanding of their interconnections. Consistent with this objective, this paper describes how precipitation extremes change both temporally and spatially in the Inner Mongolian Plateau (IMP), China and explains their causal factors. The paper refers to data collected from 43 meteorological stations in IMP and describes how precipitation extremes formed and how they influence agriculture. Data gathered and presented in this paper may be useful in understanding the extent to which the IMP is being influenced by global environmental change. This study reveals that the eleven precipitation extremes indices, except the number of precipitation days with over 0.5 mm (R0.5), number of heavy precipitation days (R10), and total precipitation in wet days (PRCPTOT), decreased in the IMP between 1959 and 2014, and most of them were non-significant in temporal. But the dry index has a larger magnitude decreasing trend than that of the wet indices, which can indicate that the dry situation was alleviated in IMP during the study interval. This study also indicated that precipitation extremes have strong relationships with elevation, latitude, and longitude. Atmospheric circulation and topography may be further primary reasons which result in the spatial variation characteristics in precipitation extremes over the IMP. Decreases in precipitation extremes, together with human activities such as livestock improvement and ecological restoration programs, has a positive effect in gross output value of agriculture and animal husbandry in the IMP. The results contribute to a deeper insight on the possible impacts of precipitation extremes and support the development of appropriate adaptation and mitigation strategies to cope with climate extremes. This paper further proposes science-based policies for grassland protection, agriculture, and animal husbandry on the national or regional and herdsman scales.

1. Introduction

1.1. Climate Change in China

Influenced by global warming, the frequency and severity of extreme climate events has increased over the past decades [1,2,3]. Frequent occurrences of extreme hydrological and climatic events have a close relationship with the spatial and temporal variations of precipitation, especially extreme precipitation, which have resulted in devastating consequences on societies and their economies [4]. China has seen a ground average temperature increase from 1951 to 2017, exceeding the global increase rate, reaching 0.24 °C/decade. The average precipitation of China was 641.3 mm in 2017, which is 1.8% higher than in previous years [5]. Climate-related disasters, such as droughts and floods, increased not only in frequency, but also in intensity, which had consequences for productivity, and created serious repercussions for the natural environment and infrastructure, resulting in threats to the lives and properties of billions of people, also aggravating poverty. Climate change in China has had serious negative effects on agriculture and has increased the instability of agricultural production. High temperatures and frequent droughts have led to the lower production and quality in prairie [5]. Compared to 1986–2005, by the end to 21st Century, the annual mean surface air temperature in China is projected to increase by 1.3 °C ± 0.7 °C, 2.6 °C ± 0.8 °C, and 5.2 °C ± 1.2 °C under the Representative Concentration Pathway (RCP) scenarios RCP2.6, RCP4.5, and RCP8.5, respectively [6]. This is expected to exacerbate the current problems.

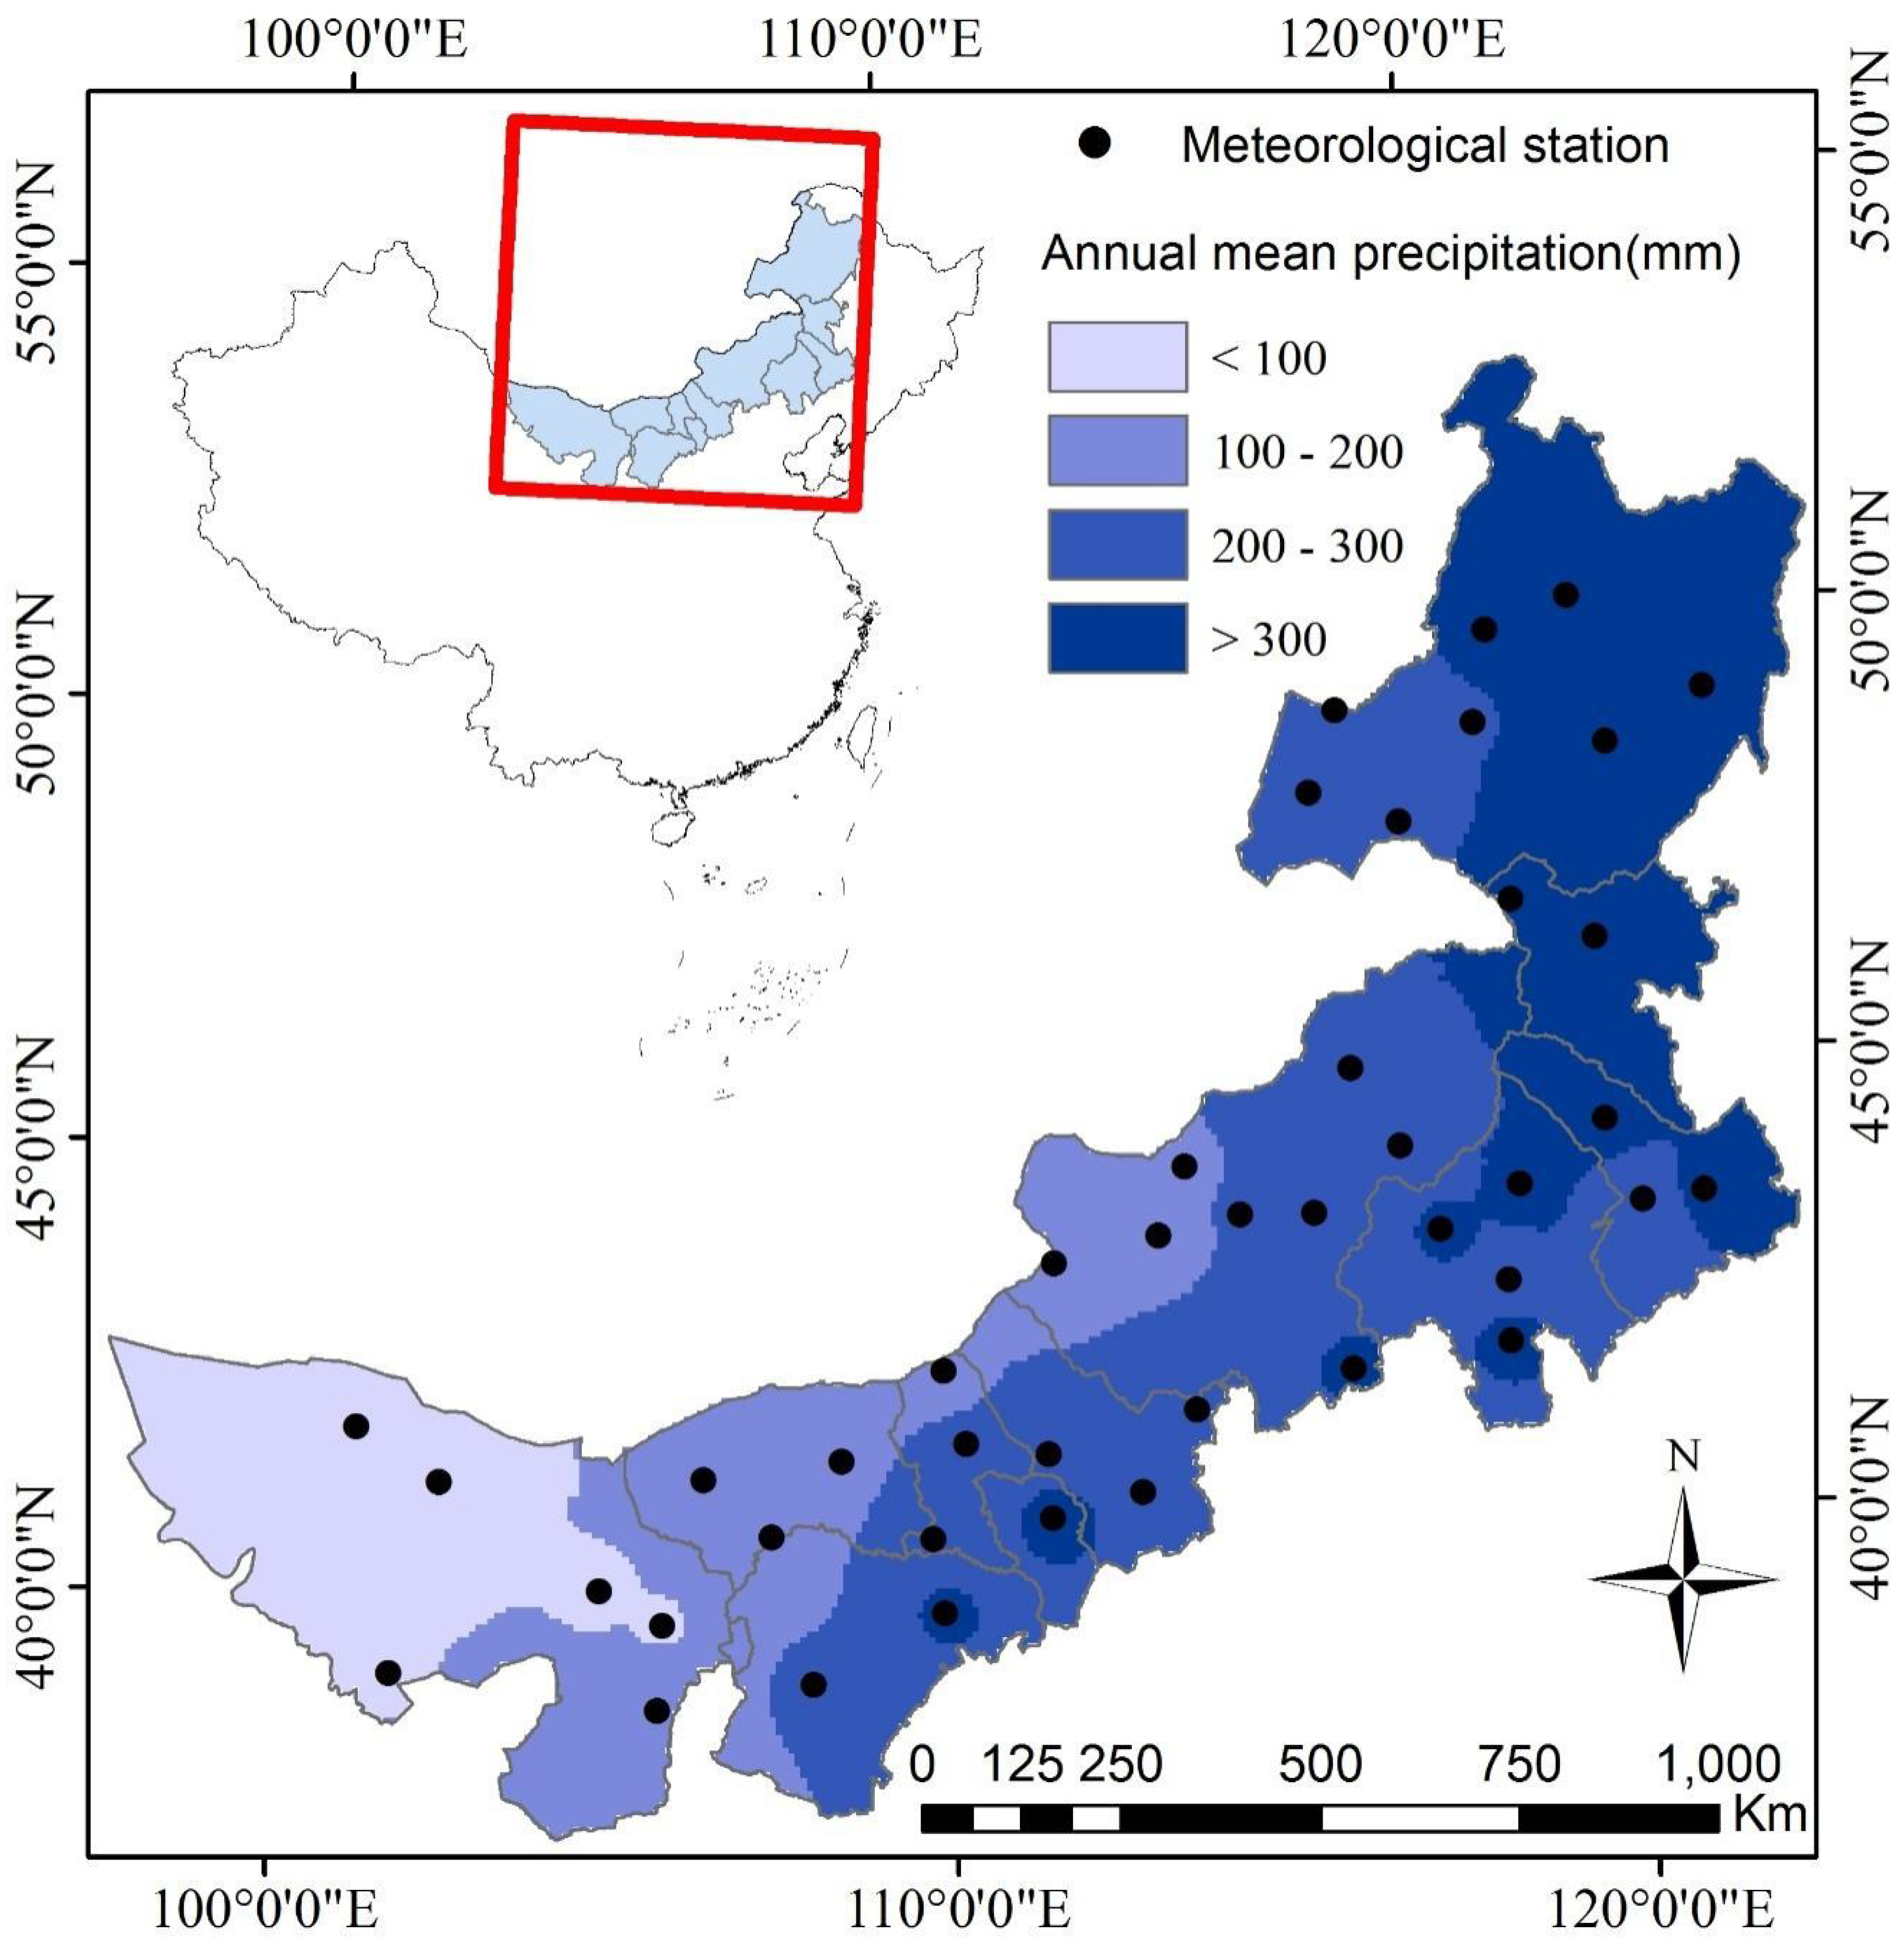
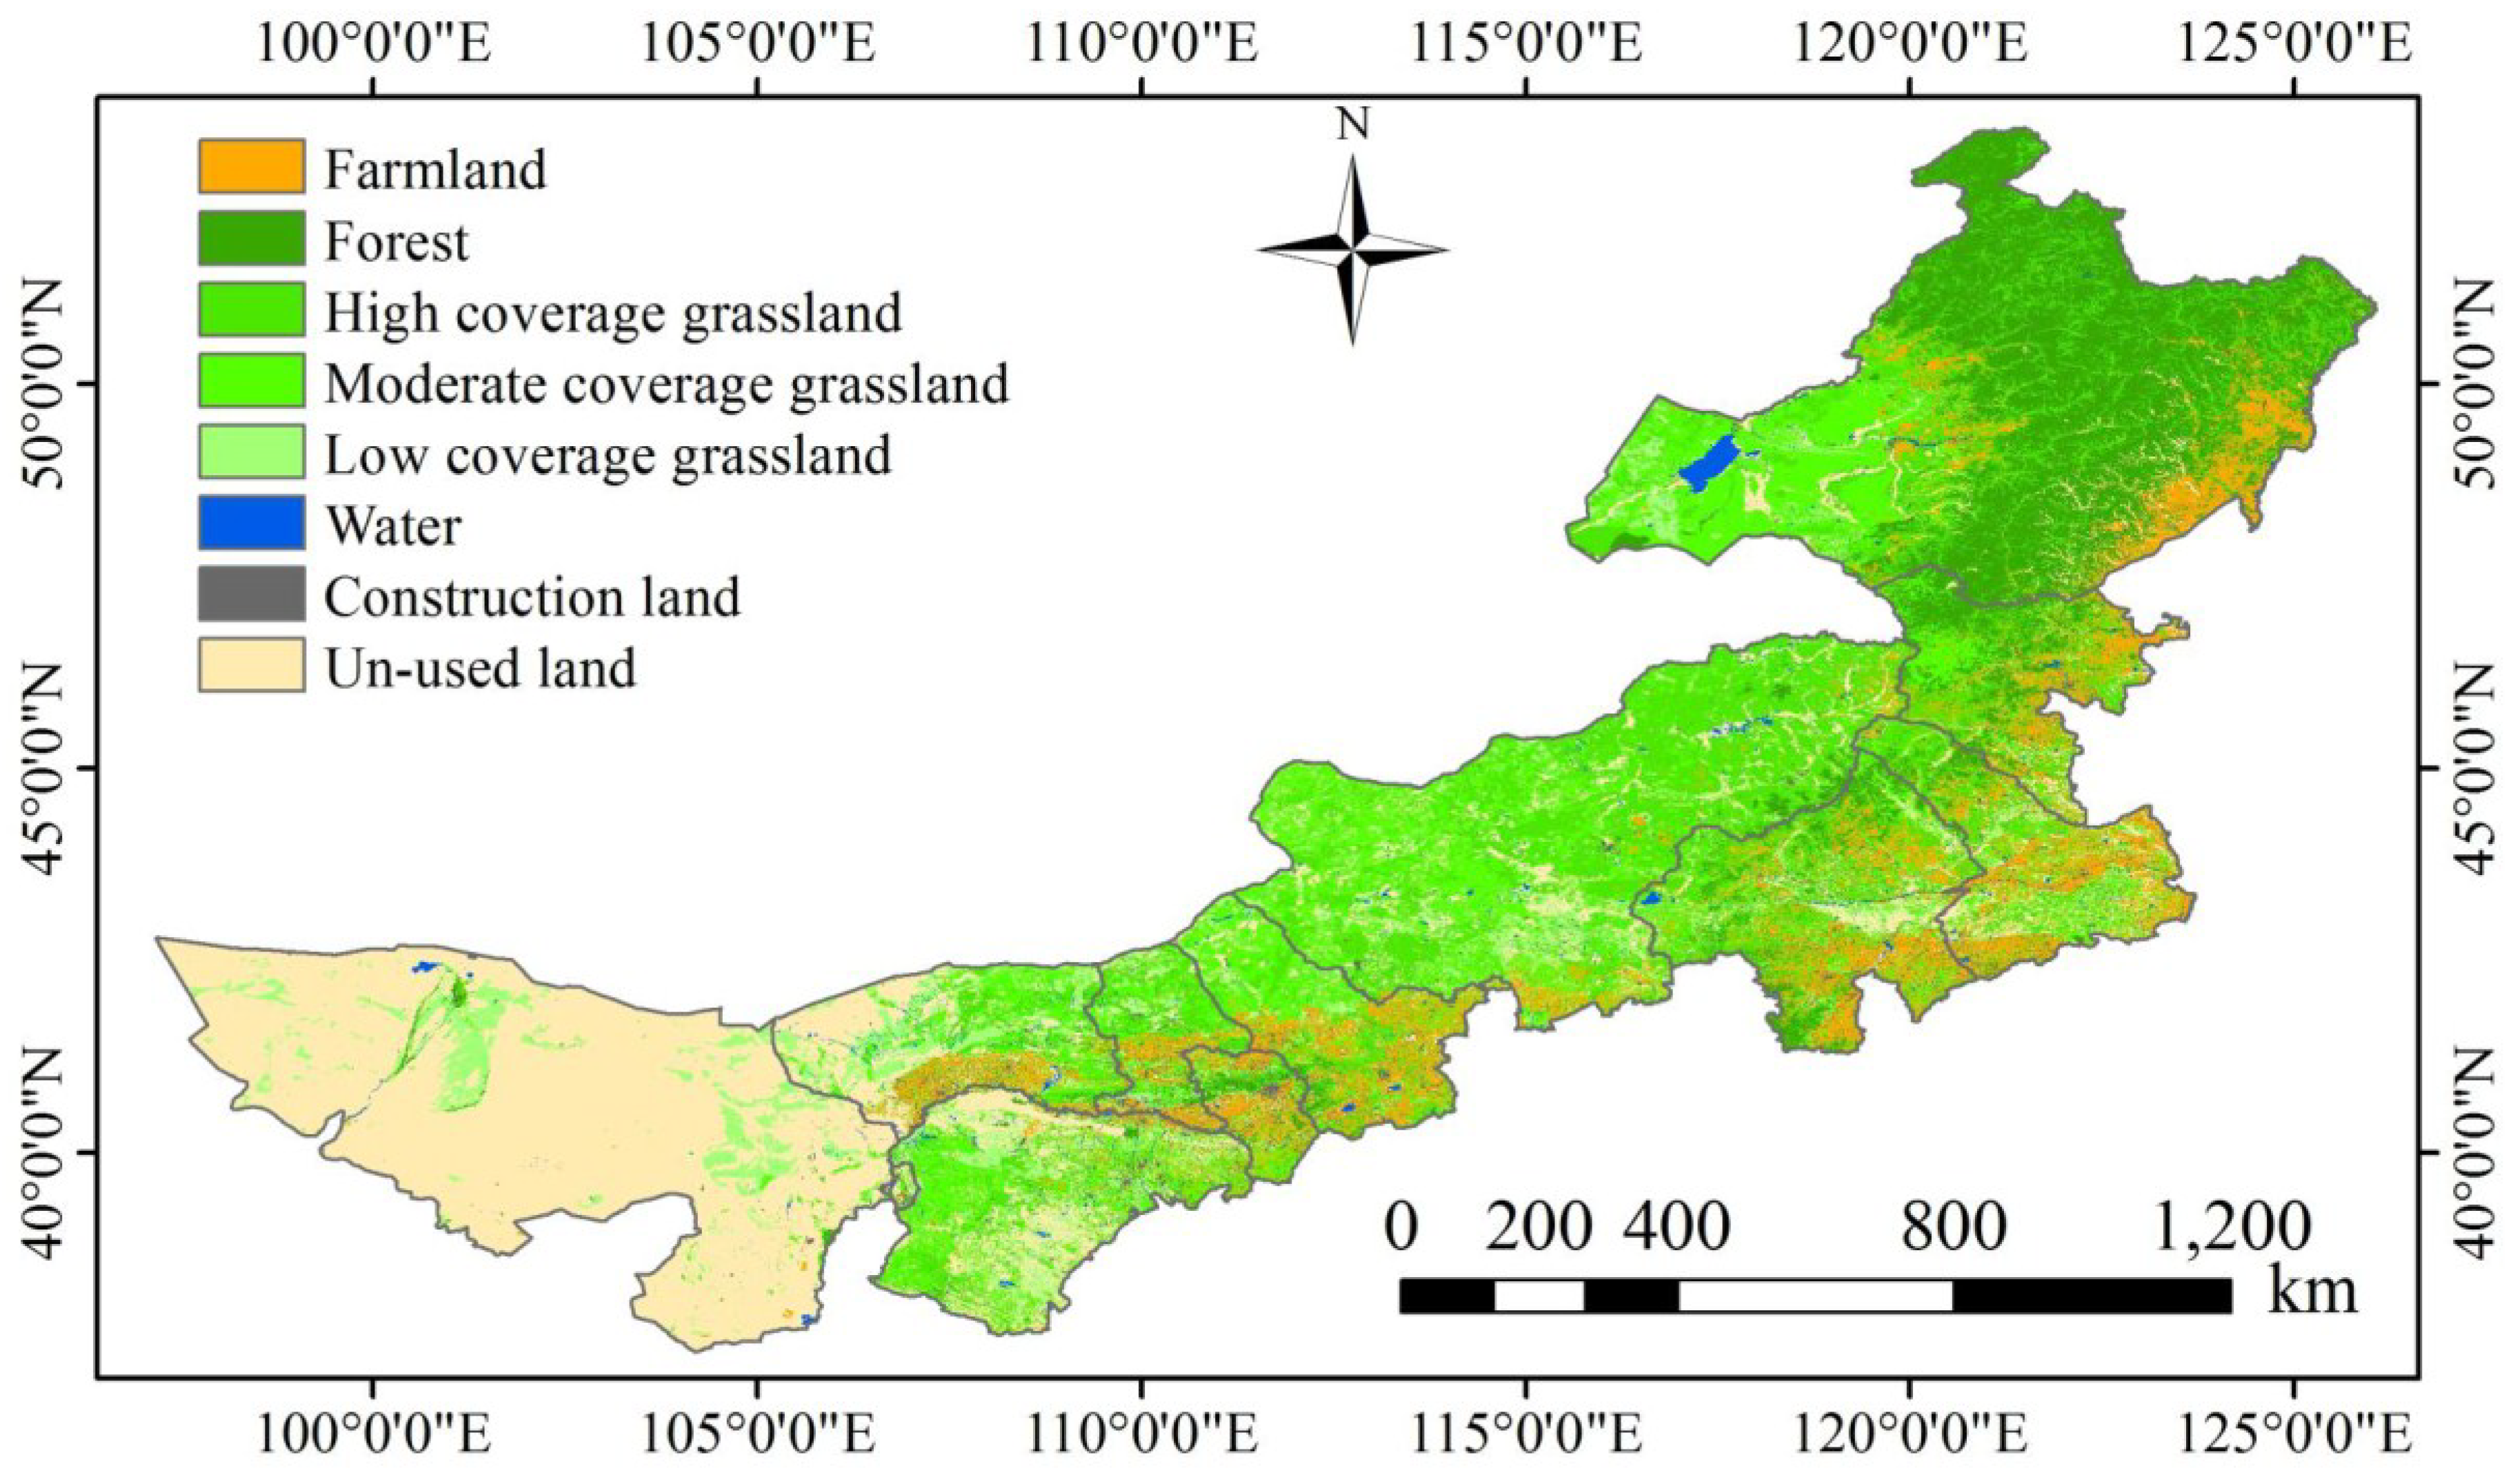
1.2. The Inner Mongolian Plateau: Climate Issues, Contexts and Problems

The Inner Mongolian Plateau (IMP) (Figure 1) is a vast area of grassland, ranking at the top of China’s five pastoral areas, and it is one of the most sensitive areas to global warming. The average warming rate in the whole region has reached 0.36 °C/decade since 1961, which is significantly higher than the national warming rate over the same period. The major crop yields were affected by climate fluctuations, changing phenology times, the risk of forest fires has increased, the total water resources have decreased, and the water deficit has become quite severe. The adverse impact of future climate change on economic and social development and ecological and environmental security will be further increased [7]. Grassland in Inner Mongolian Plateau is particularly important, not only acting as feed sources for livestock and as habitats for wildlife, but also by contributing to the livelihoods of local people. As reported, animal husbandry in IMP accounted for 45% of the province’s gross output value of agriculture in 2013 [8]. Grassland in IMP is faced with the same problems as worldwide grassland: widespread degradation due to limited resilience to climate extremes (such as droughts), rapid increases in demand for livestock products, and the high level of poverty among pastoralists [8].
Further ecosystems problems, such as dust storms originating from dry-land areas and degraded grasslands, mainly in IMP [9], have caused problems as far away as Japan and Korea [10]. Since the early 2000s, IMP has implemented various Ecological Construction Programs for grassland conservation to balance the productive and ecological functions of grasslands [8]. Located in a transition zone between the arid and semi-arid northwest inland region and the humid and semi-humid southeast, IMP provides the background for climate change and/or extreme climatic events and, together with economic and social problems and multiple stressors, which exacerbates the exposure and sensitivity, it is extremely vulnerable to climate extremes. Changes to climate conditions in pastoral areas due to extreme events may mean that in the future no longer be viable. Therefore, there is a need for rapid adaptation and innovation, thus opening new opportunities for research [11]. Proactive efforts to deal with the issues and needs seen in pastoral areas is required. The irregular changes in climate extremes caused by climate change increase the difficulties: pastoral systems have been disturbed and the unpredictability of forage production across vast areas means that the traditional knowledge of pastoralists can no longer be fully applied. Pastoralists in IMP can thus no longer make decisions on when and where to graze their livestock based on their traditional experience. For example, livestock are unable to reach the forage under the ice, and thus, if not provided with supplementary fodder, can starve during the winter or the following spring [12]. Establishing pasture reserves for winter use and for emergency forage during negative climate extremes is necessary. But many pastoralists are not aware of this issue. Climate extremes will remain highly destructive if there is not a comprehensive understanding of them. Those who are aware of the risk of being exposed to climate extremes, can plan to protect themselves from their damaging consequences. This is essential to sustain livelihoods [13]. Therefore, pastoralists must understand the characteristics of climate extremes to determine which areas to graze, when to graze, how many animals to stock, and whether the risks of movement outweigh the potential benefits. This knowledge is both necessary and urgent. Komba [14] found that if farmers recognize the variability of precipitation and they understand how this change can negatively affect their production, they can search for innovative solutions to reduce the negative consequences. Knowing the basic facts may enable herders to better respond to the climate extremes, providing a basis for adaptation in highly flexible grassland systems. However, there are only a few systemic studies within academic circles reporting on climate extremes of grassland areas and research on how the frequent climate extremes affecting agriculture in some pastoral areas of IMP is still rare. Without detailed studies of the mechanisms of extreme climates, the current risk of climate extremes changes in IMP may increase.

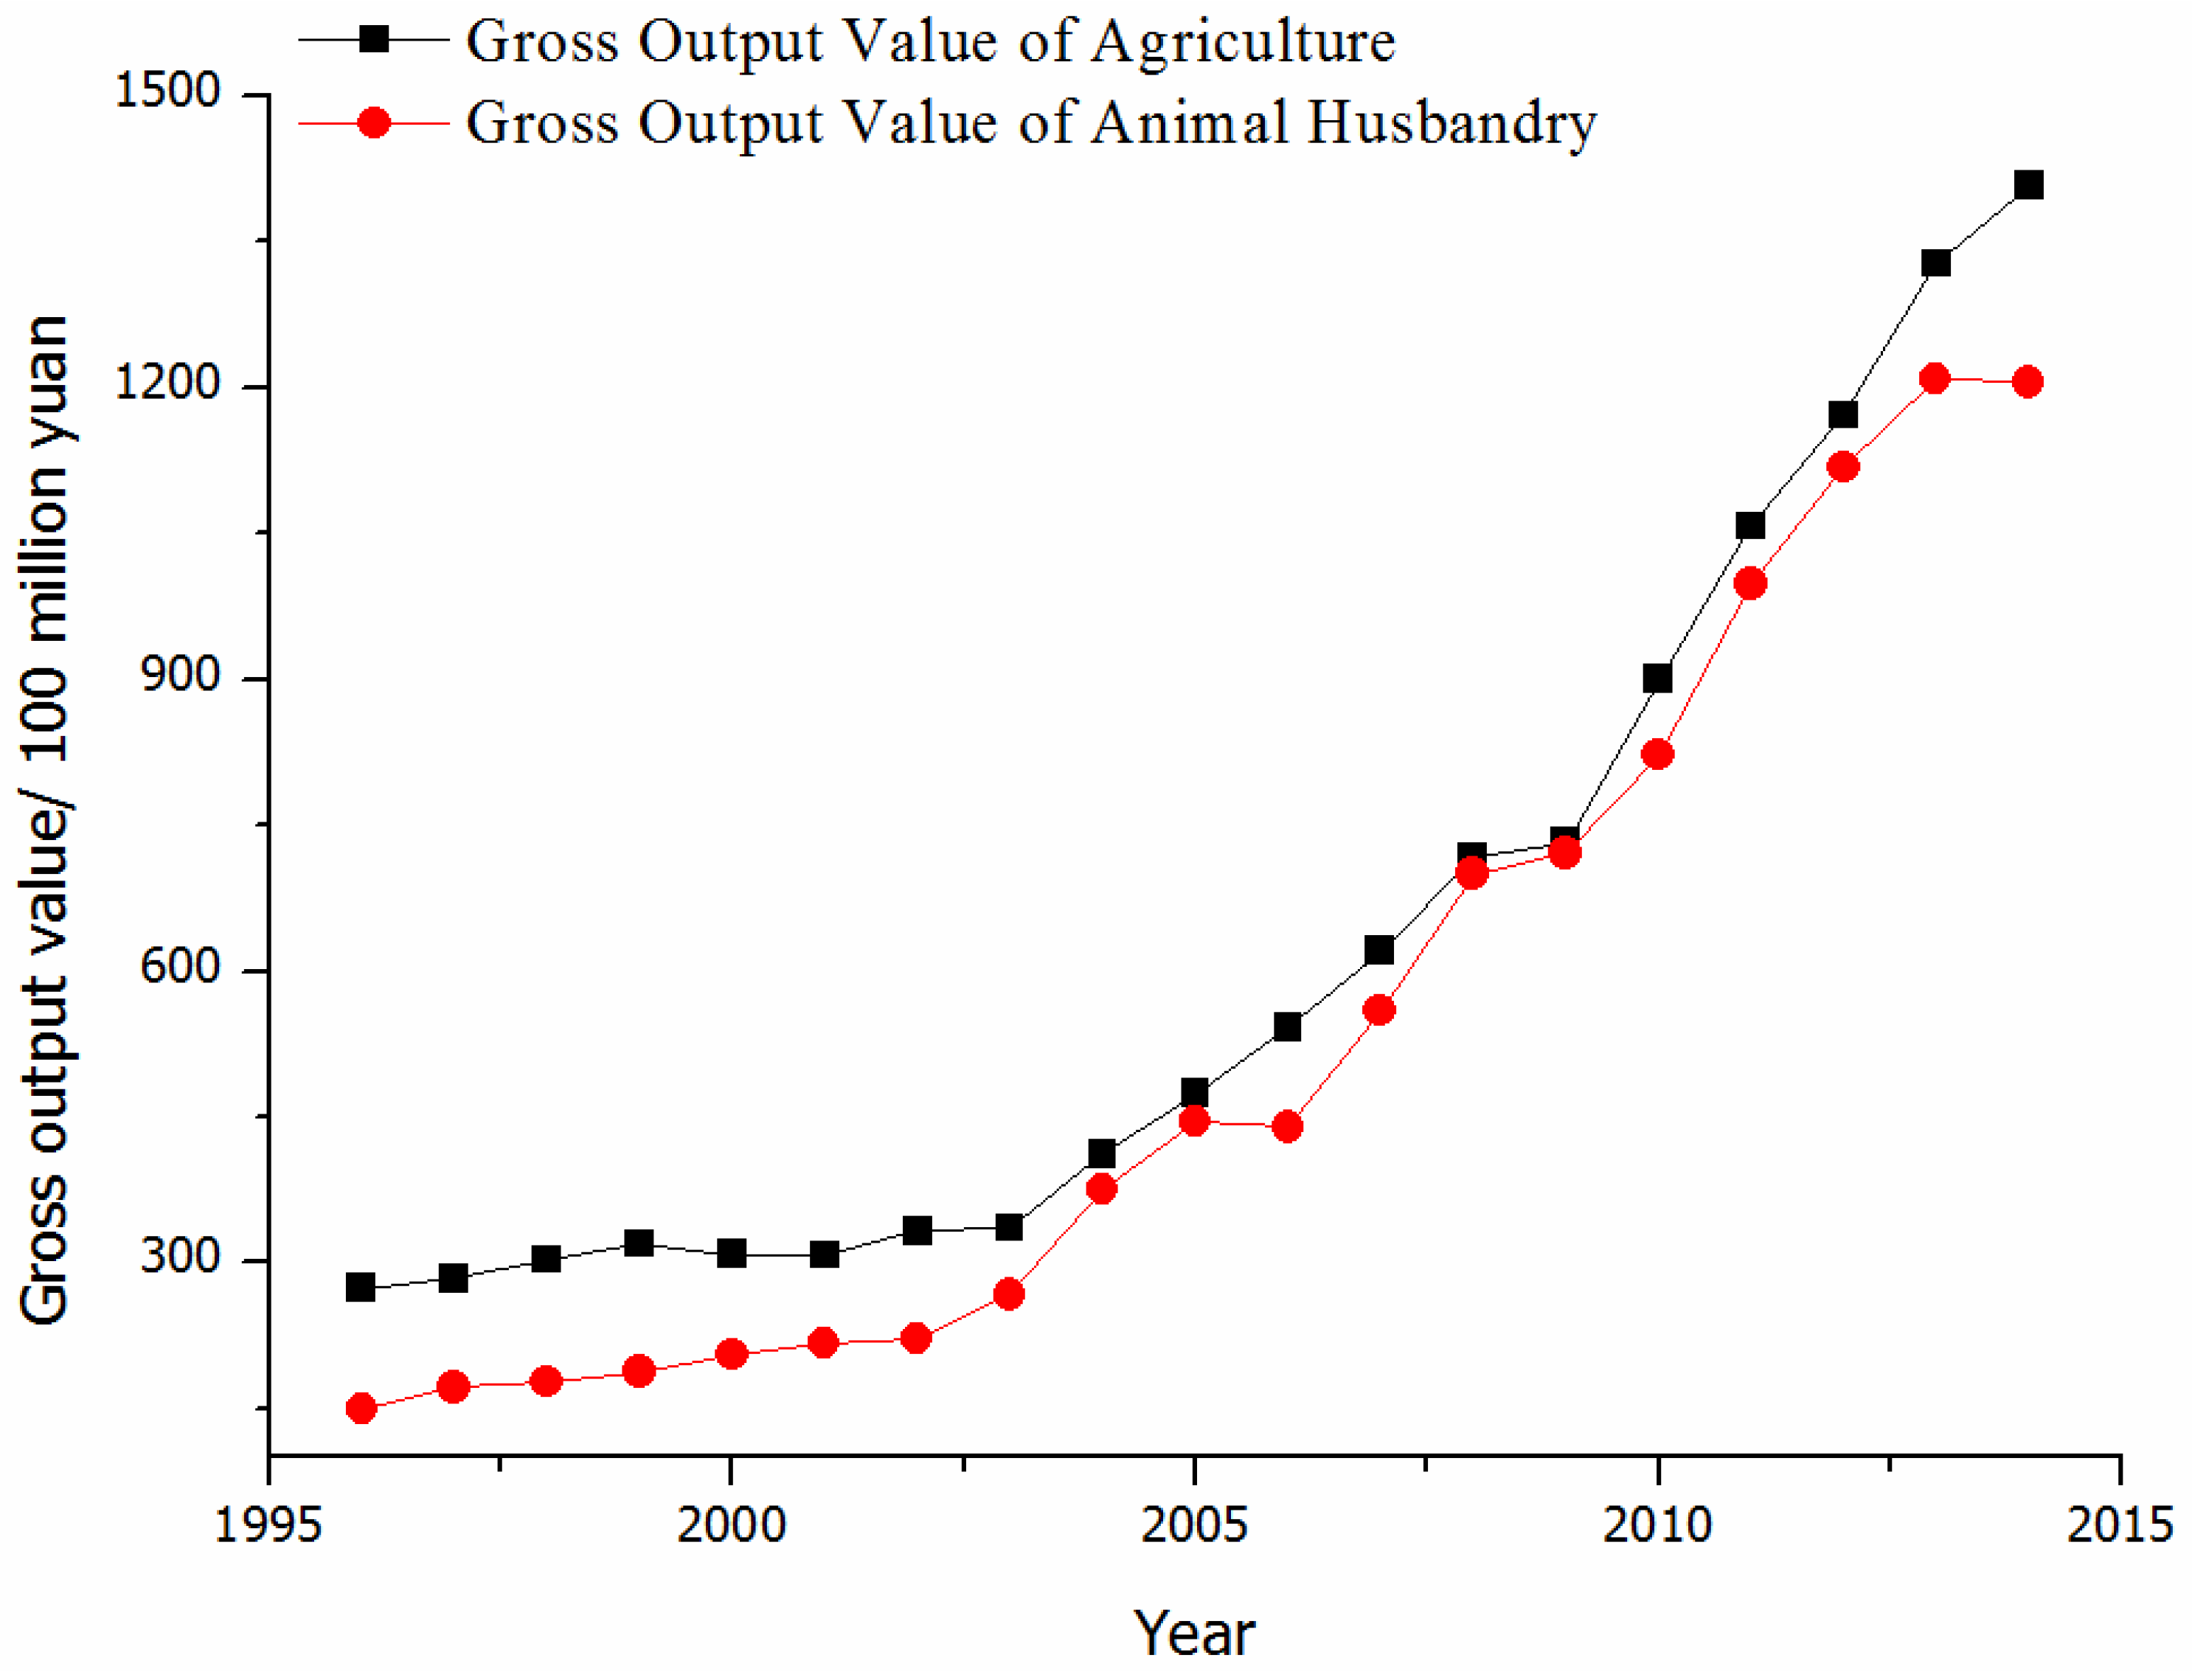
1.3. The Influence of Precipitation Variations to Agriculture

Inner Mongolian Plateau (IMP) is home to many dairy and beef cattle farms, cash crops such as soybeans and corn. The predominance of these economic activities is reliant on the regional natural resources, which result in IMP being vulnerable to climate change, especially to climate extremes. Grassland accounts for approximately 67% of the total land area in IMP [8,15]. Therefore, grassland plays an important role in the development of animal husbandry, which is an important part of agriculture. Various ecological construction programs were implemented in IMP, but grassland is still exposed to natural disasters, for example, precipitation extremes. Farm systems have evolved to cope with modest variations in climatic conditions but are susceptible to climate extremes. This is partly due to the fact that changes of precipitation extremes show much more distinctive regional characteristics, compared to temperature extremes [16]. Previous research also confirms that grassland is the most sensitive ecosystem for precipitation fluctuation [17]. Precipitation extremes can not only directly affect the grassland ecosystem by affecting the supply of soil moisture, but can also affect the supply of soil nutrients indirectly [18]. Apart from this, extreme precipitation events also have a profound impact on the growth and physiology of grassland plants. Grassland plants have evolved their own adaptation strategies for arid and semi-arid environmental fluctuations. They can improve their water-efficiency by changing their own form and physiological functions to adapt to different water conditions and improve their own competitiveness and ecological adaptability at the same time [19]. However, due to global warming, changes in precipitation extremes show high-frequency, high-intensity, and long-lasting trends, which often have a serious impact on vegetation. For example, extreme precipitation events can cause plant damage or death by wilting [17]. This will indirectly but seriously affect the animal husbandry and agriculture, since grassland provides the food for livestock, and the livelihoods for pastoralists. The Intergovernmental Science-Policy Platform on Biodiversity and Ecosystem Services (IPBES) reported that extreme weather events are one of the main causal factors leading to land degradation [11], which directly leads to a drop in potential agricultural productivity and gives rise to concerns about food security; grassland is no exception. Livestock products are one of the sole sources of income for pastoral families and many herders far exceeded their maximum allowable quantity for livestock [12], which causes a huge burden on grassland, exceeding its carrying capacity and leading to grassland degradation. The expansion of agriculture into grassland regions which are ecologically unsuitable for farming is another land degradation factor [12]. This exacerbates the effects of climate extremes. In some dry or semi-dry regions, the precipitation extremes associated with climate change are pushing the coping capacity to its limits. People in this region have normally focused their attention on temperature-related issues. Therefore, understanding the changing patterns of extreme precipitation events and their causal factors may offer a basis for understanding the responses required of grassland ecosystems to extreme precipitation events, and for the development of agriculture in IMP. There is some limited research about climate extremes in IMP. Yan et al. [20], for instance, found that extreme precipitation events showed a decreasing trend with a low frequency and intensity in Inner Mongolian during the past 50 years. You et al. [21,22] believed that the amount of rainfall associated with extreme precipitation events decreased in the middle and southeast of Inner Mongolia, but increased in the northeast and west over a recent 48-year period, after the abrupt temperature increase in 1987. Liu [23] studied the spatial-temporal changes of extreme climate events during 1970–2012, and the results showed that Max Tmax (TXx) and Min Tmin (TNn) displayed asymmetric changes. TXx has a non-significant positive trend in the forest and steppe of the Hulun Buir region; while the TNn had a significant positive trend before 21th century and then displayed volatile variability. Frost days and ice days were shown to be decreasing, while tropical days and summer days showed an increasing trend. Extreme rainfall trends were generally less spatially coherent across the region and precipitation, the Simple daily intensity index (SDII) and number of very heavy precipitation days (R20) showed a decreasing trend in forest and steppe, and an increasing trend in the desert region.
To sum up, past studies on extreme events were mainly focused on spatial-temporal characteristics, and were only aimed at some extreme climate indices, lacking comprehensive and causal factors analysis. This study provides a comprehensive analysis of changes in precipitation extremes, and fully discusses their influence over the IMP, using 11 indicators based on daily precipitation data from 43 meteorological stations over the period 1959 to 2014. The results may contribute to an improved insight on the possible impacts of climate change and could be helpful in developing appropriate adaptation and mitigation strategies to cope with the adverse effects of climate extremes. The data and methods are described in Section 2. This is followed by the analyses and discussion in Section 3. Section 4 contains the main conclusions from the study.

2. Data and Methods

2.1. Data, Quality Control, and Homogeneity Testing

Meteorological station-based daily precipitation data during 1959–2014 in IMP were used in this study, which were obtained from the Climate Data Center (CDC) of the National Meteorological Center of the China Meteorological Administration (CMA) (available from http://cdc.nmic.cn/home.do). Data quality control is a prerequisite for indices calculations and it was performed using the computer program RClimDex Software Version 1.1 (available from http://etccdi.pacificclimate.org/authenticated_downloads/RClimDex/rclimdex1.1_131115.r), which is a widely used approach, developed and maintained by Xuebin Zhang and Feng Yang at the Climate Research Branch of Meteorological Service of Canada [24,25]. Using detailed principles described by Wang [26,27], some cities, such as Zalantun City, Ulan Hot City, Jihede, Zhurihe, Hanggin Rear Banner, Ejin Horo Banner, and Baoguotu, were removed, and ultimately selected forty-three qualified stations with reliable data for statistical analysis. A homogeneity test was made with the RHtest V4 software (available online at http://etccdi.pacificclimate.org/software.shtml) to identify possible change points or structural changes in the data series. Thus, after data quality control and homogeneity assessment the forty-three stations (Figure 1) with the relevant data for at least fifty-six years (1 January 1959 to 31 December 2014) were selected.
Monthly mean geopotential height and wind fields at 850 hPa were downloaded from the National Oceanic and Atmospheric Administration-Cooperative Institute for Research in Environmental Sciences (NOAA-CIRES) Climate Diagnostics Center (available online at https://www.esrl.noaa.gov/psd/data/gridded/data.ncep.reanalysis.pressure.html), which are used for analyzing the large-scale atmospheric circulation.

2.2. Climate Extreme Indices and Analytical Methods

Eleven precipitation indices (Table 1) were calculated by RClimDex Software Version 1.1, whereby not all indices were calculated monthly. Monthly indices were calculated if no more than 3 days of data were missing in a month, while annual values were calculated if no more than 15 days were missing in a year. No annual value was calculated if any one month’s data was missing. For threshold indices, a threshold was calculated if at least 70% of data were present. For spell duration indicators, a spell can continue into the next year and was counted against the year in which the spell ended. The indices were calculated from daily precipitation data [28,29].
The low-pass filter, introduced by Sedra et al. [30], was applied to the annual anomaly series relative to 1959–2014 mean values for all precipitation indices to highlight the decadal or longer time-scale variations and trends. Then the simple linear regression method is utilized to analyze the trends of 11 precipitation indices among the 43 meteorological stations. The Mann–Kendall (MK) test was used to evaluate the statistical significance of the trends, and the abrupt analysis [16].

3. Results and Discussions

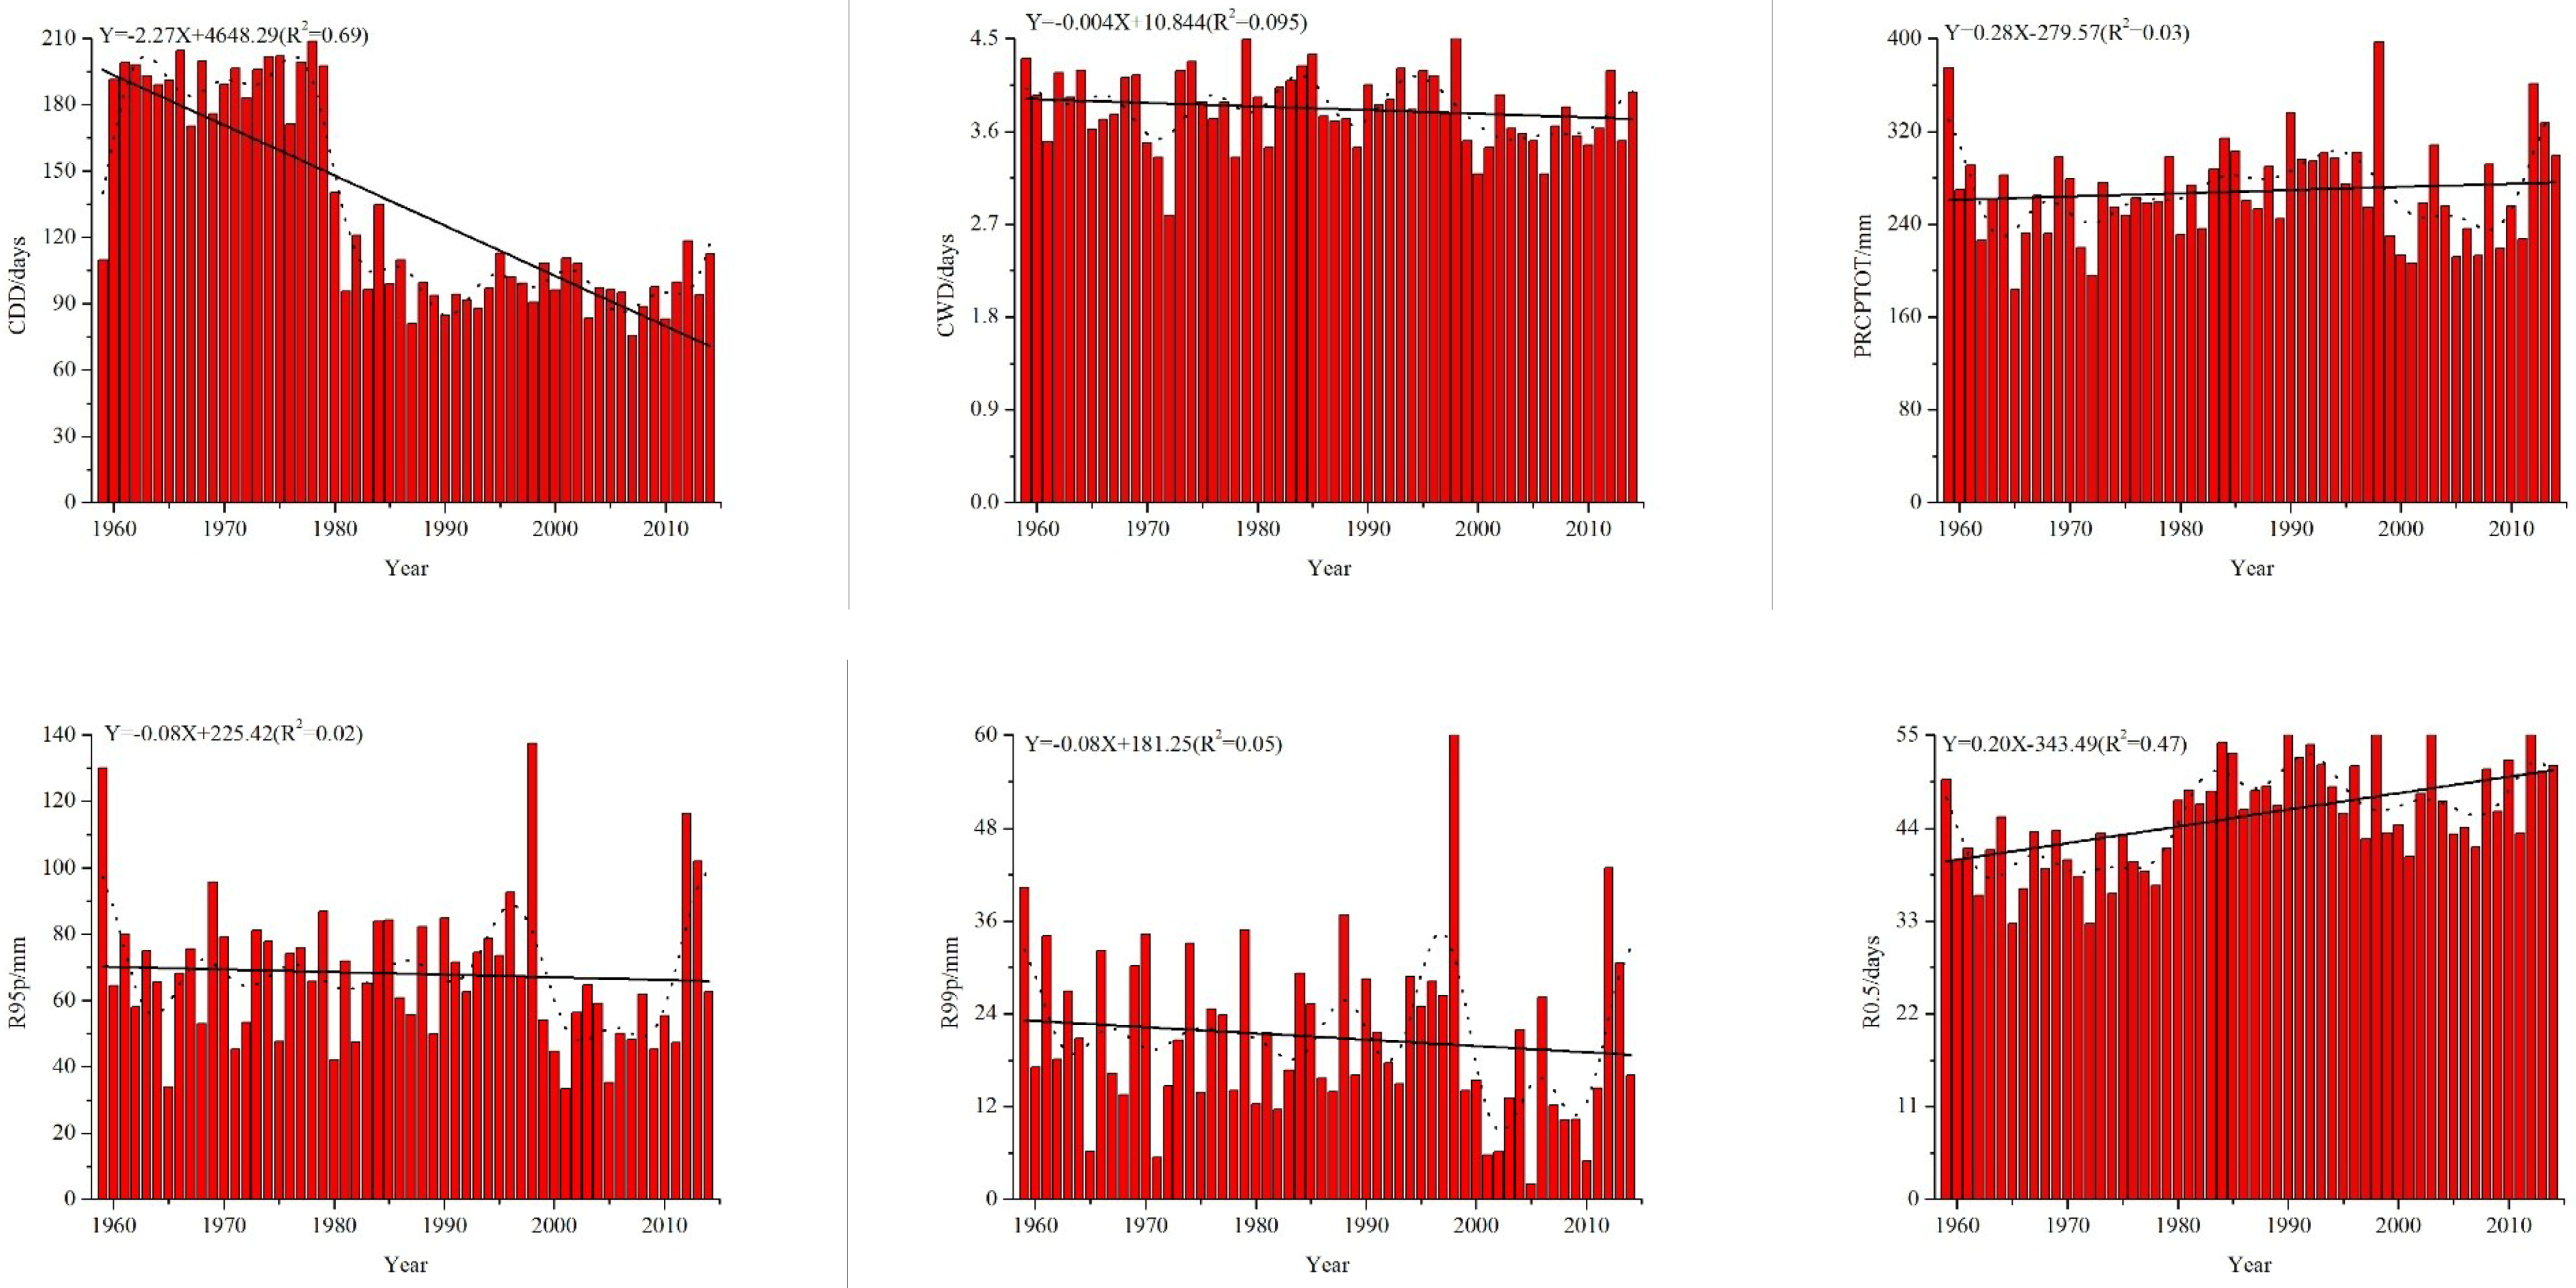
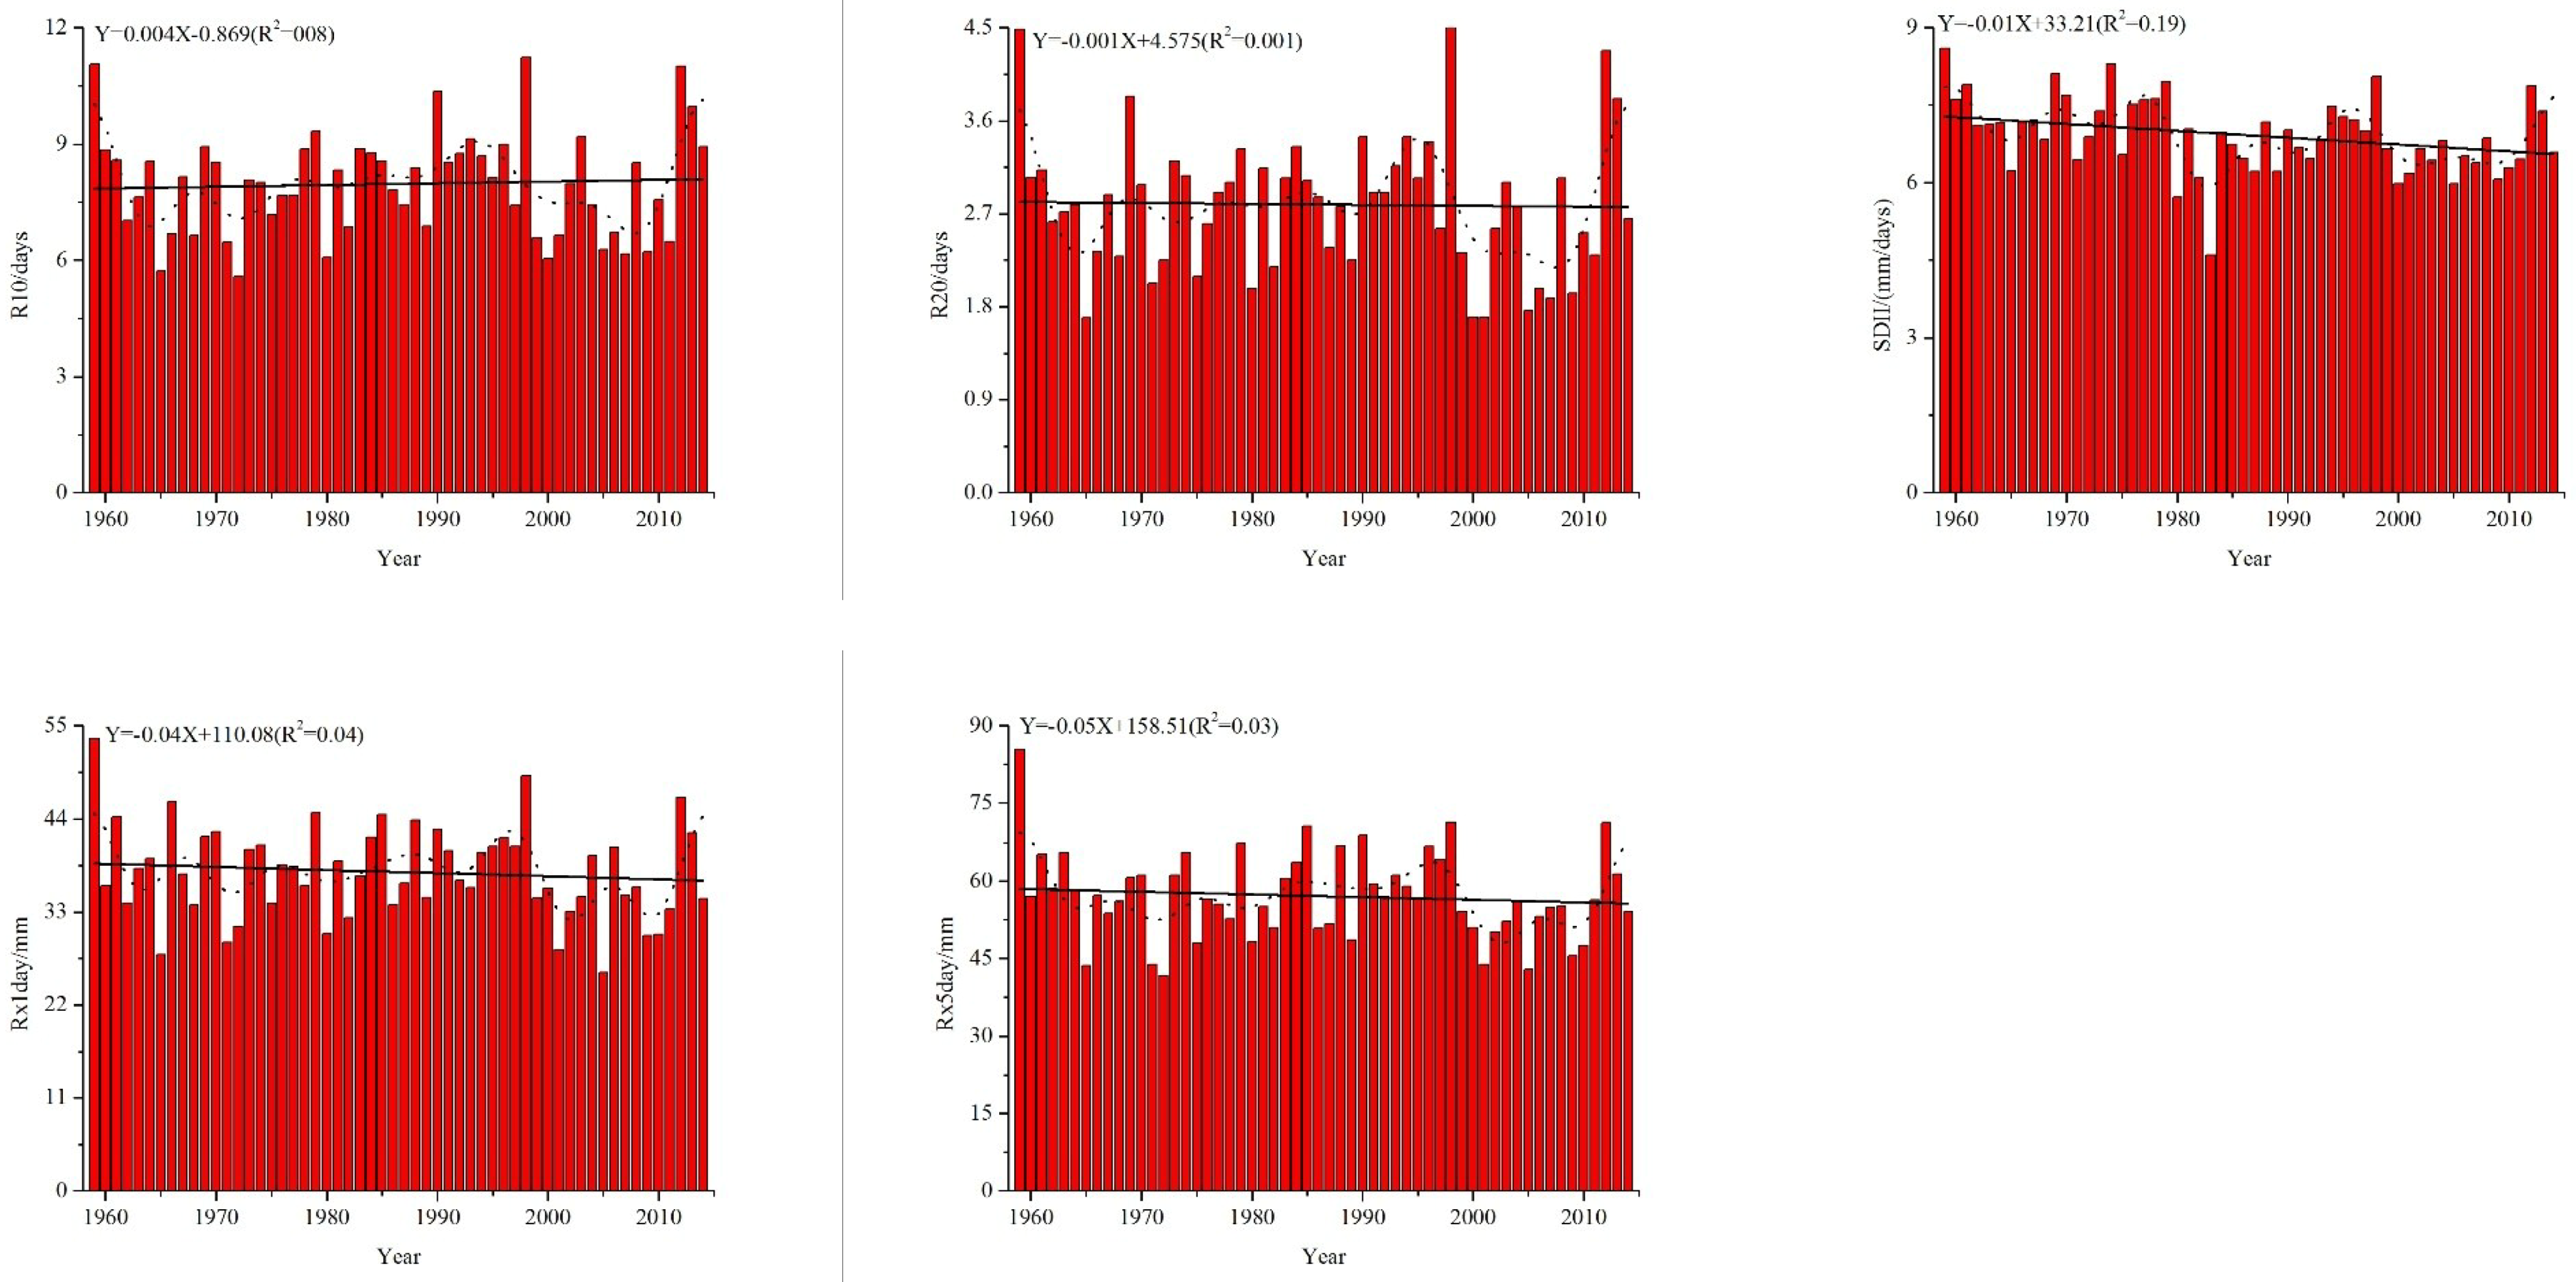
3.1. Temporal Variation of Precipitation Extremes in Inner Mongolian Plateau

To analyze the temporal variations of precipitation extremes in the IMP, the average values of the IMP are firstly computed. Figure 2 illustrates the time series of several precipitation indices in IMP during the period 1959–2014. Almost all extreme precipitation indices, except number of precipitation days with over 0.5 mm (R0.5) and number of heavy precipitation days (R10) and total precipitation in wet days (PRCPTOT), showed decreasing trends over the IMP during the period 1959–2014. Changes about CDD (−22.7 days/decade) and R0.5 (2 days/decade) are pronounced significant (p < 0.05) over time, and the other nine indices displayed non-significant. These results indicate that the duration of precipitation extremes in IMP seemed to decrease, while the frequency of precipitation events have increased, particular the R0.5. The eleven extreme indices can not only express the intensity, frequency, and magnitude of extreme precipitation, but also indicate the dryness and wetness. A previous study illustrated that changes in the CDD were in accordance with the projections for the increase in dryness in the Mediterranean area and central Europe [31]. This also indicates that CDD can represent dryness. Among the eleven indices, except CDD as a dry index, the other ten extreme precipitation indices in this research are wetness indices.
Based on the above results, the general variation tendency for wet indices over the IMP during 1959–2014 is decreasing; the dry index also shows a decreasing trend, but with larger magnitude, which can indicate that the dry situation was alleviated in the IMP during the study interval. While comparing with the northwest area of China, CDD in IMP showed a greater decreasing trend [32], which makes this research even more interesting. The use of averages over the spatial region means that a lot of regional specific information would be lost. To solve this problem, this paper also analyzed precipitation extremes based on data from meteorological stations.

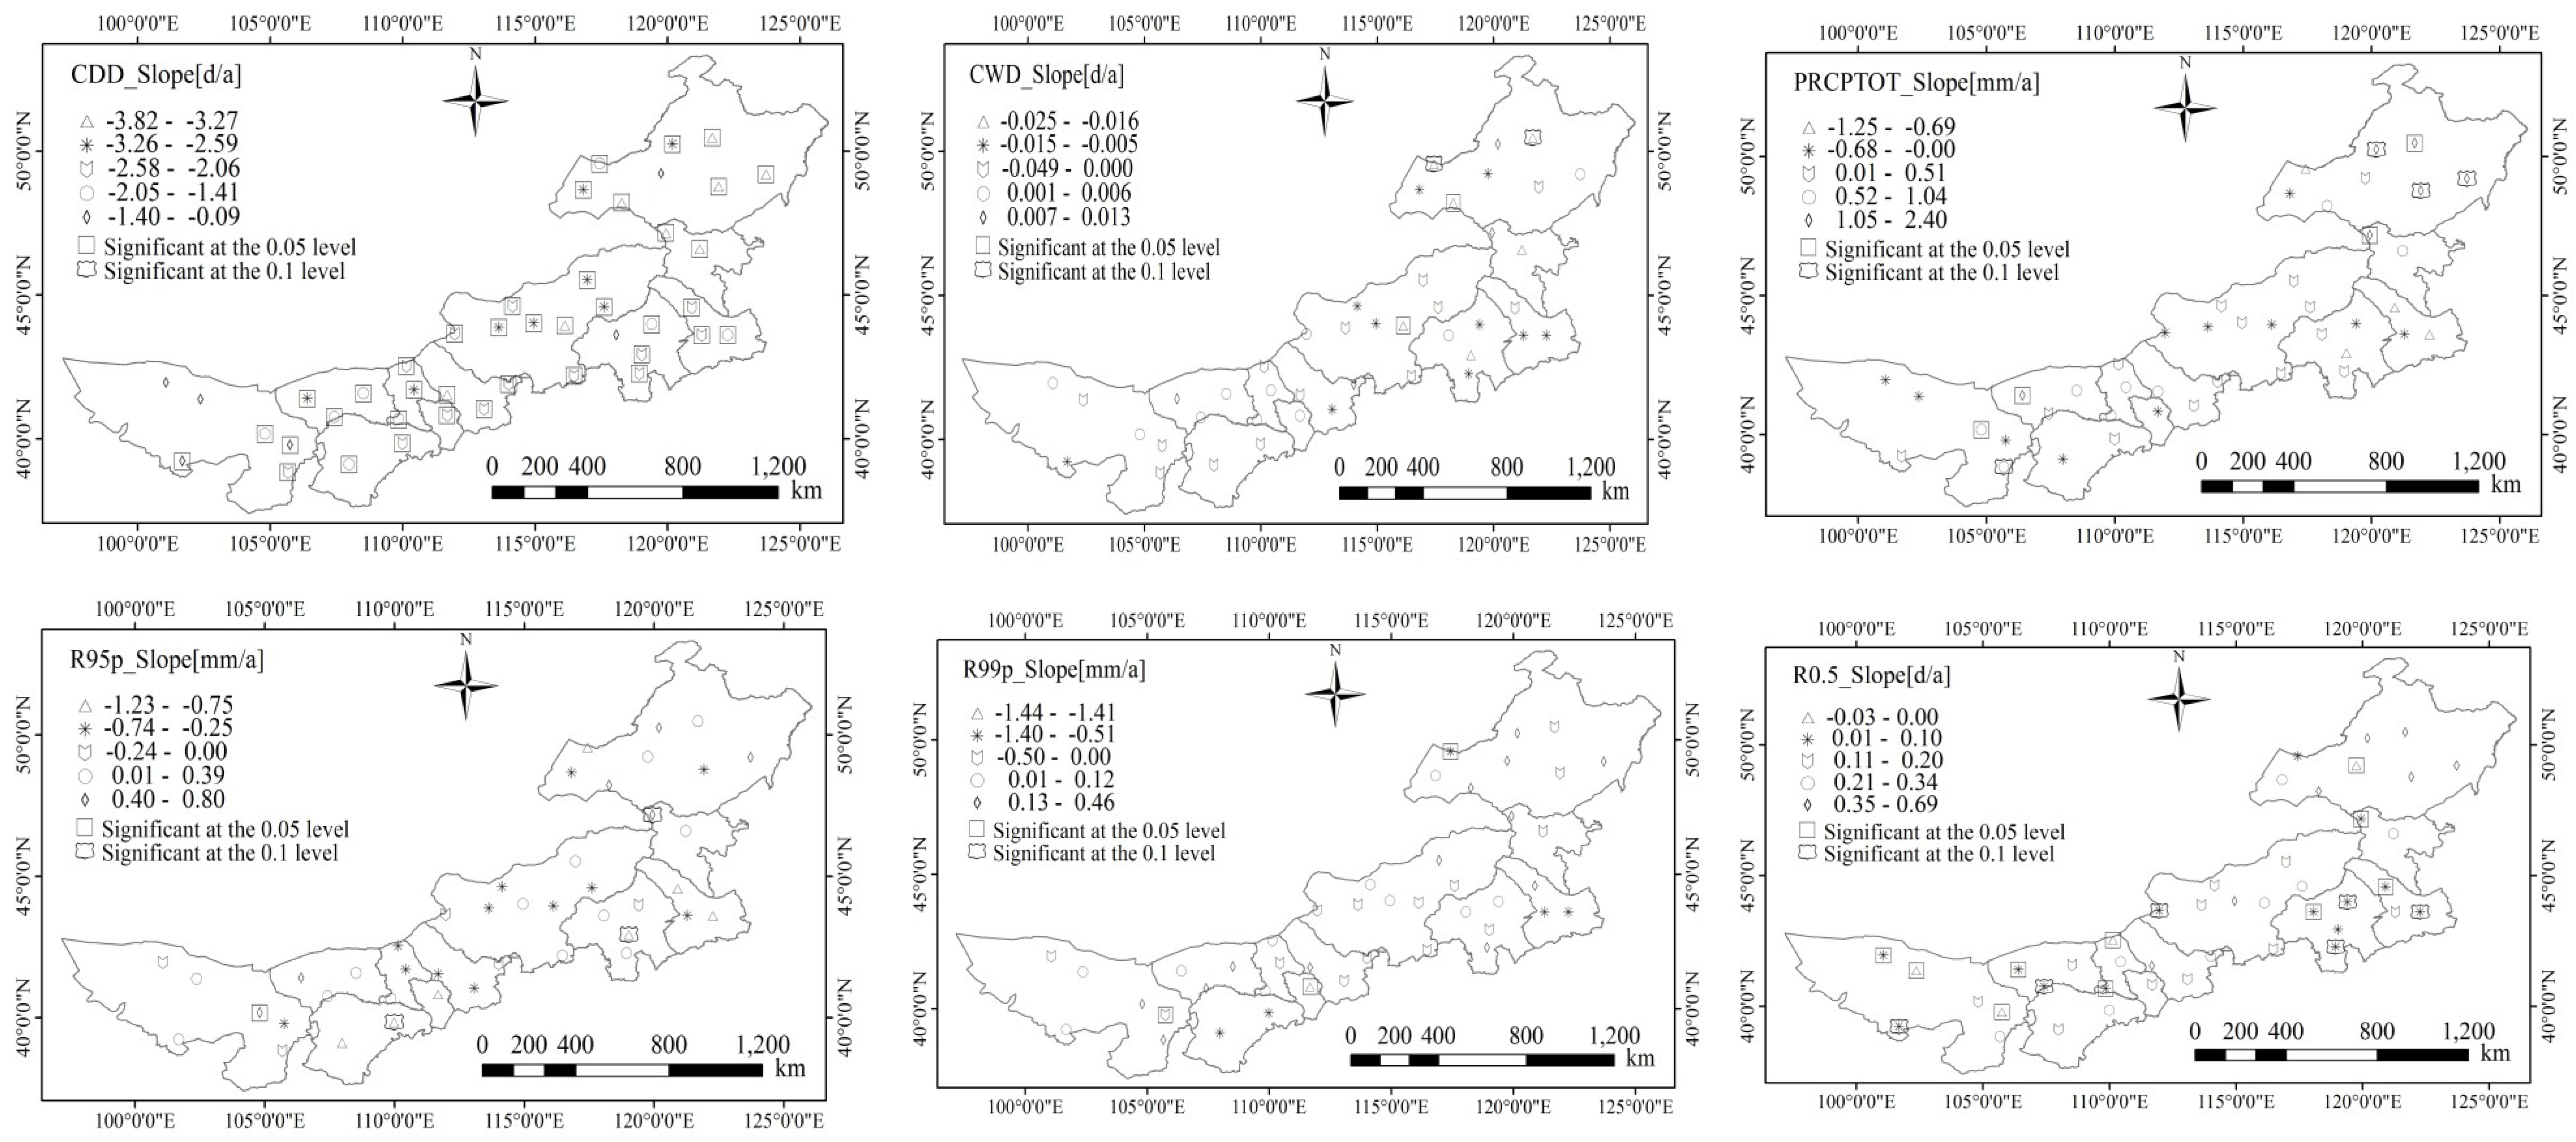
3.2. Spatial Variation of Precipitation Extremes in Inner Mongolian Plateau

To analyze the spatial variations of precipitation extremes in the IMP, precipitation indices in each station were computed. Regarding the spatial distribution (Figure 3), CDD, 100% of the stations showed a decrease over time; 90.7% of these stations passed the significance test at the 0.1 level. CWD at 67.4% of the stations showed a decrease, but only 13.8% of these stations exhibited significant trends (p < 0.1). Negative slopes dominated the spatial distribution maps, although scattered positive trends were found among those that appeared as a cluster in the middle and western area of IMP. Stations where PRCPTOT increased and decreased accounted for 65.1% and 34.9% of the total, respectively, but only 18.6% of these stations exhibited significant trends (p < 0.1). The stations with PRCPTOT increase were mainly located in the north-eastern area. SDII at 81.4% of the stations showed a decrease, 42.9% of these stations passed the significance test at the 0.1 level. The variations at the stations had significant characteristics of spatial aggregation and were evenly distributed in the northeast of the IMP. R10 at 62.8% of the stations increased and 14.8% significant at 0.1 level, while R20 at 51.2% of the stations deceased, but only about 9.1% of these stations exhibited significant trends at the 0.1 level. Rx1day at nearly 55.8% of the stations showed a decrease, but approximately 12.5% of these stations exhibited significant trends at the 0.1 level.
In addition, Rx5day at nearly 55% of the stations showed a decrease, but only approximately 4.3% of these stations exhibited significant trends at the 0.1 level, with the middle area having larger trend magnitudes. R0.5 at 93% of the stations showed an increase over time, with 67.5% of these stations showing a significant increase at the 0.1 level. The variations at the stations had significant characteristics of spatial aggregation and were mainly distributed in north-east and south-west area. R95p displayed a decrease of 55.8% at the stations, but only 8.3% of the stations passed the 0.1 significant level. Conversely, R99p at 53.5% of the total stations showed an increase trend, but no stations surpassed the 0.1 significance level. From a spatial perspective, changes of precipitation extremes existed: apparent spatial differences and dry situations were alleviated in the dry area, particularly in the western area on IMP.
Data from Figure 3 shows the decrease and increase of precipitation extreme events and spatial differences in the IMP. This suggests that when planning measures for adapting to the adverse impacts of future precipitation extreme events occurrences; sub-regions should be separately considered.

3.3. Effects Factors of Precipitation Extremes

The IMP is a semi-arid region in China and is most sensitive to climate change, although the strengthened frequency of precipitation extremes can help to alleviate the risk of drought and losses generated by drought disasters. At the same time, these extreme precipitation events can also cause some damage, especially in the IMP, which is a special landform formed by semi-arid climate. A small but high frequency heavy precipitation may be enough to trigger a natural disaster. There is thus a pressing need to better understand the impact of precipitation extremes.

3.3.1. Elevation, Longitude and Latitude

As Table 2 shows, CDD is positively correlated with elevation, whereas the other extreme precipitation indices are negatively correlated with elevation over the IMP during 1959–2014. While correlated with longitude, its relationship with CDD is negative, whereas the other extreme precipitation indices show positive relationships with longitude. Table 2 also shows that trends towards increases for extreme precipitation indices with longitude increasing (except CDD) and statistically significant at the 0.01 level. These results between latitudes were similar to those of the longitude, demonstrating that all wet extreme precipitation indices are raised with the increases in latitude. The increasing trends for some extreme precipitation indices are statistically significant at the 0.01 level.
Compared with the other ten indices, CDD is the only index which can describe dry situations. From the above result, it can be explained in a quantitative way from the geographic location why south-west area of IMP is drought prevalent and the north-east area is relatively wet. The south-west area of IMP, with higher elevation [33] and lower latitude and longitude (Figure 1), is the driest place in IMP, while an inverse trend is seen in the north-east part of IMP. Linear regressions between extreme precipitation indices and elevation, longitude, and latitude showed that specific locations determined the precipitation extremes, which in turn indicate that extreme precipitation events have regional variation characteristics.

3.3.2. Annual Total Precipitation

To validate whether the extreme precipitation indices used in this study can indicate the change of annual total precipitation or not, the correlation coefficients between annual total precipitation and selected extreme precipitation indices across IMP were acquired (Table 3). Table 3 indicates that the relationships between extreme precipitation indices and annual total precipitation are statistically significant at the level of 0.01. Except CDD, the other ten extreme precipitation indices have positive correlations with annual total precipitation and all coefficients are larger than 0.7. The results agreed with the previous findings [21,34]. That is to say, extreme precipitation indices can better indicate the expected changes of annual total precipitation in the IMP. Thus, to some extent, it can be concluded that precipitation extremes play an important part in total annual precipitation. From statistical analysis, it can be concluded that the dry situation is alleviated in the IMP in a quantitative way, due to the sharply decreased CDD. If this trend persists, IMP could experience moderate wet periods in the coming years; this result is very important for farming operations such as land clearing and preparation, planting, fertilizer application, disease/pest control, spraying of chemicals, and irrigation, among others.

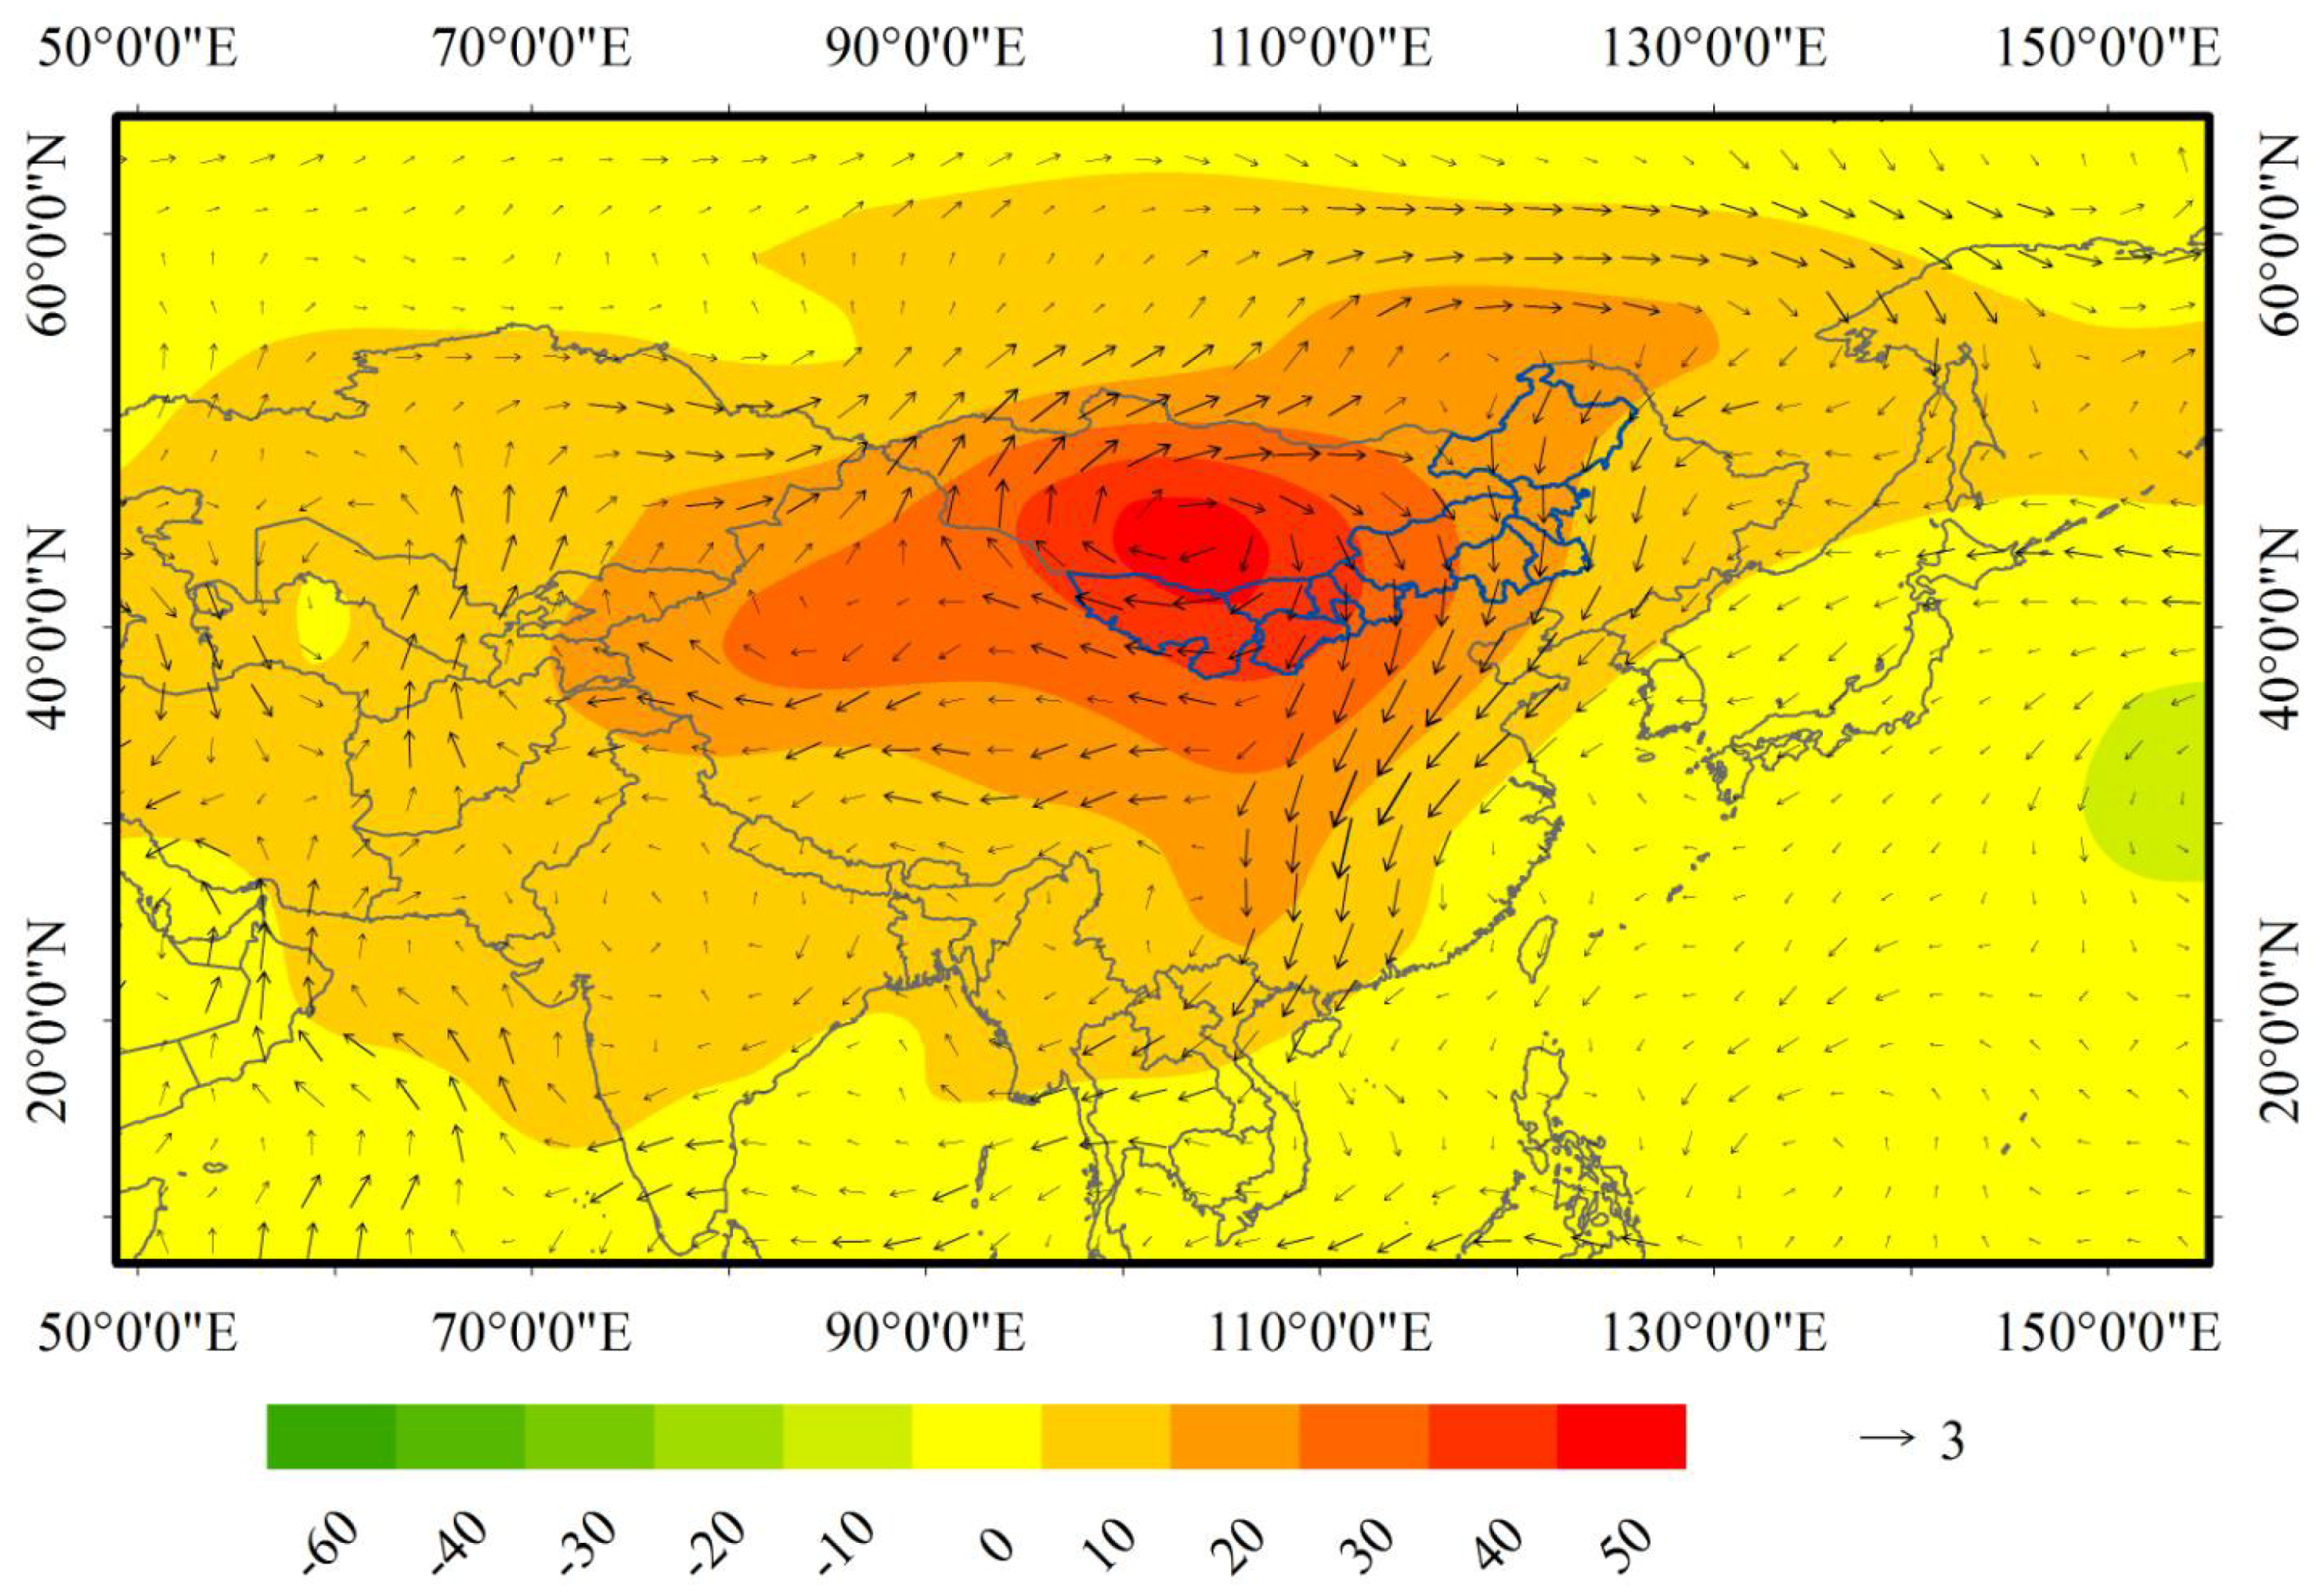
3.3.3. Topography and Atmospheric Factors

The characteristics of precipitation extremes, however, are highly spatially diverse due to the influence of complex topography [35]. The IMP is a long and narrow territory, which spans over 2400 km from west to east, with a strip of land sloping from northeast to southwest. Its climate differences from south to north are obvious. The Greater Khingan Mountains are on its northeast and the Ho-Lan Mountains are on the west. Yin Mountains run across the central portion of this province. It is difficult for the moisture to reach the study area due to its complex terrain [36]. Topography was an obvious impact factor on identifying precipitation extremes.
As one of the most important parts of the arid area in the northwest and the eastern margin of the arid area, the IMP is strongly influenced by the western-wind system and is also affected by the monsoon [37]. Previous research analysis found that the East Asian monsoon influences the spatial variation of extreme precipitation events [38]. Additionally, as the rainfall in IMP is mainly concentrated in the summer, this paper mainly discusses summer monsoons by creating atmospheric circulation composites in summer. Details can be found in Figure 4. The MK test based on the CDD during 1959–2014 and found 1983 as the abrupt year (p < 0.05), thus, these two periods represents the changed atmospheric circulation. The mean difference (new minus old) of wind vectors and geopotential height at 850 hPa between 1959–1982 (abrupt-before) and 1983–2014 (abrupt-after) in summer has been shown in Figure 4. From the view of geopotential height composite, there is an enhanced anticyclonic circulation developing over the Eurasian continent, and the Mongolian Plateau is the area with the largest differences. This result may prevent northward propagation of water vapor flux from the ocean, which can lead to decrease trends of precipitation extremes in IMP. At the view of wind vectors composite, it is crystal clear that northeasterly wind is enhanced during 1983–2014 as compared to 1959–1982, which indicates there is a weaker East Asian summer monsoon, and this can weaken the northward extension of the summer monsoon. Previous research has shown similar results [16,39,40]. The above analysis shows that most extreme precipitation indices in IMP has shown decreasing trends.

3.4. Influences of Precipitation Extremes on Agriculture in Inner Mongolian Plateau and Science-Based Future Policy-Making

3.4.1. Influences of Precipitation Extremes on Agriculture in Inner Mongolian Plateau

For the short term, taking CDD as an example, it shows obvious decreasing trends in the east-north area of IMP, while soft decreasing in west-southern, indicating that the western area of IMP should be paid more attention. Useful measures should be taken into the irrigation management in IMP based on the scattered distribution of water area (Figure 5), to ensure the water demand for crop or grass in the growing but extreme dry season and improved seeds which are more tolerant to weather extremes, such as drought. In Sub-Saharan Africa, one of the most frequently used adaptation strategies is to switch to crop varieties that are more resilient towards weather stress [41]. What is more, quality seeds of adapted and improved varieties are one of the cheapest yet fundamental technologies to raise agricultural productivity, secure food security, and foster economic development, reported by FAO [42]. Thus, another adaptation in IMP is developing improved-seeds because they are crucial in the adaption to critical climate conditions ensuring sufficient crop production, while they are not the only factor it is easy to control, particularly for farmland in the center area of IMP (Figure 5).
For the long term, based on the previous analysis, the results indicate that the duration of precipitation extremes in the IMP were decreasing due to various causal factors, while their decreases may result in wide fluctuation in soil water content with less plant available, in some periods. The available nutrients in the water are also changing, which can dramatically affect plants growth rate and even the distribution of plant types. For example, in Ordos Plateau, Stipa and Cynachum spp. (shallow roots and dependent on light rain events) have been replaced by Artemisia spp. (deeper roots and dependent on larger rain events) due to the occasional drought [43]. Vegetation competition could be changing, affecting the biomass of different kinds of forage grass and the nutritive composition of natural grassland [44]. Spatial differences of precipitation extremes in the IMP can indirectly lead to different livestock productivity by feeding different kinds of forage grass or as a result of changes in disease occurrence and in insect and weed populations [45]. This is resulting in income differences in the regional agricultural economy. Traditional livestock production is mainly based on grassland resources in IMP [46], which plays an important role in agriculture and animal husbandry. Twenty-six percent of the region’s gross domestic product (GDP) comes from agriculture and animal husbandry and 80% of the output value of agriculture and animal husbandry comes from animal husbandry [47]. Precipitation extremes have a close relationship with agriculture and animal husbandry and, thus, with the region’s economy.
As some data are not publicly accessible in China [48], only the output value of agriculture and animal husbandry from 1996 to 2014 were collected. Figure 6 indicates that from 1996 to 2014, the output value of agriculture and animal husbandry increased annually, the corresponding precipitation extremes showed a decrease trend based on the results in Figure 2. In detail, around 2000 and 2005 are the transition years. From 1996 to 2000, the gross output value of agriculture and animal husbandry change stably, and from 2001 to 2005 they increased slowly, while after 2005, they increased sharply. Among the extreme precipitation indices in Figure 2, the lower values were occurring in 2000 and 2005. Importantly, some precipitation indices increased after 2005, but the gross output value of agriculture and animal husbandry continued increasing, probably due to the livestock improvement in 2005 (http://www.zhengchang.com/html/hynews/article-906.htm). Additionally, the IMP is the key implementation province in the six large-scale ecological restoration programs from 2002 [6], such as the “Three-north Shelter-belt Forest Construction Project”, “Grain for Green Project”, “Beijing-Tianjin Sand Source Control Program”, and “Natural Forest Conservation Program”, which aim to protect and improve the ecological environment and ensure that the sustainable development of animal husbandry.
Based on the previous analysis, it is seen that during a decrease of precipitation extremes, the gross output value of agriculture and animal husbandry simultaneously increased. These results can indicate that the decreased precipitation extremes can result in the increase of gross output value of agriculture and animal husbandry. In addition, human activities such as livestock improvement and ecological restoration programs also contribute to the increase of gross output value of agriculture and animal husbandry. As far as the influence of precipitation extremes to agriculture in the area is concerned, the following features were identified:
*
Summer yields of crops such as wheat may be reduced.
*
The flexibility in respect of when crops are harvested may be reduced.
*
A potential increase in the tensions between the need to grow crops to attend food needs on the one hand, and to manage green areas on the other.
In addition, excess temperature and evapotranspiration are known to negatively influence yields [49]. Planting dates and varieties are also known to be influenced [50]. Bearing in mind that not all farmers on the IMP have access to the latest technologies, some of them are more vulnerable to the pressures posed by long dry spells and are more susceptible to extreme weather events. This, in turn, leads to a low degree of resilience to global environmental change.

3.4.2. Science Based Future Policy-Making for Grassland Protection

As earlier stated, grassland in the IMP is the basis of traditional livestock production [46]. Apart from this, it also plays an important ecological role, especially in its southern region, which is designated as the main body of the windbreak and sand fixation belt. Previous indications are that climate extremes are already having an effect on grassland, thereby increasing the need for research and programs to assist in adaptive decision making. Protecting grassland is necessary and urgent, particularly in the IMP where the climate is highly sensitive, and since it is the main livestock area. Suggestions for policy-making for grassland protection on the national and regional level may include the following elements:
*
Creating some new technologies to enhance the ability of healthy soils to regulate water resource dynamics is beneficial for maintenance of grass and livestock productivity under various conditions of precipitation extremes.
*
Encouraging farmers and ranchers to choose drought and heat stress-resistant crops and livestock to improve their ability to cope with precipitation extremes.
*
Multiple-benefit adaptation strategies should be recommended in regional planning, such as developing the resilience of grassland to precipitation extremes, promoting the development of sustainable agriculture.
*
Grassland protection and education promoting institutes should be built, since pastoralists in the IMP are the implement actors of grassland protection, but most of them are poorly educated.
*
Monitoring or even predicting the climate extremes, and then guiding herdsmen´s engagement in agricultural activities.
*
Adjust market demand to encourage herdsmen to transfer from grazing to ecotourism for their livelihoods.
In addition, some suggestions for policy-making for grassland protection on the herdsmen level are:
*
Improving their awareness of environmental protection.
*
Strictly controlling the number of livestock according to coordinated development between grass and livestock.
*
Monitoring and recording climate extremes effects on the grassland and livestock productivity, which is the basis for the future research.
The full value of the findings presented in this paper can be better assessed if the data from this study are placed in a wider context and benchmarked along with other micro-level studies on the IMP. The added value of the current research is the analysis of the impacts of extreme precipitations to the IMP. Understanding how precipitation extremes are influenced by climate changes may require further studies into a wider context. This shows that much could be gained by identifying ways to incorporate local knowledge into farming practices.

4. Conclusions

Extreme precipitation events have seriously influenced our environment and society. This study analyzed changes in precipitation extreme indices in the IMP, based on daily precipitation series for the period 1959–2014. The data were quality controlled by software RClimDex1.1 and homogenized using RHtest V4 software. Many stations were excluded from the study due to inhomogeneity. Nevertheless, the study could improve the understanding of recent spatial-temporal changes in extreme climate events in the IMP via systematic analysis of the extremes precipitation indices. The following changes in precipitation indices were observed throughout the study area:
(a)
Temporally, all precipitation extremes, except R0.5, R10, and PRCPTOT, decreased in the IMP between 1959 and 2014, and most of the changes were non-significant. Compared with the other wet and decreased indices, the dry index decreases with larger magnitude, which indicate that the IMP will be dominated by less dry conditions during the study interval.
(b)
Spatially, precipitation extremes showed spatial differences, and the dry area, such as the western area of IMP, would become slightly wetness by suffering more extreme precipitation.
Not only longitude and latitude have strong relationships with precipitation extremes significantly in the IMP. Elevation is also one important impact factor, and with altitude, longitude and elevation increasing, all extreme precipitation indices increase except CDD. In addition, atmospheric circulation and topography may be another primary reason which results in the spatial variation characteristics in precipitation extremes over the IMP.
Decreased precipitation extremes, and human activities such as livestock improvement and ecological restoration programs may result in the increase of gross output value of agriculture and animal husbandry in the IMP.
Furthermore, more science-based policy-making for grassland protection is needed and should be put forward on the national and regional scales, also involving herdsmen.
Finally, more detailed studies are still needed to fully understand the underlying mechanisms of the temporal and spatial changes in precipitation extremes over the IMP, so as to allow them to be handled in a more systematic way.

Author Contributions

All authors contributed to the analysis and to writing the paper.

Funding

This research was funded by the National Natural Science Foundation of China (Grant No.41671095, 51761135024, 61631011), and the National Key Research and Development Program of China (No.2017YFE0107400) and the Financial Fund Planning Project in Inner Mongolian (Grant No. 2018-ZME-KJXT-14).

Acknowledgments

All authors thank the three anonymous reviewers and the editor for the constructive comments on the earlier version of the manuscript.

Conflicts of Interest

The authors declare no conflict of interest.

References

  1. Holmgren, M.; Stapp, P.; Dickman, C.R.; Gracia, C.; Graham, S.; Gutiérrez, J.R.; Hice, C.; Jaksic, F.; Kelt, D.A.; Letnic, M.; et al. Extreme climatic events shape arid and semiarid ecosystems. Front. Ecol. Environ. 2006, 4, 87–95. [Google Scholar] [CrossRef]
  2. Wallace, J.M.; Held, I.M.; Thompson, D.W.J.; Trenberth, K.E.; Walsh, J.E. Global warming and winter weather. Science 2014, 343, 729–730. [Google Scholar] [CrossRef] [PubMed]
  3. Tao, H.; Fraedrich, K.; Menz, C. Trends in extreme temperature indices in the Poyang lake basin, China. Stoch. Environ. Res. Risk Assess. 2014, 28, 1543–1553. [Google Scholar] [CrossRef]
  4. Moberg, A.; Jones, P.D. Trends in indices for extremes in daily temperature and precipitation in central and western Europe. Int. J. Climatol. 2005, 25, 1149–1171. [Google Scholar] [CrossRef]
  5. CBBCC. China’s Blue Book of Climate Change. Available online: http://www.ccchina.org.cn/ (accessed on 3 April 2018).
  6. Tian, H.J.; Cao, C.X.; Chen, W.; Bao, S.; Yang, B.; Myneni, R.B. Response of vegetation activity dynamic to climatic change and ecological restoration programs in Inner Mongolian from 2000 and 2012. Ecol. Eng. 2015, 82, 276–289. [Google Scholar] [CrossRef]
  7. FYPACC. The 13th Five-Year Plan for Addressing Climate Change in Inner Mongolian Autonomous Region. Available online: http://www.nmg.gov.cn/ (accessed on 21 April 2018).
  8. Liu, M. China’s Grassland Policies and the Inner Mongoliann Grassland System. Ph.D. Thesis, Wageningen University, Wageningen, The Netherlands, 2017. [Google Scholar]
  9. Wu, J.; Zhang, Q.; Li, A.; Liang, C. Historical landscape dynamics of Inner Mongolian: Patterns, drivers, and impacts. Landsc. Ecol. 2015, 30, 1579–1598. [Google Scholar] [CrossRef]
  10. Kemp, D. Adapting to Climate Change in the Grasslands of Inner Mongolian, China. 2013. Available online: http://www.fao.org/nr/sustainability/sustainability-and-livestock/database/projects-detail/en/c/268937/ (accessed on 21 April 2018).
  11. IPBES (Intergovernmental Science-Policy Platform on Biodiversity and Ecosystems). Summary for Policymakers of the Thematic Assessment Report on Land Degradation and Restoration of the Intergovernmental Science-Policy Platform on Biodiversity and Ecosystem Services; Scholes, R., Montanarella, L., Brainich, A., Barger, N., Brink, B.T., Cantele, M., Erasmus, B., Fisher, J., Gardner, T., Holland, T.G., et al., Eds.; IPBES Secretariat: Bonn, Germany, 2018. [Google Scholar]
  12. Conte, T.J. The effects of China’s grassland contract policy on Mongoliann herders’ attitudes towards grassland management in northeastern Inner Mongolian. J. Political Ecol. 2015, 22, 79–97. [Google Scholar] [CrossRef]
  13. Marmai, N. Farmers’ Investments in Innovative Technologies in Times of Precipitation Extremes: A Statistical Analysis for Rural Tanzania; Working Papers 201617; Department of Economics and Statistics Cognetti de Martiis, University of Turin: Turin, Italy, 2016. [Google Scholar]
  14. Komba, C.; Muchapondwa, E. Adaptation to Climate Change by Smallholder Farmers in Tanzania; Working Paper; Agricultural Adaptation to Climate Change in Africa, Economic Research Southern Africa (ERSA): Cape Town, South Africa, 2012; p. 299. [Google Scholar]
  15. Xin, L.J.; Li, X.B.; Tan, M.H.; Wang, Z. Spatial and temporal variability in grassland Net Primary Production (NPP) in the Inner Mongolian sand-control belt from 2000 to 2010. Arid Zone Res. 2015, 32, 585–591. [Google Scholar]
  16. Gao, T.; Shi, X.H. Spatial-temporal characteristics of extreme precipitation events during 1951–2011 in Shandong, China and possible connection to the large scale atmospheric circulation. Stoch. Environ. Res. Risk Assess. 2016, 30, 1421–1440. [Google Scholar] [CrossRef]
  17. Zhang, B.; Zhu, J.J.; Liu, H.M.; Pan, Q.M. Effects of extreme rainfall and drought events on grassland ecosystems. Chin. J. Plant Ecol. 2014, 38, 1008–1018. [Google Scholar]
  18. Bloor, J.M.; Bardgett, R.D. Stability of above-ground and below-ground processes to extreme drought in model grassland ecosystems: Interactions with plant species diversity and soil nitrogen availability. Perspect. Plant Ecol. Evol. Syst. 2012, 14, 193–204. [Google Scholar] [CrossRef]
  19. Chen, S.P.; Bai, Y.F.; Han, X.G.; An, J.L.; Guo, C.F. Variations in foliar carbon isotope composition and adaptive strategies of Carex korshinskyi along a soil moisture gradient. Acta Phytoecol. Sin. 2004, 28, 515–522. [Google Scholar]
  20. Yan, H.M.; Chen, W.H.; Yang, F.X.; Liu, J.Y.; Hu, Y.F.; Ji, Y.Z. The spatial and temporal analysis of extreme climatic events in Inner Mongolia during the past 50 years. Geophys. Res. 2014, 33, 13–22. [Google Scholar]
  21. You, L.; Dai, X.G.; Zhang, Y. Extreme precipitation events in Inner Mongolian in 1961–2008. Adv. Clim. Chang. Res. 2010, 6, 411–416. [Google Scholar]
  22. You, L.; Dai, X.G.; Gu, Y.; Chen, T.Z.; Li, H.Y.; Ding, X.H. Variation of winter cold/warm events and general circulation anomaly over Inner Mongolian in recent 50 years. Arid Zone Res. 2014, 31, 244–249. [Google Scholar]
  23. Liu, J.Y. The Study on the Changes of Extreme Climate Events in Recent Forty-Three Years in Inner Mongolian Regions. Master’s Thesis, Inner Mongolian University, Hohhot, Inner Mongolia, China, 2014. [Google Scholar]
  24. Hyndman, R.; Fan, Y. Sample quantiles in statistical packages. Am. Stat. 1996, 50, 361–367. [Google Scholar]
  25. Zhang, X.; Hegel, G.; Zwiers, F. Avoiding inhomogeneity in percentile-based indices of temperature extremes. J. Clim. 2005, 18, 1641–1651. [Google Scholar] [CrossRef]
  26. Wang, X.L.; Wen, Q.H.; Wu, Y. Penalized maximal t test for detecting undocumented mean change in climate data series. J. Appl. Meteorol. Climatol. 2007, 46, 916–931. [Google Scholar] [CrossRef]
  27. Wang, X.L. Accounting for autocorrelation in detecting mean-shifts in climate data series using the penalized maximal t or F test. J. Appl. Meteorol. Climatol. 2008, 47, 2423–2444. [Google Scholar] [CrossRef]
  28. Karl, T.R.; Nicholls, N.; Ghazi, A. Clivar/GCOS/WMO Workshop on Indices and Indicators for Climate Extremes Workshop Summary. In Weather and Climate Extremes; Karl, T.R., Nicholls, N., Ghazi, A., Eds.; Springer: Dordrecht, The Netherlands, 1999; pp. 3–7. [Google Scholar]
  29. Peterson, T.C.; Folland, C.; Gruza, G.; Hogg, W.; Mokssit, A.; Plummer, N. Report on the Activities of the Working Group on Climate Change Detection and Related Rapporteurs 1998–2001; World Meteorological Organisation Report, WCDMP-47, WMO-TD 1071; World Meteorological Organization: Geneva, Switzerland, 2001. [Google Scholar]
  30. Sedra, A.; Smith, K.C. Microelectronic Circuits, 3rd ed.; Saunders College Publishing: New York, NY, USA, 1991; p. 459. [Google Scholar]
  31. IPCC. Summary for Policy makers. In Managing the Risks of Extreme Events and Disasters to Advance Climate Change Adaptation; A Special Report of Working Groups I and II of the Intergovernmental Panel on Climate Change; Field, C.B., Barros, V., Stocker, T.F., Qin, D., Dokken, D.J., Ebi, K.L., Mastrandrea, M.D., Mach, K.J., Plattner, G.-K., Allen, S.K., et al., Eds.; Cambridge University Press: Cambridge, UK; New York, NY, USA, 2012. [Google Scholar]
  32. Lian, L.S.; Xu, S.J.; Li, Z.F.; Sun, X.Y. Spatial-temporal variation of extreme precipitation events in Northwest China during 1961–2010. Meteorol. Environ. Res. 2014, 5, 12–19, 23. [Google Scholar]
  33. Li, C.L.; Wang, J.; Hu, R.; Yin, S.; Bao, Y.; Ayal, D.Y. Relationship between vegetation change and extreme climate indices on the Inner Mongolian Plateau, China, from 1982 to 2013. Ecol. Indic. 2018, 89, 101–109. [Google Scholar] [CrossRef]
  34. Wang, H.X.; Liu, X.N.; Guo, J.; Ren, Z.C.; Wang, F.P.; Pan, D.R. Improvement of AMMRR interpolation and application in CSCS classification of Inner Mongolian grassland. Chin. J. Eco-Agric. 2013, 21, 904–912. [Google Scholar] [CrossRef]
  35. Huang, J.; Sun, S.L.; Zhang, J.C. Detection of trends in precipitation during 1960–2008 in Jiangxi province, southeast China. Theor. Appl. Climatol. 2013, 14, 237–251. [Google Scholar] [CrossRef]
  36. Huang, J.; Sun, S.L.; Xue, Y.; Zhang, J. Changing characteristics of precipitation during 1960–2012 in Inner Mongolian, northern China. Meteorol. Atmos. Phys. 2015, 127, 257–271. [Google Scholar] [CrossRef]
  37. Li, W.B.; Li, C.Y.; Liu, Z.J.; Han, D.G.; Sun, P.F.; Jiang, H.X. Distribution of precipitation and its effect factors analysis in the central and western regions of Inner Mongolia during the last 60 years. J. Inner Mong. Agric. Univ. (Nat. Sci. Ed.) 2015, 36, 84–94. [Google Scholar]
  38. Wang, B.L.; Zhang, M.J.; Wei, J.L.; Wang, S.J.; Li, X.F.; Li, S.S.; Zhao, A.F.; Li, X.S.; Fan, J.P. Changes in extreme precipitation over Northeast China, 1960–2011. Quat. Int. 2013, 298, 177–185. [Google Scholar] [CrossRef]
  39. Feng, Q.; Li, Z.X.; Liu, W.; Li, J.; Guo, X.; Wang, T. Relationship between large scale atmospheric circulation, temperature and precipitation in the Extensive Hexi region, China, 1960–2011. Quat. Int. 2016, 392, 187–196. [Google Scholar] [CrossRef]
  40. Wen, X.H.; Wu, X.Q.; Gao, M. Spatiotemporal variability of temperature and precipitation in Gansu Province (Northwest China) during 1951–2015. Atmos. Res. 2017, 197, 132–149. [Google Scholar] [CrossRef]
  41. Fisher, M.; Abate, T.; Lunduka, R.W.; Asnake, W.; Alemayehu, Y.; Madulu, R.B. Drought tolerant maize for farmer adaptation to drought in sub-Saharan Africa: Determinants of adoption in eastern and southern Africa. Clim. Chang. 2015, 133, 283–299. [Google Scholar] [CrossRef] [Green Version]
  42. FAO. World Seed Project. 2016. Available online: http://www.un.org/en/ecosoc/julyhls/pdf13/imp_forum_fao.pdf (accessed on 23 July 2016).
  43. Cheng, X.; An, S.; Chen, J.; Li, B.; Liu, Y.; Liu, S. Spatial relationships among species, above-ground biomass, N and P in degraded grassland in Ordos Plateau, northwest China. J. Arid Environ. 2007, 68, 652–667. [Google Scholar] [CrossRef]
  44. Zhang, B.C.; Cao, J.J.; Bai, Y.F.; Deng, Z.S.; Fu, Y.; Ning, Z.G. Climate impact to nutrient change in dominant forage nature grassland in Qinghai Lake. J. Arid Land Resour. Environ. 2011, 25, 127–130. [Google Scholar]
  45. Walthall, C.L.; Hatfield, J.; Backlund, P.; Hauser, R.; Lengnick, L.; Marshall, E.; Walsh, M. USDA Climate Change and U.S. Agriculture—An Assessment of Effects and Adaptation Responses. 2013. Available online: https://www.usda.gov/oce/climate_change/effects_2012/effects_agriculture.htm (accessed on 21 April 2018).
  46. Angerer, J.; Han, G.; Fujisaki, I.; Havstad, K. Climate Change and Ecosystems of Asia with Emphasis on Inner Mongolian and Mongolian. Rangelands 2008, 30, 46–51. [Google Scholar] [CrossRef]
  47. Li, C.L.; Walter, L.F.; Yin, J.; Yin, J.; Hu, R.; Wang, J.; Yang, C.; Yin, S.; Bao, Y.; Ayal, D.Y. Assessing vegetation response to multi-time-scale drought across Inner Mongolian plateau. J. Clean. Prod. 2018, 179, 210–216. [Google Scholar] [CrossRef]
  48. Li, C.L.; Wang, J.; Hu, H.; Yin, S.; Bao, Y.; Li, Y. ICESat/GLAS-derived changes in the water level of Hulun Lake, Inner Mongolian, from 2003 to 2009. Front. Earth Sci. 2018, 12, 420–430. [Google Scholar] [CrossRef]
  49. Leal Filho, W.; Esilaba, A.O.; Rao, K.P.C.; Sridhar, G. (Eds.) Adapting African Agriculture to Climate Change; Springer: Berlin, Germany, 2015; p. 233. [Google Scholar]
  50. Arefi, I.H.; Saffari, M.; Moradi, R. Evaluating planting date and variety management strategies for adapting winter wheat to climate change impacts in arid regions. Int. J. Clim. Chang. Strateg. Manag. 2017, 9, 846–863. [Google Scholar] [CrossRef]
Figure 1. Annual mean precipitation in the Inner Mongolian Plateau (IMP) and the distribution of the 43 selected stations.
Atmosphere 09 00322 g001
Figure 2. Averaged regional trends for precipitation indices during 1959–2014 in the IMP: The dot line and bold solid lines are time series smoothed by a low-pass filter and linear trend, respectively.
Atmosphere 09 00322 g002aAtmosphere 09 00322 g002b
Figure 3. Spatial variation of extreme precipitation indices in the IMP during 1959–2014.
Atmosphere 09 00322 g003aAtmosphere 09 00322 g003b
Figure 4. Difference of wind vectors and geopotential height at 850 hPa in summer between 1959–1982 (abrupt-before) and 1983–2014 (abrupt-after).
Atmosphere 09 00322 g004
Figure 5. Land use in Inner Mongolian Plateau.
Atmosphere 09 00322 g005
Figure 6. Gross output value of agriculture and animal husbandry in the IMP from 1996 to 2014.
Atmosphere 09 00322 g006
Table 1. Precipitation indices selected for this study with indicator names, definitions, and units.
IDIndicator NameDefinitionsUnits
Rx1dayMax 1-day precipitation amountMonthly maximum 1-day precipitationmm
Rx5dayMax 5-day precipitation amountMonthly maximum consecutive 5-day precipitationmm
SDIISimple daily intensity indexAnnual total precipitation divided by the number of wet days (defined as PRCP ≧ 1.0 mm) in the yearmm/day
R10Number of heavy precipitation daysAnnual count of days when PRCP ≧ 10 mmday
R20Number of very heavy precipitation daysAnnual count of days when PRCP ≧ 20 mmday
R0.5Number of days above 0.5 mmAnnual count of days when PRCP ≧ 0.5 mm, nn is user defined thresholdday
CDDConsecutive dry daysMaximum number of consecutive days with RR < 1 mmday
CWDConsecutive wet daysMaximum number of consecutive days with RR ≧ 1 mmday
R95pVery wet days precipitationAnnual total PRCP when RR > 95th percentilemm
R99pExtremely wet days precipitationAnnual total PRCP when RR > 99th percentilemm
PRCPTOTAnnual total wet-day precipitationAnnual total PRCP in wet days (RR ≧ 1 mm)mm
Table 2. Correlation between extreme precipitation indices and elevation, longitude, and latitude.
Elevation (m)Longitude (°E)latitude (°N)
CDDY = 0.006X + 127.275 (R2 = 0.008)Y = −2.813X + 454.084 (R2 = 0.401)Y = −3.302X + 277.547 (R2 = 0.156)
CWDY = −0.001X + 4.804 (R2 = 0.160)Y = 0.133X − 11.414 (R2 = 0.677)Y = 0.194X − 4.686 (R2 = 0.403)
PRCPTOTY = −0.127X + 397.961 (R2 = 0.235)Y = 14.781X − 1418.928 (R2 = 0.683)Y = 16.112X − 437.14 (R2 = 0.228)
R10Y = −0.004X + 12.128 (R2 = 0.227)Y = 0.474X − 46.146 (R2 = 0.661)Y = 0.532X − 15.327 (R2 = 0.234)
R20Y = −0.002X + 4.965 (R2 = 0.340)Y = 0.193X − 19.276 (R2 = 0.605)Y = 0.187X − 5.424 (R2 = 0.160)
R0.5Y = −0.010X + 56.619 (R2 = 0.068)Y = 1.90X − 171.385 (R2 = 0.491)Y = 2.952X − 83.627 (R2 = 0.334)
R95pY = −0.037X + 105.288 (R2 = 0.288)Y = 3.797X − 365.455 (R2 = 0.663)Y = 3.840X − 100.107 (R2 = 0.191)
R99pY = −0.010X + 31.034 (R2 = 0.194)Y = 1.090X − 103.515 (R2 = 0.518)Y = 0.965X − 21.372 (R2 = 0.114)
RX1dayY = −0.015X + 52.573 (R2 = 0.285)Y = 1.380X − 119.845 (R2 = 0.539)Y = 0.936X − 3.325 (R2 = 0.070)
RX5dayY = −0.027X + 84.237 (R2 = 0.329)Y = 2.574X − 236.854 (R2 = 0.646)Y = 2.295X − 43.493 (R2 = 0.145)
SDIIY = −0.001X + 8.494 (R2 = 0.200)Y = 0.151X−10.279 (R2 = 0.422)Y = 0.071X + 3.801 (R2 = 0.026)
Table 3. Correlations between precipitation indices and annual total precipitation in the IMP during 1959–2014.
IndicesCDDCWDPRCPTOTR10R20R0.5R95pR99pRx1dayRx5daySDII
Annual total precipitation−0.737 **0.892 **0.998 **0.995 **0.939 **0.770 **0.975 **0.886 **0.875 **0.937 **0.802 **
Note: ** represent significant at 0.01 level, respectively.

