Review

The Concept of Large-Scale Conditioning of Climate Model Simulations of Atmospheric Coastal Dynamics: Current State and Perspectives

1
Institute of Coastal Research, Helmholz-Zentrum Geesthacht, 21502 Geesthacht, Germany
2
School of Earth Sciences, University of Melbourne, 3010 Melbourne, Australia
3
Key Laboratory of Ocean Circulation and Waves, Institute of Oceanology, Chinese Academy of Sciences, Qingdao 266071, China
*
Author to whom correspondence should be addressed.
Atmosphere 2018, 9(9), 337; https://doi.org/10.3390/atmos9090337
Submission received: 26 July 2018 / Revised: 21 August 2018 / Accepted: 23 August 2018 / Published: 27 August 2018
(This article belongs to the Special Issue Storms, Jets and Other Meteorological Phenomena in Coastal Seas)

Abstract

:
We review the state of dynamical downscaling with scale-constrained regional and global models. The methodology, in particular spectral nudging, has become a routine and well-researched tool for hindcasting climatologies of sub-synoptic atmospheric disturbances in coastal regions. At present, the spectrum of applications is expanding to other phenomena, but also to ocean dynamics and to extended forecasting. Additionally, new diagnostic challenges are appearing such as spatial characteristics of small-scale phenomena such as Low Level Jets.

1. Introduction

Polar Lows, Medicanes, Coastal Low levels Jets, and other meso-scale storm phenomena represent significant cases of dangerous weather phenomena. Large-scale atmospheric dynamical state shapes the occurrences and features of such events. They are particularly prevalent and energetic above coastal waters, so that for planning coastal infrastructure as well as offshore activity, knowledge about the statistics, including extreme value statistics, is needed. Because of the large-scale conditioning, such statistics vary in time, reflecting not only decadal variability but also long-term climate change.
Deriving such statistics represents a challenge not only because of the size of such disturbances, but also because of the changing quality and density of the observational basis. Satellite products provide a good source of data (e.g., Reference [1]) but working with them is labor-intensive, and statistics based on such data may be compromised by subjective choices and the limited lifetimes of different satellites.
An alternative approach of processing is dynamical downscaling, which extrapolates in the state space from large to smaller scales. A climatology of Polar Lows over the North Atlantic was obtained by implementing this method [2], and later of Polar Lows over the North Pacific [3], of Medicanes over the Mediterranean Sea [4], of Tropical Cyclones over the Northwestern Pacific [5], and of Coastal Low Level Jets in the Bohai/Yellow sea region [6]. The methodology has matured now and is routinely used in many applications—mainly for deriving atmospheric states in the past decades.
We review past developments, address the present state and prospects of such approaches, with simulating dynamical properties of small-scale cyclones like Polar Lows (e.g., Reference [7]), and the possibility of implementing such methodology in global models [8].

2. Simulating Small Synoptic Features Conditioned by the Large-Scale State Constraining by Spectral Nudging

The idea to constrain regional dynamical models to follow the large-scale trajectory provided by weather analysis scheme, was introduced into atmospheric sciences in the 1990s. Earlier methods involved nudging spatial means [9,10,11]; Waldron et al. [12] (1996) introduced the term “spectral nudging” into weather forecasting contexts, and [13], independently of the earlier work, suggested and tested the usage in climate simulations, extended to seasonal and decadal timescales. Later contributions and tests were provided by Reference [14].
The basic idea is related to the downscaling-concept, according to which the large-sale state together with smaller scale physiographic details, such as mountain ranges or coastal configurations, would condition the smaller scale dynamical state. Originally, the concept was introduced as an empirical variant (e.g., Reference [15]), while simulations with limited area models were later recognized as representing a dynamical variant of downscaling (e.g., Reference [16]). In a strict sense, however, limited area modelling employing the conventional boundary forcing does not induce consistent smaller scales by processing large-scale states. Instead, the states along the narrow strips along the lateral boundaries of the considered region are processed in the spirit of boundary value problems, even if it is known that in this case this mathematical concept is not well posed [17,18,19,20].
This changed when a constraining of the larger scales was introduced. Trigonometric expansions, cosine expansions [21], and also spherical harmonics expansion allow the needed separation of scales. “Nudging terms” were added to the equations, which penalize deviations from a given state on large scales, but leave small scales unconstrained.
Constraining the large scales in a model simulation represents a kind of data assimilation (e.g., Reference [22]), but in a different manner than conventionally done. In data assimilation, two equations are formulated, “the state space equation” describing the forward development of the systems trajectory, and “the observation equations”, which relates observables to state variables in the state space equation. Both equations represent a kind of knowledge, namely theoretical knowledge, about the system (the dynamics in the state space) and empirical knowledge (the observed quantities); both types of knowledge are incomplete, and the two equations are integrated forward in tandem for combining the two types of knowledge efficiently. First, the state space equation is used to estimate the future state; this suggested state is then transformed into an observable using the observation equation. Eventually, the estimated future state is corrected by a term proportional to the difference of the actual observable and the estimated observable—and so forth. In most cases, the observables are local observations, but in the case of downscaling it is the large-scale state, e.g., states in a coordinate system spanned by orthogonal functions sorted according to scale. The assumption is that the driving coarse resolution data is of satisfactory quality for large scales; thus the dynamical model (featured in the state space equation) is supposed to follow these states closely, while it is asked to provide additional details for those smaller scales, where the coarse resolution data are considered to need improvement.
Figure 1 illustrates the success in a spectrally constrained three-months simulation. The curves describe the similarity of the state of the driving reanalysis (here: National Centers for Environmental Prediction/National Center for Atmospheric Research (NCEP/NCAR) reanalysis; there are of course various other reanalyses, but this one has the advantage of being built for many more decades than more recent reanalyses, and is based on four-dimensional data throughout) and the constrained limited area model simulations (here: REMO regional model). A similarity value of 1 indicates full representation of the reanalysis by the limited area model. The two upper curves show the similarity of the large scales in a constrained run and another free run. Obviously, the constrained simulation follows the trajectory of the reanalysis closely, whereas the free run intermittently simulates significant deviations (for details, refer to Reference [13]). The lower two curves show the same similarity measure but for medium scales (medium scales are here: all non-large scales, excluding the smallest scales affected by the truncation of the finite grids). In both, the constrained and unconstrained simulation the deviation from the global re-analyses is large, which indicates that the limited area model is generating additional details on such scales. That this additional detail is indeed realistic, and thus represents an added value over the re-analysis was shown by Feser et al. [23].
When the simulation region is large (such as all of contiguous US), the improvements can be dramatic [24] but when the region is small then the effect becomes insignificant [25]. Obviously, such developments are more likely, when the region is farther away from the boundaries because of the large constraints they involve.
Sometimes, the argument is brought forward that such a correction would violate principles of conservation, e.g., mass or momentum. This is indeed true, but accepted in all reanalyses schemes; also the violations are not large, when employed regularly, and the systems are not closed, at least in terms of energy and momentum.
Obviously, a number of choices have to be made when implementing the spectral nudging method in particular referring to the variables, the intensity of the nudging, conditional upon wave length and height, frequency of spectral nudging; in the classical paper by von Storch et al. [13], the variables were the two components of the wind above 850 hPa (so that surface details are permitted to influence the lower part of the atmosphere, with less and less influence higher up in the troposphere and stratosphere). Several sensitivity experiments have been conducted since then, for instance by Alexandru et al. [26], Omrani et al. [27], Kang et al. [28], Miguez-Macho et al. [14,29], Park et al. [30], Radu et al. [31], Ramzan et al. [32], and Tang et al. [33]. Schubert-Frisius et al. [34] extensively tested different settings for employing spectral nudging in a global model (see Section 4).
In most applications, the method is used to downscale reanalysis—in particular the NCEP/NCAR reanalysis, which has covered the globe since 1948 and has the advantage of providing multi-decadal histories of weather. Its grid resolution is about 210 km. It certainly suffers from inhomogeneities, in particular the advent of globally covering satellites which represented a major change outside of some well-observed regions mostly in Europe and North America. Another popular data set is ERA-Interim from the European Centre for Medium-range Weather Forecasts, which has been available since 1979, with a considerably higher grid resolution (of about 80 km). In recent years, further reanalyses such as the NCEP Coupled Forecast System Reanalysis CFSR and the National Aeronautics and Space Administration Modern Era Retrospective-analysis for Research and Applications MERRA2 entered the “market”, usually covering the satellite era (post-1979), with resolutions of about 0.5° (in detail, c.f. https://climatedataguide.ucar.edu/).
Generally, the global reanalyses are not homogeneous, since the observational data, which are processed in the (frozen) analysis-schemes, are non-stationary in terms of coverage, density, and quality. However, the development of the large-scale features of the atmospheric dynamics, are plausibly homogenous, because less data are needed to determine their state. Thus, the spectral nudging method employs a qualitatively stationary part of the reanalysis, and determines a consistent and homogeneous addition to the reanalyses.
Besides spectral nudging, there is also another nudging technique, which forces a simulation to follow a given trajectory in phase space, namely “grid nudging” or “analysis nudging”. Obviously such a constraint is limiting the development of the state much more than that of selective nudging, since not only the large scales, which are supposed to be less affected by the finite grid resolution, but all scales, including those heavily affected by the grid truncation and the interrupted energy cascade, are affected. A number of studies have considered the two techniques (e.g., References [35,36,37]). The latter, the grid-point ansatz, is useful when sub-grid-scale processes are examined and fitted, while for hindcasting spectral nudging is to be preferred, as it allows improved small-scale dynamics and better descriptions of physiographic detail.

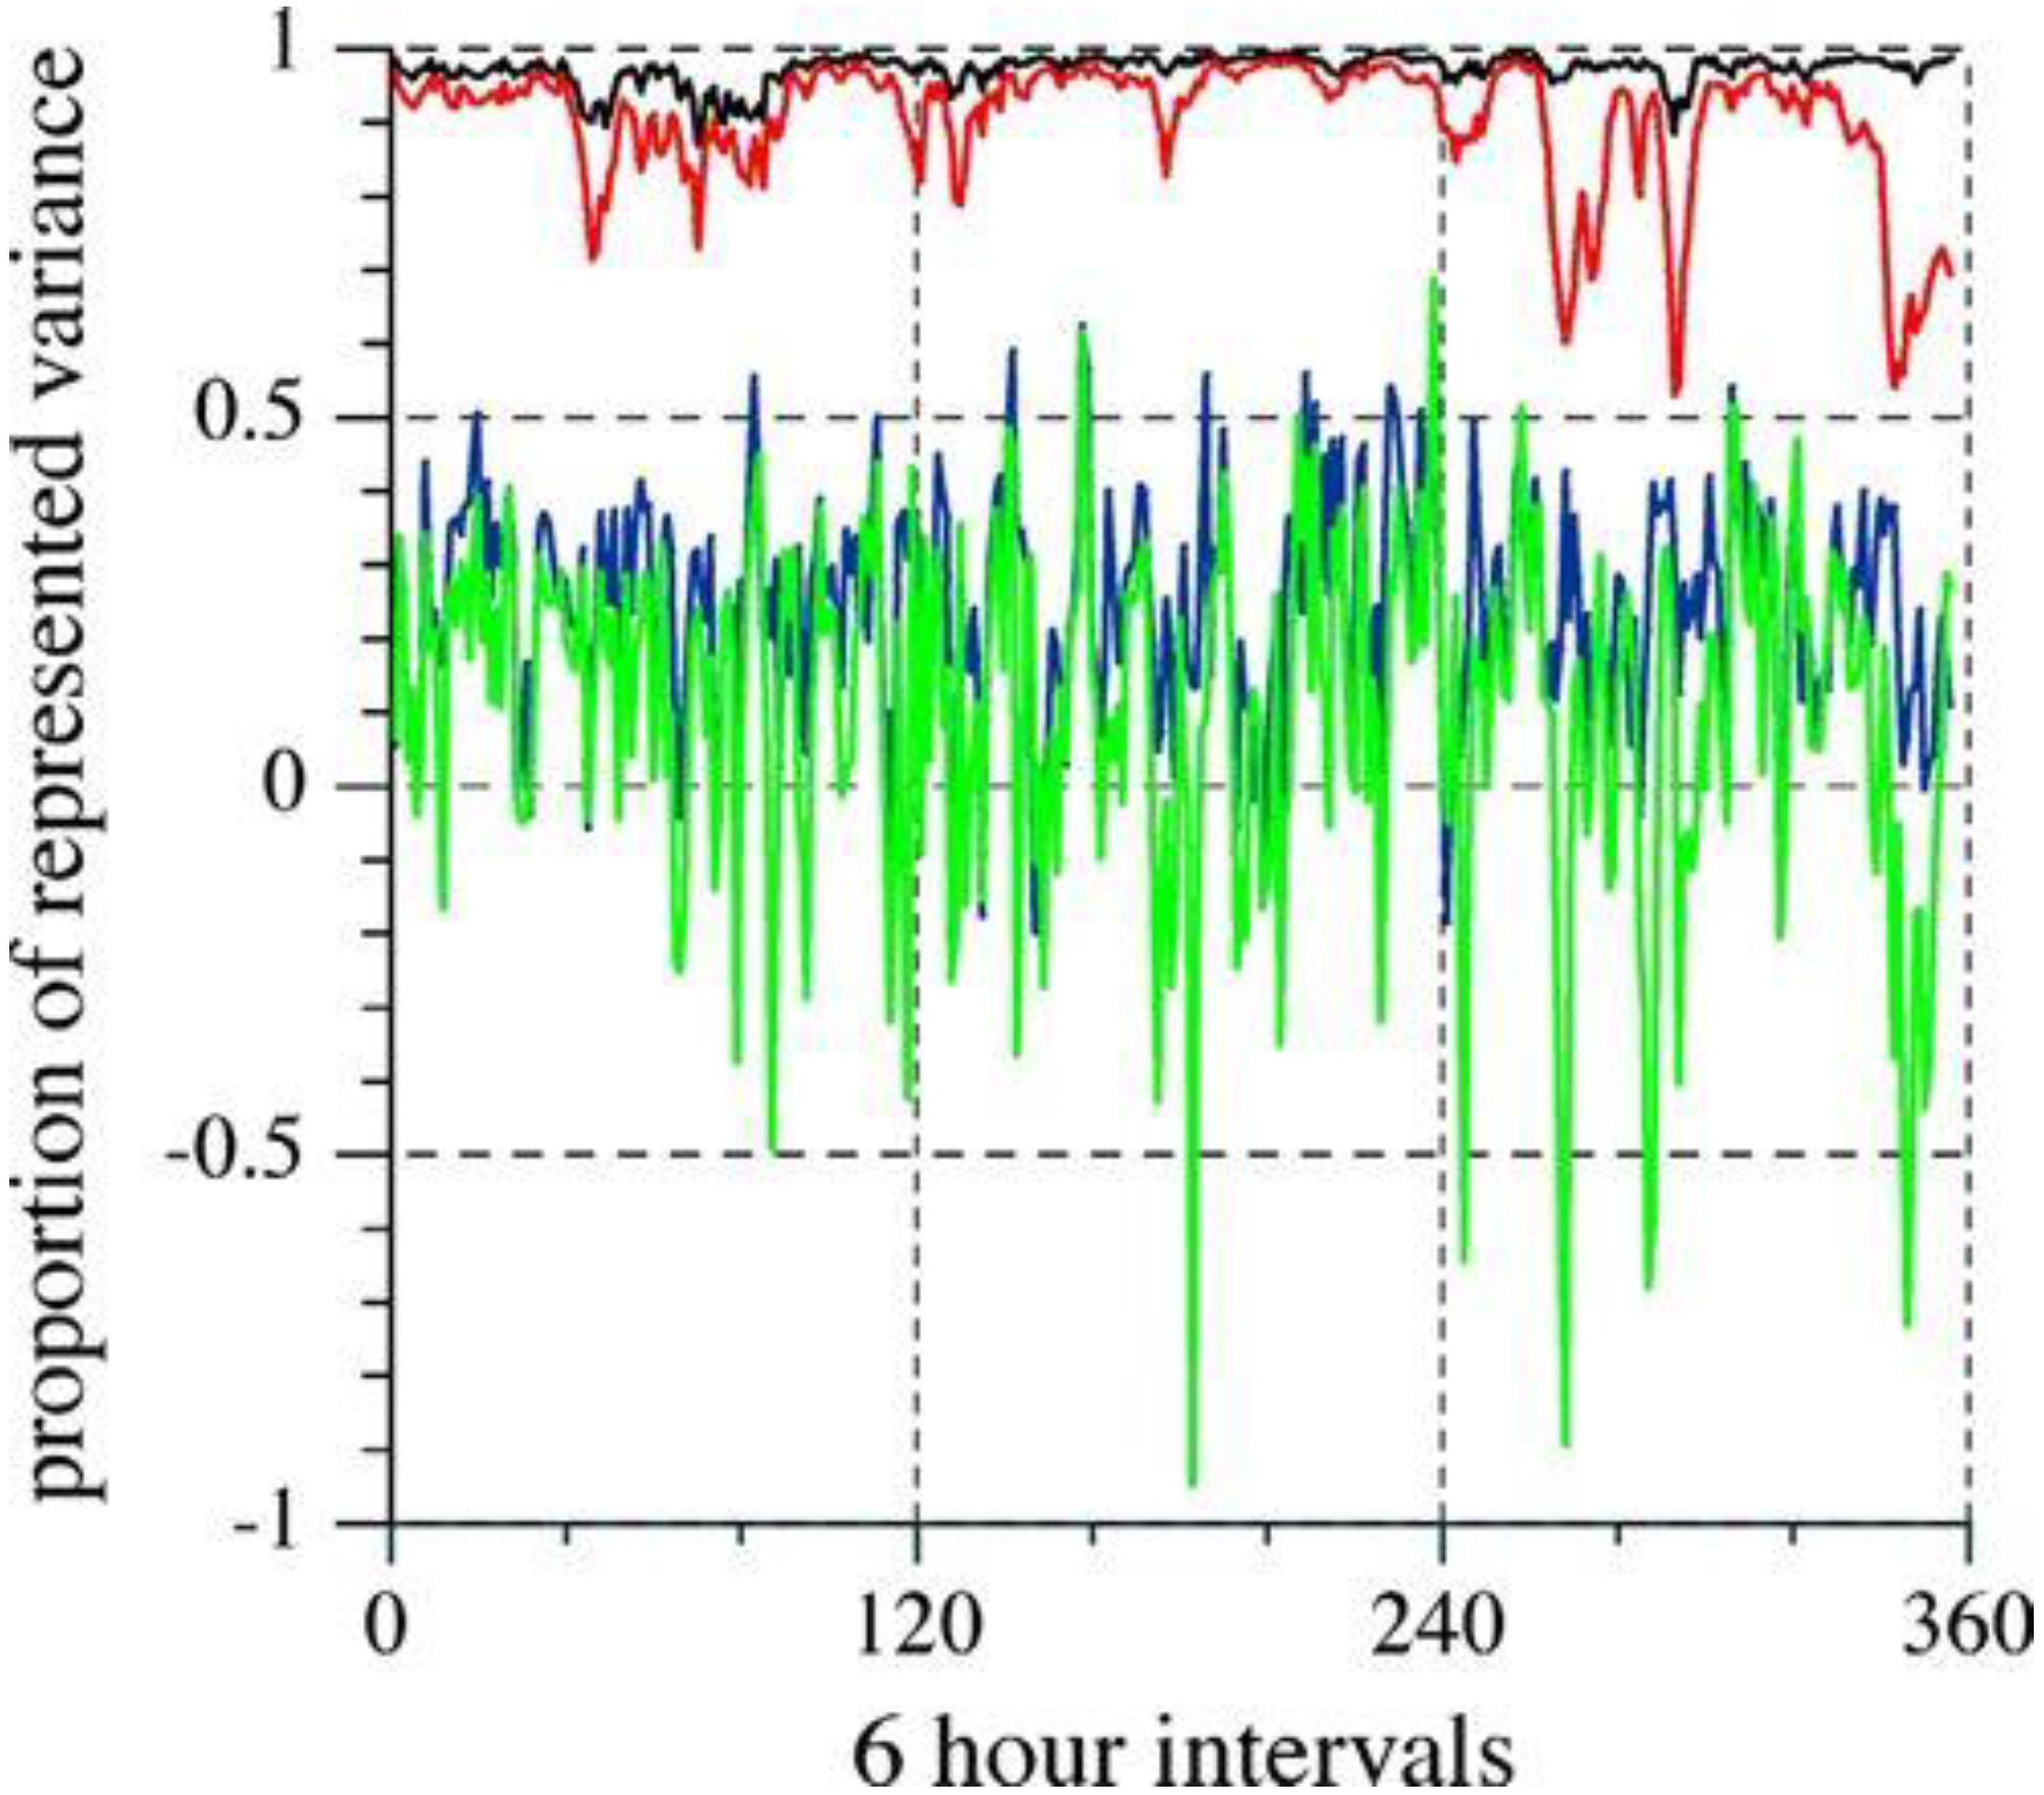
3. Issue: Divergence in Phase Space

From predictability studies, it has long been known that global models starting from the same modified initial conditions and subject to the same forcing end up in very different trajectories, albeit within a corridor given by climatology, if a minuscule change is introduced somewhere in the process (e.g., Reference [38]). Interestingly, it was not recognized for another 20 years that limited area models show similar behavior, namely that the state in the interior of the area is not determined by the lateral boundary conditions, but that different trajectories may form for limited time periods. When initiated with very slightly different initial conditions, significant variability emerges in the model region at a possibly much later time, as demonstrated by Ji and Vernekar [39], Rinke and Dethloff [40], Weisse and Feser [41], Weisse et al. [42], and Alexandru et al. [43]. After a while, the system returns to a preferred trajectory, but may again generate a bundle of very different trajectories for a limited time at any later time.
The examples demonstrate that the different trajectories of the simulated systems are for extended times similar, but that every now and then a major split takes place, which results in significant differences for a limited time. It means, regional models generate intermittently different developments (“divergence in phase space”)—which is not indicating “falseness” of a model, but is rightly reflecting the stochastic character of “weather formation”.
Examples of such episodes are given by Weisse et al. [42], Weisse and Feser [41], Zahn et al. [7] and Feser and von Storch [44]. As an example, Figure 2 shows an example from seasonal simulations for a time, when in reality a typhoon formed in East Asia [44]. In one simulation, not one but three typhoons formed (Figure 2b), and in the second, one major storm plus a secondary storm formed (Figure 2c).
When the large scales in a simulation are constrained the effect is largely suppressed, and the differences are mostly insignificant. Figure 2a shows the result of a constrained simulation, and only one typhoon emerges, at the right location and time (albeit with a too shallow depth).

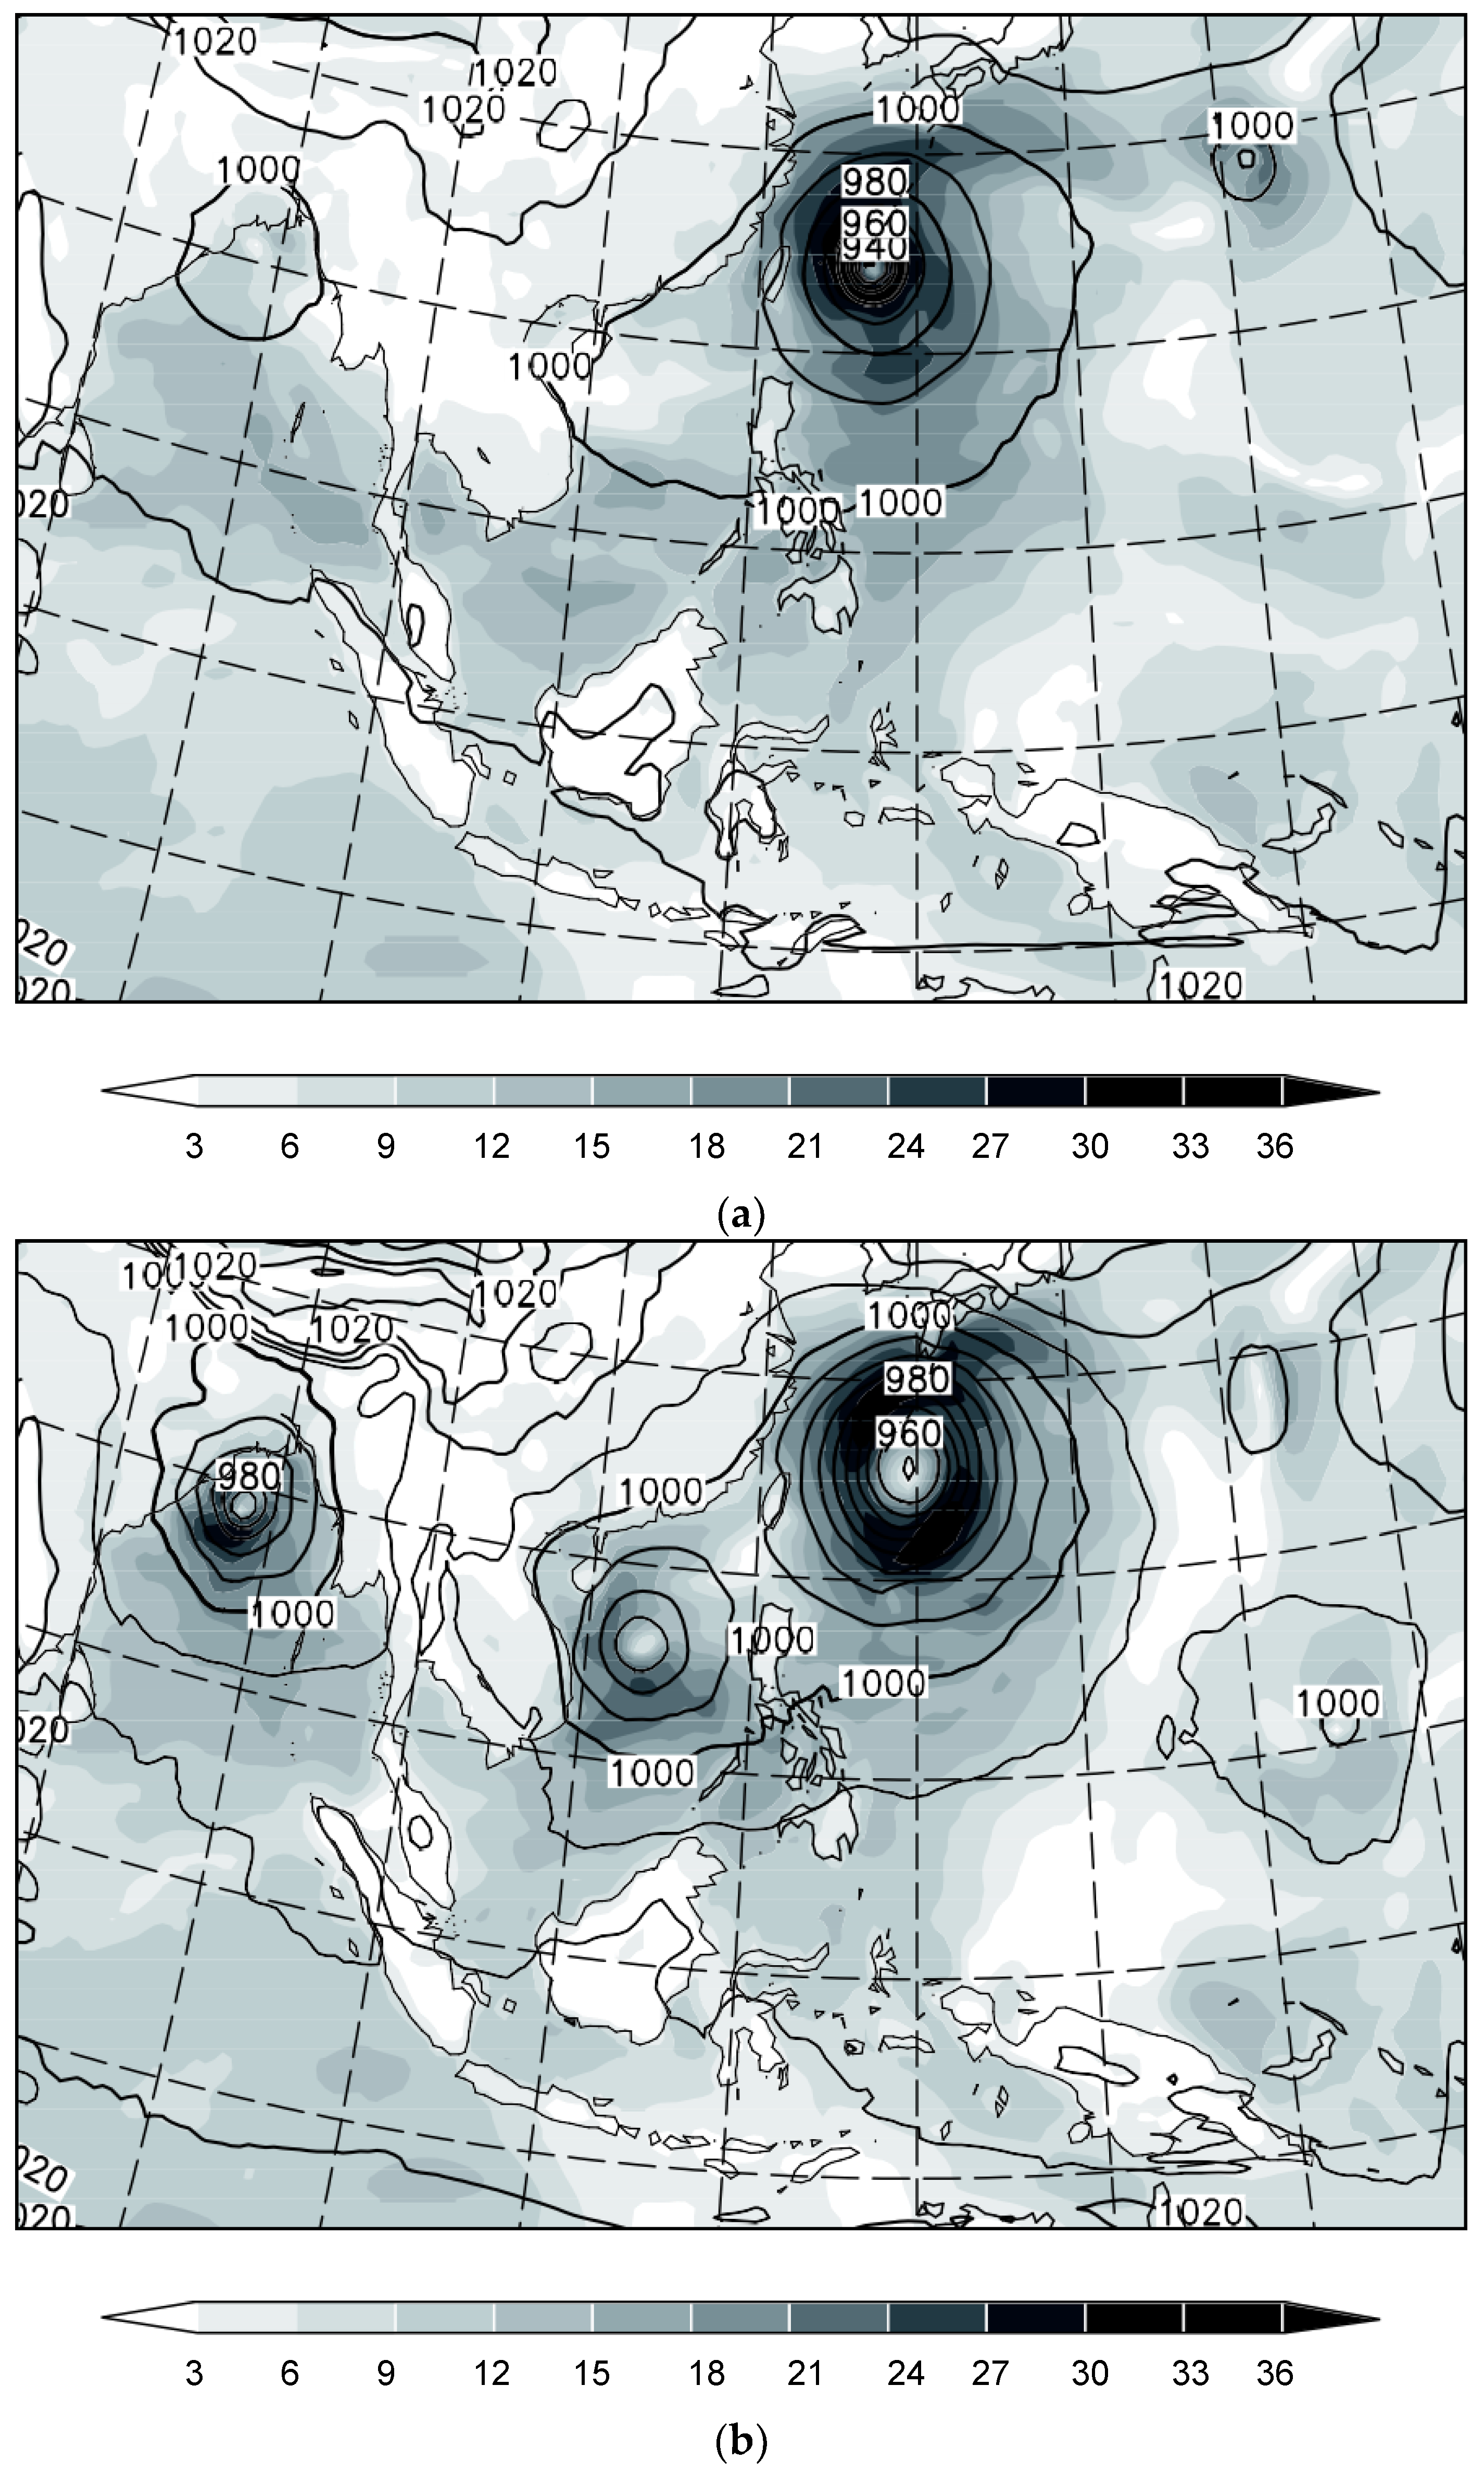
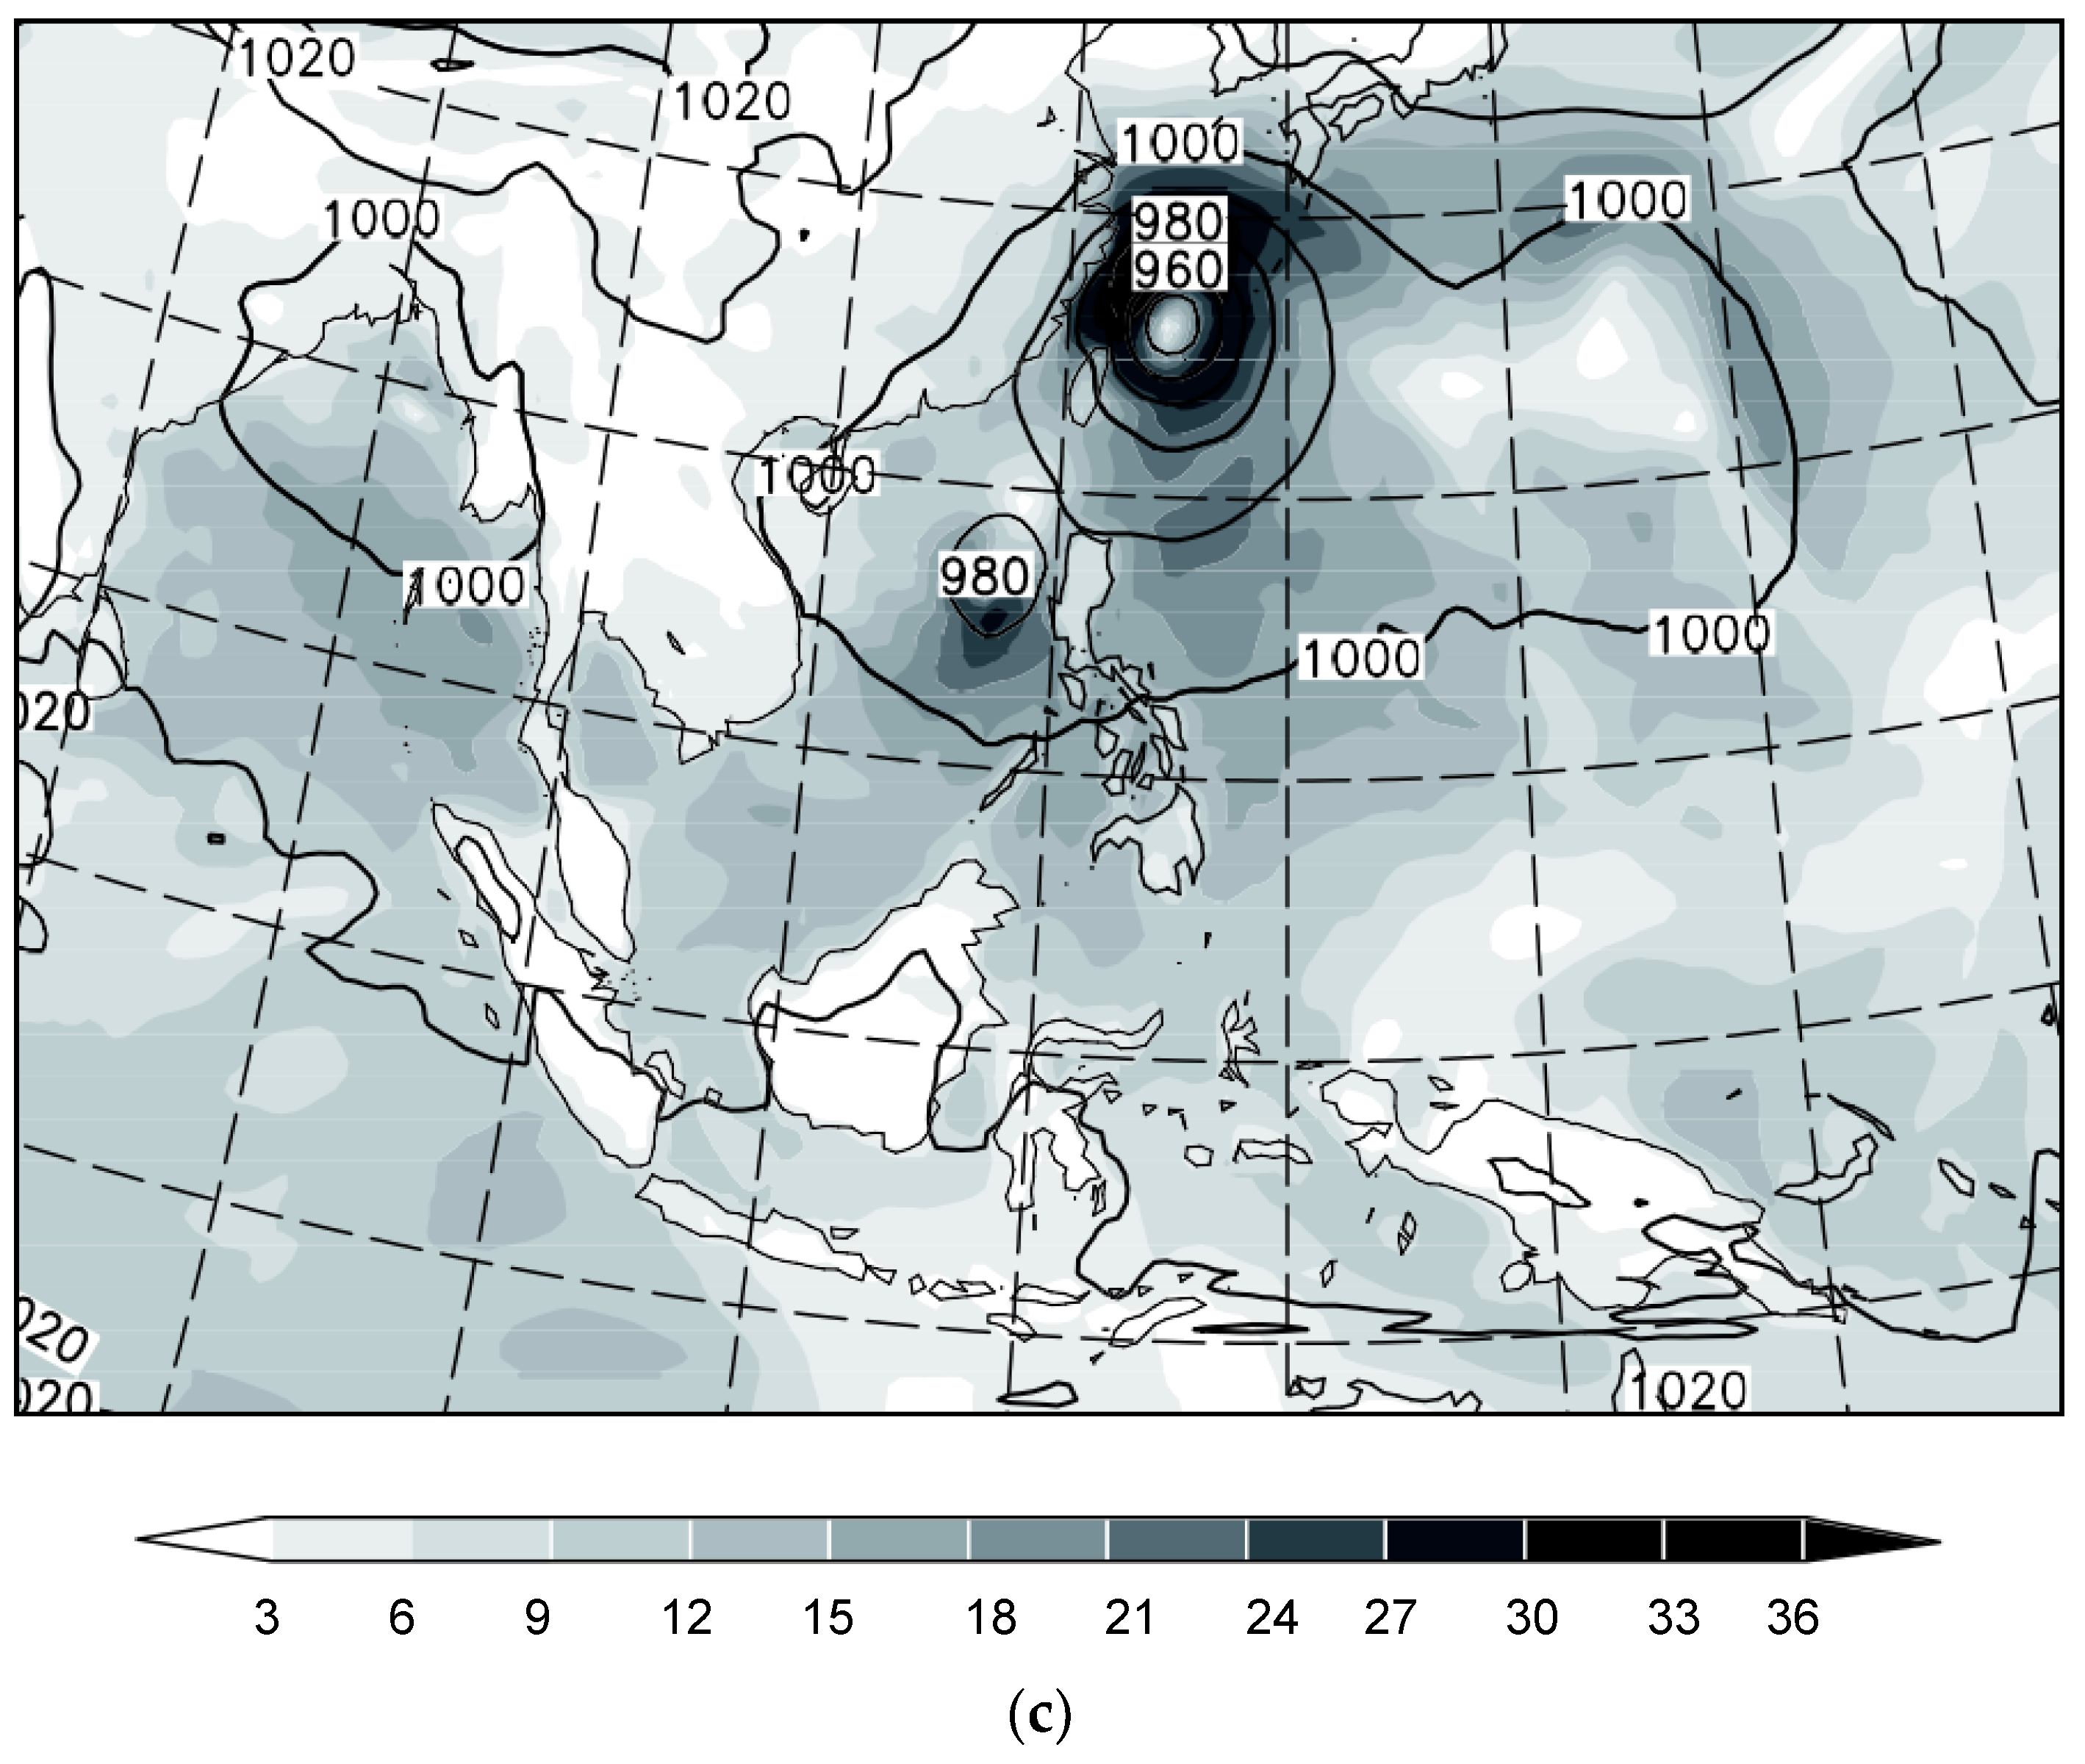
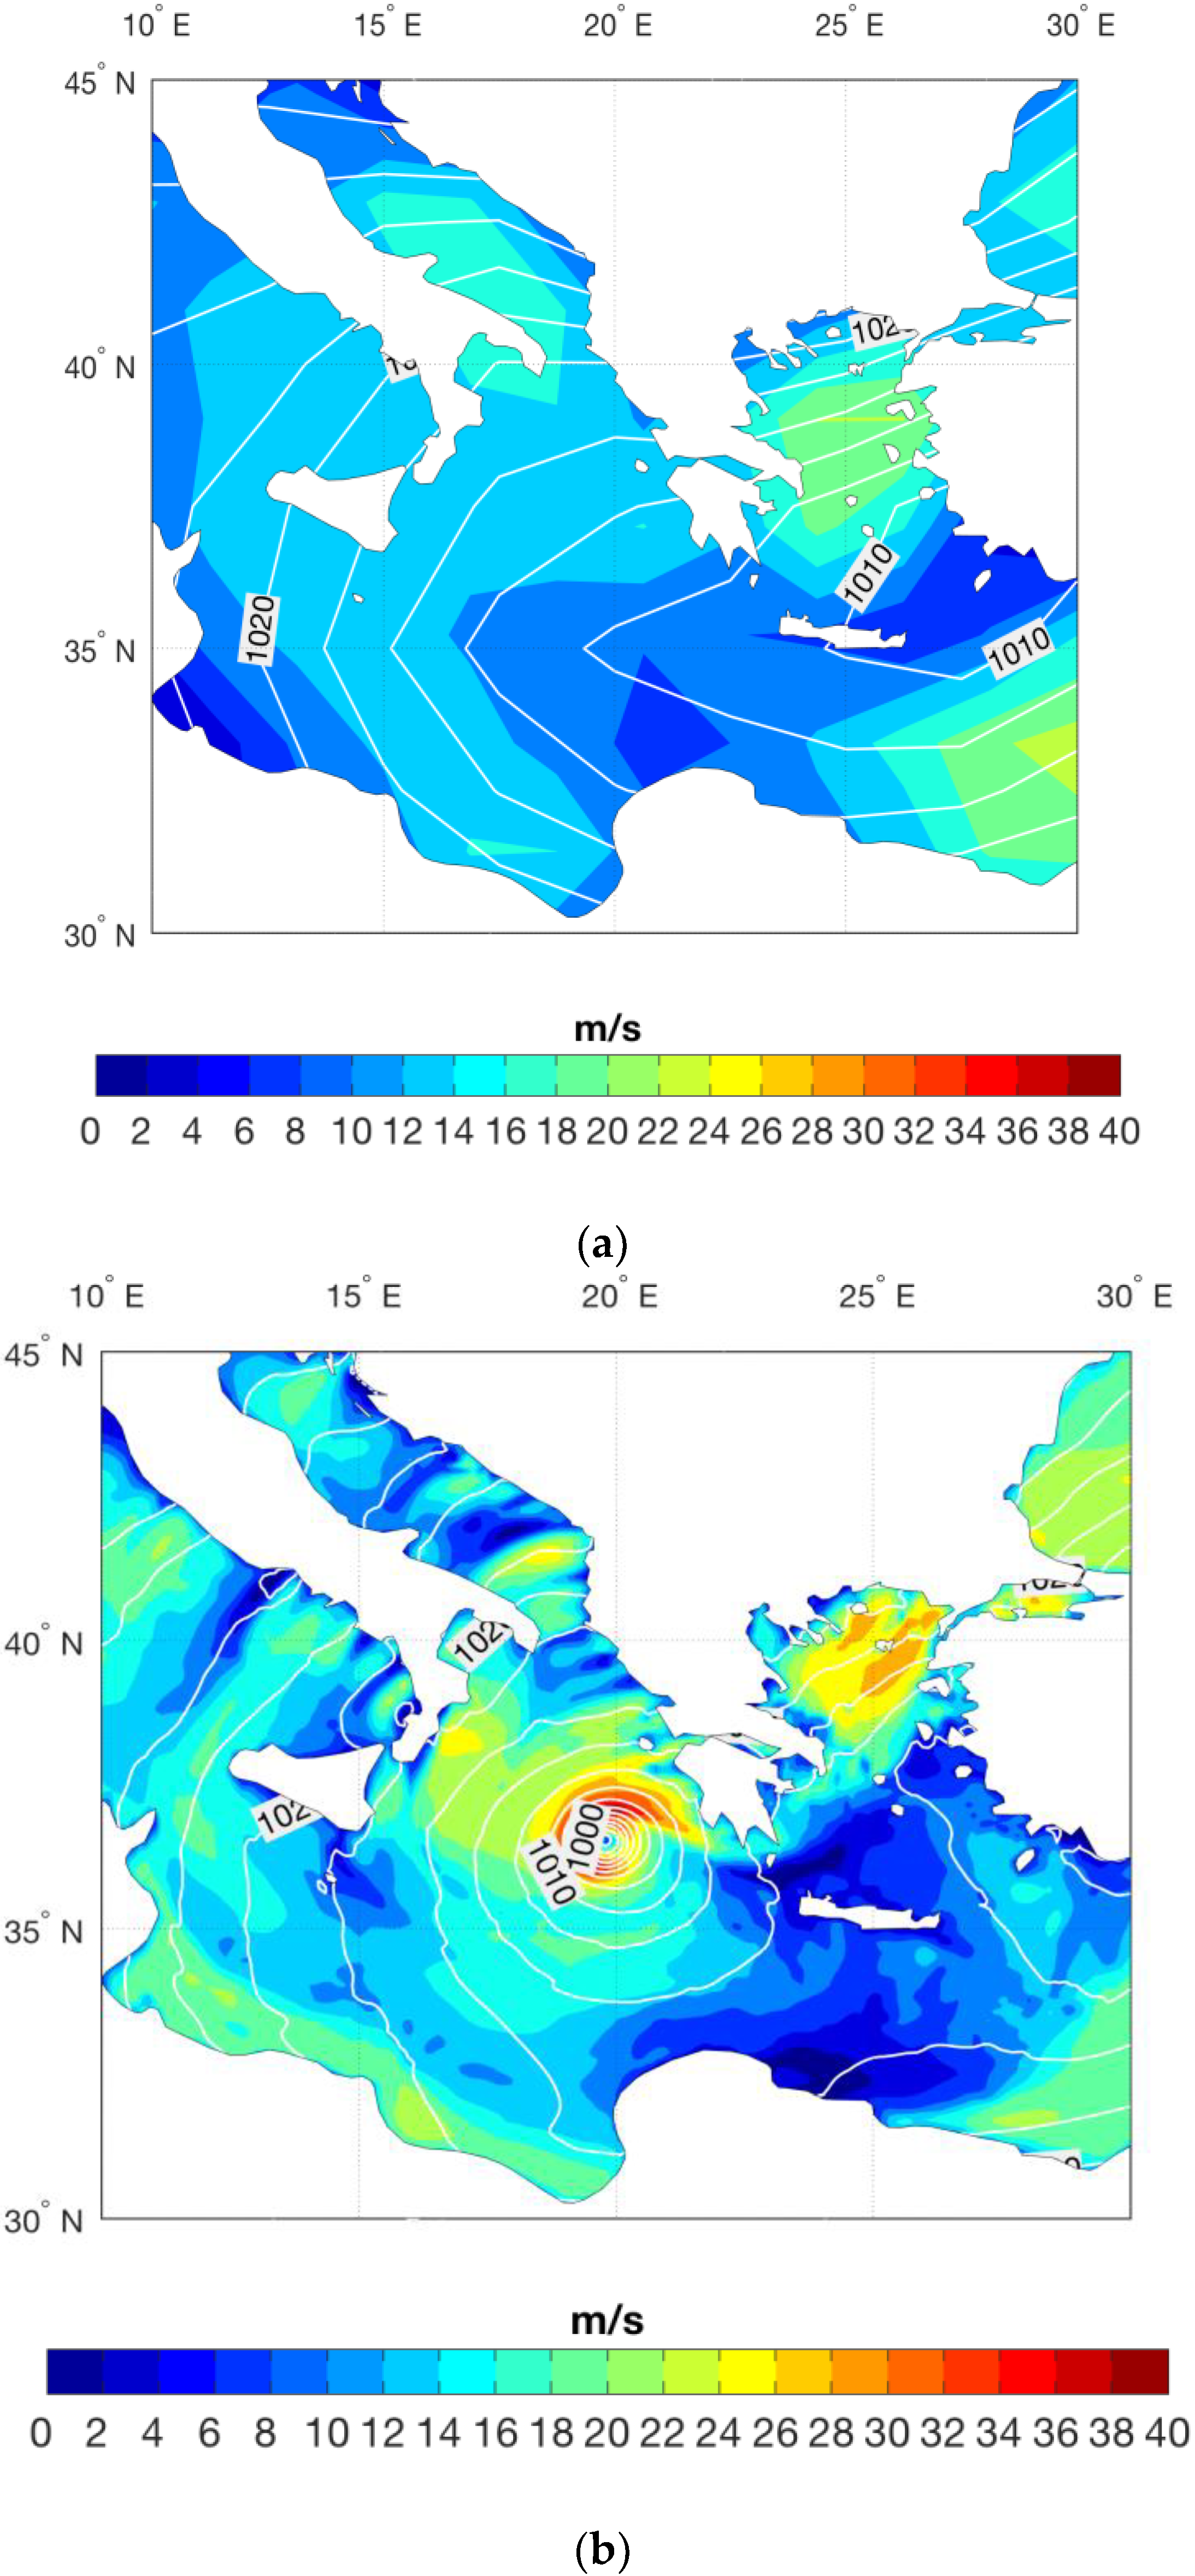
4. Simulating Small Synoptic Features Conditioned by the Large-Scale State in Regional Models

Spectrally nudged regional climate models have been used to construct climatologies, and scenarios of possible future changes, of small-scale synoptic phenomena in various regions, among them Europe, the South Atlantic, East Asia, the Mediterranean Sea, the Yellow Sea, and the North Pacific. Of course, other meteorological phenomena were also described and studied, such as precipitation connected with the East Asian summer monsoon [45].
The first cases were Polar Lows over the North Atlantic [2,7] and over the North Pacific [3,46]. These relatively small energetic storms form over the subarctic sea, mostly in cold air outbreaks, and it is has only been possible to accurately identify them since the advents of satellites. Using NCEP/NCAR reanalysis as driving data, a history of the formation of such storms could be constructed beginning in 1948. The annual cyclogenesis frequency was found to be mostly stationary, with no remarkable trends towards more or less storms. The used grid resolution of about 50 km was seemingly not sufficient to allow for realistic deepening of the storms. Future scenarios were also constructed; in the regions of the North Atlantic and North Pacific, the frequency of storm occurrence decreased due to more stable atmospheric conditions as the higher atmosphere warmed faster than the surface; an assessment of the change in intensity was not made [47,48].
Medicanes are also small, intense storms over the Mediterranean Sea, with features similar to those found in tropical storms, such as vertical symmetry, a thermal profile characterized by a warm core, and a spiral shape in the cloud cover with a central cloud-free eye. The horizontal resolution of gridded models or reanalysis data are particularly sensitive issues for the case of Medicanes, with the smaller among such storms showing a radius as small as 70 km. Using a double-nested regional model, with a grid resolution of 10 km in the inner region, and NCEP/NCAR reanalyses as forcing data, Cavicchia and von Storch [49] demonstrated that realistic Medicanes were formed at the right time and location. Figure 3 shows the features of a Medicane which occurred in January 1995 as simulated in a downscaling simulation; a Medicane with realistic features is formed, whereas in the forcing data the storm is not visible due to the coarse resolution. No noteworthy trends for the time since 1948 were detected [4] in the main formation regions. For future climate scenarios, a decrease in storm occurrence was found caused by increased atmospheric stability in analogy to the Polar Lows case. On the other hand, a slight intensification of the simulated future storms was found [50]. As an example, Figure 4 shows the spatial densities of Medicanes (given as number of tracks passing through a grid box).
Low Level Jets and other phenomena in the Bohai and Yellow Sea region: Coastal areas are featured with plenty types of meso- or small-scale atmospheric processes. A simulation with a resolution of about 7 km was conducted over the Bohai and Yellow Sea region in East Asia during 1979–2013, forced by the ERA-Interim reanalysis dataset [51]. Li [52] revealed that the simulation outperforms ERA-Interim in capturing the detailed spatial and temporal structures of cases of meso-scale phenomena such as a typhoon and a cold surge. A vortex street, an orography-related phenomenon, can be realistically generated by the simulation rather than by the ERA-Interim. Furthermore, Li et al. [6] proved the hindcast can reproduce the climatology, the diurnal cycle, the variability of wind profiles, and specific low level jet (LLJ) cases, which are mesoscale-flow phenomena with horizontal wind maxima within the lowest few kilometers of the troposphere. Long-term statistics of LLJs reveal that they feature a strong diurnal cycle, intra-annual, and interannual variability, but weak decadal variability. LLJs are more frequent in April, May, and June (defined as LLJ season) and less frequent in winter season. Figure 5 shows that LLJs mostly occur at a height of 200–400 m, with intensities generally less than 16 m/s. The dominant wind directions are southwesterly and southerly. Li et al. [6] also identified a low-frequency link between anomalies of LLJ occurrence over the Bohai and Yellow Sea and regional large-scale barotropic circulation over the East Asia-northwest Pacific region.
Tropical cyclones affect large parts of tropical coastal areas worldwide and their inhabitants. Because of their vast damage potential, it is essential to analyze their possible future changes and past variability. A commonly used approach to generate homogeneous tropical cyclone (TC) statistics relies on general circulation and regional climate models. They have the advantage of using a non-changing model system over time which is important to derive long-term statistics. The spectral nudging technique has been applied successfully in a number of studies in the Western Pacific to gain realistic TC distributions of the past [44,53,54]. Spectral nudging reduces the number of TCs simulated by the regional climate model just forced at the lateral boundaries and not using spectral nudging in the model domain’s interior by about half, but generally retains the ones which were observed [55]. The TC generation and development is very dependent on the quality of the forcing data set and storm intensity is sensitive to the model’s resolution. A TC climatology for the last decades [5] shows a large similarity to observation-derived best track data [56] for the most recent times which feature the best measurement quality and availability. Both modeled- and observation-based data sets show an increase in TC activity, in terms of annually accumulated TC days for the last three decades. For earlier decades, statistics differ between the model and observations. An upward shift in TC intensities in the regional model is apparent around the end of the 1970s which is presumably based on the introduction of satellite measurements in the forcing reanalysis at that time. This shows the large dependency of the regional climate model on its global forcing data and that for some cases spectral nudging cannot completely cure data inhomogeneities, which were presumably inherent in the forcing data.

5. Simulating Small Synoptic Features Conditioned by the Large-Scale State Constraining in Global Models

It was Yoshimura and Kanamitsu [8] who noticed that the idea of spectral nudging may also be implemented into global models. Indeed, conceptually the implementation in global models is more attractive than in regional models, as in this case the downscaling concept is applied in a purer sense, namely a forcing of only the larger scales and not a hybrid of forcing along the lateral boundaries and of large-scale components.
The concept was also tested and implemented by Schubert-Frisius et al. [34] and von Storch et al. [57], using the ECHAM6 global atmospheric models with a T255 grid resolution (corresponding to about 60 km), and the large-scale NCEP/NCAR reanalysis as constraint. As an example, Figure 6 shows the description of a typhoon in the NCEP/NCAR reanalysis together with the downscaling achieved by the constrained global simulation.
A variety of parameters, such as the vertical profile of the nudging parameters, were tested [34]. In addition, the performance of the global simulation with respect to regional simulations was confirmed [57]. It turned out that if the global and the regional models had a comparable grid resolution, the hindcasts were also similar, as demonstrated by Figure 7, which compares the global simulation with two regional models in terms of the Brier Skill Score using the satellite product QUIKSCAT as a reference. For the wind in regions marked in red, the regional model performs better than the global model, whereas blue regions mark a superiority of the global model. The global model is a bit better than the regional model when a comparable grid resolution is employed, but the reduction of the grid resolution to 7 km in the regional model leads to a significant improvement. It remains to be seen what the situation is if the global model is run with a resolution which is close to being convection-permitting (<4 km according to Prein et al. [58]).
Thus, instead of running many regional simulations in different domains, introducing further potential sources of inhomogeneity due to boundary conditions, it may be sufficient to run the global simulations for all regions at the same time. In conclusion: running a global model with enforced global (large-scale) circulations allows the simulations of all regional climates at the same time.

6. Concluding Outlook: Purposes and Challenges

In general, spectral nudging has several advantages as outlined in this paper. However, it may also gloss over certain model deficiencies; indeed, both failures and successes with spectrally nudged models draw their skill from both the model formulation and the large-scale evidence provided by reanalyses. If one of the two sources of information is failing, it may be possible that the other is strong enough to overcome the insufficiency in the employed model or the employed reanalysis.
Constraining large scales in simulations, but letting small scales develop freely, conditional upon the state of the large scales, may be used for a variety of purposes.
The most common application is the construction of regional climatologies for different parts of the world, namely Europe [59] including the Mediterranean region [4], East Asia and the Northwestern Pacific [5,44,51,53,60], the South Atlantic [61], Central Siberia [62]; other applications are studying meteorological processes [63] and regional details in forecasting [64]. These climatologies have been used to study changing weather-related phenomena, such as storms, ocean waves, storm surges, atmospheric deposition and transport of chemical elements, marine biota modelling, carbon cycle studies, plant productivity analyses, but also for economic applications such as oil spill simulations or ship routing and design.
The usage of a scale-dependent constraining, with the better observed large scales limiting the space of possible developments of the smaller scales, may also be applied in other dynamical systems, which include a downscaling hierarchy. Consistently, recent approaches for using this method in ocean models are implemented and tested [65,66,67].
Modelling of regional weather streams across several decades permits the construction of climatologies of certain phenomena. We have discussed Polar Lows, medicanes, and typhoons above, and briefly touched Low Level Jets. Identifying and characterizing the members of such climatological ensembles of phenomena may pose new challenges in describing such phenomena (say, counting, determining scales, intensities, and tracks). This challenge grows when dealing with the output of convection-permitting resolutions, simply because of the more detailed output.
There are certainly some aspects which need further consideration—in particular, the question of how well different configurations of the spectral nudging (variables, vertical profile, frequency, for instance) function. In addition, the implementation of a large-scale constraint using orthogonal functions, which may be associated with spatial scales (such as trigonometric or spherical harmonics), requires a uniform gridding; however, the implementation of a large-scale constraint in models with different grid resolutions will pose an extra challenge.
An example are Low Level Jets, which have been studied mostly as a local phenomena, namely connected to certain vertical profiles. After having gridded data, Low Level Jets should be described by their full three- or four-dimensional structures. Figure 8 shows the developments of two Low Level Jets in the Bo Hai/Yellow Sea region to help illustrate the challenge. The LLJs do not represent a trajectory with a growing, a mature, and a decaying phase, but a disintegrating object. To deal with LLJs as a spatial pattern, pattern recognition methods need to be implemented for defining patterns, sizes, and dynamic properties.

Author Contributions

Conceptualization, H.S.; Methodology, H.S.; Software, L.C.; Validation, L.D.; Formal Analysis, L.D., L.C., F.F.; Investigation, L.C.; Resources, F.F.; Data Curation, L.C.; Writing-Original Draft Preparation, H.S. and F.F.; Writing-Review & Editing, L.C., L.D.; Visualization, L.D., L.C., F.F.; Supervision, H.S.; Project Administration, F.F.; Funding Acquisition, H.S.

Funding

The work was partly supported through the Cluster of Excellence ‘CliSAP’ (EXC177), University of Hamburg, funded through the German Research Foundation (DFG). It is a contribution to the Helmholtz Climate Initiative REKLIM (Regional Climate Change), a joint research project of the Helmholtz Association of German Research Centres (HGF). The work was also supported by the National Key Research and Development Program of China (2017YFA0604100) and the National Natural Science Foundation of China (41706019). This research was partially supported through funding from the Earth System and Climate Change Hub of the Australian Government’s National Environmental Science Programme (NESP).

Acknowledgments

Thanks to Jens Hesselbjerg-Christensen and Rene Laprise for advice. The German Climate Computing Center (DKRZ) provided the computer hardware for the climate model simulations.

Conflicts of Interest

The authors declare no conflict of interest. The funders had no role in the design of the study; in the collection, analyses, or interpretation of data; in the writing of the manuscript, and in the decision to publish the results.

References

  1. Blechschmidt, A.-M. A 2-year climatology of polar low events over the Nordic Seas from satellite remote sensing. Geophys. Res. Lett. 2008, 35. [Google Scholar] [CrossRef] [Green Version]
  2. Zahn, M.; von Storch, H. A longterm climatology of North Atlantic Polar Lows. Geophys. Res. Lett. 2008, 35. [Google Scholar] [CrossRef]
  3. Chen, F.; von Storch, H. Trends and variability of North Pacific Polar Lows. Adv. Meteorol. 2013, 2013. [Google Scholar] [CrossRef]
  4. Cavicchia, L.; von Storch, H.; Gualdi, S. A long-term climatology of medicanes. Clim. Dyn. 2014, 43, 1183–1195. [Google Scholar] [CrossRef]
  5. Barcikowska, M.; Feser, F.; Zhang, W.; Mei, W. Changes in intense Tropical Cyclone Activity for the Western North Pacific during the last decades derived from a Regional Climate Model Simulation. Clim. Dyn. 2017, 49, 2931–2949. [Google Scholar] [CrossRef]
  6. Li, D.; von Storch, H.; Yin, B.; Xu, Z.; Qi, J.; Wei, W.; Guo, D. Low Level Jets over the Bohai Sea and Yellow Sea: Climatology, Variability, and the Relationship with Regional Atmospheric Circulations. J. Geophys. Res. Atoms. 2018, 123, 5240–5260. [Google Scholar] [CrossRef]
  7. Zahn, M.; von Storch, H.; Bakan, S. Climate mode simulation of North Atlantic Polar Lows in a limited area model. Tellus A Meteorol. Oceanogr. 2008, 60, 620–631. [Google Scholar] [CrossRef]
  8. Yoshimura, K.; Kananitsu, M. Dynamical global downscaling of global reanalysis. Mon. Weather Rev. 2008, 136, 2983–2998. [Google Scholar] [CrossRef]
  9. Kida, H.; Koide, T.; Sasaki, H.; Chiba, M. A new approach for coupling a limited area model to a GCM for regional climate simulations. J. Meteorol. Soc. Jpn. 1991, 69, 723–728. [Google Scholar] [CrossRef]
  10. Sasaki, H.; Kida, H.; Koide, T.; Chiba, M. The performance of long term integrations of a limited area model with the spectral boundary coupling method. J. Meteorol. Soc. Jpn. 1995, 73, 165–181. [Google Scholar] [CrossRef]
  11. McGregor, J.L.; Katzfey, J.J.; Nguyen, K.C. Fine Resolution Simulations of Climate Change for Southeast Asia: Southeast Asian Regional Committee for START Research Project Final Report; CSIRO Atmospheric Research: Aspendale, Australia, 1998. [Google Scholar]
  12. Waldron, K.M.; Peagle, J.; Horel, J.D. Sensitivity of a spectrally filtered and nudged limited area model to outer model options. Mon. Weather Rev. 1996, 124, 529–547. [Google Scholar] [CrossRef]
  13. Von Storch, H.; Langenberg, H.; Feser, F. A spectral nudging technique for dynamical downscaling purposes. Mon. Weather Rev. 2000, 128, 3664–3673. [Google Scholar] [CrossRef]
  14. Miguez-Macho, G.; Stenchikov, G.L.; Robock, A. Spectral nudging to eliminate the effects of domain position and geometry in regional climate model simulations. J. Geophys. Res. Atoms. 2004, 109. [Google Scholar] [CrossRef] [Green Version]
  15. Von Storch, H. Inconsistencies at the interface of climate impact studies and global climate research. Meteorol. Z. 1992, 72–80. [Google Scholar] [CrossRef]
  16. Giorgi, F.; Hewitson, B.; Christensen, J.; Hulme, M.; von Storch, H.; Whetton, P.; Jones, R.; Mearns, L.; Fu, C. Regional Climate Information—Evaluation and Projections; Cambridge University Press: New York, NY, USA, 2001; pp. 583–638. [Google Scholar]
  17. Davies, H.C. A lateral boundary formulation for multi-level prediction models. Q. J. R. Meteorol. Soc. 1976, 102, 405–418. [Google Scholar] [CrossRef]
  18. Oliger, J.; Sundström, A. Theoretical and practical aspects of some initial boundary value problems in fluid dynamics. SIAM J. Appl. Math. 1978, 35, 419–446. [Google Scholar] [CrossRef]
  19. Staniforth, A. Egional modelling: A theoretical discussion. Meteorol. Atmos. Phys. 1997, 63, 15–29. [Google Scholar] [CrossRef]
  20. Laprise, R. Regional climate modelling. J. Comp. Phys. 2008, 227, 3641–3666. [Google Scholar] [CrossRef]
  21. Denis, B.; Cote, J.; Laprise, R. Spectral decomposition of two-dimensional atmospheric fields on limited area domains using the discrete cosine tranform. Mon. Weather Rev. 2002, 130, 1812–1829. [Google Scholar] [CrossRef]
  22. Robinson, A.R.; Lermusiaux, P.F.J.; Sloan, N.Q., III. Data assimilation. Sea 1998, 10, 541–594. [Google Scholar]
  23. Feser, F.; Rockel, B.; von Storch, H.; Winterfeldt, J.; Zahn, M. Regional Climate Models Add Value to Global Model Data: A Review and Selected Examples. Bull. Am. Meteor. Soc. 2011, 92, 1181–1192. [Google Scholar] [CrossRef] [Green Version]
  24. Rockel, B.; Castro, C.L.; Pielke, R.A., Sr.; von Storch, H.; Leoncini, G. Dynamical downscaling: Assessment of model system dependent retained and added variability for two different regional climate models. J. Geophys. Res. 2008, 113. [Google Scholar] [CrossRef] [Green Version]
  25. Schaaf, B.; von Storch, H.; Feser, F. Does Spectral Nudging Have an Effect on Dynamical Downscaling Applied in Small Regional Model Domains? Mon. Weather Rev. 2017, 145, 4303–4311. [Google Scholar] [CrossRef] [Green Version]
  26. Alexandru, A.; De Elia, R.; Laprise, R.; Separovic, L.; Biner, S. Sensitivity study of regional climate model simulations to large-scale nudging parameters. Mon. Weather Rev. 2009, 137, 1666–1686. [Google Scholar] [CrossRef]
  27. Omrani, H.; Drobinski, P.; Dubos, T. Spectral nudging in regional climate modeling: how strong should we nudge? Q. J. R. Meteorol. Soc. 2012, 138, 1808–1813. [Google Scholar] [CrossRef] [Green Version]
  28. Kang, H.-S.; Cha, D.-H.; Lee, D.-K. Evaluation of the mesoscale model/land surface model (MM5/LSM) coupled model for East Asian summer monsoon simulations. J. Geophys. Res. 2005, 110. [Google Scholar] [CrossRef] [Green Version]
  29. Miguez-Macho, G.; Stenchikov, G.L.; Robock, A. Regional climate simulations over North America: Interaction of local processes with improved large-scale flow. J. Clim. 2005, 18, 1227–1246. [Google Scholar] [CrossRef]
  30. Park, J.; Hwang, S.-O. Impacts of spectral nudging on the simulated surface air temperature in summer compared with the selection of shortwave radiation and land surface model physics parameterization in a high-resolution regional atmospheric model. J. Atmos. Sol.-Terr. Phys. 2017, 164, 259–267. [Google Scholar] [CrossRef]
  31. Radu, R.; Déqué, M.; Somot, S. Spectral nudging in a spectral regional climate model. Tellus A Meteorol. Oceanogr. 2008, 60, 898–910. [Google Scholar] [CrossRef] [Green Version]
  32. Ramzan, M.; Ham, S.; Amjad, M.; Chang, E.-C.; Yoshimura, K. Sensitivity Evaluation of Spectral Nudging Schemes in Historical Dynamical Downscaling for South Asia. Adv. Meteorol. 2017, 2017. [Google Scholar] [CrossRef]
  33. Tang, J.; Song, S.; Wu, J. Impacts of the spectral nudging technique on simulation of the East Asian summer monsoon. Theor. Appl. Climatol. 2010, 101, 41–51. [Google Scholar] [CrossRef]
  34. Schubert-Frisius, M.; Feser, F.; von Storch, H.; Rast, S. Optimal spectral nudging for global dynamic downscaling. Mon. Weather Rev. 2017, 145, 909–927. [Google Scholar] [CrossRef]
  35. Liu, P.; Tsimpidi, A.P.; Hu, Y.; Stone, B.; Russell, A.G.; Nenes, A. Differences between downscaling with spectral and grid nudging using WRF. Atmos. Chem. Phys. 2012, 12, 3601–3610. [Google Scholar] [CrossRef] [Green Version]
  36. Ma, Y.; Yi, Y.; Mai, X.; Qiu, C.; Long, X.; Wang, C. Comparison of Analysis and Spectral Nudging Techniques for Dynamical Downscaling with the WRF Model over China. Adv. Meteorol. 2016, 2016, 1–16. [Google Scholar] [CrossRef]
  37. Spero, T.; Nolte, C.; Mallard, M.; Bowden, J. A Maieutic Exploration of Nudging Strategies for Regional Climate Applications using the WRF Model. J. Appl. Meteorol. Climatol. 2018. [Google Scholar] [CrossRef]
  38. Chervin, R.M.; Gates, W.L.; Schneider, S.H. The effect of time averaging on the noise level of climatological statistics generated by atmospheric general circulation models. J. Atmos. Sci. 1974, 31, 2216–2219. [Google Scholar] [CrossRef]
  39. Ji, Y.M.; Vernekar, A.D. Simulation of the Asian summer monsoons of 1987 and 1988 with a regional model nested in a global GCM. J. Clim. 1997, 10, 1965–1979. [Google Scholar] [CrossRef]
  40. Rinke, A.; Dethloff, K. On the sensitivity of a regional Arctic climate model to initial and boundary conditions. Clim. Res. 2000, 14, 101–113. [Google Scholar] [CrossRef] [Green Version]
  41. Weisse, R.; Feser, F. Evaluation of a method to reduce uncertainty in wind hindcasts performed with regional atmosphere models. Coast. Eng. 2003, 48, 211–225. [Google Scholar] [CrossRef]
  42. Weisse, R.; Heyen, H.; von Storch, H. Sensitivity of a regional atmospheric model to a sea state dependent roughness and the need of ensemble calculations. Mon. Weather Rev. 2000, 128, 3631–3642. [Google Scholar] [CrossRef]
  43. Alexandru, A.; de Elía, R.; Laprise, R. Internal variability in regional climate downscaling at the seasonal scale. Mon. Weather Rev. 2007, 135, 3221–3238. [Google Scholar] [CrossRef]
  44. Feser, F.; von Storch, H. A dynamical downscaling case study for typhoons in SE Asia using a regional climate model. Mon. Weather Rev. 2008, 136, 1806–1815. [Google Scholar] [CrossRef]
  45. Lee, D.-K.; Cha, D.-H.; Kang, H.-S. Regional climate simulation of the 1998 summer flood over East Asia. J. Meteorol. Soc. Jpn. 2004, 82, 1735–1753. [Google Scholar] [CrossRef]
  46. Chen, F.; Geyer, B.; Zahn, M.; von Storch, H. Towards a multidecadal climatology of North Pacific Polar Lows employing dynamical downscaling. Terr. Atmos. Ocean. Sci. 2012, 23, 291. [Google Scholar] [CrossRef]
  47. Chen, F.; von Storch, H.; Zeng, L.; Du, Y. Polar Low genesis over the North Pacific under different global warming scenarios. Clim. Dyn. 2014, 43, 3449–3456. [Google Scholar] [CrossRef]
  48. Zahn, M.; von Storch, H. Decreased frequency of North Atlantic polar lows associated to future climate warming. Nature 2010, 467, 309–312. [Google Scholar] [CrossRef] [PubMed]
  49. Cavicchia, L.; von Storch, H. Medicanes simulation in a high resolution regional climate model. Clim. Dyn. 2012, 39, 2273–2290. [Google Scholar] [CrossRef]
  50. Cavicchia, L.; von Storch, H.; Gualdi, S. Mediterranean tropical-like cyclones in present and future climate. J. Clim. 2014, 27, 7493–7501. [Google Scholar] [CrossRef]
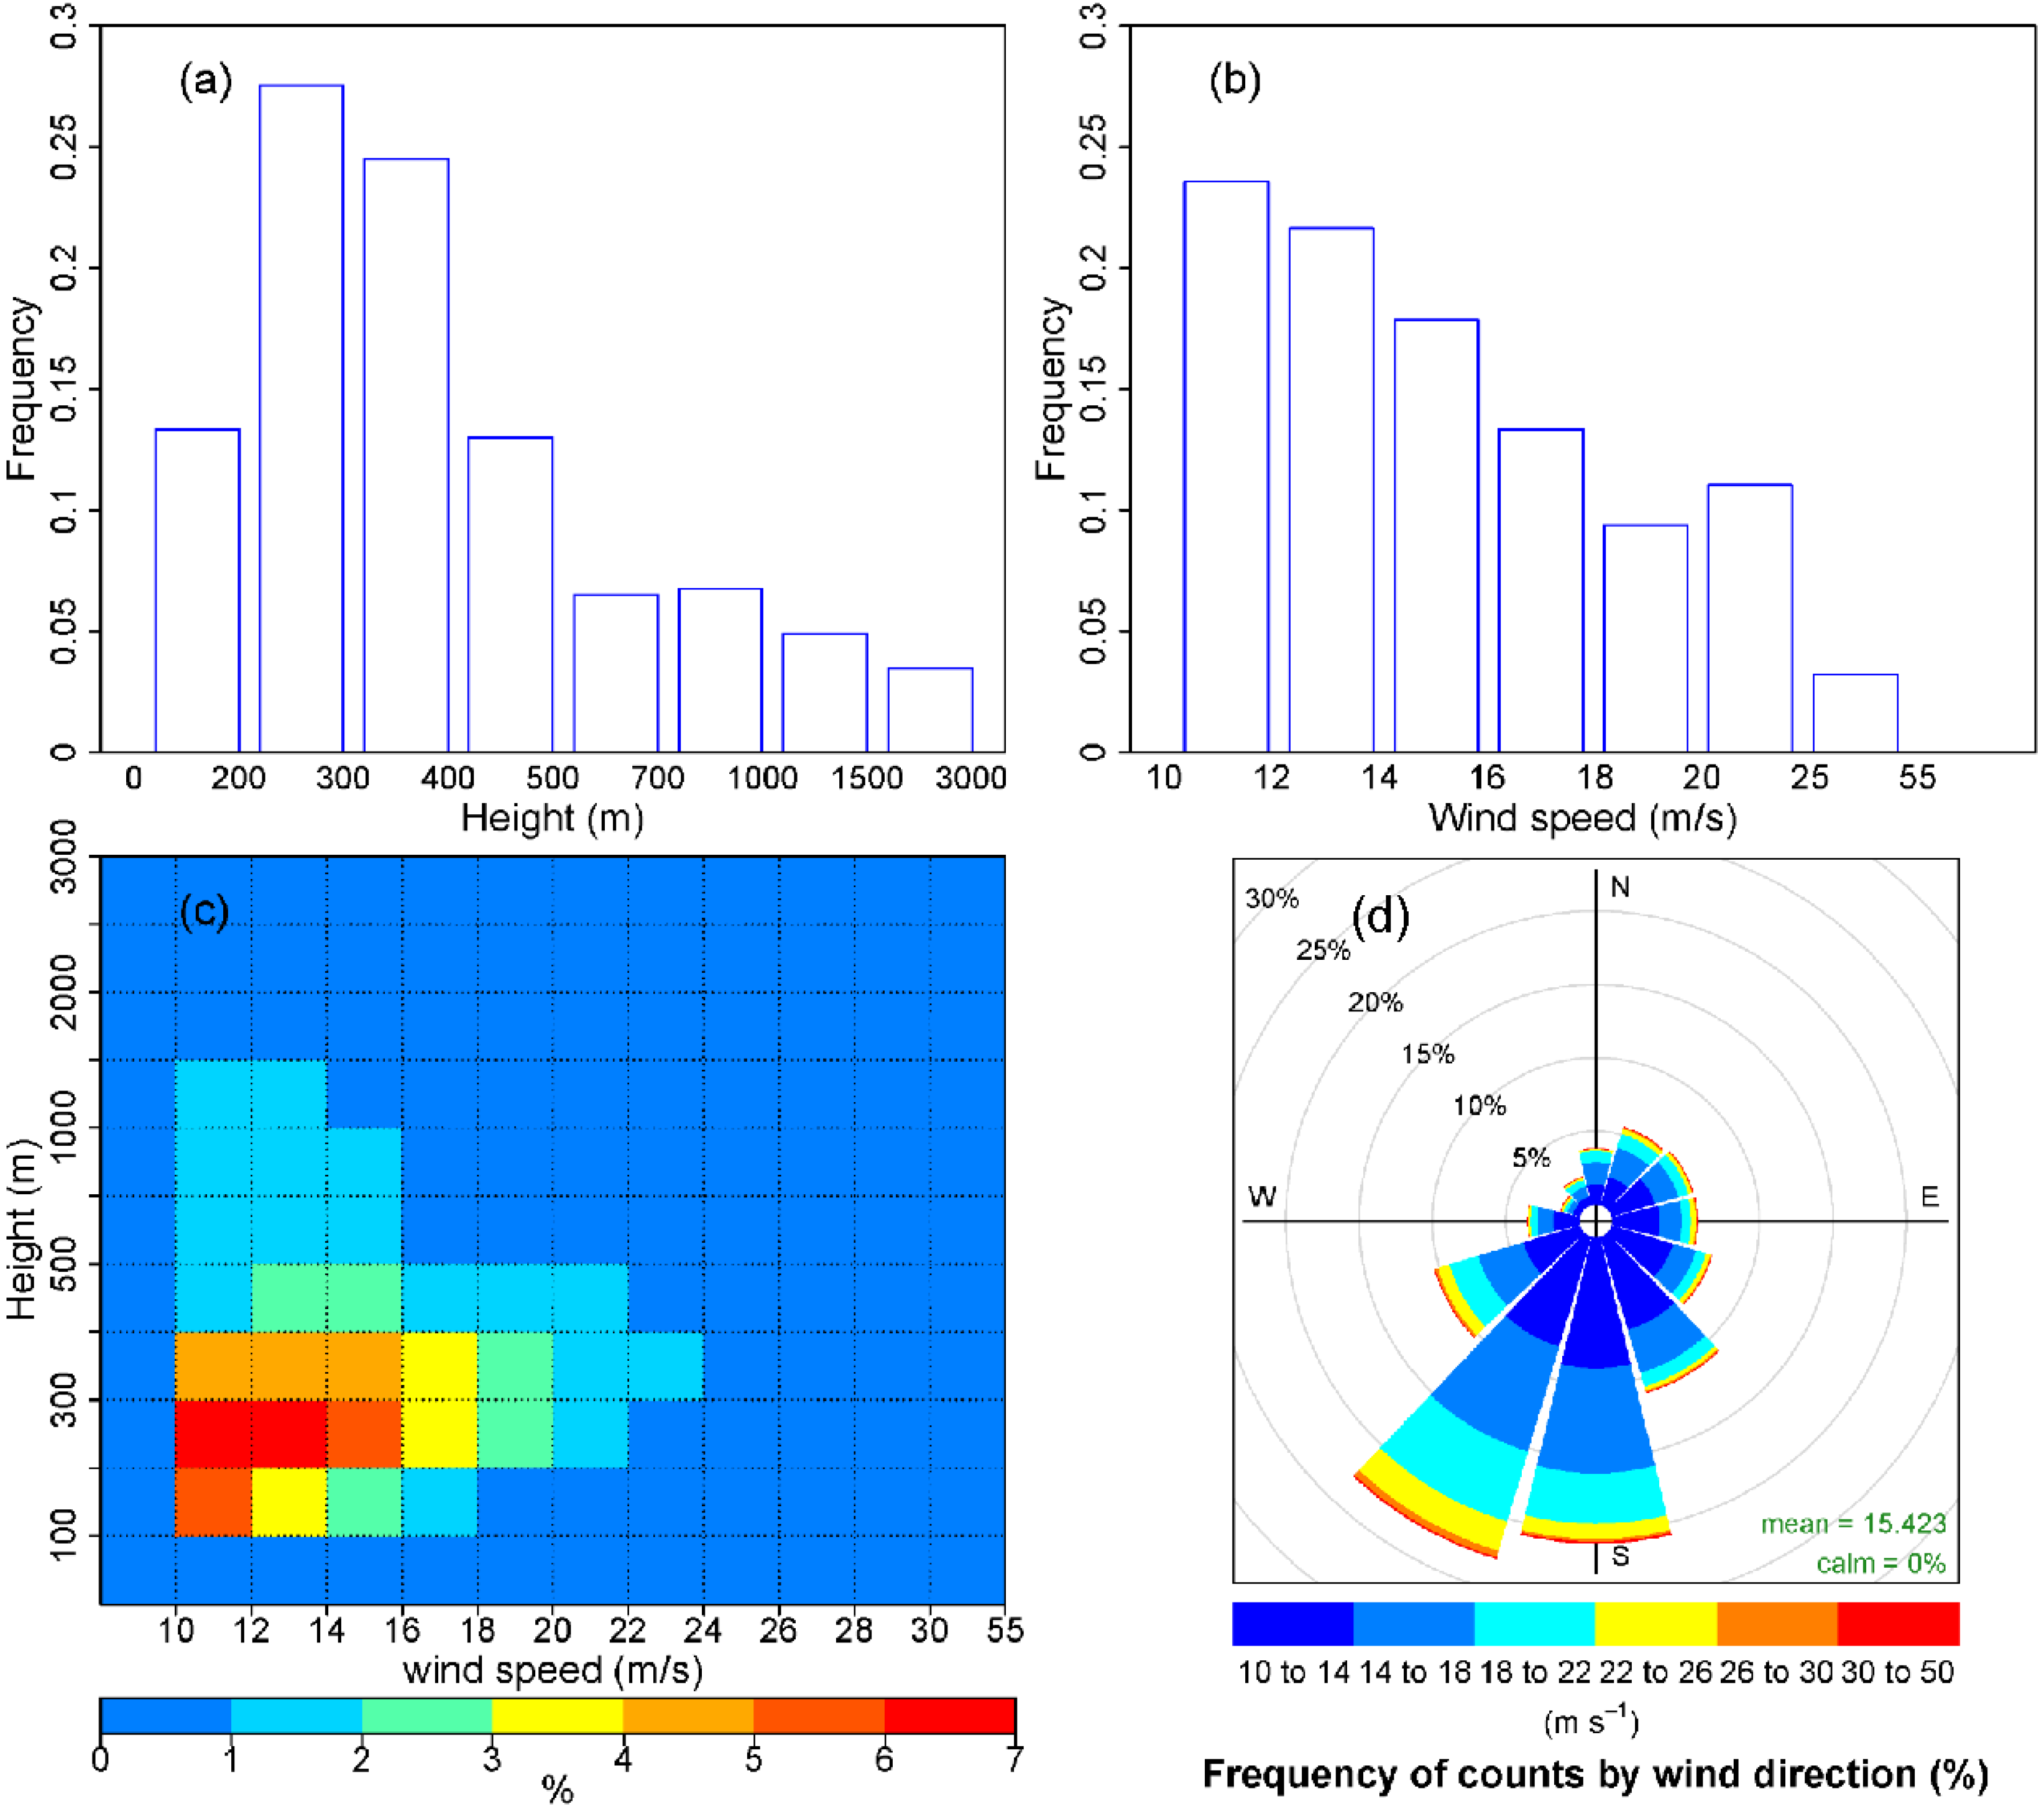
  51. Li, D.; von Storch, H.; Geyer, B. High-resolution wind hindcast over the Bohai Sea and the Yellow Sea in East Asia: Evaluation and wind climatology analysis. J. Geophys. Res. Atmos. 2016, 121, 111–129. [Google Scholar] [CrossRef] [Green Version]
  52. Li, D. Added value of high-resolution regional climate model: selected cases over the Bohai Sea and Yellow Sea areas. Int. J. Climatol. 2017, 37, 169–179. [Google Scholar] [CrossRef]
  53. Feser, F.; von Storch, H. Regional modelling of the western Pacific typhoon season 2004. Meteorol. Z. 2008, 17, 519–528. [Google Scholar] [CrossRef] [PubMed]
  54. Feser, F.; Barcikowska, M. Changes in typhoons over the last decades as given in observations and climate model simulations. In Natural Disasters—Typhoons and Landslides—Risk Prediction, Crisis Management and Environmental Impacts; Nova Science Publishers: Hauppauge, NY, USA, 2014; ISBN 978-1-63463-309-3. [Google Scholar]
  55. Feser, F.; Barcikowska, M. The Influence of Spectral Nudging on Typhoon Formation in Regional Climate Models. Environ. Res. Lett. 2012, 7, 014024. [Google Scholar] [CrossRef]
  56. Barcikowska, M.; Feser, F.; von Storch, H. Usability of best track data in climate statistics in the western North Pacific. Mon. Wea. Rev. 2012, 140, 2818–2830. [Google Scholar] [CrossRef]
  57. Von Storch, H.; Feser, F.; Geyer, B.; Klehmet, K.; Li, D.; Rockel, B.; Schubert-Frisius, M.; Tim, N.; Zorita, E. Regional re-analysis without local data—Exploiting the downscaling paradigm. J. Geophys. Res. Atmos. 2017, 122. [Google Scholar] [CrossRef]
  58. Prein, A.; Langhans, W.; Fosser, G.; Andrew, F.; Ban, N.; Goergen, K.; Keller, M.; Tölle, M.; Gutjahr, O.; Feser, F.; et al. A review on regional convection-permitting climate modeling: Demonstrations, prospects, and challenges. Rev. Geophys. 2015, 53, 323–361. [Google Scholar] [CrossRef] [PubMed] [Green Version]
  59. Geyer, B. High resolution atmospheric reconstruction for Europe 1948–2012: CoastDat2. Earth Syst. Sci. Data 2014, 6, 147. [Google Scholar] [CrossRef]
  60. Platonov, P.; Kislov, A.; Rivin, G.; Varentsov, M.; Rozinkina, I.; Nikitin, M.; Chumakov, M. Mesoscale atmospheric modelling technology as a tool for creating a long-term meteorological dataset. In Proceedings of the International Conference on Computational Information Technologies for Environmental Sciences (CITES-2017), Zvenigorod, Russian Federation, 4–7 September 2017. [Google Scholar]
  61. Tim, N.; Zorita, E.; Hünicke, B. Decadal variability and trends of the Benguela upwelling system as simulated in a high-resolution ocean simulation. Ocean Sci. 2015, 11, 483–502. [Google Scholar] [CrossRef] [Green Version]
  62. Klehmet, K.; Geyer, B.; Rockel, B. A regional climate model hindcast for Siberia: Analysis of snow water equivalent. Cryosphere 2013, 7, 1017–1034. [Google Scholar] [CrossRef]
  63. Kolstad, E.W.; Bracegirdle, T.J.; Zahn, M. Re-examining the roles of surface heat flux and latent heat release in a “hurricane-like” polar low over the Barents Sea. J. Geophys. Res. Atmos. 2016, 121, 7853–7867. [Google Scholar] [CrossRef] [Green Version]
  64. Zhao, Y.; Wang, D.; Liang, Z.; Xu, J. Improving numerical experiments on persistent severe rainfall events in southern China using spectral nudging and filtering schemes. Q. J. R. Meteorol. Soc. 2016, 142, 3115–3127. [Google Scholar] [CrossRef]
  65. Wright, D.G.; Thompson, K.R.; Lu, Y. Assimilating long-term hydrographic information into an eddy-permitting model of the North Atlantic. J. Geophys. Res. Oceans 2006, 111, C09022. [Google Scholar] [CrossRef]
  66. Katavouta, A.; Thompson, K.R. Downscaling ocean conditions: Experiments with a quasi-geostrophic model. Ocean Model. 2013, 72, 231–241. [Google Scholar] [CrossRef]
  67. Katavouta, A.; Thompson, K.R. Downscaling ocean conditions with application to the Gulf of Maine, Scotian Shelf and adjacent deep ocean. Ocean Model. 2016, 104, 54–72. [Google Scholar] [CrossRef]
Figure 1. Similarity of zonal wind at 850 hPa between simulations and (driving) NCEP/NCAR reanalyses in constrained (black and blue) and unconstrained (red and green) simulations with a limited area model. Top: Large spatial scales. Bottom: Regional spatial scales [13], © Copyright 2000 AMS.
Atmosphere 09 00337 g001
Figure 2. Simulated sea level pressure (hPa; isobars) and near-surface wind speed fields (ms−1; shaded) of typhoon Winnie representing 0000 UTC 17 August 1997. (a) With constraining; (b,c) two simulations without constraining. The simulations were initialized with (b) conditions of 0000 UTC 3 August 1997 and (c) conditions of 0000 UTC 7 August 1997. (Model: COSMO-CLM; forcing: NCEP 1; 50 km grid resolution. [44]) © Copyright 2008 AMS.
Atmosphere 09 00337 g002aAtmosphere 09 00337 g002b
Figure 3. Snapshots of January 1995 Medicane on 15 January at 18 UTC. (a) Sea level pressure (2 hPa contours) and wind field (m/s, color shaded) from the forcing NCEP reanalysis. (b) Same as (a) but from COSMO-CLM simulation at 10 km resolution.
Atmosphere 09 00337 g003
Figure 4. Track density of simulated Medicanes in the 1948–2010 period (COSMO-CLM, 10 km grid resolution, forcing: NCEP; [4]).
Atmosphere 09 00337 g004
Figure 5. Low-level jets statistics over the Bohai Sea and Yellow Sea during April, May, and June (1979–2013): (a) Jet height histogram (%), (b) jet wind speed histogram (%), (c) jet height-wind speed distribution, and (d) jet wind rose [6], © Copyright 2018 American Geophysical Union (AGU).
Atmosphere 09 00337 g005
Figure 6. Vorticity fields of typhoon “Tokage” at the time of its maximum strength 1800 UTC 19 October 2004, (a) in the NCEP/NCAR re-analysis and (b) in the constrained global model [34], © Copyright 2017 AMS.
Atmosphere 09 00337 g006
Figure 7. Brier Skill Scores (red: improvements; blue: no improvement) of a regional hindcast using: (a) 55 km grid resolution; (b) 7 km grid resolution with the constrained global model over the period of December 1999–November 2009 for marine surface wind speeds of 3–25 m/s relative to observational reference data (“truth”) QuikSCAT [57], © Copyright 2017 AGU.
Atmosphere 09 00337 g007
Figure 8. (ai) Two Coastal Low Level Jets (LLJ) A and B simulated in a constrained COSMO-CLM simulation with a grid resolution of 7 km, forced by ERA-Interim with three-hourly increments starting from 1 April 2006. The dotted area features maximum wind speed larger than 10 m/s at height below ~3 km, the colored area stands for low level jets, with differences between the wind maximum and minimum larger than or the wind speed at ~3 km greater than 5 m/s. LLJ A: Starting from weak and small LLJ, then growing and becoming strong LLJ, then decaying and disappearing. LLJ B: A well-developed LLJ at the beginning, then disintegrates into LLJ pieces, decaying and disappearing.
Atmosphere 09 00337 g008

