Single Scattering Albedo’s Spectral Dependence Effect on UV Irradiance
by

Ioannis-Panagiotis Raptis
1,2,*, 
Stelios Kazadzis
1,2, 
Kostas Eleftheratos
3,4,
Vassilis Amiridis
5 and
Ilias Fountoulakis
6,7
1
Institute for Environmental Research and Sustainable Development, National Observatory of Athens, 15236 Athens, Greece
2
Physicalisch-Meteorologisches Observatorium Davos, World Radiation Centre, 7260 Davos, Switzerland
3
Department of Geology and Geoenvironment, National and Kapodistrian University of Athens, 15783 Athens, Greece
4
Centre for Environmental Effects on Health, Biomedical Research Foundation of the Academy of Athens, 11527 Athens, Greece
5
Institute for Astronomy, Astrophysics, Space Applications and Remote Sensing, National Observatory of Athens, 15236 Athens, Greece
6
Aosta Valley Regional Environmental Protection Agency (ARPA), 11020 Saint-Christophe, Italy
7
Laboratory of Atmospheric Physics, Aristotle University of Thessaloniki, 54124 Thessaloniki, Greece
*
Author to whom correspondence should be addressed.
Atmosphere 2018, 9(9), 364; https://doi.org/10.3390/atmos9090364
Submission received: 25 June 2018
/
Revised: 14 September 2018
/
Accepted: 17 September 2018
/
Published: 19 September 2018
(This article belongs to the Section Aerosols)
Abstract
:The absorbing and scattering nature of aerosols affects the total radiative forcing and is quantified by single scattering albedo (SSA), which is defined as the absorption to total extinction ratio. There are limited measurements of SSA in the ultraviolet (UV) irradiance spectrum, hence, the influence of SSA on incoming UV irradiance has not been explored in great depth. In the present study, UV irradiance was calculated and compared using different SSA datasets retrieved at Athens, Greece during 2009–2014; including SSA time series from Ultraviolet Multi-Filter Radiometer (UVMFR) at 332 and 368 nm, SSA from AERONET at 440 nm, from OMI satellite at 342.5 nm and AeroCom climatological database at 300 nm. Irradiances were estimated using a radiative transfer model (RTM). Comparisons of these results revealed that relative differences of UVA and UVB could be as high as 20%, whilst average relative differences varied from 2% to 8.7% for the entire experimental period. Both UVA and UVB drop by a rate of ~12% for 0.05 aerosol absorption optical depth in comparison to ones estimated with the use of SSA at visible range. Brewer irradiance measurements at 324 nm were used to validate modeled monochromatic irradiances and a better agreement was found when UVMFR SSAs were used with an average difference of 0.86%. However, when using visible or climatological input, relative differences were estimated +4.91% and +4.15% accordingly.
1. Introduction
Aerosols are among the major agents of Earth’s radiative budget, having a crucial effect on the climate. Aerosols directly absorb solar irradiance and contribute to the heating of the atmosphere. Furthermore, they reduce the planetary albedo, either directly or by enhancing the absorption of solar and terrestrial radiation by clouds [1]. Thus, their presence affects the thermal state of the atmosphere by having both a heating and a cooling effect. The highest uncertainties of anthropogenic climate change are caused by factors controlling aerosol forcing. A recent comprehensive review of the current state of knowledge on aerosol effect on radiation and climate is provided by Intergovernmental Panel on Climate Change (IPCC) [2], where the total direct forcing of aerosols is estimated in the scale of −0.45 W/m2, though with uncertainty more than 100%. One of the major sources of uncertainty in contemporary modelled aerosol climate forcing is the absorbing/scattering nature of the particles. Spectral dependence of columnar absorbing characteristics of aerosols causes changes in the radiative forcing of the atmosphere, as well as the climate. Columnar aerosol absorption of ultraviolet (UV) irradiance is even less studied, but has a significant effect as it strongly influences photolysis rates and indirectly affects agricultural production and human health [3,4].
The aerosols that show a significant absorbing behavior are mainly black carbon, mineral dust, and organic aerosols grouped as brown carbon [3]. Urban aerosols were found to absorb more in the UV than in visible wavelengths, especially when black carbon particles dominate the mixture [5]. Jethva and Torres [6] found evidence that absorption from biomass burning aerosols has a significant spectral dependence, showing significant effects at the UV part of the solar spectrum. Corr et al. [7] presented a significant enhancement of columnar aerosol absorption in the UV region, in Mexico City, which was attributed to increased organic carbon components in the aerosol mixture. More recent studies [3,8] attributed the large differences between visible and UV columnar absorption to brown carbon emitted from biomass burning. In addition, desert dust particles are strong absorbers at UV band [9], especially when there is high concentration of hematite in the coarse mode [10].
The most commonly used variable for monitoring aerosols in the atmosphere is the aerosol optical depth (AOD), which is retrieved by ground-based [11,12] and satellite instruments [13]. AOD varies a great deal at different parts of the spectrum and the variable of the Angström exponent is used to quantify the extinction’s spectral behavior, which influences incident irradiance. These two parameters define the largest part of aerosol’s influence on radiative transfer and, hence, have been studied the most. Additionally, a significant role on radiative transfer calculations is played by single scattering albedo (SSA), which is defined as the ratio of scattering to total extinction. Thus, it is linked to the chemical composition and the size of the particles. High SSA signifies more scattering aerosols, while lower values are linked to more absorbing types. SSA value determines the cooling/warming outcome of the aerosol radiative forcing effect [14]. Thus, uncertainties in the estimation of SSA could lead to changes on the sign of radiative forcing. Furthermore, SSA is strongly spectrally-dependent, demonstrating different behavior according to aerosol mixture, which may lead to significant changes as a function of wavelength [15]. SSA used in radiative transfer model (RTM) calculations refers to the vertical profile (column) of the aerosol extinction coefficient that usually differs significantly from the in situ measured one [8]. These profiles of the extinction coefficient can be retrieved by airborne in situ vertical profiling of aerosols [16,17,18] but this approach remains very expensive and is rarely used in experimental campaigns. More commonly, retrievals of the mean columnar SSA from sun-photometric instruments are used to scale default climatological profiles used for RTM simulations [19] Measurements of the mean columnar SSA are available from a large number of sites around the globe, though rarely in the UV [8,20].
SSA retrievals in the visible and near infrared spectral range are available from the most common sun-photometric networks. The Aerosol Robotic Network (AERONET) provides SSA in that range using an inversion algorithm [21]. The international network for aerosol, clouds, and solar radiation studies and their applications (SKYNET) [22,23] also retrieves SSA at visible wavelengths. Meanwhile, recent efforts have been made to also provide SSA at 340 and 380 nm, though it seems to systematically underestimate compared to UVMFR retrieved SSA, which is linked to the use of very high surface albedo value (0.1) in the current algorithm [20]. Still, datasets of SSA in the UV spectral region retrieved from ground-based measurements are not frequent and usually are available for short periods of time, whilst in scientific literature there are a few publications on the subject [4,7,8,20,24,25,26,27]. UVMFR measurements are used in some of the above studies to retrieve SSA in UV wavelengths following the methodology as described in Kroktov et al. [25,26].
SSA in the UV spectral region is also retrieved from satellite sensors. Ozone Monitoring Instrument (OMI) on board NASA’s AURA satellite measures reflected radiation from the Earth’s surface in the 270–500 nm spectral range. The OMAERUV algorithm [28,29] is used to retrieve the AOD and SSA at 20 wavelength bands. The SSA in the UV is retrieved for the bands with central wavelengths at 388 nm and 342.5 nm. SSA retrieved from this algorithm has been assessed, compared to AERONET retrievals at visible wavelengths [6,28,30,31], though both inversion techniques use several assumptions, resulting in them not being directly comparable. Jethva et al. [31] found that the highest differences of satellite and ground-based SSA are over the Arabian Peninsula, biomass burning areas in Southeast Asia, Australia, and occasionally, above urban sites around the globe.
UV irradiance is less than 10% of the solar irradiance reaching the Earth’s surface, even though it is very important for the biosphere. The UV solar spectrum is divided into three zones: UVC (<290 nm), where practically all irradiance is blocked by the atmosphere; UVA (315–400 nm), which provides ~90% of the total UV radiation reaching the surface; and UVB (290–315 nm), which is the most harmful for living cells, as well as being beneficial for humans at the same time, by defining the creation of vitamin D in the human skin [32,33]. Ozone is the dominant attenuator of UVB irradiance and the most important atmospheric factor for its deviations [34]. Aerosol attenuation in UV spectral region is also a non- negligible factor for the irradiance reaching the surface and, in some cases, its effects have been found to be as important as those of ozone [35,36,37,38,39]. Additionally, absorbing aerosols indirectly affect irradiance’s variability, by reducing the incident UV irradiance and altering lower atmosphere’s photochemistry, thus affecting tropospheric ozone’s concentration (up to 50 ppb has been reported) [38].
Several factors related to human health are actively related to the UV irradiance estimation, such as DNA damage, Vitamin D Effective Dose and the UV index (erythema) for human exposure to the sun for numerous vulnerable population groups (e.g., pregnant women, light-colored skins, etc., as described by the World Health Organization) [40]. These variables are monitored in few countries through surface networks [41,42,43] but have greater value when forecasted through RTM and are available to the general public [44]. Due to the lack of sources for SSA in the UV region, it is a common practice when estimating UV or forecasting health-related variables such as the UV index, to transfer SSA values from available visible wavelengths to UV wavelengths in radiative transfer calculations, or just use climatological values [34].
This work aims to quantify the impact of spectral SSA (measurements and estimations) in the UV spectral region on UVA and UVB simulations from RTMs. Datasets of SSA retrieved at UV region from UVFMR measurements, from satellites and from climatological databases, alongside with CIMEL SSA retrievals at 440 nm were used as inputs in RTM. All data were recorded or refer to Athens, Greece for 2009–2014 period. Results have been compared to obtain a robust estimation of the impact of SSA on UV irradiance. Additionally, actual irradiance measurements from a collocated Brewer spectroradiometer at 324 nm were used to validate the RTM results for different SSA inputs.
2. Data and Methods
In order to quantify the effect of the absorbing and scattering nature of aerosols, the main physical variables used are SSA and absorption aerosol optical depth (AAOD). The SSA at a wavelength λ is defined as the relative contribution of aerosol scattering extinction (bsca) to total extinction (bsca + babs), thus, indirectly describing also the absorption contribution (babs):
SSA = (bsca (λ))/(bsca (λ) + babs (λ))
Values of SSA range from 0 to 1 by definition; yet, in the Earth’s atmosphere, they are very rarely lower than 0.65 [7].
AAOD is calculated in respect to AOD and SSA as follows:
AAOD(λ) = AOD(λ) × (1 − SSA(λ))
This variable is convenient for quantifying the final effect of the variations of aerosol absorption on radiative forcing, because it considers both the total extinction by aerosols and the scattering portion and, cases of high AOD and low SSA, which lead to the largest reduction of irradiance, are more clearly identified.
The ground-based measurements used in this study were recorded during the period 2009–2014 in Athens, Greece. The site of the measurements was the roof of Biomedical Research Foundation of the Academy of Athens (37°54′ N, 23°48′ E, 130 m above sea level), near the city center, where the ground-based Atmospheric Remote Sensing Station (ARSS) was in continuous operation during this period [45]. Part of the ARSS infrastructure are a CIMEL sun-photometer and a UVMFR that were used in the present study. On the same roof, there was also a Brewer MKIV single monochromator installed. Athens has warm and dry summers and wet and mild winters, typical for the Eastern Mediterranean. Athens has a population of 5 million and most of the urban emissions are trapped in the basin due to topography. Average AOD at 440 nm is 0.22 with σ at 0.11 and average Angström exponent 440–870 nm at 1.3, according to AERONET level 2 retrievals. Additionally, there are common cases of long transport of air masses from arid areas of Northern Africa, frequently associated with dust events that affect the area [46].
2.1. UVMFR
UVMFR is an instrument manufactured by Yankee Environmental Systems, Turner Falls, MA, U.S.A., designed to measure Global and Diffuse Horizontal Irradiance at UV wavelengths. Incoming Irradiance is filtered and recorded at channels centered around seven bandwidths (300, 305, 311, 317, 325, 332, and 368 nm) with nominal full width half maximum at 2 nm. Each measurements cycle lasts 10 s and averaged 1 min values are stored. In each cycle, two diffuse horizontal irradiance (DHI) and one global horizontal irradiance (GHI) measurements are performed, defined by the position of a moving shadowing disc. Thus, all data are recorded using the same sensor and the direct nominal irradiance (DNI) is retrieved by subtracting DHI from GHI. Furthermore, corrections for dark current and angular response are applied [25].
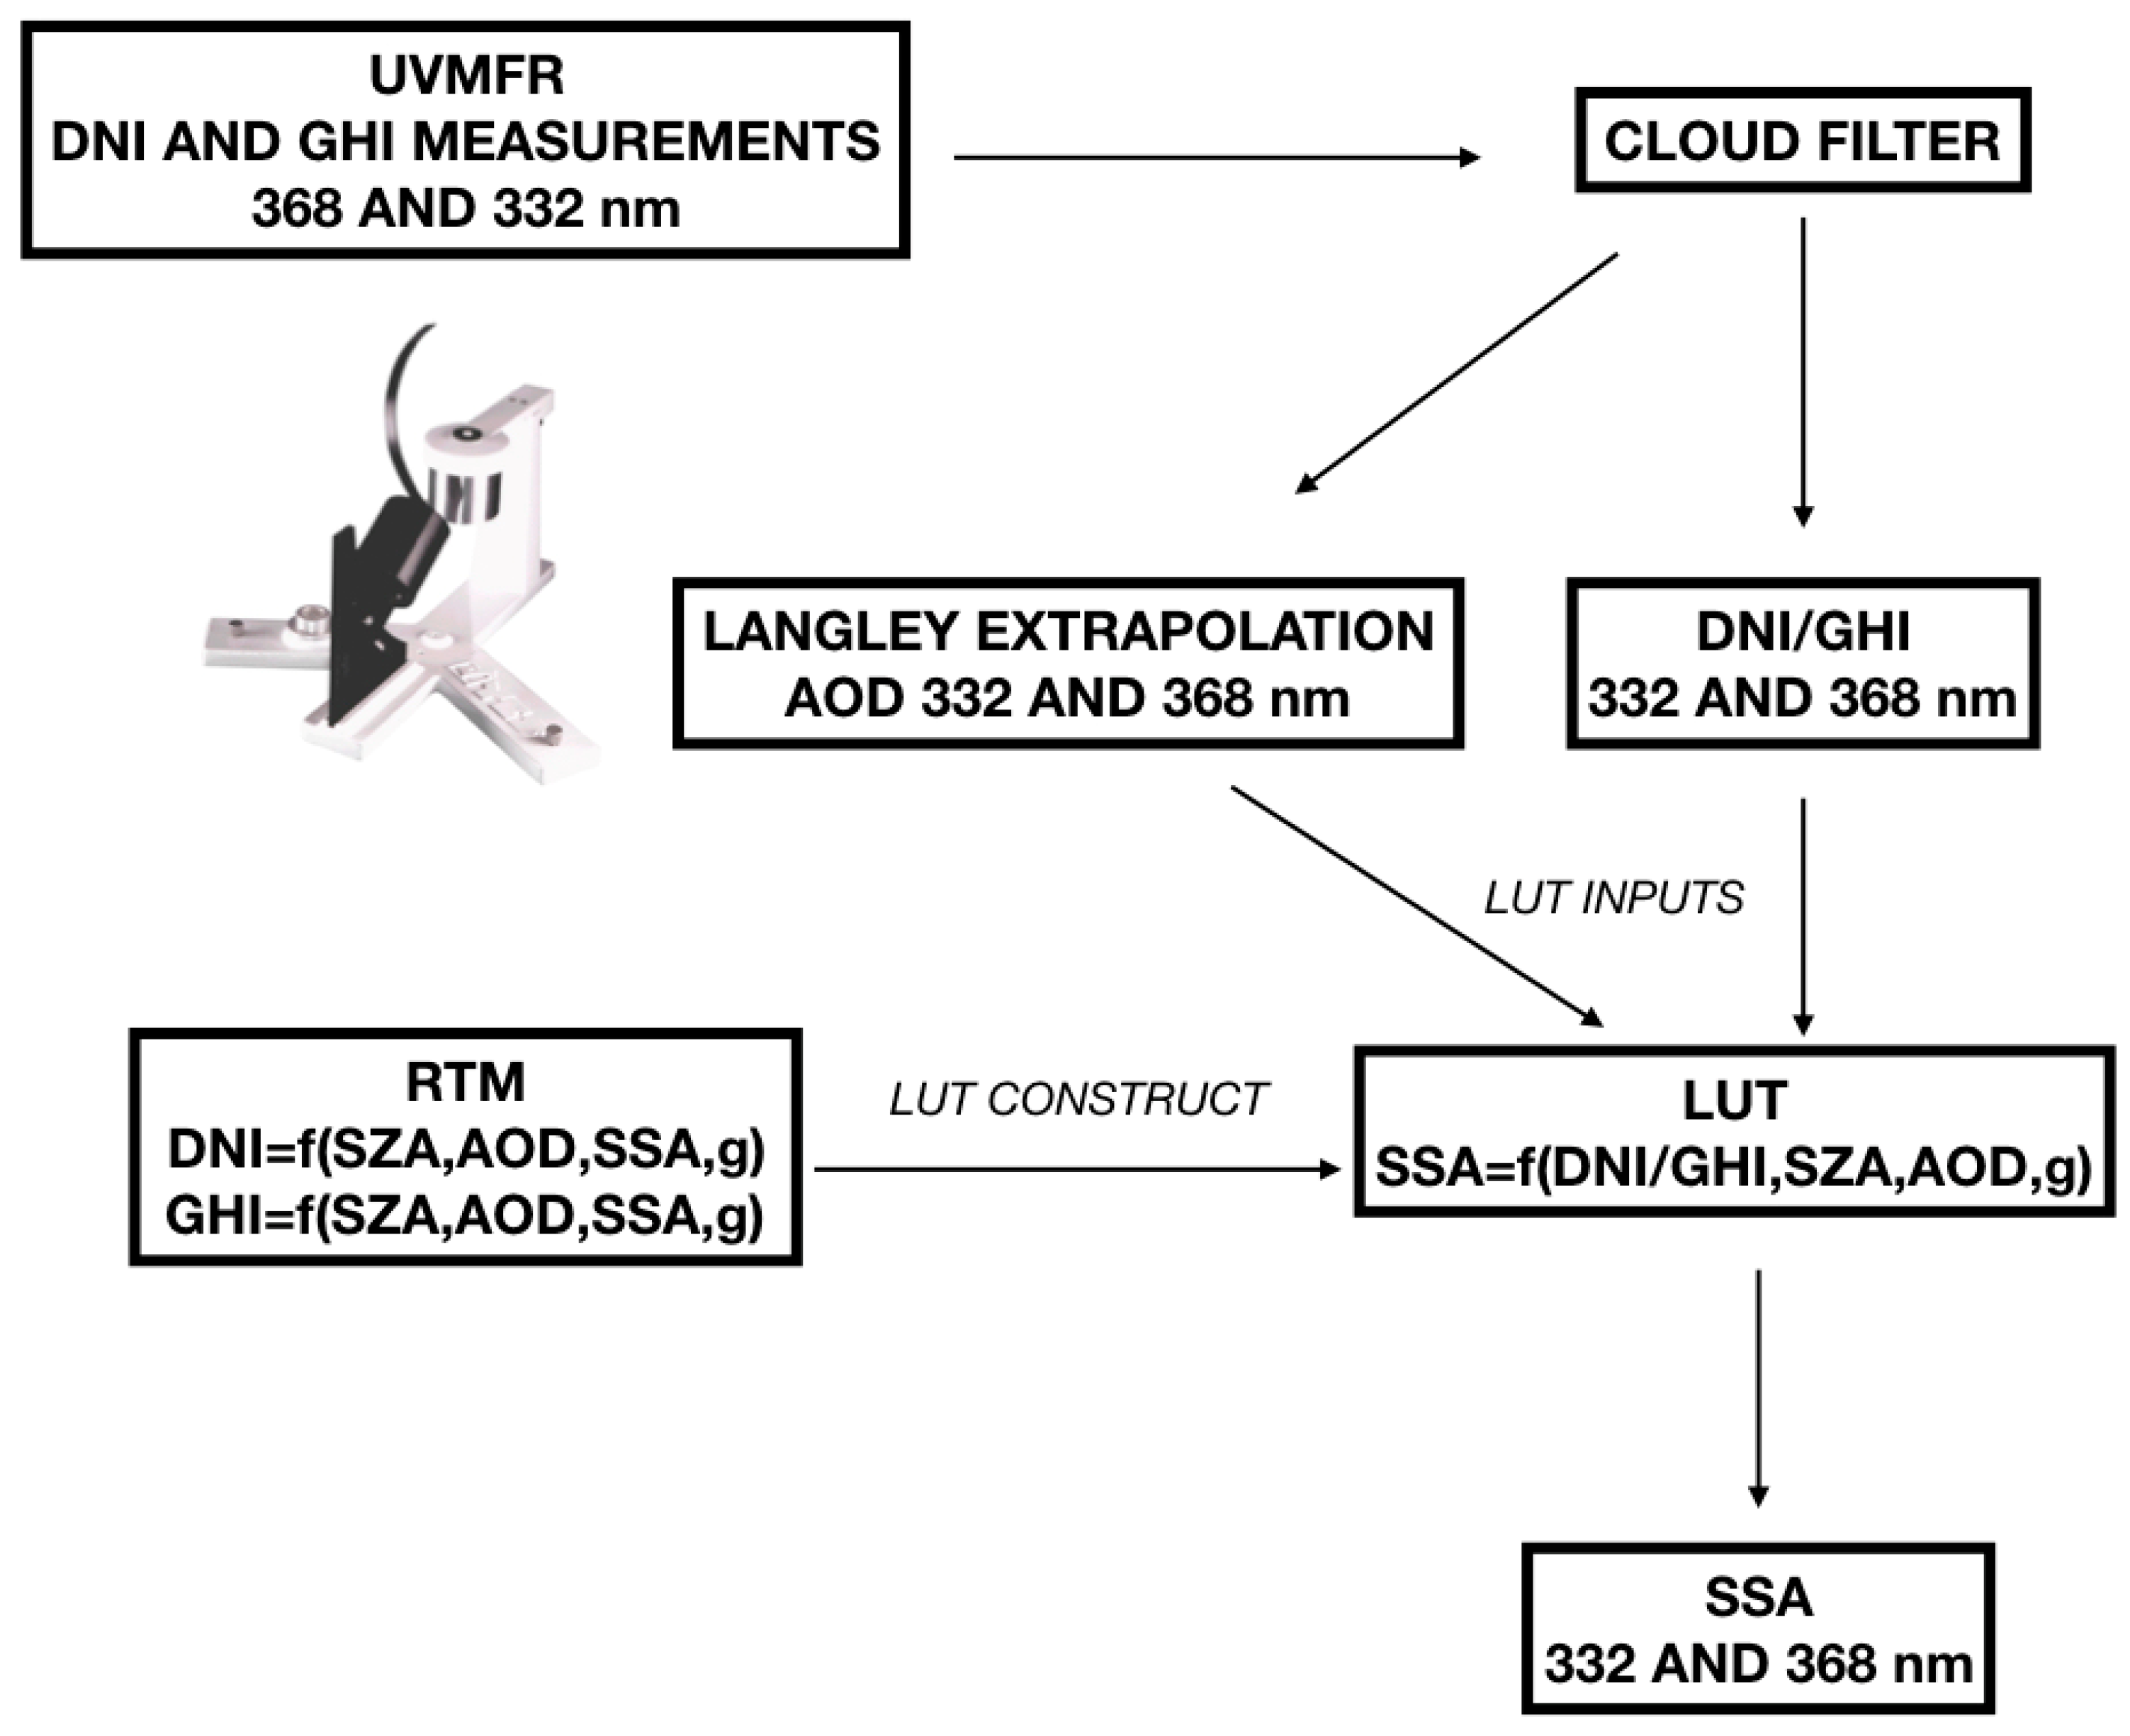
Kazadzis et al. [8] have developed a method for retrieving SSA at 332 and 368 nm using UVMFR measurements. This method is described in detail in the abovementioned work while in the present study a short outline is presented, along a diagram of the steps shown in Figure 1. Ratios of DHI/GHI are calculated for every measurement at 332 and 368 nm. Additionally, AOD is calculated at these wavelengths for each measurement. RTM calculations were performed using the Libradtran [47] code and lookup tables (LUT) were created linking DHI/GHI ratios and other variables, such as solar zenith angle (SZA), AOD, and SSA (for more details, see Section 2.6). Thus, a model was developed to calculate the SSA at each wavelength using these LUTs, as follows:
where λ indicates the wavelength. The method benefits from the technical fact that both DHI and GHI are measured by the same sensor, so there is no absolute calibration related uncertainty. Uncertainty analysis performed in Kazadzis et al. [8] revealed a final mean SSA error of the order of 6% for Athens’ dataset, which might even exceed 15% in cases of very low aerosols (AOD < 0.1) and very low SZA (<20°). At this study, we have used the same UVMFR dataset and model runs for the exact same period.
SSA(λ) = f(DHI(λ)/GHI(λ), SZA, AOD(λ))
It should be noted that the determination of both AOD and SSA from the UVMFR instrument at wavelengths lower than 332 nm is highly uncertain due to the total column ozone effect on solar irradiance attenuation [48]. The determination of the SSA using this method becomes even more difficult at such low wavelengths, as the uncertainty in the AOD retrieval introduces additional uncertainties to the SSA retrieval. For this purpose, AOD and SSA from UVMFR at 368 nm for UVA and at 332 nm for UVB related model runs have been used. Although 332 nm is found in UVA region, it is used for this study’s UVB RTM calculations as it is the closest wavelength with robust AOD retrieval. The uncertainty introduced by this choice could vary, according to Angström exponent in the UVB region, which could be up to 1.3% for AOD at 305 nm.
2.2. AERONET
CIMEL sun-photometers are the standard instruments of AERONET (Aerosol Robotic Network). Holben et al. [11] present a detailed description of the CIMEL instruments and AERONET protocols. These devices record DNI at eight wavelengths (340, 380, 440, 500, 675, 870, 940, 1020, 1640 nm) and use the measurements at seven channels to retrieve AOD, while measurements at 940 nm are used to retrieve the total column of water vapor. CIMEL sun-photometers also have a sky radiance measurement schedule at almucantar planes. These sky radiances are imported to a RTM model resulting inversion products to be exported based on various hypotheses. These products include radiative properties such as SSA, phase function and asymmetry parameter. SSA is calculated at four wavelengths (440, 675, 870, 1020 nm). Level 2 (L2) data that are quality assured for SSA are produced only when AOD at 440 nm exceeds 0.4 and SZA exceeds 50° [49]. In order to enrich the dataset within this study, we have also used Level 1.5 SSA data when L2 size distribution was available (as suggested by Kazadzis et al. [8]), since the limitation of L2 filtered out an important part of the retrievals for Athens dataset, where AOD > 0.4 is not often.
2.3. Brewer Spectrophotometer
Measurements of global and direct spectral UV irradiance have been routinely conducted at ARSS, since July 2003 on daily basis by a Brewer MKIV monochromator measuring solar radiation in the UV and the visible part of the solar spectrum. The instrument measures columnar amounts of ozone (Total Ozone Column—TOC), SO2, and NO2. It also measures global (horizontal) irradiances in the UV-B section (290–315 nm) of the spectrum at 0.5 nm intervals. For total column ozone measurements, the instrument is designed to take direct sun measurements at five nominal wavelengths 306.3, 310.1, 313.5, 316.8, and 320.0 nm, these are used with the standard algorithm to retrieve columnar ozone measurements from Brewer spectrophotometers [50]. Brewer ozone data for Athens have been analyzed in recent studies [51,52]. In addition, the instrument was used to derive AOD in the visible part of the solar spectrum [53]. For the first time in this study, we analyzed spectral UV irradiance measurements at 324 nm from the Athens Brewer instrument, for the period January 2009 to December 2014. The Brewer spectroradiometer is calibrated regularly by means of a standard radiometer of the same type. The last three calibrations were performed at the Academy of Athens in July 2007, October 2010 and October 2013 by the travelling standard Brewer #017 (International Ozone Services Inc., Mr. Ken Lamb and Dr. Volodya Savastiouk).
2.4. AeroCom
The Max-Planck-Institute Aerosol Climatology version 1 (MAC-v1) provides optical properties of the total column of tropospheric aerosols, such as the AOD, the SSA and the asymmetry parameter [54]. The MAC-v1 climatology has been widely used in studies involving aerosols [34,55,56]. The parameters are provided on monthly timescales for the entire globe, with spatial resolution of 1° × 1°. They have been derived by combining ground-based monthly statistics for aerosol optical properties from sun-photometer networks with the median of 15 models used Aerosol Comparison between Observations and Models (AeroCom) [57]. Climatology was initially created for the mid-visible aerosol column optical properties, since reliable ground-based measurements exist mainly for the visible range of the solar spectrum. This was later extended to other wavelengths of the solar and the far-infrared spectrum (ranging from 0.23 to 8 μm and 3.6 to 100 μm respectively) with the proper assumptions. In the UV region (UV-C, UV-B and UV-A) the optical properties are provided for 0.23, 0.3 and 0.4 μm. A linear interpolation of the desired parameters to the coordinates of ARSS were applied, since the coordinates of the ARSS do not coincide with any of the climatology grid points.
2.5. OMI
Aura satellite launched in 2004 by NASA carries the Ozone Monitoring Instrument (OMI). OMI scans the entire earth’s surface in 15 orbits per day, with a ground spatial resolution of ~13 × 24 km2, measuring reflected radiation in 20 bandwidth channels in the spectral region of 270–500 nm [29]. UV aerosol index, AOD and SSA are retrieved at 342.5 and 388 nm using OMAERO algorithm, whilst there are also aerosol products from the OMAERUV algorithm which are a continuation of the Total Ozone Mapping Spectrometer time series [58]. The algorithm has been revised by adding a more sophisticated carbonaceous aerosol model [6] and by including a spectral dependent imaginary index as a proxy for organics in the mixture [59]. This satellite product has major sources of uncertainty caused by cloud contamination, the height of aerosol layer and the hypothesis of surface albedo, especially in desert areas [31]. In the present study, we have used SSA and AOD from OMAERO, averaged at monthly level, using only 2009–2014 data, for the pixel including the location of the ground-based instruments. These data are available online [60].
2.6. Radiative Transfer Model
For RTM calculations, the Libradtran code [47,61] was used. Multiple runs were performed to construct appropriate LUTs, for calculating SSA through DNI and GHI measurements and then UV irradiance from SSA retrievals. Output spectra were set to 0.1 nm resolution for both GHI and DNI. Input values for AOD were 0–1.5 with a step of 0.1, for SZA 1–81° with a step of 2.5°, for SSA 0.60–0.96 with a step of 0.02 and for TOC 250–400 DU with a step of 15 DU. As described in Section 2.1 and in earlier work [8], the output was used to calculate SSA from UVMFR measurements. Afterwards, RTM output data were used to calculate Irradiance in the UV spectral region. UVA was calculated by integrating GHI values between 315–400 nm and between 290–315 nm for UVB accordingly. Additionally, time series of irradiance at 324 nm were calculated in order to compare with Brewer measurements. Since the aim of the present work is to investigate the difference in irradiance caused by different estimation of SSA, other variables, such as TOC, NO2, and surface albedo, were used as constant inputs, using Athens climatology. Thus, the parametrization used is as follows:
where SZA is derived from astronomical calculations and SSAi is used differently in each of the retrieved or the climatological (AeroCom) datasets For UVA and UVB, AOD retrieved with UVMFR at 368 nm and at 332 nm was used respectively, and the Angström exponent is calculated from these data. The uncertainty of this choice is discussed in Section 2.1. For calculating UV at 324 nm, AOD extrapolated from 332 nm was used, which adds an uncertainty lower than the one of the measurement (0.01 AOD). TOC was set to climatological values derived from Brewer time-series. For calculating UV irradiance at 324 nm with the RTM, mean values of Brewer TOC, averaged at ±2 h interval around cloudless Brewer measurements were used. The extra-terrestrial irradiance spectrum of ATLAS-3 [62] was used and the US Standard aerosol profiles were set [63] and maintained the same in all sets of runs to avoid any effect on the comparisons. NO2 was also set to a constant mean climatological value. Keeping constant values for all inputs, except aerosol parameters and sun elevation, provide the opportunity to study the SSA effects on UV solar irradiance, only. In order to validate the RTM outputs when comparing to Brewer measurements, RTM runs have been calculated using an extraterrestrial irradiance convoluted with the Brewer slit function, in order to have comparable results [64]. Modelled UVA and UVB values were calculated by integrating the RTM output irradiances at 315–400 nm and 290–315 nm accordingly. The comparison between RTM and Brewer UV irradiances at 324 nm was carried out using 324 ± 1 nm integrals. The choice of this wavelength was to minimize the ozone effect on the absolute comparison differences [65]. For the same period, asymmetry factor (g) at 440 nm from AERONET at the station shows mean value of 0.69 with a standard deviation of 0.03, while 3.2% of the values are higher 0.72% and 2.9% lower than 0.66. Since measurements of g in the UV spectral range are not available, these values were used in RTM [7]. A sensitivity analysis on the response of RTM output on g changes revealed variations of 0.6% on both UVA and UVB, when mean AOD and SSA where used, for mean ± σ values for g. We have used mean monthly values for calculations of UVA and UVB, which varied in the range 0.68–0.71. For calculating UV irradiance at 324 nm, mean daily (or monthly if not available) from CIMEL for each Brewer cloudless measurement was used. Surface albedo at UV spectral region is very low, in the order of 2–4%, in snow free conditions [24], and a constant value of 0.04 was used in our calculations. Brewer measurements are considered as state of the art for TOC measurements with an uncertainty in the order of 3%. Including this uncertainty, for the 324 nm UV retrievals, the introduced error is less than 0.2%. For similar calculations at lower wavelengths, the introduced uncertainty would be much higher. All results are presented in the form of relative differences of irradiances. Hence, any uncertainty introduced by the above selections will alternate absolute values, but will be eliminated in current comparisons.
UVA = f(AOD368,SSAi,SZA)
UVB= f(AOD332,SSAi,SZA)
3. Results and Discussion
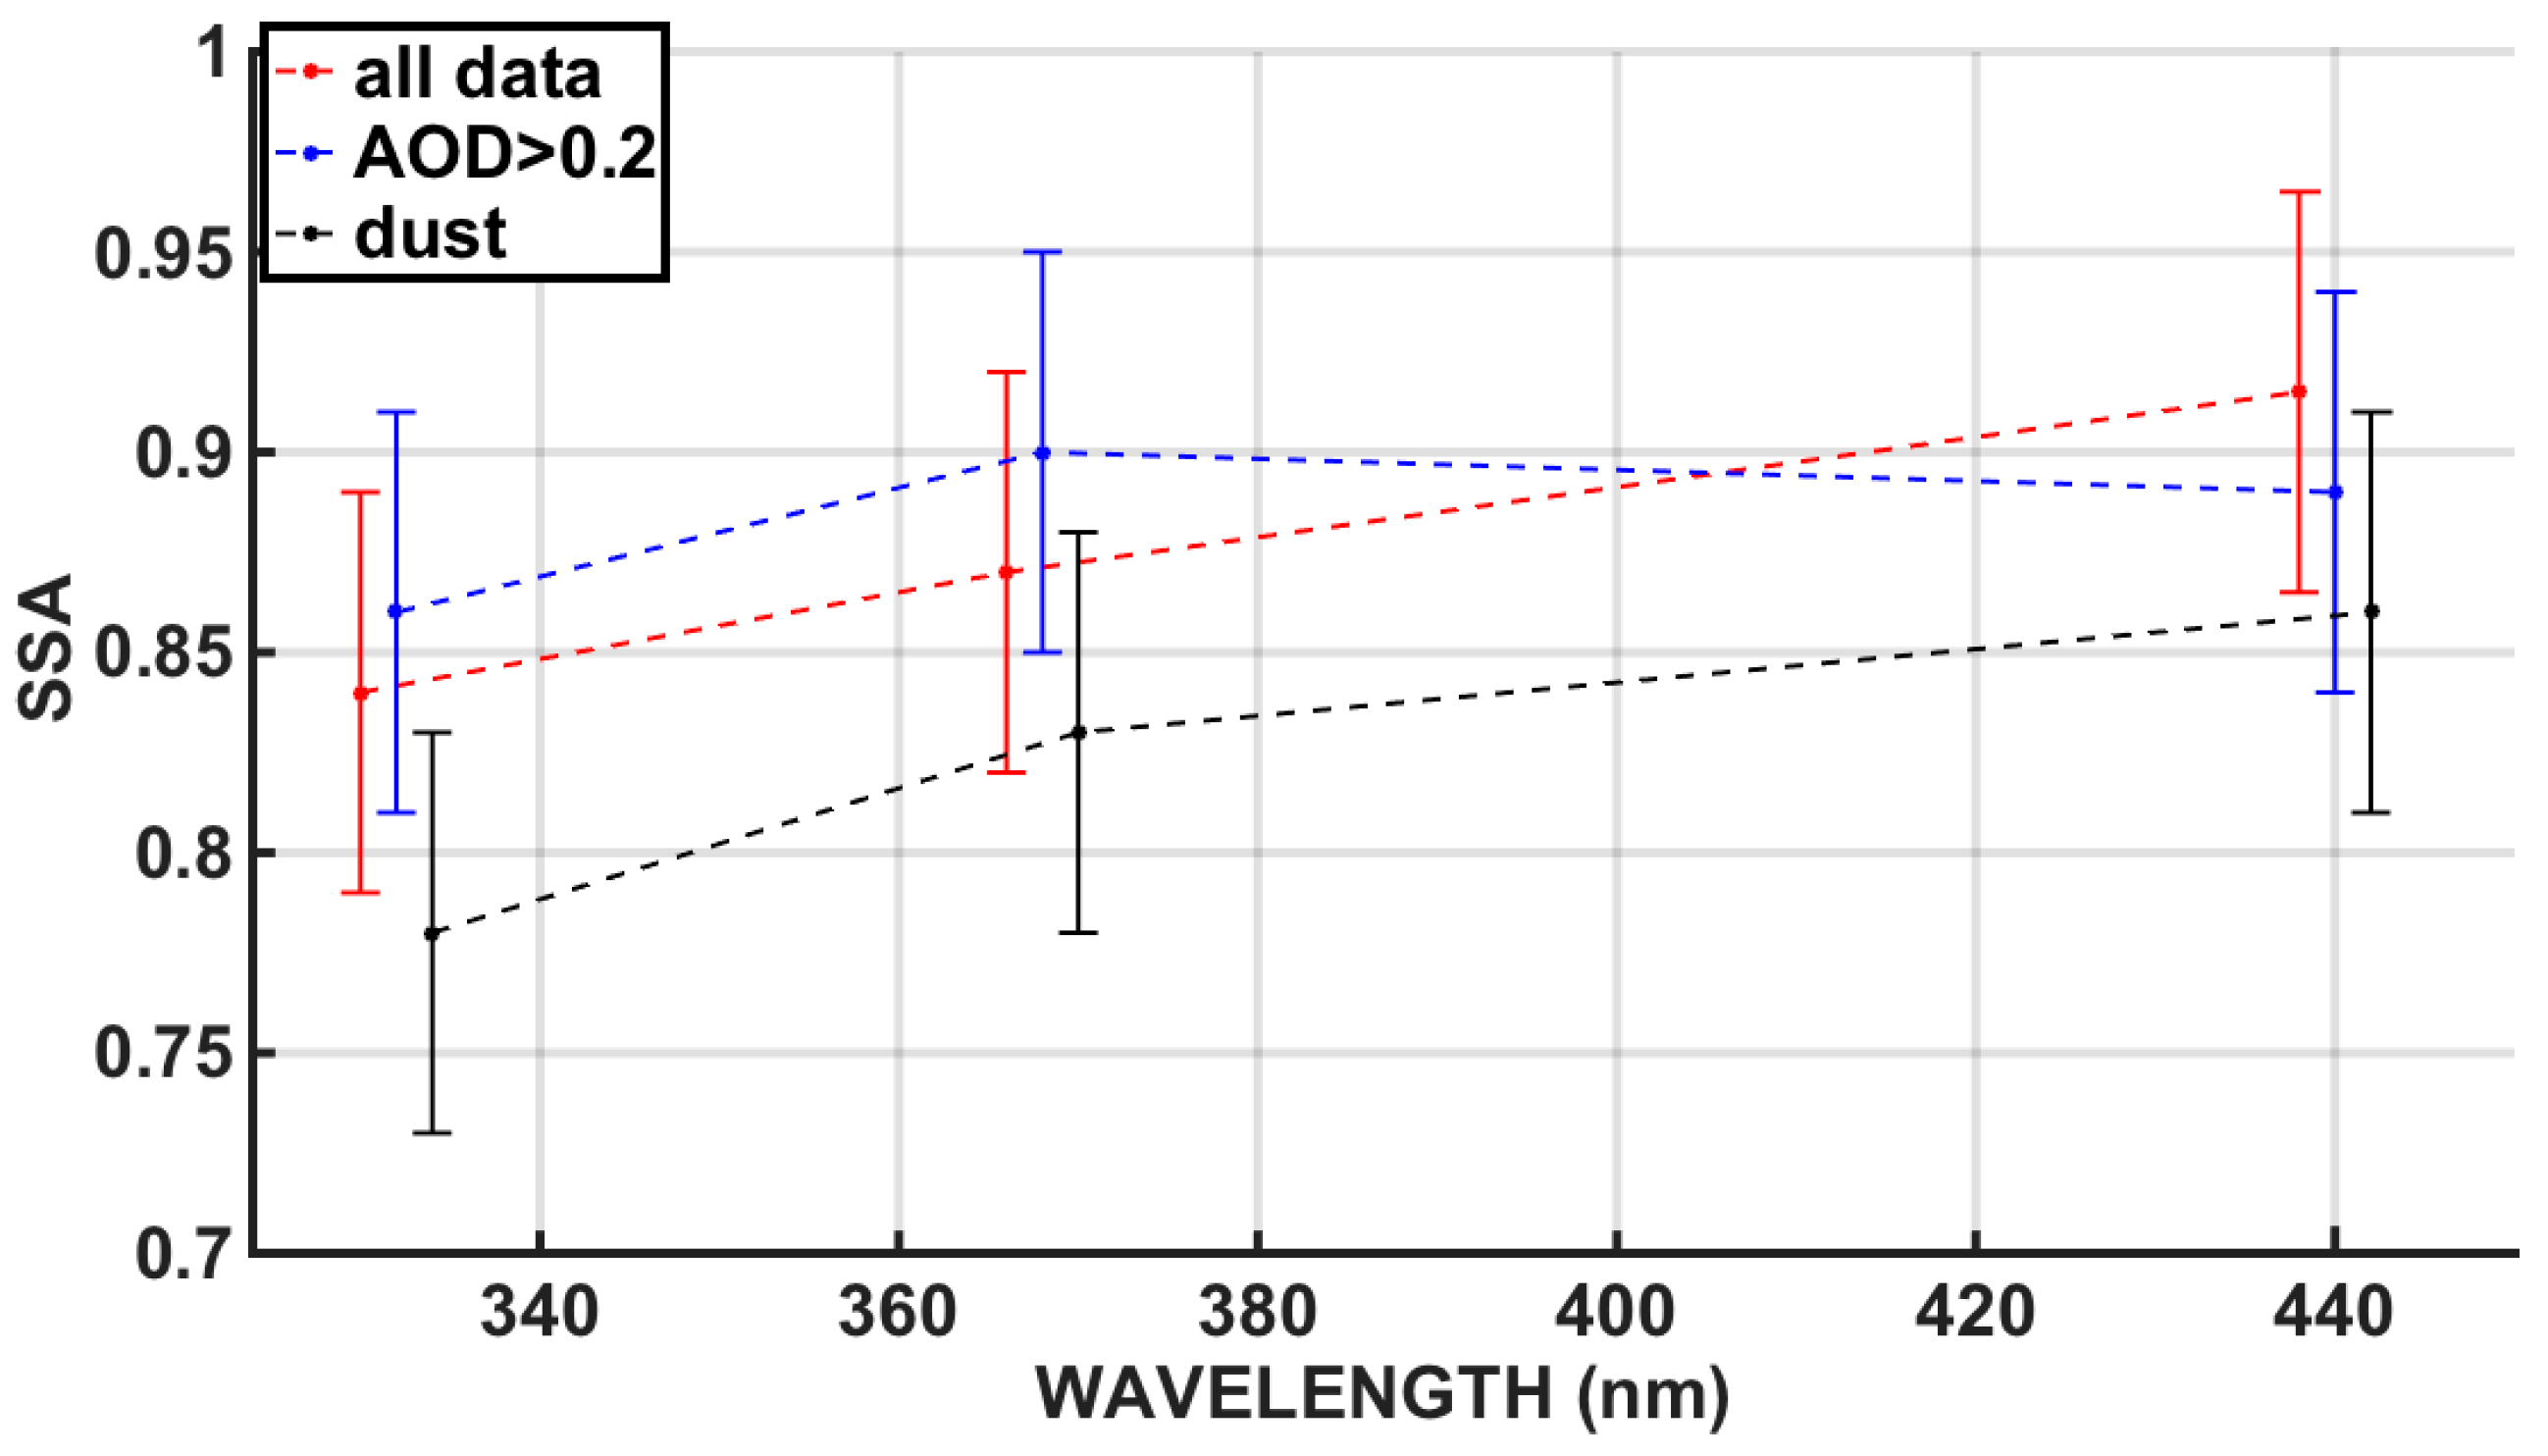
Five-year average SSA recorded at 332 nm and 368 nm retrieved from UVMFR and at 440 nm from CIMEL are presented in Figure 2, alongside with error bars at 1 standard deviation. Averages have been calculated separately for all data. For data with AOD higher than 0.2 and for data with Angström exponent lower than 0.7 which is linked to the presence of large and most frequently dust aerosols [8]. We can observe a systematic decrease of SSA values when moving from visible to lower wavelengths for the whole dataset. Using all AOD data, we observe a drop of SSA from 440 nm to 332 nm of ~0.075. Whilst for AOD > 0.2 data the drop is smaller (~0.04) and SSA368 is higher than SSA440, which in Kazadzis et al. [8] was linked to the frequent occurrence of brown carbon aerosols and polluted dust mixtures. For dust aerosol cases SSAs are generally lower by ~0.05 for all wavelengths, showing a drop of ~0.07 from 440 nm to 332 nm. More details about this dependence can be found in [8]. A lot of studies summarized by Bais et al. [34], are in accordance with this behavior and, in this study, it is underlined that SSA extrapolation to UV wavelengths is often a reasonable approximation for scattering but less so for absorption, which is more dependent on chemical composition and that UV enhanced absorption is caused by organic material in the particles.
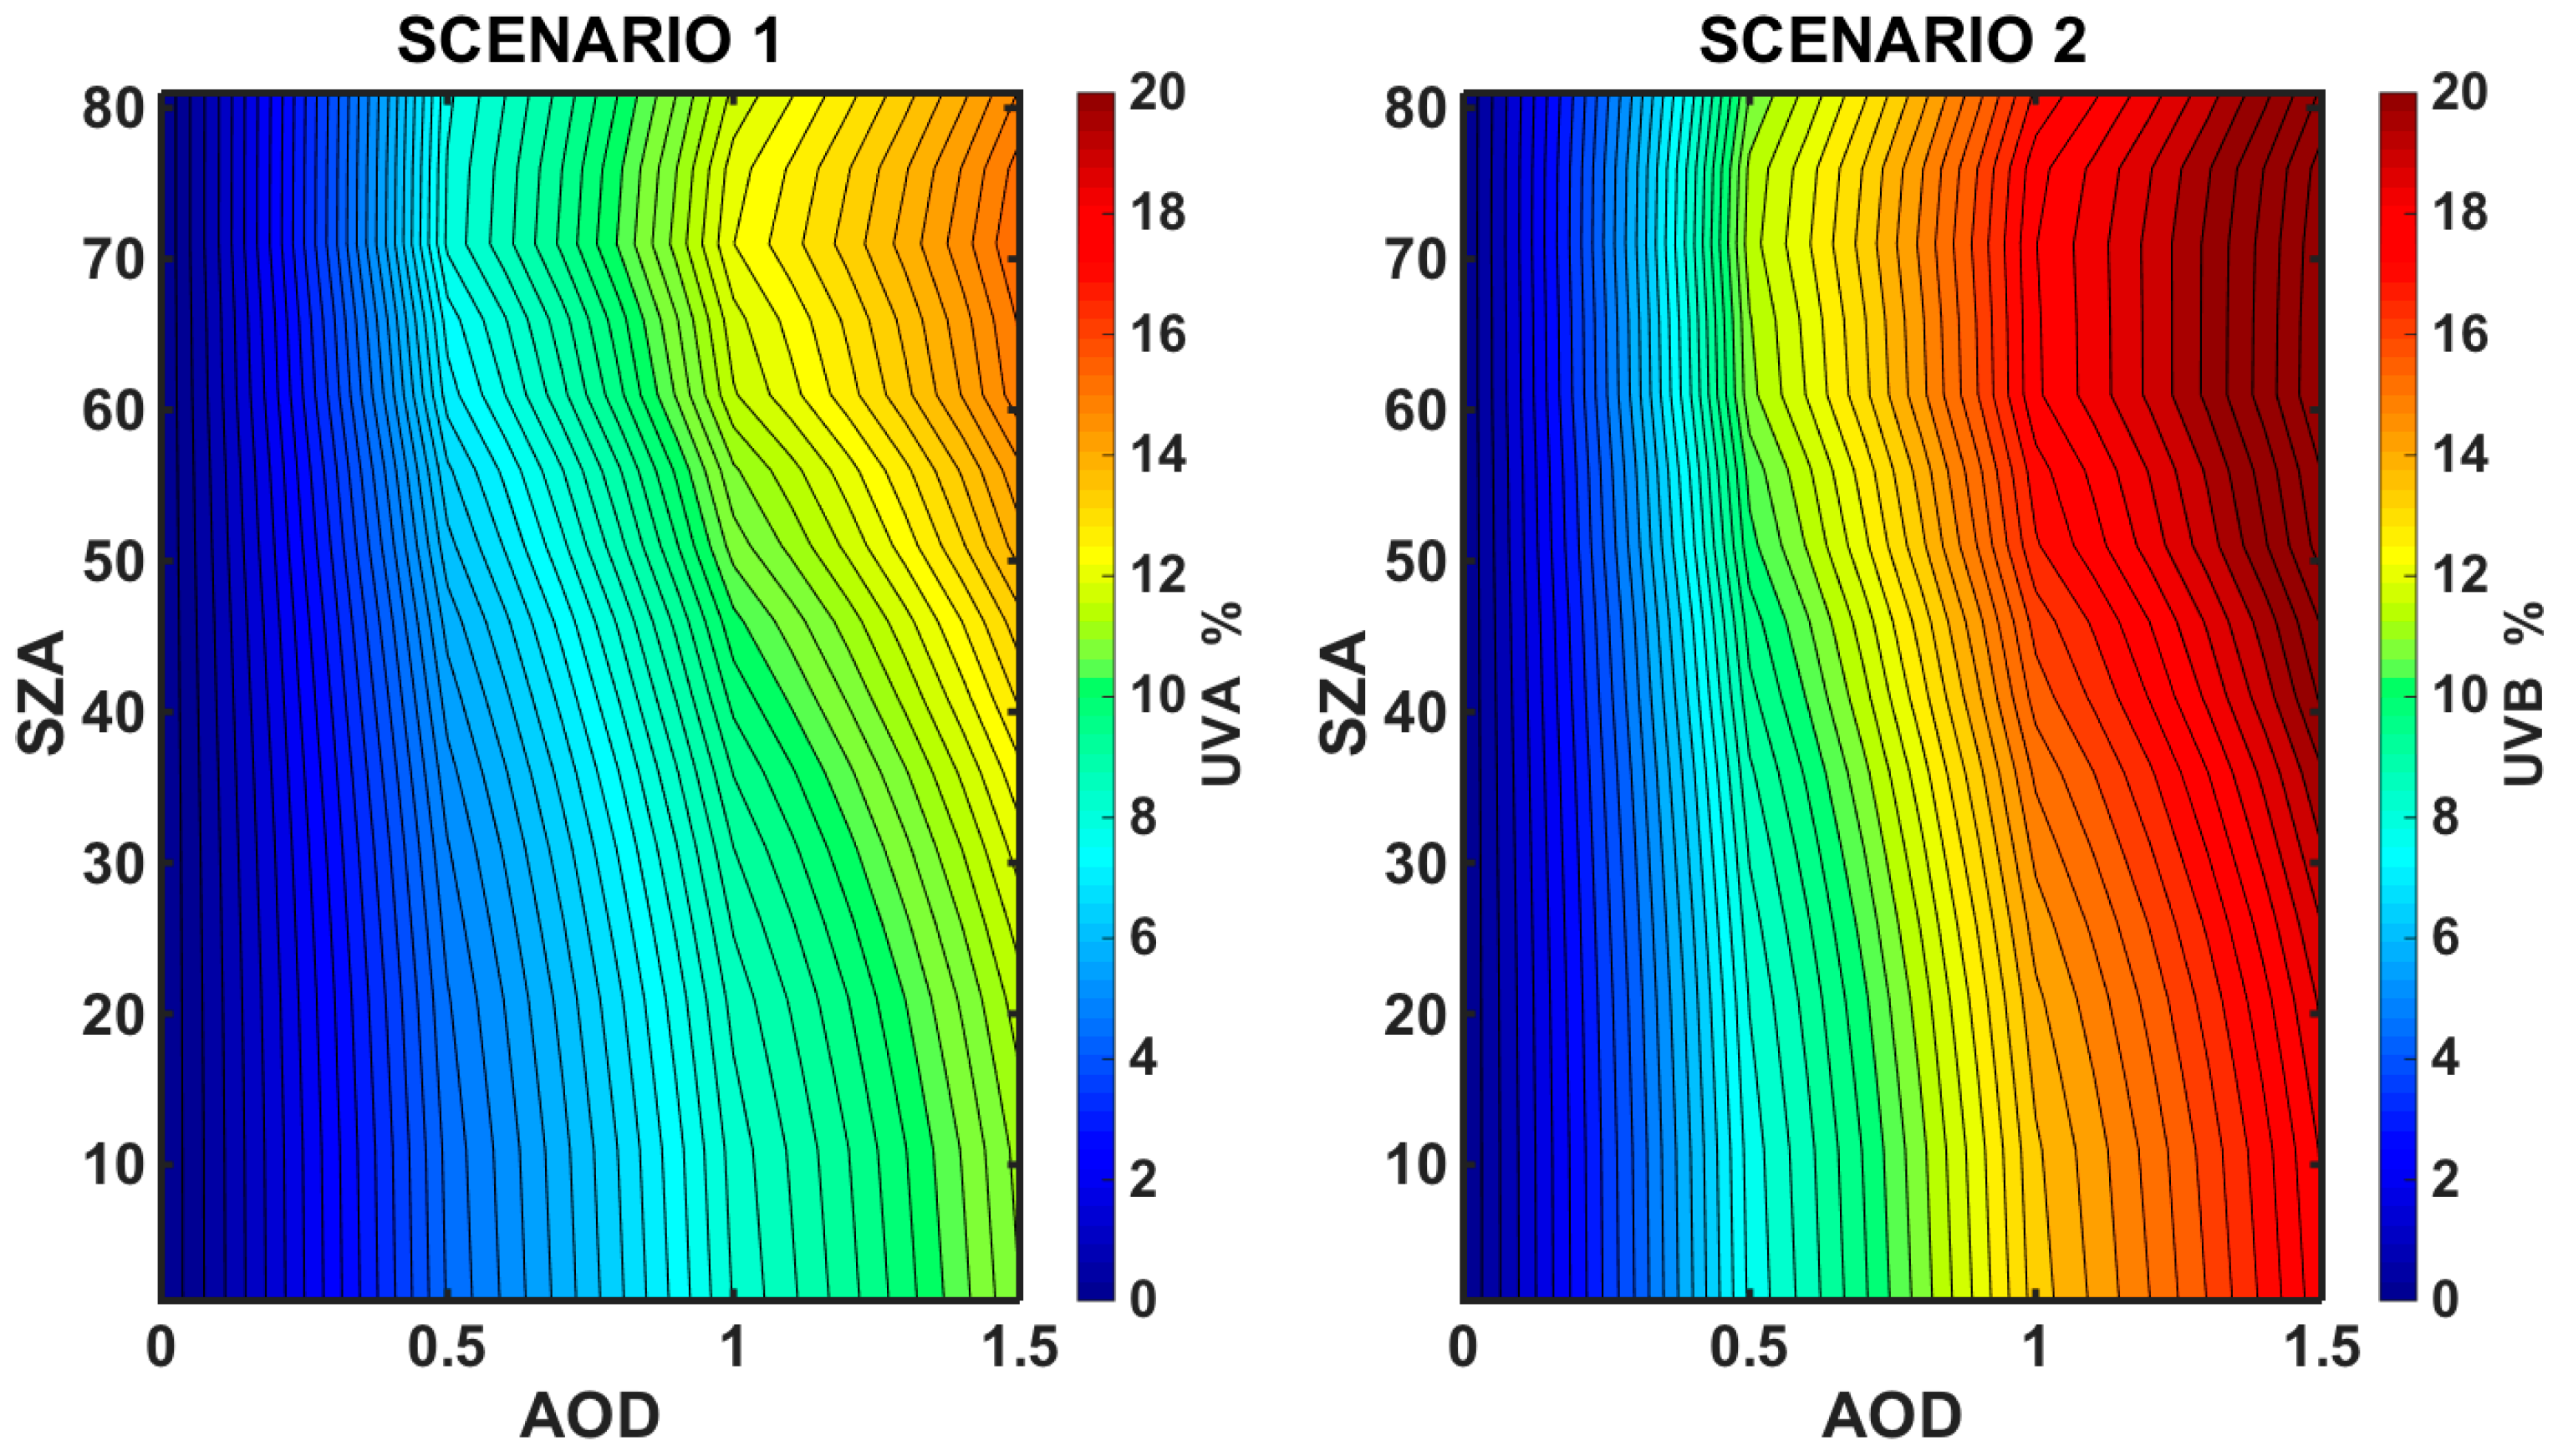
Based on the differences visualized in Figure 2, the theoretical expected differences between UVB and UVA irradiances simulated by the RTM were calculated with different SSA inputs. The example shown in Figure 3 includes two cases; the first one using the CIMEL Athens mean SSA at 440 nm (SSA440) (0.91) and the second using the 368 nm and 332 nm SSA mean values from UVMFR (0.86 and 0.84 respectively). A graphical representation of the differences in each case is provided for all SZAs and AODs. The difference on the solar UV irradiance between the simulations for the two cases (using SSA440 or SSA from the UVMFR) is shown as a function of SZA and AOD. The differences are of the order of 10–13% and 13–18% per unit of AOD for UVA and UVB, respectively. Although, in Athens’ dataset an AOD of 1 is very rare and it was noted that in such occasions the UVB estimations are different by 20% and this would introduce a very high error in UV index calculation and forecasts. In cases of very low AOD (<0.1) the differences are <2%, thus any differences on UVA and UVB estimations due to the spectral variability of SSA is less important. Highest relative differences are found at higher SZAs, which is linked to longer optical paths, and are expected to have a larger effect on aerosol extinction on solar irradiance.
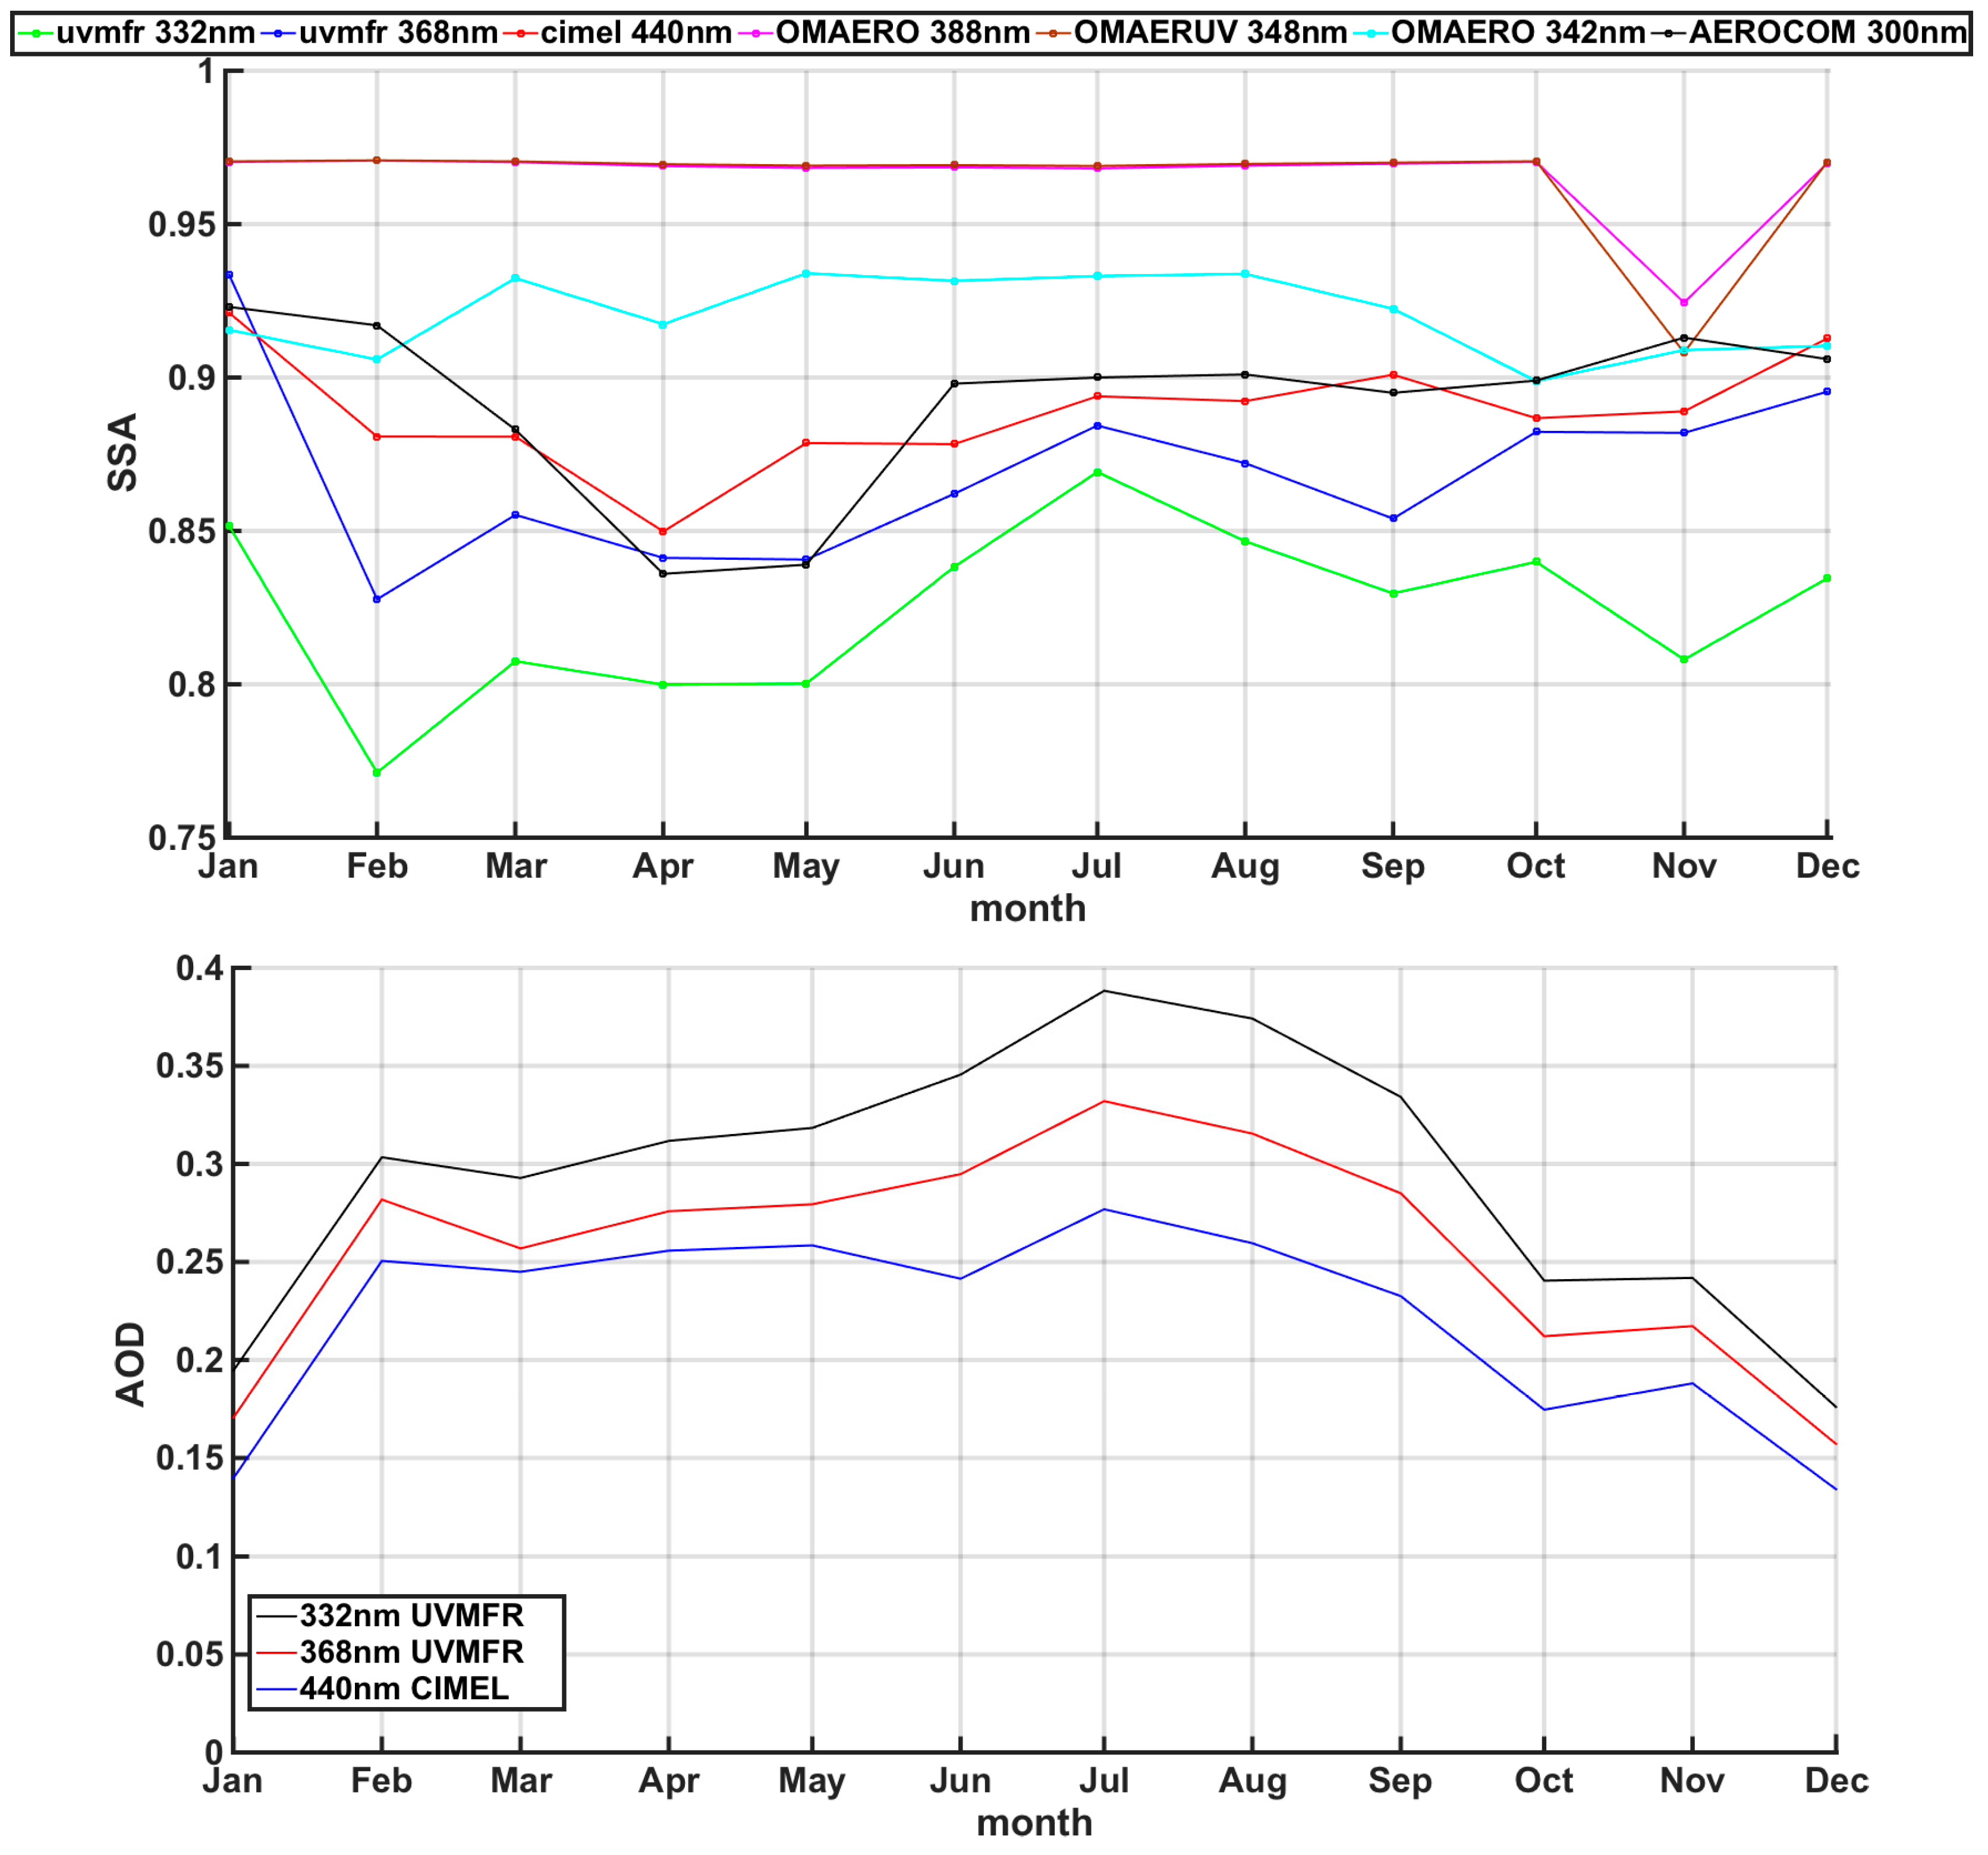
In order to perform the simulations using AOD and SSA from other available datasets, we have calculated the mean monthly values of SSA from OMAERO (388 nm and 340 nm), OMAERUV (388 nm), and AeroCom (300 nm) for Athens, Greece and compared them to those from UVMFR (332 nm and 368 nm) and CIMEL (440 nm) (see Figure 4). In addition, mean monthly AODs for 332, 368, and 440 nm were calculated from UVMFR and CIMEL measurements, respectively, and presented in Figure 3 low. All average values in both figures were calculated using data from the period 2009–2014, which provides a short-term climatology for the Athens region. All SSA values retrieved from ground observations have lower values during the period of February to May, which in Kazadzis et al. [8] was attributed to frequent dust events and high brown carbon emissions within the urban area. Meanwhile, the highest monthly values are recorded during the summer months, peaking in August. OMAERUV at 338 nm retrieves clearly higher values, even from visible wavelengths (CIMEL 440 nm) except from January and December, where the values from both instruments are similar. UVMFR retrievals have the lowest values all year, excluding the months of January and April when AeroCom retrieves slightly lower ones and January when CIMEL is lower. AeroCom monthly values calculated at 300 nm, deviate from those of other retrievals and noticeably from those of UVMFR at 332 nm. OMAERO practically provides the same values all year, except in November but still the values are significantly higher than any other retrieval. AOD at all wavelengths peaks in July, showing higher values during the summer months. Lowest AOD is recorded in December and January. Mean AOD at 332 nm is higher during the whole year, showing differences from AOD at 440 nm ranging from 0.05 in December up to 0.13 in July.
The differences between the simulations of UVB and UVA irradiance using UVMFR and CIMEL SSA inputs have been assessed. The inputs and model outputs presented here can be seen in Table 1. We have decided to keep the AOD inputs common (332 nm for UVB RTM integrals and 368 nm for UVA RTM ones) for all different data sources of SSAs to assess only the effect of differences in the SSA on simulated solar UV and not to mix or enhance these differences by using (the slightly different but within the measurement uncertainty [8]), different AODs. However, this way guarantees a more robust comparison of the results, isolating SSA spectral related effects on UV irradiances.
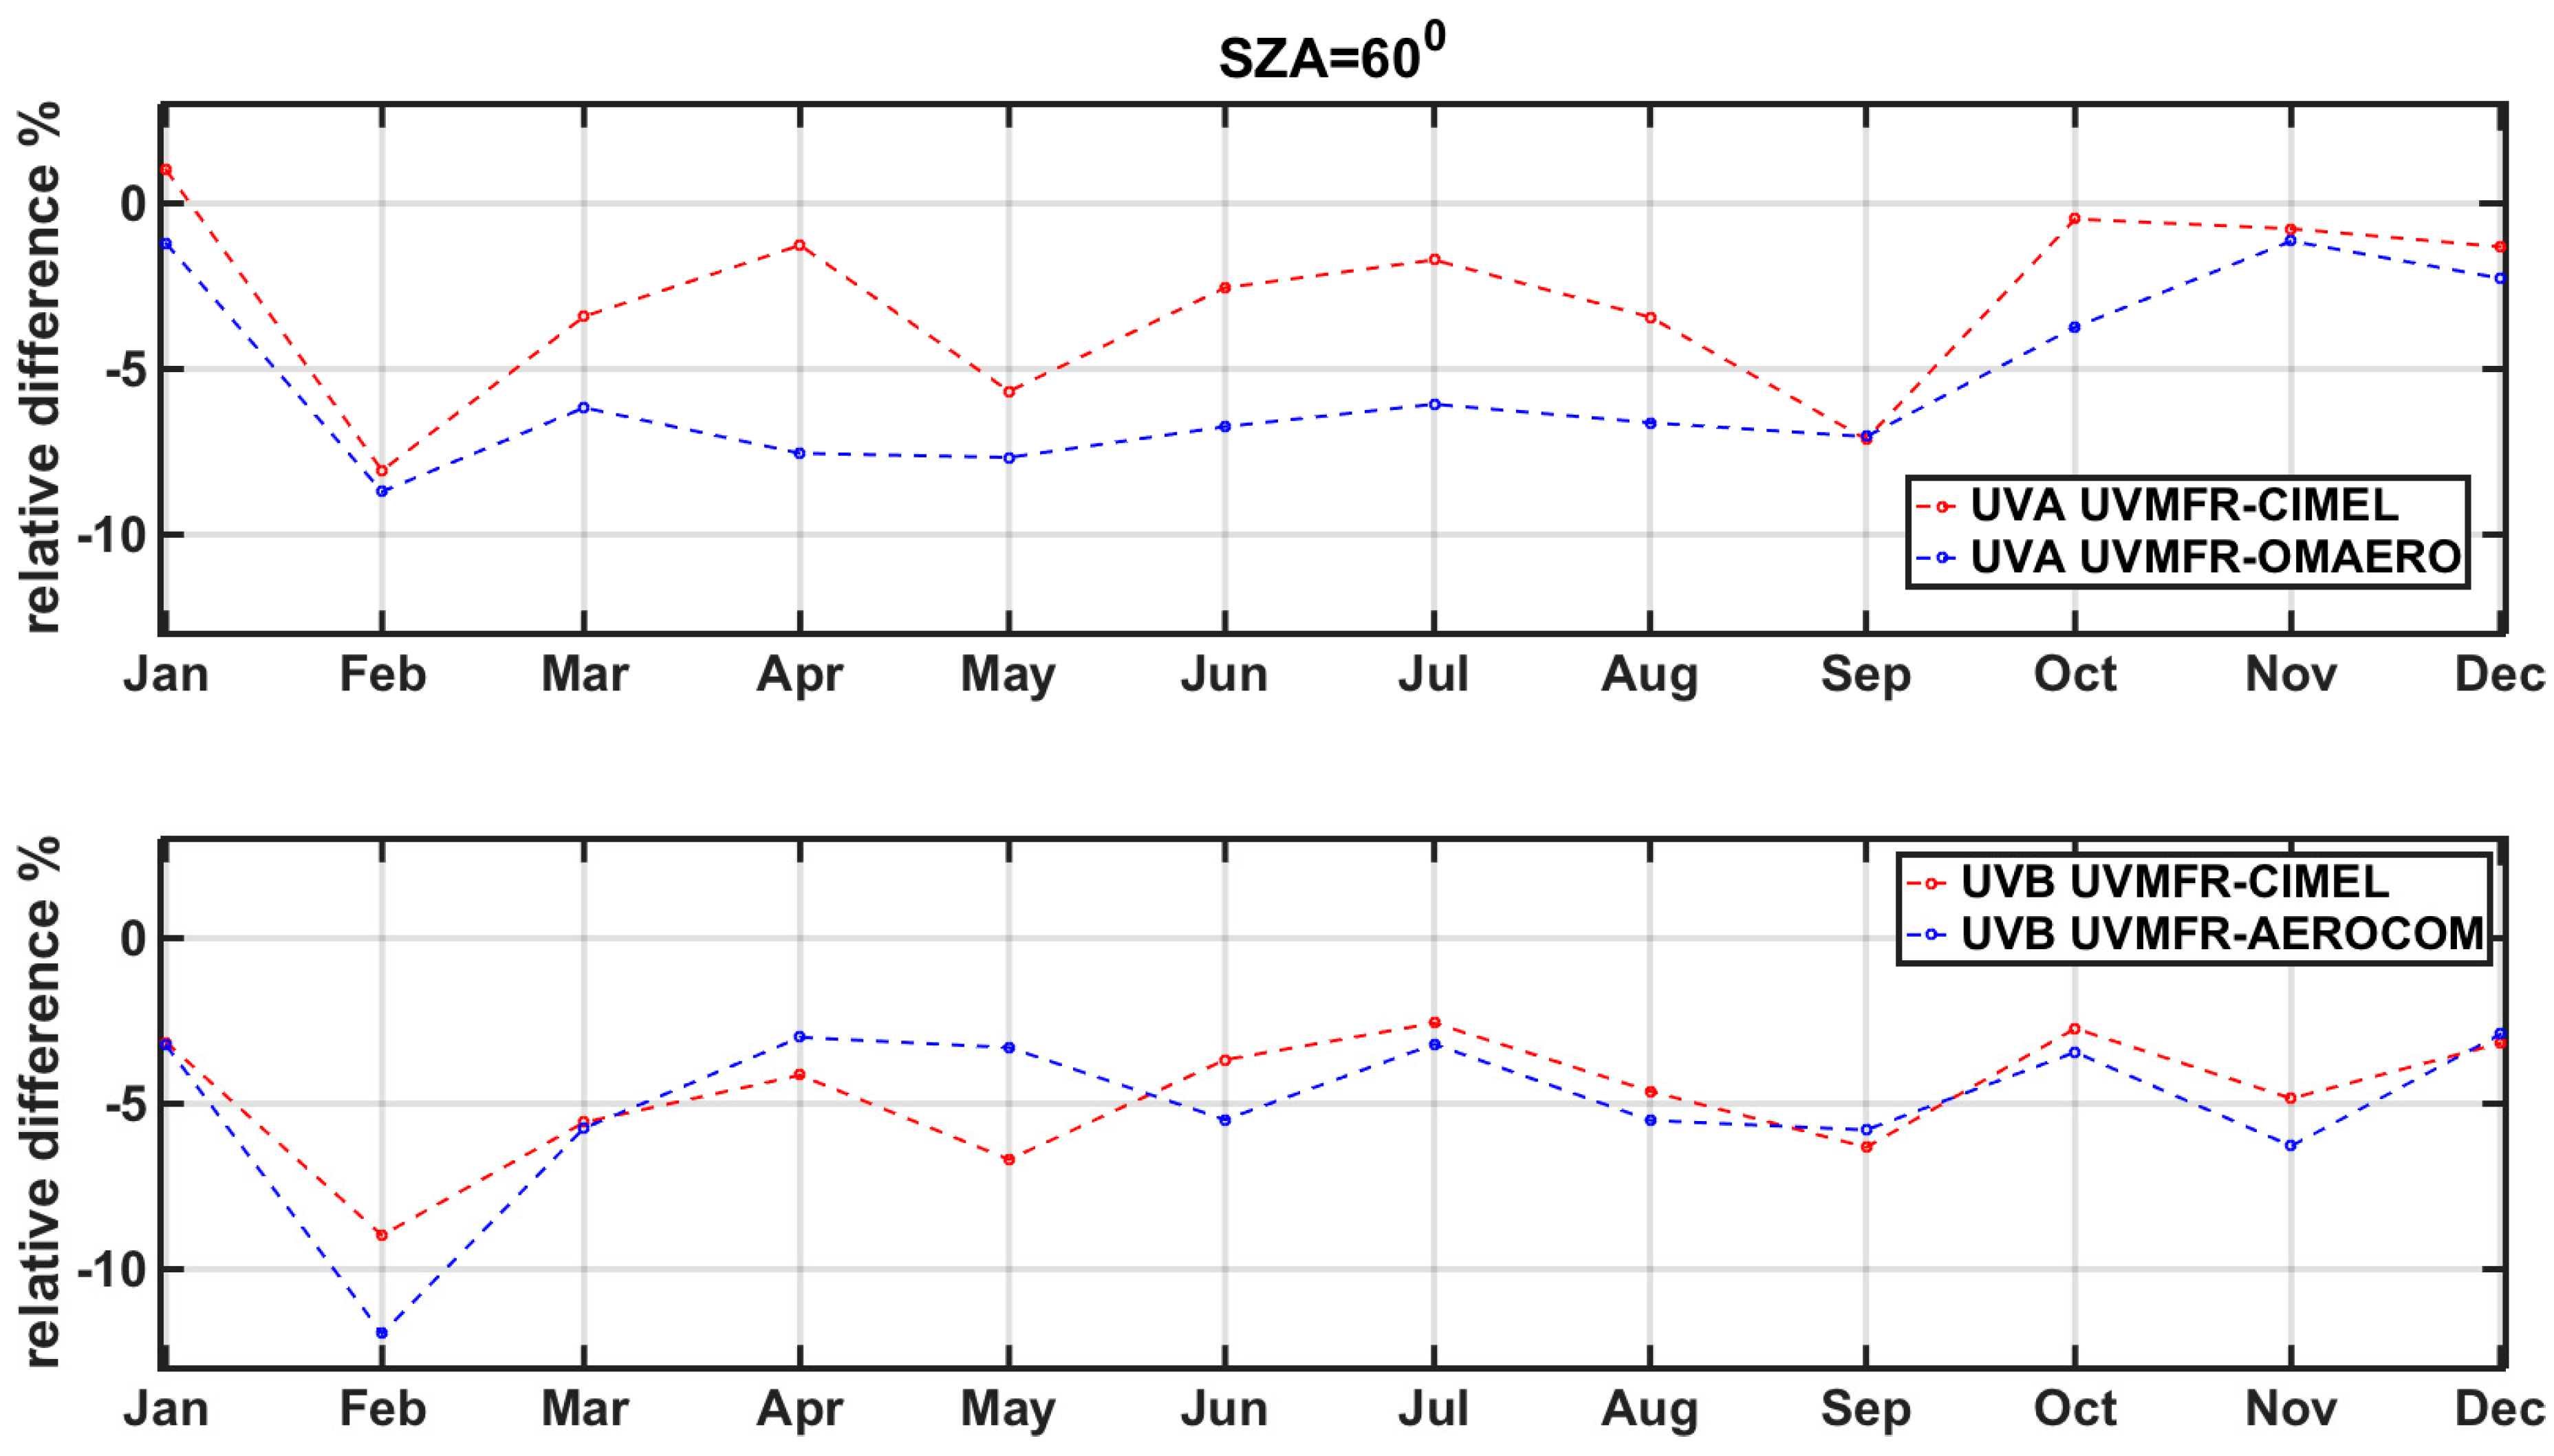
Following this approach, mean UVA and UVB for each month was calculated for SZA = 60°. This SZA selection was made to quantify the influence of different values of SSA, excluding the seasonal variability of SZA and the SZA value which was chosen as the one that can be found all year long. Relative differences of these results are presented in Figure 5. These relative differences follow the combined seasonal variations of AOD and SSA, presenting the lowest values in February reaching −9.1% for UVA and −12.3% for UVB. Barring UVA calculated with SSACIMEL and SSAUVMFR in January, all other months reveal an underestimation of irradiance when using UVMFR inputs. This is explained by lower SSA values retrieved by the instrument. UVA calculated with SSAOMAERO shows an average difference of 6.1% all year round in comparison to the one calculated with SSAUVMFR. UVA calculated with SSACIMEL has a yearly difference of 2.9% from that calculated with SSAUVMFR. For UVB calculations, the relative differences are higher and are of the same order for both SSAAEROCOM and SSACIMEL, showing an average of −5.9% and −5.7% accordingly.
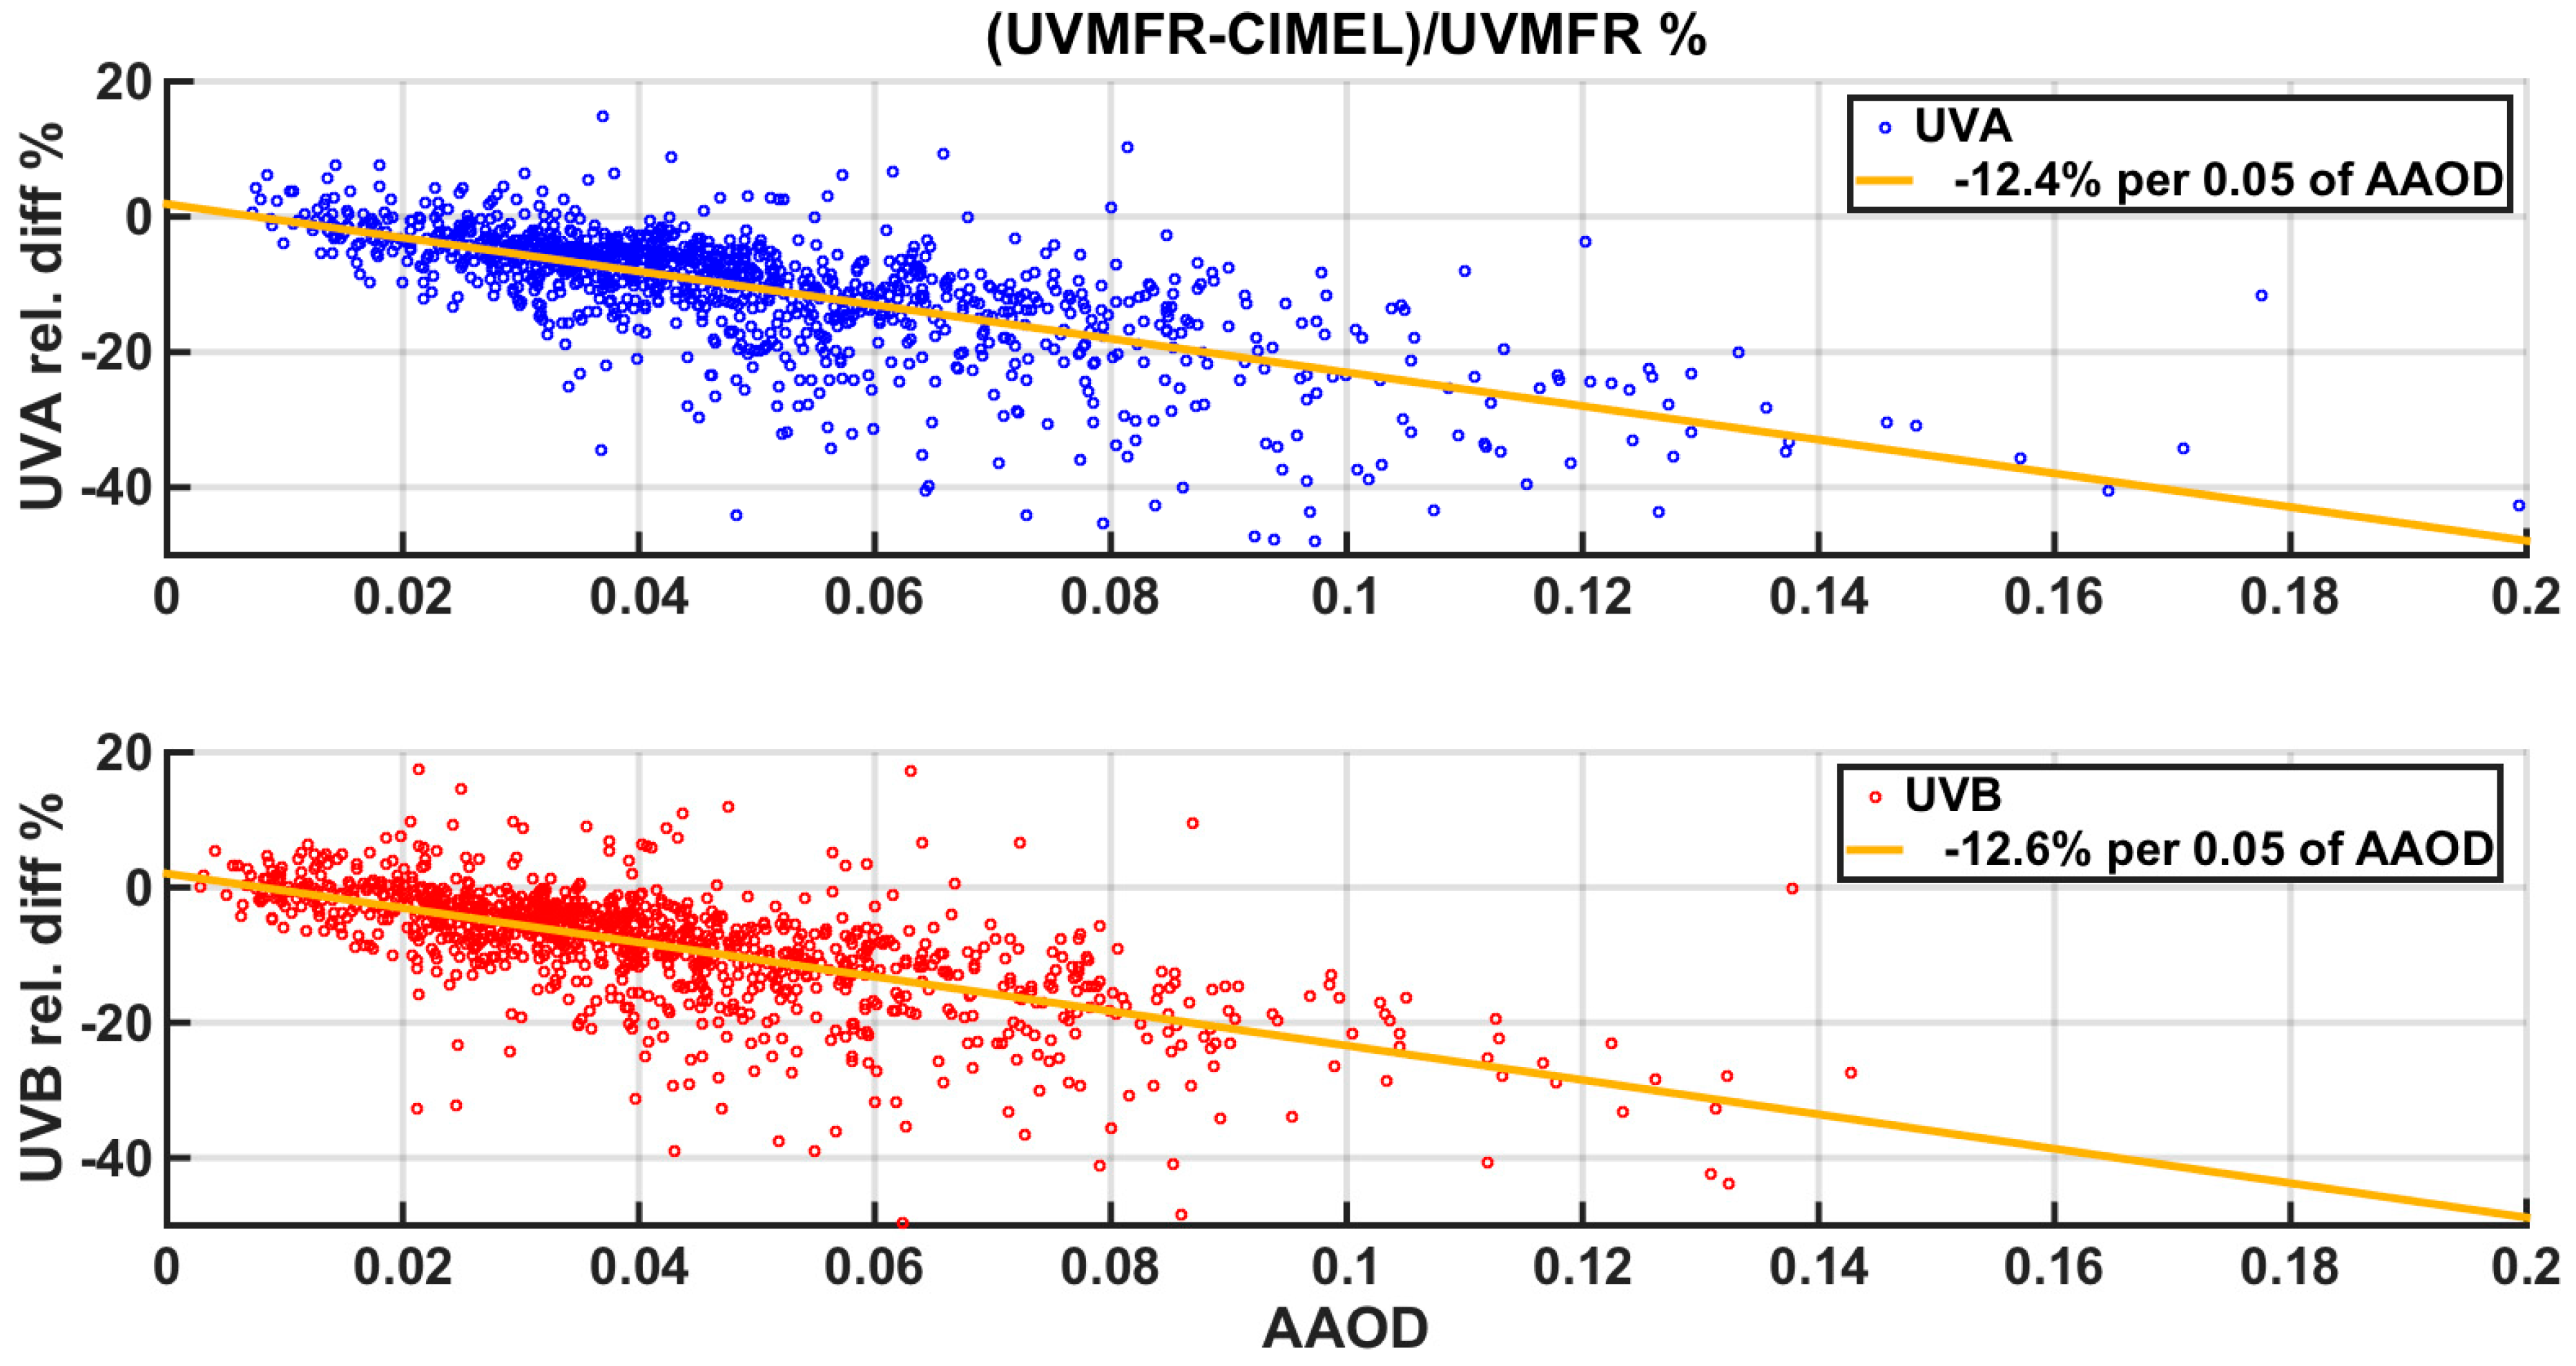
Figure 6 shows the calculated differences for UVB and UVA outputs when using SSACIMEL and SSAUVMFR as a function of AAOD. For these calculations, we have used all the 1480 synchronous values of both UVMFR and AERONET level 1.5 inversions products (following the criterion described in Section 2.2). AAOD was used for this comparison, as combined AOD and SSA changes in irradiance RTM outputs can be described by this parameter. This is because even if AODs did not differ in the compared model runs, irradiance differences are enhanced, due to higher AOD absolute values according to Equation (2). In this particular figure, we can observe that UVB and UVA calculations, using SSACIMEL and SSAUVMFR, decrease by ~12% per 0.05 of AAOD. When AAOD is higher than 0.04, an overestimation of outputs of SSACIMEL is the dominant case for both UVA and UVB, while the opposite appears in about 1% of the data. Although measurements of higher AAOD values would provide a more robust estimation of this behavior, this estimation is produced using a five-year long dataset and can be considered as representative for this urban area with moderate aerosol loads.
In Figure 7, histograms for the comparison of the full data set of UVMFR and CIMEL synchronous 1480 retrievals, are presented. These histograms reveal a dominant overestimation of both UVA and UVB when calculated using SSACIMEL. The average relative difference for UVA is −4.7% and for UVB is −8.5%. For 77.1% and 86.4% of the cases for UVA and UVB, respectively, the irradiances simulated with input from SSAUVMFR are lower than those simulated with SSACIMEL. The rest of the cases are linked with aerosol mixtures that have higher SSA in UV than in 440 nm. These are usually expected to be fine mode absorbing aerosols that are attributed to urban pollution [8]. Additionally, there are very few cases (0.9% for UVA and 1.4% for UVB) showing absolute differences higher than 25%. Kazadzis et al. [8] suggested that most these cases are linked to Angstrom exponents lower than 0.7 and, thus, to severe dust events.
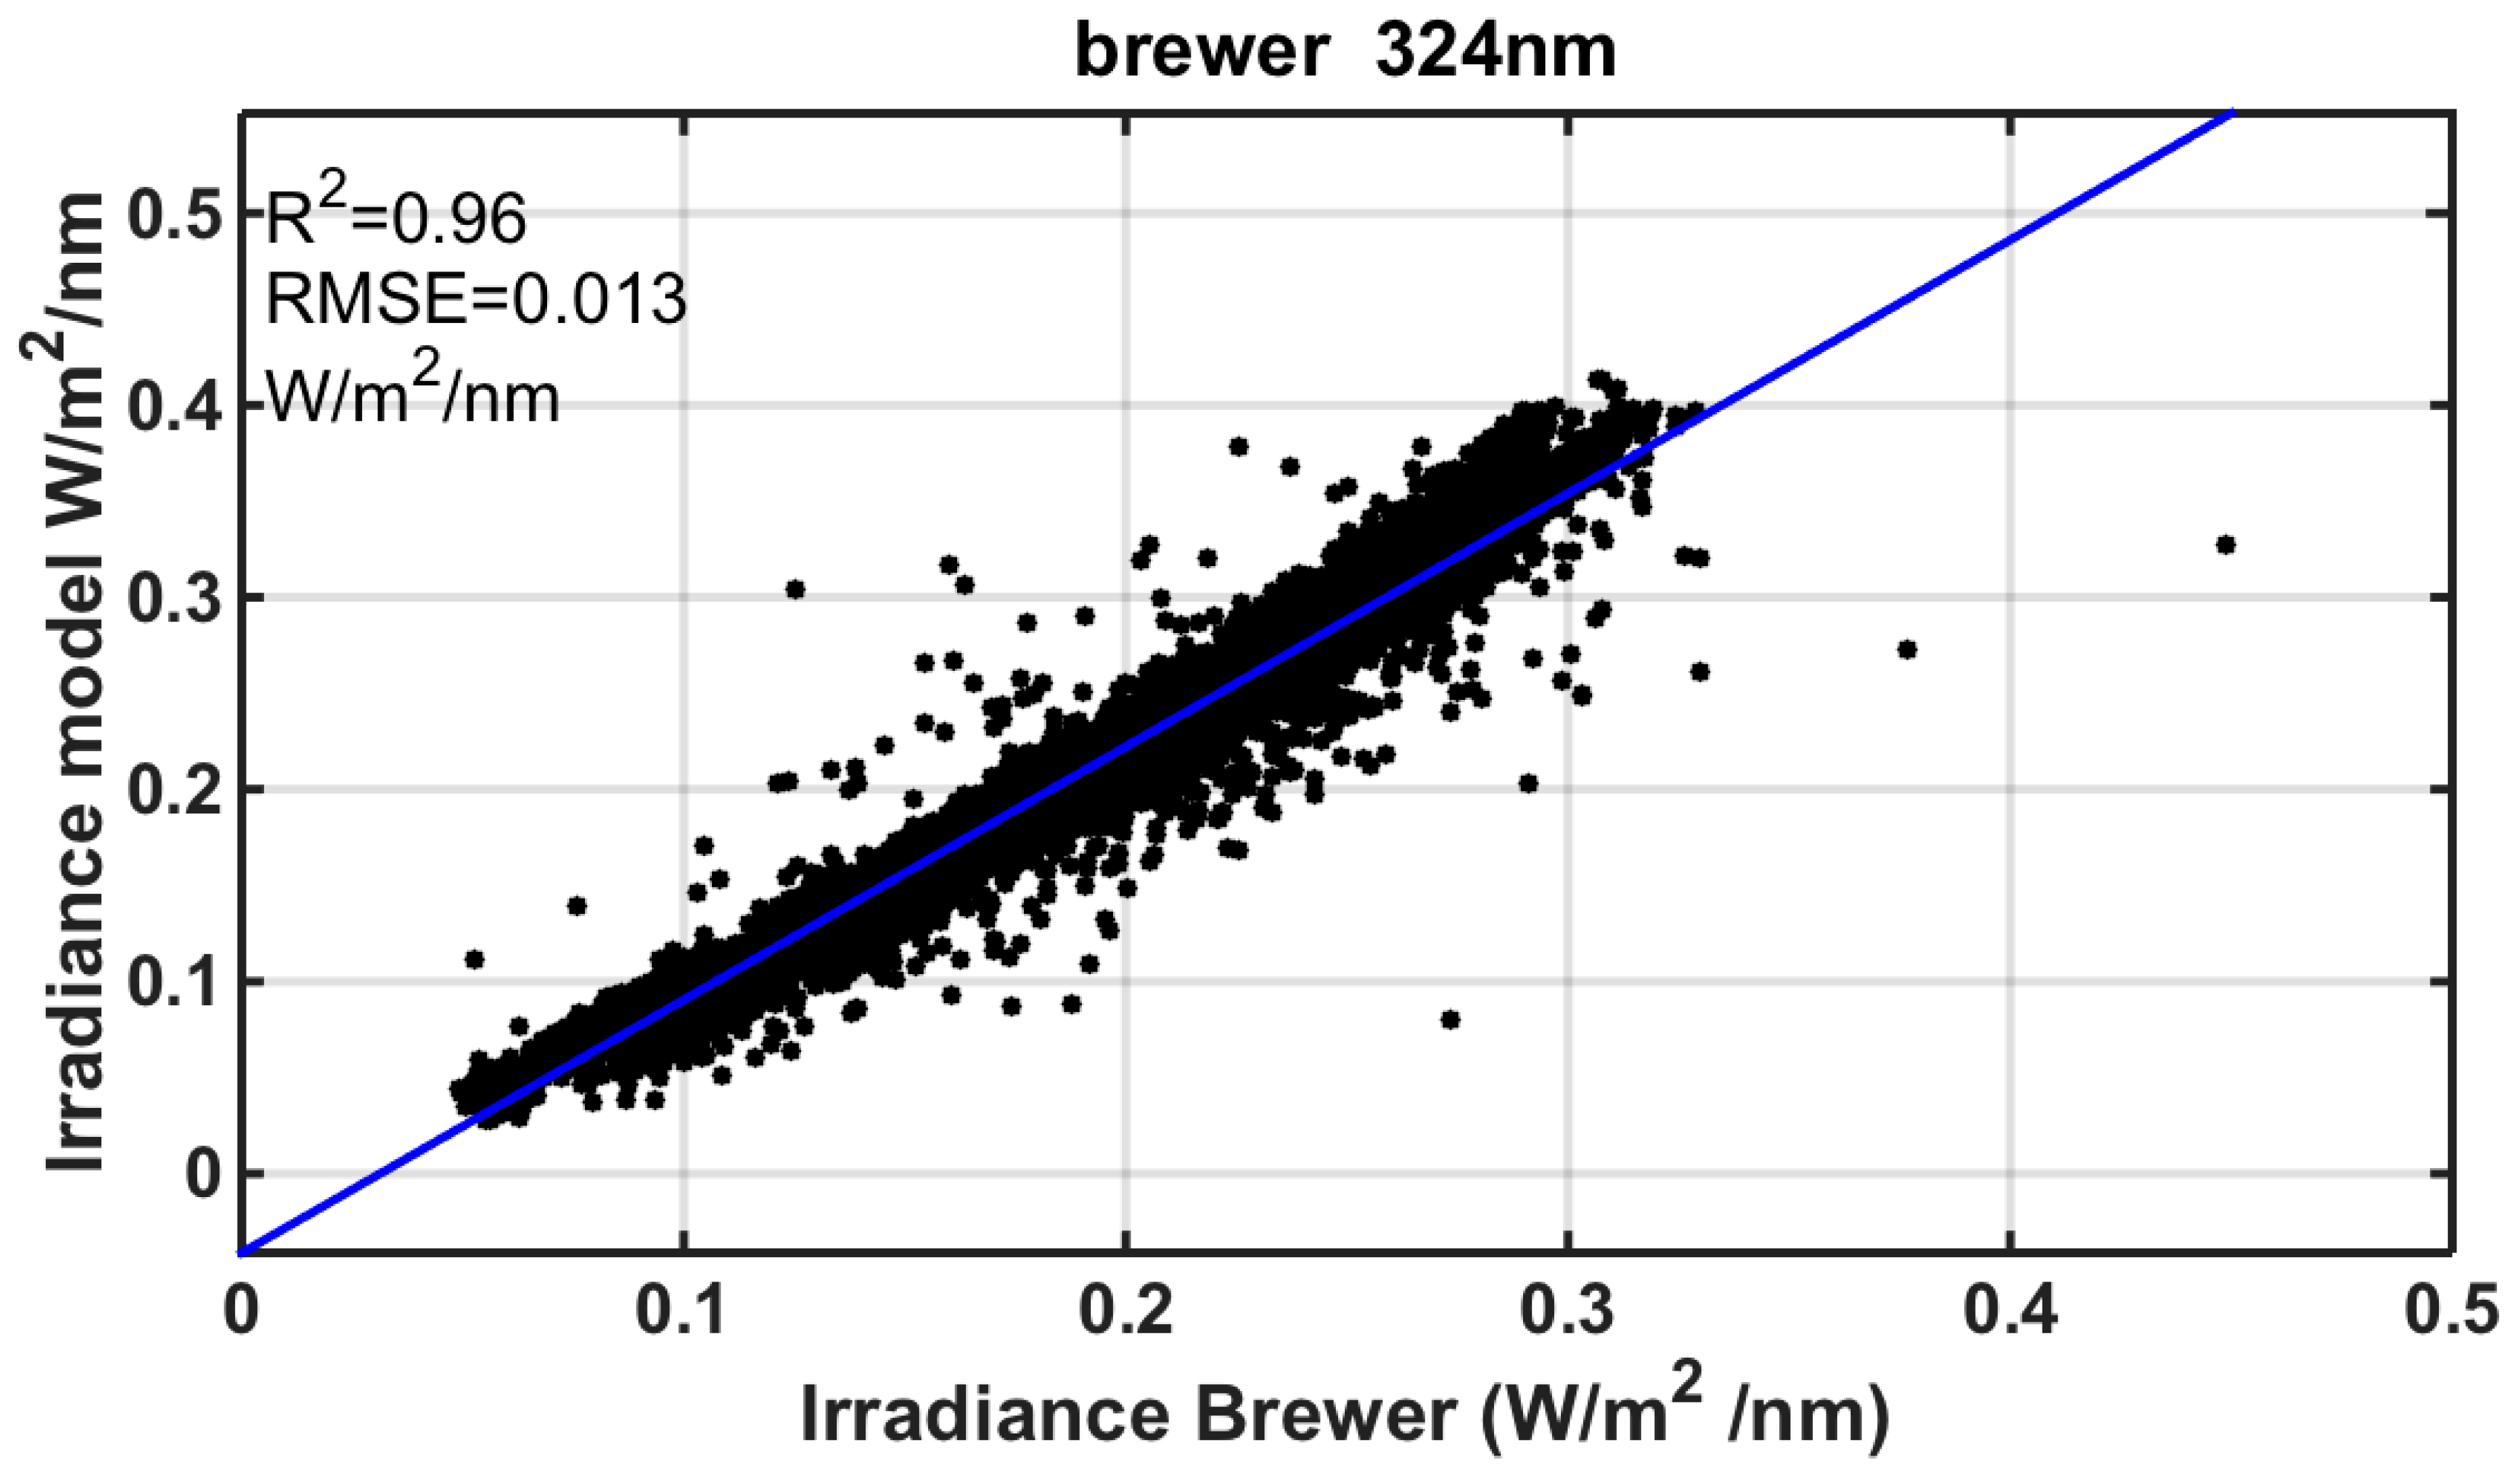
Aiming to verify the above results using actual solar irradiance measurements, we compare RTM simulated solar UV irradiances with synchronous cloud free Brewer UV measurements at 324 nm from the Brewer MKIV instrument. This is located on the same roof as the UVMFR and CIMEL instruments. For this simulation, AODUVMFR and SSAUVMFR at 332 nm were used as input.
In order to validate the agreement between RTM and BREWER recorded irradiance at 324 nm, a statistical approach was selected. The statistical variables used are R2 and root mean square error (RMSE) calculated as follows:
The Brewer values (yi), is the average of those values. fi are the calculated RTM and N is the number of measurements.
A comparison of 4297 synchronous cloud-free (based on the cloud detection algorithm used for UVMFR [8]) Brewer measurements and UV324 nm model runs—with UVMFR input data—is shown in Figure 8, demonstrating an R2 of 0.96 and RMSE of 0.013 W/m2. The results reveal a good agreement with differences that can be mainly attributed to model inputs as well as measurement and absolute calibration uncertainties of the Brewer values.
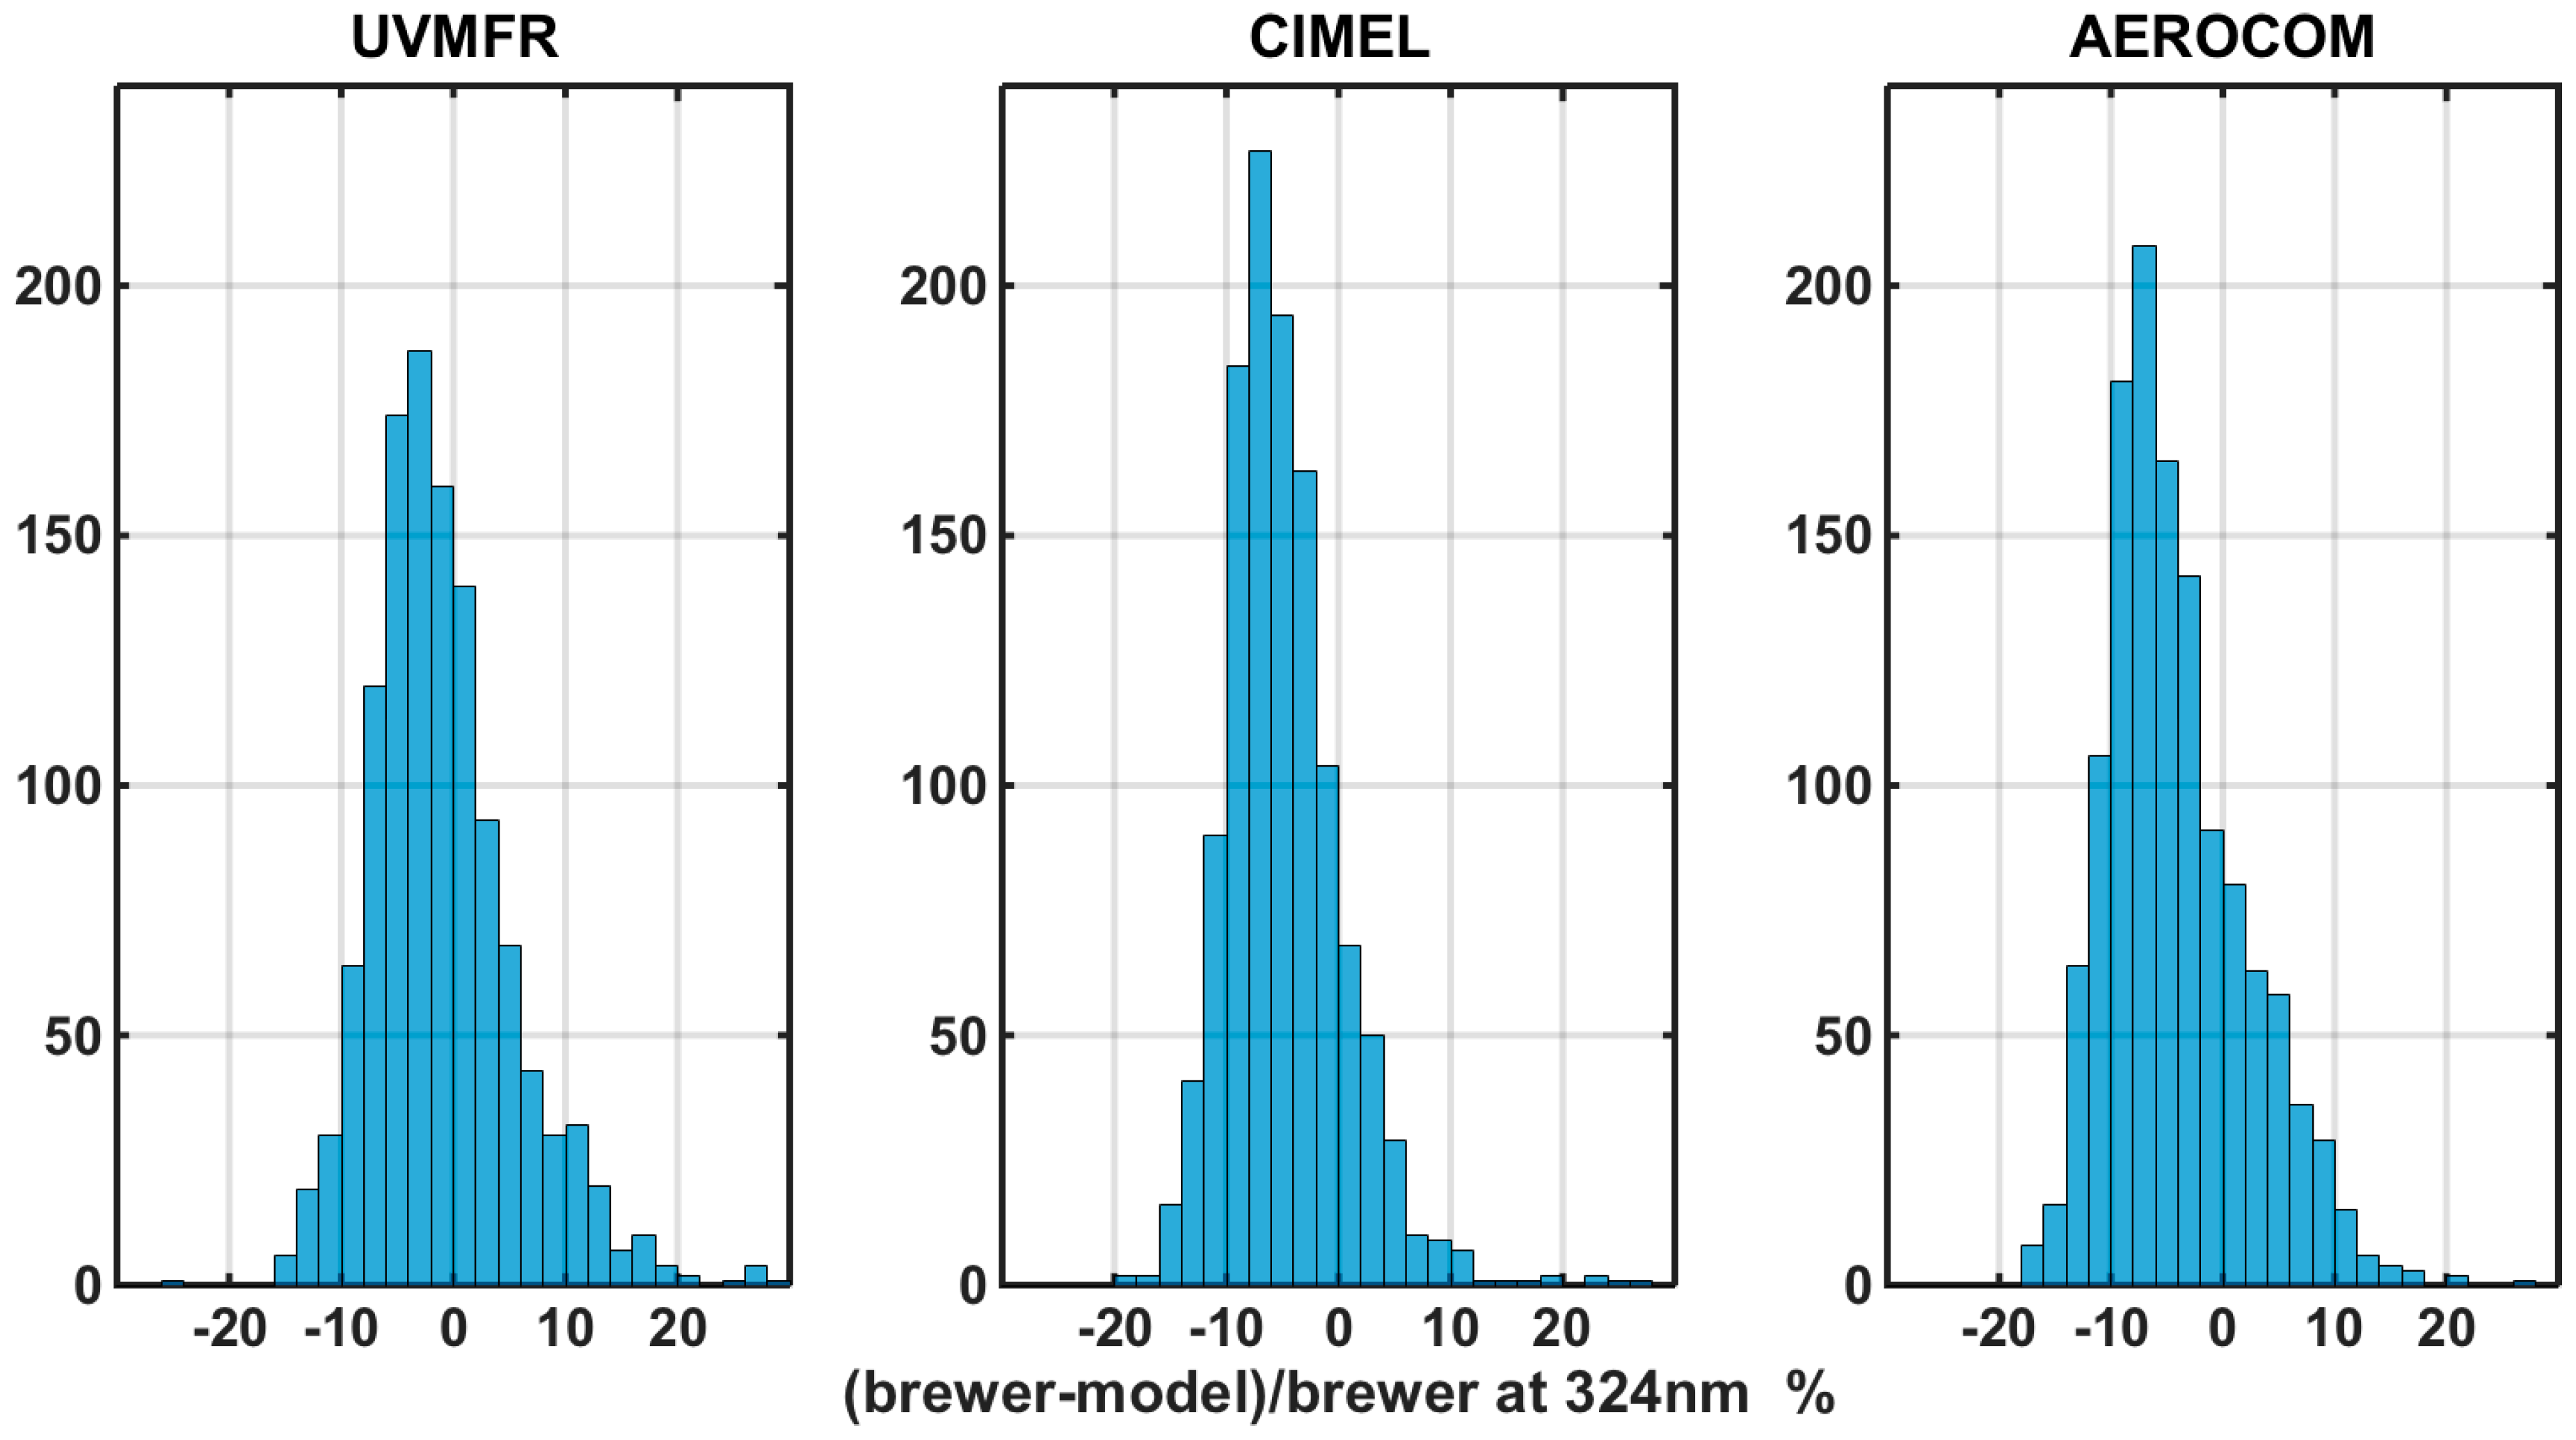
Finally, RTM runs were performed with CIMEL, AeroCom and UVMFR 332 nm SSA as well as UVMFR 332 nm AOD and compared with Brewer recordings. At this scenario, AeroCom values for the corresponding month, was used for all the synchronous UVMFR-BREWER data points. The distribution of differences of the three different scenarios is presented in Figure 9 and Table 2. From these statistics, it was concluded that irradiance calculated with SSAUVMFR has the smallest absolute mean and median difference in comparison to the ones calculated with SSACIMEL and SSAAEROCOM. Results reveal a similar average difference with the ones presented in Figure 6. Standard deviations of the differences are in the order of 6.5% to 7.5%. It is interesting that AeroCom provides a slightly better agreement than AERONET, having smaller absolute mean and median differences. This is mainly because SSAAEROCOM is calculated at 300 nm. However, it is expected to have higher variation when using a constant climatological monthly value. It should be noted that the dominant case is the overestimation of simulated irradiance as compared to recorded values, which indicates that SSA at 324 nm should be lower than any of these values. All three distributions have comparable range of values, with less than 10 cases of relative differences higher than 20%. Concluding the comparison, it appears that using SSAUVMFR at 332 nm in RTM UV324 nm calculation provides the closest to Brewer measured results.
All the above results converge to the conclusion that retrievals of SSA at UV wavelengths are required to correctly estimate UV irradiance. Additionally, according to aerosol type, a detailed parameterization of SSA values in UV could lead to a more valid estimation of UV irradiance. The datasets were recorded in Athens, Greece, which is a moderately polluted European city. With rare high aerosol loads and frequent Saharan dust transport events between the months of February and June, the differences in calculated irradiances should be considered as representative of these conditions. UV irradiance estimation differences in rural pristine areas with very low AOD values should be nearly negligible. On the other hand, in heavily industrialized areas and megacities with very high black and brown carbon concentrations, these differences would be magnified. Furthermore, in areas with more frequent and more severe dust events, the effect of SSA drop in UV should be considered in all calculations. Additionally, we should underline the need of performing a similar study in an area were types of aerosol with different spectral behavior dominate, especially organic particles. Although, for some types (e.g., sea salt, sulfate, and nitrate) the absorption is practically negligible in the whole spectrum [31]. Differences in UVA and UVB lead to change in health-related variables. In most cases, irradiances are lower than estimated which transported from visible range values, resulting to lower UV index and Vitamin D production. This should lead to different instructions for the exposure of general population.
4. Conclusions
The effect of spectral SSA using different data sources for calculating incoming irradiance at UV wavelengths was studied. A 5-year long dataset of SSAUVMFR at 368 and 332 nm, AERONET retrievals at 440 nm, SSAOMAERO at 342.5 nm and climatological values from AeroCom were used as input to a RTM. Outputs were integrated to estimate UVA and UVB. The major findings are:
- SSA spectral decrease in the UV leads to a systematic overestimation of UV when SSA at visible is used, for the Athens area for the same AOD. The average difference for UVA is 4.7% and for UVB is 8.5%, between estimations using SSAUVMFR and SSACIMEL inputs.
- When climatological SSAAEROCOM values at 300 nm were used to calculate UVB, average relative difference to the one calculated with SSAUVMFR at 332 nm was found at 5.7%.
- The rate of underestimation of calculated UVA and UVB with SSAUVMFR and SSACIMEL, for Athens, is −12% per 0.05 increase of AAOD. Mostly, for dust aerosol and local pollution related areas of the planet, this overestimation could be highly important. In addition, as AAOD at lower (UVB) wavelengths is theoretically higher than the one at 332 nm, the effect of using extrapolating SSA440 could have larger discrepancies in the UVB irradiance calculation compared to the results presented in this study.
- UV irradiance at 324 nm from a Brewer spectroradiometer was compared to RTM calculations using different SSA input. This was performed to validate the RTM results. The results revealed that using SSAUVMFR at 332 nm in the simulations provides closer to measured values with a mean difference of 0.85%, compared to 4.91% when transferring SSA from the visible and 4.11% when using climatological values.
To summarize, spectral aerosol optical depth is the most important parameter that can describe the UV attenuation due to aerosols. In addition, there is a lack of SSA measurements worldwide for the UV range. This is because the densest ground-based aerosol sun-photometric network (AERONET) provide SSA at 440 nm (lowest wavelength). UV irradiance—aerosol interaction studies and services (for example UV index forecasts) does not consider the findings of various studies (especially in urban and high AOD areas). This presents higher absorption in the UV compared to the visible. This can lead to a systematic overestimation of the UV Index (when all other parameters, like TOC and AOD, have been correctly used in the UV index forecast models), due to this SSA spectral dependence.
In conclusion, it appears to be crucial for modelled UVA and UVB irradiance calculations to have a proper estimation of absorbing aerosol related columnar parameters, such as SSA, especially when AOD is higher than 0.4. Although TOC is the major factor at UV wavelengths, especially in the UVB region, SSA spectral dependence could lead to changes of more than 15% per unit of AOD. In the absence of SSAUV measurements worldwide, currently used estimations for UV forecasts have a non-negligible uncertainty caused by the use of visible wavelength based SSA values.
All the above findings present the need of more detailed information on the aerosol absorbing properties in the UV range when UV related variables are estimated (UVA, UVB, UV index, vitamin D production), especially for high AOD areas.
Author Contributions
Conceptualization: S.K. and I.-P.R.; data curation: I.-P.R.; methodology: I.-P.R. and S.K. and I.F.; software: I.-P.R.; validation: I.-P.R. and K.E.; formal analysis: I.-P.R. and S.K.; investigation: I.-P.R., S.K., V.A., and K.E.; resources: S.K., V.A., and K.E.; writing—review I.-P.R.; editing: S.K., I.F., and K.E.; visualization: I.-P.R. and S.K.; supervision: S.K.; project administration: S.K. and I.-P.R.
Funding
This research was partly funded by the H2020 GEO-CRADLE project under grant agreement No. 690133.
Acknowledgments
The research leading to these results was supported from the European Union’s Horizon 2020 Research and Innovation Programme ACTRIS-2 (grant agreement No. 654109). The authors also would like to thank the scientists maintaining AeroCom database and all the scientists involved in OMI satellite produces.
Conflicts of Interest
The authors declare no conflict of interest.
References
- Kaufman, Y.J.; Tanré, D.; Boucher, O. A satellite view of aerosols in the climate system. Nature 2002, 419, 215–223. [Google Scholar] [CrossRef] [PubMed]
- IPCC. Climate Change 2013: The Physical Science Basis. Contribution of Working Group I to the Fifth Assessment Report of the Intergovernmental Panel on Climate Change; Stocker, T.F., Qin, D., Plattner, G.K., Tignor, M., Allen, S.K., Boschung, J., Nauels, A., Xia, Y., Bex, V., Midgley, P.M., Eds.; Cambridge University Press: Cambridge, UK; New York, NY, USA, 2013; 1535p. [Google Scholar] [CrossRef]
- Bergstrom, R.W.; Pilewskie, P.; Russell, P.B.; Redemann, J.; Bond, T.C.; Quinn, P.K.; Sierau, B. Spectral absorption proper-ties of atmospheric aerosols. Atmos. Chem. Phys. 2007, 7, 5937–5943. [Google Scholar] [CrossRef]
- Mok, J.; Krotkov, N.A.; Arola, A.; Torres, O.; Jethva, H.; Andrade, M.; Labow, G.; Eck, T.F.; Li, Z.; Dickerson, R.R. Impacts of brown carbon from biomass burning on surface UV and ozone photochemistry in the Amazon Basin. Sci. Rep. 2016, 6, 36940. [Google Scholar] [CrossRef] [PubMed] [Green Version]
- Martins, J.V.; Artaxo, P.; Kaufman, Y.J.; Castanho, A.D.; Remer, L.A. Spectral absorption properties of aerosol particles from 350–2500 nm. Geophys. Res. Lett. 2009, 36, L13810. [Google Scholar] [CrossRef]
- Jethva, H.; Torres, O. Satellite-based evidence of wavelength-dependent aerosol absorption in biomass burning smoke inferred from Ozone Monitoring Instrument. Atmos. Chem. Phys. 2011, 11, 10541–10551. [Google Scholar] [CrossRef] [Green Version]
- Corr, C.A.; Krotkov, N.; Madronich, S.; Slusser, J.R.; Holben, B.; Gao, W.; Flynn, J.; Lefer, B.; Kreidenweis, S.M. Retrieval of aerosol single scattering albedo at ultraviolet wavelengths at the T1 site during MILAGRO. Atmos. Chem. Phys. 2009, 9, 5813–5827. [Google Scholar] [CrossRef] [Green Version]
- Kazadzis, S.; Raptis, P.; Kouremeti, N.; Amiridis, V.; Arola, A.; Gerasopoulos, E.; Schuster, G.L. Aerosol absorption retrieval at ultraviolet wavelengths in a complex environment. Atmos. Meas. Tech. 2016, 9, 5997–6011. [Google Scholar] [CrossRef] [Green Version]
- Alfaro, S.C.; Lafon, S.; Rajot, J.L.; Formenti, P.; Gaudichet, A.; Maille, M. Iron oxides and light absorption by pure desert dust: An experimental study. J. Geophys. Res. Atmos. 2004, 109, D08208. [Google Scholar] [CrossRef]
- Schuster, G.L.; Dubovik, O.; Arola, A. Remote sensing of soot carbon—Part 1: Distinguishing different absorbing aerosol species. Atmos. Chem. Phys. 2016, 16, 1565–1585. [Google Scholar] [CrossRef]
- Holben, B.N.; Eck, T.F.; Slutsker, I.; Tanre, D.; Buis, J.P.; Setzer, A.; Vermote, E.; Reagan, J.A.; Kaufman, Y.J.; Nakajima, T. AERONET—A federated instrument network and data archive for aerosol characterization. Remote Sens. Environ. 1998, 66, 1–16. [Google Scholar] [CrossRef]
- Kazadzis, S.; Kouremeti, N.; Diémoz, H.; Gröbner, J.; Forgan, B.W.; Campanelli, M.; Estellés, V.; Lantz, K.; Michalsky, J.; Carlund, T. Results from the Fourth WMO Filter Radiometer Comparison for aerosol optical depth measurements. Atmos. Chem. Phys. 2018, 18, 3185–3201. [Google Scholar] [CrossRef] [Green Version]
- Remer, L.A.; Kaufman, Y.J.; Tanré, D.; Mattoo, S.; Chu, D.A.; Martins, J.V.; Li, R.R.; Ichoku, C.; Levy, R.C.; Kleidman, R.G. The MODIS aerosol algorithm, products, and validation. J. Atmos. Sci. 2005, 62, 947–973. [Google Scholar] [CrossRef]
- Reid, J.S.; Hobbs, P.V. Physical and optical properties of young smoke from individual biomass fires in Brazil. J. Geophys. Res.-Atmos. 1998, 103, 32013–32030. [Google Scholar] [CrossRef] [Green Version]
- Russell, P.B.; Bergstrom, R.W.; Shinozuka, Y.; Clarke, A.D.; De-Carlo, P.F.; Jimenez, J.L.; Livingston, J.M.; Redemann, J.; Dubovik, O.; Strawa, A. Absorption Angstrom Exponent in AERONET and related data as an indicator of aerosol composition. Atmos. Chem. Phys. 2010, 10, 1155–1169. [Google Scholar] [CrossRef] [Green Version]
- Schwarz, J.P.; Spackman, J.R.; Gao, R.S.; Watts, L.A.; Stier, P.; Schulz, M.; Davis, S.M.; Wofsy, S.C.; Fahey, D.W. Global-scale black carbon profiles observed in the atmosphere and compared to models. Geophys. Res. Lett. 2010, 37, L18812. [Google Scholar] [CrossRef]
- Skeie, R.B.; Berntsen, T.K.; Myhre, G.; Tanaka, K.; Kvalevåg, M.M.; Hoyle, C.R. Anthropogenic radiative forcing time series from pre-industrial times until 2010. Atmos. Chem. Phys. 2011, 11, 11827–11857. [Google Scholar] [CrossRef] [Green Version]
- Andrews, E.; Ogren, J.A.; Kinne, S.; Samset, B. Comparison of AOD, AAOD and column single scattering albedo from AERONET retrievals and in situ profiling measurements. Atmos. Chem. Phys. 2017, 17, 6041–6072. [Google Scholar] [CrossRef] [Green Version]
- Kosmopoulos, P.G.; Kazadzis, S.; Taylor, M.; Raptis, P.I.; Keramitsoglou, I.; Kiranoudis, C.; Bais, A.F. Assessment of surface solar irradiance derived from real-time modelling techniques and verification with ground-based measurements. Atmos. Meas. Tech. 2018, 11, 907–924. [Google Scholar] [CrossRef] [Green Version]
- Mok, J.; Krotkov, N.A.; Torres, O.; Jethva, H.; Li, Z.; Kim, J.; Koo, J.H.; Go, S.; Irie, H.; Labow, G. Comparisons of spectral aerosol single scattering albedo in Seoul, South Korea. Atmos. Meas. Tech. 2018, 11, 2295–2311. [Google Scholar] [CrossRef]
- Holben, B.N.; Tanré, D.; Smirnov, A.; Eck, T.F.; Slutsker, I.; Abuhassan, N.; Newcomb, W.W.; Schafer, J.S.; Chatenet, B.; Lavenu, F.; et al. An emerging ground-based aerosol climatology: Aerosol optical depth from AERONET. J. Geophys. Res. 2001, 106, 12067–12097. [Google Scholar] [CrossRef] [Green Version]
- Nakajima, T.; Tonna, G.; Rao, R.; Boi, P.; Kaufman, Y.; Holben, B. Use of sky brightness measurements from ground for remote sensing of particulate polydispersions. Appl. Opt. 1996, 35, 2672–2686. [Google Scholar] [CrossRef] [PubMed]
- Nakajima, T.; Yoon, S.-C.; Ramanathan, V.; Shi, G.-Y.; Takemura, T.; Higurashi, A.; Takamura, T.; Aoki, K.; Sohn, B.-J.; Kim, S.-W.; et al. Overview of the Atmospheric Brown Cloud East Asian Re- gional Experiment 2005 and a study of the aerosol direct radiative forcing in east Asia. J. Geophys. Res. 2007, 112, D24S91. [Google Scholar] [CrossRef]
- Bais, A.F.; Kazantzidis, A.; Kazadzis, S.; Balis, D.; Zerefos, C.S.; Meleti, C. Effects of aerosol optical depth and single scattering albedo on surface UV irradiance. Atmos. Environ. 2005, 39, 1093–1102. [Google Scholar] [CrossRef]
- Krotkov, N.A.; Bhartia, P.K.; Herman, J.R.; Slusser, J.R.; Labow, G.; Scott, G.R.; Janson, G.T.; Eck, T.F.; Holben, B.N. Aerosol ultraviolet absorption experiment (2002 to 2004), part 1: Ultraviolet multifilter rotating shadowband radiometer calibration and intercomparison with CIMEL sunphotometers. Opt. Eng. 2005, 44, 041004. [Google Scholar] [CrossRef]
- Krotkov, N.A.; Bhartia, P.K.; Herman, J.R.; Slusser, J.R.; Scott, G.R.; Labow, G.; Vasilkov, A.P.; Eck, T.F.; Dubovik, O.; Holben, B.N. Aerosol ultraviolet absorption experiment (2002 to 2004), part 2: Absorption optical thickness, refrac-tive index, and single scattering albedo. Opt. Eng. 2005, 44, 041005. [Google Scholar] [CrossRef]
- Kazadzis, S.; Gröbner, J.; Arola, A.; Amiridis, V. The effect of the global UV irradiance measurement accuracy on the single scattering albedo retrieval. Atmos. Meas. Tech. 2010, 3, 1029–1037. [Google Scholar] [CrossRef] [Green Version]
- Torres, O.; Tanskanen, A.; Veihelmann, B.; Ahn, C.; Braak, R.; Bhartia, P.K.; Veefkind, P.; Levelt, P. Aerosols and surface UV products from Ozone Monitoring Instrument observations: An overview. J. Geophys. Res. 2007, 112, D24S47. [Google Scholar] [CrossRef]
- Torres, O.; Ahn, C.; Chen, Z. Improvements to the OMI near-UV aerosol algorithm using A-train CALIOP and AIRS observations. Atmos. Meas. Tech. 2013, 6, 3257–3270. [Google Scholar] [CrossRef] [Green Version]
- Ahn, C.; Torres, O.; Bhartia, P.K. Comparison of Ozone Monitoring Instrument UVAerosol Products with Aqua/Moderate Resolution Imaging Spectroradiometer and Multiangle Imaging Spectroradiometer observations in 2006. J. Geophys. Res. 2008, 113, D16S27. [Google Scholar] [CrossRef]
- Jethva, H.; Torres, O.; Ahn, C. Global assessment of OMI aerosol single-scattering albedo using ground-based AERONET inversion. J. Geophys. Res. Atmos. 2014, 119, 9020–9040. [Google Scholar] [CrossRef] [Green Version]
- Asta, J.; Pål, B.; Arne, D.; Stefan, A.-E.; Jörg, R.; Kristin, M.; Michael, F.H.; William, B.G.; Johan, M. Solar radiation and human health. Rep. Prog. Phys. 2011, 74, 066701. [Google Scholar] [Green Version]
- Lucas, R.M.; Norval, M.; Neale, R.E.; Young, A.R.; de Gruijl, F.R.; Takizawa, Y.; van der Leun, J.C. The consequences for human health of stratospheric ozone depletion in association with other environmental factors. Photochem. Photobiol. Sci. 2015, 14, 53–87. [Google Scholar] [CrossRef] [PubMed] [Green Version]
- Bais, A.F.; McKenzie, R.L.; Bernhard, G.; Aucamp, P.J.; Ilyas, M.; Madronich, S.; Tourpali, K. Ozone depletion and climate change: Impacts on UV radiation. Photochem. Photobiol. Sci. 2015, 14, 19–52. [Google Scholar] [CrossRef] [PubMed]
- Meleti, C.; Bais, A.F.; Kazadzis, S.; Kouremeti, N.; Garane, K.; Zerefos, C. Factors affecting solar ultraviolet irradiance measured since 1990 at Thessaloniki, Greece. Int. J. Remote Sens. 2009, 30, 4167–4179. [Google Scholar] [CrossRef]
- Fragkos, K.; Bais, A.F.; Fountoulakis, I.; Balis, D.; Tourpali, K.; Meleti, C.; Zanis, P. Extreme total column ozone events and effects on UV solar radiation at Thessaloniki, Greece. Theor. Appl. Climatol. 2016, 126, 505–517. [Google Scholar] [CrossRef]
- Fountoulakis, I.; Bais, A.F.; Fragkos, K.; Meleti, C.; Tourpali, K.; Zempila, M.M. Short- and long-term variability of spectral solar UV irradiance at Thessaloniki, Greece: Effects of changes in aerosols, total ozone and clouds. Atmos. Chem. Phys. 2016, 16, 2493–2505. [Google Scholar] [CrossRef]
- Castro, T.; Madronich, S.; Rivale, S.; Muhlia, A.; Mar, B. The influence of aerosols on photochemical smog in Mexico City. Atmos. Environ. 2001, 35, 1765–1772. [Google Scholar] [CrossRef]
- Lamy, K.; Portafaix, T.; Brogniez, C.; Godin-Beekmann, S.; Bencherif, H.; Morel, B.; Pazmino, A.; Metzger, J.M.; Auriol, F.; Deroo, C. Ultraviolet radiation modelling from ground-based and satellite measurements on Reunion Island, southern tropics. Atmos. Chem. Phys. 2018, 18, 227–246. [Google Scholar] [CrossRef] [Green Version]
- WHO; Lucas, R.; McMichael, T.; Smith, W.; Armstrong, B. Solar Ultraviolet Radiation: Global Burden of Desease from Solar Ultraviolet Radiation; Pruss-Ustun, A., Zeeb, H., Mathers, C., Repacholi, M., Eds.; Environmental Burden of Disease Series, No. 13; World Health Organization, Public Health and the Environment: Geneva, Switzerland, 2006. [Google Scholar]
- Hülsen, G.; Gröbner, J. Characterization and calibration of ultraviolet broadband radiometers measuring erythemally weighted irradiance. Appl. Opt. 2007, 46, 5877–5886. [Google Scholar] [CrossRef] [PubMed]
- WMO/GAW. Instruments to Measure Solar Ultraviolet Radiation Part 3: Multi-Channel Filter Instruments; GAW Report No. 190, WMO/TD-No. 1537; WMO: Geneve, Switzerland, 2010. [Google Scholar]
- Dahlback, A. Measurements of biologically effective UV doses, total ozone abundances, and loud effects with multichannel, moderate bandwidth filter instruments. Appl. Opt. 1996, 35, 6514–6521. [Google Scholar] [CrossRef] [PubMed]
- Blumthaler, M. UV Monitoring for Public Health. Int. J. Environ. Res. Public Health 2018, 15, 1723. [Google Scholar] [CrossRef] [PubMed]
- Amiridis, V.; Kafatos, M.; Perez, C.; Kazadzis, S.; Gerasopoulos, E.; Mamouri, R.E.; Papayannis, A.; Kokkalis, P.; Giannakaki, E.; Basart, S.; et al. The Potential of the Synergistic Use of Passive and Active Remote Sensing Measurements for the Validation of a Regional Dust Model. Ann. Geophys. 2009, 27, 3155–3164. [Google Scholar] [CrossRef]
- Gkikas, A.; Basart, S.; Hatzianastassiou, N.; Marinou, E.; Amiridis, V.; Kazadzis, S.; Pey, J.; Querol, X.; Jorba, O.; Gassó, S.; et al. Mediterranean intense desert dust outbreaks and their vertical structure based on remote sensing data. Atmos. Chem. Phys. 2016, 16, 8609–8642. [Google Scholar] [CrossRef] [Green Version]
- Mayer, B.; Kylling, A. Technical note: The libRadtran software package for radiative transfer calculations—Description and examples of use. Atmos. Chem. Phys. 2005, 5, 1855–1877. [Google Scholar] [CrossRef]
- Carlund, T.; Kouremeti, N.; Kazadzis, S.; Gröbner, J. Aerosol optical depth determination in the UV using a four-channel precision filter radiometer. Atmos. Meas. Tech. 2017, 10, 905–923. [Google Scholar] [CrossRef] [Green Version]
- Dubovik, O.; King, M.D. A flexible inversion algorithm for retrieval of aerosol optical properties from Sun and sky radiance measurements. J. Geophys. Res. 2000, 105, 20673–20696. [Google Scholar] [CrossRef] [Green Version]
- Bais, A.F.; Zerefos, C.S.; Meleti, C.; Ziomas, I.C.; Tourpali, K. Spectral measurements of solar UV-B radiation and its relation to total ozone, SO2, and clouds. J. Geophys. Res. 1993, 98, 5199–5204. [Google Scholar] [CrossRef]
- Kazantzidis, A.; Bais, A.F.; Zempila, M.M.; Meleti, C.; Eleftheratos, K.; Zerefos, C. Evaluation of ozone column measurements over Greece with NILU–UV multi–channel radiometers. Int. J. Remote Sens. 2009, 30, 4273–4281. [Google Scholar] [CrossRef]
- Raptis, P.I.; Kazadzis, S.; Eleftheratos, K.; Kosmopoulos, P.; Amiridis, V.; Helmis, C.; Zerefos, C. Total ozone column measurements using an ultraviolet multi-filter radiometer. Int. J. Remote Sens. 2015, 36, 4469–4482. [Google Scholar] [CrossRef]
- Diémoz, H.; Eleftheratos, K.; Kazadzis, S.; Amiridis, V.; Zerefos, C.S. Retrieval of aerosol optical depth in the visible range with a Brewer spectrophotometer in Athens. Atmos. Meas. Tech. 2016, 9, 1871–1888. [Google Scholar] [CrossRef] [Green Version]
- Kinne, S.; O’Donnel, D.; Stier, P.; Kloster, S.; Zhang, K.; Schmidt, H.; Rast, S.; Giorgetta, M.; Eck, T.F.; Stevens, B. MAC-v1: A new global aerosol climatology for climate studies. J. Adv. Model. Earth Syst. 2013, 5, 704–740. [Google Scholar] [CrossRef] [Green Version]
- Ruiz-Arias, J.A.; Dudhia, J.; Gueymard, C.A. A simple parameterization of the short-wave aerosol optical properties for surface direct and diffuse irradiances assessment in a numerical weather model. Geosci. Model Dev. 2014, 7, 1159–1174. [Google Scholar] [CrossRef] [Green Version]
- Wilcox, L.J.; Highwood, E.J.; Dunstone, N.J. The influence of anthropogenic aerosol on multi-decadal variations of historical global climate. Environ. Res. Lett. 2013, 8, 024033. [Google Scholar] [CrossRef] [Green Version]
- Kinne, S.; Schulz, M.; Textor, C.; Guibert, S.; Balkanski, Y.; Bauer, S.E.; Berntsen, T.; Berglen, T.F.; Boucher, O.; et al. An AeroCom initial assessment—Optical properties in aerosol component modules of global models. Atmos. Chem. Phys. 2006, 6, 1815–1834. [Google Scholar] [CrossRef]
- Torres, O.; Bhartia, P.K.; Herman, J.R.; Ahmad, Z.; Gleason, J. Derivation of aerosol properties from satellite measurements of backscattered ultraviolet radiation: Theoretical basis. J. Geophys. Res. 1998, 103, 17099–17110. [Google Scholar] [CrossRef] [Green Version]
- Kirchstetter, T.W.; Novakov, T.; Hobbs, P.V. Evidence that the spectral dependence of light absorption by aerosols is affected by organic carbon. J. Geophys. Res. 2004, 109, D21208. [Google Scholar] [CrossRef]
- OMI/Aura Multi-wavelength Aerosol Optical Depth and Single Scattering Albedo 1-orbit L2 Swath 13 × 24 km V003. NASA Goddard Space Flight Center, Goddard Earth Sciences Data and Information Services Center (GES DISC). Available online: https://disc.gsfc.nasa.gov/datasets/OMAERO_V003/summary (accessed on 25 June 2018).
- Emde, C.; Buras-Schnell, R.; Kylling, A.; Mayer, B.; Gasteiger, J.; Hamann, U.; Kylling, J.; Richter, B.; Pause, C.; Dowling, T. The libRadtran software package for radiative transfer calculations (Version 2.0). Geosci. Model Dev. Discuss. 2015, 9, 1647–1672. [Google Scholar] [CrossRef] [Green Version]
- Thuillier, G.; Hersé, M.; Foujols, T.; Peetermans, W.; Gillotay, D.; Simon, P.C.; Mandel, H. The solar spectral irradiance from 200 to 2400 nm as measured by the SOLSPEC spectrometer from the ATLAS and EURECA missions. Sol. Phys. 2003, 214, 1–22. [Google Scholar] [CrossRef]
- U.S. Government Printing Office. U.S. Standard Atmosphere; U.S. Government Printing Office: Washington, DC, USA, 1976.
- Kazadzis, S.; Bais, A.; Kouremeti, N.; Gerasopoulos, E.; Garane, K.; Blumthaler, M.; Schallhart, B.; Cede, A. Direct spectral measurements with a Brewer spectroradiometer: Absolute calibration and aerosol optical depth retrieval. Appl. Opt. 2005, 44, 1681–1690. [Google Scholar] [CrossRef] [PubMed]
- Fioletov, V.E.; Kerr, J.B.; Wardle, D.I. The relationship between total ozone and spectral UV irradiance from Brewer observations and its use for derivation of total ozone from UV measurements. Geophys. Res. Lett. 1997, 24, 2997–3000. [Google Scholar] [CrossRef] [Green Version]
Figure 1.
Flow chart of the methodology followed to retrieve SSA from UVFMR measurements [8].
Figure 1.
Flow chart of the methodology followed to retrieve SSA from UVFMR measurements [8].

Figure 2.
Mean SSA in UV and lower visible wavelengths, as measured in Athens for the period 2009–2014 (332 and 368 nm measured by UVMFR and 440 nm measured by CIMEL). Averages for all data, for AOD > 0.2 and for dust cases (Angström exponent < 0.7), are shown with different colors.
Figure 2.
Mean SSA in UV and lower visible wavelengths, as measured in Athens for the period 2009–2014 (332 and 368 nm measured by UVMFR and 440 nm measured by CIMEL). Averages for all data, for AOD > 0.2 and for dust cases (Angström exponent < 0.7), are shown with different colors.

Figure 3.
Relative differences of UVA (left) and UVB (right) irradiances for different SSAs as a function of SZA and AOD, calculated from RTM. Scenarios are calculated using mean SSA values at 332, 368, and 440 nm for Athens’ dataset. Scenario 1 is calculated with (SSA440 − SSA368)/SSA440 and scenario 2 with (SSA440 − SSA332)/SSA440. Mean values for these are SSA440 = 0.91 SSA368 = 0.86 and SSA332 = 0.84.

Figure 4.
(Top): Mean monthly SSA values calculated by CIMEL and UVMFR time series and extracted from OMAERO, OMAERUV and AeroCom databases, for Athens during the 2009–2014 period. (Bottom): mean monthly values of AOD calculated using CIMEL and UVMFR time series.
Figure 4.
(Top): Mean monthly SSA values calculated by CIMEL and UVMFR time series and extracted from OMAERO, OMAERUV and AeroCom databases, for Athens during the 2009–2014 period. (Bottom): mean monthly values of AOD calculated using CIMEL and UVMFR time series.

Figure 5.
Mean Monthly Relative difference in UVA (upper plot) and UVB (lower plot), calculated with different SSA input and using time series of UVMFR SSA as reference.
Figure 5.
Mean Monthly Relative difference in UVA (upper plot) and UVB (lower plot), calculated with different SSA input and using time series of UVMFR SSA as reference.

Figure 6.
Relative difference in UVA (upper plot) and UVB (lower plot) with respect to AAOD, calculated with UVMFR and CIMEL SSA inputs as described in Table 1.
Figure 6.
Relative difference in UVA (upper plot) and UVB (lower plot) with respect to AAOD, calculated with UVMFR and CIMEL SSA inputs as described in Table 1.

Figure 7.
Relative frequency histograms of cases of UVA (upper plot) and UVB (lower plot) relative differences of GHI calculated using UVMFR and CIMEL SSA input as described in Table 1, for all available synchronous data.
Figure 7.
Relative frequency histograms of cases of UVA (upper plot) and UVB (lower plot) relative differences of GHI calculated using UVMFR and CIMEL SSA input as described in Table 1, for all available synchronous data.
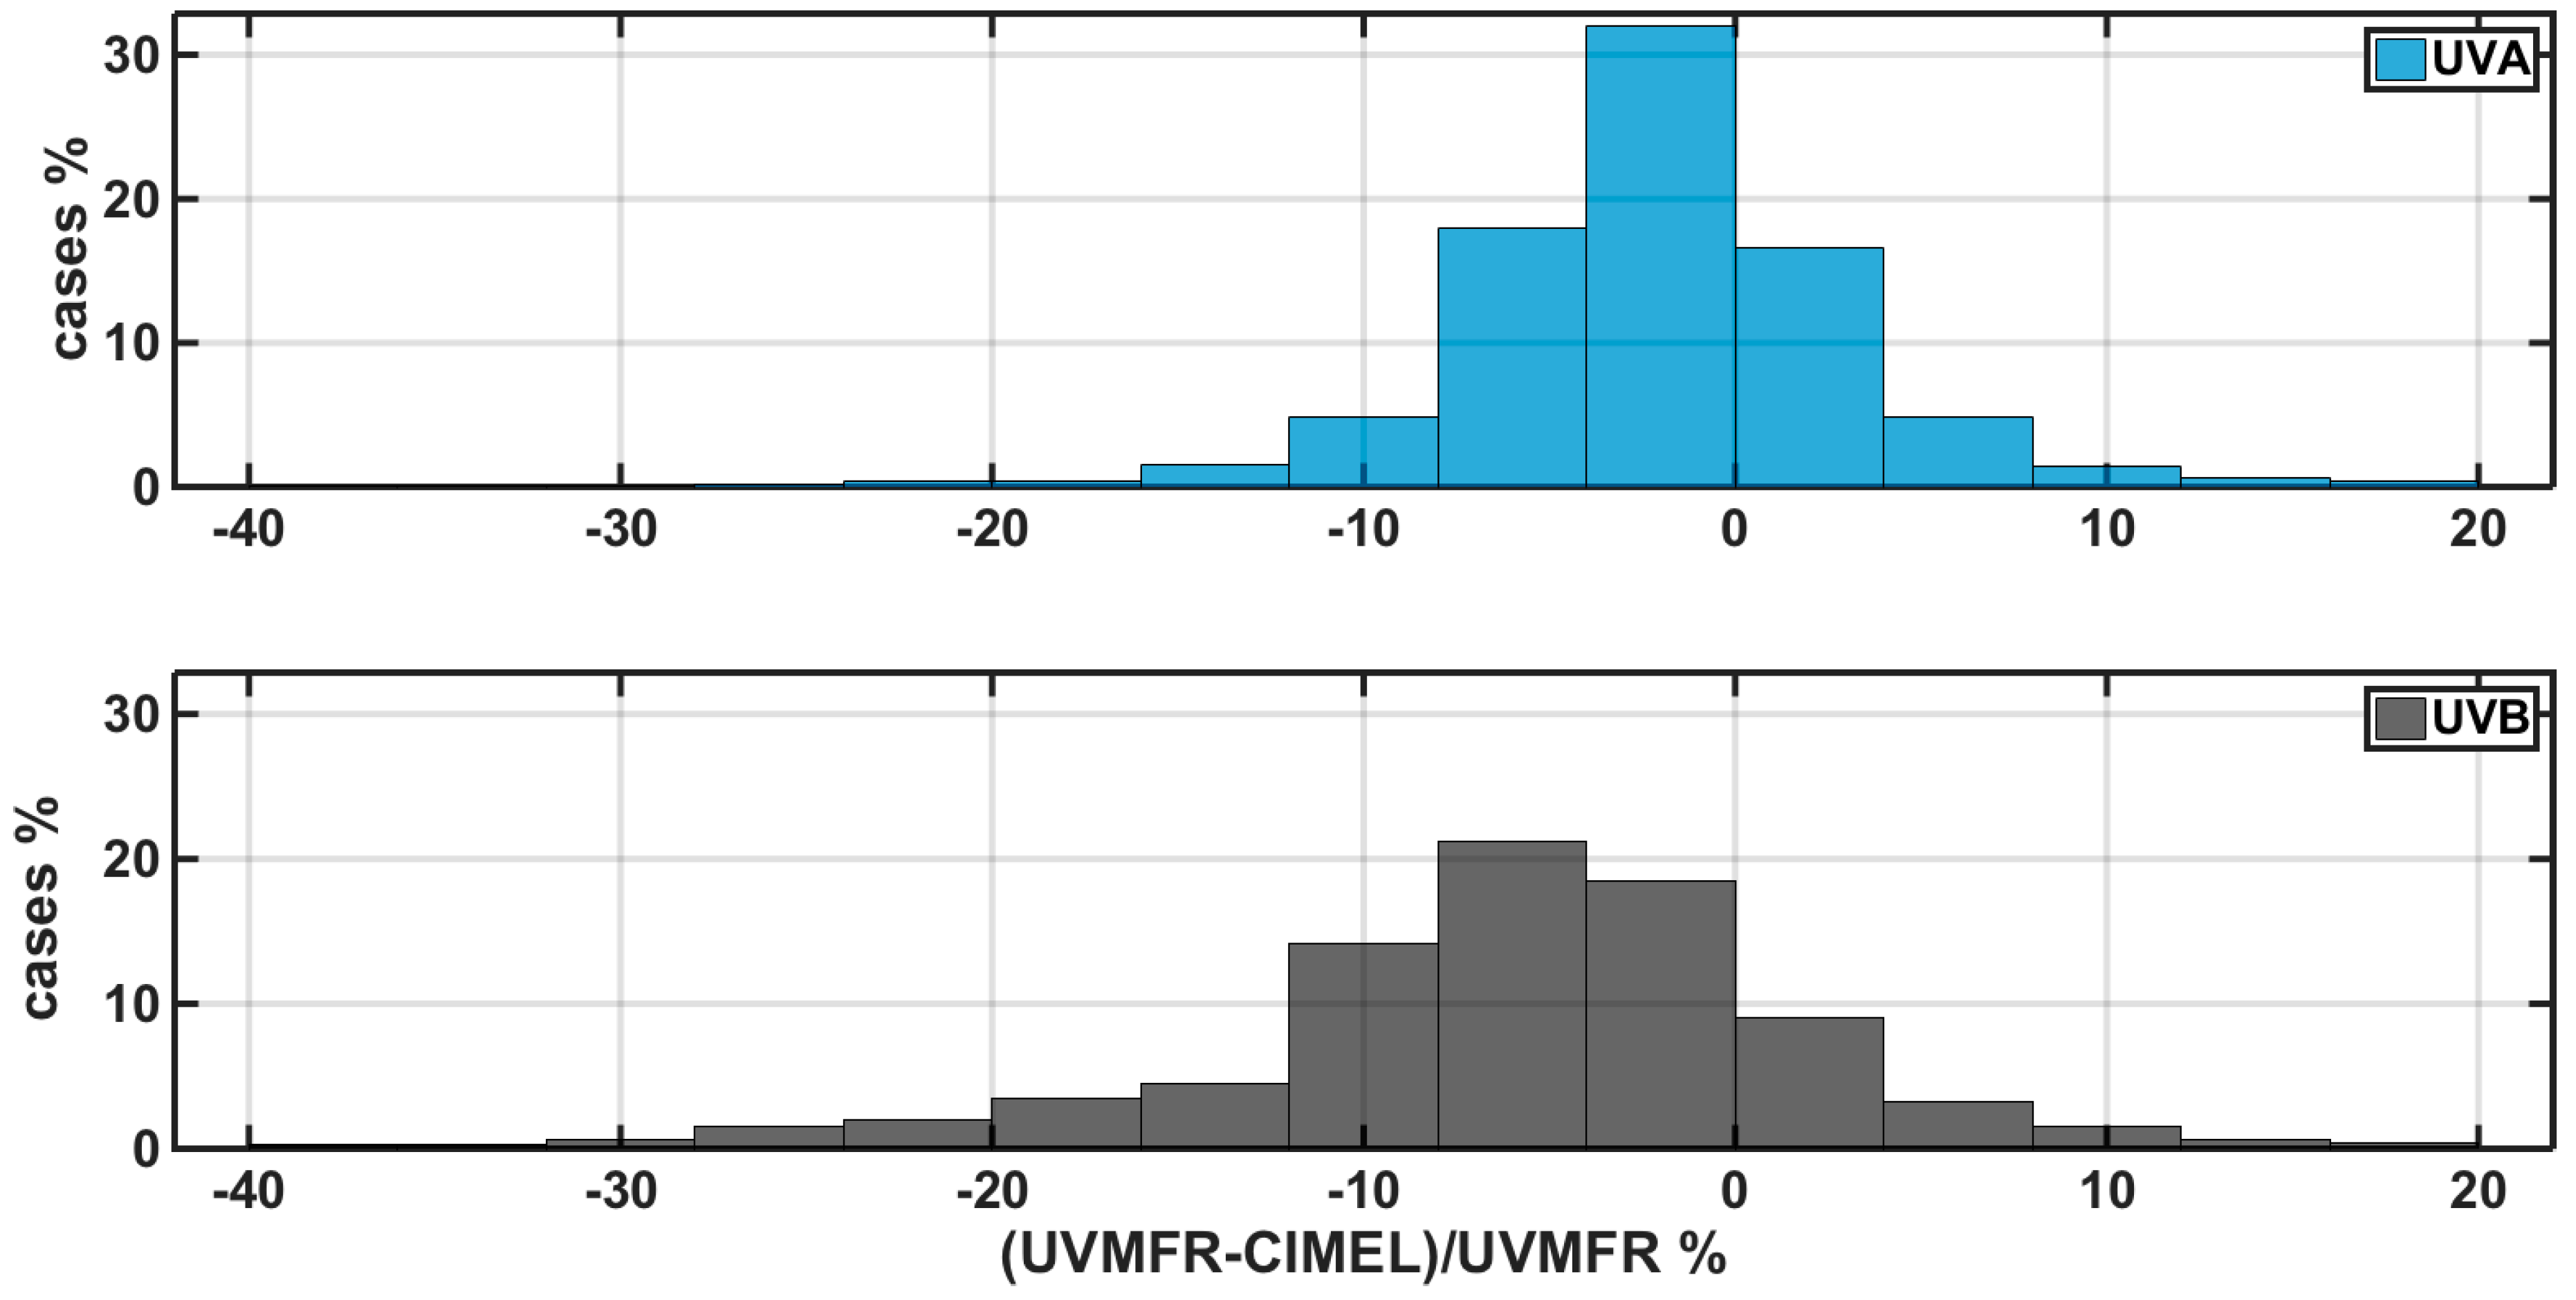
Figure 8.
Cloudless synchronous retrievals of Global UV at 324 nm, measured from Brewer and calculated from model using UVMFR SSA and AOD at 332 nm inputs.
Figure 8.
Cloudless synchronous retrievals of Global UV at 324 nm, measured from Brewer and calculated from model using UVMFR SSA and AOD at 332 nm inputs.

Figure 9.
Number of cases of relative difference between Brewer recorded Irradiance at 324 nm and estimated through RTM calculations using SSAUVMFR at 332, SSACIMEL at 440 nm, and SSAAEROCOM at 300 nm.
Figure 9.
Number of cases of relative difference between Brewer recorded Irradiance at 324 nm and estimated through RTM calculations using SSAUVMFR at 332, SSACIMEL at 440 nm, and SSAAEROCOM at 300 nm.

Table 1.
UVA and UVB output datasets of RTM runs, characterized by SSA and AOD used in each case. Result names are characterized by the SSA dataset used.
Table 1.
UVA and UVB output datasets of RTM runs, characterized by SSA and AOD used in each case. Result names are characterized by the SSA dataset used.
| Name | AOD Input (λ) (nm, instr.) | SSA Input (λ) (nm, instr.) | Output (Irradiance Integral) |
|---|---|---|---|
| UVMFRUVA | 368, uvmfr | 368, uvmfr | UVA |
| UVMFRUVB | 332, uvmfr | 332, uvmfr | UVB |
| CIMELUVA | 368, uvmfr | 440, CIMEL | UVA |
| CIMELUVB | 332, uvmfr | 440, CIMEL | UVB |
| OMAEROUVA | 368, uvmfr | 342, OMAERO | UVA |
| AeroComUVB | 332, uvmfr | 300, AeroCom | UVB |
Table 2.
Statistics of RTM calculated Irradiance at 324 nm compared to Brewer recordings at 324 nm for all available data.
Table 2.
Statistics of RTM calculated Irradiance at 324 nm compared to Brewer recordings at 324 nm for all available data.
| UV (Brewer-ModelX)/Brewer | Mean Difference % | Standard Deviations % | Median % | 5–95 Percentile % |
|---|---|---|---|---|
| UVMFR | −0.85 | 6.78 | −1.86 | −9.72–11.24 |
| CIMEL | −4.91 | 6.62 | −5.58 | −12.07–4.33 |
| AeroCom | −4.15 | 7.50 | −5.34 | −12.47–7.72 |
© 2018 by the authors. Licensee MDPI, Basel, Switzerland. This article is an open access article distributed under the terms and conditions of the Creative Commons Attribution (CC BY) license (http://creativecommons.org/licenses/by/4.0/).
Share and Cite
MDPI and ACS Style
Raptis, I.-P.; Kazadzis, S.; Eleftheratos, K.; Amiridis, V.; Fountoulakis, I. Single Scattering Albedo’s Spectral Dependence Effect on UV Irradiance. Atmosphere 2018, 9, 364. https://doi.org/10.3390/atmos9090364
AMA Style
Raptis I-P, Kazadzis S, Eleftheratos K, Amiridis V, Fountoulakis I. Single Scattering Albedo’s Spectral Dependence Effect on UV Irradiance. Atmosphere. 2018; 9(9):364. https://doi.org/10.3390/atmos9090364
Chicago/Turabian StyleRaptis, Ioannis-Panagiotis, Stelios Kazadzis, Kostas Eleftheratos, Vassilis Amiridis, and Ilias Fountoulakis. 2018. "Single Scattering Albedo’s Spectral Dependence Effect on UV Irradiance" Atmosphere 9, no. 9: 364. https://doi.org/10.3390/atmos9090364
Note that from the first issue of 2016, this journal uses article numbers instead of page numbers. See further details here.