1. Introduction
Wetlands are diverse and productive ecosystems that provide numerous resources for human use. All wetlands depend on specific hydrologic conditions for maintenance, but tropical wetland/shallow reservoir systems are especially sensitive to change in water balance as the important physical, chemical and biological processes are all accelerated by higher ambient temperatures [
1].
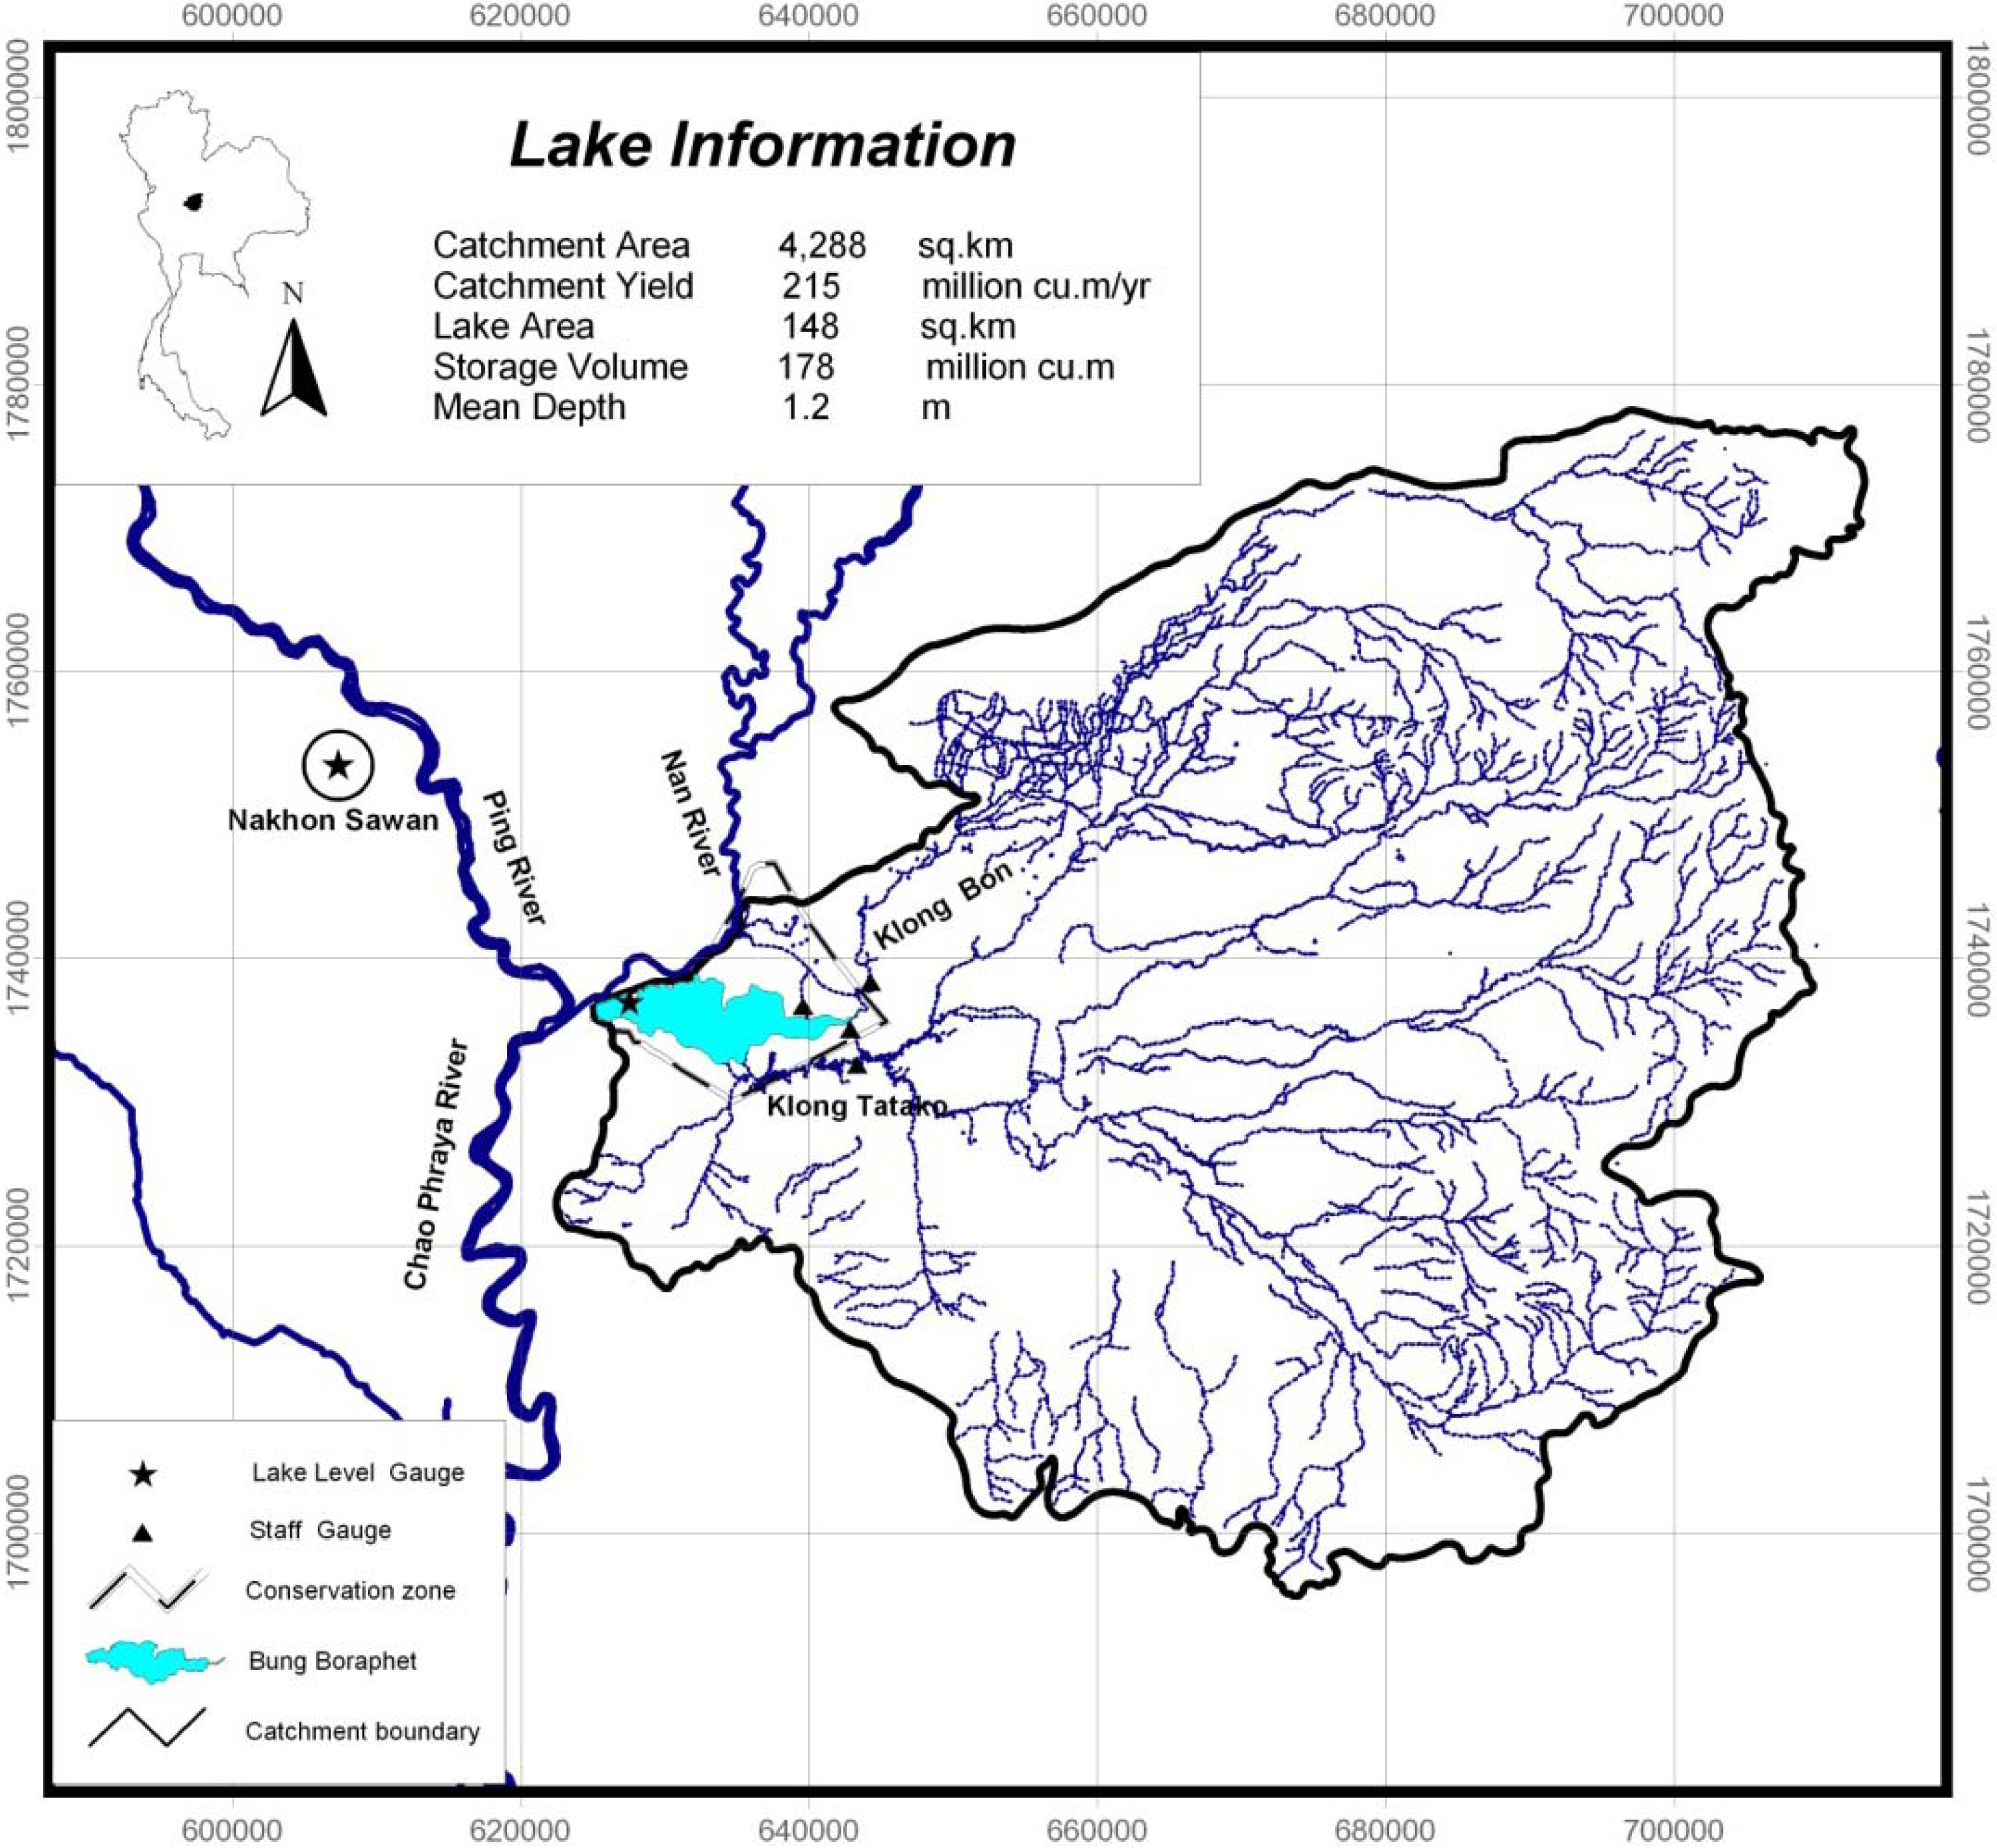
Bung Boraphet is the largest shallow reservoir and wetland complex in Thailand. It is situated at the head of Chao Phraya River flood plain in central Thailand (
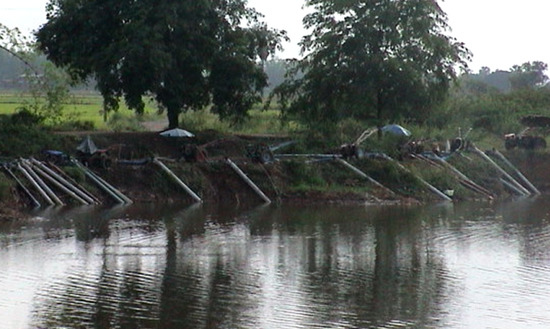
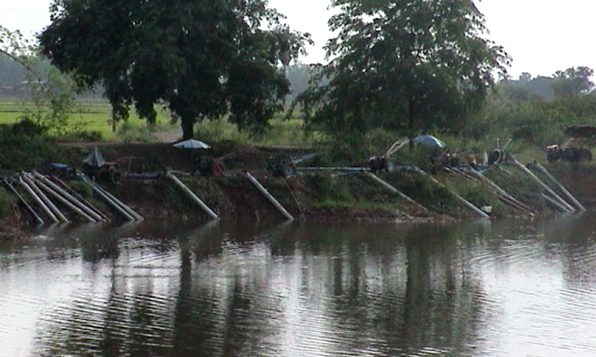
Figure 1). The human population living around Bung Boraphet uses the reservoir-wetland for rice cultivation and fishing. Other recognised values of the wetland are tourism and biodiversity [
2].
Figure 1.
Location, dry season catchment and instrumentation for Bung Boraphet study (dashed line delineates the Conservation Zone around Bung Boraphet).
Figure 1.
Location, dry season catchment and instrumentation for Bung Boraphet study (dashed line delineates the Conservation Zone around Bung Boraphet).
The Bung Boraphet wetland has a long history of active water management. King Rama VII assigned the management responsibility to the Thai Fisheries Department in 1927, when a weir was constructed at the outlet of the wetland to expand the open water fish habitat. In 1937, a 212 km
2 ‘Conservation Zone’ was gazetted to preserve the wetland habitat from encroachment by settlers. Nevertheless, by 2006, around 30,000 people lived within the Conservation Zone and more than 60% of the area was under cultivation [
3].
In response to increasing demand for storage for dry season irrigation supply water, the weir crest was raised to +23.8 m (MSL) in 1970’s and again to +24.0 m (MSL) in 1993. The area of irrigated rice paddy within the Conservation Zone doubled between 1993 and 2003 (to 76 km
2) [
4]. Despite increased storage capacity, the average annual drawdown of the storage has increased, from 77% between 1993 and 2001, to 91% between 2002 and 2006 [
3].
The developments in the Bung Boraphet catchment reflect an expansion in dry season rice cultivation that has occurred elsewhere in the middle Chao Phraya River basin. This particularly affects the availability of water resources in the dry season (January to June), when the basin undergoes seasonal closure [
5]. Dry season water scarcity is predicted to increase in future [
6].
Thailand has a long cultural tradition of irrigated rice cultivation, centered on the flood plain of the Chao Phraya River. Historical water resource development was based on the concept that Thais were a nation of rice-growers and thus provision of irrigation infrastructure was the best development option in rural areas [
7]. This traditional view has encouraged Thai decision makers to focus on the benefits, rather than the cost/benefit ratios, when considering further irrigation infrastructure development [
8]. The continuing demand for irrigation water from Bung Boraphet has prompted new proposals to increase the yield of the storage by raising the weir height [
9] or by increasing the rate of diversion from the Nan River [
10].
This paper describes the development of a reservoir water budget model for Bung Boraphet, which we propose as an essential tool for hydrological management of the lake-wetland system to sustain the fishery, the biodiversity and the developing tourist industry as well as cultivation of rice.
Simple hydrologic models have been used extensively to describe water balance in wetlands (e.g., [
11,
12] and shallow flood plain lakes [
13,
14]). The Bung Boraphet system is more complex because of reverse flows from reservoir to catchment in the dry season.
Our aims in developing the water balance model were to 1) quantify the components of the Bung Boraphet water budget seasonally and over the annual inflow outflow cycle; 2) identify the uncertainty associated with the estimate of each component; and 3) to provide a hydrological basis for more equitable and sustainable management of the wetland complex.
3. Results
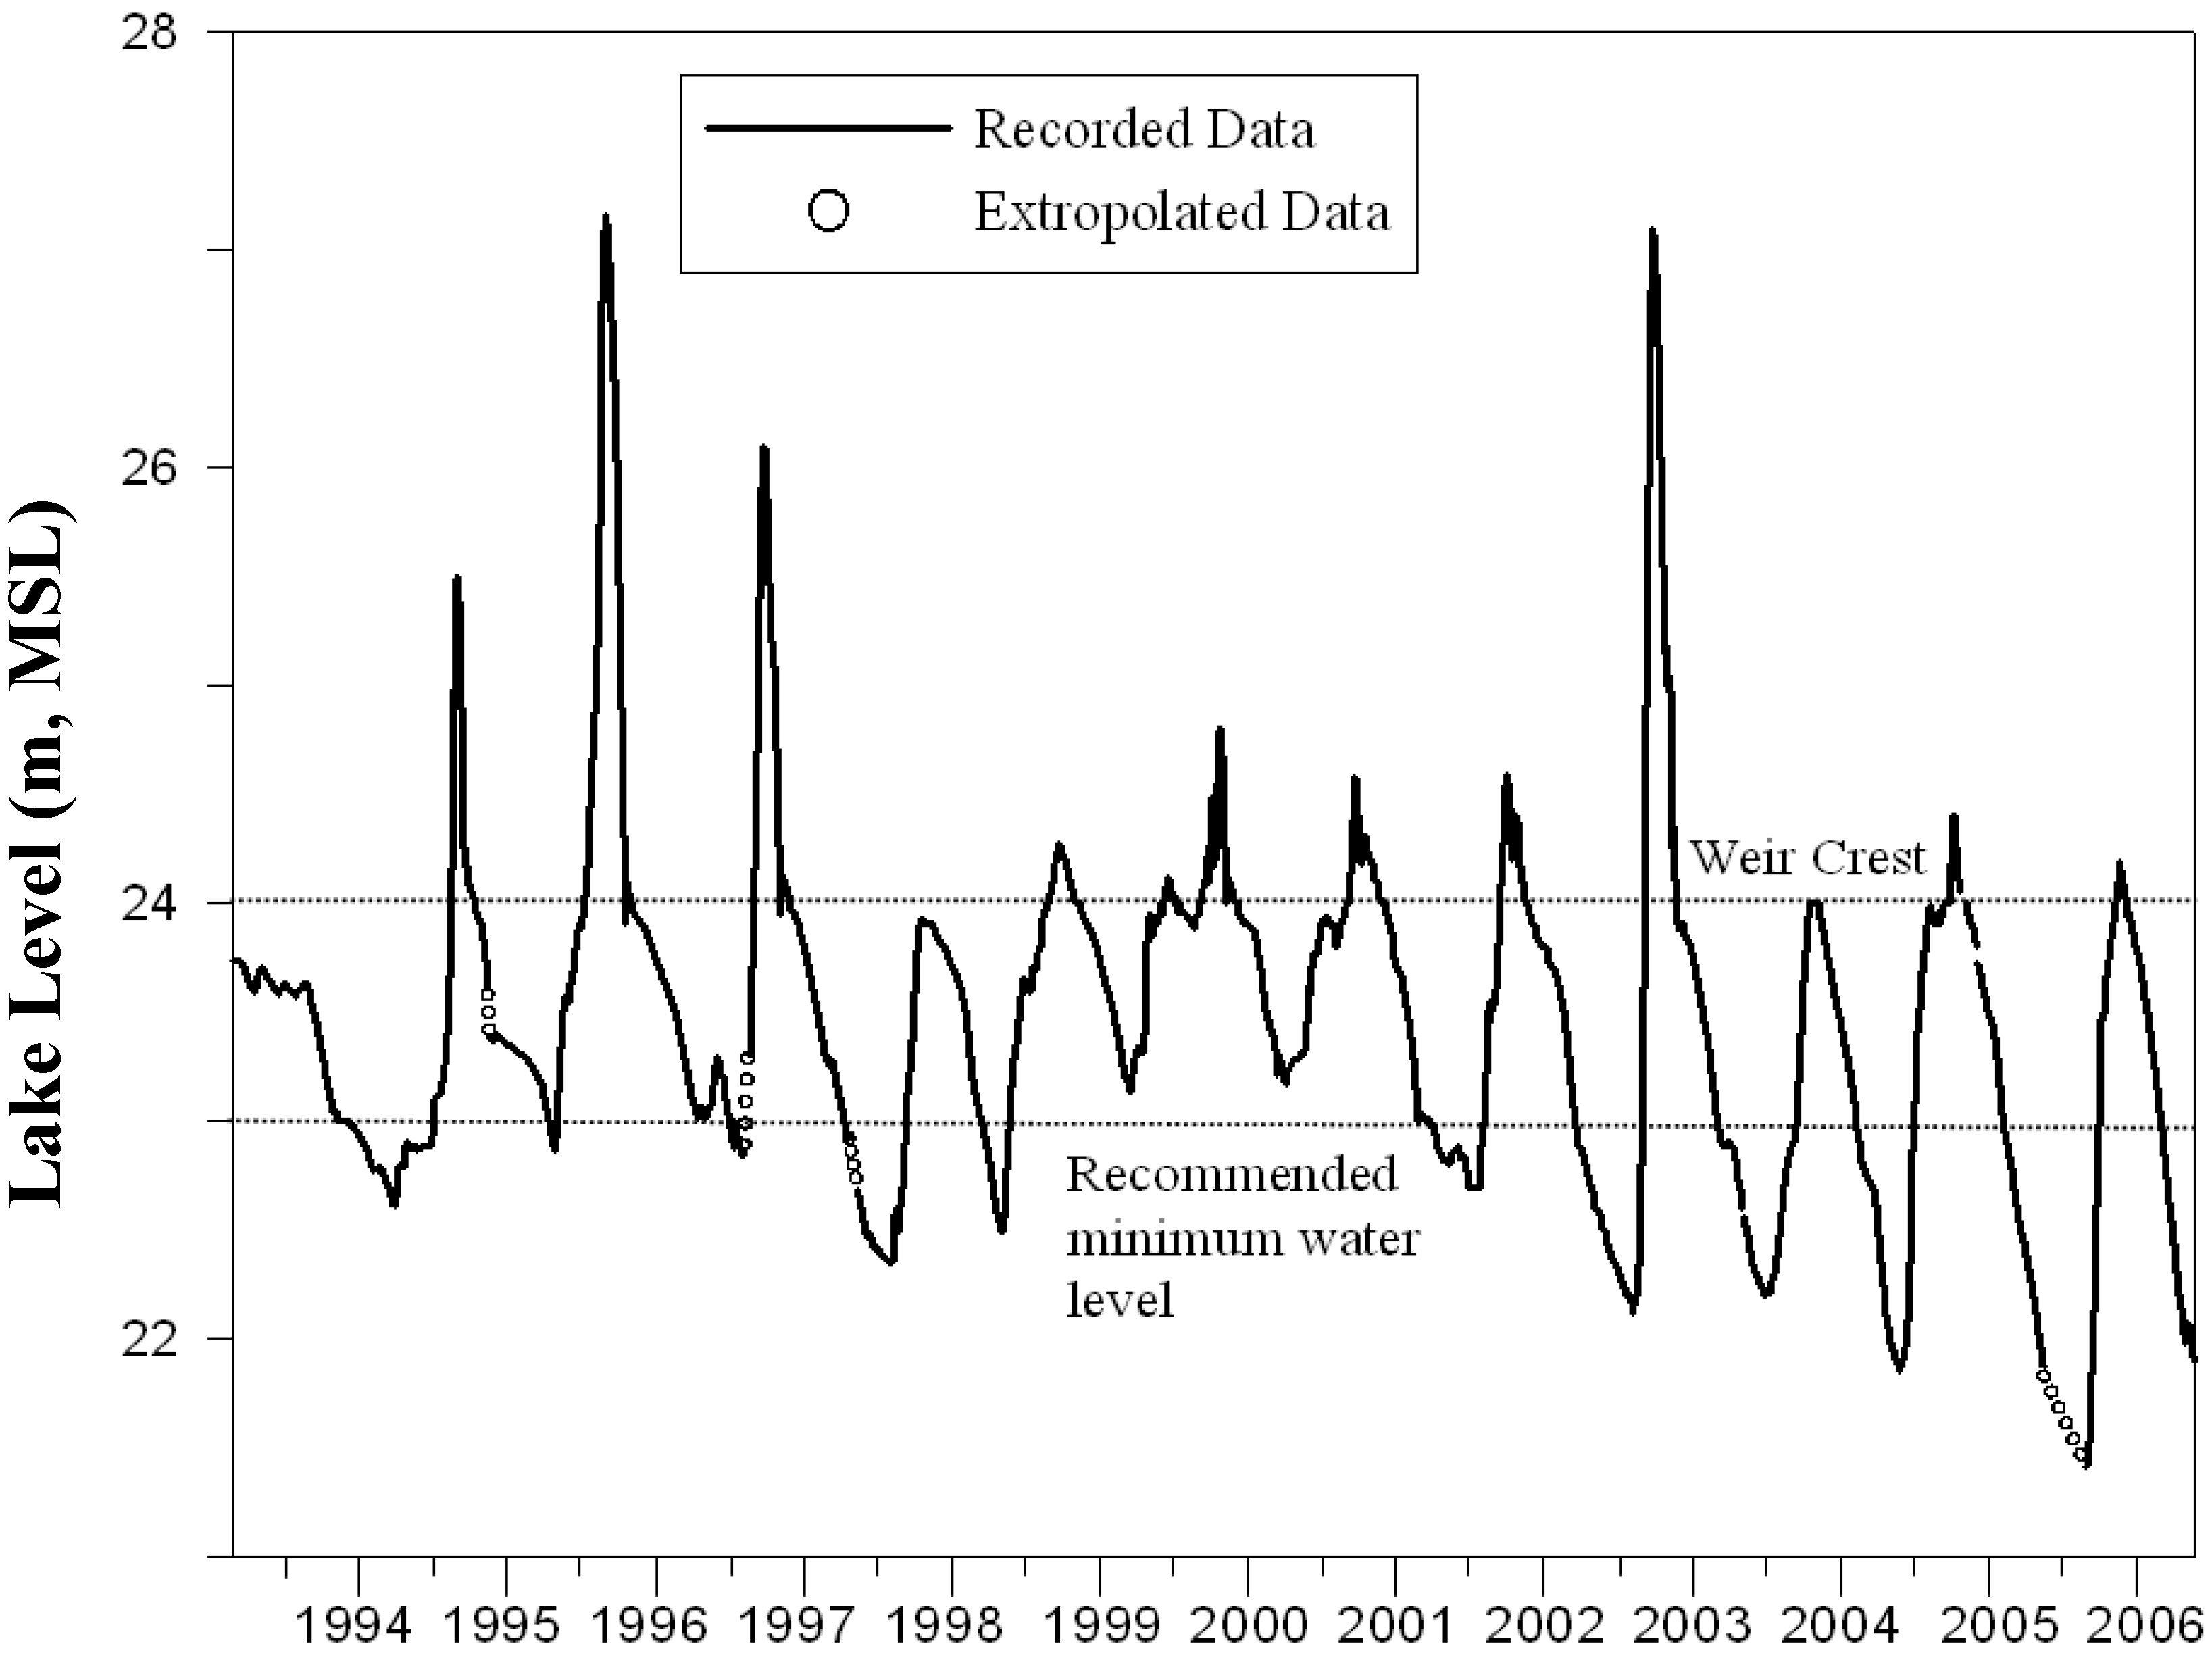
The hydrodynamic behaviour of Bung Boraphet was highly cyclic. A uni-modal filling phase commenced in mid-year and a prolonged drawdown followed from October-November. This annual cycle is evident in daily records of reservoir level since the weir was raised to +24 MSL in 1993 (
Figure 5). Over that period the annual maximum level exceeded the weir height in 11 of 14 years. More significantly, there have been 3 major floods in the Chao Phraya River system, identified by maximum water levels more than 2 m above the weir, which inundated large areas of the Chao Phraya flood plain including the Bung Boraphet wetland. The inflow-outflow cycle in Bung Boraphet that we used in this analysis always lagged the start of the official Thai water year (1 April and 31 March). The first inflow to Bung Boraphet followed the onset of the monsoon and was usually 6-8 weeks after the start of the water year. This variability in the start of the cycle, plus interannual differences in the magnitude of the flood, meant the duration of the natural cycle varied between 261 and 431 days during this study (
Table 3).
Figure 5.
Daily observations of water level of Bung Boraphet (1993-2006).
Figure 5.
Daily observations of water level of Bung Boraphet (1993-2006).
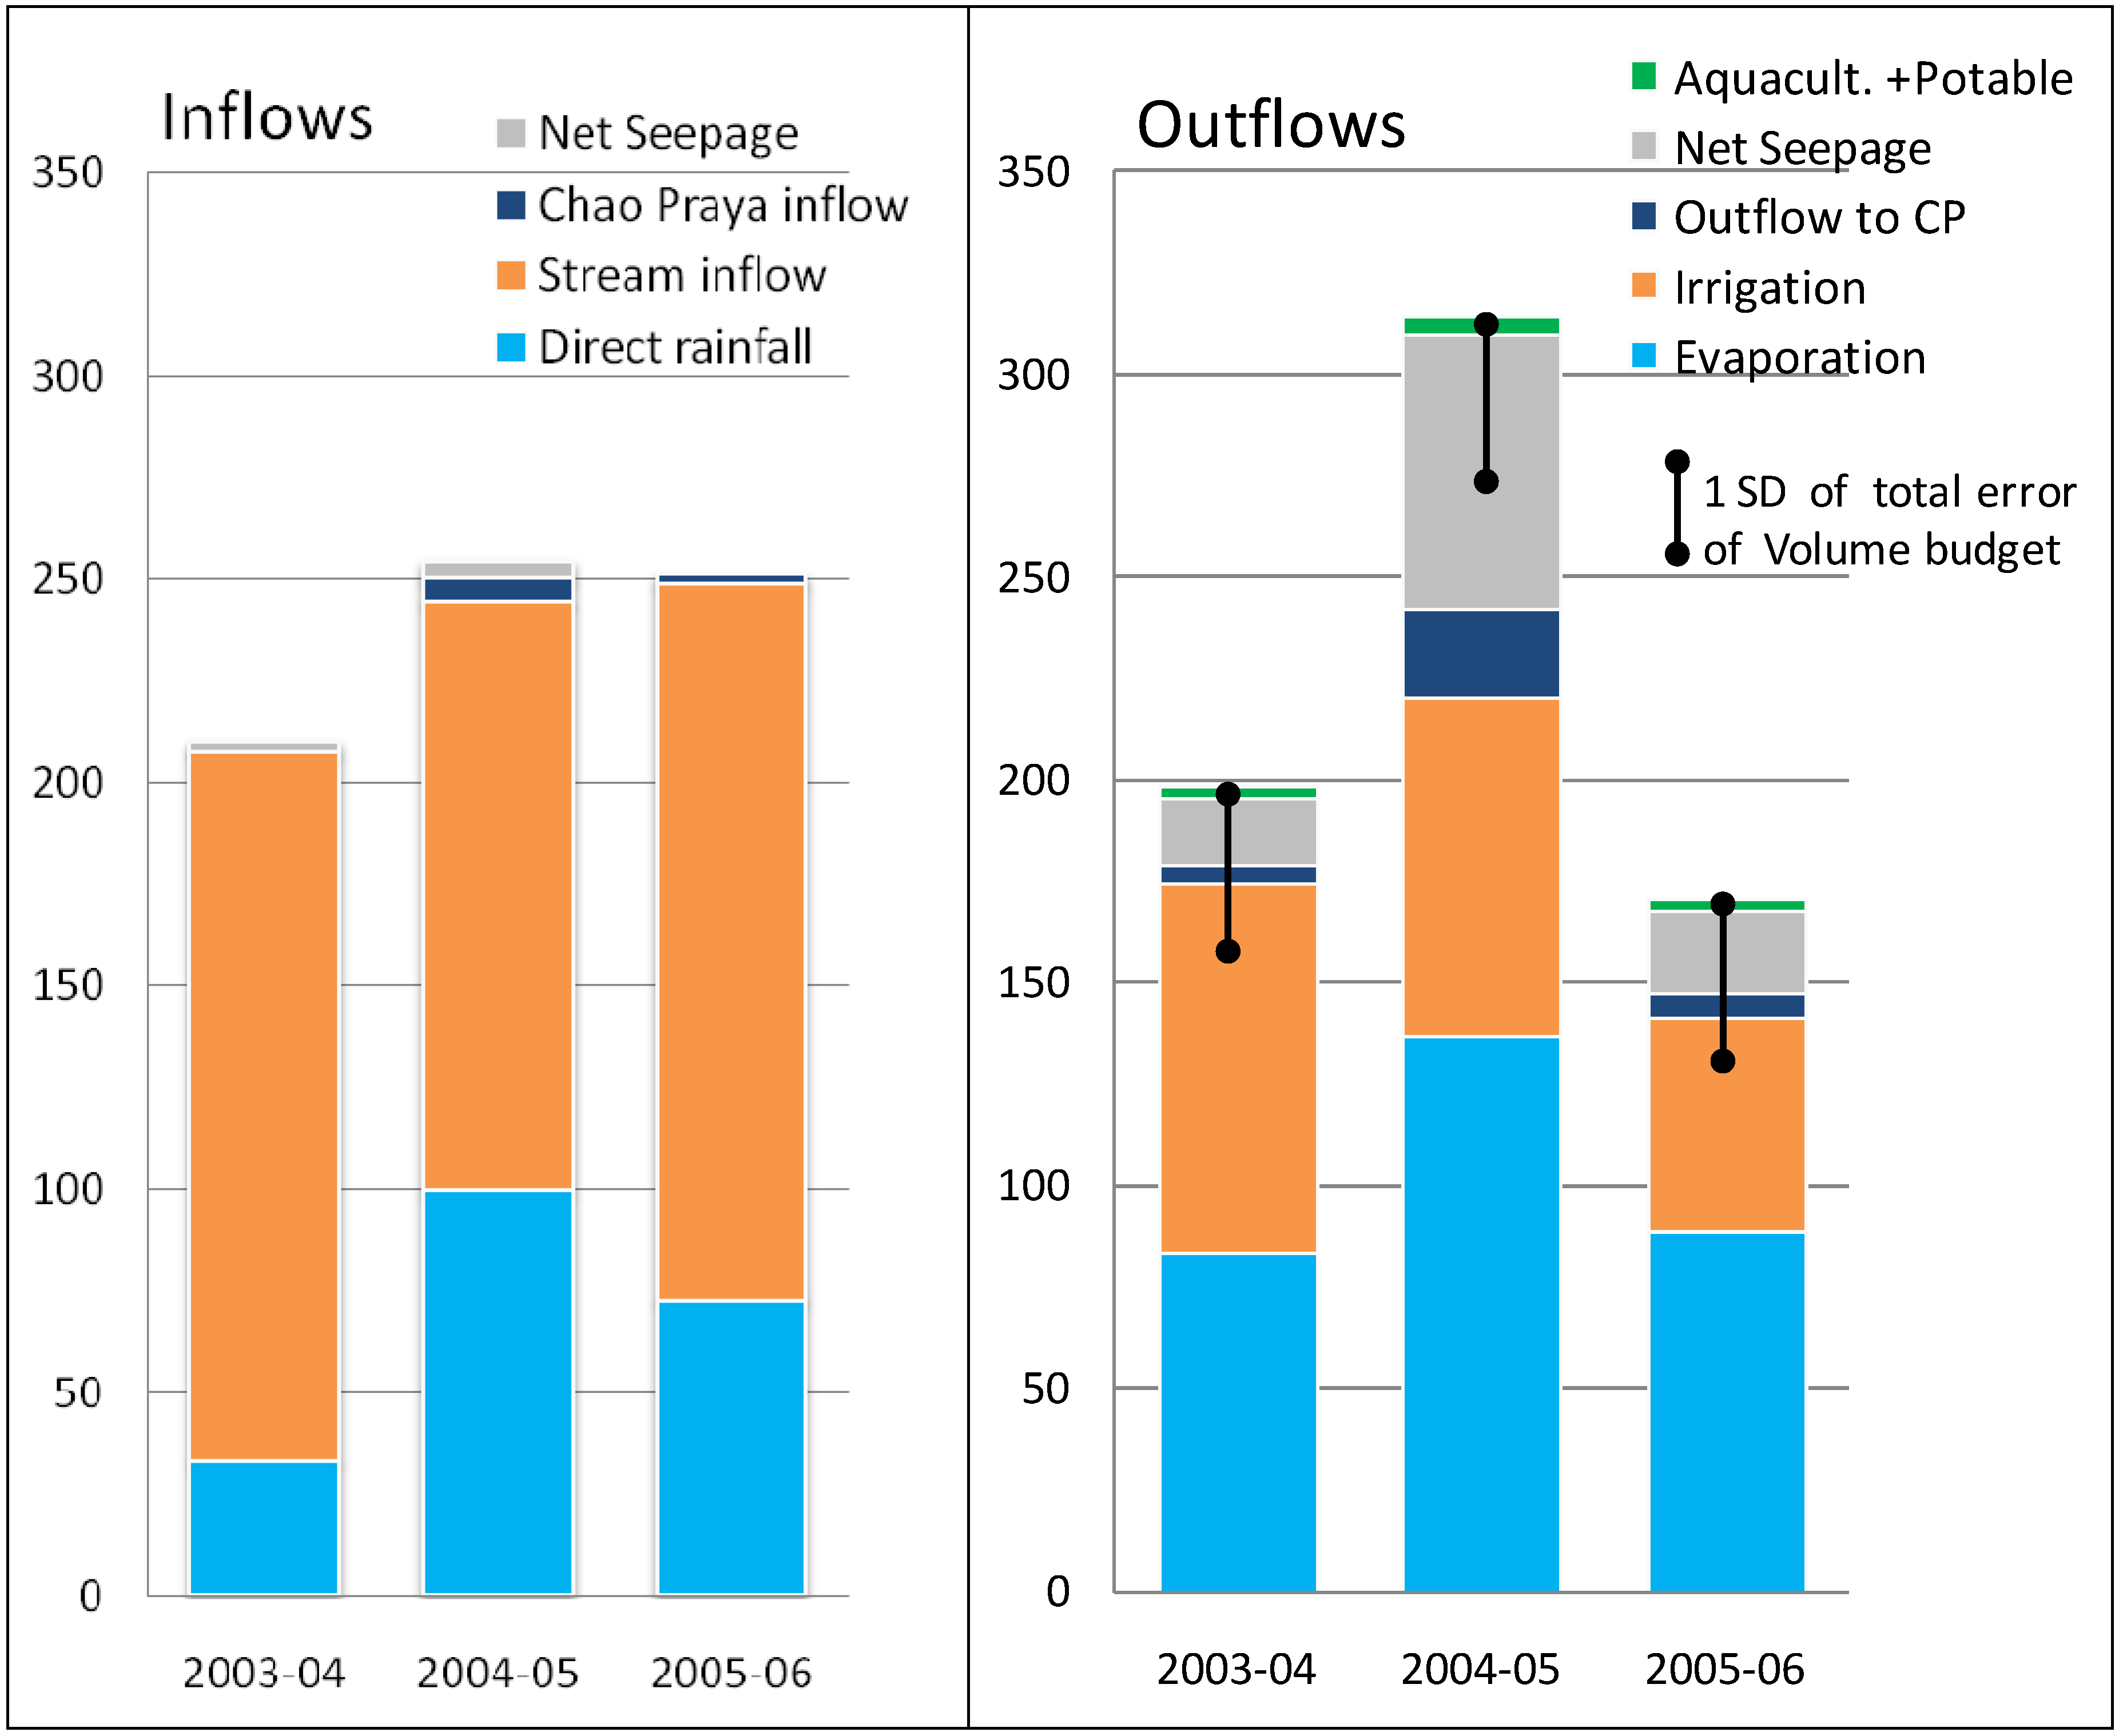
The volume of each component of the water budget was calculated for each season in three complete inflow/outflow cycles from 2003 to 2006 (
Table 3 and
Figure 6). A very large surface water inflow from the Chao Phraya River preceded the commencement of this study in 2002, but during the study period there was only a single minor inflow from Nan River in 2003. Thus this study was an opportunity to accurately assess the contribution of the local catchment to the water budget of the reservoir, in the absence of ungauged input from the Chao Phraya River.
Table 3.
Summary of water balance components for three inflow/outflow cycles.
Table 3.
Summary of water balance components for three inflow/outflow cycles.
| | | 2003-04 | 2004-05 | 2005-06 |
|---|
| Losses | (106 m3) | | | |
| | Evaporation | 83 | 137 | 89 |
| | Net Seepage outflow | 4 | 48 | 12 |
| | Outflow Type1 | 78 | 64 | 44 |
| | Outflow Type2 | 13 | 20 | 8 |
| | Total Irrigation outflows | 91 | 84 | 52 |
| | Outflow to CP‡ | 4 | 22 | 6 |
| | Outflow to Others§ | 3 | 5 | 3 |
| | Total of loss terms | 186 | 295 | 162 |
| Gains | (106 m3) | | | |
| | K. Bon | 19 | 20 | 25 |
| | K. Tatako | 151 | 118 | 147 |
| | Irrigation Canals | 4 | 6 | 4 |
| | Stream inflows | 174 | 145 | 176 |
| | Direct rainfall | 33 | 100 | 73 |
| | Inflow from CP‡ | 0 | 6 | 2 |
| | Net Seepage inflow | 2 | 4 | 0 |
| | Total of gain terms | 210 | 255 | 251 |
| Net Storage | | 28 | -36 | 92 |
| Total error (1 SD) | 41 | 42 | 41 |
| Duration | of Outflow period (d) | 202 | 309 | 158 |
| Duration† | of annual cycle (d) | 311 | 431 | 261 |
3.1. Surface water flows
Stream gauges were installed on the four main streams for this project. Although there were no control structures at the gauge sites, rating curve data was gathered over the duration of the project, so the error in these curves was expected to be within the normal range for such curves. The rating curve coefficients are listed in the
Appendices.
Surface runoff from the Bung Boraphet catchment was the most important gain term in the water budget. The main source of surface water was K. Tatako. The inflow from K. Bon was about 15% of that from K. Tatako in each cycle and the contributions from two irrigation canals were minor(
Table 3).
The specific yield of the Bung Boraphet catchment was 39,000 m3 km -2 y-1 which was significantly lower than the yields from the two much larger tributaries of the Chao Phraya River, namely the Ping River (150,000 m3 km -2 y-1) and Nan River (339,000 m3 km -2 y-1).
Figure 6.
Volume of water (106 m3) for water balance components over three complete inflow outflow cycles between November 2003 and May 2006. One standard deviation (SD) of the total error in the volume is super-imposed on the outflow summary. It was ~40 10 6 m3 each year.
Figure 6.
Volume of water (106 m3) for water balance components over three complete inflow outflow cycles between November 2003 and May 2006. One standard deviation (SD) of the total error in the volume is super-imposed on the outflow summary. It was ~40 10 6 m3 each year.
3.2. Rainfall
Rainfall in the Bung Boraphet catchment was highly seasonal. The majority of the precipitation occurring during the monsoon period (May to October) and in the wetter years more than 80% of the direct rainfall on the reservoir fell during this period.
Direct rainfall contributed 16–40% of the total input. The 2003 inflow season was comparatively dry and direct rainfall only contributed 16% of the total input of water to the reservoir whereas in 2004-5 and 2005-6 the direct rainfall onto the reservoir was 30 and 40% respectively of the total gain.
3.3. Evaporation
The average annual evaporation from Bung Boraphet was 1770 mm/y and evaporation was the dominant loss term in the budget, contributing about 50% of the water loss in each cycle. The mean depth of the reservoir at FSL is 1.2 metres and does not vary much across the drawdown range. Therefore evaporation was always a significant loss factor at any storage level.
Over the duration of the study, the total volume of loss by evaporation was 1.5 times greater than the gain from direct rainfall onto the reservoir. However, the volume of water lost to evaporation varied between cycles principally because of differences in cycle duration.
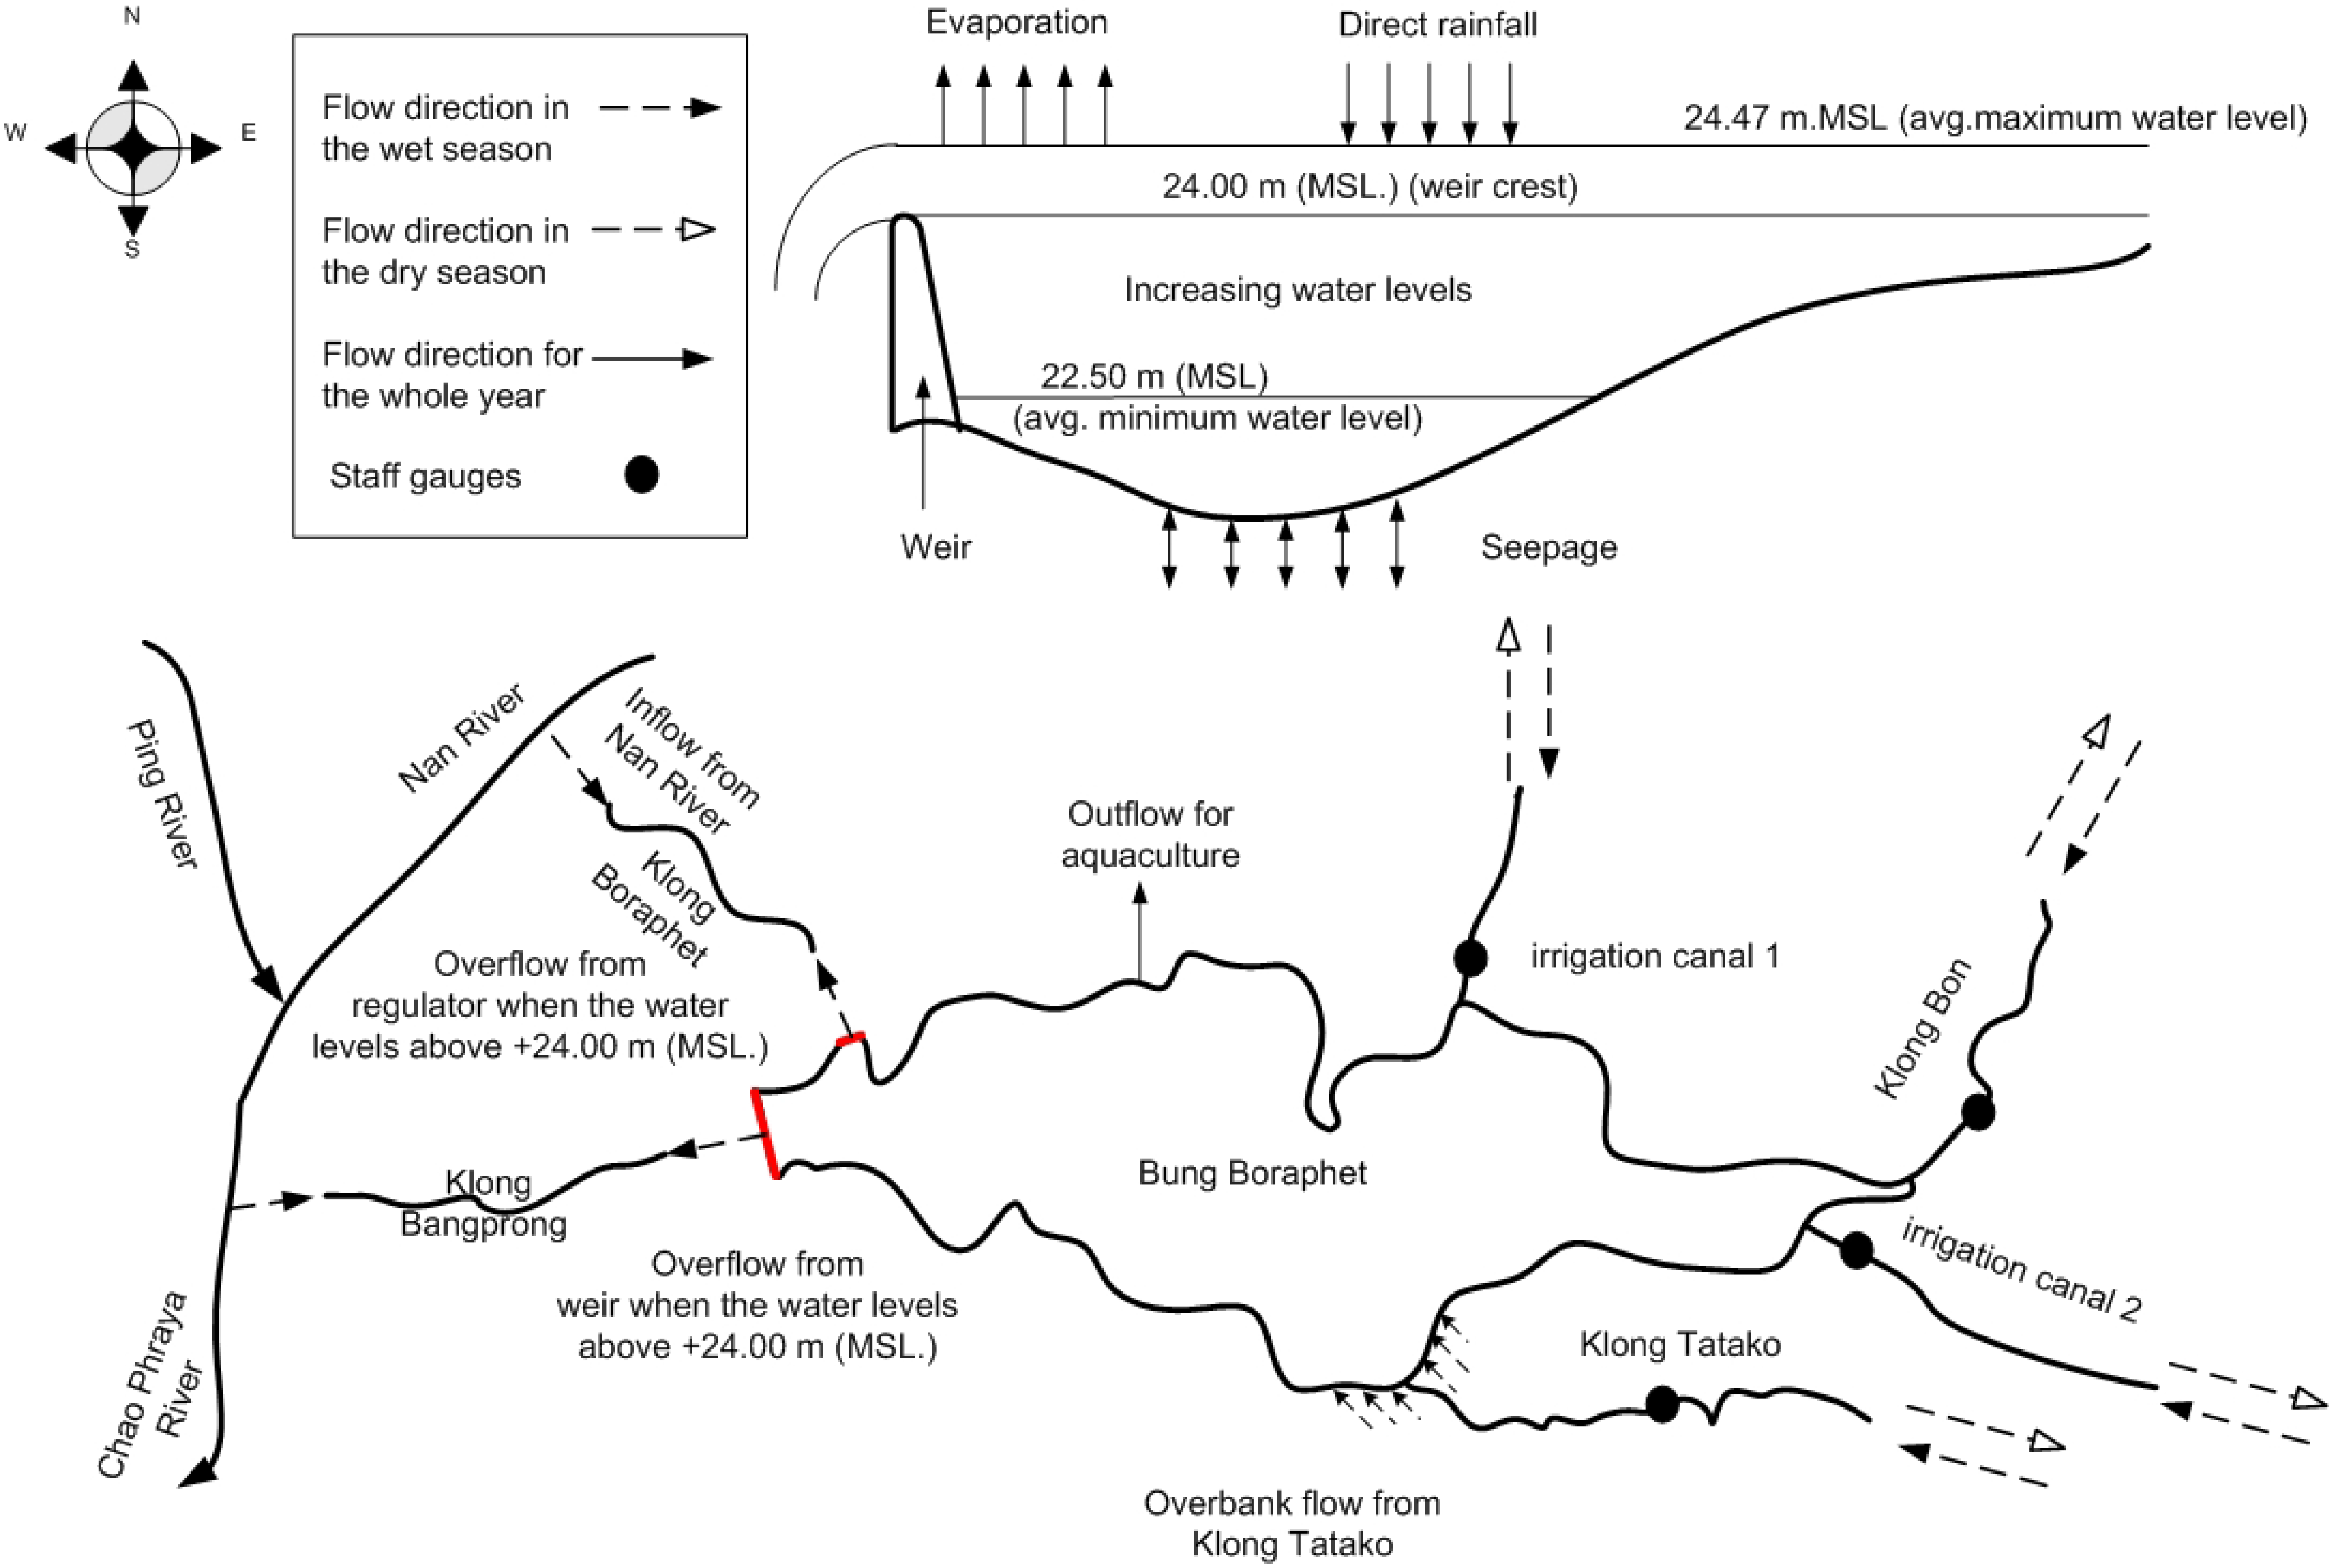
3.4. Surface water outflows
The surface water outflow components of the budget were; 1) outflows via the catchment streams; 2) outflows for other uses (public water supply and aquaculture); and 3) discharges downstream via the weir or the Nan River regulator. Outflow to the catchment occurred during the dry season, when farmers extracted reservoir water via the streams, to irrigate paddy rice.
The outflow rating curves for each catchment stream had slightly poorer correlation coefficients than the inflow curves (see
Appendices) because outflows were rated in conditions of variable pumping rates, whereas inflow (driven by gravity) was less variable. This was true for all streams except Irrigation Canal 1 – which had the least rating flow measurements.
Irrigation outflows were the second largest loss term in the water budget. The range, 92–58 x10
6 m
3, represented 50% and 30% of the total losses for the respective years (
Table 3 and
Figure 6). The volume of the irrigation outflow varied more than evaporation between cycles as it depended not only on the volume of water in the reservoir available for extraction but also environmental factors like catchment runoff and farmers decisions on the profitability of a second or third rice crop.
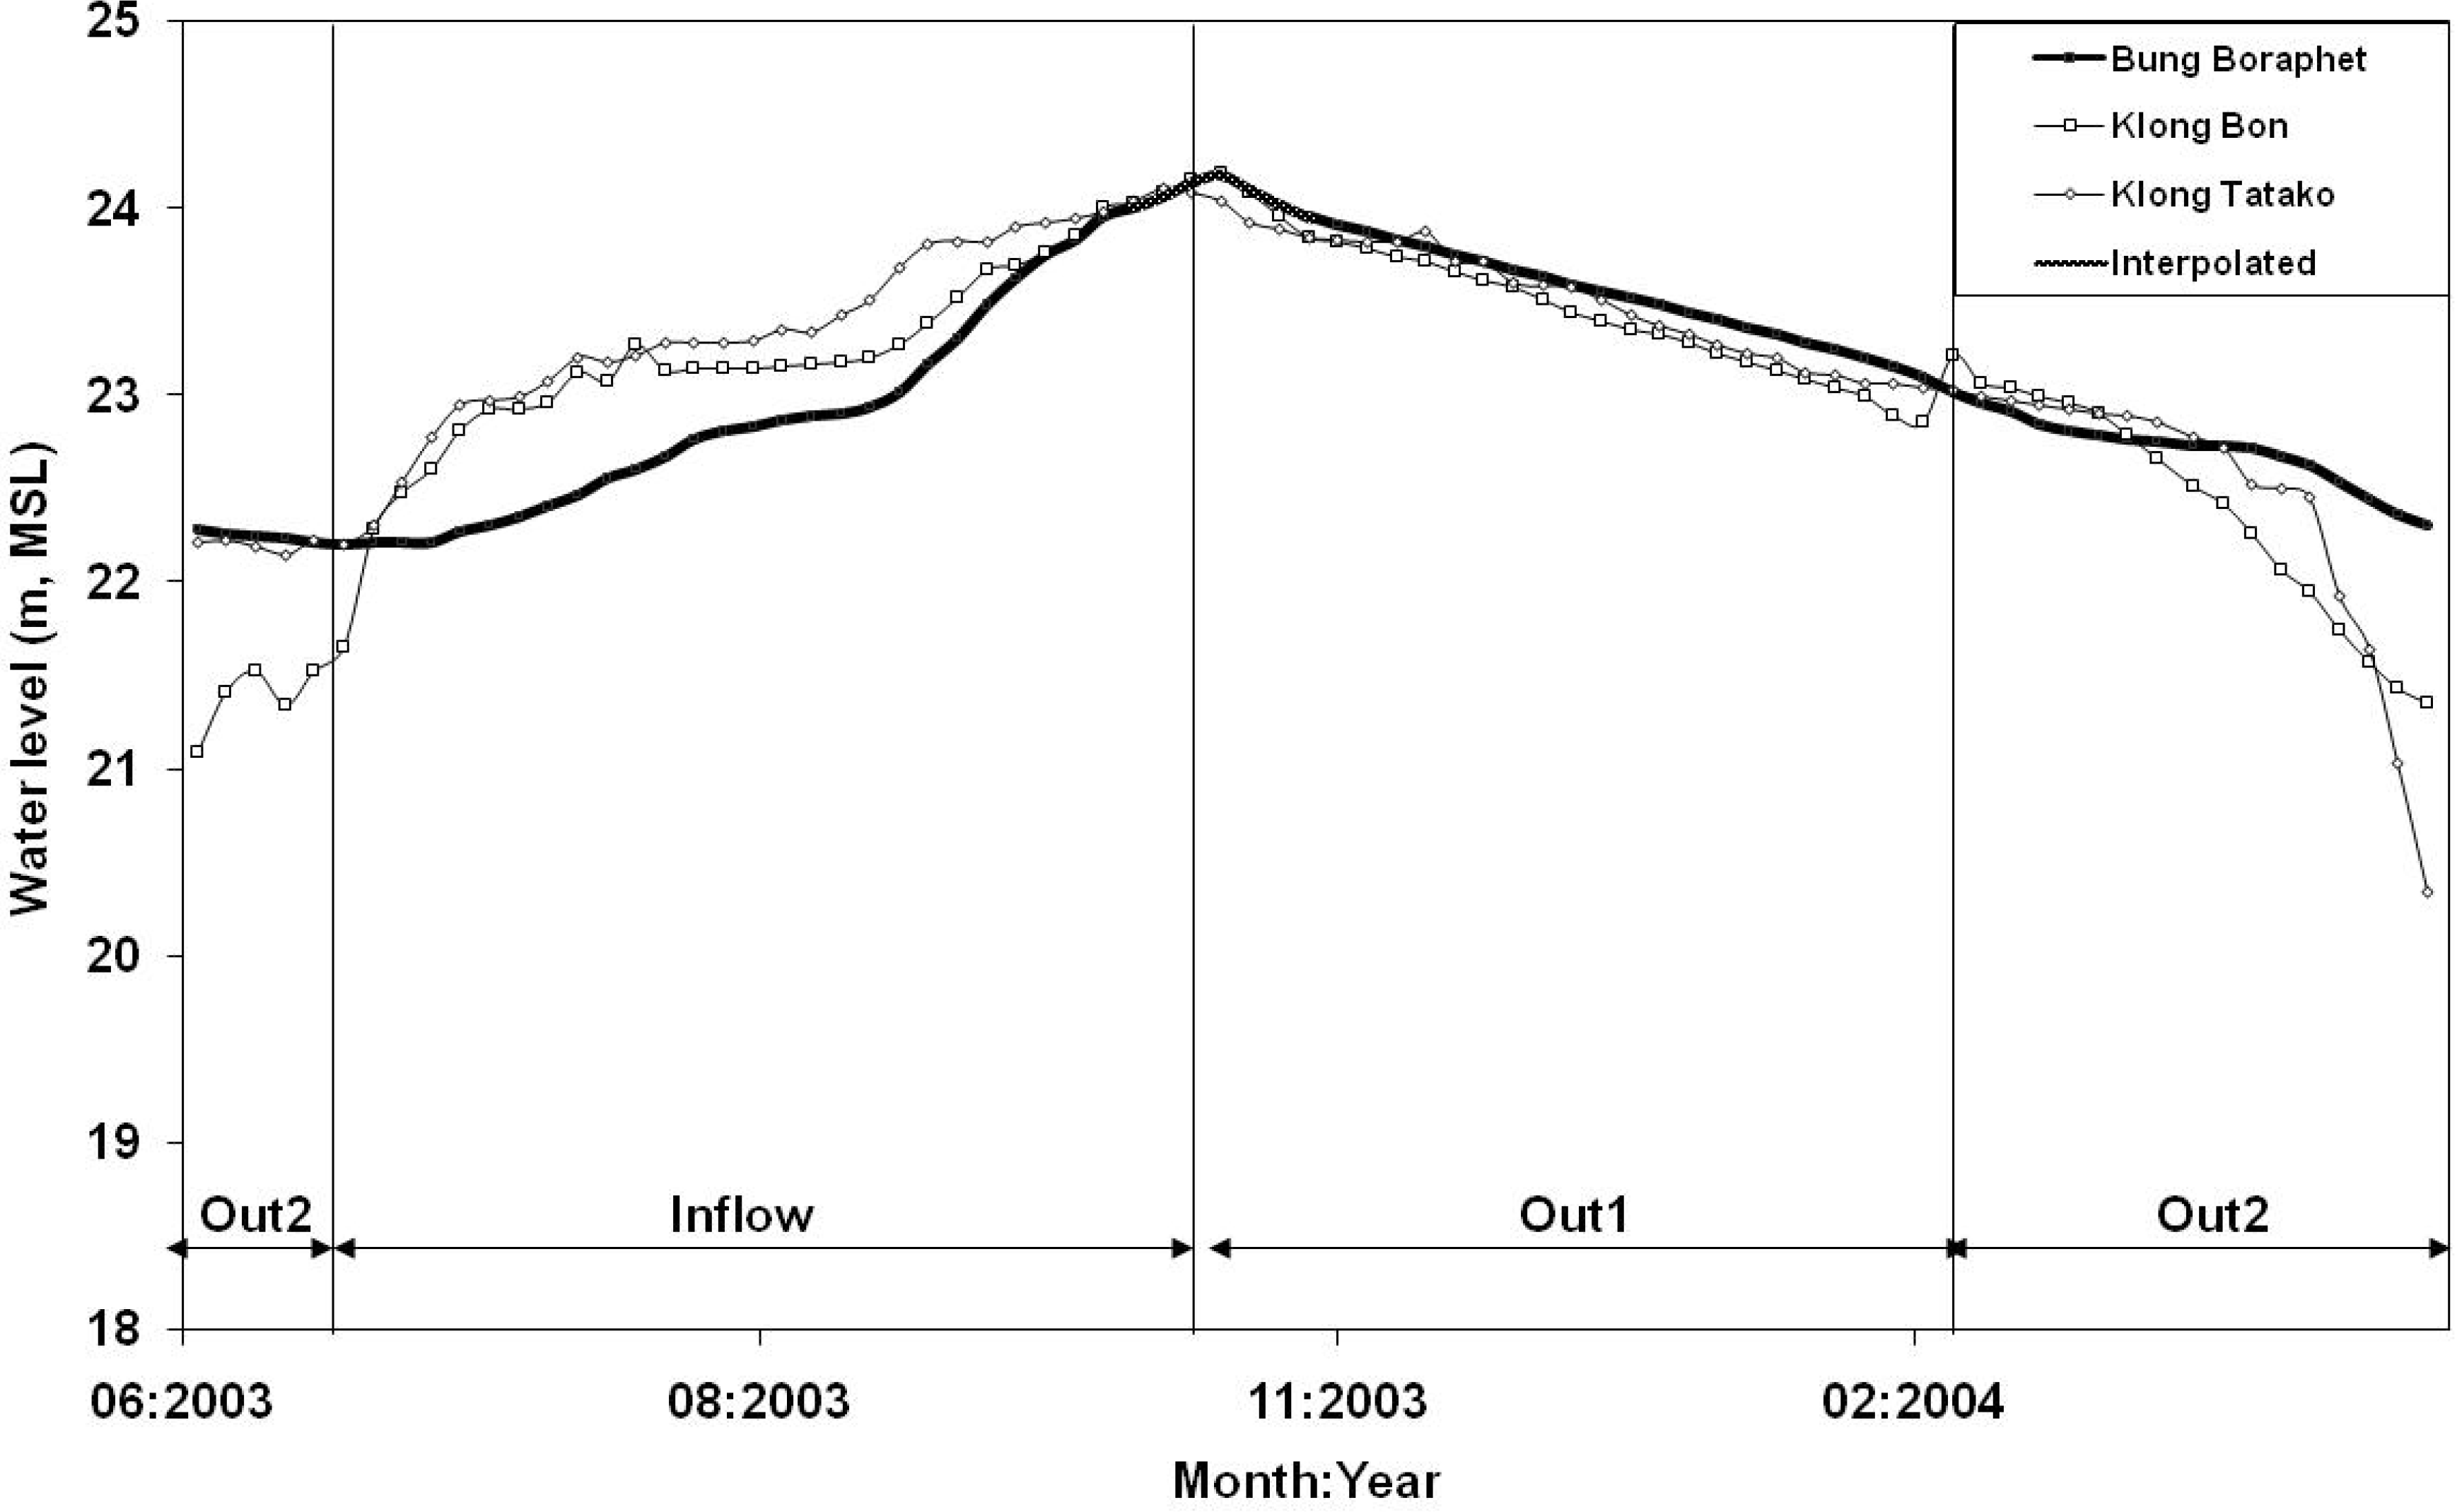
Gauged outflows (type 1) occurred at the beginning of the drawdown cycle and were used to irrigate a second rice crop. These outflows comprised the greatest extraction volume each year. Ungauged outflows (type 2) occurred later in the drawdown period, when the reservoir level fell to about +22.8 m and farmers constructed temporary check dams in the stream network to continue extracting reservoir water. The change from Outflow type 1 to type 2 was confirmed when levels at catchment gauge stations exceeded the reservoir level (
Figure 4).
The volume of ungauged Outflow type 2 represented less than 10% of the total inflow in two years but in 2004–05, it rose to 28% of the inflow, and comprised 20% of volume extracted for irrigation. These outflows were generally used to irrigate a third rice crop in the year. These outflows occurred late in the dry season when all other inputs were negligible, so reservoir drawdown was exaggerated by this use. In 2004–5, the largest type 2 Outflow of the three cycles studied coincided with the lowest reservoir level since the weir was raised in 1993.
The smallest loss term during the study was the volume discharged downstream. There were minor discharges over the control structures at maximum reservoir level in 2003–04 and 2004–05. Although a fishway is incorporated in the weir, there were no recorded releases when the reservoir was below Full Supply Level (FSL), so water exchange between Bung Boraphet and the Chao Phraya River system was very limited during the study period.
Reservoir levels above FSL were not recorded in 2003 (
Figure 7), due to operator error. However, the outflow volumes at those times were estimated by substituting levels from the catchment streams, which would slightly over-estimate the volume discharged.
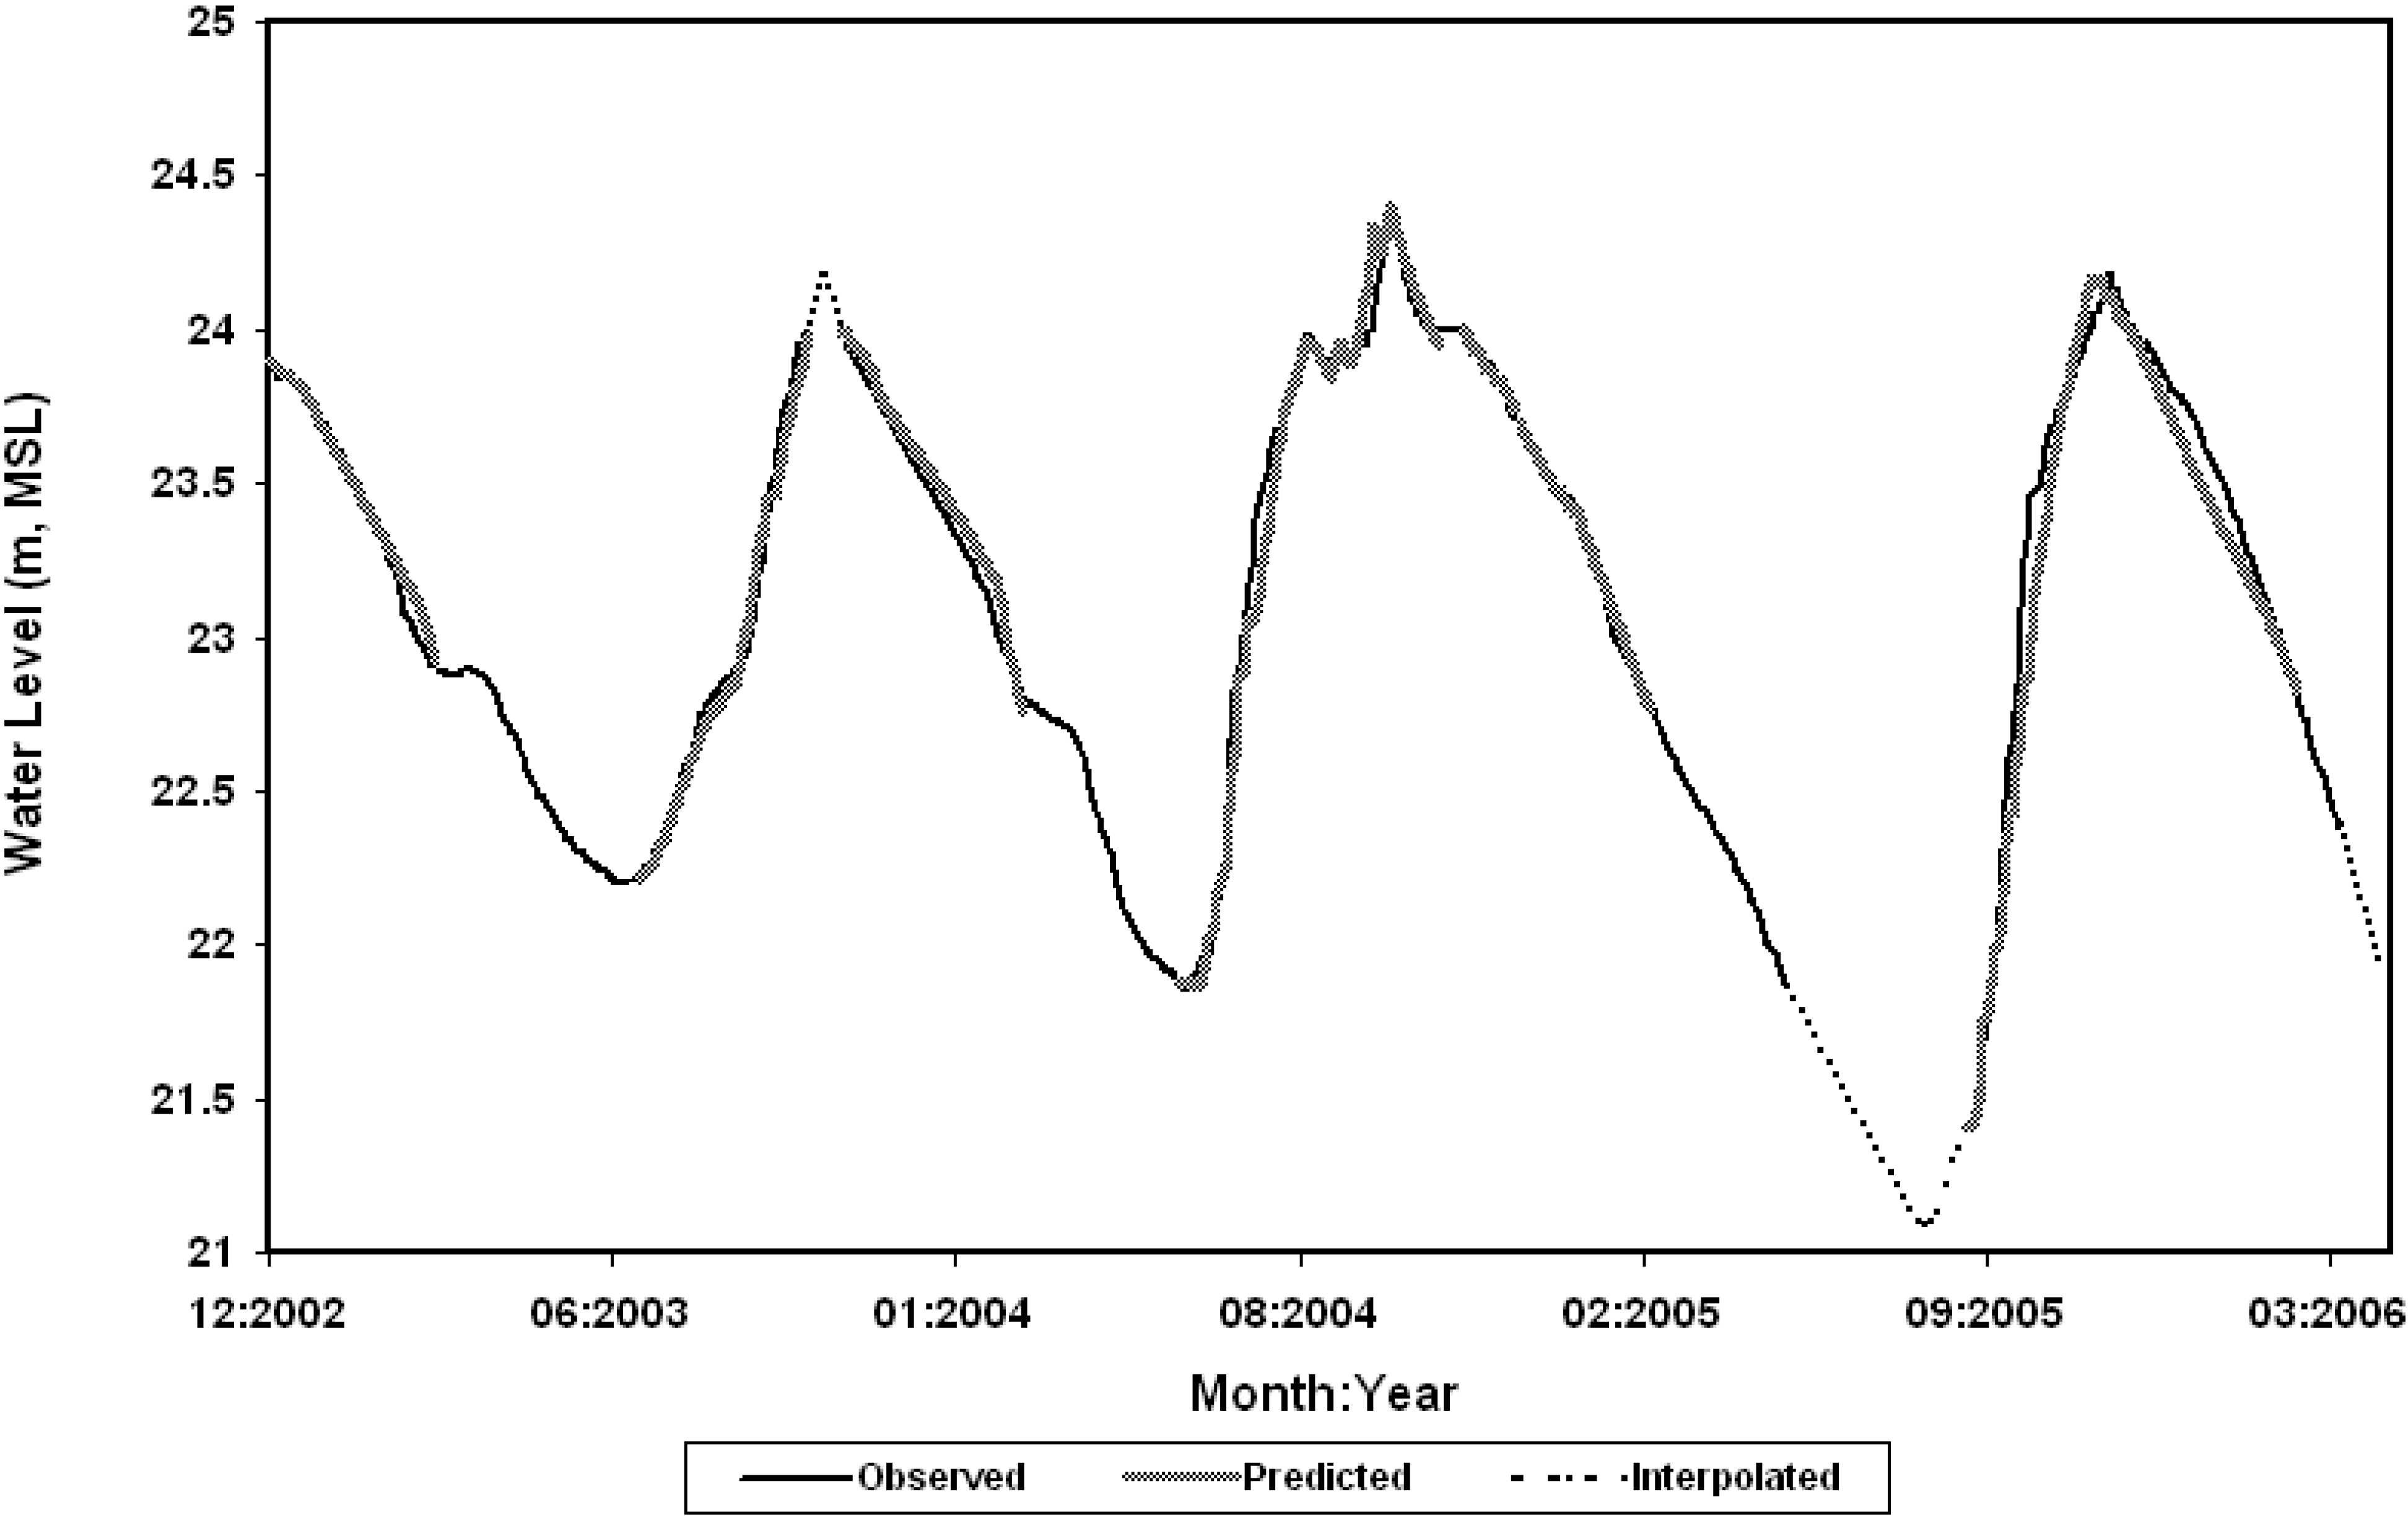
Figure 7.
Observations of the reservoir stage height over the study period vs. predicted values. (Note: observed =observed level; predicted = predicted level for inflow and Outflow 1periods; interpolated data for unrecorded reservoir levels).
Figure 7.
Observations of the reservoir stage height over the study period vs. predicted values. (Note: observed =observed level; predicted = predicted level for inflow and Outflow 1periods; interpolated data for unrecorded reservoir levels).
3.5. Seepage
A major flood in the Chao Phraya system in 2002 peaked at a height of +27.2 m (MSL) in Bung Boraphet and temporarily inundated more than 880 km
2 of the Bung Boraphet catchment (
Table 4). After this inundation event, groundwater seeped into the reservoir from bank storage at a diminishing rate until 2004. Overlaid on this multiyear trend of a diminishing seepage into the reservoir was a seasonal cycle of seepage loss during the inflow season and seepage gains (or lesser loss) during the outflow season.
The mean daily seepage component of the budget for inflow periods varied between a gain of 0.8 mm/d and a loss of 0.3 mm/d. During the outflows the maximum gain was 1.1mm/d in 2003 after the Chao Phraya River flood and the maximum loss was 2.2 mm/d in 2005 (
Table 4).
The gross seepage flux for each annual cycle (
Table 3) was calculated from the sum of the seasonal seepage terms (see
Table 4). Overall, there was a net seepage loss from the reservoir in every hydrological cycle. The magnitude of the loss ranged from 1% of the total losses in 2003–04 (after the 2002 flood), to 15% in 2004–5 when inflows were lowest and drawdown most prolonged. The greater seepage losses in 2004–2006 were presumably because the minor floods in those years did not recharge the bank storage in the same way as in 2002 (
Table 4).
Table 4.
Seasonal seepage co-efficients for each water cycle.
Table 4.
Seasonal seepage co-efficients for each water cycle.
| Period | Start Date | Duration (d) | Reservoir starting level (m, MSL) | max level (m, MSL) | Temporary inundated Area† (km2) | Net Seepage (mm/d) ‡ |
|---|
| Inflow | 1-Jul-02 | 123 | 22.2 | 27.20 | 882 | nd |
| Out type 1 | 11-Dec-02 | 89 | 27.2 | | | -1.23 |
| Inflow | 15-Jul-03 | 99 | 22.3 | 24.00 | 116 | -0.30 |
| Out type 1 | 10-Nov-03 | 105 | 24.0 | | | -0.02 |
| Inflow | 24-May-04 | 122 | 22.0 | 24.50 | 229 | -0.34 |
| Out type 1 | 24-Sep-04 | 151 | 24.5 | | | 2.02 |
| Inflow | 26-Aug-05 | 79 | 21.5 | 24.20 | 123 | 0.80 |
| Out type 1 | 14-Nov-05 | 112 | 24.2 | | | 0.20 |
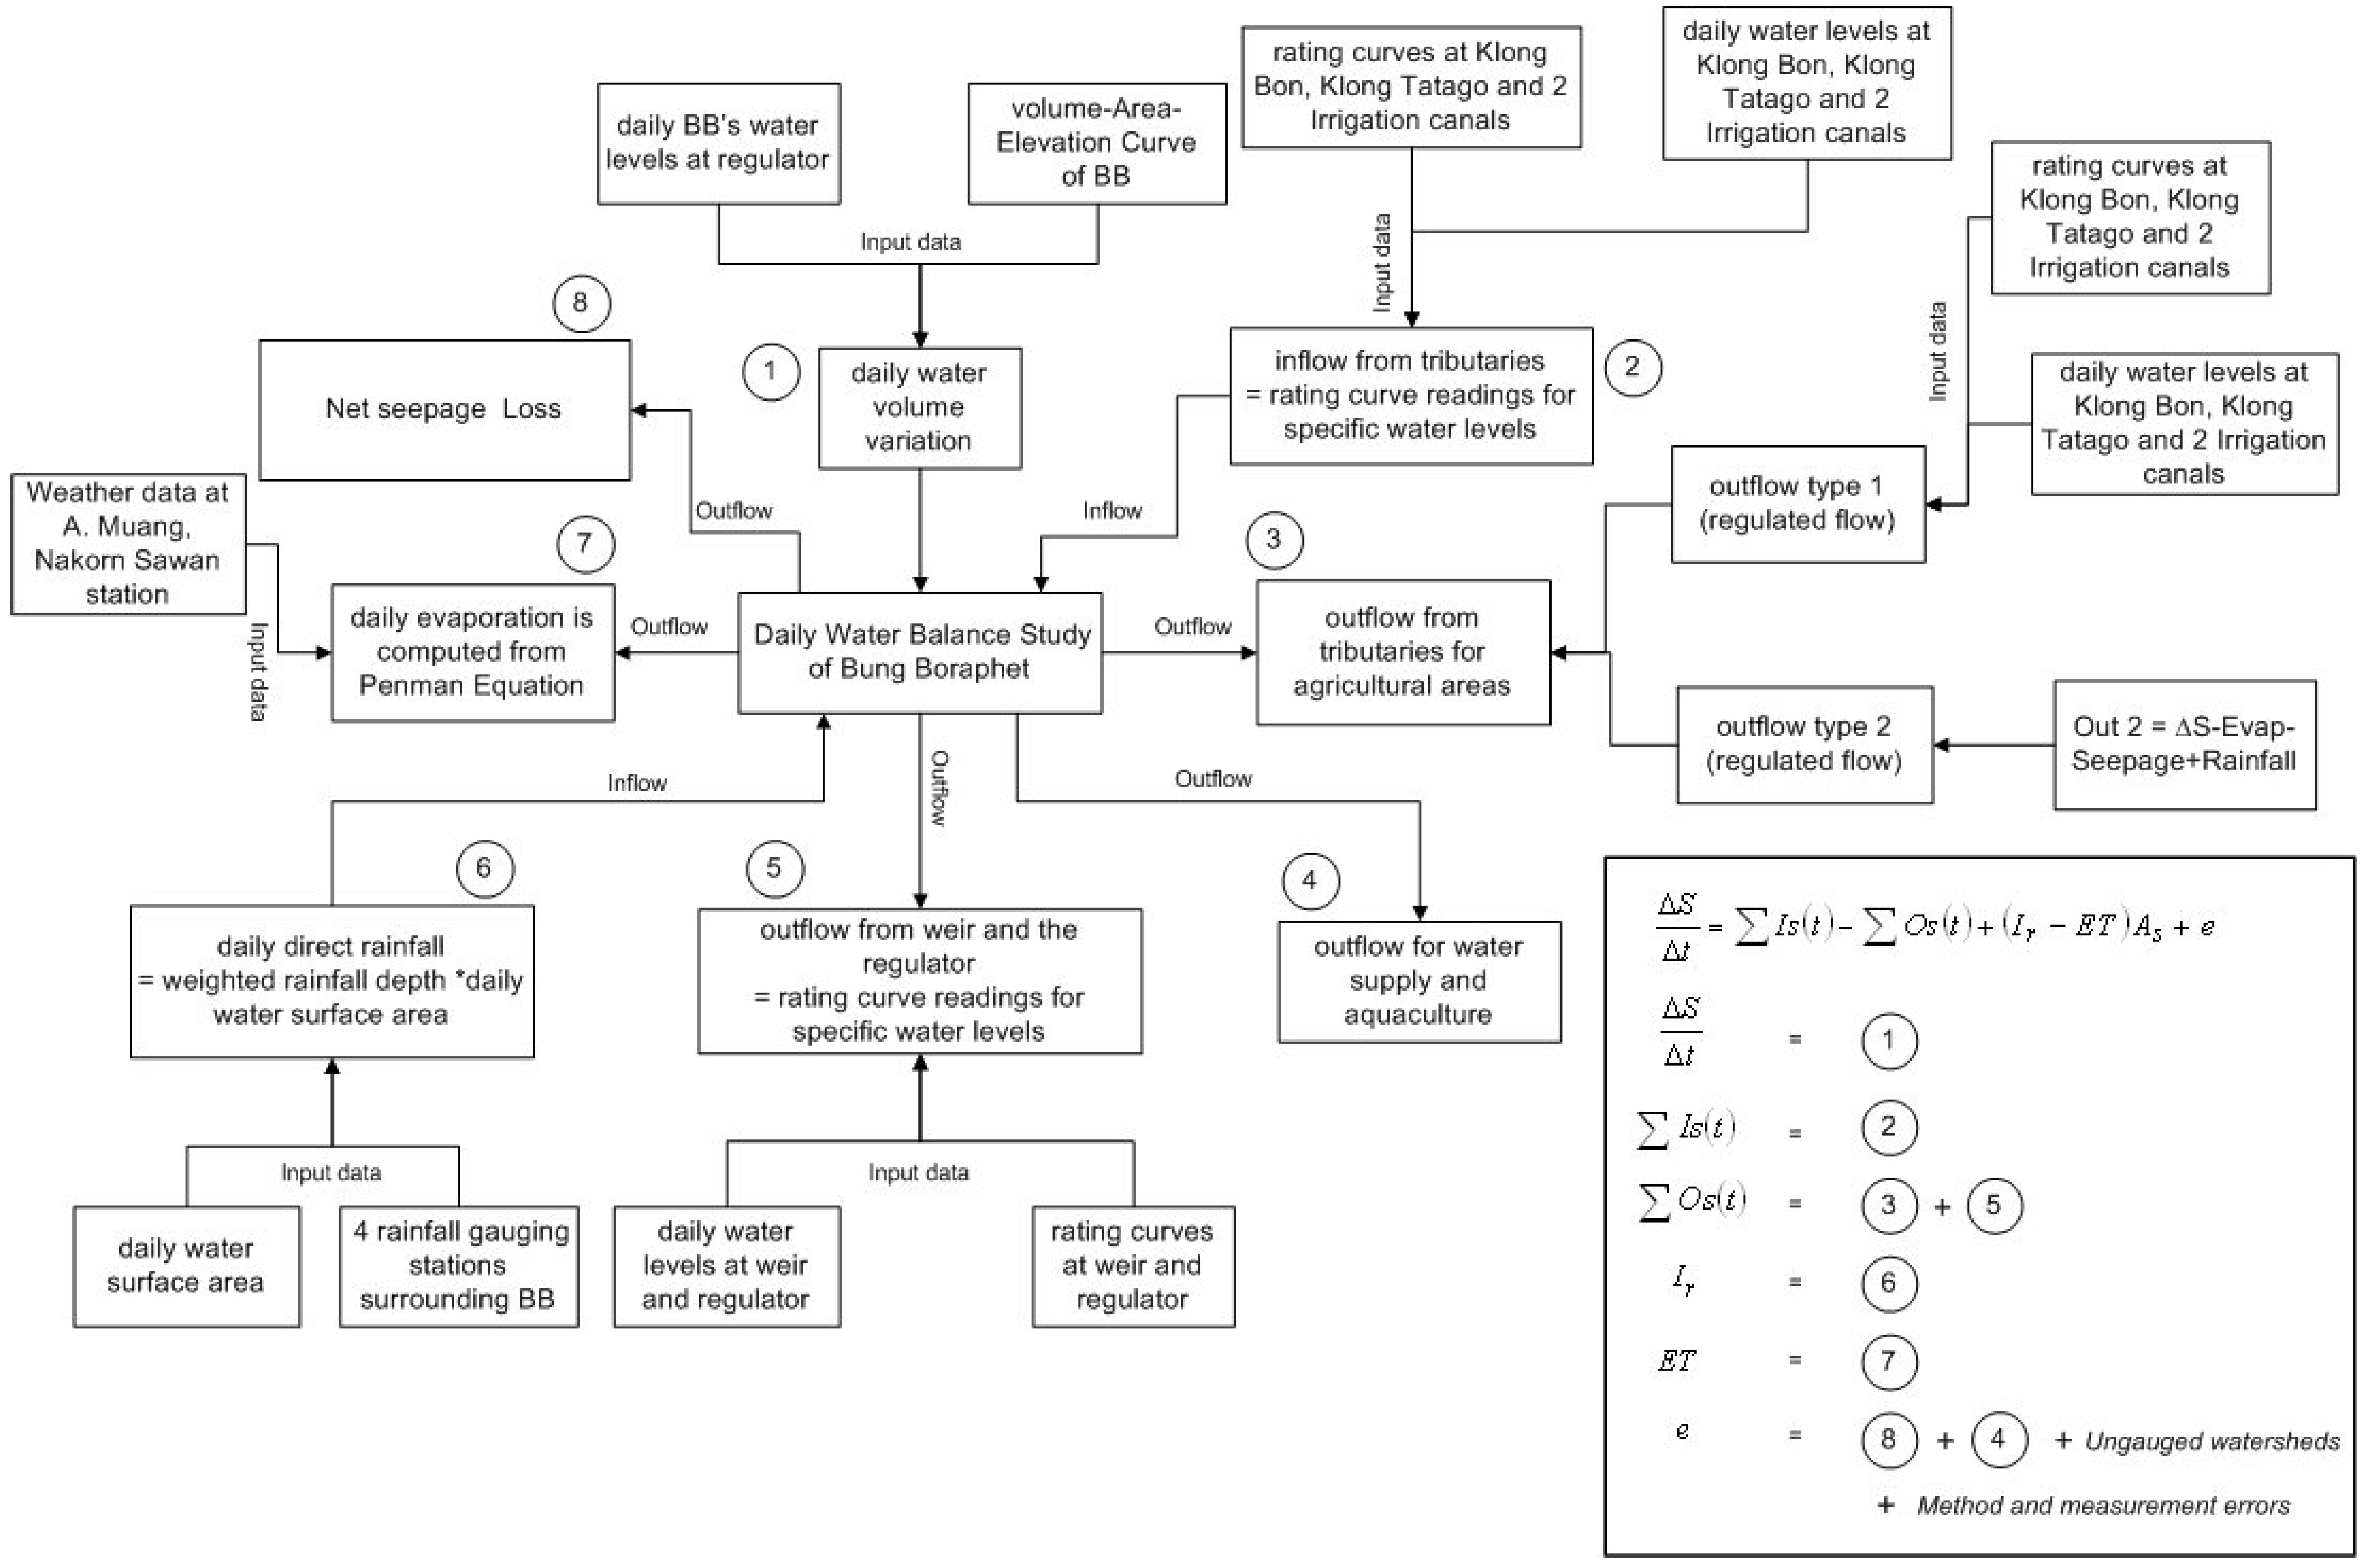
3.6. Water budget model calibration and validation
The water-budget model was developed using Excel software (Microsoft Excel 2003) with daily time steps. The model was validated for all inflow and Outflow type 1 periods, by comparing the predicted daily change in stored volume (ΔS/Δt in eq. 1) to the observed change. There were several short periods when reservoir level was not recorded. The level change during those times was assumed to be linear (
Figure 7).
The accuracy of the reservoir water budget model (eq. 1) was evaluated by comparing the daily reservoir water level observations with model predictions for inflow and Outflow type 1 periods between December 2002 and May 2006 (
Figure 7). The flow characteristics for each flow period were different, so the appropriate co-efficients for flow prediction were set at the start of each flow period.
Statistical assessments of goodness of fit of model prediction of water level to the observations for inflow and Outflow period 1 were all satisfactory (Correlation coefficient [
21] r=0.98 - best fit when r = 1; Root mean square error [
22] = 0.09 with best fit when RMSE = 0; Nash-Sutcliffe criterion [
23] = 96.8% with best fit when EI = 100%).
The results of the statistical analyses gives confidence that the water budget model can accurately estimate the contribution of different components of the water balance during periods in 2003 and 2005, when the reservoir level was not recorded.
3.7. Demand model results
The demand model derived irrigation efficiency (E
i) for Outflow 1 flow in 2003-2004 was 42%. This was very similar to the dry season E
i (averaged over 4 years) of 43.4%, reported by [
24] for irrigated paddy rice areas in the Chao Phraya Basin adjacent to Bung Boraphet. We applied the same E
i and used the irrigation demand model to estimate the optimum area for irrigation in the Outflow 1 and 2 periods of the following dry seasons (2004–2006) (
Table 5).
Table 5.
Mean water losses and estimated irrigated area during Outflows.
Table 5.
Mean water losses and estimated irrigated area during Outflows.
| Period | | Mean rate of Loss 106 m3 d-1 | | | Reservoir Stage ht | | Optimum Irrigated Area* |
|---|
| Type | Start date | Duration(days) | | Net Evapn† | Irrigat. | Seepage | | | to begin period(m, MSL) | | km2 |
|---|
| Y2 Out 1 | 02-Nov-03 | 113 | | -0.21 | -0.69 | -0.04 | | | +24.0 | | 76 |
| Y3 Out 1 | 24-Sep-04 | 151 | | -0.28 | -0.42 | -0.26 | | | +24.5 | | 54 |
| Y4 Out 1 | 14-Nov-05 | 112 | | -0.41 | -0.39 | -0.07 | | | +24.2 | | 40 |
| Y2 Out 2 | 24-Feb-04 | 89 | | -0.25 | -0.15 | -0.02 | | | +22.6 | | 22 |
| Y3 Out 2 | 23-Feb-05 | 158 | | -0.11 | -0.13 | -0.07 | | | +23.2 | | 10 |
| Y4 Out 2 | 07-Mar-06 | 46 | | -0.31 | -0.19 | -0.03 | | | +23.0 | | 9 |
3.8. Errors in measurement
The total error in the measured components of the water balance cannot be calculated directly from the sum of the individual component error volumes, because the sign of the error for each component may be positive or negative with respect to the true value. We used the method of [
18] to determine the standard deviation (SD) in the total error from the sum of the variance of all the measured components (eq. 4):
where S
T2 is variance of the total error in volume of the water budget;
The total error is most sensitive to uncertainty in measurement of the largest terms (
i.e. evaporation, inflow and outflow) and least sensitive to uncertainty in measurement of smaller terms like change in storage volume. The standard deviation (SD) of the total error was close to constant each year with 1 SD ~40 x 10
6 m
3 (
Figure 6). The measurement error for each component converted to volume is reported in the
Appendices. The residual term was <10% of the total water input to Bung Boraphet in the first and last annual cycle. However, in 2004-05 the residual term, which includes seepage and outflow type 2, was 28% of the total outflow. More precise, automated records of reservoir level would improve the reliability of future water balances and the accuracy of the seepage estimate.
4. Discussion
4.1. Surface water inflows
The hydrological characteristics of the Bung Boraphet catchment streams were similar to those of the much larger tributaries of the Chao Phraya River at Nakhon Sawan described by [
15]. However, the specific yield of the Bung Boraphet catchment (38,500 m
3 km
-2 y
-1) was significantly less than for the larger rivers (e.g., 26% and 11% respectively of the Ping and Nan catchment yields). This may be due to the larger proportion of agricultural landuse – especially intensive rice cultivation – in the Bung Boraphet catchment, which would intercept and detain surface water inflows.
All surface flow monitoring sites in the stream network were close to the reservoir. Thus the water budget model only calculated water withdrawals from the reservoir. It did not include the volume extracted from streams during inflow periods.
4.2. Rainfall
Direct rainfall was a significant component of the budget as the reservoir has such a large surface area. The very low volume of direct rainfall in 2003–4 was anomalous, considering the total stream discharge in that cycle was equal highest. The difference in rainfall between cycles was unlikely to be solely due to the increased gauge coverage that occurred in April 2005 and improved the accuracy of rainfall estimates in the final inflow period. It may be another indicator of the contribution of intensive farming to the low specific yield from this catchment.
4.3. Surface water outflows
This assessment of the water budget was based on the rise and fall of the reservoir water level in inflow outflow cycles. The cycles were not uniform in duration, and this variability had greatest effect on the size of the evaporation term. Thus, when reservoir water levels fell to a record low in 2005, it was mainly because the 2004 wet season finished early and the 2005 wet season was late. It was 309 days from the start of outflow in September 2004 until the reservoir level rose again in August 2005. The net evaporation over this extended outflow was 50% more than for the shorter cycles. Seepage was also significantly higher than in other years, whereas extraction for irrigation was relatively constant.
The outflows to irrigate rice in the catchment were the second largest loss term in the water budget. Demand for water for irrigation has increased throughout the Chao Phraya River floodplain over the past two decades, as technological advances permitted cultivation of two or even three rice crops per year [
5]. In the Bung Boraphet catchment, the increase in demand due to multiple crops per year has been further exacerbated by a doubling in the area of rice paddy [
4] and the dry season drawdown observed in each hydrological cycle of this study suggest that the area of dry season irrigation in the catchment is already periodically exceeding the storage capacity of the Bung Boraphet reservoir.
Irrigation demand
A survey of Bung Boraphet farmers in 2002 reported that farmers would plant a second (dry season) rice crop on all irrigated paddy in the Bung Boraphet catchment, if the reservoir was full at the beginning of the dry season.
The farmers also reported that dry season rice yield varied from year to year depending on water availability. But since a new weir was constructed in 1993, the reservoir has always been full (≥24 m) at the beginning of the dry season (
Figure 5). Therefore reservoir level at the start of drawdown seemed to be a poor indicator of water availability.
Our study seemed to confirm this, because although the reservoir was ≥24 m at the beginning of drawdown in each year of this study, the volume extracted for irrigation progressively declined from 91 x 10
6 m
3 (2003–04) to 53 x 10
6 m
3 (2005–06) (
Table 3 and
Figure 6).
If we assume the entire irrigable area was planted to rice each dry season, the diminished irrigation supply after 2003 was either supplemented from other sources, or the crops received inadequate water and the yield suffered.
To answer this question, we compared the irrigation consumption with the net evaporation (evaporation less direct rainfall) and seepage terms during each Outflow season. The seasonal volumes were converted to daily rates to normalise for different seasonal durations to aid the comparison (
Table 5).
The extraction rate in Outflow 1 periods was negatively correlated with the net evaporation rate. This is a clear indicator that the stored supply was insufficient because if the stored supply was in excess we would expect irrigation consumption to rise in drier years to match the loss from higher net evaporation. Conversely if the irrigated area is in excessive of the supply capacity of the storage, an increase in the seasonal net evaporation would further reduce the water available for irrigation use.
In summary, the evidence from water balance and the demand modeling indicated that if farmers cultivated 76 km2 of irrigated land for a second rice crop every dry season (as reported by survey), then the yields from the second (and third) crops in 2004–5 and 2005–6 would have been reduced by water resource limitation, despite full reservoir storage at the beginning of the dry season.
In the lower Chao Phraya basin, the anticipated price at harvest is the most important driver for dry season rice planting, even where the availability of irrigation water is controlled by a government agency [
5]. In the Bung Boraphet catchment, where extraction is uncontrolled, crop price is also likely to be the dominant influence on farmer’s planting decisions, perhaps aided by the farmer misconception that a full reservoir at the end of the wet season will provide sufficient water for the dry season crop.
4.4. Evaporation
Evaporation is a very important feature of the Bung Boraphet water balance as it was the largest loss term in 2 of the 3 years. The Bowen-ratio energy-budget (BREB) method is generally considered as a benchmark standard for measurement of evaporation and it is assumed to be within 10% of true values when averaged over a season and within 15% when averaged over a month [
25]. The Penman method used in this study has also been widely applied in hydrological studies of reservoir water balance. The average annual evaporation rate of Bung Boraphet of 1,700 mm/y was comparable to Penman evaporation estimates from other large shallow tropical lakes with a monsoonal climate (e.g. Lake Manton, Northern Territory Australia 1,971 mm/y [
26] and Lake Ziway, Ethiopia 1,870 mm/y [
27].
We estimated the uncertainty in the Penman evaporation estimate used here was 20%, based on the findings of [
28] that 85% of the Penman estimates were within 20% of the BREB measure. The uncertainty in the evaporation estimate could be reduced by installing measurement instrumentation closer to the reservoir than in this study.
4.5. Groundwater
The residual term of reservoir water budgets includes all ungauged inputs and outputs. Although the net ungauged contribution to the Bung Boraphet water budget in this study were generally small (<10% of the total inflow in 2 of 3 hydrological cycles), evidence from other floodplain lakes has shown seepage into and out of the reservoir during the course of the annual inundation and drawdown cycle, can be significant [
14,
29].
The seepage behaviour of the Bung Boraphet reservoir was relatively complex. A regional flood event in 2002 provided bank storage sufficient to provide unidirectional seepage into the reservoir throughout the following muted hydrological cycle. The annual floods during this study period were much smaller than 2002 and by the 2004–5 cycle the seepage flux had reversed to become a net loss. Towards the end of the study, seasonal reversals in the direction of seepage which are typically associated with flood plain lakes became evident.
These results indicate that the magnitude and the duration of the annual flood have a dominant effect on the direction of subsequent seepage flows. Although seepage was the least significant net loss term in the budget, long term average seasonal seepage terms should only be applied with caution and a consideration of the magnitude of the annual flood in modeling different management options.
4.6. Eco-hydrological implications of the changes in water balance
The original Bung Boraphet weir was constructed to create a permanent reservoir fishery and this use is still an important use today. However, some of the hydrological management strategies advocated by Thailand’s Department of Fisheries for the Bung Boraphet reservoir fishery conflict with the eco-hydrological principles for sustaining other wetland uses.
For example, floodplain wetland ecosystems are very sensitive to variability in the hydrological cycle, so that wide annual or interannual fluctuations in water level are normal and indeed beneficial to wetland productivity and functionality. A survey of the birdlife of Australian lakes and reservoirs showed water bird diversity was correlated with hydrological variability; natural wetlands had greatest diversity and reservoirs with tightly regulated levels had least [
30].
The inundation ratio (seasonal: permanent flooded area) is an eco-hydrological indicator of potential wetland productivity. A local example of its use is as a predictor of the annual productivity of the Tonle Sap fishery (on the Mekong River flood plain) [
31].
The inundation ratio of the Bung Boraphet reservoir- wetland during this study ranged from 3:1 to 12:1, which is comparable to the mean inundation ratio of 6:1 reported for wetlands on the Niger and the Senegal Rivers in Africa [
32]. This suggests the recent trend towards an increasing inundation ratio in the Bung Boraphet wetland (as observed in this study) may be more beneficial to wetland health (diversity) and function (productivity), than maintenance of a regulated storage with minimum drawdown of +23 m (MSL). It is noteworthy that fish diversity in Bung Boraphet is reported to have diminished significantly since it has been managed as a regulated reservoir.
There are benefits in maintaining the reservoir fishery as a closed system in the dry season. Flood plain lakes are recognized as the nurseries and recruitment areas for highly productive tropical river fisheries. Nutrients and silt that are transported on the floodplain by floodwaters are trapped and become available for use in subsequent aquatic and terrestrial phases of the inundations cycle. This process makes wetlands highly productive ecosystems. The wetland productivity is usually exported to the river system during the flood recession phase, but the discharge to the Chao Phraya River system was only 4.5% of the total input during this study. Thus wetland production is retained in the reservoir and the local fishery benefits at the expense of fish production throughout the Chao Phraya system.
However, this local benefit may be compromised if the minimum storage volume is not maintained (as occurred in each year of this study). During the prolonged dry season of 2005 the volume fell to 9% of the storage (+21.4 m (MSL)). If fish cannot escape downstream from such extreme drawdown events, they will be concentrated in a diminishing area of open water, where growth is reduced by increased competition for food and predation is increased by water birds and illegal fishermen. The Bung Boraphet region recorded the highest level of convictions for illegal fishing in the 23 Thai fishing regions in 2004–5 represent 14% of the national total [
33].
Other fisheries management practices in Bung Boraphet seem to contradict best management practices used elsewhere. For example the Fishery Department has an operational target to dredge one million cubic metres of silt from Bung Boraphet reservoir every year, to maintain the reservoir volume and keep deeper water channels available for boat access and fish refuge [
34]. This is a planned response to an estimated average annual deposition of 2.2 million cubic metres of sediment from the Chao Phraya system.
One could question whether ongoing dredging is an appropriate response to address a silt loading delivered by floods with a recurrence interval of 3–5 years. More important is the practical impact of the dredging activity in raising turbidity levels and reducing the submerged aquatic plant cover in the lower half of the reservoir [
4].
Aquatic macrophyte beds provide nursery habitats for many fish species. Activities that increase the turbidity of macrophyte dominated shallow lakes risk switching the main primary production of these systems from macrophytes to phytoplankton with blooms of toxic cyanobacteria (blue green algae).
4.7. Management
Balancing consumptive water use with the eco-hydrological requirements of environmental resources is an important element of integrated water basin management for sustainable development [
35]. The demand for water from the Bung Boraphet reservoir for dry season irrigation is now in excess of the storage volume and management of the irrigation demand will be imperative in the future. Understanding and careful accounting of the components of the reservoir water budget will be important in achieving a balance between the competing uses. Areas of uncertainty in components of the water budget identified in this study could be reduced by simple improvements in instrumentation (e.g., automated recording of reservoir level and measuring climatic factors at sites closer to the reservoir).
The current proposal for dry season diversions from the Nan River into the Bung Boraphet reservoir [
10] to maintain the reservoir volume at +23 m (MSL), seems ill conceived for several reasons. Firstly, dry season diversions from the Nan River would decrease the water flowing to the Chao Phraya delta, where farmers are also requesting a bigger dry season allocation [
24]. Therefore, rice production would really be re-allocated not increased. Secondly, even temporary storage in the Bung Boraphet reservoir would result in a significant volume of diverted water being lost by evaporation. Thirdly, natural resource managers, farmers and even the public are likely to question the allocation of valuable dry season water for cultivation of rice in a designated conservation zone. Finally, the maintenance of a minimum reservoir level at 40% of the stored volume may be beneficial for the reservoir fishery, but detrimental to other properties of the system such as wetland bio-diversity and the productivity of the greater Chao Phraya river system.
5. Conclusions
A water balance model for the Bung Boraphet reservoir was developed from daily measurements over three annual inflow outflow cycles and used to prepare a reservoir water budget. There were no system wide floods during this study and monsoon derived surface water inflow from the local catchment was the dominant inflow term. A basin wide flood inundated the floodplain in the wet season of 2002, immediately before this study commenced, and that flood contributed to groundwater flows into the reservoir in 2003.
Evaporation was the biggest overall loss term. In two of the flow cycles evaporative loss was ~86 x 106 m3. The outflow period of the 2004–2005 cycle was very long and evaporation reached 137 x 106 m3, which contributed to the extreme drawdown of the reservoir. Most of the irrigation extraction was gauged in each drawdown cycle (Outflow type 1) but in late drawdown the extraction had to be estimated by statistical analysis of the daily residual (Outflow type 2). The outflow for irrigation was the second largest loss term in the budget and averaged 76 x 106 m3/cycle. Seepage was the smallest loss term. The direction and the magnitude of seepage flow were influenced by the extent and duration of the flood and there were net gains from seepage into the reservoir in some flow periods.
The uncertainty in total volume due to measurement was ±40 x 106 m3 (1 standard deviation). This uncertainty would be reduced by improving the precision of the water level measurement and by establishing a new evaporation measurement station to closer to the reservoir.
Demand modeling showed that irrigation demand in the Bung Boraphet catchment exceeded the reservoir storage capacity and the catchment water yield in the dry season. Future management plans should focus on balancing the consumptive water needs with the hydrological requirements of the reservoir fishery and the requirement to sustain a diverse and productive wetland. The differing eco-hydrological requirements of the fishery and the wetland need to be better understood to reconcile existing management practices with sustainable use in future.
Water balance models are a scientific way of identifying the relative contribution of different components of the water budget. Water budgets are an important step in matching the available resource with the hydrological requirements of different uses. This study has highlighted evaporation as the biggest contributor to water loss from the Bung Boraphet reservoir. The significance of evaporative loss should not be overlooked, when allocating Nan River water for dry season irrigation use within the Chao Phraya basin.


