Estimation of Non-Revenue Water Ratio Using MRA and ANN in Water Distribution Networks


Department of Civil & Environmental Engineering, Incheon National University, Incheon 22012, Korea
*
Author to whom correspondence should be addressed.
Water 2018, 10(1), 2; https://doi.org/10.3390/w10010002
Submission received: 19 November 2017
/
Revised: 16 December 2017
/
Accepted: 18 December 2017
/
Published: 21 December 2017
(This article belongs to the Special Issue Advances in Water Distribution Networks)
Abstract
:The non-revenue water (NRW) ratio in water distribution networks is the ratio of losses from unbilled authorized consumption and apparent and real losses to the total water supply. NRW is an important parameter for prioritizing the improvement of a water distribution system and identifying the influencing parameters. Though the method using multiple regression analysis (MRA) is a statistical analysis method for estimating the NRW ratio using the main parameters of a water distribution system, it has disadvantages in that the accuracy is low compared to the measured NRW ratio. In this study, an artificial neural network (ANN) was applied to estimate the NRW ratio to improve assessment accuracy and suggest an efficient methodology to identify related parameters of the NRW ratio. When using an ANN with the optimal number of neurons, the accuracy of estimation was higher than that of conventional statistical methods, as with MRA.
1. Introduction
Civil infrastructure such as bridges, buildings, and pipelines ensure economic and industrial prosperity in a society. Specifically, water distribution systems assure the delivery of the primary commodity of water [1]. They are, however, subject to deterioration over time that usually leads to problems such as the reduced utility of hydraulic facilities, water loss, service disruption, and lower water quality. Additionally, the gradual rise in consumer demand for water creates new problems such as low pressure at demand junctions. This usually raises the entrance water pressure of the water distribution system, which in turn increases the frequency of leakage [2].
To overcome problems in pressure management and ensure continuous, efficient, and economic operation of a water distribution system, an effective rehabilitation strategy is required. The latter should consider criteria on hydraulics, economics, reliability, and water quality performance, and [3] since the economic resources available for the rehabilitation of a water distribution system are scarce, it should also help prioritize investment [4].
In the early 1990s, no standard term existed to express and assess water losses in a water distribution system. The International Water Association (IWA) has acknowledged this problem and established a water loss task force (WLTF). The WLTF examined international best practices and developed a standardized terminology for non-revenue water (NRW) [5].
The IWA has recently proposed new performance indicators and their successful applications are being reported regularly [6,7]. A percentage indicator was also suggested not to be used for performance comparison, especially where target areas see large differences in consumption per service connection [8,9].
Analysis of the effects of pipe damage in water distribution networks determines the improvement priorities for each district water supply system; a systematic plan for replacement and remediation is required to maintain a city waterworks [10,11]. The waterworks improvement projects of old distribution networks are being implemented, but what is difficult is making management more economical and upgrading the operating system through the evaluation of aged pipes and the prevention of accidents based on empirical decisions [12].
Therefore, decision-making on the priority of maintenance of a water distribution network requires the study and analysis of the factors affecting leaks, as well as identifying the physical and operational parameters affecting leaks with parameters such as water pressure, and quality and demand quantity. To decrease the NRW ratio, studies on water distribution analysis, reliability enhancement, diagnosis of pipe network technology and pipe deterioration evaluation for optimal water distribution were conducted.
It is important to determine the level of contribution of leaks and bursts to the overall NRW volume [13] to evaluate the influence of water tariffs on NRW under a water supply plan [14]. Winarni (2009) found a performance indicator for facility management in water supply systems by comparing the infrastructure leakage index (ILI) [15]. Efforts to reduce leaks and commercial losses cost money, especially if large sections of piping need replacement. Nevertheless, studies have shown that efforts toward conservation and NRW reduction can provide water at about half to a third of the cost of water production [16]. A variety of studies have been carried out on the effective parameters of a water distribution network [6,17,18,19].
The index of the NRW ratio of a water distribution system needs to be proven by correlation with the region’s characteristics and quantifying the influence of related parameters. For example, in areas with severe deterioration, the NRW ratio could be considered high because of many leaks, and it is difficult to find the factor of leakage parameters. In addition, unless the relationship between the regional characteristics and the NRW ratio is properly identified, the estimation of the ratio could prove unrealistic and uneconomic, even if the ratio is high due to local specificity.
In this study, a NRW ratio estimation model was suggested by using an artificial neural network (ANN) and multiple regression analysis (MRA). The statistical method was used to compare the results of ANN and MRA with the real measured values of the NRW ratio. This study also proposed a methodology for estimating the NRW ratio using ANN, which has the main parameters of water distribution system as independent variables and the NRW ratio as the dependent variable. To verify the suggested ANN and MRA, a target area was selected and applied.
2. General Research on the NRW Ratio and Theoretical Background
2.1. Non-Revenue Water of a Water Distribution Network
NRW corresponds to the percentage of water lost due to leaks and commercial problems, such as the lack of precision or mistakes in client databases. In Equation (1), is the volume of water produced per time unit and Ab is the volume of billed water per time unit [2].
The definition of NRW could be described as follows. NRW is the difference between the volume of water put into a water distribution system and that billed to customers. The NRW ratio comprises three components [2].
- (a)
- Physical losses comprise leaks from all parts of a water distribution system and overflow at water storage tanks. They can be caused by poor operations and maintenance, lack of active leakage control, and poor quality of underground assets.
- (b)
- Commercial losses are caused by under-registration of customer meters, data handling errors, and theft of water in various forms.
- (c)
- Unbilled authorized consumption includes water used by a utility for operational purposes, that used in firefighting, and that provided free to certain consumer groups.
Components of water balance in a water distribution system are shown in Table 1. One of the main elements of NRW is leakage, and finding and improving related factors in a district metered area (DMA) can lower the NRW ratio. In addition, it is important to identify the major factors influencing a water distribution network for NRW estimation.
2.2. Multiple Regression Analysis
Regression analysis is used to identify specific relationships between variables with high correlations or predict the value of variables. In the regression model, one independent variable is called simple regression analysis, and one independent variable does not sufficiently explain the dependent variable. When introducing multiple independent variables to the regression model, MRA is used with a linear function.
The multiple linear regression model with independent variables is expressed as Equation (2) [20].
where is the independent variable, is the dependent variable, is the regression coefficients, is the intercept of , and is the slope of the independent variables.
2.3. Artificial Neural Network
The ANN procedure used is a feed-forward network type with input, hidden and output layers, as shown in Figure 1. Neurons in the input layer simply act as a buffer for distributing the input signals to neurons in the hidden layer. The neurons in different layers are interconnected via weights. The neurons in the hidden and output layers are called the activation function.
The activation function used here is a sigmoidal activation function. The input for each neuron in the hidden layer is the sum of the weighted input signal (, in which is the interconnecting weight between neuron in the hidden layer and neuron in the input layer). The output from the neuron is given by Equation (3).
The output of neurons in the output layer is computed in a similar fashion. Schematic diagram of a multilayer feed-forward neural network is shown in Figure 1.
3. Methodology for Estimating the NRW Ratio Using MRA and ANN
The main parameters of the NRW ratio were analyzed and a classification system based on physical and operational parameters in water distribution systems was designated. Parameters that directly affect estimation of the NRW ratio are selected and the equation for estimating the ratio is introduced through MRA.
A parameter selection system was suggested through MRA, which is most widely used for predicting the NRW ratio [22,23]. Methods for evaluating accuracy are also described in detail per the entire process of estimating the NRW ratio, as shown in Figure 2.
When setting up the ANN model, effective parameters in water distribution networks are required. For the analysis using accuracy assessment of the ANN simulation results with the measured values, MRA is used to select statistically significant parameters and the NRW ratio was estimated by applying selected parameters to ANN. For this purpose, the selection of the target area and collection of data on the water distribution system are required. The influential factors selected are among the physical and operational parameters of the water distribution system; the water pressure in the pipe network can be considered through the demand energy ratio given by Jo [24].
The statistical procedure performs MRA with various physical and operational parameters as independent variables and the NRW ratio as a dependent variable. MRA is needed to select the most influential parameters of the ratio, and can also be used for estimating the ratio [25].
The procedure for NRW ratio estimation utilizes MRA and ANN. The ratio results calculated from the selected parameters and measured value must be compared for analysis of the relations between used parameters and NRW. For this, an accuracy assessment method can be used. The mean absolute error (MAE), mean squared error (MSE), percent of bias (PBIAS), goodness of fit (G) value, and determination coefficient (R2) can be commonly used to compare measured and simulated values. Finally, the parameters that represent the simulated value most similar to the measured value is selected for application of ANN.
Figure 1 shows the ANN structure for estimating the NRW ratio in a water distribution system. The input layer consists of physical and operational parameters and a bias layer. The bias layer can be considered a parameter that corrects the calculation results of the NRW ratio by ANN so that the measurement results and deviation will be reduced. The number of hidden layers is determined through trial and error, and the optimal number of neurons gives a highly accurate result. The optimal number of neurons as being composed of within 2n which was suggested by Heaton, J., where n is the number of independent variables [26].
4. Application to Study Area
4.1. Description of Data Collection and Parameters
The target area for this study was Incheon, Korea’s third-biggest city. The data covered the status of the area, waterworks facilities and operational status, as well as water supply indicators of the Incheon Waterworks Basic Plan [27]. In addition, data on analysis of water pipe networks and simulation data of water distribution systems were collected [28].
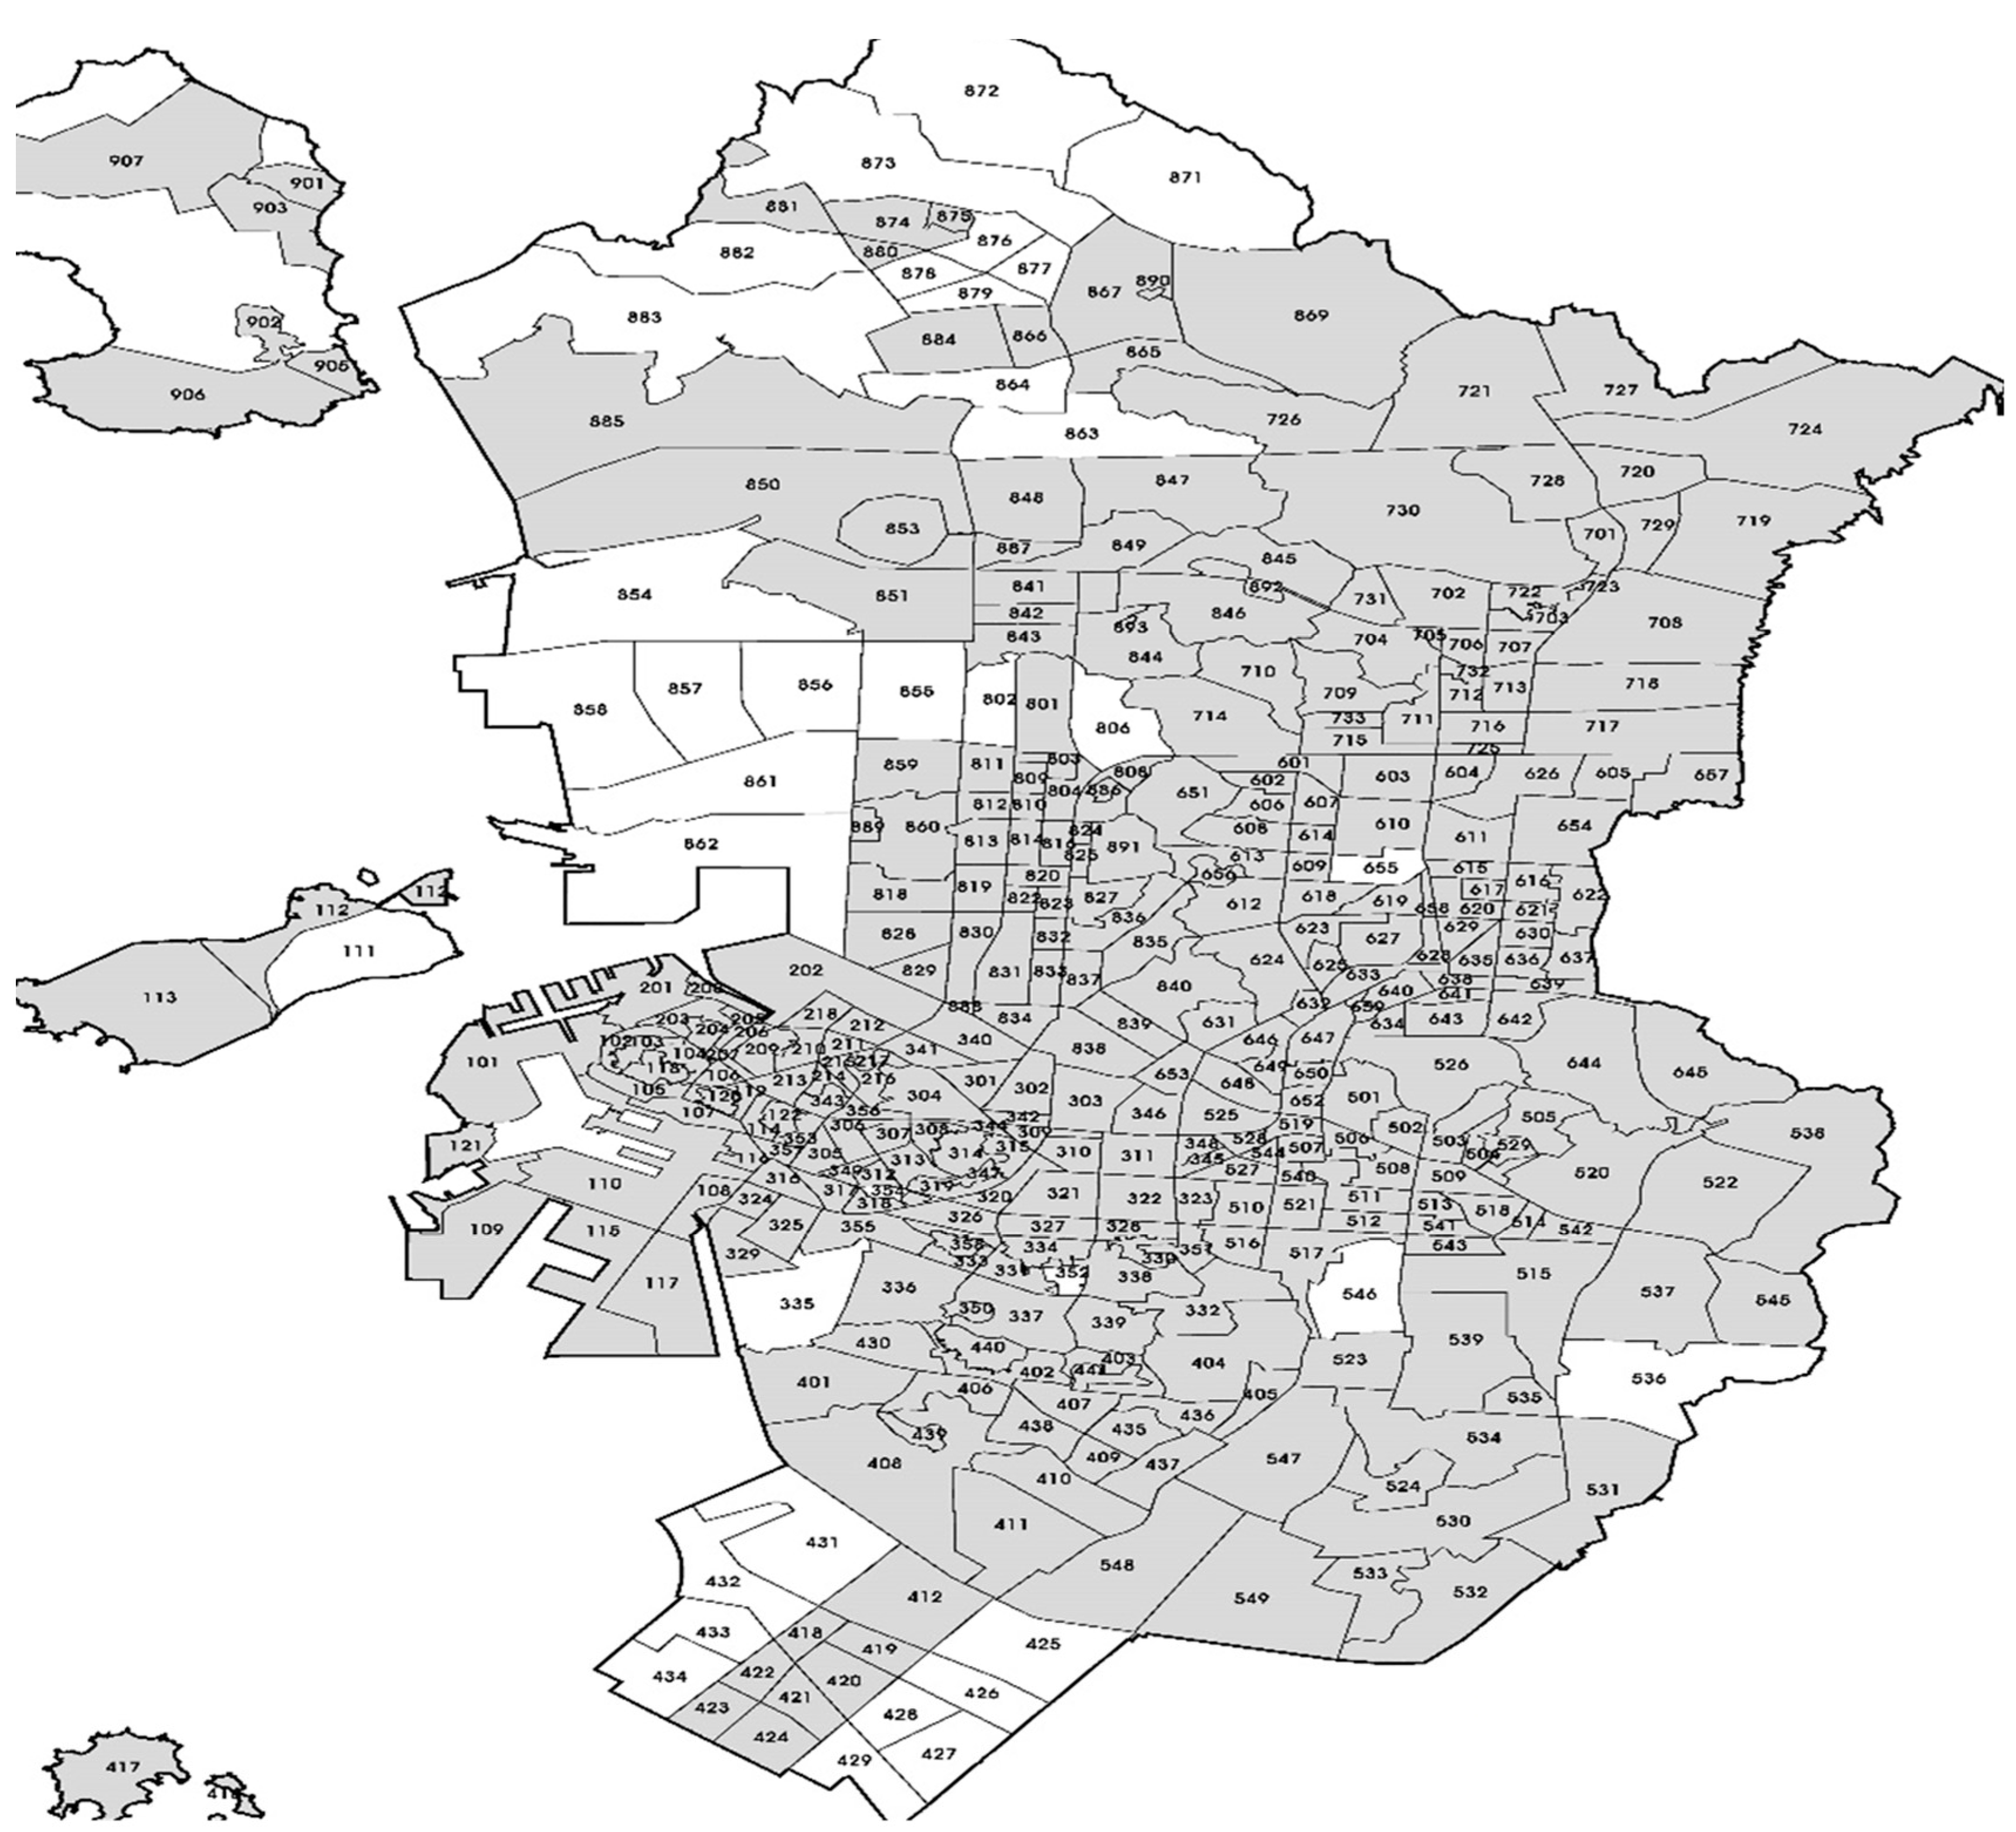
The city’s 367 district metered areas (DMAs) were selected for technical diagnosis analysis and a general technical diagnosis was conducted on 330 completed DMAs, as shown in Table 2 and Figure 3. In Figure 3, DMAs are colored gray and unblocked DMAs are colored white.
In order to apply the methodology to study area for estimating the NRW ratio, 173 DMAs were selected for estimation analysis and 194 DMAs excluded from the data for being unfinished, non-operational or running abnormally among the 367 DMAs.
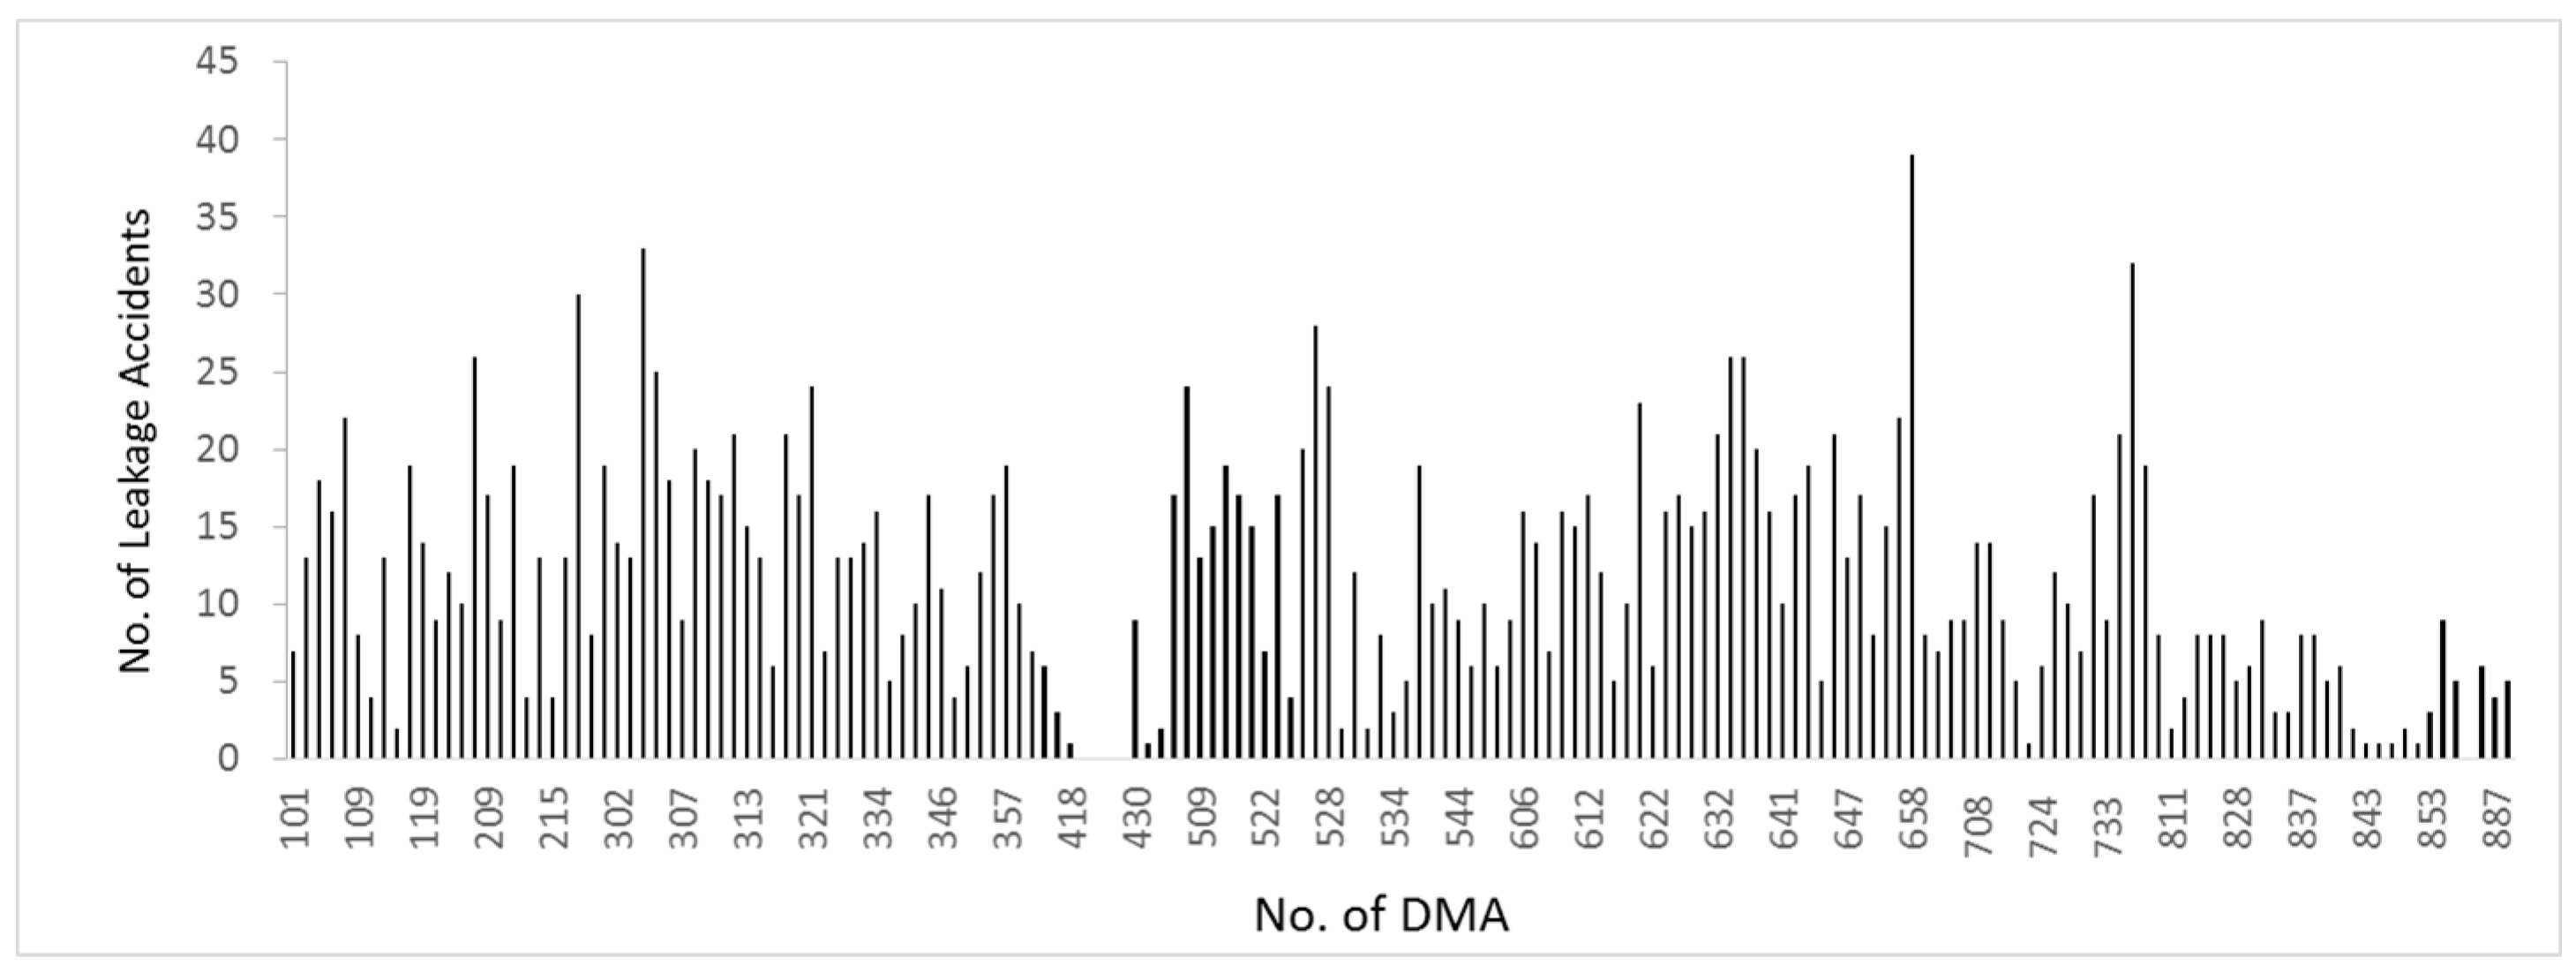
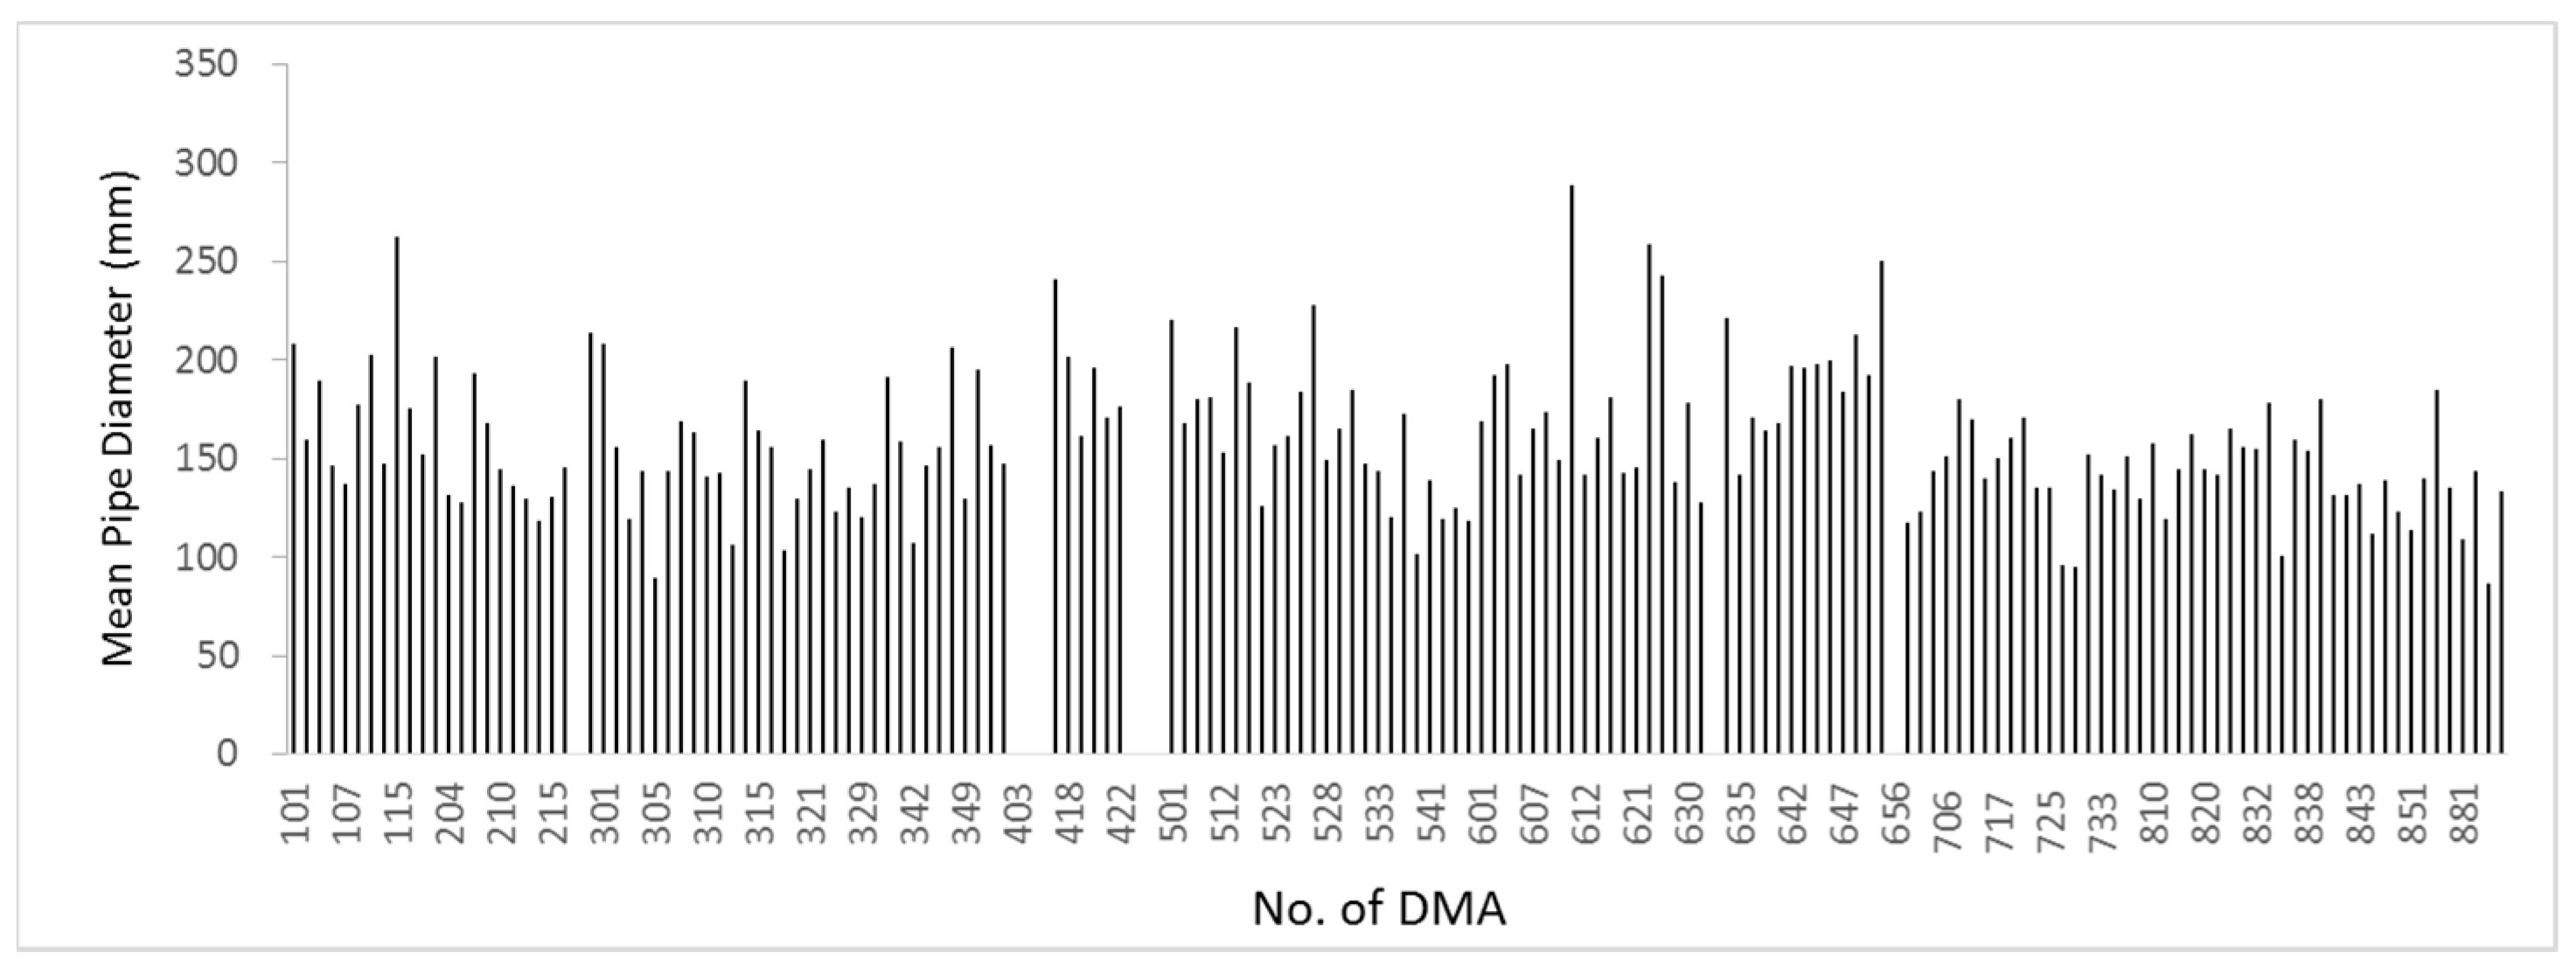
Six selected parameters were used as independent variables for estimating the NRW ratio. Among the parameters reflecting physical characteristics selected were mean pipe diameter, pipe length per demand junction, amount of water supply per demand junction and deteriorated pipe ratio; the demand energy ratio and the number of leaks were selected as operational parameters.
The demand energy ratio is calculated by hydraulic pressure and demand in water distribution systems from the research of Jo (2017) [24]. The data used for estimating the NRW ratio are shown in Table 3.
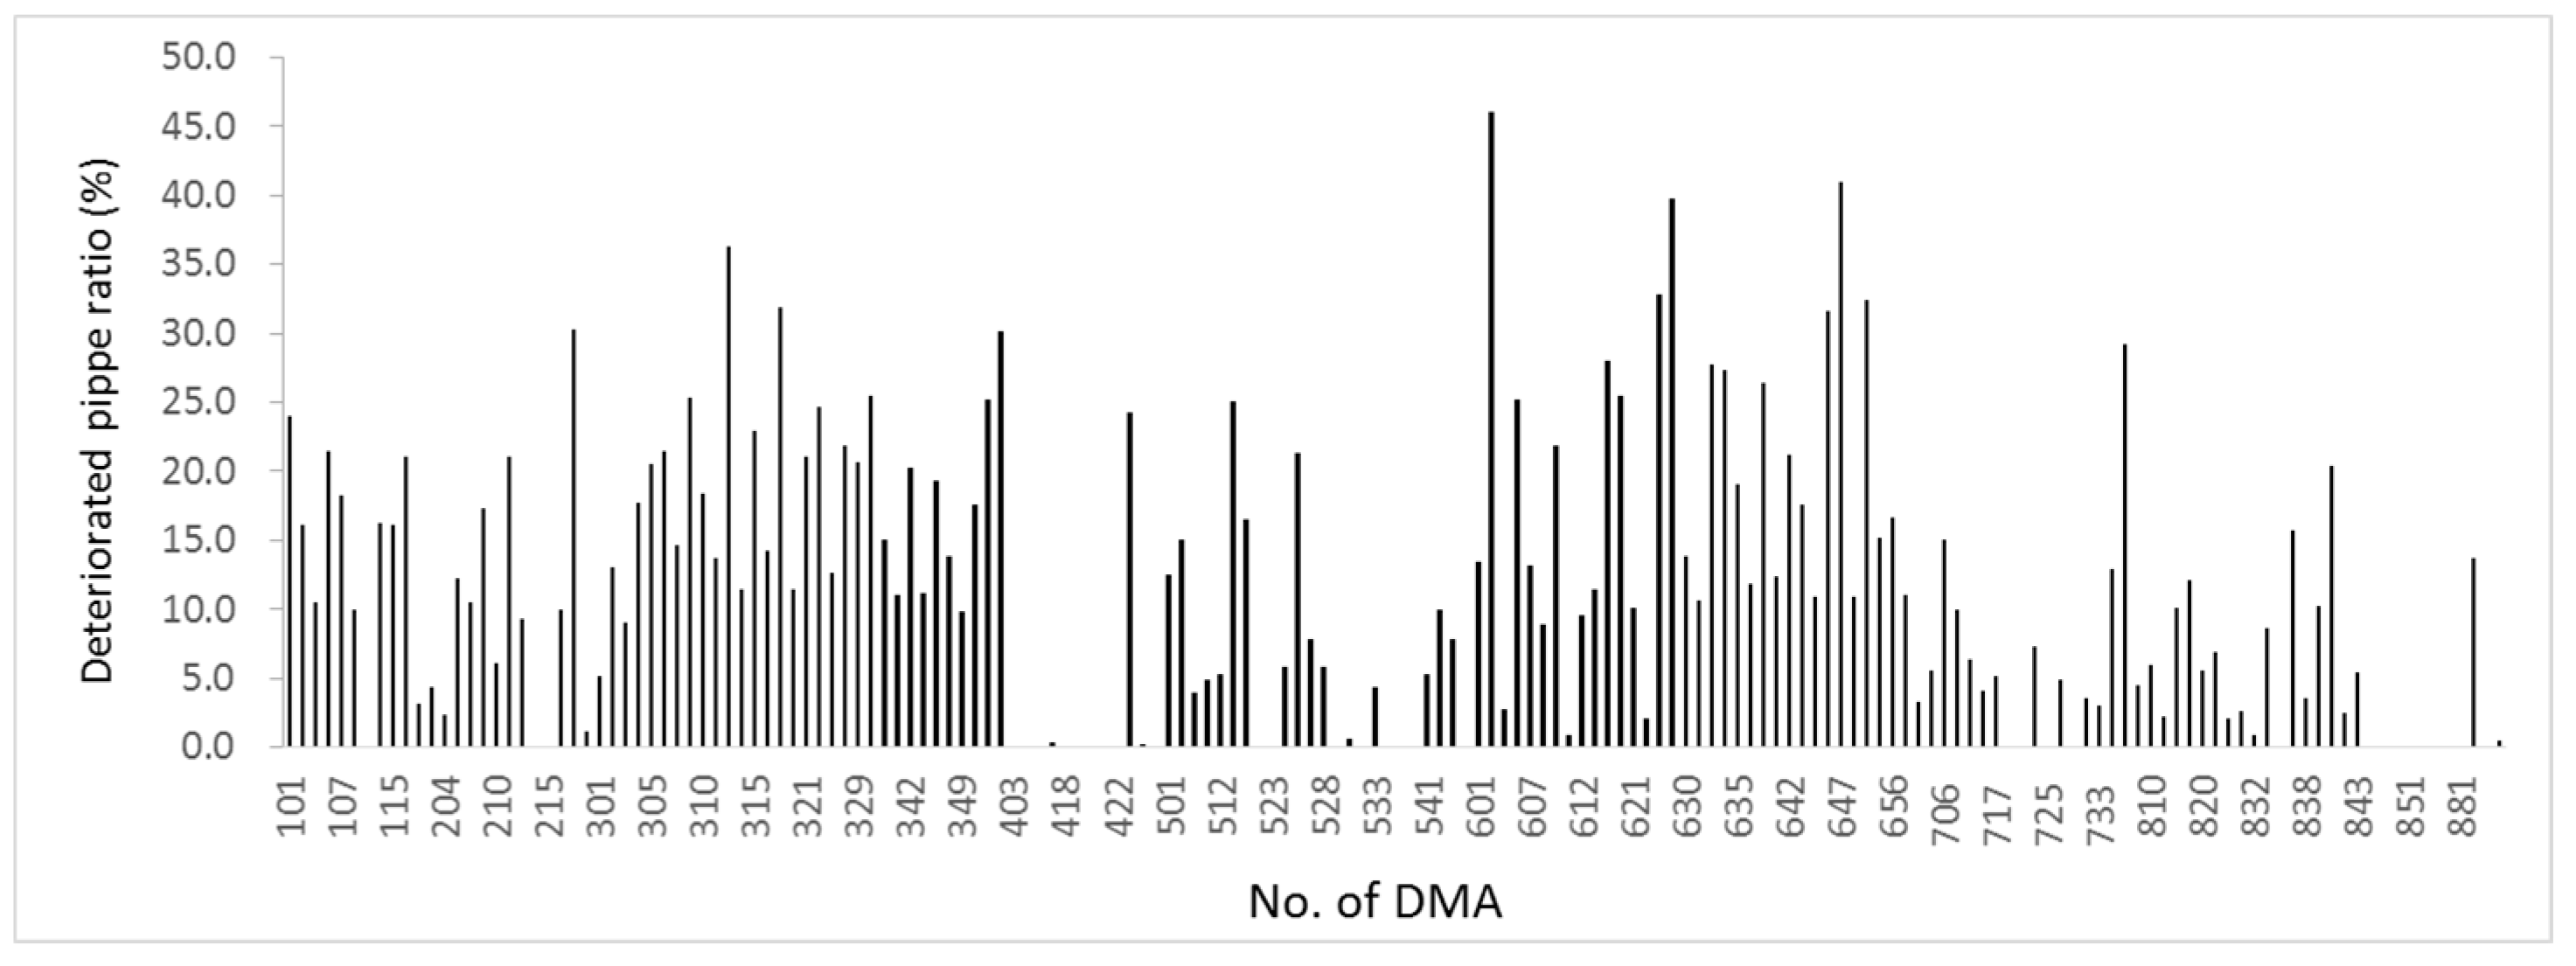
Selected parameters were determined by previous research on parameter classification systems in water distribution networks [25]. These parameters were related with NRW and verified by statistical analysis between the parameters and NRW. Jang (2017) suggested various parameters, simulated estimating the NRW ratio, and determined the six parameters with high correlation and accuracy for estimating the NRW ratio [25]. Data on the selected parameters were collected in the target area. The NRW ratio, a dependent variable, is based on measured data in consideration of revenue water and effective and ineffective NRW in 2014, as shown in Figure 4.
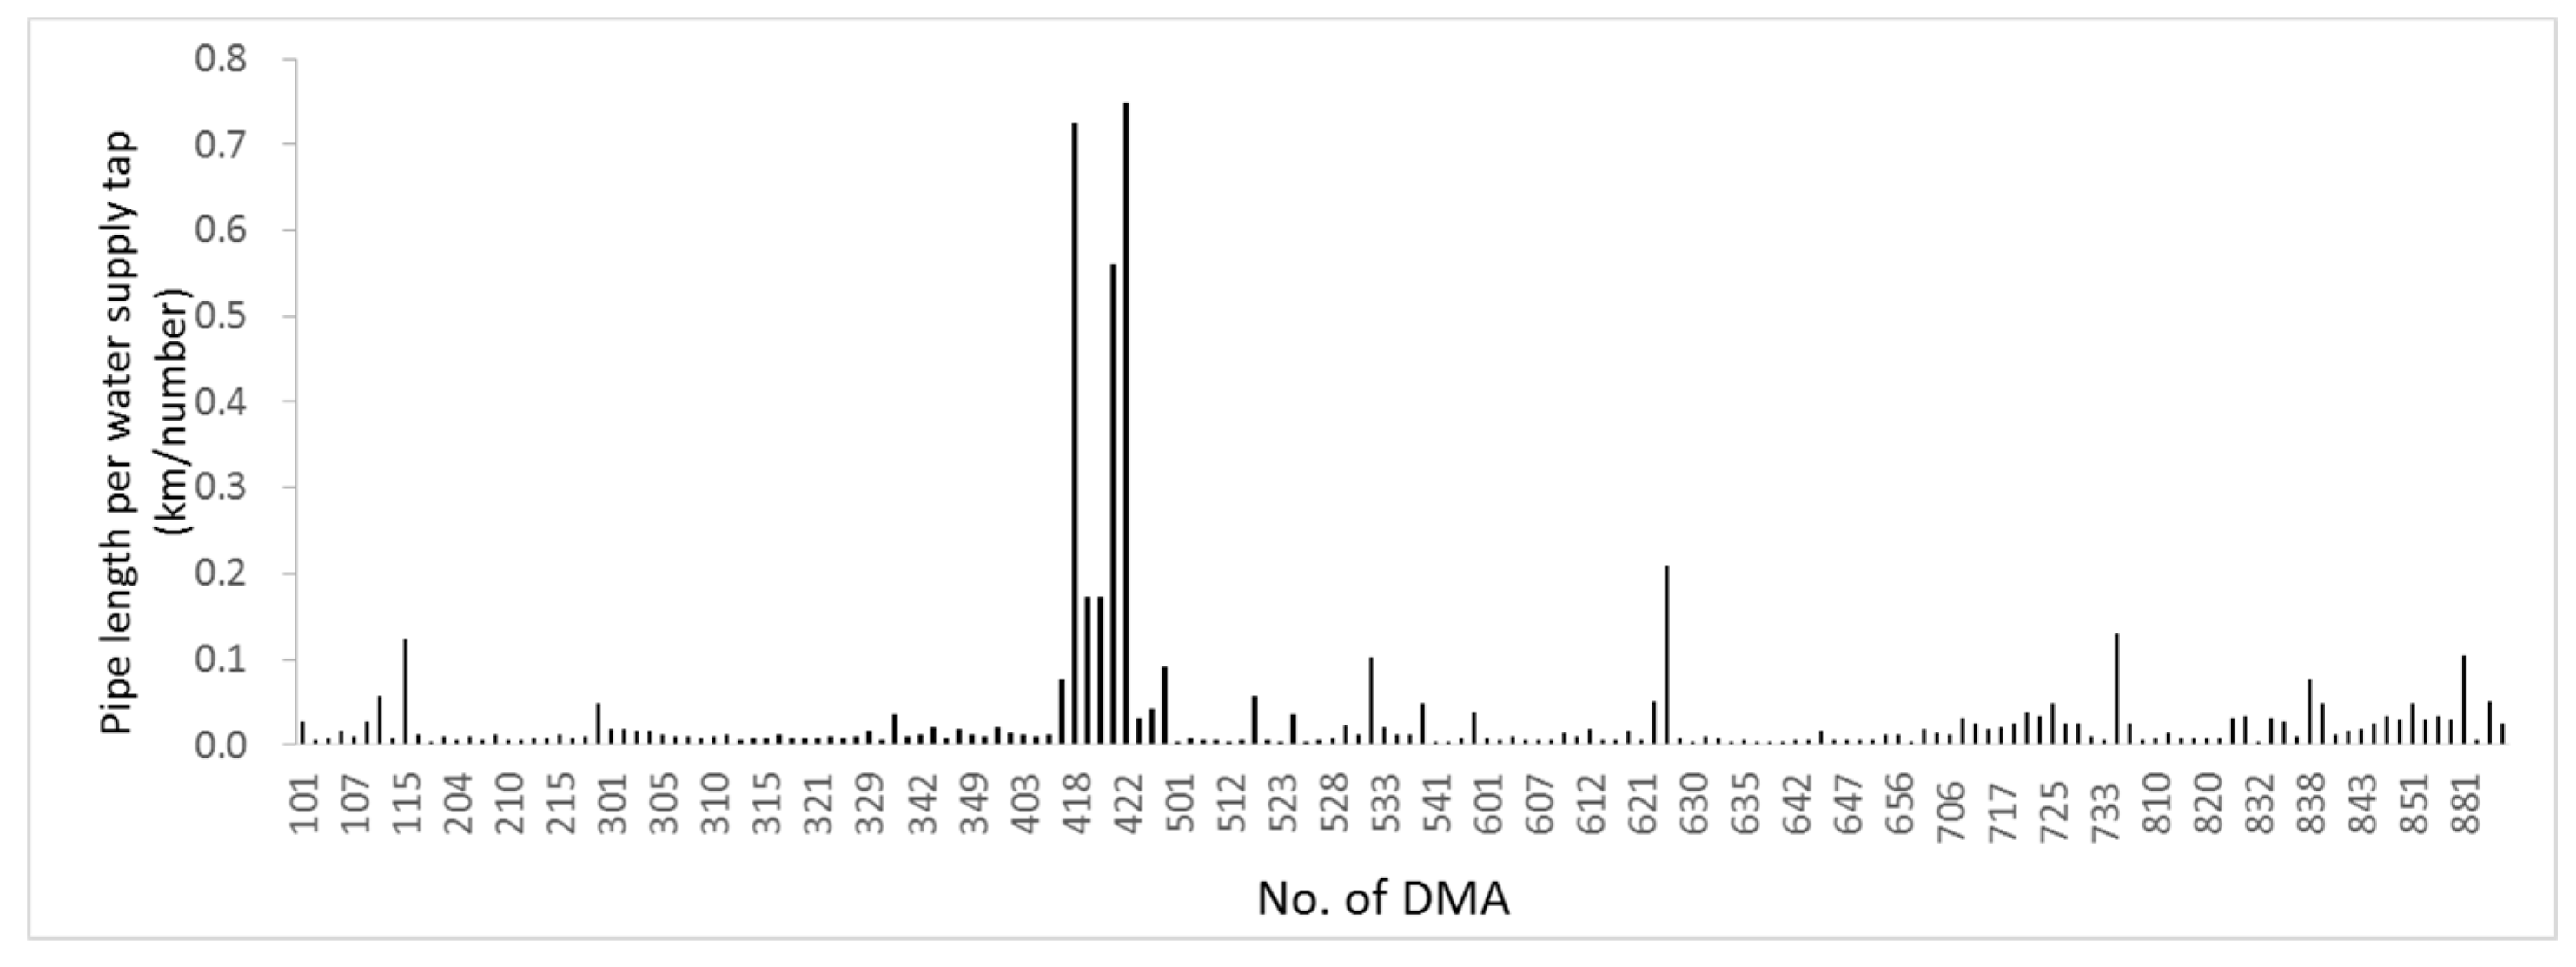
The average NRW ratio of the 173 DMAs was 19.9%, the minimum NRW ratio was 0.2% (DMA No. 853), and the maximum NRW ratio was 64.3% (DMA No. 886). Figure 5, Figure 6, Figure 7, Figure 8, Figure 9 and Figure 10 are the data of each independent variable.
The average value of the pipe length per demand junction (km/no. of junctions) is 0.0336; the maximum value is 0.75 (DMA No. 418) at the beginning of the No. 400 DMA located in industrial district, and; the number of demand junctions is lower than in residential district. Compared to other DMAs, pipe length of industrial district is longer than other districts for water delivery in each DMA.
The highest volume of water supply per demand junction was 318 in DMA No. 627 in an old industrial district. It was significantly higher than the average (9.1). The other district were mainly distributed with low value as less than 50 and there were some high values depending on DMA characteristics.
On average, pipelines more than 20 years old had an average NRW ratio of 11.3%; DMA No. 602 in the old industrial district had a ratio of 46.1%, significantly higher than other districts.
4.2. Result of MRA for Estimating NRW Ratio
The coefficient of equation for MRA was minus 0.048 for water supply quantity per demand junction, 0.284 for number of leaks, 0.347 for the deteriorated pipe ratio, 1.709 for the demand energy ratio, minus 0.064 for mean pipe diameter and 10.456 for pipe length per demand junction. The constant was considered a little high at 20.488, and three parameters were statistically satisfactory because the significance probability was lower than 0.05, but the other parameters were unsatisfactory. Results of MRA are shown in Table 4 and the calculated multiple regression equation is shown as Equation (4).
NRW ratio (%) = 20.488 − 0.048 water supply quantity per junction + 0.284 number of leaks + 0.347 deteriorated pipe ratio + 1.709 demand energy ratio − 0.064 mean pipe diameter + 10.546 pipe length per junction
Figure 11 is the scatter plot graph. All original parameters were selected and applied to MRA. In the graph, the R2 of 0.15 shows a low correlation with the real measured NRW ratio.
In order to calculate the multiple nonlinear regression for Equation (3), which was calculated through multiple regression analysis, a new equation was derived by introducing the exponential concept into each independent variable.
In order to determine the optimal formula, calculations of 1400 iterations were performed. The final parameters of nonlinear equation were calculated by repeating the calculation until the sum of squares error showed the smallest value. Finally the multiple nonlinear regression formula was derived, as shown in Equation (5).
NRW ratio (%) = 18.316 + 68.6 water supply quantity per junction−0.0240 + 0.038 number of leaks1.511 + 5.945 deteriorated pipe ratio0.274 + 0.038 demand energy ratio4.368 – 6.065 mean pipe diameter0.345 – 32.523 pipe length per junction−0.059
4.3. Result of ANN for Estimating NRW Ratio
The simulation condition for calculating the NRW ratio through ANN used the deteriorated pipe ratio, mean pipe diameter, water supply quantity per demand junction, demand energy ratio, pipe length per demand junction and number of leaks including both physical and operational parameters.
The number of hidden layers was capped at 15. To determine the optimal number of neurons in hidden layers, the method of trial and error was used for estimating the NRW ratio. When 12 neurons in hidden layers were selected for the optimal ANN model, they showed highest R2 value than other the number of neurons applied case.
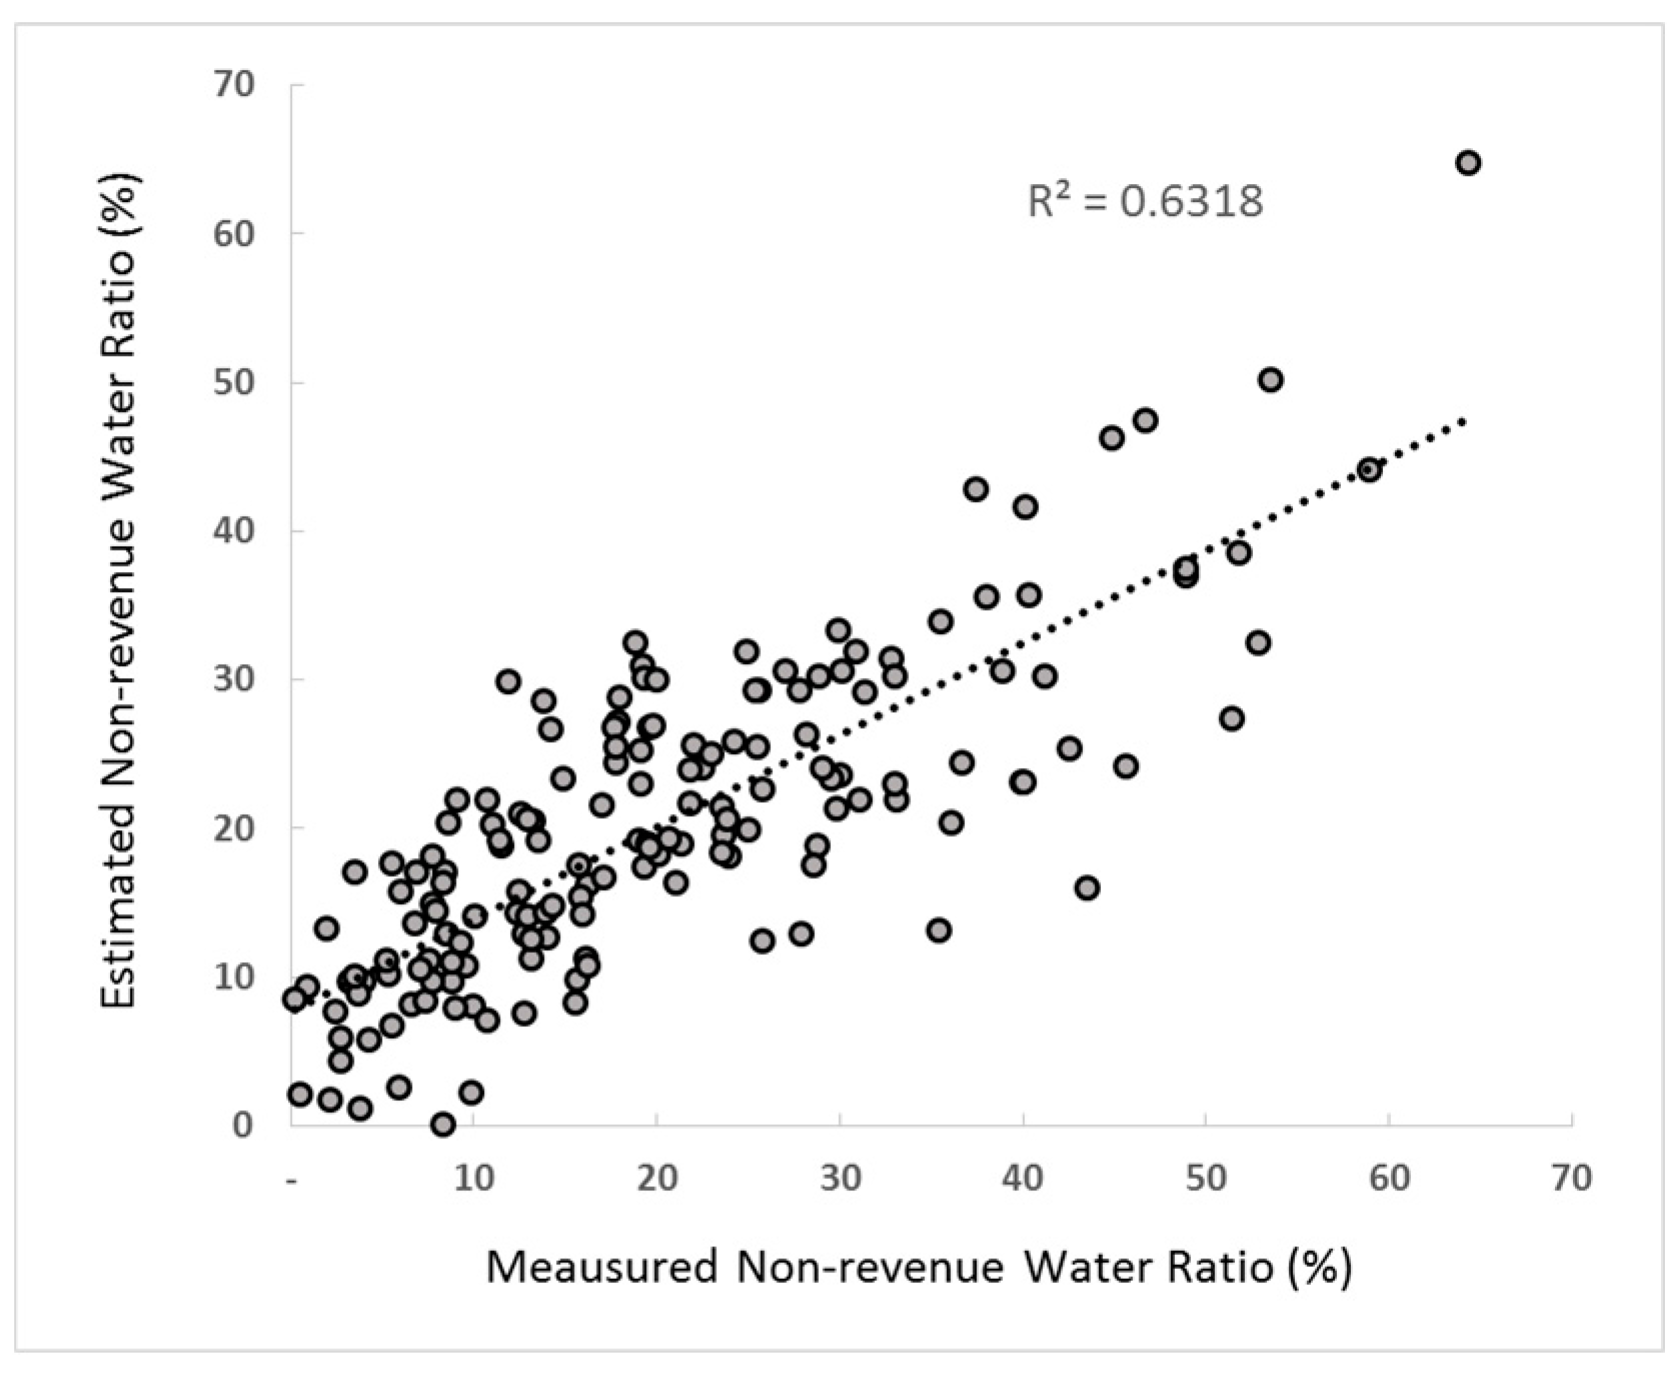
Figure 13 is a graph showing the comparison between the observation and simulation values of the NRW ratio under the 12 neuron condition in the hidden layer, which are derived from the optimal results among the 15 neurons.
4.4. Accuracy Assessment for Analyzing Application Method
To evaluate the accuracy of the multiple regression equations proposed in the previous study and the results of ANN found by this research, an error ratio analysis was performed to evaluate the difference between the actual and model values. Accuracy analysis can be estimated by comparing the actual value with the value generated by the model.
This meant the use of the mean absolute error (MAE), the mean square error (MSE), and the percent of bias (PBIAS), which evaluates the bias of the estimation result, and the G-value prediction method. The calculation method of each equation is shown in Equations (6)–(9), and the comparison between the actual and model values can be more accurately evaluated through regression analysis.
If MAE and MSE are smaller, the estimated value is more accurate. If PBIAS is close to zero, the estimation result represents less bias. If the G value is 100, it is a perfect estimation. If the G value is negative, this indicates lower reliable than using the average of data values as 10a predictor.
Table 5 shows the results of the accuracy assessment for the estimated results of MRA and ANN that selected optimal the number of neurons as 12.
The ANN model with 12 neurons in the hidden layer was closest to the actual measured value. The condition using ANN satisfied all accuracy evaluation items except PBIAS and average value compared with MRA.
5. Conclusions
In this study, estimation of the NRW ratio using an ANN and MRA were conducted with specific parameters affecting the frequency of leaks in water distribution systems. Accuracy assessment was used to compare the selection of the optimal model between the ANN and MRA, and the following conclusions were drawn through the research.
Based on the results of the previous study, calculation of the NRW ratio is recommended by using MRA, which is obtained from the physical and operational parameters in water distribution networks. This study tried to use an ANN for estimating the NRW ratio, then compared the results of MRA and the ANN. An accuracy assessment showed that the ANN model had higher prediction accuracy than that of MRA.
A methodology has been developed for estimating the NRW ratio using an ANN with the main parameters of water distribution systems. When an ANN was used, the accuracy of NRW ratio estimation was higher than under the previous method of MRA. So when it is difficult to measure the NRW ratio and use MRA in a DMA, the ANN model is recommended for estimating the NRW ratio using the main parameters of water distribution systems.
When an ANN is used to predict the NRW ratio, finding the significance of the parameters is possible because it calculates the optimized model considering the interconnection between mutual parameters, despite the condition being statistically insignificant. The optimal number of neurons is also determined in the range of 2n when the number of independent parameter is n.
MRA is the most widely used method to predict the NRW ratio, and formulas vary according to regional characteristics and used parameters. If the volume of available data is sufficient, the ratio’s prediction using an ANN is recommended for use in analysis of water distribution systems.
The use of the ANN model is expected to lead to the rehabilitation and improvement of water distribution systems and the optimal operation of water supply facilities for DMA construction.
Author Contributions
Dongwoo Jang performed the data analysis and modeling simulation. Gyewoon Choi contributed suggestion of methodologies and review the paper.
Conflicts of Interest
The authors declare that they have no conflicts of interest.
References
- Rizzo, P. Water and Wastewater Pipe Nondestructive Evaluation and Health Monitoring: A Review. Adv. Civ. Eng. 2010, 2010, 818597. [Google Scholar] [CrossRef]
- Saldarriaga, J.G.; Ochoa, S.; Moreno, M.E.; Romero, N.; Cortes, O.J. Prioritized Rehabilitation of Water Distribution Networks Using Dissipated Power Concept to Reduce Non-Revenue Water. Urban Water J. 2010, 7, 121–140. [Google Scholar] [CrossRef]
- Engelhardt, M.O.; Skipworth, P.J.; Savic, D.A.; Saul, A.J.; Walters, G.A. Rehabilitation Strategies for Water Distribution Networks: A Literature Review with a UK Perspective. Urban Water 2000, 2, 153–170. [Google Scholar] [CrossRef]
- Halhal, D.; Walters, G.A.; Ouzar, D.; Savic, D.A. Water Network Rehabilitation with a Structured Messy Genetic Algorithm. J. Water Resour. Plan. Manag. 1997, 123, 137–146. [Google Scholar] [CrossRef]
- Frauendorfer, R.; Liemberger, R. The Issues and Challenges of Reducing Non-Revenue Water; Asian Development Bank: Mandaluyong, Philippines, 2010. [Google Scholar]
- Alegre, H.; Hirner, W.; Baptista, J.M.; Parena, R. Performance Indicators for Water Supply Services; IWA Publishing: London, UK, 2000. [Google Scholar]
- Lambert, A.O.; Hirner, W.H. Losses from Water Supply Systems: Standard Terminology and Recommended Performance Measures; IWA the Blue Pages, International Water Association: London, UK, 2000; pp. 1–13. [Google Scholar]
- Lambert, A.O. International Report on Water Losses Management and Techniques; Water Science and Technology Water Supply; IWA Publishing: London, UK, 2002; Volume 2, pp. 1–20. [Google Scholar]
- Liemberger, R. Do You Know How Misleading the Use of Wrong Performance Indicators can be? In Proceedings of the IWA Managing Leakage Conference, Nicosia, Cyprus, 20–22 November 2002. [Google Scholar]
- Park, S.W.; Kim, T.Y.; Lim, K.Y.; Jun, H.D. Fuzzy Techniques to Establish Improvement Priorities of Water Pipes. J. Korea Water Resour. Assoc. 2011, 44, 903–913. [Google Scholar] [CrossRef]
- Park, Y.S. A Study on Long Term Replacement and Maintenance Plan for Multi-Region Water Pipelines Considering Economics. Master’s Thesis, Seoul National University, Seoul, Korea, 2014. [Google Scholar]
- Park, I.C.; Kwon, K.W.; Cho, W.C.; Cho, K.H. Study on the Decision Priority of Rehabilitation for Water Distribution Network Based on Prediction of Pipe Deterioration. In Proceedings of the Korea Water Resources Association Conference, Jeju, Korea, 18–19 May 2006; pp. 1391–1394. [Google Scholar]
- Mukundi, M.J. Determinants of High Non-Revenue Water: A Case of Water Utilities in Murang’ A County, Kenya. Master’s Thesis, Kenyatta University, Kenyatta, Kenya, 2014. [Google Scholar]
- Shilehwa, C.M. Factors Influencing Water Supply’s Non Revenue Water: A Case of Webuye Water Supply Scheme. Master’s Thesis, University of Nairobi, Nairobi, Kenya, 2013. [Google Scholar]
- Winarni, W. Infrastructure Leakage Index (ILI) as Water Losses Indicator. Civ. Eng. Dimens. 2009, 11, 126–134. [Google Scholar]
- Wyatt, A.S. Non-Revenue Water: Financial Model for Optimal Management in Developing Countries; RTI Press: Amman, Jordan, 2010. [Google Scholar]
- Jung, J.J. The Primary Factor of Management Evaluation Indicators for Local Public Water Supplies & Suggestion of Alternative Evaluation Indicators. J. Korean Policy Stud. 2012, 12, 139–159. [Google Scholar]
- Lambert, A.O.; Brown, T.G.; Takizawa, M.; Weimer, D. A Review of Performance Indicators for Real Losses from Water Supply Systems. J. Water SRT Aqua 1999, 48, 227–237. [Google Scholar]
- Shinde, V.R.; Hirayama, N.; Mugita, A.; Itoh, S. Revising the Existing Performance Indicator System for Small Water Supply Utilities in Japan. Urban Water J. 2013, 10, 377–393. [Google Scholar] [CrossRef]
- Gwak, J.M. Research and Statistical Analysis; Informa: London, UK, 2013. [Google Scholar]
- Haykin, S. Neural Networks: A Comprehensive Foundation; Macmillan: New York, NY, USA, 1994. [Google Scholar]
- Kwon, S.H.; Lee, J.W.; Chung, G.H. Snow Damages Estimation Using Artificial Neural Network and Multiple Regression Analysis. J. Korean Soc. Hazard Mitig. 2017, 17, 315–325. [Google Scholar] [CrossRef]
- Park, C.S. A Case Study on Establishment of Block System for the Increase of Revenue Water in Distribution Systems. Master’s Thesis, Chonnam National University, Gwangju, Korea, 2014. [Google Scholar]
- Jo, H.G. Study on Influence Factors of Non-revenue Water for Sustainable Management of Water Distribution Networks. Ph.D. Thesis, Incheon National University, Incheon, Korea, 2017. [Google Scholar]
- Jang, D.W. Estimation of Non-Revenue Water Ratio Using PCA and ANN in Water Distribution Systems. Ph.D. Thesis, Incheon National University, Incheon, Korea, 2017. [Google Scholar]
- Heaton, J.T. Introduction to Neural Networks with Java; Heaton Research, Inc.: London, UK, 2005. [Google Scholar]
- Waterworks Headquarters, Incheon Metropolitan City. Basic Plan of Waterworks Maintenance in Incheon; Incheon Metropolitan City: Incheon, Korea, 2015. [Google Scholar]
- Waterworks Headquarters, Incheon Metropolitan City. Technical Diagnostics Report for Re-Establish Basic Plan of Waterworks Maintenance in Incheon Water Distribution Network; Incheon Metropolitan City: Incheon, Korea, 2015. [Google Scholar]
Figure 1.
Schematic Diagram of Multilayer Feed-Forward Neural Network [21].
Figure 1.
Schematic Diagram of Multilayer Feed-Forward Neural Network [21].
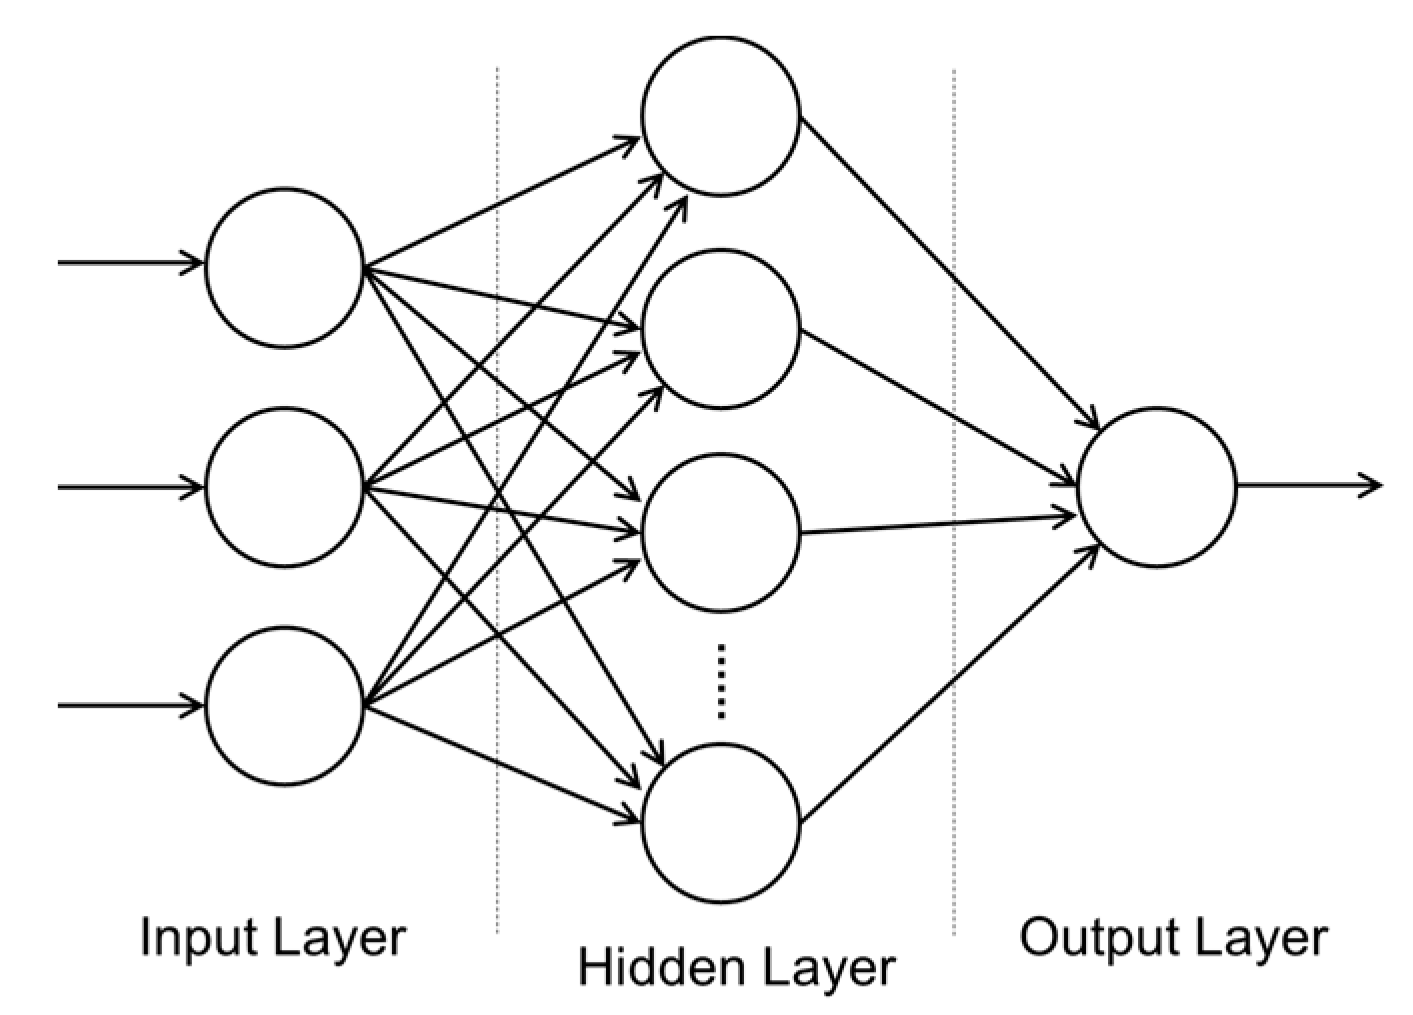
Figure 2.
Study Diagram. Multiple regression analysis (MRA); artificial neural network (ANN).
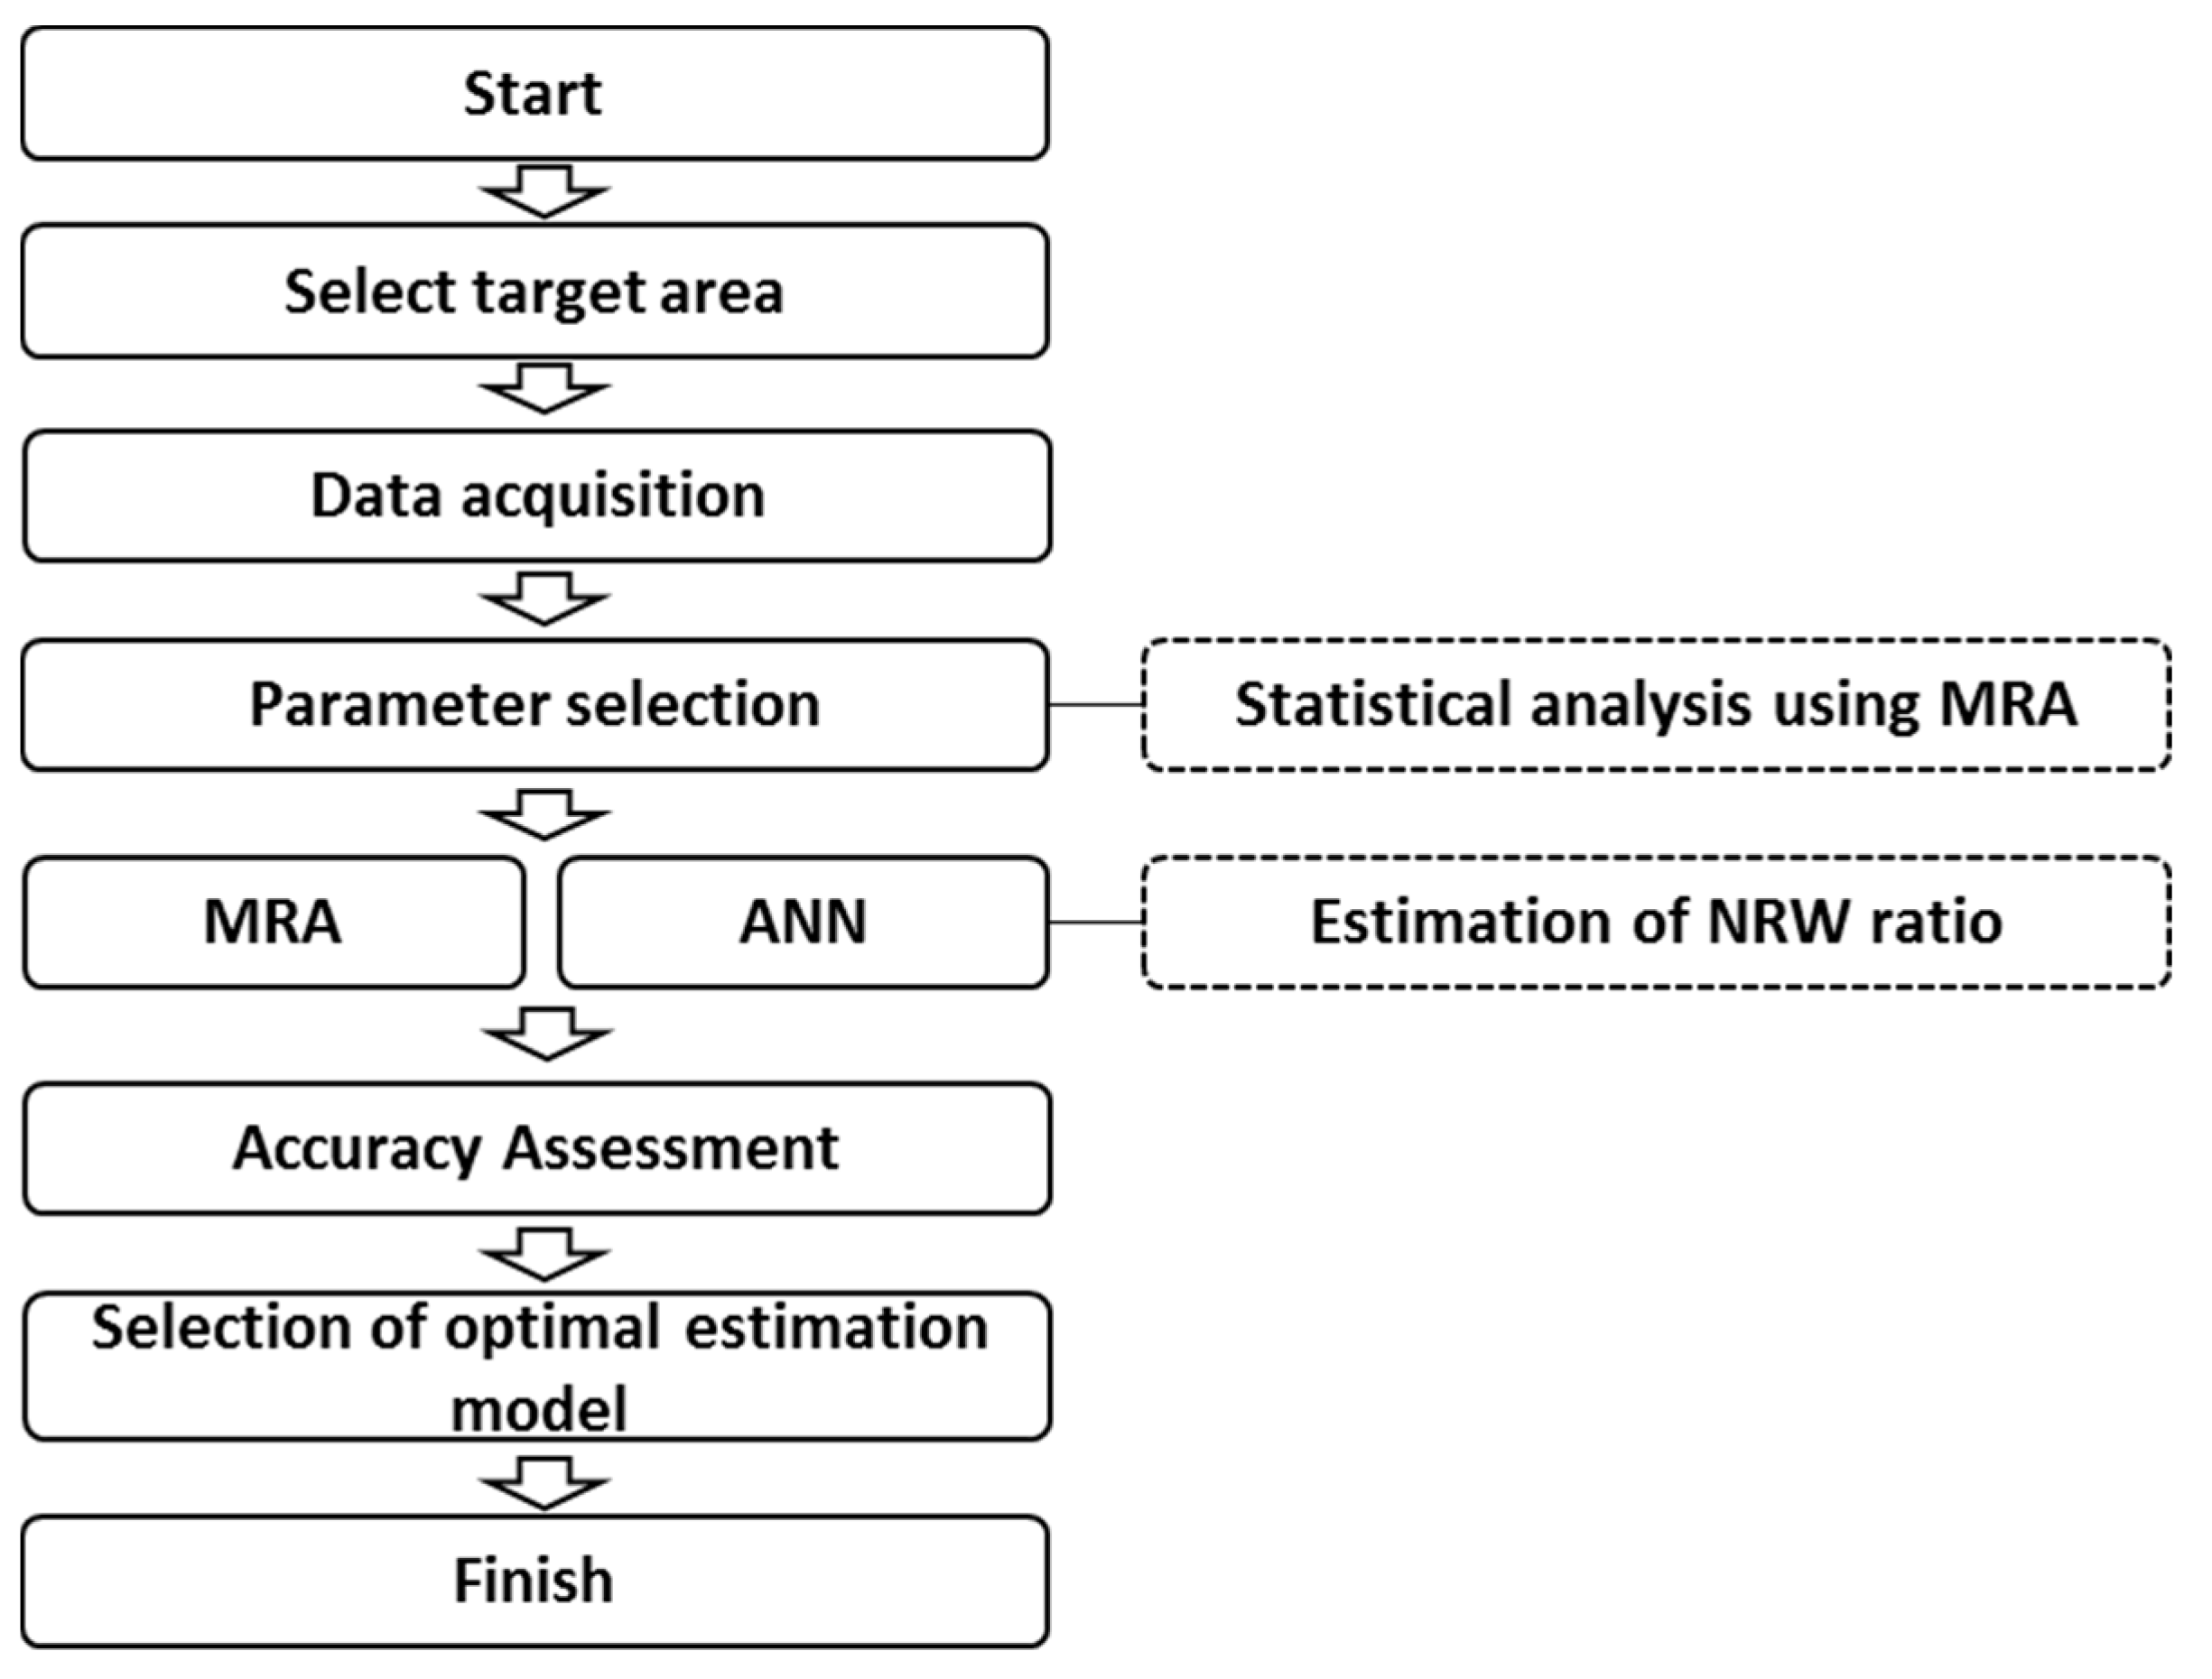
Figure 3.
Water Distribution System of DMAs in Incheon [28].
Figure 3.
Water Distribution System of DMAs in Incheon [28].

Figure 4.
Data Status of NRW ratio in Incheon’s DMAs.
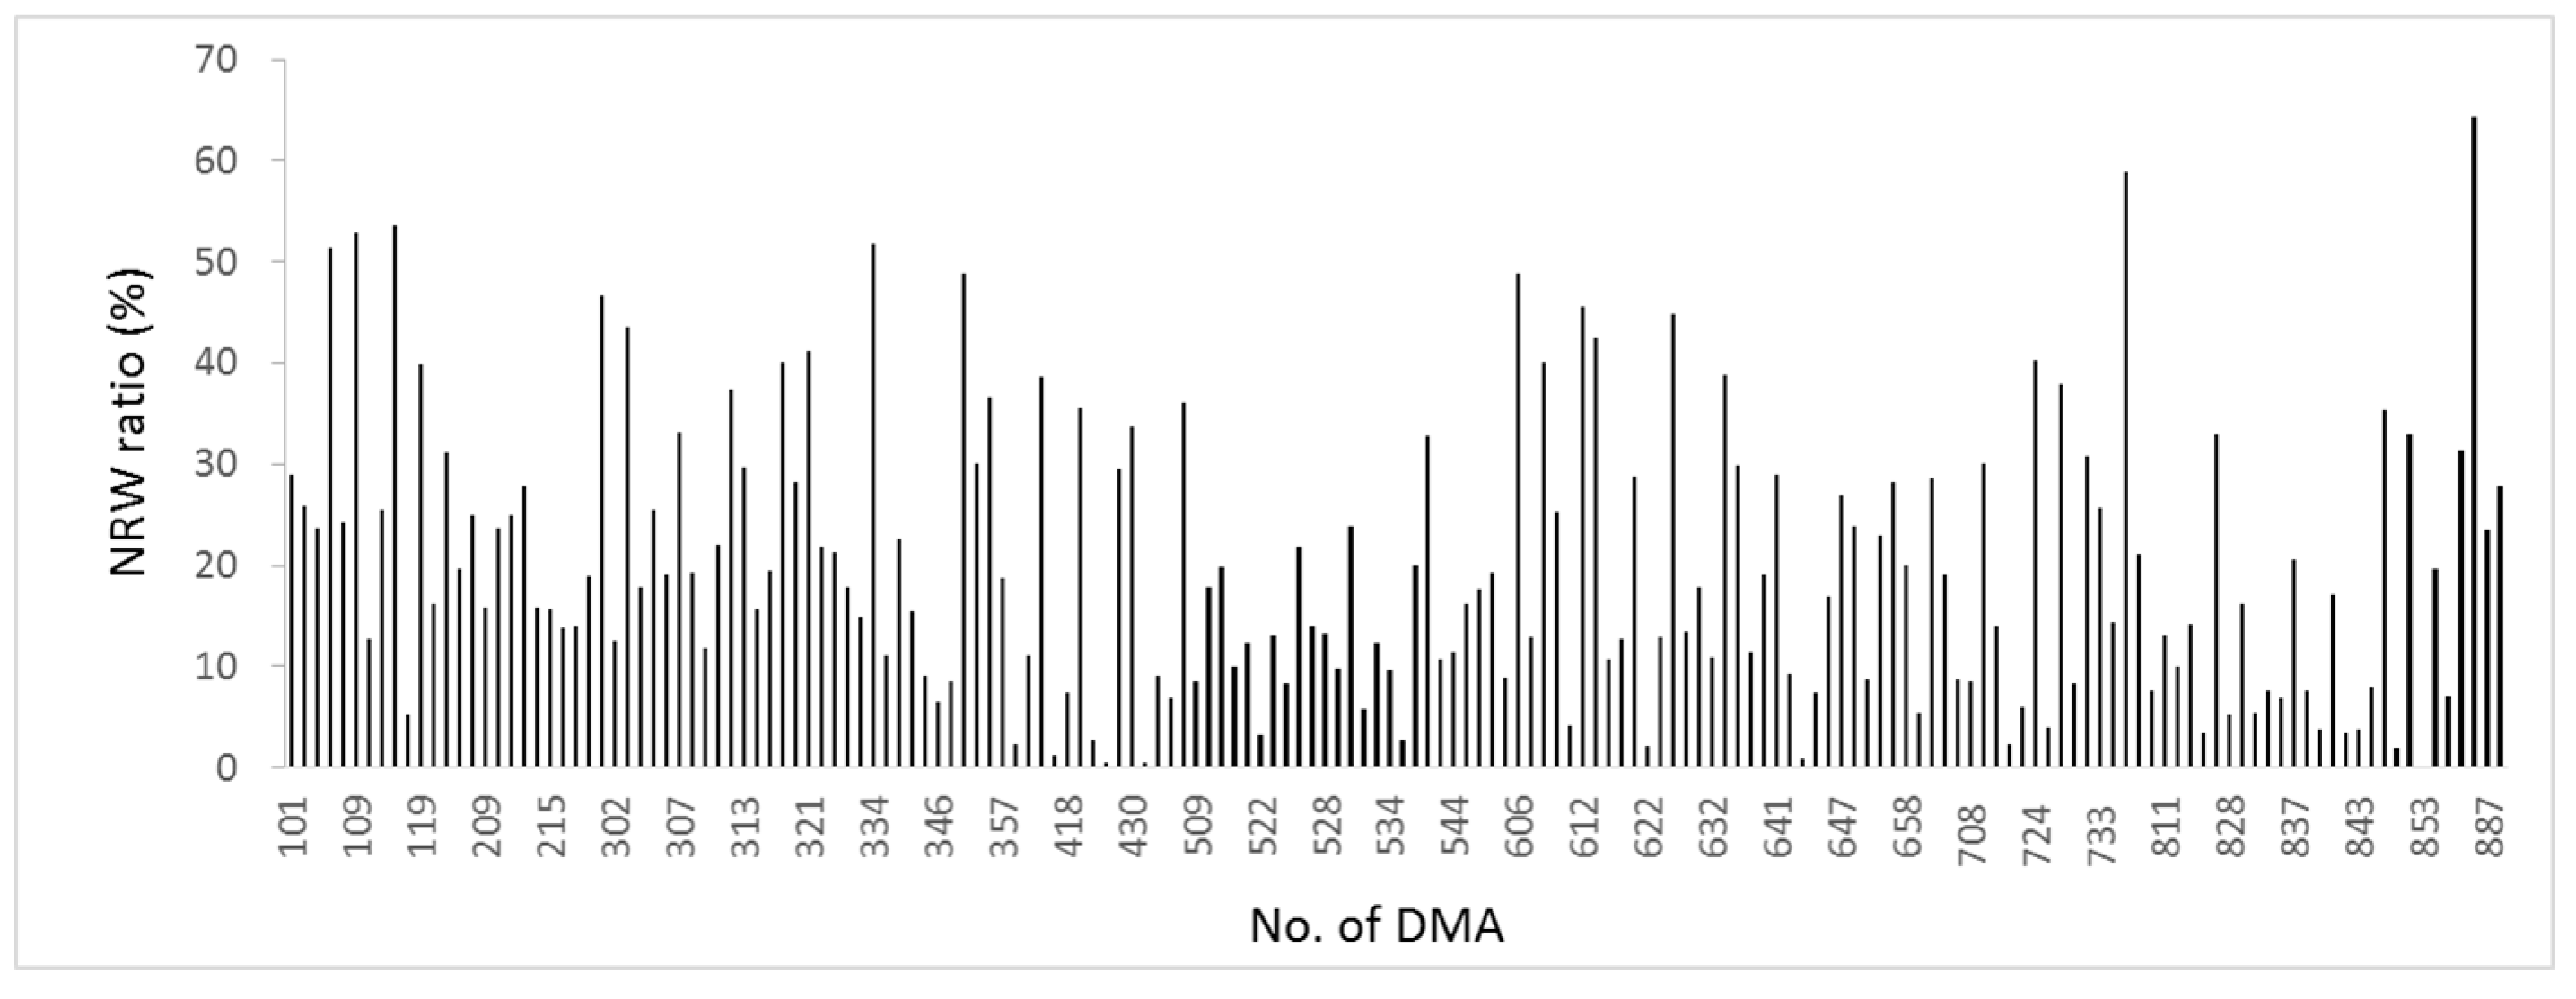
Figure 5.
Data of Pipe Length per Demand Junction in Incheon’s DMAs.

Figure 6.
Data on Volume of Water Supply per Demand Junction in Incheon’s DMA.
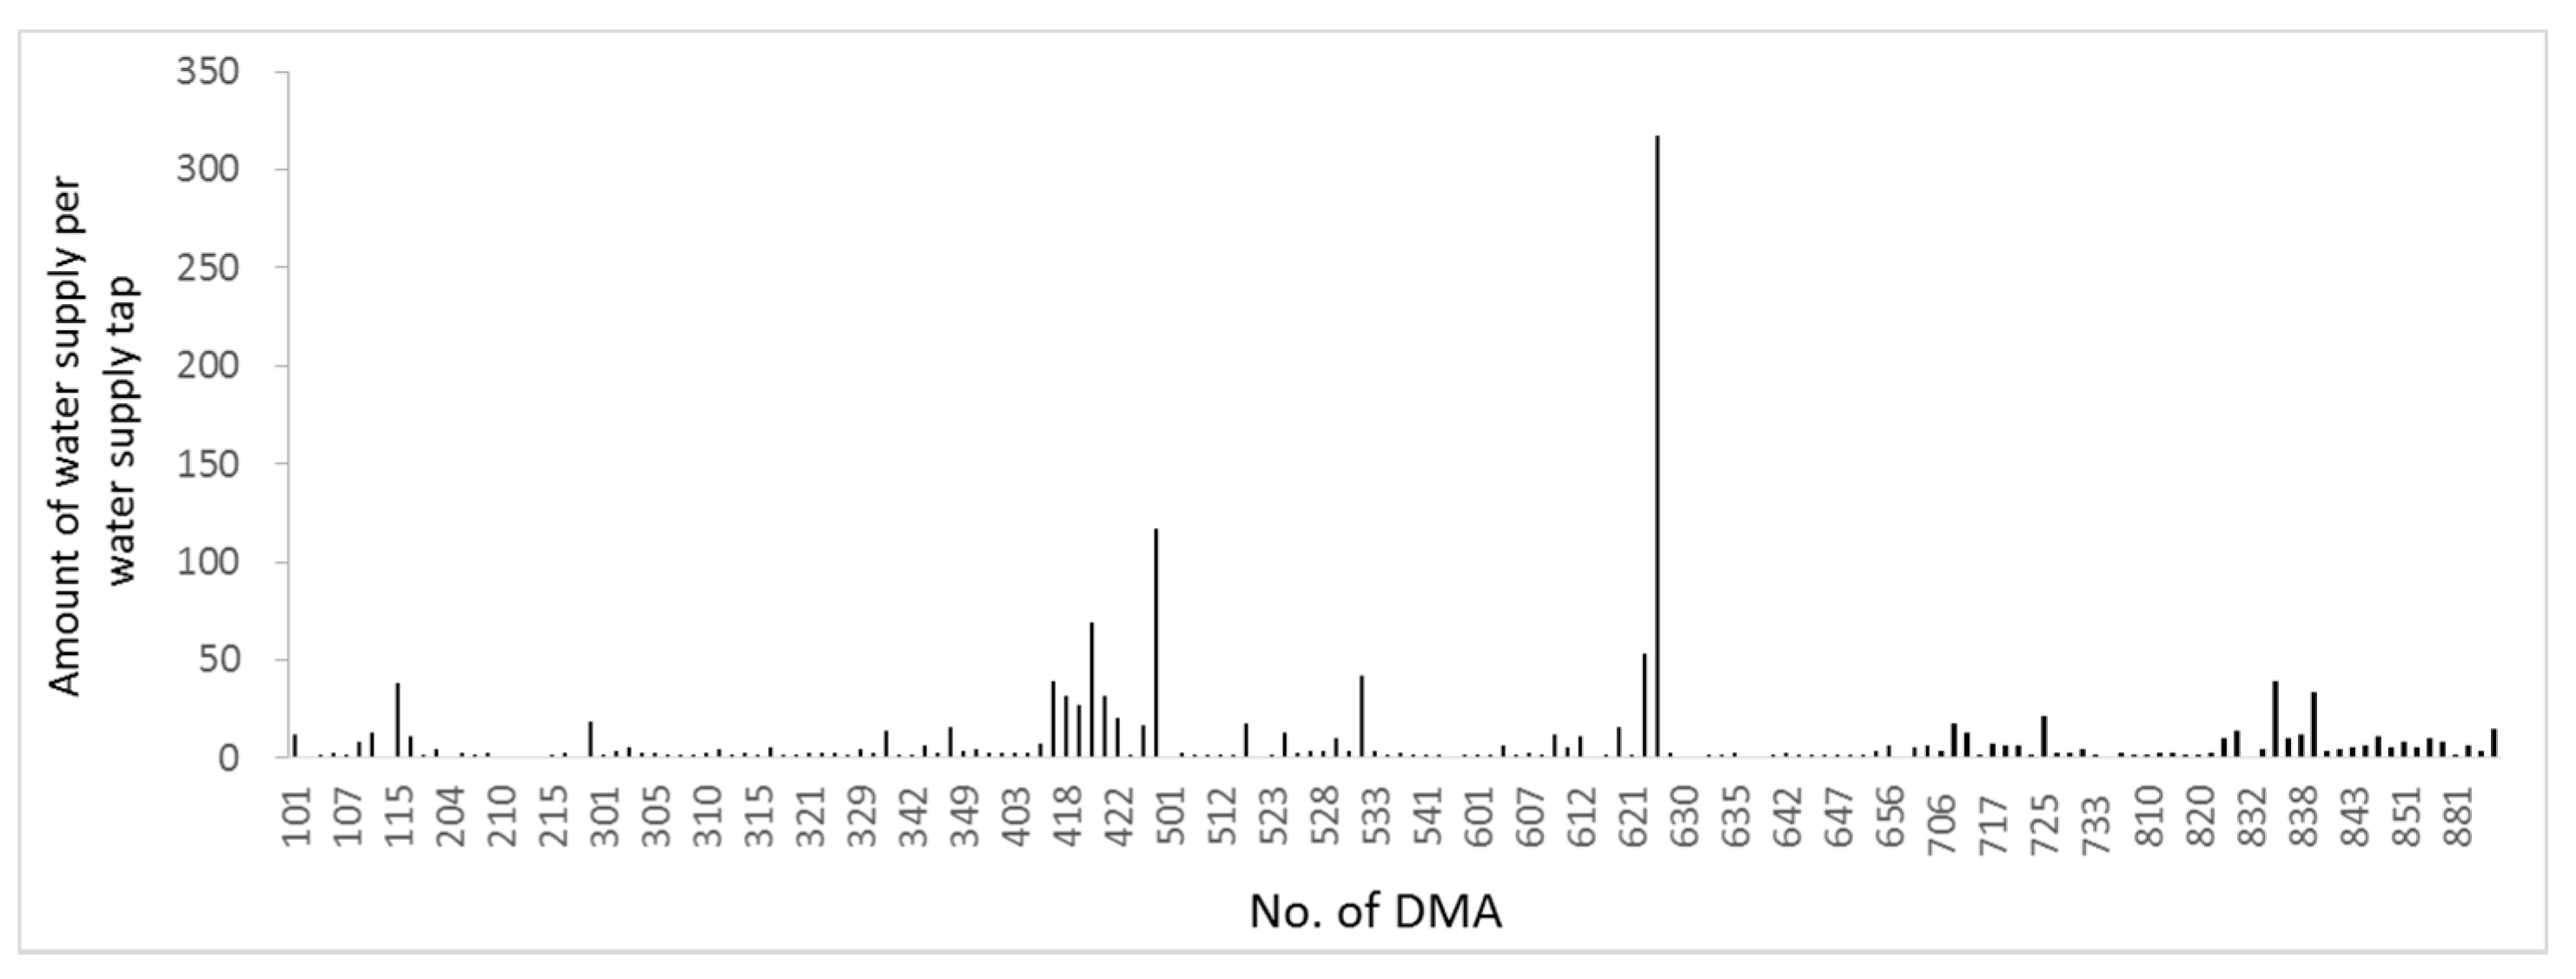
Figure 7.
Data on Deteriorated Pipe Ratio in Incheon’s DMAs.

Figure 8.
Data on Demand Energy Ratio in Incheon’s DMAs.
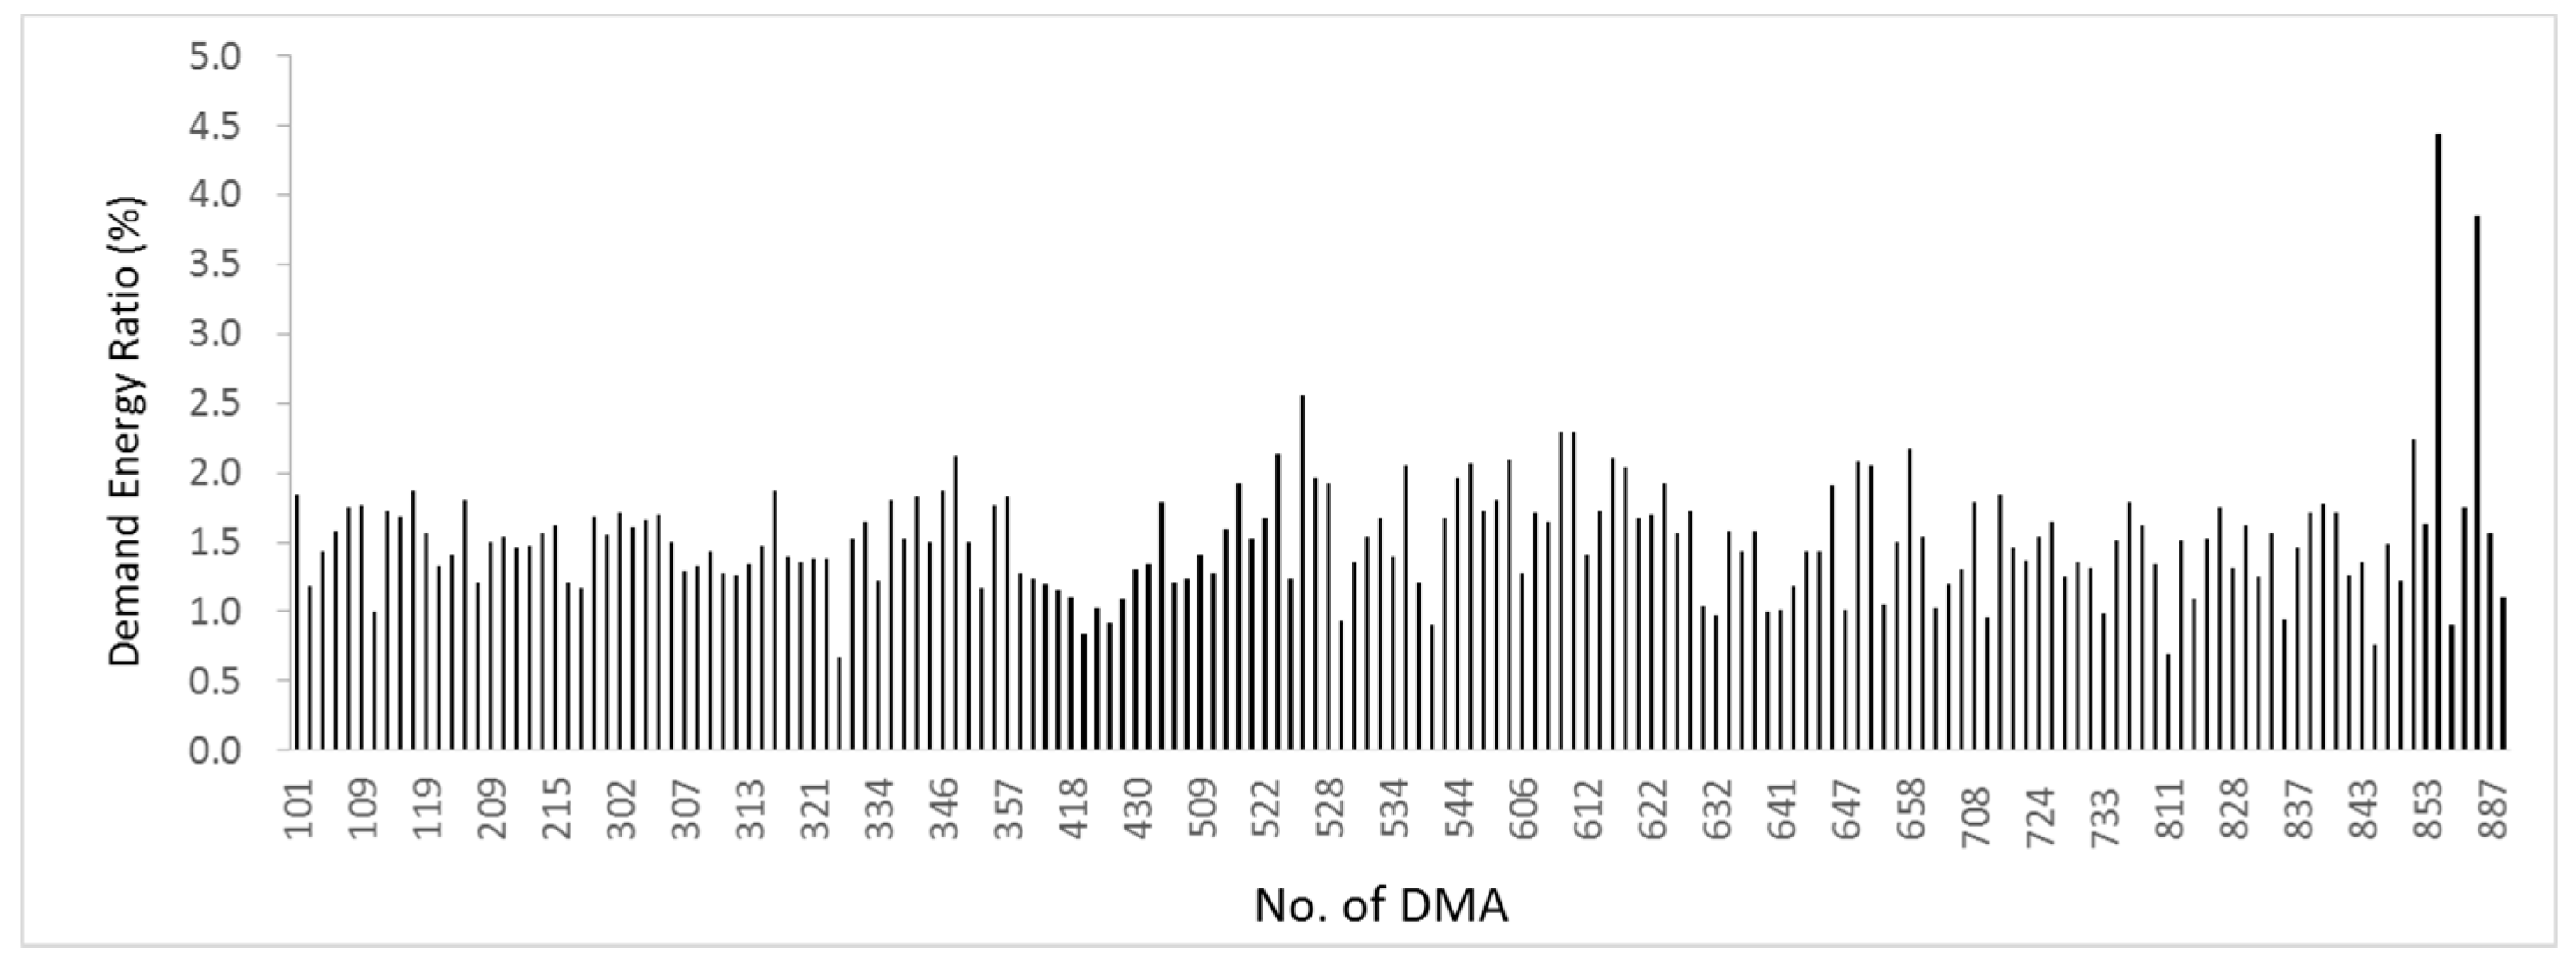
Figure 9.
Data on No. of Leaks in Incheon’s DMAs.

Figure 10.
Data on Mean Pipe Dimeter in Incheon’s DMAs.

Figure 11.
Scatter Plot of NRW Ratio Using MRA Results.
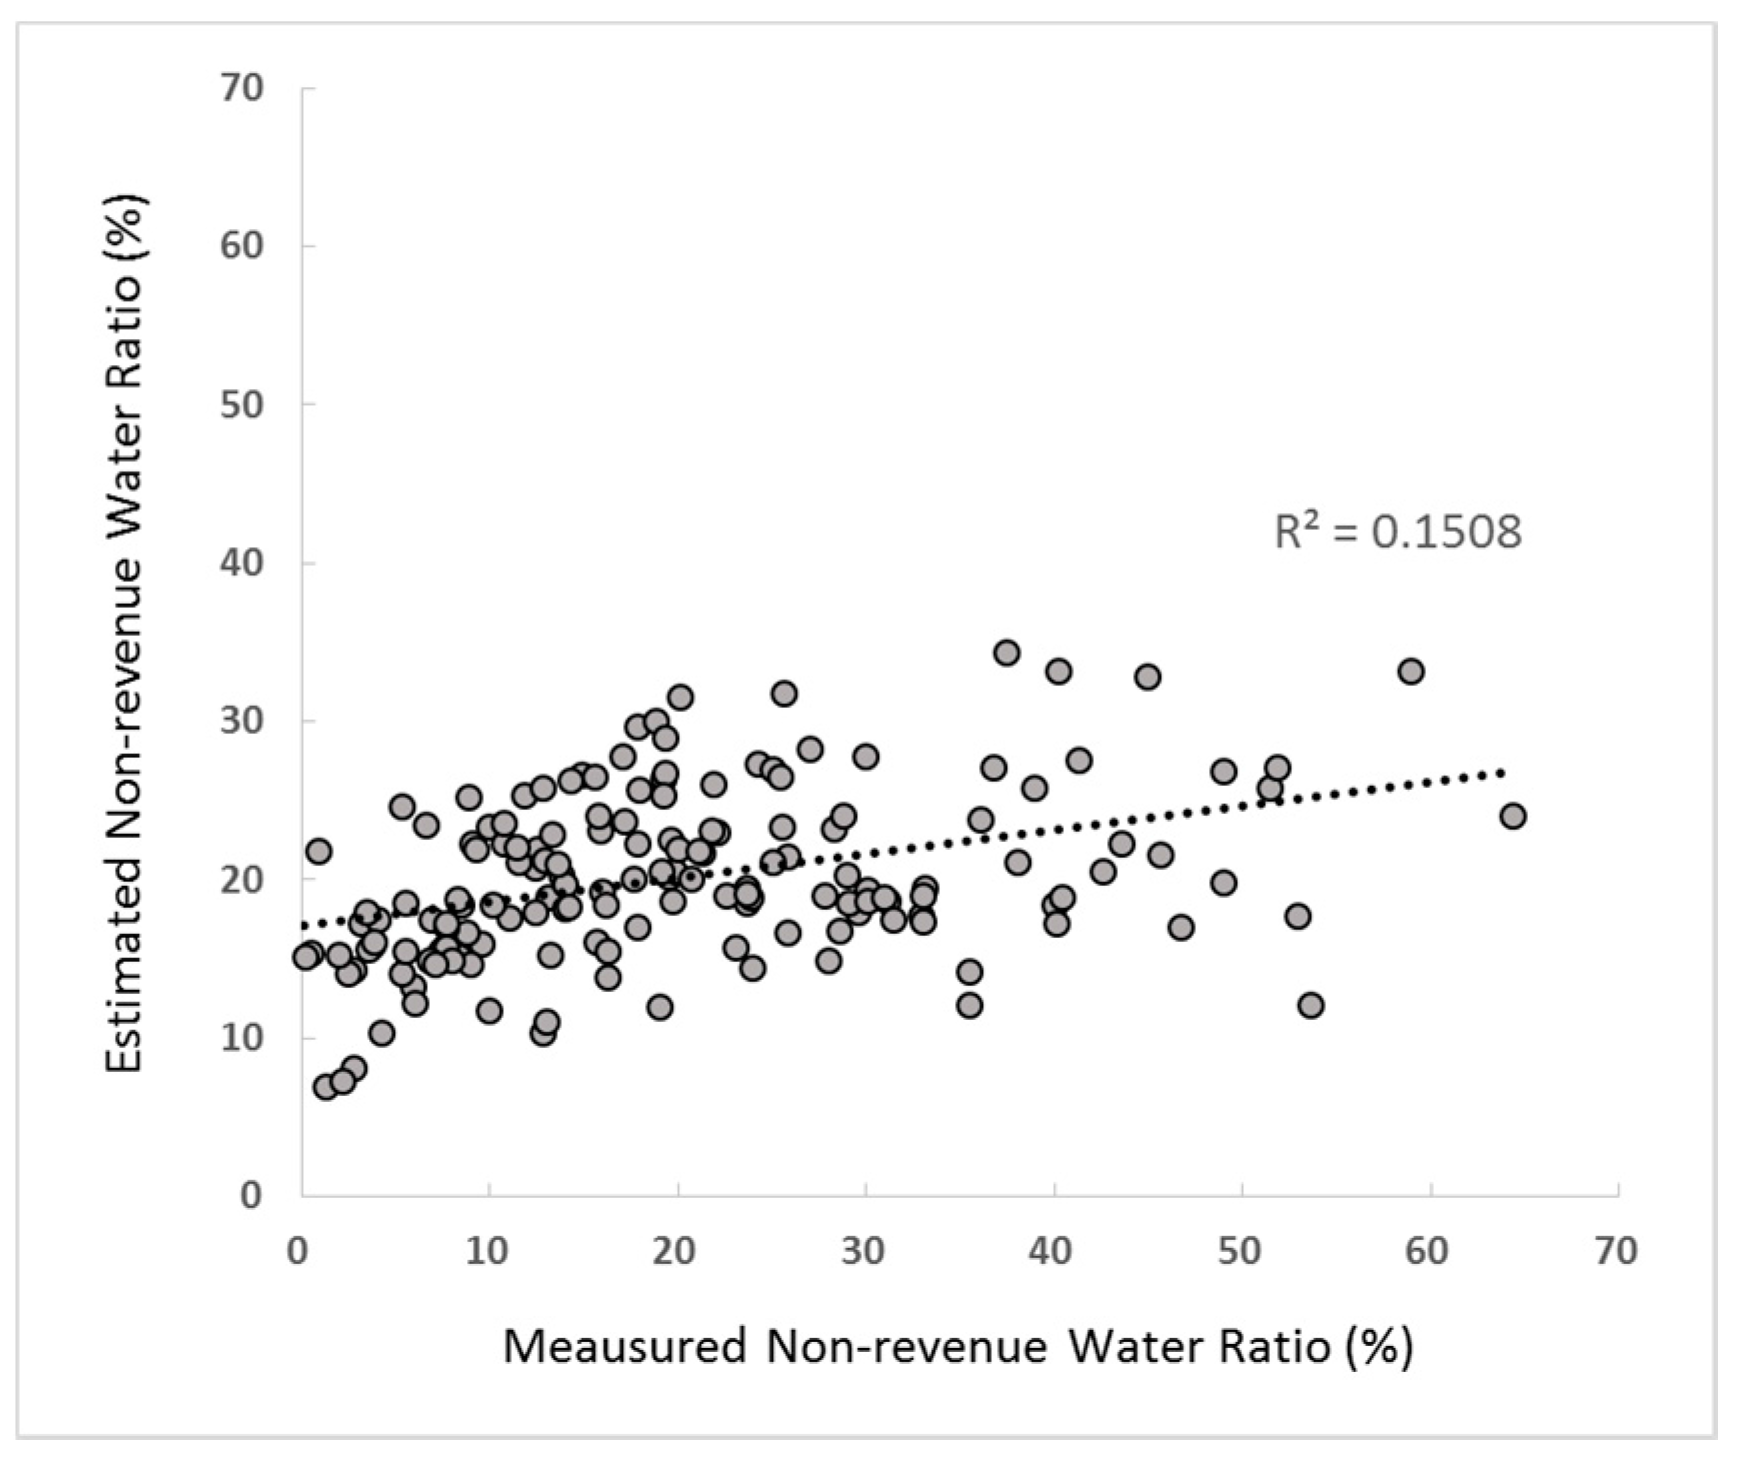
Figure 12.
Scatter Plot of NRW Ratio Using Nonlinear MRA Results.
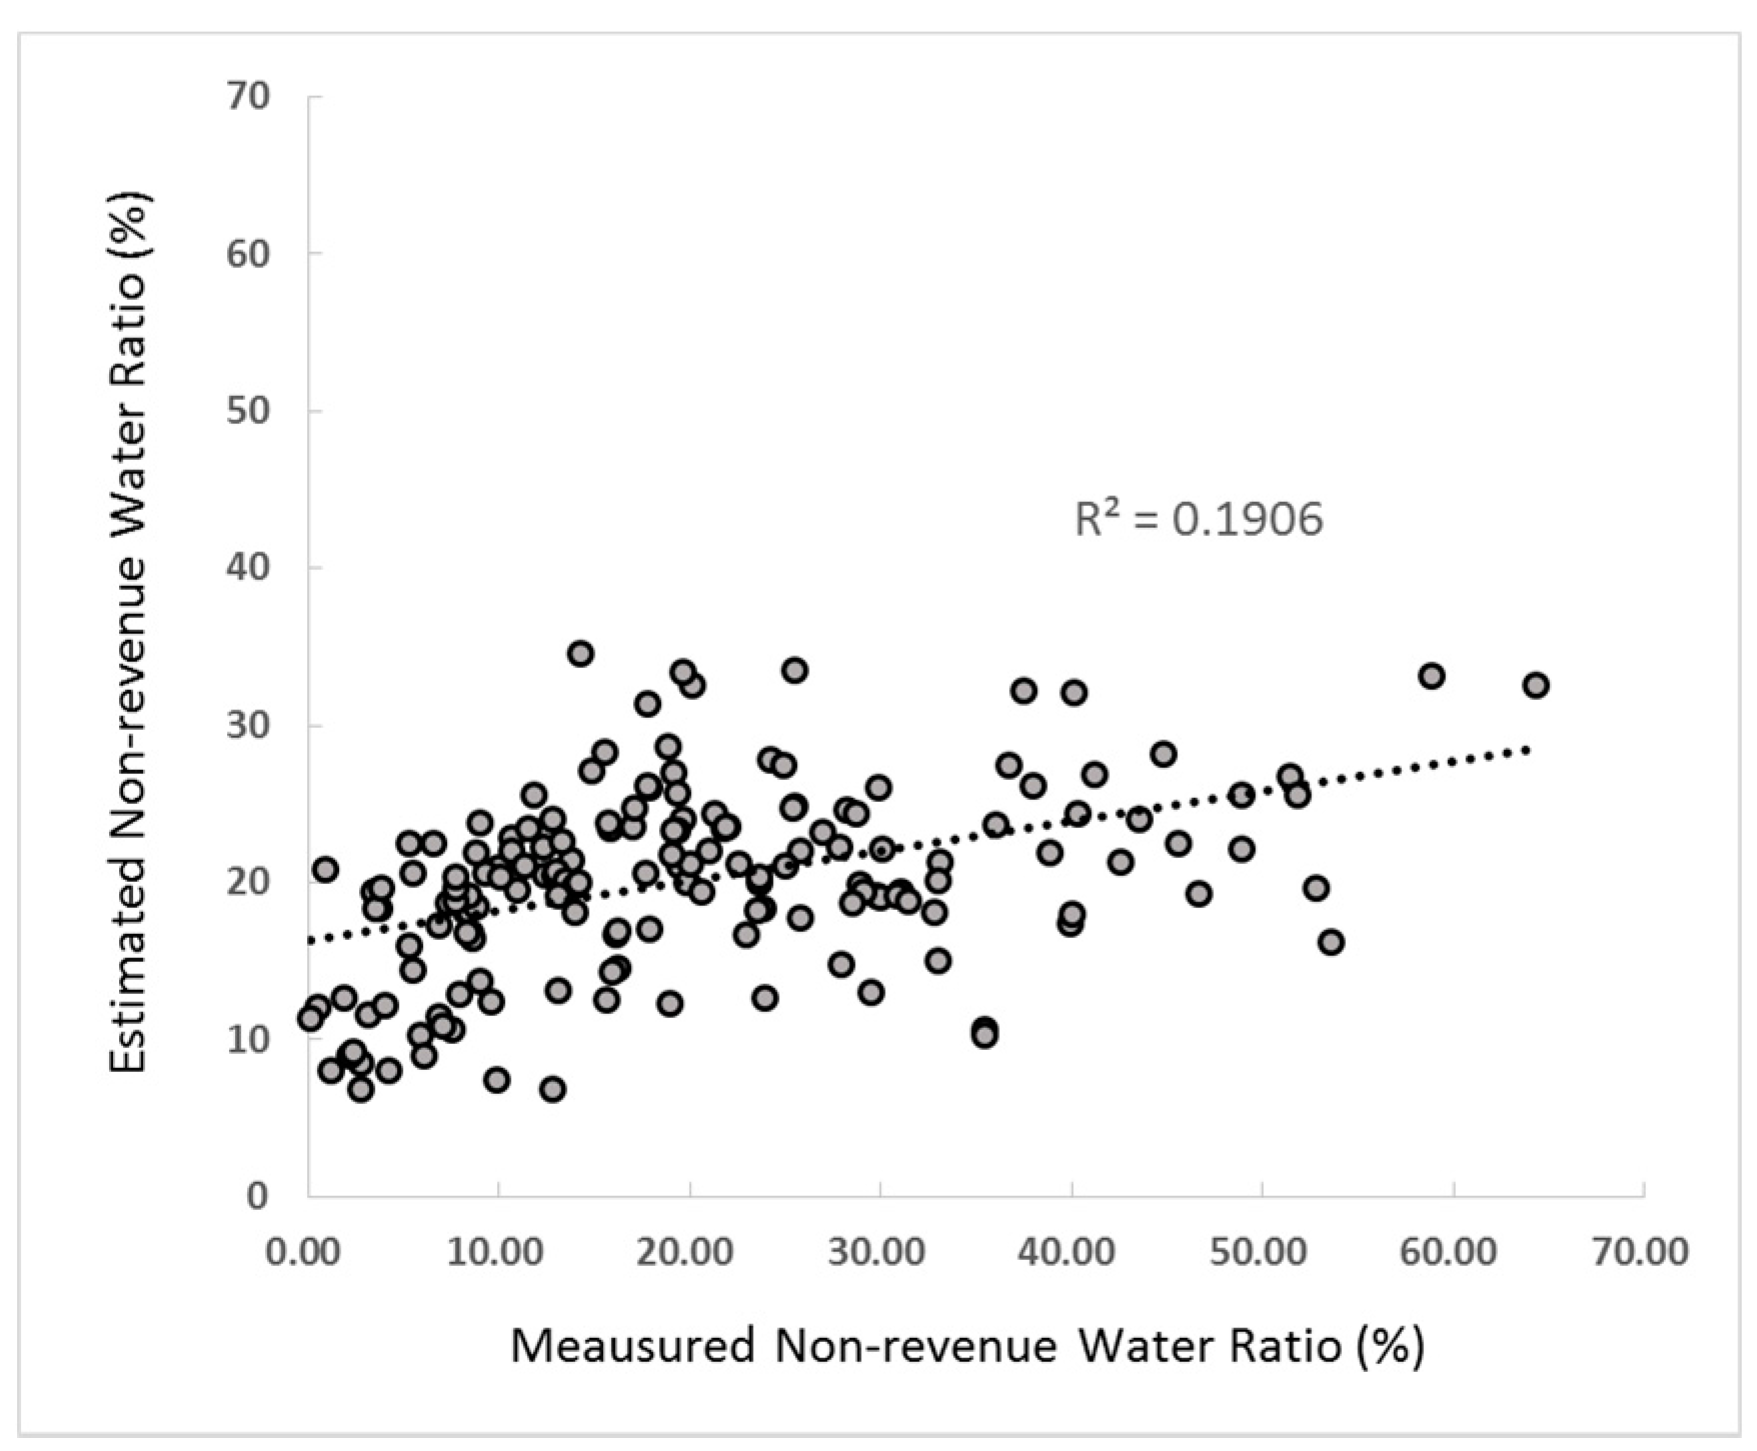
Figure 13.
Scatter Plot of NRW Ratio Using ANN Results.


Table 1.
Components of Water Balance. Non-revenue water (NRW).
| Water Produced | Effective water | Revenue water | Billed and metered |
| Exported | |||
| Others | |||
| Effective NRW | Supplier’s use | ||
| Public use | |||
| Illegal use | |||
| Metering under-registration | |||
| Ineffective water | Ineffective NRW | Discounted | |
| Leaks |
Table 2.
Status of Incheon’s DMAs.
| Classification | Total |
|---|---|
| DMA (District metered area) | 278 (76%) |
| From DMA to unblocked DMA | 52 (14%) |
| Unblocked DMA | 37 (10%) |
| * Total | 367 (100%) |
Note: * Source: Waterworks Headquarters Incheon Metropolitan City [28].
Table 3.
Selected parameters for estimating NRW ratio.
| Classification | Parameter | Data Collection |
|---|---|---|
| Operational parameter | Demand energy ratio | Simulated data |
| No. of leaks | Measured data | |
| Physical parameter | Mean pipe diameter | Designed data |
| Pipe length/demand junction | Designed data | |
| Water supply quantity/demand junction | Measured data | |
| Deteriorated pipe ratio | Designed data |
Table 4.
Results of Multiple Regression Analysis.
| Classification | Unstandardized Coefficients | Significant Probability |
|---|---|---|
| Constant | 20.488 | 0.000 |
| Water supply quantity per demand junction | −0.048 | 0.251 |
| No. of leaks | 0.284 | 0.074 |
| Deteriorated pipe ratio | 0.347 | 0.003 |
| Demand energy ratio | 1.709 | 0.454 |
| Mean pipe diameter | −0.064 | 0.036 |
| Pipe length per demand junction | 10.456 | 0.379 |
Table 5.
Results of Accuracy Assessment. Mean absolute error (MAE); mean squared error (MSE); percent of bias (PBIAS); goodness of fit (G).
Table 5.
Results of Accuracy Assessment. Mean absolute error (MAE); mean squared error (MSE); percent of bias (PBIAS); goodness of fit (G).
| Classification | Measured NRW Ratio | Multiple Regression Analysis | Non-Linear Multiple Regression Analysis | ANN (12 Neurons) |
|---|---|---|---|---|
| Sum. | 3279 | 3279 | 3279 | 3297 |
| Ave. | 20.1 | 20.1 | 20.1 | 20.2 |
| Standard D | - | 23.7 | 23.5 | 21.9 |
| MAE | - | 10.0 | 9.9 | 6.2 |
| MSE | - | 146.8 | 139.9 | 63.7 |
| PBIAS | - | 0.0 | 0.0 | −0.1 |
| G | - | 19.5 | 23.2 | 65.1 |
© 2017 by the authors. Licensee MDPI, Basel, Switzerland. This article is an open access article distributed under the terms and conditions of the Creative Commons Attribution (CC BY) license (http://creativecommons.org/licenses/by/4.0/).
Share and Cite
MDPI and ACS Style
Jang, D.; Choi, G. Estimation of Non-Revenue Water Ratio Using MRA and ANN in Water Distribution Networks. Water 2018, 10, 2. https://doi.org/10.3390/w10010002
AMA Style
Jang D, Choi G. Estimation of Non-Revenue Water Ratio Using MRA and ANN in Water Distribution Networks. Water. 2018; 10(1):2. https://doi.org/10.3390/w10010002
Chicago/Turabian StyleJang, Dongwoo, and Gyewoon Choi. 2018. "Estimation of Non-Revenue Water Ratio Using MRA and ANN in Water Distribution Networks" Water 10, no. 1: 2. https://doi.org/10.3390/w10010002
Note that from the first issue of 2016, this journal uses article numbers instead of page numbers. See further details here.