Do As They Did: Peer Effects Explain Adoption of Conservation Agriculture in Malawi

1
Department of Environmental Studies, New York University, New York, NY 10003, USA
2
School of Environment and Sustainability, University of Michigan, Ann Arbor, MI 48109, USA
3
National Smallholder Farmers’ Association of Malawi, Lilongwe 3, Malawi
4
International Food Policy Research Institute, Washington, DC 20006, USA
*
Author to whom correspondence should be addressed.
Water 2018, 10(1), 51; https://doi.org/10.3390/w10010051
Submission received: 7 October 2017
/
Revised: 13 November 2017
/
Accepted: 17 November 2017
/
Published: 10 January 2018
(This article belongs to the Special Issue Soil Water Conservation: Dynamics and Impact)
Abstract
:Adoption of the trinity of practices known commonly today as conservation agriculture (CA)—maintaining soil cover, reducing tillage, and enhancing soil nitrogen through legumes—is a critical process to the management of erosion in rural landscapes, and maintenance of aquatic habitats and hydropower potential. However, the large literature on the benefits and risks of CA fails to find any universal determinants of adoption, with competing uses for crop residues, availability of labor, and access to physical inputs common constraints appearing in different contexts. We conduct a study in the specific context of Malawi, using ethnographic interviewing to draw out possible decision criteria and machine learning to identify their explanatory power. This study is structured to inform the question: “How do farmers decide to adopt the specific activities of CA in Malawi?” We find that more than any other factor, adoption by neighbors (i.e., peer effects) matters, with possible implications for the overall cost of encouraging CA (e.g., through subsidies) as it is taken up across a landscape. Further, we note that little else within our household survey (save for more detailed articulation of neighbor and neighborhood characteristics) offers greater explanatory power than those factors identified by farmers themselves. Finally, we note that decisions made in the presence of an incentive are structurally different than those made without incentives, validating previous concerns in the literature regarding the basis most CA adoption studies, within CA promotion interventions.
1. Introduction
Careful management of erosion is critical to maintaining aquatic habitat and long-term hydropower potential in the Shire River Basin of Malawi [1]. As a means to reduce sediment loads to the Shire Basin system, the Government of Malawi encourages adoption of conservation agriculture (CA), a trinity of agricultural practices that, while taking various forms across the globe [2], generally encourages farmers to avoid tilling soil, to keep soil covered with mulch or cover crops, and to introduce a (usually nitrogen-fixing) intercrop or rotation. In Malawi, CA is written into the country’s Agricultural Sector Wide Approach (ASWAp) as (i) crop residue mulching (CR); (ii) zero tillage (ZT); and (iii) legume intercropping or rotation (IC) [3]. Several different approaches to financing incentives for CA adoption are under design and evaluation in Malawi, including the UNDP’s Green Water Credit Scheme [4] and a private trust for promoting CA in riparian micro-catchments developed by the MCC [5]. The role of CA in reducing sediment loading to surface waters is fairly well characterized in the literature at around 65% [6,7], but the calculus of adoption for households (e.g., constraints and net benefits) is much murkier, highlighting the need for context-specific assessments. In the current study we present a method for allowing farmers themselves to provide key criteria in their decisions to adopt or not, and evaluate the importance of these criteria in a large-n study.
Examination of the factors shaping uptake and diffusion of CA, which is acknowledged across Southern Africa to be generally low overall [8], is an area of active research [9,10,11,12]. So far, the findings can be well described as “mixed”; in the words of one research group reviewing this literature, “There are few if any universal variables that regularly explain the adoption of conservation agriculture” [13]. Giller (2009) notes, for example, that in many contexts, competing uses for crop residues, availability of labor, and access to physical inputs can restrict adoption of CA [14]. Pannell (2014) notes crop residues as well, pointing additionally to short-term yield gaps and farmers’ general aversion to uncertainty [15]. Although researchers frequently point to the competing uses for crop residues (e.g., animal fodder) as a constraint to the diffusion of CA [16,17], it is also observed that—for Malawi in particular—the low density of grazers makes this less likely to be a constraint [17]. Summarizing the challenge of understanding and encouraging CA adoption, we suggest that various factors including costs, agronomic knowledge, and production risks in the early stages of CA adoption discourage farmers from sustained adoption of CA, misaligning their actions with the longer-term needs of their communities.
Andersson and D’Souza (2014) note that many of the studies within this literature are conducted in the context of an intervention promoting CA, so their results are largely limited to revealing “general characteristics of CA (component) adopters, rather than revealing farmers’ resource allocation strategies that underpin adoption and non-adoption” [17]. The present study also examines CA from within the context of an intervention promoting CA, and it also employs tools to compare decision-making across both our treatment and control groups in order to look more closely at the structure of CA adoption decisions and how they are shaped by the presence of incentives. That is, our study design allows us to look at whether incentives re-organize decision-making in a meaningful way, such that different factors matter, which might offer some explanation as to why there is little clear consistency across different contexts in terms of which factors shape adoption.
Specifically, we draw from the ethnographic decision tree modeling (EDTM) work pioneered by Christina Gladwin (in Malawi, largely) in the 1980s and conduct interviews in which key points in respondents’ decision processes (specifically those pertaining to farmers’ decisions to adopt each of the three constituent practices of CA) are identified and articulated, and subsequently applied to construct classification trees whose terminal nodes best classify the order of factors that affect the decision taken by participants [18]. This technique has enjoyed continued use through recent decades with continued application to agricultural decisions, such as farm planning [19] and weed management [20], as well as in other contexts, such as counselling psychology [21]. By asking farmers directly about how they make decisions, as compared to traditional models where researchers provide potentially relevant variables a priori as is the case in household surveys, we are better able to capture and characterize the issues that matter most to farmers. Our study contributes and expands this methodology by combining ethnographic methods with machine learning, which can more efficiently determine decision trees and discover complex structures that were not specified in advance [22]. Bootstrap aggregating (or bagging) is a popular ensemble learning method for statistical classification. Compared with other meta-algorithms for data classification, bagging has been shown to be a stable, accurate, and easy-to-implement algorithm for data classification [23]. Bagging generates multiple versions of a predictor and then uses model averaging to arrive at an aggregated predictor. In our study, we depart from the typical small-n approach to building trees by re-applying our identified key decision criteria in a large-n endline survey. This allows us (i) to make use of machine learning tools (specifically the random forest and bootstrap aggregation algorithms) to identify structure in farmer decision-making; (ii) to examine the explanatory power of farmer-identified factors for the adoption of CA alongside that of other sets of variables commonly solicited in a household survey; and (iii) to compare differences in decision structure across groups who have (treatment) and have not (control) been offered incentives to adopt CA.
This study is structured to inform the question: “How do farmers decide to adopt the specific activities of CA?” Within this broader question, we also wish to understand how decisions to adopt each of the different practices may differ, and how these decisions may differ in the presence of an incentive, with the goal of informing the behavioral response side of potential soil and water conservation programs. Through our novel integration of ethnography and machine learning, we find that more than any other factor, adoption by neighbors (i.e., peer effects) matters, with possible implications for the overall cost of encouraging CA (e.g., through subsidies) as it is taken up across a landscape. Further, we note that little else within our household survey (save for more detailed articulation of neighbor and neighborhood characteristics) offers greater explanatory power than those factors identified by farmers themselves. Finally, we note that decisions made in the presence of an incentive are structurally different than those made without incentives, validating previous concerns in the literature regarding the basis most CA adoption studies, within CA promotion interventions.
2. Materials and Methods
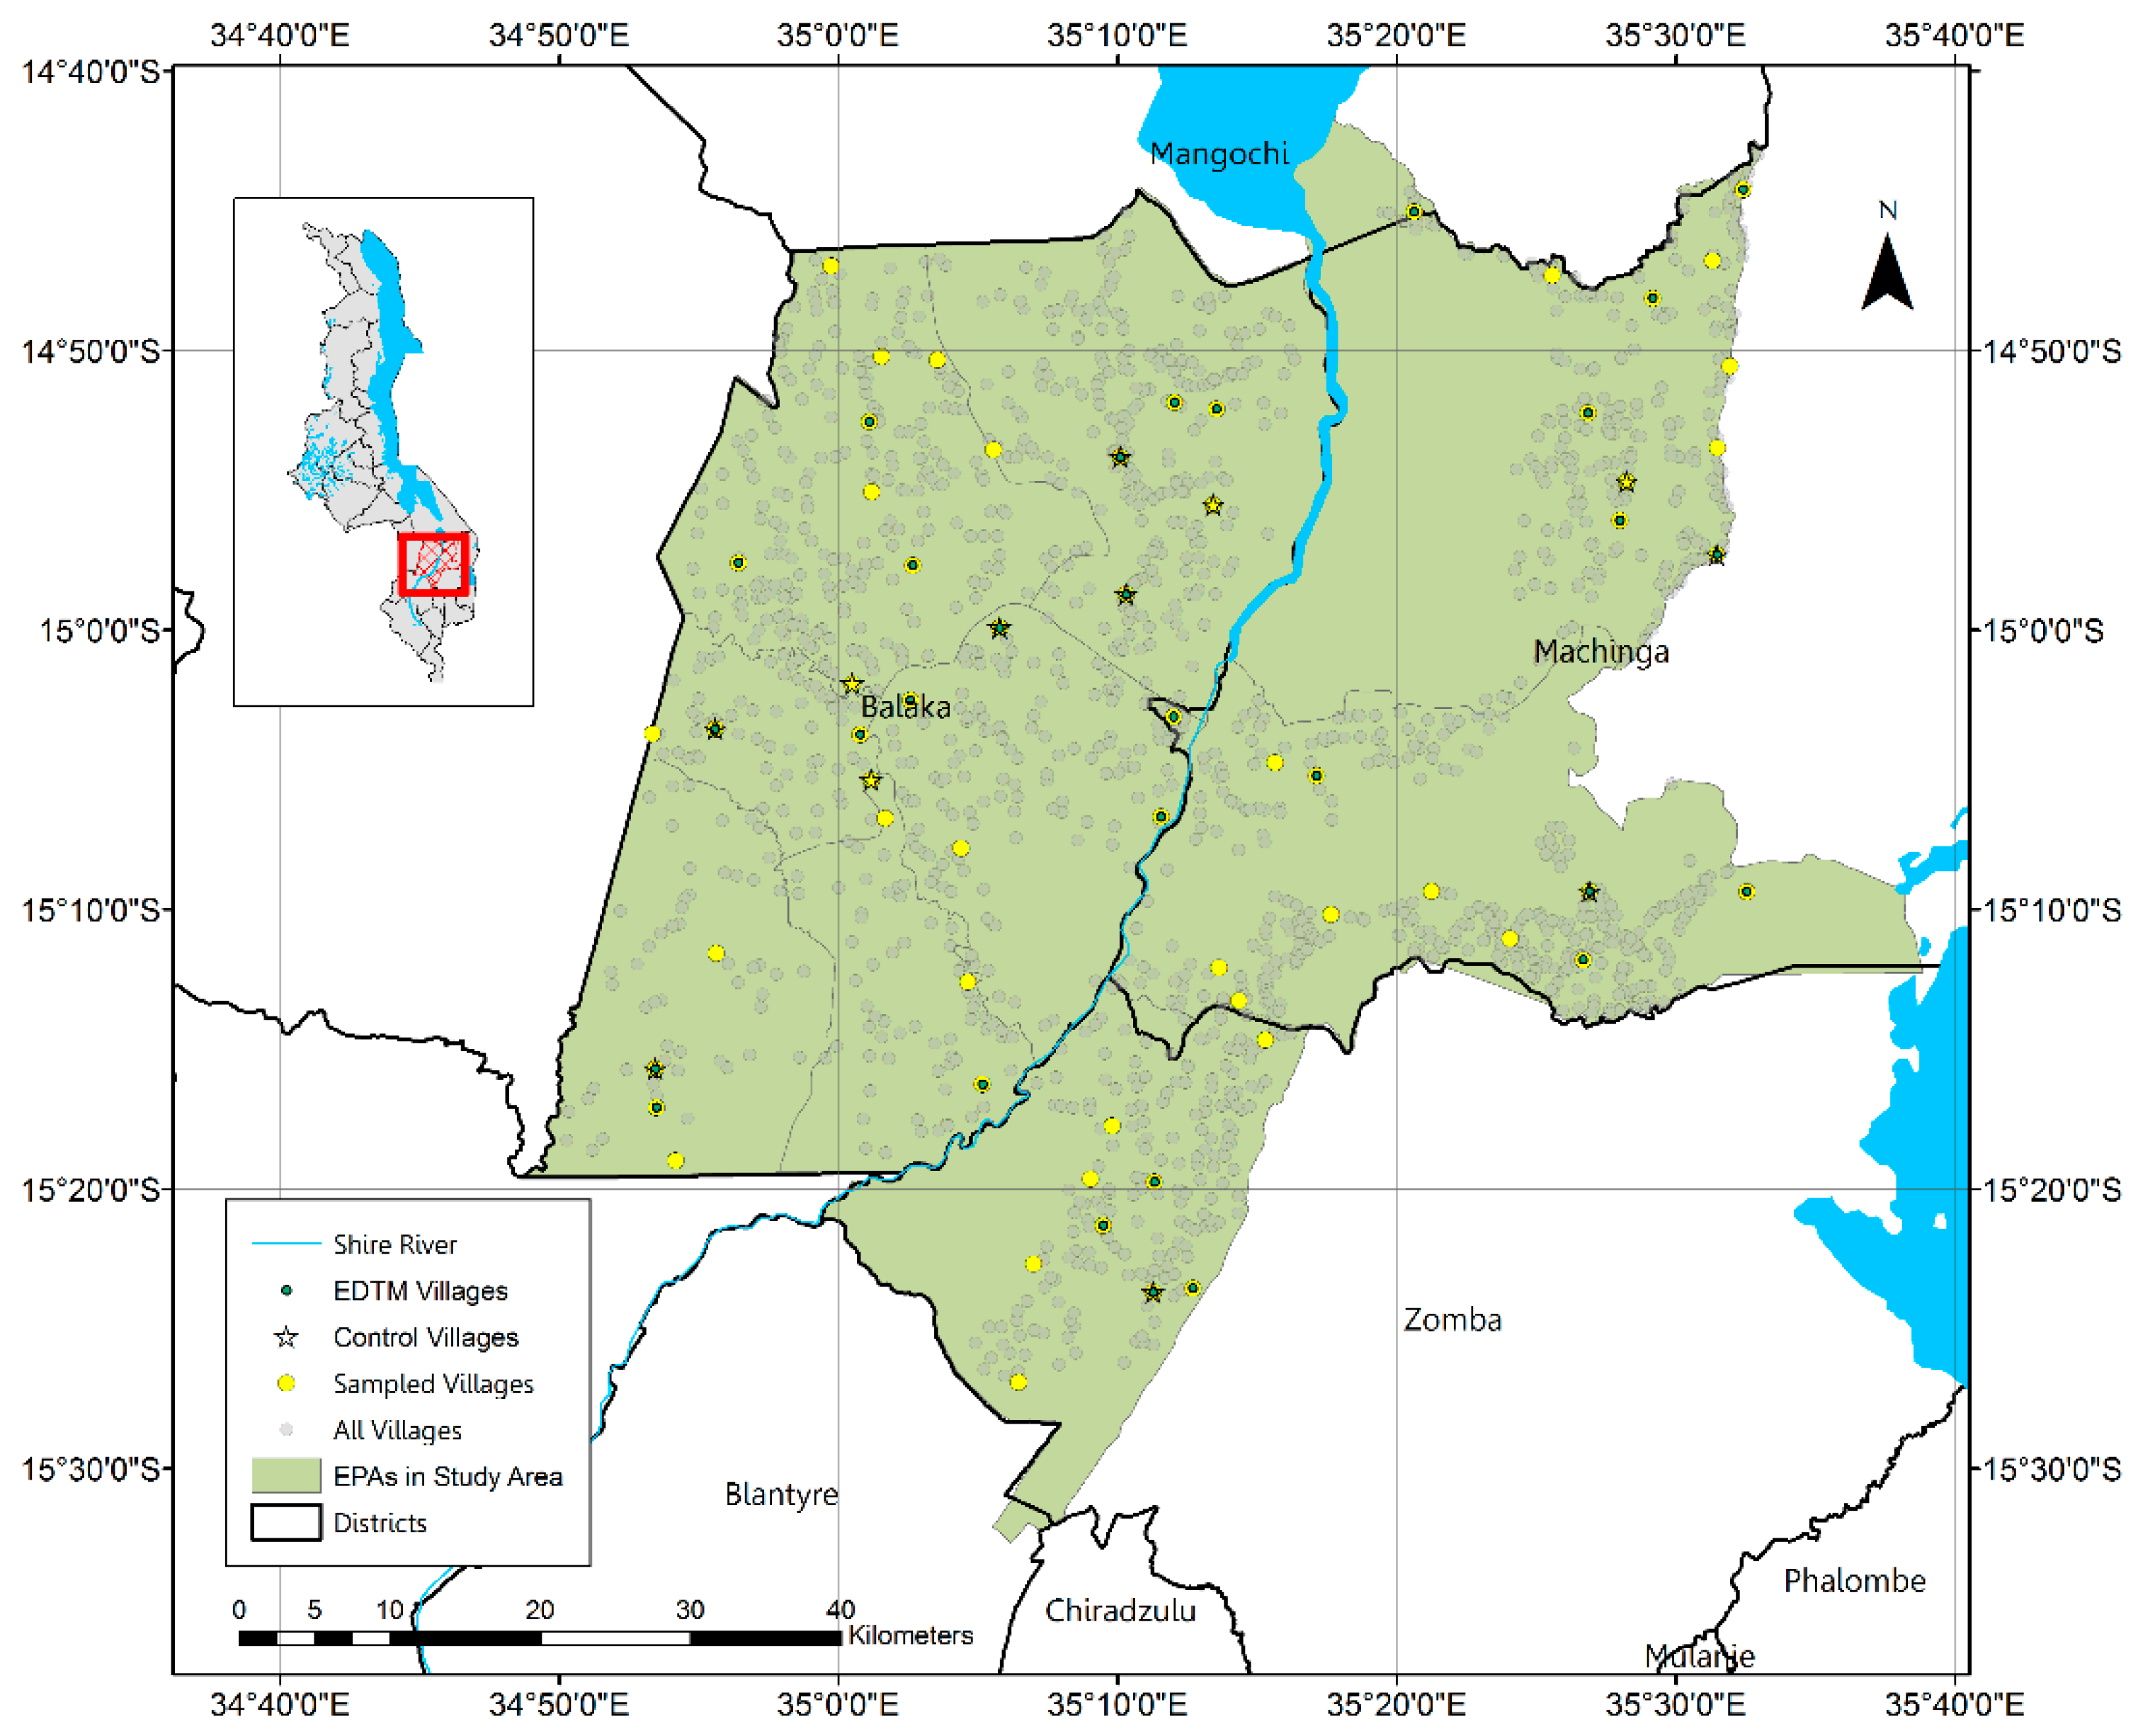
Our primary data collection occurred via two activities within a larger project evaluating the impact of different incentive structures [24] on the adoption of the three practices of conservation agriculture in the Shire River Basin, Malawi. This larger project includes a random sample of 63 villages selected from the pooled sampling frame of the 5 extension planning areas (EPAs) riparian to the upper Shire River Basin, including Balaka and Machinga districts and a portion of Zomba district (Figure 1). The work presented in the current paper does not draw on distinctions across treatments, and rather focuses on the aggregate effect of having been offered an incentive or not, but the interested reader is directed to [25] or to Appendix A for further details on project design. The two activities whose data we draw on in the current study include a small-n ethnographic exercise (n = 96 respondents) conducted in a selection of project villages between the end of the intervention and the endline study, as well as a survey module within the project’s endline study (n = 1923 respondents).
The ethnographic exercise drew a clustered, quota sample of participants from within the larger project’s sample. Specifically, we visited a random selection of 8 of the 12 control villages and 24 of the 48 treatment villages, and in each village identified three participants for interviews: one who was practicing intercropping/rotation (irrespective of whether they also practiced zero tillage or mulching); one who was practicing zero tillage or mulching (irrespective of whether they practiced intercropping/rotation); and one participant who was practicing none of these three CA practices. Following the method of ethnographic decision tree modeling (EDTM) of [18], our team of interviewers from the National Smallholder Farmers’ Association of Malawi (NASFAM) conducted face-to-face interviews with 96 participants to probe for key factors shaping the decision whether to adopt the three constituent practices of CA. Coding of the interviews yielded 26 unique criteria from across the set of interviews (summarized in our results section as Table 1). In the traditional EDTM espoused by [18], these decision criteria would be used to manually construct decision trees that could then be quantitatively analyzed to assess the predictive accuracy of the decision tree. In our analysis, we departed from Gladwin’s method in two distinct ways. First, rather than construct decision trees from this relatively small sample of 96 interviews, we instead leveraged the knowledge gleaned from these interviews to design a household survey module (consisting of a series of binary response items) to be included in the larger project’s endline survey (n = 1923 respondents). Additionally, for each item we added a follow-up question that asked explicitly whether the respondent believed that factor had shaped their choice to adopt or not any of the three CA practices. Second, rather than constructing the decision trees manually based on the ethnographic interviews, we applied machine learning tools to this large-n dataset (from the endline survey) to identify structure in farmers’ decision-making using decision trees (and forests) as described below.
We used the TreeBagger package in Matlab’s Machine Learning Toolbox to train a “forest” of 100 classification trees to predict farmers’ adoption of each of the three CA practices using data from the EDTM module, separately for both (i) responses from respondents in control villages (hereafter, “control”) and (ii) responses from respondents in treatment villages (hereafter, “treatment”). Each forest is generated using 10-fold cross validation, meaning that the available data are sliced into 10 parts, with a part excluded from a set of trees trained on the remaining nine parts, and repeated 10 times. The trained trees are then validated on the excluded part, generating an estimate of “out of bag” (OOB) prediction error. TreeBagger also generates an estimate of predictor importance, by estimating the relative OOB prediction error when individual predictors are excluded from the trees. To compare the predictive capacity of the EDTM module with that of other survey modules common to household surveys, we incorporated other modules from the endline survey (treatment characteristics, household characteristics, neighborhood characteristics, farm characteristics, and risk perceptions; a list of included items as well as our complete Android ODK protocol is attached as supplementary information) and repeated the above TreeBagger exercise, giving us estimates of predictor importance as well as average prediction error for forests of trees (and predictors within them) built from pooling the EDTM module with these additional modules.
Following this exercise, we selected “best fit” trees for each case by identifying the tree structure that minimized OOB prediction error, using the fitctree.m and cvloss.m functions in the Machine Learning Toolbox and following Matlab’s “Classification” example [26]. There are several options for selecting a best fit, with MathWorks suggesting both (i) choosing the tree that gives an absolute minimum in prediction error (without considering tree complexity) and (ii) finding an optimum that identifies the simplest tree structure whose OOB prediction error is within one standard error of the absolute minimum; we select the latter approach for selecting trees.
3. Results
3.1. Key Decision Criteria and Perceived Relevance
We identified 26 different criteria from our ethnographic interviews that farmers mentioned as shaping their decisions to adopt any of the agricultural practices within CA; these are summarized in Table 1 in the question form through which they were verified in return interviews and included in our endline survey. These criteria span a range of different factors, and we have tagged them (for organization and visualization only) based on our judgments as belonging to social, physical environment, climatic, economic, risk perception, and governance themes. In-depth descriptions of these criteria, along with supporting quotations from ethnographic interviews, are included as Appendix B.
We asked respondents in our endline survey about each of the 26 decision criteria (Table 1), and whether they felt that particular criteria influenced their decisions regarding each of the three CA practices individually. The endline survey encompassed 1923 respondents, in which 1669 (87 percent) respondents reported practicing intercropping, 961 (50 percent) reported practicing crop residue mulching, and 750 (39 percent) reported practicing zero tillage; 535 (28 percent) respondents reported practicing all three. In general, respondents reported that the choice to intercrop was based on economic motivations such as improving yields or reducing the risk of food insecurity (in the case of intercropping) or economic constraints such as the limited availability of inputs (in the case of mulching residues and practicing zero tillage). In addition to these economic factors, the decision(s) to mulch crop residues and practice zero tillage were also influenced by the environmental conditions of their agricultural land (Table 1).
Specifically, farmers identified that their decision of whether to intercrop was based on their perception that they would have more crops to consume (661) or to sell (623), indicating that people intercrop because they think it will increase their total output. Similarly, whether there was a market for the crop was an identified decision criterion (540). In addition to market forces, farmers were influenced to do intercropping in order to mitigate risks to yields like crop failure (469), planting delays (173), and concerns of pests whether insect (149) or other animals (118).
Farmers most often explained their choice of whether to retain crop residues in terms of the inputs required like sufficient access to crop residues (831) and sufficient labor to apply them (226). They also explained that they were influenced by the competing benefits and drawbacks of crop residue application. Farmers may be influenced to adopt crop residues because they are concerned with weed growth (251), which can be stifled with crop residue application and of soil moisture (206). However, they also may be discouraged from adopting it since they are concerned with increased insect pests (217), which may increase when residues are transferred across fields.
Farmers indicated that their choice to adopt zero tillage was influenced (either positively or negatively) by the conditions of their plots like if they had soil erosion problems (123), waterlogging issues (111), which are associated with hard pans (164)—a condition of the soil that makes it compact and more difficult for plant roots to establish. Farmers were also influenced by their concern of weed growth (219) and if they could buy herbicide (187) to address it.
In sum, across our ethnographic surveys and in the perceptions reported by respondents in our endline survey, different factors shape decisions for the different CA practices. In particular, farmers link the decision to intercrop most commonly with crop performance and market opportunities, while they link the decisions for zero tillage and crop residue mulching more commonly with physical constraints such as access to residues, labor constraints, and weed issues. Our next analyses draw on machine learning tools to examine whether these same reported factors also help to predict adoption within our sample.
3.2. Random Forest Results
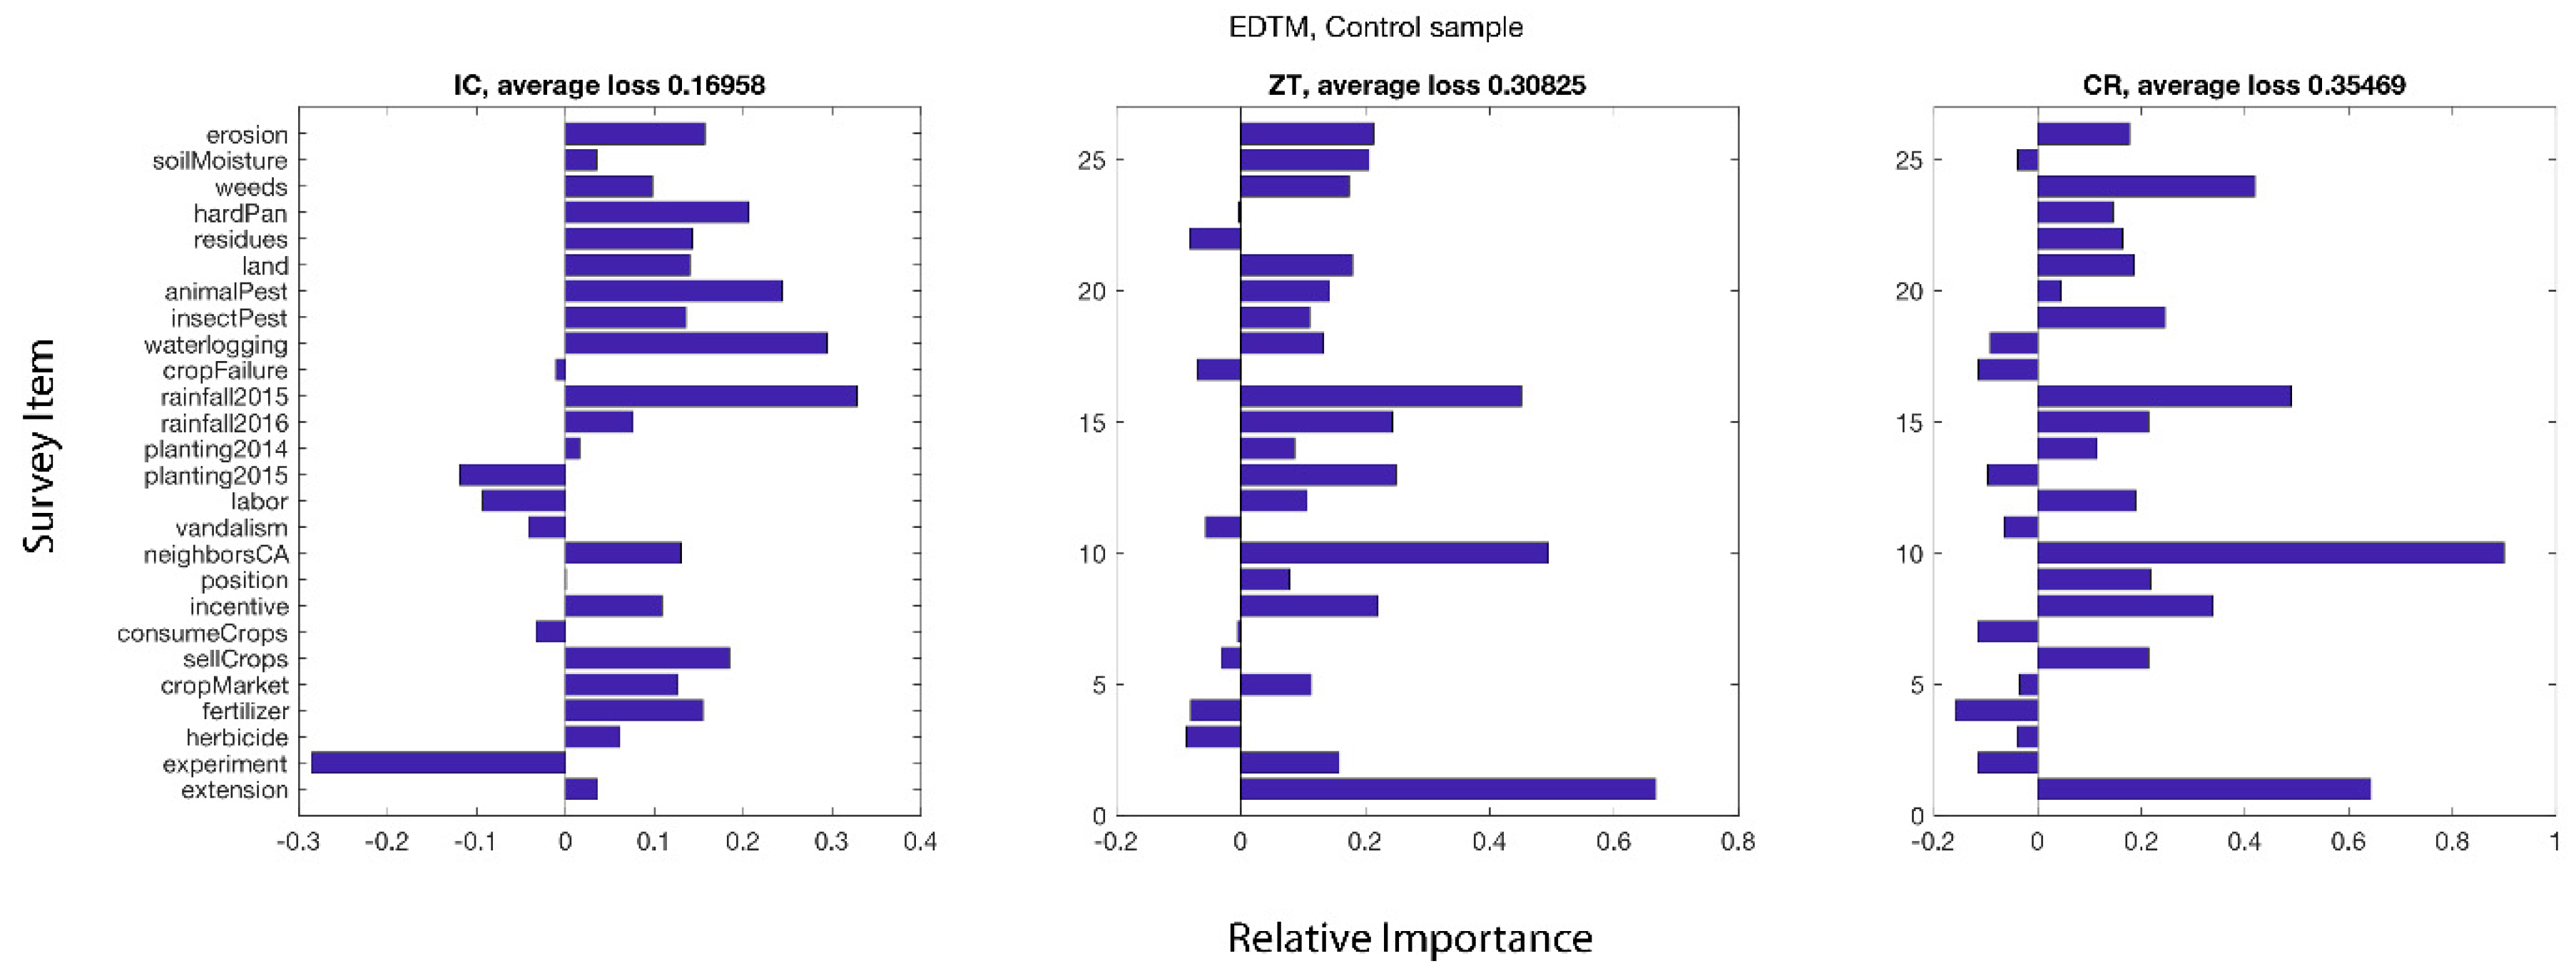
We analyzed “forests” of classification trees trained on the dataset of adoption decisions and the 26 criteria from Table 1, and found that the variables that explain the most variation in farmers’ choices to adopt were different than what farmers self-reported (Figure 2 and Figure 3). Additionally, the factors that influenced farmers’ decisions to adopt intercropping were different between control and treatment groups. However, the decision criteria for applying crop residues and zero tillage were similar for each activity and between treatment and control groups.
In ensemble predictions for the control samples, the choice to intercrop was driven by a number of variables, but the top decision criterion was concern about soil erosion (Figure 2), along with the perception that there would be a market and the ability to sell the leguminous crop, or that they could be consumed by the household. The choice to do intercropping within the treatment group was also driven by market factors, as well as concerns about pests, and the ability to purchase herbicides.
The ensemble predictions for the decision to adopt crop residues were generally most influenced by whether people had been exposed to the practice. In control groups people were most influenced by whether their neighbors did it and if they had access to extension and, to a lesser extent, whether they were concerned with weed growth. The main factor for applying crop residues for the treatment group was the monetary incentive, along with whether they had exposure to it either through extension or if their neighbors did it, and also if crop residues were available to them.
Similar to crop residue application, the decision to do zero tillage, in both control and treatment groups, was driven by whether or not people had exposure to it. In the control group people adopted zero tillage when they had access to extension or if their neighbors did it. To a lesser extent, people in the control group were influenced by whether there was sufficient rain in the previous year. Those in the treatment group were most influenced by whether their neighbors did zero tillage (Figure 3). To a much lesser extent the treatment group was also influenced by the monetary incentive and whether they had access to residues.
3.3. Expanded Ensemble Predictions
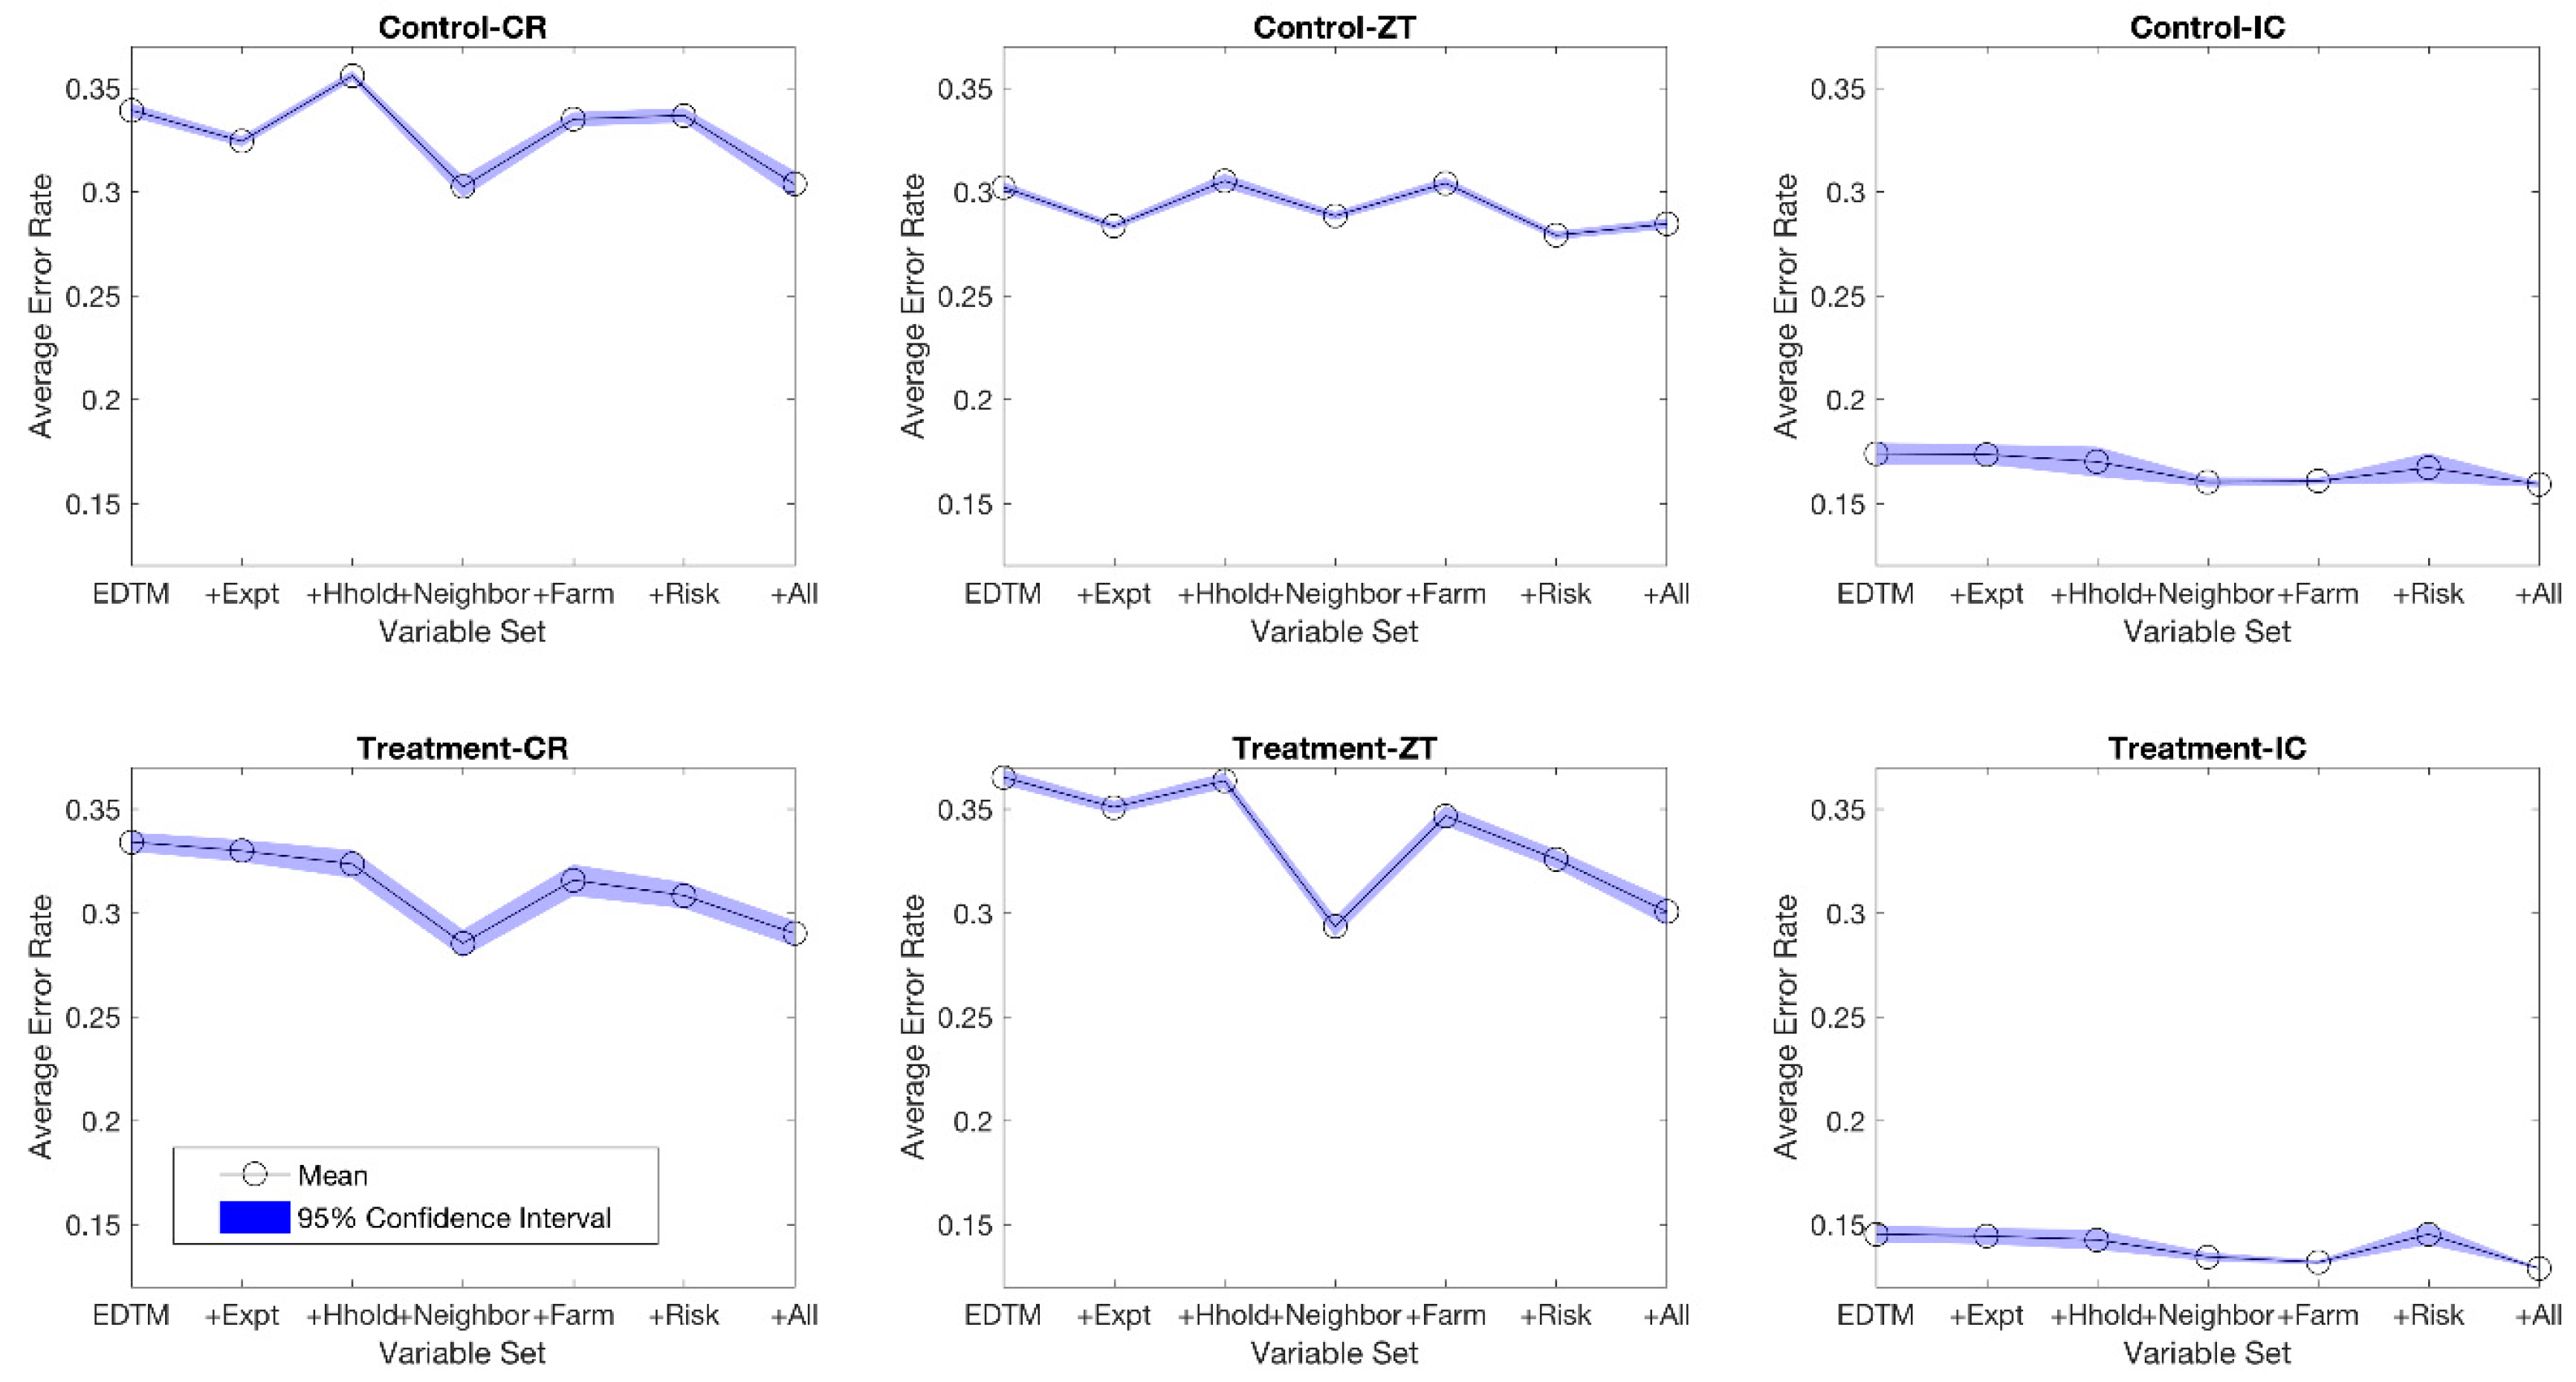
As a means of comparing how well the set of criteria outlined by farmers (in the EDTM module) performed as predictors relative to the kinds of variables commonly identified in standard agricultural household surveys, we trained additional forests using the EDTM module, plus one of the following sets of variables also included in our endline survey: treatment characteristics, household characteristics, neighborhood characteristics, farm characteristics, and risk perceptions (list of survey items included in these modules, along with full survey protocol, is included as supplementary information). Additionally, we trained one final forest on the combined set of all modules.
Prediction error is reduced in most cases by inclusion of neighborhood characteristics; inclusion of risk variables offers some improvement to explaining crop residue mulching and zero tillage in the treatment group; inclusion of farm characteristics improves prediction of IC in both the treatment and control groups. It is notable that the module with the greatest additional impact on prediction, neighborhood characteristics, is captured coarsely by the EDTM module (“Do any of your neighbors practice …”); and it is possible that more detailed probing of this topic in the interviews may have yielded additional criteria to capture the variability explained by the neighborhood module. Additional points to draw from Figure 4, reinforcing the message from other results in this study are that (i) the prediction of intercropping and the factors that improve prediction of intercropping are distinct from those which predict crop residue mulching and zero tillage and (ii) the factors that improve prediction in the treatment group appear to be different from those that improve prediction in the control group. Finally, it is noteworthy that in most cases, the reduction in prediction error with additional modules is modest, highlighting that the criteria outlined by farmers themselves were able to explain variability in adoption nearly as well as would the items in a larger household survey.
3.4. Decision Tree Results
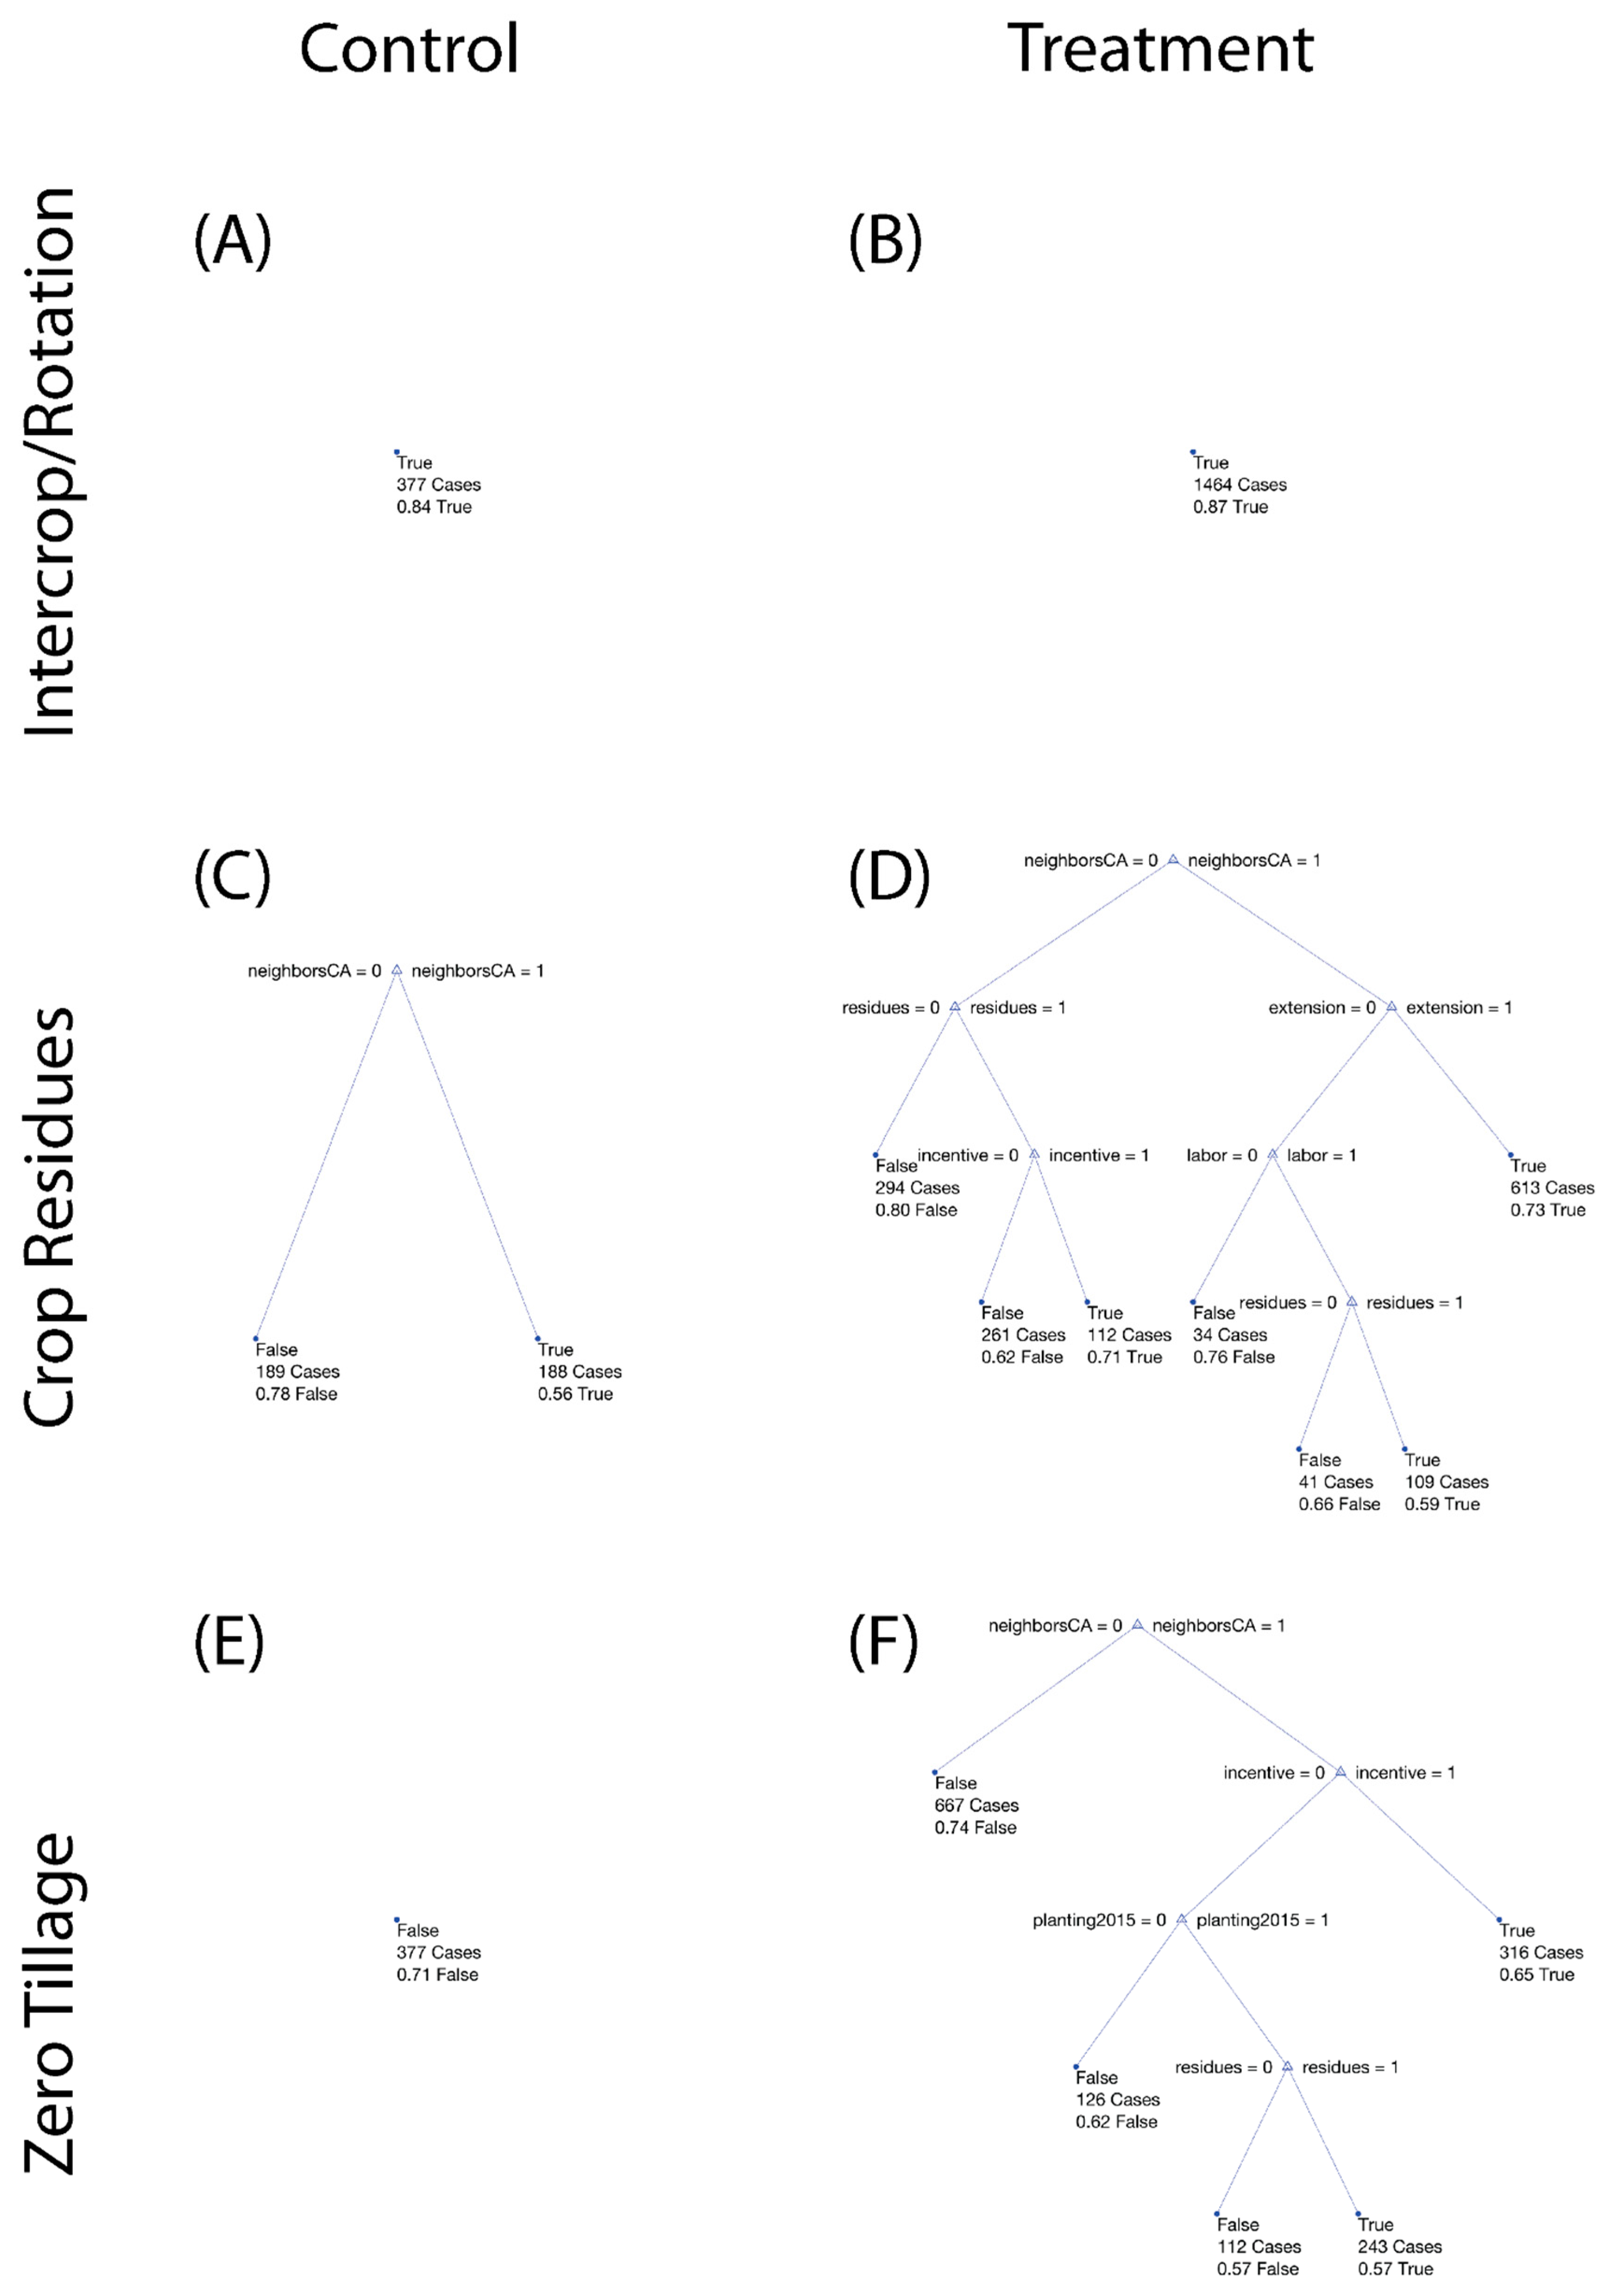
Finally, we present individual trees for each of the three practices across treatment and control (Figure 5), whose structure was selected as optimal (the simplest tree structure whose cross-validation prediction error falls within one standard error of the minimum prediction error across all trees—see Methods). Once again, the decision trees for each of the CA activities are different, which indicates that farmers use different decision criteria when deciding to do a particular CA practice. In addition, the availability of an incentive changes the way farmers structure decisions to adopt CA. In the case of intercropping, for both treatment and control groups, there is no decision “tree,” in large part because rates of intercropping are simply very high across both samples (>80%) and there are no variables that improve upon the simple prediction that a farmer will intercrop.
The choice to apply crop residues is best explained in the dataset by whether or not one’s neighbor does it, regardless of treatment. Within the control group the decision is straightforward: if your neighbors apply cover crops, you likely will too and if they do not, you likely will not. The treatment group is similar in that if your neighbors are doing it, you likely will too, but there are additional factors that explain variability. Where their neighbors are not mulching residues, farmers in treatment villages who have residues and are offered an incentive are likely to adopt as well. For those in treatment villages whose neighbors are practicing zero tillage, but who have not received extension training on zero tillage, a lack of labor or a lack of residues are the key things that keep them from also adopting. Interestingly, the presence of neighbors practicing mulching makes the availability of residues a much lower-order factor than when such role models are absent.
Like the case for intercropping, there is no decision “tree” for farmers to adopt zero tillage in the control group. Most simply do not do zero tillage (>70%); and of those that are doing it, their decision criteria are not held enough in common to structure a tree. The tree for the treatment group is more complex, and like the decision to apply crop residues, is most strongly influenced by neighbors’ practices. Those whose neighbors have not adopted, most likely will also not adopt. Those whose neighbors have adopted and who were offered an incentive most likely will also adopt. Where farmers have neighbors who have adopted and were not offered an incentive are more likely to adopt if the last year’s planting went as planned and if they feel they have available crop residues for residue mulching. Though of minor importance to the zero tillage decision, the presence of crop residues in this tree supports the idea that these two decisions are linked.
As a last note on the importance of neighbors, we note that the importance of neighbors transcends both the availability of an incentive (i.e., neighbors matter in both control and treatment groups) as well as the structure of incentive. The “neighbors CA” variable remains the most important (top node) variable in the optimal trees for adoption of crop residues and zero tillage in the data subsets for both payment structures offered in our main intervention (standard subsidy, and agglomeration payment; see Methods) (additional trees included as supplementary information). As outlined in the Methods section, the “agglomeration payment” structure offers bonuses to adoptees whose neighbors also adopt, creating a network externality in which neighborhood adoption should matter [26]. Our analysis in the current paper does not focus on the agglomeration payment directly but only on the broader effect of having been offered an incentive. However, the importance of the neighbor effect across all treatments as well as the control highlights that there are clear peer effects latent in the system that incentives like the agglomeration payment can be designed to harness.
4. Discussion
We have presented results from two data collection efforts: (i) a set of ethnographic interviews in which respondents identified a set of key criteria shaping their decisions to adopt the different practices that comprise conservation agriculture (CA), and (ii) a large-scale endline survey in which farmers from both treatment and control villages were asked to report on these same criteria, as well as the role they perceived them to have in their CA decision-making. In our analysis we examined farmers’ own perceptions of which factors shaped their decision-making; which factors better explained variability in adoption of CA within the sample; and how the set of factors identified by farmers themselves compared with other common household survey items in predicting adoption.
Most notably the set of factors explaining adoption of intercropping differs sharply from the factors that explain adoption of zero tillage or crop residue mulching (between which there is much overlap), a finding that is consistent across both the farmers’ perceived factors of importance, as well as the factors identified as important by our random forest approach. This finding supports the findings of [27], who characterized the adoption of CA not as one decision nor three but closer to two; one regards intercropping and a second regards the mulching of crop residues over (generally) untilled soil. The second finding of interest is that the set of factors emerging as important, as perceived by the farmers, is different from the set of factors identified as important within the decision tree and random forest approaches (i.e., explaining variation in adoption within the dataset).
More specifically, variation in adoption of zero tillage and crop residue mulching is explained by a small number of variables, most notably adoption by neighbors and the presence of incentives. Though adoption by neighbors emerged as perhaps the most important factor in shaping adoption, it was perceived by only a handful of respondents as having shaped their decisions (2–3%; Table 1). At least in the case of crop residue mulching, early adopters might feel otherwise; one interviewee noted, “People used to laugh at us when we adopted ground cover, but now the same people are coming to me asking for assistance on how they can also do it”.
A unique element of our study is that we examined the structure of decision-making across farmers both inside and outside of an intervention. Our decision tree analysis demonstrated that, while neighbor effects seem to matter both inside and outside the intervention, decisions on CA practices within the treatment may be structured differently. That is, variation in adoption by members of the treatment group could be better explained (in terms of cross-validated errors) by additional factors such as the presence of incentives and access to factors such as crop residues, extension, and labor, while variation in adoption within the control group could not. One implication of the appearance of crop residues in the trees for both zero tillage and crop residue mulching is that access to sufficient crop residues may be a key entry point to shifting adoption of both CA practices.
Implications for Programmatic Soil and Water Conservation
Our analysis shows that, within our sample and timeframe, neighbors and incentives emerge as the key factors shaping adoption. An implication of this is that in the absence of neighbors as role models, incentives are likely necessary to encourage initial adopters in a region. However, the importance of neighbors in our results suggests that once some adoption has been achieved, further adoption may be more likely, rather than less. Additionally, the incentives necessary to encourage further adoption may be lower (rather than higher), as farmers need less of an encouragement to follow in the footsteps of their peers. Though the role of peer effects to encourage adoption and diffusion is nothing new [28], it is by no means universal, nor are there generally universal factors shaping adoption in CA contexts [13]. Identifying neighbors’ adoption as a clear driver of new adoption in the Shire Basin context has clear application in the design of new research and development programs in the region aimed at improving livelihoods, landscapes, and water systems. We mean to suggest that, based on our findings in this paper, the CA adoption problem may have a tipping point (beyond which further adoption is self-reinforcing as people observe their neighbors also adopting). This kind of system behavior supports the argument that payments need to be high upfront, but may not need to stay that way—as neighbors adopt, and as the private benefits of CA accrue to the adopter (reduced input costs, improved soil structure yields, etc.), payments can be phased out. In the sustainable land management context, demonstrated reduction in sedimentation could even provide the basis for payments for ecosystem services (PES) program [29,30], with a direct beneficiary willing to take over any provision of encouragement. Though adoption of CA is generally low across Southern Africa [8], we suggest the importance of research that identifies landscapes within the region where CA adoption is comparatively high, in order to better test the potential for tipping point behavior in the addressing the challenge of land degradation.
Supplementary Materials
The following are available online at www.mdpi.com/2073-4441/10/1/51, Spreadsheet S1: Item list and Survey Protocol; Binder S1: Additional Classification Trees.
Acknowledgments
This work is part of the project entitled Agglomeration Payments for Catchment Conservation in Malawi–NE/L001624/1, which is partly funded with support from the Ecosystem Services for Poverty Alleviation (ESPA) program. The ESPA program is funded by the Department for International Development, the Economic and Social Research Council, and the Natural Environment Research Council. This work was further supported through a grant from the Feed the Future Innovation Lab for Collaborative Research on Assets and Market Access, funded by the United States Agency for International Development. Additional support was provided by the CGIAR Research Program on Policies, Institutions, and Markets (PIM), led by IFPRI.
Author Contributions
A.R.B., J.Z.C., and P.S.W. conceived and designed the experiments; F.M. performed the experiments; A.R.B., J.Z.C. and F.M. analyzed the data; A.R.B., J.Z.C., F.M. and P.S.W. wrote the paper.
Conflicts of Interest
The authors declare no conflict of interest. The founding sponsors had no role in the design of the study; in the collection, analyses, or interpretation of data; in the writing of the manuscript, and in the decision to publish the results.
Appendix A. Description of Methods in Larger Project Intervention
Our primary data collection occurred via two activities within a larger project evaluating the impact of different incentive structures on the adoption of the three practices of conservation agriculture in the Shire River Basin, Malawi. This larger project includes a random sample of 63 villages selected from the pooled sampling frame of the 5 extension planning areas (EPAs) riparian to the upper Shire River Basin, including Balaka and Machinga districts and a portion of Zomba district (Figure 1). The sample was originally designed as 12 control villages and 48 treatment villages—6 treatments each with 8 villages—with 3 additional villages added incidentally as intervention teams visited accidentally visited villages close to the true sampled village with similar names. The project collected baseline data from a clustered sample of 30 households in each of the sampled villages; implemented a two-year, opt-in intervention at the village level in each of the 48 treatment villages (plus the 3 accidental inclusions); followed by an endline panel survey with respondents from the baseline survey, adding in additional households from the original sampling frame to replace households that had left the village or were otherwise unable or unwilling to participate. With additional villages and new responses to account for attrition, our final endline survey was given to 1923 respondents.
The interventions in each village varied in structure, following a 2 × 3 design of (i) payment structure and (ii) monitoring level. Payments took one of two structures—a standard subsidy, and an “agglomeration payment” [22], which included a smaller standard subsidy along with bonus payments given for participation by neighboring farmers. All payments were calibrated to have a value on the order of 30 USD per acre (up to a maximum of one acre, in increments of 0.1 acres) for complete adoption of all three CA practices. Monitoring levels varied from (i) high (all participants); (ii) reduced (half of participants); to (iii) low (no participants). In “high” monitoring treatments, all registered plots were visited at the end of the season to verify compliance, while in “reduced” monitoring treatments, a random selection of half of the participants had a plot visit while others merely self-reported. In “low” monitoring treatments, all participants self-reported.
Appendix B. Ethnographic Results—Thick Descriptions
We identified 26 different criteria from our ethnographic interviews that farmers mentioned as shaping their decisions to adopt any of the agricultural practices within CA; these are summarized in Table 1 in the main paper, in the question form through which they were verified in return interviews and included in our endline survey. The reasoning behind the adoption (or not) of each of the three practices differs, and in the text below we draw supporting quotations from our interviews to provide a thicker description of farmer thinking than is provided by Table 1. Across our 96 interviews, 73 respondents (76 percent) reported practicing intercropping (or leguminous crop rotations), 56 (58 percent) reported mulching crop residues, and 23 (24 percent) reported practicing zero tillage; only 12 (13 percent) practiced all three.
Appendix B.1. Intercropping
Farmers reported choosing to intercrop because they believed that it would increase their food supplies and incomes through mitigating the risk of crop failure and by maximizing the number of crops planted, especially when land is limited. Farmers also reported choosing to intercrop because it improved their food security through increasing the amount and diversity of food that they could access. Lastly, people adopted intercropping because they thought it would improve their soil fertility, which would lead to improved yields and profits.
Some farmers viewed intercropping as a strategy to reduce the potentially negative impacts of drought and flooding that could lead to crop failure, which could result in both food insecurity and income loss. An adopter explains, “When we plant maize with pigeon peas and the maize does not do well, we are able to sell the pigeon peas and buy maize”. Another adopter emphasized how intercropping (though not of a legume) allowed her to overcome a climatic shock: “If it were not for sorghum, I would have died from hunger as my maize crop was washed away by floods”. Not only did people intercrop to buffer against risks, they did so to increase their yields. Many farmers attribute their decision to intercrop to seeing that their neighbors harvest higher yields and even bumper harvests. Increased yields can improve food security through increasing the amount of food produced, expanding dietary diversity, and increasing income (e.g., through sales of marketable surpluses). An adopter explained, “Low maize yields prompted me to start intercropping maize with cowpeas, so that I have food and can also sell”. Also, an adopter explained how intercropping leads to more dietary diversity, “When we plant maize, cowpeas and pigeon peas and it is time to harvest, we have more food. It is like we have planted both food and relish”.
Farmers also adopted intercropping in order to maximize the use of their limited space and increase income. Another respondent elucidates, “Since my piece of land is small, I have always been forced to practice intercropping so that I can harvest more crops on this small piece of land”. Another furthers that intercropping can be profitable: “I plan to continue growing maize with pigeon peas because the pigeon peas are bringing me money after selling”. Farmers also consider that intercropping will lead to future improved yields by improving soil fertility. A respondent explains, “I realized that there was rampant soil degradation and felt the need to intercrop the maize with legumes to improve the fertility of the soil”. Another farmer adds, “The leaves of the pigeon pea plants shed off and improve the fertility of the soil so we obtain food ... and also income when we sell the pigeon pea”. Even though most farmers thought that intercropping would improve soil and yields, others explained that concerns about yield were why they did not adopt intercropping: “Planting more crops in the same field results in poor performance of maize, which is the main crop here”.
Appendix B.2. Crop Residues
Among farmers who mulched crop residues, the most commonly cited reasons were the perceived environmental benefits of retained soil moisture, improved soil fertility, and reduced soil erosion. People also mulched crop residues because of the reduced labor requirements (e.g., to remove stubble) and as a means of limiting termites, though some people think that crop residues can actually increase pest problems. Those who did not apply crop residues explained that the did not do so because they did not have the stalks, were concerned about arson, or did not have access to extension to learn how to do it.
These farmers often explain their primary reason for mulching residues as being improved soil moisture. A respondent explains, “In this type of farming, when I cover the field with maize stalks, even when rainfall is low, the crop does not wilt, it still grows and the harvest is good”. Also, another farmer adds the increasing important benefits of soil moisture: “I noticed some time back that climate was changing because we were receiving inconsistent rainfall. Therefore, I decided to use the husks to preserve moisture in the soil, which helps the crops to grow”. Farmers also explained that they adopted it because they thought it improved the soil quality. One said, “This ground cover helps to prevent loss of nutrients by reducing soil erosion when we have floods”. Another perceived benefit of retaining crop residues is the reduced labor inputs required. One farmer explained, “Before I started this type of farming, I used to face problems especially tilling of the field and I had to weed more than twice. However, now, I am able to rest and I simply go and remove the weeds by hand”. Some farmers were additionally persuaded to do cover cropping because they thought it would reduce termite damage. “Due to the prolonged dry spells, there was a termite attack but the damage was minimal as the pests were busy feeding on the ground cover”. Though others did not adopt it for the same reason. “Much as [ground cover] is good, the main challenge that I am facing is that termites tend to cut down the crops on the areas which I have put much covering materials”.
For those that do not adopt, the main reported reason was that they did not have access to inputs like maize stalks and others worried that applying maize stalks would increase the chances of arson on their property. A respondent explains, “For me to start, I will need organic manure and maize stalks”. Obtaining maize stalks can be difficult because they are also used as fodder for livestock. In some cases, farmers must choose between using them for livestock or improved soil moisture on their farm and, in other cases, there are few stalks left after it is consumed by livestock in the community. A farmer explains, “In this village there are some rich people who have cattle and these cattle destroy the materials I used for ground cover practice and other selfish young people just set fire on the ground cover materials, which discourages many people from practicing [it]”.
Appendix B.3. Zero Tillage
Farmers who adopted zero tillage (23 of 96 interviewees) reported that they chose to do so because they thought it would increase their yields and food security as well as improve soil health. Many people lamented that they were not able to adopt zero tillage because it required too much labor, they did not have the inputs required, and that there was little extension training on the zero tillage practice. At times, the choice to do zero tillage was associated with their willingness to apply crop residues, which is evidenced by people complaining that they could not do zero tillage because “they did not have enough maize stalks which are also needed for this type of farming”.
Farmers chose to adopt zero tillage after they were told by extension agents or saw from their neighbors that would be able to increase yields, especially when coupled with applying crop residues. “At first I was only trying the practice after the extension agent told me about this ground cover farming, but now I have seen the yields have improved and I plan on increase the land under this practice”. Part of the reason that farmers adopted this practice was because they recognized the potential benefit of their soil and, consequently, their yield. A farmer explains, “It is not good to till the land every year because that degrades the soil. By tilling the soil every year, there used to be emergence of red weeds resulting in wilting of maize”. Though other people explained that soil concerns were why they did not adopt: “The soil type in this area is hard, and when we tried it we realized we were better off [just] doing ground cover”. To some extent, farmers were able to see some of the agronomic benefits of CA emerging, as another explained, “I have benefited a lot from this type of farming as the field was not infested with weeds and that germination was good since the basins were able to retain moisture”.
Those that did not adopt zero tillage said that it was because they did not have extra labor and inputs required, nor did they have sufficient access to extension agents. People choose not to do zero tillage because “digging the basins is quite laborious and time consuming”. A couple of different women explained that they were not able to do it without additional male labor, which was not always available. One woman whose husband migrates explained, “I do farm activities alone ... and I can only do minimum tillage if we could be two with my husband”. Beyond labor, which was a major concern for many, few people also complained that they did not have inputs like maize stalks and fertilizer, which they said were required to do zero tillage. Last, farmers indicated that of all the CA practices taught by extension agents, zero tillage was the least accessible. A farmer explained, “We were only trained on [applying crop residues] and intercropping, therefore, I am unable to practice this farming”. Another suggested, “There’s need of more agricultural extension workers so that we keep up the momentum. That way more people in the village will adopt these methods”.
References
- Kumambala, P. Sustainability of Water Resources Development for Malawi with Particular Emphasis on North and Central Malawi; University of Glasgow: Glasgow, UK, 2010. [Google Scholar]
- Scopel, E.; Triomphe, B.; Affholder, F.; Da Silva, F.A.M.; Corbeels, M.; Xavier, J.H.V.; Lahmar, R.; Recous, S.; Bernoux, M.; Blanchart, E.; et al. Conservation agriculture cropping systems in temperate and tropical conditions, performances and impacts. A review. Agron. Sustain. Dev. 2013, 33, 113–130. [Google Scholar] [CrossRef]
- Government of Malawi. Malawi the Agriculture Sector Wide Approach (ASWAp): Malawi’s Prioritised and Harmonised Agricultural Development Agenda; Government of Malawi: Lilongwe, Malawi, 2010.
- Fleskens, L.; Chilima, C. Development of a Green Water Credit Scheme in the Shire River Basin; UNDP: Lilongwe, Malawi, 2013. [Google Scholar]
- Campbell, B.; Pierson, O. Creating a Market Mechanism to Keep the Lights on in Malawi. Available online: https://www.mcc.gov/resources/story/story-kin-apr-2015-creating-a-market-mechanism-to-keep-the-lights-on (accessed on 10 October 2016).
- Araya, T.; Cornelis, W.M.; Nyssen, J.; Govaerts, B.; Bauer, H.; Gebreegziabher, T.; Oicha, T.; Raes, D.; Sayre, K.D.; Haile, M.; et al. Effects of conservation agriculture on runoff, soil loss and crop yield under rainfed conditions in Tigray, Northern Ethiopia. Soil Use Manag. 2011, 27, 404–414. [Google Scholar] [CrossRef]
- Mchuru, C.N.; Lorentz, S.; Jewitt, J.; Manson, A.; Chaplot, V. No-Till Impact on Soil and Soil Organic Carbon Erosion under Crop Residue Scarcity in Africa. Soil Sci. Soc. Am. J. 2011, 75, 1503–1512. [Google Scholar] [CrossRef]
- Ndah, H.T.; Schuler, J.; Uthes, S.; Zander, P.; Traore, K.; Gama, M.-S.; Nyagumbo, I.; Triomphe, B.; Sieber, S.; Corbeels, M. Adoption potential of conservation agriculture practices in sub-Saharan Africa: Results from five case studies. Environ. Manag. 2014, 53, 620–635. [Google Scholar] [CrossRef] [PubMed]
- Friedrich, T.; Derpsch, R.; Kassam, A. Overview of the global spread of conservation agriculture. Field Actions Sci. Rep. 2012, 6. Available online: http://journals.openedition.org/factsreports/1941 (accessed on 8 January 2018).
- Kassam, A.; Friedrich, T. Conservation Agriculture : Concepts, worldwide experience, and lessons for success of CA-based systems in the semi-arid Mediterranean environments. Opt. Méditerranéennes 2010, 96, 11–51. [Google Scholar]
- Brouder, S.M.; Gomez-macpherson, H. Agriculture, Ecosystems and Environment The impact of conservation agriculture on smallholder agricultural yields: A scoping review of the evidence. Agric. Ecosyst. Environ. 2014, 187, 11–32. [Google Scholar] [CrossRef]
- Brown, B.; Nuberg, I.; Llewellyn, R. Stepwise frameworks for understanding the utilisation of conservation agriculture in Africa. Agric. Syst. 2017, 153, 11–22. [Google Scholar] [CrossRef]
- Knowler, D.; Bradshaw, B. Farmers’ adoption of conservation agriculture: A review and synthesis of recent research. Food Policy 2007, 32, 25–48. [Google Scholar] [CrossRef]
- Giller, K.; Witter, E.; Corbeels, M.; Tittonell, P. Conservation agriculture and smallholder farming in Africa: The heretics’ view. Field Crop. Res. 2009, 114, 23–34. [Google Scholar] [CrossRef]
- Pannell, D.J.; Llewellyn, R.S.; Corbeels, M. The farm-level economics of conservation agriculture for resource-poor farmers. Agric. Ecosyst. Environ. 2014, 187, 52–64. [Google Scholar] [CrossRef]
- Arslan, A.; McCarthy, N.; Lipper, L.; Asfaw, S.; Cattaneo, A. Adoption and intensity of adoption of conservation farming practices in Zambia. Agric. Ecosyst. Environ. 2014, 187, 72–86. [Google Scholar] [CrossRef]
- Andersson, J.A.; D’Souza, S. From adoption claims to understanding farmers and contexts: A literature review of Conservation Agriculture (CA) adoption among smallholder farmers in southern Africa. Agric. Ecosyst. Environ. 2014, 187, 116–132. [Google Scholar] [CrossRef]
- Gladwin, C.H. Ethnographic Decision Tree Modeling; Sage: Thousand Oaks, CA, USA, 1989; ISBN 9780803934863. [Google Scholar]
- Roth, H.; Conference, T.; Nelson, C.; August, N.Z. Using Ethnographic Decision Tree Modelling to Explore Farmers’ Decision-making Processes : A Case Study Paper. In Proceedings of the 2009 NZARES Conference, Nelson, New Zealand, 27–28 August 2009. [Google Scholar]
- Orr, A.; Mwale, B.; Saiti, D. Modelling agricultural “performance”: Smallholder weed management in Southern Malawi. Int. J. Pest Manag. 2002, 48, 265–278. [Google Scholar] [CrossRef]
- Beck, K.A. Ethnographic decision tree modeling: A research method for counseling psychology. J. Couns. Psychol. 2005, 52, 243–249. [Google Scholar] [CrossRef]
- Mullainathan, S.; Spiess, J. Machine Learning: An Applied Econometric Approach. J. Econ. Perspect. 2017, 31, 87–106. [Google Scholar] [CrossRef]
- Bauer, E.; Kohavi, R.; Chan, P.; Stolfo, S.; Wolpert, D. An Empirical Comparison of Voting Classification Algorithms: Bagging, Boosting, and Variants. Mach. Learn. 1999, 36, 105–139. [Google Scholar] [CrossRef]
- Parkhurst, G.M.; Shogren, J.F. Smart Subsidies for Conservation. Am. J. Agric. Econ. 2008, 90, 1192–1200. [Google Scholar] [CrossRef]
- Ward, P.S.; Bell, A.R.; Parkhurst, G.M.; Droppelmann, K. Heterogeneous Preferences and the Effects of Incentives in Promoting Conservation Agriculture in Malawi. Agric. Ecosyst. Environ. 2016, 222, 67–79. [Google Scholar] [CrossRef]
- Mathworks Classification—MATLAB & Simulink Example. Available online: https://www.mathworks.com/help/stats/examples/classification.html?requestedDomain=www.mathworks.com (accessed on 5 July 2017).
- Ward, P.S.; Bell, A.R.; Droppelmann, K.; Benton, T. Early adoption of conservation agriculture practices: Understanding partial compliance in programs with multiple adoption decisions. Land Use Policy 2018, 70, 27–37. [Google Scholar] [CrossRef]
- Rogers, E.M.; Shoemaker, F.F. Communication of Innovations: A Cross-Cultural Approach; Free Press: New York, NY, USA, 1971. [Google Scholar]
- Engel, S.; Schaefer, M. Ecosystem services—A useful concept for addressing water challenges? Curr. Opin. Environ. Sustain. 2013, 5, 696–707. [Google Scholar] [CrossRef]
- Bell, A.; Matthews, N.; Zhang, W. Opportunities for improved promotion of ecosystem services in agriculture under the Water-Energy-Food Nexus. J. Environ. Stud. Sci. 2016, 6, 183–191. [Google Scholar] [CrossRef]
Figure 1.
Study Area.

Figure 2.
Relative variable importance in predicting intercropping (IC), zero tillage (ZT), or crop residue mulching (CR) within the Control sample from the EDTM module, based on change in OOB prediction error across a forest of trained classification trees. Variables ordered as in Table 1.
Figure 2.
Relative variable importance in predicting intercropping (IC), zero tillage (ZT), or crop residue mulching (CR) within the Control sample from the EDTM module, based on change in OOB prediction error across a forest of trained classification trees. Variables ordered as in Table 1.

Figure 3.
Relative variable importance in predicting intercropping (IC), zero tillage (ZT), or crop residue mulching (CR) within the Treatment sample from the EDTM module, based on change in OOB prediction error across a forest of trained classification trees. Variables ordered as in Table 1.
Figure 3.
Relative variable importance in predicting intercropping (IC), zero tillage (ZT), or crop residue mulching (CR) within the Treatment sample from the EDTM module, based on change in OOB prediction error across a forest of trained classification trees. Variables ordered as in Table 1.
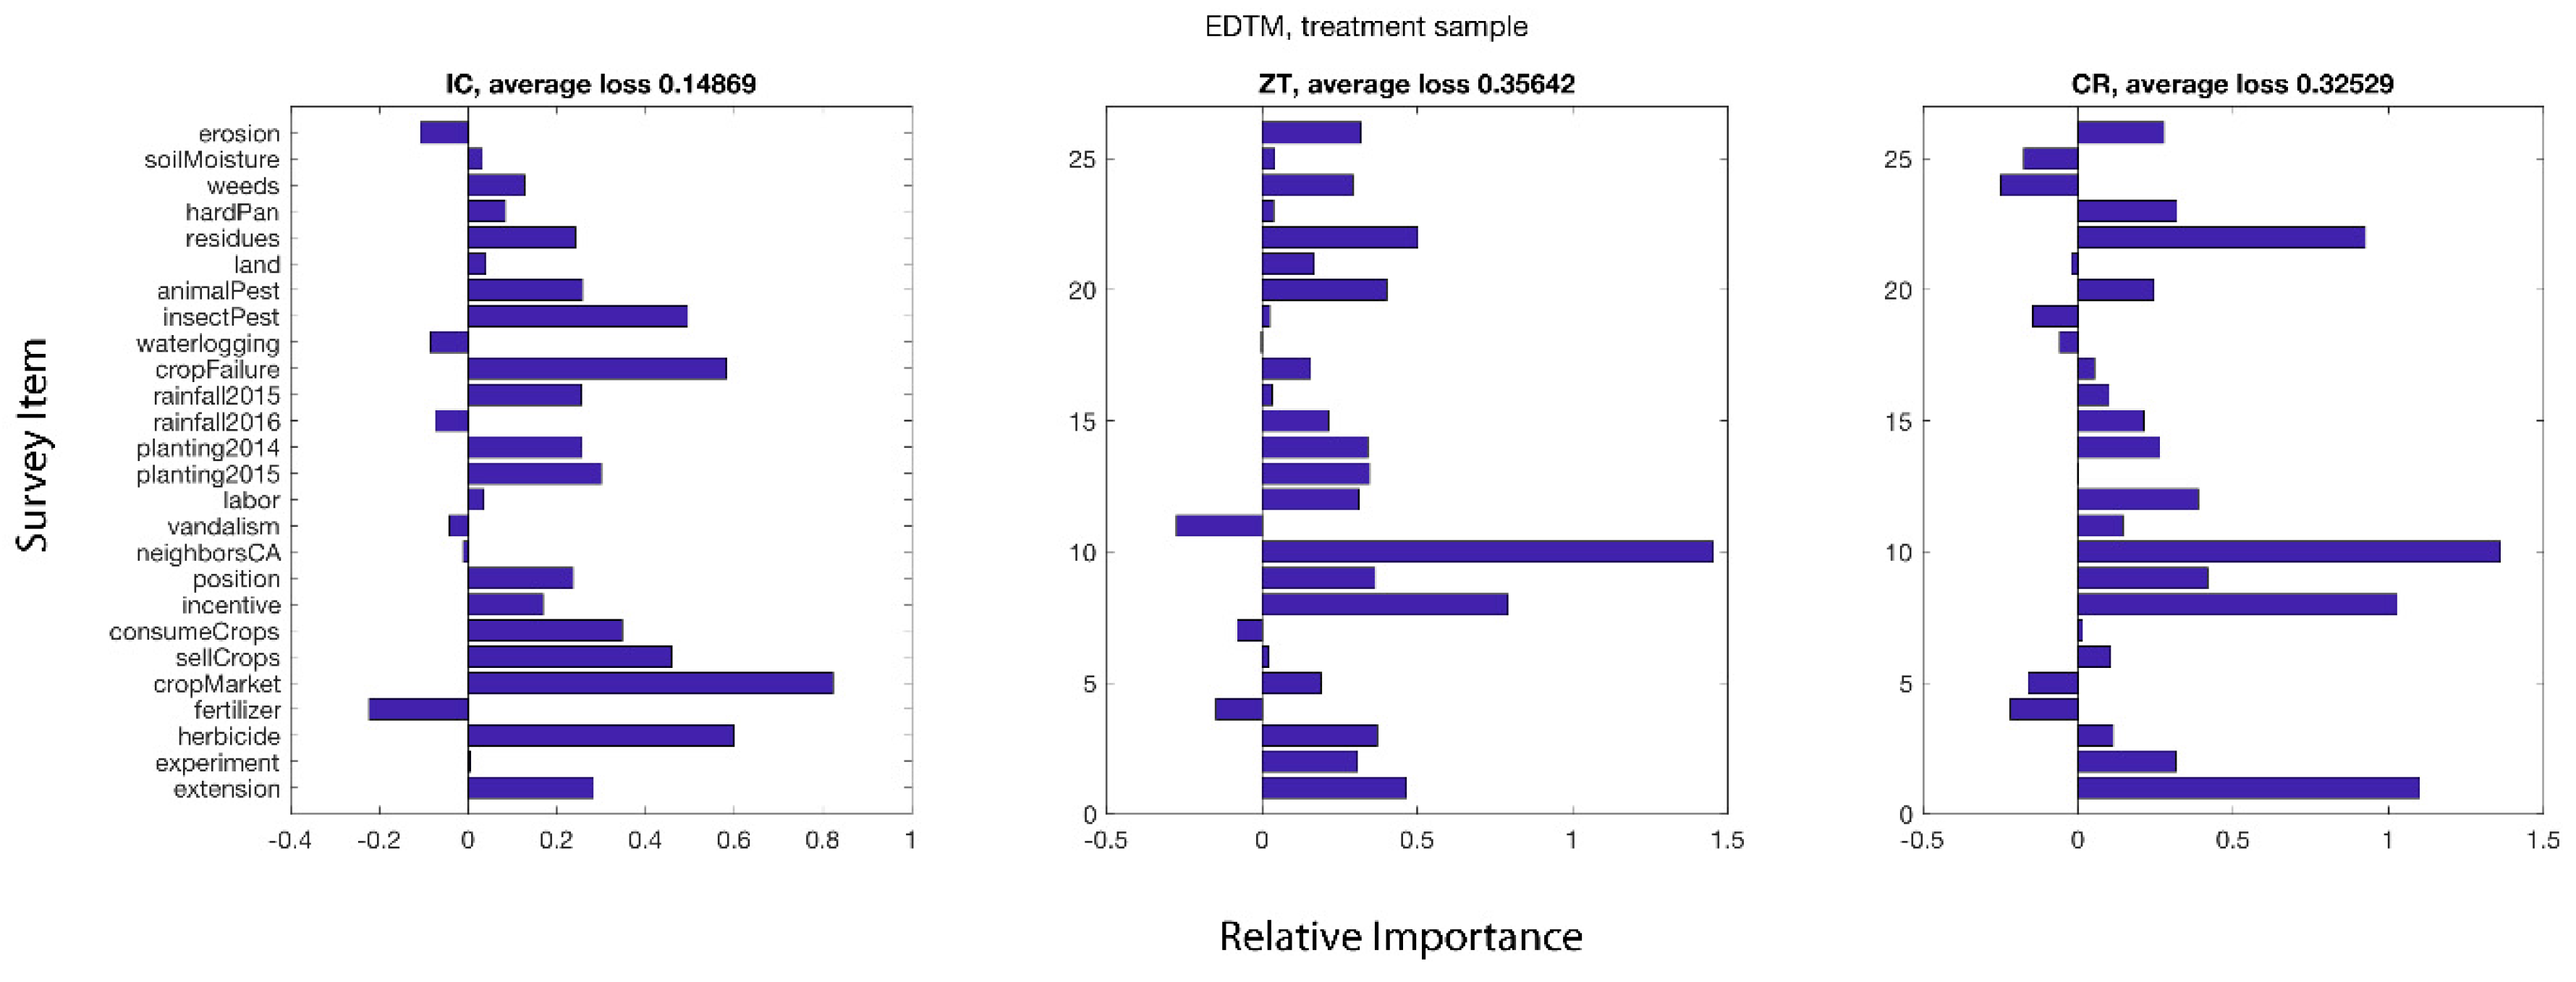
Figure 4.
Average out-of-bag prediction error from ensembles of classification trees (“forests”) trained on data from the EDTM variables (farmer-identified criteria for adoption), as well as additional modules of experimental conditions (Expt), household characteristics (Hhold), neighborhood characteristics (neighbor), farm characteristics (farm), and risk perceptions (risk); for each of the three CA practices (intercropping (IC), zero tillage (ZT), or crop residue mulching (CR)) within both the control and treatment groups.

Figure 5.
Decision trees for farmers’ choices to adopt treatment for intercropping, crop residue, and zero tillage in control (A,C,E) and payment (B,D,F) treatment groups.
Figure 5.
Decision trees for farmers’ choices to adopt treatment for intercropping, crop residue, and zero tillage in control (A,C,E) and payment (B,D,F) treatment groups.


Table 1.
Survey items in EDTM Module identified from ethnographic interviews, including authors’ tags for categorization and counts of endline respondents perceiving an influence on the decision to adopt intercropping (IC), zero tillage (ZT), or crop residue mulching (CR). Items were tagged as relating to any of the categories physical environment, climate, social, economic, risk, and governance; and then sorted per their memberships in those categories, in that order.
| Names | Survey Item | Physical Env | Climate | Social | Economic | Risk | Governance | IC | ZT | CR |
|---|---|---|---|---|---|---|---|---|---|---|
| ‘soil erosion’ | Do you consider the levels of soil erosion your soils undergo to be problematic? | x | x | x | 22 | 123 | 75 | |||
| ‘soil moisture’ | Do you consider the moisture levels of your soils to be problematic? | x | x | 24 | 74 | 206 | ||||
| ‘weed growth’ | Do you consider the level of weed growth on your plots to be problematic? | x | x | 20 | 219 | 251 | ||||
| ‘hard pans’ | Would you say that you have hard pans in the soils of any of your plots? | x | x | 10 | 164 | 67 | ||||
| ‘crop residues’ | Do you feel that you have sufficient crop residues that you would be willing to use as mulch in your plots? | x | x | 27 | 18 | 831 | ||||
| ‘enough land’ | Do you feel that you have an amount of land for which CA would be valuable? | x | x | 100 | 29 | 52 | ||||
| ‘animal pests’ | Do you feel that any of your plots are at risk of damage from animal pests? | x | x | 118 | 17 | 87 | ||||
| ‘insect pests’ | Do you feel that any of your plots are at risk of damage from insect pests? | x | x | 149 | 25 | 217 | ||||
| ‘waterlogging’ | Do you feel that any of your plots are at risk of damage from waterlogging? | x | x | 7 | 111 | 153 | ||||
| ‘crop failure concern’ | Are you concerned about failure of any one of your crops? | x | x | x | 469 | 45 | 46 | |||
| ‘rainfall’ | During [this past season/the season before this one], would you describe the rainfall as having been below average, average, or above average? ** | x | x | 81 | 61 | 98 | ||||
| ‘planting’ | Were you able to plant your crops [last year/the year before last year] at the time you wanted to? ** | x | x | 173 | 33 | 30 | ||||
| ‘household labor’ | Would you say that your household could handle the labor requirements of CA? | x | x | 46 | 36 | 226 | ||||
| ‘vandalism’ | Do you feel that your plots are at risk of vandalism (i.e., arson, theft)? | x | x | 63 | 17 | 109 | ||||
| ‘neighbors CA’ | Do any of your neighbors practice CA? | x | 36 | 49 | 58 | |||||
| ‘community position’ | Do you feel that your position in the community makes it important for you to practice CA, to NOT practice CA, or does it not matter? | x | 16 | 27 | 27 | |||||
| ‘CA incentive’ | Have you been offered incentives to adopt CA? | x | x | 36 | 15 | 33 | ||||
| ‘crops for own’ | Do you feel that you would want to grow more crops for your own consumption on the same amount of land? | x | 661 | 19 | 37 | |||||
| ‘crops for sale’ | Do you feel that you would want to grow more crops for sale on the same amount of land? | x | 623 | 20 | 37 | |||||
| ‘market for crops’ | Do you feel that you could sell more crops profitably, if you wanted to? | x | 540 | 16 | 29 | |||||
| ‘can buy fertilizer’ | Are you able to purchase fertilizer for your crops? | x | 90 | 15 | 80 | |||||
| ‘can buy herbicide’ | Are you able to purchase herbicides for your crops? | x | 32 | 187 | 110 | |||||
| ‘willing to try new’ | Do you feel that you are willing and able to try new or different practices? | x | 26 | 56 | 69 | |||||
| ‘extension CA’ | Have you been able to learn about CA from extension agents or lead farmers? | x | 40 | 21 | 50 |
Note: ** These items were asked for each of the last two seasons, as two separate items.
© 2018 by the authors. Licensee MDPI, Basel, Switzerland. This article is an open access article distributed under the terms and conditions of the Creative Commons Attribution (CC BY) license (http://creativecommons.org/licenses/by/4.0/).
Share and Cite
MDPI and ACS Style
Bell, A.R.; Zavaleta Cheek, J.; Mataya, F.; Ward, P.S. Do As They Did: Peer Effects Explain Adoption of Conservation Agriculture in Malawi. Water 2018, 10, 51. https://doi.org/10.3390/w10010051
AMA Style
Bell AR, Zavaleta Cheek J, Mataya F, Ward PS. Do As They Did: Peer Effects Explain Adoption of Conservation Agriculture in Malawi. Water. 2018; 10(1):51. https://doi.org/10.3390/w10010051
Chicago/Turabian StyleBell, Andrew Reid, Jennifer Zavaleta Cheek, Frazer Mataya, and Patrick S. Ward. 2018. "Do As They Did: Peer Effects Explain Adoption of Conservation Agriculture in Malawi" Water 10, no. 1: 51. https://doi.org/10.3390/w10010051
Note that from the first issue of 2016, this journal uses article numbers instead of page numbers. See further details here.