The Synergic Characteristics of Surface Water Pollution and Sediment Pollution with Heavy Metals in the Haihe River Basin, Northern China

1
State Key Lab of Urban and Regional Ecology, Research Center for Eco-Environmental Sciences, Chinese Academy of Sciences, Beijing 100085, China
2
University of Chinese Academy of Sciences, Beijing 100085, China
*
Author to whom correspondence should be addressed.
Water 2018, 10(1), 73; https://doi.org/10.3390/w10010073
Submission received: 13 November 2017
/
Revised: 10 January 2018
/
Accepted: 11 January 2018
/
Published: 15 January 2018
(This article belongs to the Special Issue Eutrophication Management: Monitoring and Control)
Abstract
:Aquatic environmental deterioration is becoming a serious problem due to rapid urbanization and economic development, particularly in developing countries. As two important components of the aquatic environment, water quality and sediment pollution are widely considered to be concerns; however, they are considered separately in most cases. The relationship between water quality and sediment pollution with heavy metals has been little addressed. In this study, the Haihe River Basin (HRB), one of the most polluted areas in China, was used as a case study, and the eutrophication index (EI) and the potential ecological risk index (RI) were employed to evaluate water quality and sediment pollution of heavy metals, respectively. The results showed that generally in the HRB, the water quality was poor, while the risk of heavy metal pollution was relatively low. Surface water quality was mainly influenced by sewage discharges from human daily life, and heavy metal pollution was affected by industry structure, in that the areas with resource/energy consumption industries and high-pollution industries often have high risks of heavy metal pollution Synergic pollution from water eutrophication and sediment pollution with heavy metals was found, especially in the central areas of the HRB, and it was largely dependent on the type of human activities. In the places with intensive human activities, such as secondary industry, eutrophication occurred simultaneously with heavy metal pollution, other than in less human-affected areas. These findings are useful for planning aquatic environment protections and river ecosystem management.
1. Introduction
As human activity increases, aquatic ecosystems and environments are facing the threat of deterioration. A decline in water quality and the degradation of aquatic ecosystems are often accompanied by rapid agricultural and economic development [1,2,3]. Eutrophication, as an important contributor to the degradation of aquatic ecosystems, is the enrichment of water bodies by nutrients, especially compounds of nitrogen (N) and phosphorus (P), which may cause the accelerated growth of algae and higher forms of plant life and produce an undesirable disturbance to the balance of organisms and water quality [4]. This may lead to changes in water clarity and dissolved oxygen, result in the deterioration of the water environment, and even threaten the aquatic ecosystems’ function [5,6]. Currently, in China, the eutrophication of water bodies around industrial and agricultural areas has become increasingly serious and has posed a serious threat to regional water bodies and the environment. It has already become a challenge to sustainable socioeconomic development [3,7,8]. Meanwhile, heavy metal pollution has also become a worldwide concern, especially in rivers, because of their toxicity, persistence in the environment, and subsequent accumulation in the bodies of aquatic microorganisms, flora and fauna, which may, in turn, enter the human food chain and cause health problems [9,10,11]. Hence, researchers have explained that sediment contamination by heavy metals may have a considerable detrimental effect on the health of aquatic ecosystems [12,13,14]. The distribution of heavy metals in sediment adjacent to populated areas can provide evidence of anthropogenic influence on aquatic systems and convenience in assessing the potential risks associated with the discharge of human waste [9]. Previous studies have focused more on surface water quality or heavy metals in sediments separately, such that there is a lack of effective research on the relationship between surface water quality and sediment pollution with heavy metals. The features of synergic pollution on surface water quality and heavy metal pollution in sediments reflect the synchronicity of pollution conditions in different media that may provide a reference for environmental monitoring and management. Thus, exploring and understanding synergic pollution characteristics of surface water quality and heavy metal pollution in sediments and their driving forces are necessary for better environmental management and the formulation of control strategies in large-scale watersheds.
The Haihe River Basin, one of the most important river basins in China, is within China’s central political, economic, and cultural area, where approximately 140 million people live [15]. With the rapid development of agriculture and industry in the Haihe River Basin, pollution has become serious [16,17,18]. Meanwhile, the rapid urbanization and intensive utilization of water resources in the Haihe River Basin have already led to rivers faced with water shortages and environmental deterioration [19,20,21]. Although monitoring and assessment work on water environmental quality in the Haihe River Basin has been widely conducted [2,21,22], systematic studies of the heavy metal pollution in sediments and the surface water quality have been of less concern. For better understanding of the relationship between them and developing pollution control strategies, an investigation of surface water quality, heavy metal pollution in sediments and their synergic pollution characteristics is needed. In this study, the Haihe River Basin (HRB), one of the most polluted areas in northern China, was used as the case study area, and the eutrophication index (EI) and the potential ecological risk index (RI) were employed to evaluate the water quality and sediment pollution with heavy metals, respectively.
The objectives of this study are to: (1) assess the water quality and potential ecological risk of heavy metals in the Haihe River Basin; (2) explore and understand the synergic pollution characteristics of surface water quality and heavy metal pollution in sediments; and (3) identify the driving forces that cause eutrophication, the potential ecological risk of heavy metals and their synergic pollution in the Haihe River Basin.
2. Materials and Methods
2.1. The Study Area
The Haihe River Basin, located mainly within the province of Hebei, includes Beijing, Tianjin, parts of Inner Mongolia, and the provinces of Shanxi, Henan, and Shandong (Figure 1) and covers an area of 318,000 km2, where approximately 140 million people live. It is a developed basin with intensive agriculture, industry and rapid urbanization. The central plain of the basin is the most disturbed area, with large cities, high population and developed agriculture and industry. Mountain areas in the northern and western basin mainly depend on agriculture and animal husbandry, and the southern plain of the basin is dominated by agriculture, which is an important grain production base in China. It has been reported that the development of agriculture, industry and rapid urbanization has caused significant pollution in waters in this region [16,23,24]. Therefore, the Haihe River Basin has attracted much attention from the Chinese government and has become one of the most important basins in the State 11th and 12th 5-year Plans for Water Pollution Control. The Haihe River Basin is divided into nine major sub-watersheds (Figure 1): the Luan River (LR), BeiSan River (BSR), YongDing River Mountain Area (YDRMA), DaQing River (DQR), BeiSiRiver Downstream Plain (BSRDP), ZiYa River (ZYR), HeiLong Gang (HLG), Zhangwei River (ZWR), and Tu-hai-Ma-xia River (TMR). The population and structure of the Gross Domestic Product (GDP) in these watersheds are shown in Table 1. The population and GDP data were collected from China’s Statistical Yearbook 2011 at the county level.
2.2. Sampling
To define the features of aquatic environmental pollution, a total of 320 samples of surface water and 314 samples of surface sediments were collected from 160 sites in the Haihe River Basin (Figure 1). Samples in THMJR, HLG, ZWR, ZYR and DQR and part of YDMRA watersheds (a total of 142) were collected in May and September in 2013, while the samples in LR, BSR, DPBSR and part of YDMRA watersheds (a total of 178) were collected in May and September in 2014. Each water sample consisted of five homogenized sub-samples (1 L) that were taken from 0–10 cm depths within an area of approximately 25 m2 and then placed into pre-cleaned Teflon bottles. Water samples were filtered through a 0.45-μm capsule filter, placed in a cooler, and immediately delivered to the laboratory. River sediments were collected synoptically at the same sites as the water samples. Each sample of sediment was composed of five homogenized sub-samples that were taken from the top 10 cm within an area of 5 m2. Composite samples of sediment were placed in dark-colored Teflon bottles, refrigerated and returned immediately to the laboratory, where the samples were air-dried, crushed, mixed thoroughly and passed through a 100-mesh nylon sieve before being stored at 4 °C in the dark until analysis.
2.3. Quantification of Surface Water Quality and Heavy Metals in Sediment
Concentrations of total phosphorus (TP), total nitrogen (TN), ammonia nitrogen (NH3-N), nitrate nitrogen (NO3-N) and chemical oxygen demand (COD) in water samples were analyzed according to the State Standard on Surface Water Environmental Quality of China (GB 3838-2002). GB 3838-2002 specified the standards for the determination of water pollutants and the quality level of water. Water quality was divided into five levels in GB 3838-2002, water quality in level I was used for water source or National Nature Reserve, and water in level Vcan only match general landscape requirement. Sediments were digested with HNO3 and H2O2 according to United States Environmental Protcction Agency (USEPA) Method 3051. The total concentrations of heavy metals (Cd, Pb, Cu, Cr, Zn, As, Ni) in the digestates and reagent blanks were quantified by inductively coupled plasma mass spectrometry (ICP-MS, 7500a, Agilent Technologies, Santa Clara, CA, USA). Quality assurance and quality control for the quantification of heavy metals were determined by analyzing duplicates, method blanks, liquid standard solutions and Chinese Standard certified reference materials GBW07427 (GSS-13). Repeatability for individual heavy metals was three and recovery rates of heavy metals from the sediment were all greater than 80%. Concentrations of pollutants were shown in Table 2 and Table 3.
2.4. Assessment on Surface Water Quality
A universal index formula in the form of a logarithmic power function was proposed to design a eutrophic evaluation model that is scientific and reasonable, simple and intuitive, universal and common, easy to calculate and convenient to use. This formula was based on the ‘normalized values’ of multi-indices from the ‘reference values’ of indices for eutrophic evaluation [25]. The universal index can be calculated by the following equation:
Xj = Xn/X0
Here, EI is the composite eutrophication indices. Wj is the weights of different eutrophication indices. Xj is the ‘standardized values’ of each index compared with the ‘reference values’ for eutrophic evaluation. Xn is the concentration of the corresponding index. X0 is the ‘extremely oligotrophic value’ of the corresponding eutrophication indices. X0 for TP, TN, NH3-N, NO3-N and CODare 1.0, 0.02, 0.01, 0.1, and 0.12 mg/L, respectively [2]. When EI ≤ 20, the water quality is defined as ‘slightly eutrophic’, and ‘moderately eutrophic’, ‘eutrophic’, ‘highly eutrophic’ and ‘extremely eutrophic’ are defined, respectively, when 20 < EI ≤ 39.42, 39.42 < EI ≤ 61.29, 61.29 < EI ≤ 76.28, 76.28 < EI ≤ 99.72 [24].
2.5. Potential Ecological Risk Index
The potential ecological risk index was proposed to evaluate the characteristics and environmental behavior of heavy metal pollution in sediments. The ecological risk index is calculated by the following equation [25,26]:
Eri = Tri × Cri = Tri × (CSi/Cni)
Among them, Cri is the value of the concentration of a heavy metal divided by the background value. CSi is the measured concentration of a heavy metal and Cni is the background concentration of a heavy metal. Tri is the toxic factor of a heavy metal, the values for Cd, As, Pb, Cu, Ni, Zn, Cr were 30, 15, 5, 5, 5, 2 and 1, respectively [26]. Eri is the monomial potential ecological risk factor, which indicates the integrated ecological risk index. The ecological risk for each heavy metal can be categorized as follows: Eri < 40: low risk; 40 ≤ Eri < 80: moderate risk; 80 ≤ Eri < 160: considerable risk; 160 ≤ Eri < 320: high risk; and Eri ≥ 320: extremely high risk. The potential ecological risk index (RI) represents the overall ecological risk of multiple heavy metals in the sediments. RI was classified into four levels: RI < 150: low risk; 150 ≤ RI < 300: moderate risk; 300 ≤ RI < 600: considerable risk; and RI ≥ 600: high risk [25,26].
2.6. Enrichment Factors
Enrichment factors (EFs) were used to distinguish between natural and anthropogenic contributions of pollution by determining potential sources of metals to riverine, estuarine and coastal environments [27]. To identify anomalous concentrations of metals, the geochemical normalization of concentrations of metals to concentrations of a conservative element, such as aluminum (Al), iron (Fe), or silicon (Si), was conducted. In this study, Al was used as the conservative tracer to differentiate natural from anthropogenic sources of heavy metals. The EF for each metal was calculated as follows [28]:
EF = (M/Al)sample/(M/Al)background
Here, EF is the enrichment factor, (M/Al)sample is the ratio of the concentrations of heavy metals and that of Al in the sample, and (M/Al)background is the ratio of heavy metals and Al concentration in the background. Background values of heavy metals in the Haihe River Basin collected from background values of soil elements in China are shown in Table 3. Values of EF between 0.5 and 1.5 indicate that the metal was entirely from crustal materials or natural processes, whereas values of EF greater than 1.5 suggest that sources were more likely the result of human activities [29]. The categories of contamination were defined based on EF values. For example, an EF value between 1.5 and 2 suggests a minimal enrichment of heavy metals. Alternatively, an EF value greater than 2 implies enrichment of heavy metals due to an increase in human activity [30].
2.7. Data Analysis
Correlation analysis and regression analysis were done using SPSS version 19.0 (IBM, Armonk, NY, USA) and figures were generated in Arcgis 10.2 (Esri, Redlands, CA, USA) and Origin 8.0 (OriginLab, Northampton, MA, USA).
3. Results
3.1. Surface Water Quality
As shown in Table 2, in the Haihe River Basin, total nitrogen (TN) was 5.05 mg/L, which was approximately 2.5 times higher than the scope of grade V in the Chinese surface water standard (GB 3838-2002, 1.5–2 mg/L). Similarly, total phosphorus (TP) was approximately 2.5 times higher than the scope of grade V in GB 3838-2002 (0.3–0.4 mg/L), with a mean concentration of 0.98 mg/L, which means that TN and TP pollution in the Haihe River Basin is extremely serious. The chemical oxygen demand (COD) is 37.87 mg/L, reaching the scope of grade V in GB 3838-2002 (30–40 mg/L), which implied that COD pollution is serious. The ammonia nitrogen (NH3-N) and nitrate nitrogen (NO3-N) are 0.45 and 3.56 mg/L, falling in the scope of grade II in GB 3838-2002 (0.15–0.5 and 2–5 mg/L), which are better than TN and TP. In general, the surface water quality in the Haihe River Basin was serious and TN, TP, and COD were the mainpollutants that affected surface water quality. To further assess the surface water quality of different chemical indices, the universal index using a logarithmic power function was proposed to assess water eutrophication and widely used in China [2,17]. The calculated EIs and their distribution are displayed in Figure 2. Generally, the mean EI in the Haihe River Basin was 67.99, which indicated a ‘highly eutrophic’ level in this region. Furthermore, none of water samples was below the eutrophic level, among which, 20.6% were at a ‘eutrophic’ level, 60% were at a ‘highly eutrophic’ level and 19.4% were at a ‘extremely eutrophic’ level, indicating the serious condition of surface water quality in the Haihe River Basin, which was consistent with other studies [2,31,32]. The eutrophication variations were apparent in different watersheds in the Haihe River Basin: BSRDP > ZYR > TMR > BSR > DQR > YDRMA > LR > ZWR > HLG.
3.2. Heavy Metals in Sediments
As shown in Table 3, the mean concentrations of Cu, Zn, Cr, Pb, Ni, Cd and As in the Haihe River Basin were 51.01, 167.27, 112.09, 37.81, 41.38, 0.20 and 7.56 mg/kg, respectively, which were all higher than the background values [33] in the Haihe River Basin, except for As. Among all the metals, Zn had the highest content, and Cd had the lowest value. This did not represent the real contamination levels of heavy metals because the evaluation of heavy metal contamination was based on comparisons with their respective background values. Based on the comparison of a metal concentration in the sediments with its background value, a potential ecological risk index was proposed to assess the contamination level of heavy metals [26]. Potential ecological risk (PER) represents the sensitivity of the biological community to a given substance and illustrates the risk induced by contamination [34,35]. The individual Potential Ecological Risk Index (Eri) of heavy metals in the Haihe River Basin are presented in Table 3, and the potential risk level of individual heavy metals in the Haihe River Basin were Cd > Cu > As > Pb > Ni > Cr > Zn. All the metals except Cd showed a low PER, which implied that those metals had a low potential ecological risk level, except for Cd. The potential ecological risk grade of Cd reached a moderate risk level that should be taken into consideration when formulating environmental management strategies. The mean potential ecological risk index (RI) in the Haihe River Basin was 109, which showed that the overall potential risk of multiple heavy metals in this region was low.
The distribution of the potential risk of heavy metals is presented in Figure 2. According to the PERs in different watersheds in the Haihe River Basin, the risk level of multiple heavy metals was ZYR > DQR > ZWR > BSRDP > HLG > BSR > YDRMA > LR > TMR. What is even more concerning, the ZYR and DQR watersheds had a moderate risk level. In these two watersheds, 22% of samples reached ‘moderate risk’, while 13% samples reached ‘considerable risk’, and one sample in the ZYR watershed even reached ‘high risk’, with RI value of 603. Although the potential ecological risk level was low in the whole Haihe River Basin, long-term monitoring for heavy metals in sediments is still needed, especially in moderate risk regions, such as the ZYR and DQR watersheds.
An enrichment factor is a normalization technique widely used to separate metals derived from natural sources in the environment from those associated with anthropogenic activities [36]. Values of EF greater than 1.5 suggested that the sources of heavy metals were more the result of human activities [30]. To further evaluate anthropogenic influences on heavy metals in river sediments in the Haihe River Basin, the EF for each metal was calculated. The mean EF was highest for Cd (3.71), indicating the highest degree of anthropogenic contamination of this metal, followed by Zn (3.38), Pb (2.50), Cu (2.35), Cr (1.10), Ni (1.05) and As (1.02) (Table 3), indicating that in the Haihe River Basin, Cd, Zn, Pb and Cu pollution were mostly attributed to human activities [29]. The spatial distribution of EF values of heavy metals in different regions are shown in Figure 2, which was similar to the concentrations and potential risk. The high EF values confirmed that intensive human activities were the main factor that resulted in the enrichment of heavy metals in the whole Haihe River Basin and different sub-watersheds [30].
3.3. Synergic Pollution Characteristics in the Haihe River Basin
Surface water quality and heavy metal pollution in sediments were both analyzed above, and in this part, synergic pollution characteristics between different pollutants and media in the Haihe River Basin were explored. To detect the synergic pollution characteristics in the Haihe River Basin, correlation analyses between different pollutants in the watershed scale had been carried out. Constructed Pearson correlation coefficients between different pollutants are displayed in Table 4. The results showed that a positive correlation exists between the following pairs of pollutants: Zn–Ni (0.809 **), Cr–Ni (0.673 **), Cu–Ni (0.686 **), Zn–Cr (0.617 **), TN–NH3-N (0.611 **) and TN–NO3-N (0.605 **) (p < 0.01).
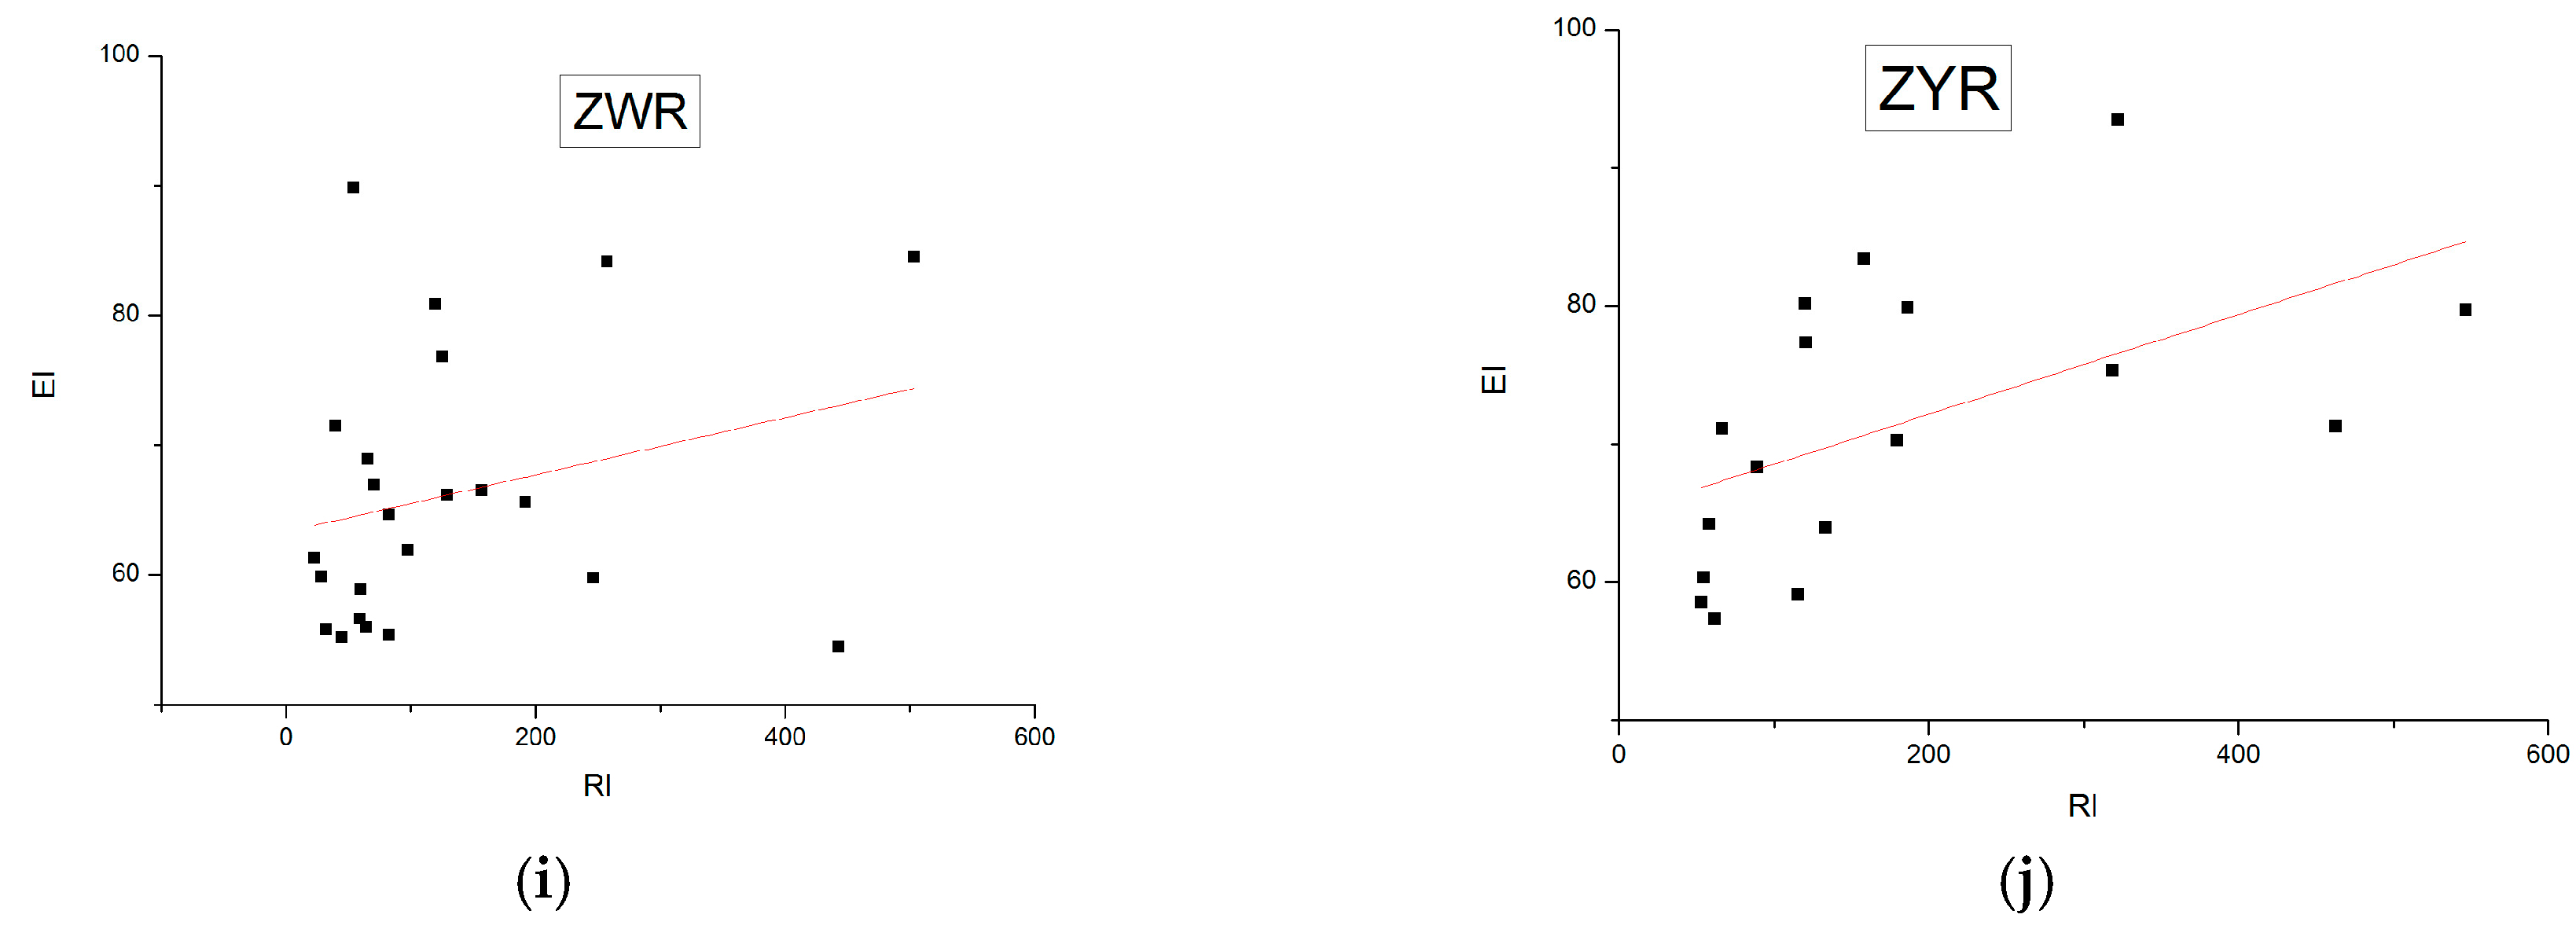
This indicates that these pollutants were associated with each other and may have common sources in the Haihe River Basin. However, all these pollutant pairs existed in single media, and there was no positive correlation between pollutants in water and pollutants in sediments. It seemed that the analysis between single pollutants cannot provide enough evidence to prove synergic pollution characteristics in the Haihe River Basin, so further analysis between the potential ecological risk of heavy metals in sediments and eutrophication in water bodies was done at the watershed and sub-watershed scale in order to explore synergic pollution characteristics. The results of the correlation and regression analyses are displayed in Figure 3 and Table 5.
At the basin scale, the calculated Pearson correlation coefficient (0.318 *) between EIs and RIs, which represented eutrophication in water bodies and potential ecological risk of heavy metals in sediments respectively, were significantly correlated (p < 0.05). In other words, eutrophication and the potential ecological risk of heavy metals were correlated such that synergic pollution occurred in the Haihe River Basin. However, the Haihe River Basin is vast in territory that synergic pollution showed spatial differences in different sub-watersheds. At the sub-watershed scale, extremely significant correlations between EI and RI were found in the central area of the Haihe River Basin, such as DQR (0.992 **), BSRDP (0.631 **) and ZYR (0.627 **) watersheds (p < 0.01),indicating that eutrophication in water and the potential ecological risk of heavy metals in sediments in these regions were significantly associated with each other. As reported in Section 3.1 and Section 3.2, these sub-watersheds were all seriously polluted with eutrophication or heavy metals. In other words, serious synergic pollution of eutrophication in water and the potential ecological risk of heavy metals in sediments occurred in the central region of the Haihe River Basin.
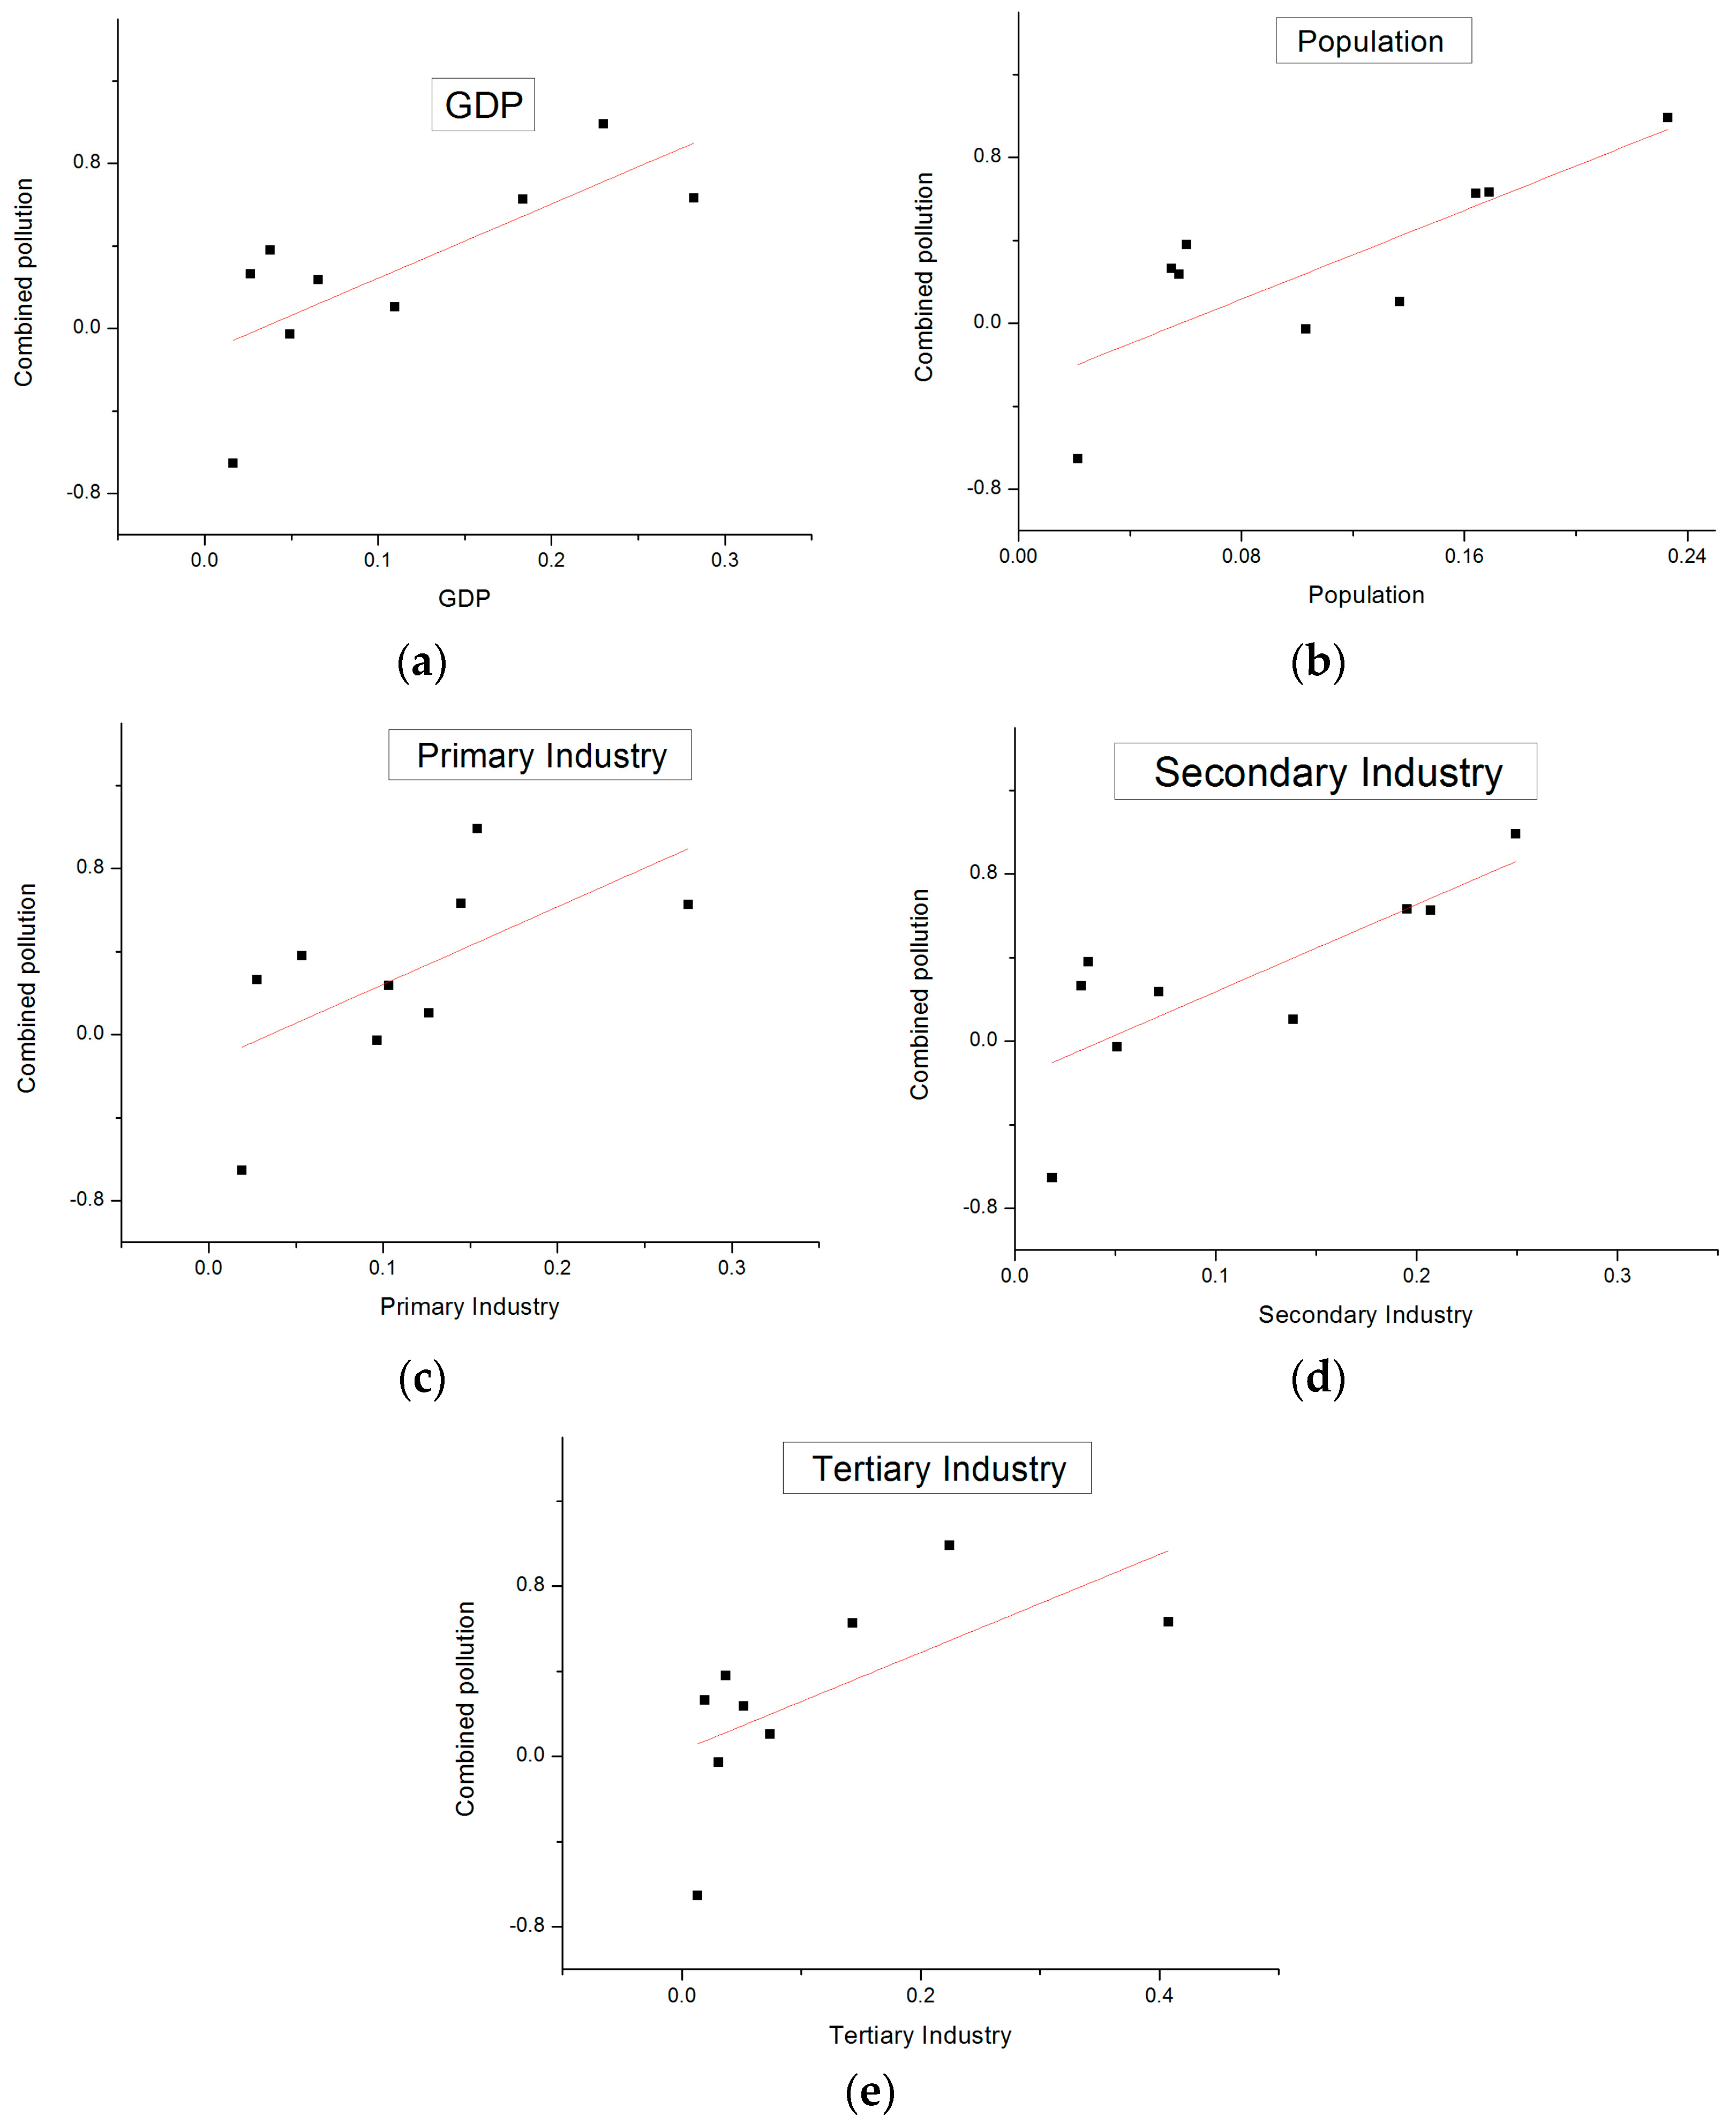
To determine the potential factors that caused the difference of synergic pollution and its spatial distribution in the Haihe River Basin, an analysis of relationships between socioeconomic data and the degree of synergic pollution of potential ecological risk of heavy metals in sediments and eutrophication in water bodies was done. The correlation coefficients between RIs and EIs were used to describe the degree of synergic pollution, while the socioeconomic data were used to measure the intensity of human activity, and all the socioeconomic data were normalized. In the whole Haihe River Basin, the degree of synergic pollution was significantly correlated with population and GDP, which confirmed that human activities were the dominant factors that caused the synergic pollution of surface water quality and heavy metal pollution in sediments (Figure 4 and Table 6). In addition, among all the economic data, secondary industry output was the data most significantly correlated with the degree of synergic pollution of potential ecological risk and eutrophication, followed by tertiary and primary industry in turn. These findings revealed that among all economy activities, secondary industry made the largest contribution to synergic pollution in the Haihe River Basin.
4. Discussion
4.1. The Driving Force Foreutrophication in the Haihe River Basin
Surface water quality was poor in the Haihe River Basin such that under different kinds of human disturbance, eutrophication in the Haihe River Basin showed obvious spatial differences. Intensive human activities in urban life, the construction of reservoirs and agricultural non-point source pollution were the main driving forces that influenced the water quality in the Haihe River Basin. Intensive human activities in urban life influenced the surface water quality and its spatial differences through large sewage discharges. In the Haihe River Basin, the most polluted area of surface water was the BSRDP watershed, with a mean value of EI (75.72), which was close to ‘extremely eutrophic (76.28)’ and significantly higher than the values in the other watersheds. As shown in Table 1, the tertiary industry output in this area was 1146 billion yuan, which accounted for 63% of GDP in this area, and the population density was 1473 km−2, which was significantly higher than those in the other sub-watersheds in the Haihe River Basin. The highest tertiary industry output and population density in BSRDP indicated the highest level of intensive human activities in urban life, and it was reported that the sewage discharge caused by intensive human activities from the large cities such as Beijing (1445.79 million tons in 2013) and Tianjin (568.83 million tons in 2013) located in this area was the main factor that resulted in the degeneration of water quality [37,38]. Similarly, following BSRDP, the ZYR watershed was the second most polluted area of surface water. Previous studied have revealed that sewage discharge caused by urban life from large cities such as Shijiazhuang, Handan and Xingtai may lead to the eutrophication in the rivers in these regions [17,39,40]. Otherwise, in the ZYR watershed, the construction of reservoirs in the upstream area was another important type of human disturbance that affected water quality. The construction of reservoirs caused a reduction in streamflow, which contributed to accelerate the accumulation of nutrients and was another important driving force for the eutrophication in the ZYR watershed [41]. The Haihe River Basin was also one of the most important grain districts in China, with wheat, corn and cotton production. Agricultural non-point source pollution due to the application of chemical fertilizers and pesticides led to the pollution of water bodies in agricultural areas in the ZYR, DQR and HLG watersheds. All these findings confirmed the fact that intensive human disturbance was the main factor that influence the surface water quality and its spatial differences.
4.2. The Effects of Industry Structure on Heavy Metal Pollution
The spatial distribution of heavy metals was mainly determined by the regional industry structure. In the Haihe River Basin, the ZYR and DQR watersheds were the most polluted areas of heavy metals and had a moderate risk level, while the risk levels of heavy metals in other regions in the Haihe River Basin were low. Previous studies have reported that the ZYR watershed was significantly contaminated by heavy metals due to industrial development and rapid urbanization [42,43]. To further analyze the industrial structure, we found that industry in the ZYR watershed was dominated by resource and energy consumption industries with backward manufacturing techniques, such as the pharmaceutical chemical industry, the printing and dyeing industry, the paper making industry, and the brewing industry, which caused large amounts of pollutants to be discharged to the water environment. Otherwise, driven by economic interests, the discharge of wastewater without any treatment directly into rivers from enterprises was widespread. Furthermore, parts of rivers in this region flowed slowly, or even dried up sometimes, which accelerated the accumulation of metals in sediments [44]. Similarly, the DQR watershed was located in the central Haihe River Basin, including large parts of Hebei Province, with parts of Beijing, Tianjin and Shanxi Province. It has been reported that highly developed heavy industry was the main cause of heavy metal pollution in this region [44,45]. As shown in Table 1, the output of secondary industry (767.8 billion yuan) in the DQR watershed was the highest in the Haihe River Basin, and the industrial structure there was mostly based on high-polluting heavy industry, such as petrochemical, mining, metallurgy, electric and coke production industry. The discharge of pollutants from those high-polluting heavy industries increased the risk level of heavy metals in this region. Otherwise, in other watersheds with a low risk level of heavy metals, the industrial structure was based on new energy and energy-efficient industry with advanced technology and production engineering, such as the BSRDP watershed, or industry there was less developed, as indicated by the low secondary output, such as in the TMR, HLG, YDRMA and BSR watersheds All these findings confirmed that the regional industrial structure significantly influenced the spatial distribution of heavy metal pollution.
4.3. The Effects of Human Activities on Synergic Pollution of Surface Water and Sediments
Anthropogenic activities in industrial production and daily life, especially in secondary industry, are the main contributors to synergic pollution of surface water quality and heavy metals in sediments in the Haihe River Basin. In the Haihe River Basin, highly synergic pollution of heavy metals in sediments and eutrophication in waters were found in the central areas, where intensive human activities existed. As shown in Table 1 and Figure 1, the three sub-watersheds ZYR, DQR and DPBSR in the central Haihe River Basin occupied approximately 33.33% of the whole basin, with more than 50% of total population. The GDP in these watersheds was significantly higher than that in the other watersheds, accounting for 70% of the GDP in the Haihe River Basin. The highest population density and GDP in the central regions showed intensive human activities in these areas. The secondary industrial output in the central areas accounted for 55% of the whole basin, which indicated intensive human activities in industrial productive activity. These data supported the conclusion that anthropogenic activities in production and daily life, especially in secondary industry, had a great impact on the synergic pollution of surface water quality and heavy metals in sediments in the Haihe River Basin. In detail, there are many industrial and manufacturing bases dominated by resource and energy consumption industries and highly polluting heavy industries in the central areas of the Haihe River Basin, such as Sinopec (the largest petrochemical enterprises in China), Hebei Iron and Steel Group Co. (the largest iron and steel production base in Shijiazhuang, China), Shougang Group (one of the most important iron and steel production bases in Beijing, China), Jingxing coal mine and Kailuan coal mine (important coal production and processing bases in China), and so on. Pollutants discharged from those highly polluting industrial enterprises into the water environment exacerbated the synergic pollution in the central region. Otherwise, the tertiary industry output in central areas accounted 79% of that of the whole basin, which implied intensive human activities in urban daily life. The primary industry output in these areas reached 57% of that of the whole basin, and the central plain of the Haihe River Basin is one of the most important grain districts in China, with wheat, corn and cotton production. Agricultural non-point source pollution due to the application of chemical fertilizers and pesticides lead to the pollution of water bodies in these areas. All these data showed central regions in the Haihe River Basin were developed areas with intensive human activities in agricultural and industrial production and urban life. Pollutant emissions caused by intensive human activities in industrial and agricultural production and human daily life were the major cause for the synergic pollution of eutrophication and heavy metal pollution in sediments. Otherwise, as shown in Table 1 and Table 5, in other regions with less population and GDP in the Haihe River Basin, there were no significant correlations between eutrophication and potential ecological risk of heavy metals, so synergic pollution in these areas was not serious. Furthermore, the eutrophication in waters and potential ecological risk of heavy metals in sediments were negatively correlated in the BSR watershed, in which the population, GDP and secondary output were all the minimum values, indicating the lowest degree of human activities in this region, which confirmed the fact that synergic pollution in the Haihe River Basin was mostly caused by highly intensive human activities in agricultural and industrial production and urban life, especially in secondary industry in developed areas with high population density.
The conclusion that intensive activities, especially in secondary industry, significantly influenced the synergic pollution of surface water quality and heavy metals in sediments can not only be used in the Haihe River Basin, but also provide a reference for large-scale environmental monitoring and management and be expanded to other regions. The degree of synergic pollution reflected the coordination of pollution conditions in different media, and the relationship between degrees of synergic pollution and socioeconomic data implied the relationship between human activities and the coordination of pollution conditions in different media, which could provide an indicative basis for water environmental monitoring and investigation in watershed environmental management. The results indicate that when serious water pollution occurs in watersheds with intensive human activities in industrial and agricultural production and urban life, the corresponding pollution of heavy metals in sediments will exist as well, and the pollution in one kind of media can serve as an indicator for pollution in another kind of media. Using these results in watershed environmental management could effectively reduce the costs of environmental monitoring and provide the basis for further research on water environmental risk management and control.
5. Conclusions
An overview of surface water quality, heavy metals in sediments and their synergic pollution characteristics within the Haihe River Basin has been given. Mean concentrations of total nitrogen (TN), total phosphorus (TP), ammonia nitrogen (NH3-N), nitrate nitrogen (NO3-N), chemical oxygen demand (COD) in waters and heavy metals (Cd, As, Pb, Cu, Ni, Zn, Cr) in sediments were investigated in the Haihe River Basin. The mean TN, TP, NH3-N, NO3-N, and COD were 5.05, 0.98, 0.45, 3.56 and 37.87 mg/L, respectively, while the mean concentrations of Cd, As, Pb, Cu, Ni, Zn, Cr were 51.01 mg/kg, 167.27 mg/kg, 112.09 mg/kg, 37.81 mg/kg, 41.38 mg/kg, 0.20 mg/kg and 7.56 mg/kg, respectively. The mean EI value was 67.93, and the surface water quality in the Haihe River Basin was poor, which implied serious eutrophication in the whole basin. The BSRDP watershed had the highest level of eutrophication due to anthropogenic emissions from urban areas. Potential ecological risk index (PER) values showed that the ZYR and DQR watersheds were confronted with moderate levels of potential ecological risk of heavy metal pollution in sediments. High EF values and industry structure based on the resource and energy consumption and heavy industry there showed human activities in industry production lead to metal pollution and enrichment in these watersheds. Among all the metals, Cd showed the highest potential ecological risk level, and Cd, Zn, Cu and Pb showed the greatest anthropogenic enrichment, as indicated by enrichment factor (EF) values >2. The synergic pollution of heavy metals in sediments and eutrophication in waters occurred in the Haihe River Basin, particularly in the central regions of the Haihe River Basin where intensive human activities existed. The relationship between the degree of synergic pollution and socioeconomic data revealed that in the Haihe River Basin, synergic pollution was significantly correlated with GDP and population, especially secondary industrial output. These findings confirmed the conclusion that intensive human activities in industrial and agricultural production, especially in secondary industry, significantly influenced the synergic pollution of heavy metals in sediments and eutrophication in waters. This result is not only applicable for regional environmental protection and development in the Haihe River Basin but can also be extended into regions in which serious synergic pollution may occur. In regions where intensive human activities exist, especially with developed secondary industry, water eutrophication and sediment pollution by heavy metals usually occur simultaneously. Therefore, when serious water pollution occurs in these developed regions, corresponding pollution of heavy metals in sediments will exist as well, and the pollution in one kind of media can serve as an indicator for pollution in another kind of media. For better environmental monitoring and management, these conclusions should be taken into consideration, and effective measures must be taken to optimize industrial structure, vigorously support environmentally friendly enterprise sand increase investments in environmental protection for high polluting enterprises to reduce pollution emissions and prevent the synergic pollution that occurs in areas strongly affected by anthropogenic activities.
Acknowledgments
This work was financed by the Natural Science Foundation of China (41590843) and State Key S&T Special Projects (2016YFC0503000).
Author Contributions
Peiru Kong did the sampling, experiments, data analysis and wrote the manuscript; Ranhao Sun helped design the experiment and sampling; Xian Cheng helped the sampling and experiments; Liding Chen helped design the sampling, gave foundation support and revised the paper.
Conflicts of Interest
The authors declare no conflict of interest.
References
- Gooddy, D.C.; Lapworth, D.J.; Bennett, S.A.; Heaton, T.H.E.; Williams, P.J.; Surridge, B.W.J. A multi-stable isotope framework to understand eutrophication in aquatic ecosystems. Water Res. 2016, 88, 623–633. [Google Scholar] [CrossRef] [PubMed] [Green Version]
- Zhang, H.; Lin, C.; Lei, P.; Shan, B. Evaluation of river eutrophication of the Haihe River Basin. Acta Sci. Circumst. 2015, 35, 2336–2344. (In Chinese) [Google Scholar]
- Zhang, R.; Zhou, L.; Zhang, F.; Ding, Y.; Gao, J.; Chen, J.; Yan, H.; Shao, W. Heavy metal pollution and assessment in the tidal flat sediments of Haizhou Bay, China. Mar. Pollut. Bull. 2013, 74, 403–412. [Google Scholar] [CrossRef] [PubMed]
- Tekile, A.; Kim, I.; Kim, J. Mini-review on river eutrophication and bottom improvement techniques, with special emphasis on the Nakdong River. J. Environ. Sci. 2015, 30, 113–121. [Google Scholar] [CrossRef] [PubMed]
- Smith, V.H.; Tilman, G.D.; Nekola, J.C. Eutrophication: Impacts of excess nutrient inputs on freshwater, marine, and terrestrial ecosystems. Environ. Pollut. 1999, 100, 179–196. [Google Scholar] [CrossRef]
- Lijklema, L. Development and eutrophication: Experiences and perspectives. Water Sci. Technol. 1995, 31, 11–15. [Google Scholar]
- Strokal, M.; Yang, H.; Zhang, Y.; Kroeze, C.; Li, L.; Luan, S.; Wang, H.; Yang, S.; Zhan, Y. Increasing eutrophication in the coastal seas of China from 1970 to 2050. Mar. Pollut. Bull. 2014, 85, 123–140. [Google Scholar] [CrossRef] [PubMed]
- Herbeck, L.S.; Unger, D.; Wu, Y.; Jennerjahn, T.C. Effluent, nutrient and organic matter export from shrimp and fish ponds causing eutrophication in coastal and back-reef waters of NE Hainan, tropical China. Cont. Shelf Res. 2013, 57, 92–104. [Google Scholar] [CrossRef]
- Zhang, C.; Yu, Z.-G.; Zeng, G.-M.; Jiang, M.; Yang, Z.-Z.; Cui, F.; Zhu, M.-Y.; Shen, L.-Q.; Hu, L. Effects of sediment geochemical properties on heavy metal bioavailability. Environ. Int. 2014, 73, 270–281. [Google Scholar] [CrossRef] [PubMed]
- Yi, Y.; Yang, Z.; Zhang, S. Ecological risk assessment of heavy metals in sediment and human health risk assessment of heavy metals in fishes in the middle and lower reaches of the Yangtze River basin. Environ. Pollut. 2011, 159, 2575–2585. [Google Scholar] [CrossRef] [PubMed]
- Peng, J.-F.; Song, Y.-H.; Yuan, P.; Cui, X.-Y.; Qiu, G.-L. The remediation of heavy metals contaminated sediment. J. Hazard. Mater. 2009, 161, 633–640. [Google Scholar] [CrossRef] [PubMed]
- Gao, X.; Chen, C.-T.A. Heavy metal pollution status in surface sediments of the coastal Bohai Bay. Water Res. 2012, 46, 1901–1911. [Google Scholar] [CrossRef] [PubMed]
- Christophoridis, C.; Dedepsidis, D.; Fytianos, K. Occurrence and distribution of selected heavy metals in the surface sediments of Thermaikos Gulf, N. Greece. Assessment using pollution indicators. J. Hazard. Mater. 2009, 168, 1082–1091. [Google Scholar] [CrossRef] [PubMed]
- Vega, M.; Pardo, R.; Barrado, E.; Debán, L. Assessment of seasonal and polluting effects on the quality of river water by exploratory data analysis. Water Res. 1998, 32, 3581–3592. [Google Scholar] [CrossRef]
- Zheng, M.; Zheng, H.; Wu, Y.; Xiao, Y.; Du, Y.; Xu, W.; Lu, F.; Wang, X.; Ouyang, Z. Changes in nitrogen budget and potential risk to the environment over 20 years (1990–2010) in the agroecosystems of the Haihe Basin, China. J. Environ. Sci. 2015, 28, 195–202. [Google Scholar] [CrossRef] [PubMed]
- Wang, Z.-G.; Luo, Y.-Z.; Zhang, M.-H.; Xia, J. Quantitative Evaluation of Sustainable Development and Eco-Environmental Carrying Capacity in Water-Deficient Regions: A Case Study in the Haihe River Basin, China. J. Integr. Agric. 2014, 13, 195–206. [Google Scholar] [CrossRef]
- Liu, X.; Li, G.; Liu, Z.; Guo, W.; Gao, N. Water Pollution Characteristics and Assessment of Lower Reaches in Haihe River Basin. Procedia Environ. Sci. 2010, 2, 199–206. [Google Scholar] [CrossRef]
- Yang, B.; Zhiyun, O.; Hua, Z.; Weihua, X.; Cheng, Z.; Changwei, Z.; Shuai, C.; Bo, J. Ecosystems patterns and dynamics in Haihe river basin. Acta Ecol. Sin. 2010, 30, 327–334. [Google Scholar] [CrossRef]
- Yang, T.; Liu, J.; Chen, Q. Evaluation of Environmental Flow Requirement for Improvement of River Ecological Integrity in the Haihe River Basin, China. Fresenius Environ. Bull. 2014, 23, 1121–1130. [Google Scholar]
- Qin, C.; Jia, Y.; Su, Z.; Bressers, H.T.A.; Wang, H. An Analysis of Water Consumption and Pollution with the Input-Output Model in the Haihe River Basin, China. Environ. Eng. 2014, 864–867, 1059–1069. [Google Scholar] [CrossRef]
- Wu, M.; Huang, S.; Wen, W.; Sun, X.; Tang, X.; Scholz, M. Nutrient distribution within and release from the contaminated sediment of Haihe River. J. Environ. Sci. 2011, 23, 1086–1094. [Google Scholar] [CrossRef]
- Tang, W.; Zhao, Y.; Wang, C.; Shan, B.; Cui, J. Heavy metal contamination of overlying waters and bed sediments of Haihe Basin in China. Ecotoxicol. Environ. Saf. 2013, 98, 317–323. [Google Scholar] [CrossRef] [PubMed]
- Liu, J.; Luan, Y.; Su, L.; Cao, Z.; Zeng, B. Public participation in water resources management of Haihe river basin, China: The analysis and evaluation of status quo. Procedia Environ. Sci. 2010, 2, 1750–1758. [Google Scholar]
- Li, Z.; Wang, J.; Guo, C. A universal index formula for eutrophic evaluation using a logarithmic power function. Acta Sci. Circumst. 2010, 30, 664–672. (In Chinese) [Google Scholar]
- Li, R.; Li, R.; Chai, M.; Shen, X.; Xu, H.; Qiu, G. Heavy metal contamination and ecological risk in Futian mangrove forest sediment in Shenzhen Bay, South China. Mar. Pollut. Bull. 2015, 101, 448–456. [Google Scholar] [CrossRef] [PubMed]
- Hakanson, L. An ecological risk index for aquatic pollution control. A sedimentological approach. Water Res. 1980, 14, 975–1001. [Google Scholar] [CrossRef]
- Feng, H.; Han, X.F.; Zhang, W.G.; Yu, L.Z. A preliminary study of heavy metal contamination in Yangtze River intertidal zone due to urbanization. Mar. Pollut. Bull. 2004, 49, 910–915. [Google Scholar] [CrossRef] [PubMed]
- Ghrefat, H.; Yusuf, N. Assessing Mn, Fe, Cu, Zn, and Cd pollution in bottom sediments of Wadi Al-Arab Dam, Jordan. Chemosphere 2006, 65, 2114–2121. [Google Scholar] [CrossRef] [PubMed]
- Zhang, J.; Liu, C.L. Riverine Composition and Estuarine Geochemistry of Particulate Metals in China—Weathering Features, Anthropogenic Impact and Chemical Fluxes. Estuar. Coast. Shelf Sci. 2002, 54, 1051–1070. [Google Scholar] [CrossRef]
- Han, Y.; Du, P.; Cao, J.; Posmentier, E.S. Multivariate analysis of heavy metal contamination in urban dusts of Xi’an, Central China. Sci. Total Environ. 2006, 355, 176–186. [Google Scholar]
- Wang, L.; Liu, L.; Zheng, B. Eutrophication development and its key regulating factors in a water-supply reservoir in North China. J. Environ. Sci. 2013, 25, 962–970. [Google Scholar] [CrossRef]
- Li, F.; Sun, H.; Hao, Z.; He, N.; Zhao, L.; Zhang, T.; Sun, T. Perfluorinated compounds in Haihe River and Dagu Drainage Canal in Tianjin, China. Chemosphere 2011, 84, 265–271. [Google Scholar] [CrossRef] [PubMed]
- State Environmental Protection Administration. Background Values of Soil Elements in China; China Environmental Science Press: Brighton, UK, 1990.
- Chai, M.; Shi, F.; Li, R.; Shen, X. Heavy metal contamination and ecological risk in Spartina alterniflora marsh in intertidal sediments of Bohai Bay, China. Mar. Pollut. Bull. 2014, 84, 115–124. [Google Scholar] [CrossRef] [PubMed]
- Bastami, K.D.; Bagheri, H.; Kheirabadi, V.; Zaferani, G.G.; Teymori, M.B.; Hamzehpoor, A.; Soltani, F.; Haghparast, S.; Harami, S.R.M.; Ghorghani, N.F.; et al. Distribution and ecological risk assessment of heavy metals in surface sediments along southeast coast of the Caspian Sea. Mar. Pollut. Bull. 2014, 81, 262–267. [Google Scholar] [CrossRef] [PubMed]
- Hamdoun, H.; Van-Veen, E.; Basset, B.; Lemoine, M.; Coggan, J.; Leleyter, L.; Baraud, F. Characterization of harbor sediments from the English Channel: Assessment of heavy metal enrichment, biological effect and mobility. Mar. Pollut. Bull. 2015, 90, 273–280. [Google Scholar] [CrossRef] [PubMed]
- Wang, X.; Zou, Z.; Zou, H. Water quality evaluation of Haihe River with fuzzy similarity measure methods. J. Environ. Sci. 2013, 25, 2041–2046. [Google Scholar] [CrossRef]
- Yin, L.; Ling, J. The Research of the Distribution of Phosphorus Content in Major Rivers in Tianjin. J. Anhui Agric. 2011, 36, 14764–14765. (In Chinese) [Google Scholar]
- Zhao, X.; Shan, B.; Zhang, W. Forms and Spatial Distribution Characteristics of Nitrogen in Ziya River Basin. Environ. Sci. 2014, 35, 143–149. (In Chinese) [Google Scholar]
- Zhao, Y.; Shan, B.; Tang, W.; Zhang, H. Nitrogen mineralization and geochemical characteristics of amino acids in surface sediments of a typical polluted area in the Haihe River Basin, China. Environ. Sci. Pollut. Res. 2015, 22, 17975–17986. [Google Scholar] [CrossRef] [PubMed]
- Smith, V.H. Eutrophication A2—Likens, Gene E. In Encyclopedia of Inland Waters; Academic Press: Oxford, UK, 2009; pp. 61–73. [Google Scholar]
- Tang, W.; Zhang, H.; Shan, B.; Li, S. Accumulation and risk assessment of sedimentary trace metals in response to industrialization from the tributaries of Fuyang River System. Environ. Earth Sci. 2015, 73, 1975–1982. [Google Scholar] [CrossRef]
- Tang, W.; Wang, L.; Shan, B.; Zhao, Y. Heavy metal pollution of the surface sediments in Daqing River System, Haihe Basin. Acta Sci. Circumst. 2015, 35, 3620–3627. (In Chinese) [Google Scholar]
- Wang, R.; Cheng, X.; Sun, R. Ecological Risk Assesment of Heavy Metals in Surface Sediments in the Southern and Central Haihe River Basin. Environ. Sci. 2014, 35, 3740–3747. (In Chinese) [Google Scholar]
- Hao, H.; Zhou, H.; Wang, J.; Li, G. Assessment on potential ecological risk due to heavy metals pollution in sediment in the South Zhangwei Canal. J. China Inst. Water Resour. Hydropower Res. 2005, 3, 109–115. (In Chinese) [Google Scholar]
Figure 1.
Distribution of sampling sites in the Haihe River Basin.
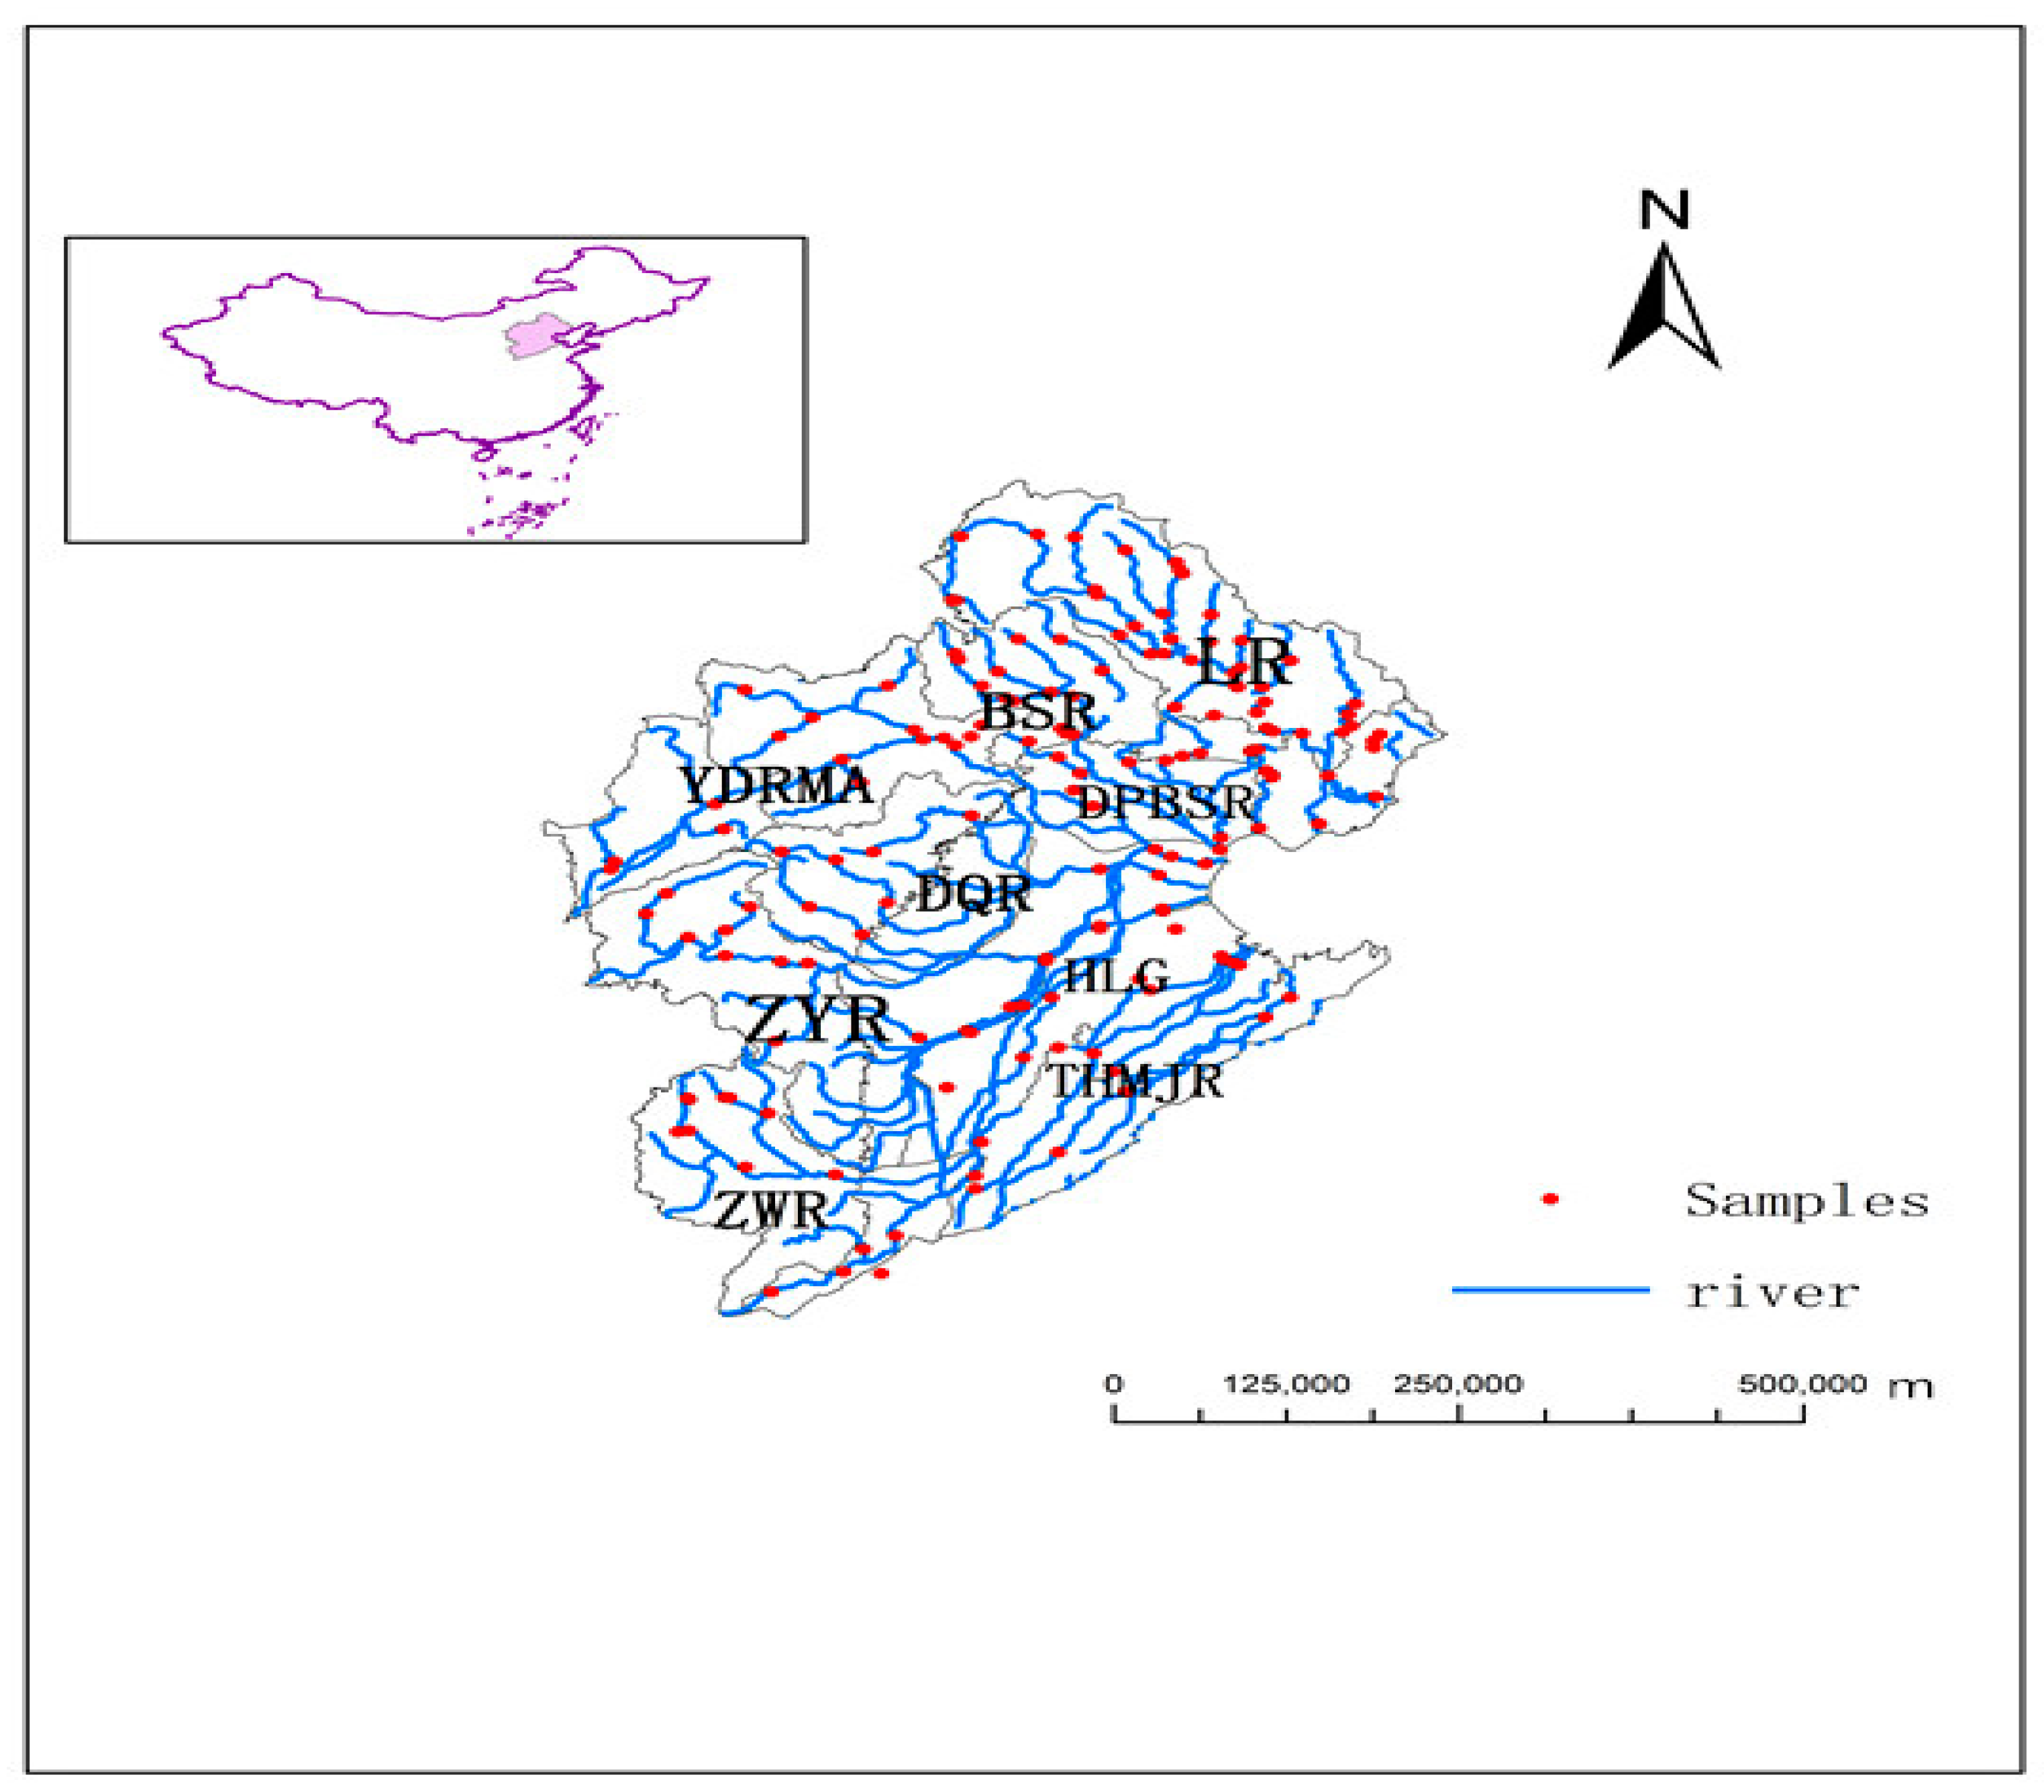
Figure 2.
(a) Enrichment factors (EF) of heavy metals in the Haihe Basin; (b) Eutrophication index (EI) in the Haihe River Basin; (c) Potential ecological risk index (RI) of heavy metals in the Haihe Basin.
Figure 2.
(a) Enrichment factors (EF) of heavy metals in the Haihe Basin; (b) Eutrophication index (EI) in the Haihe River Basin; (c) Potential ecological risk index (RI) of heavy metals in the Haihe Basin.
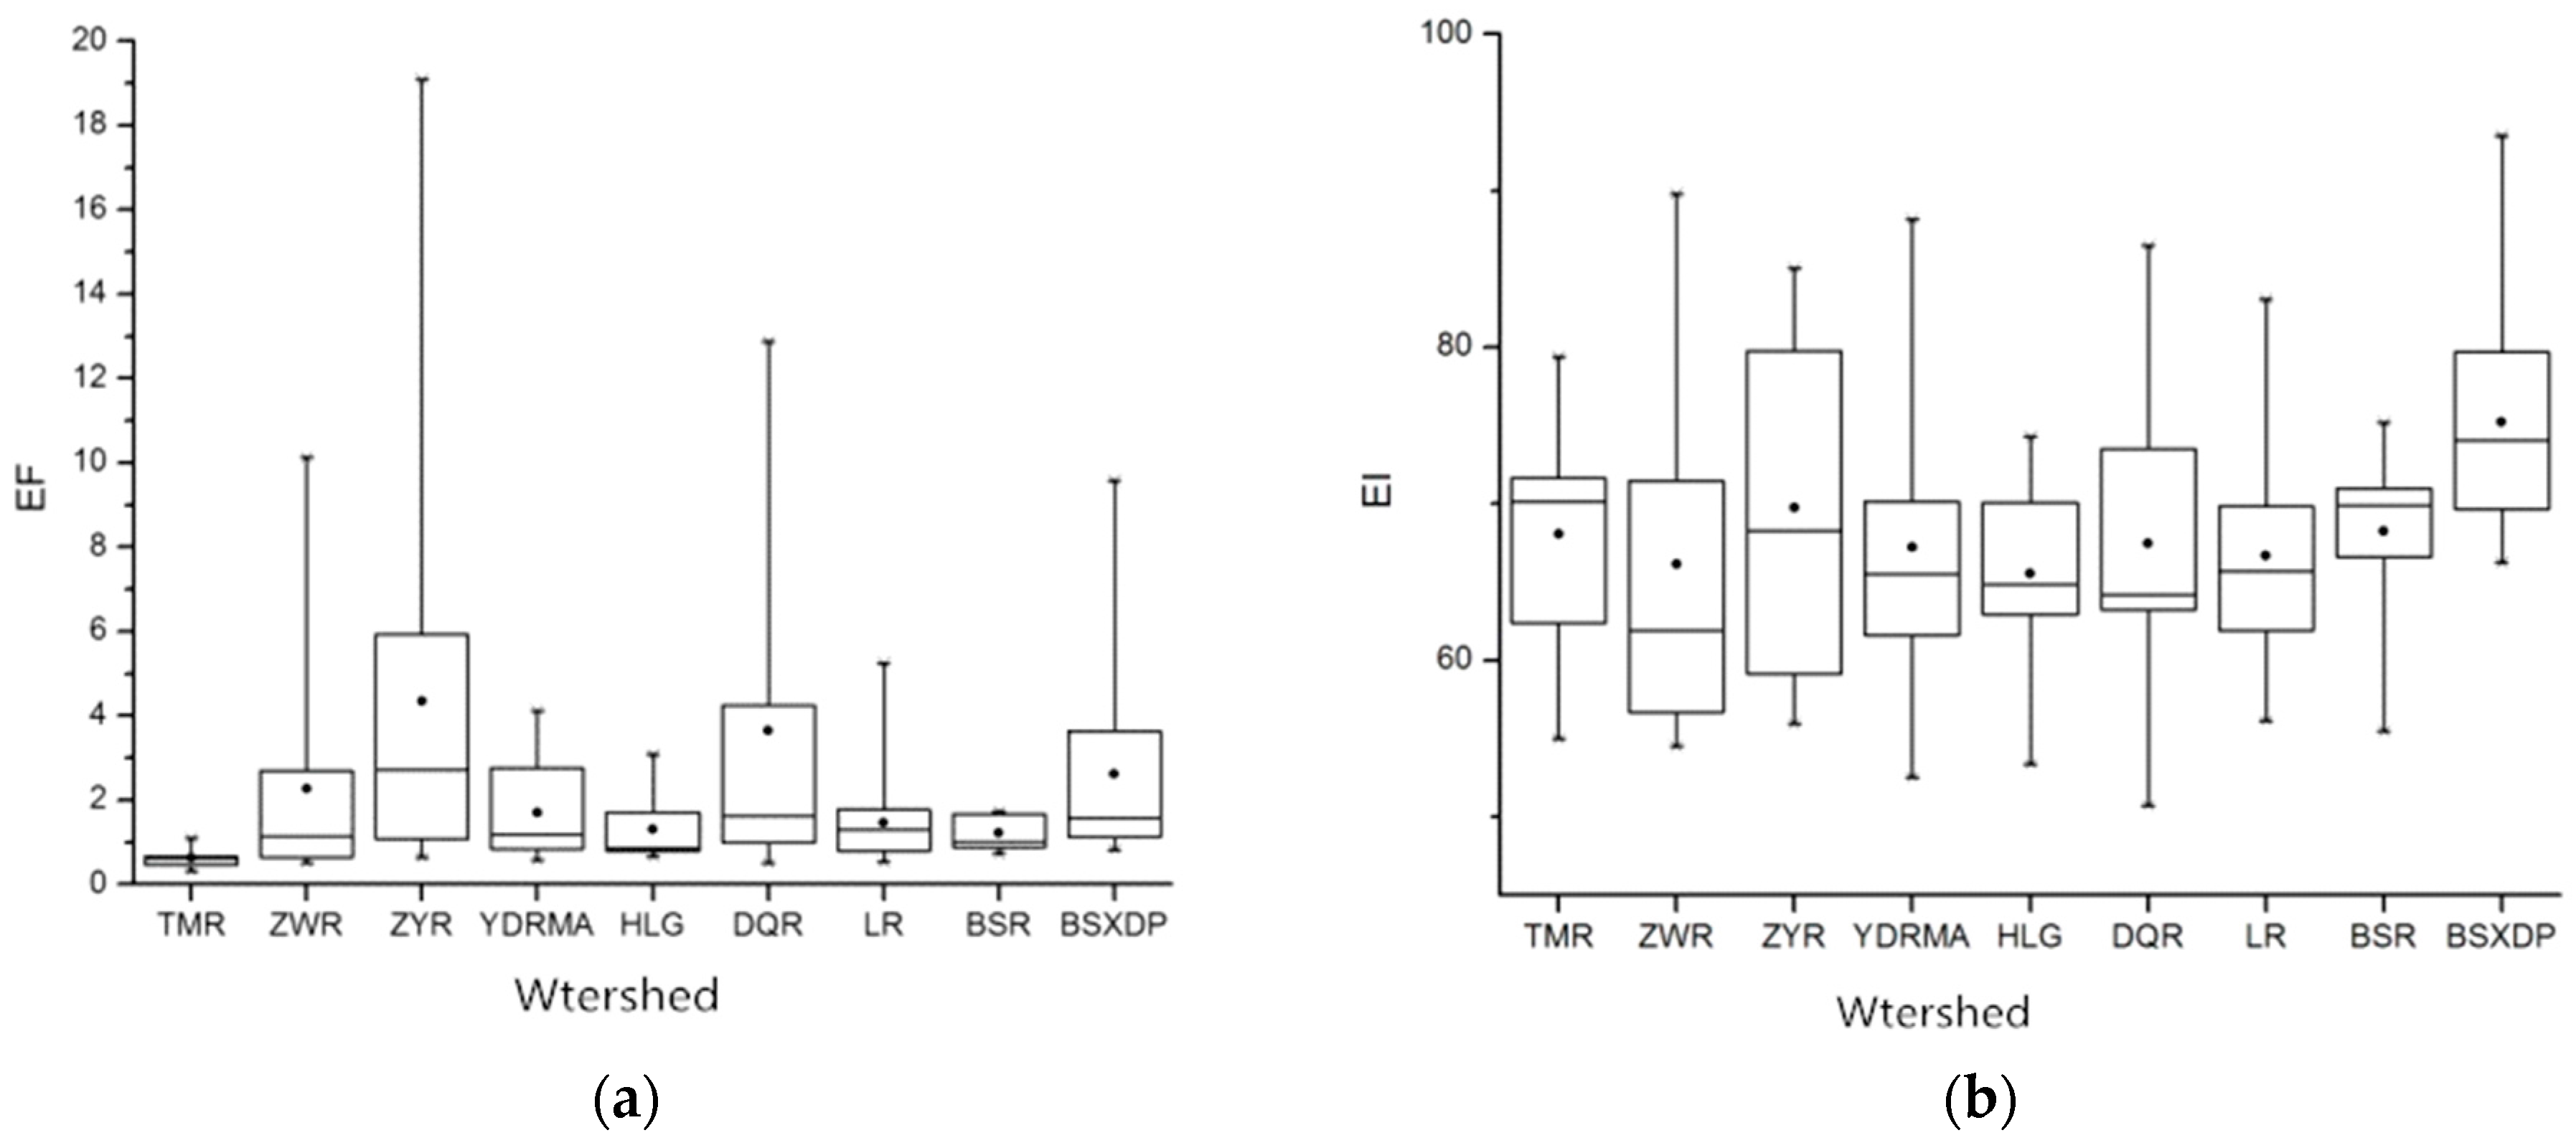
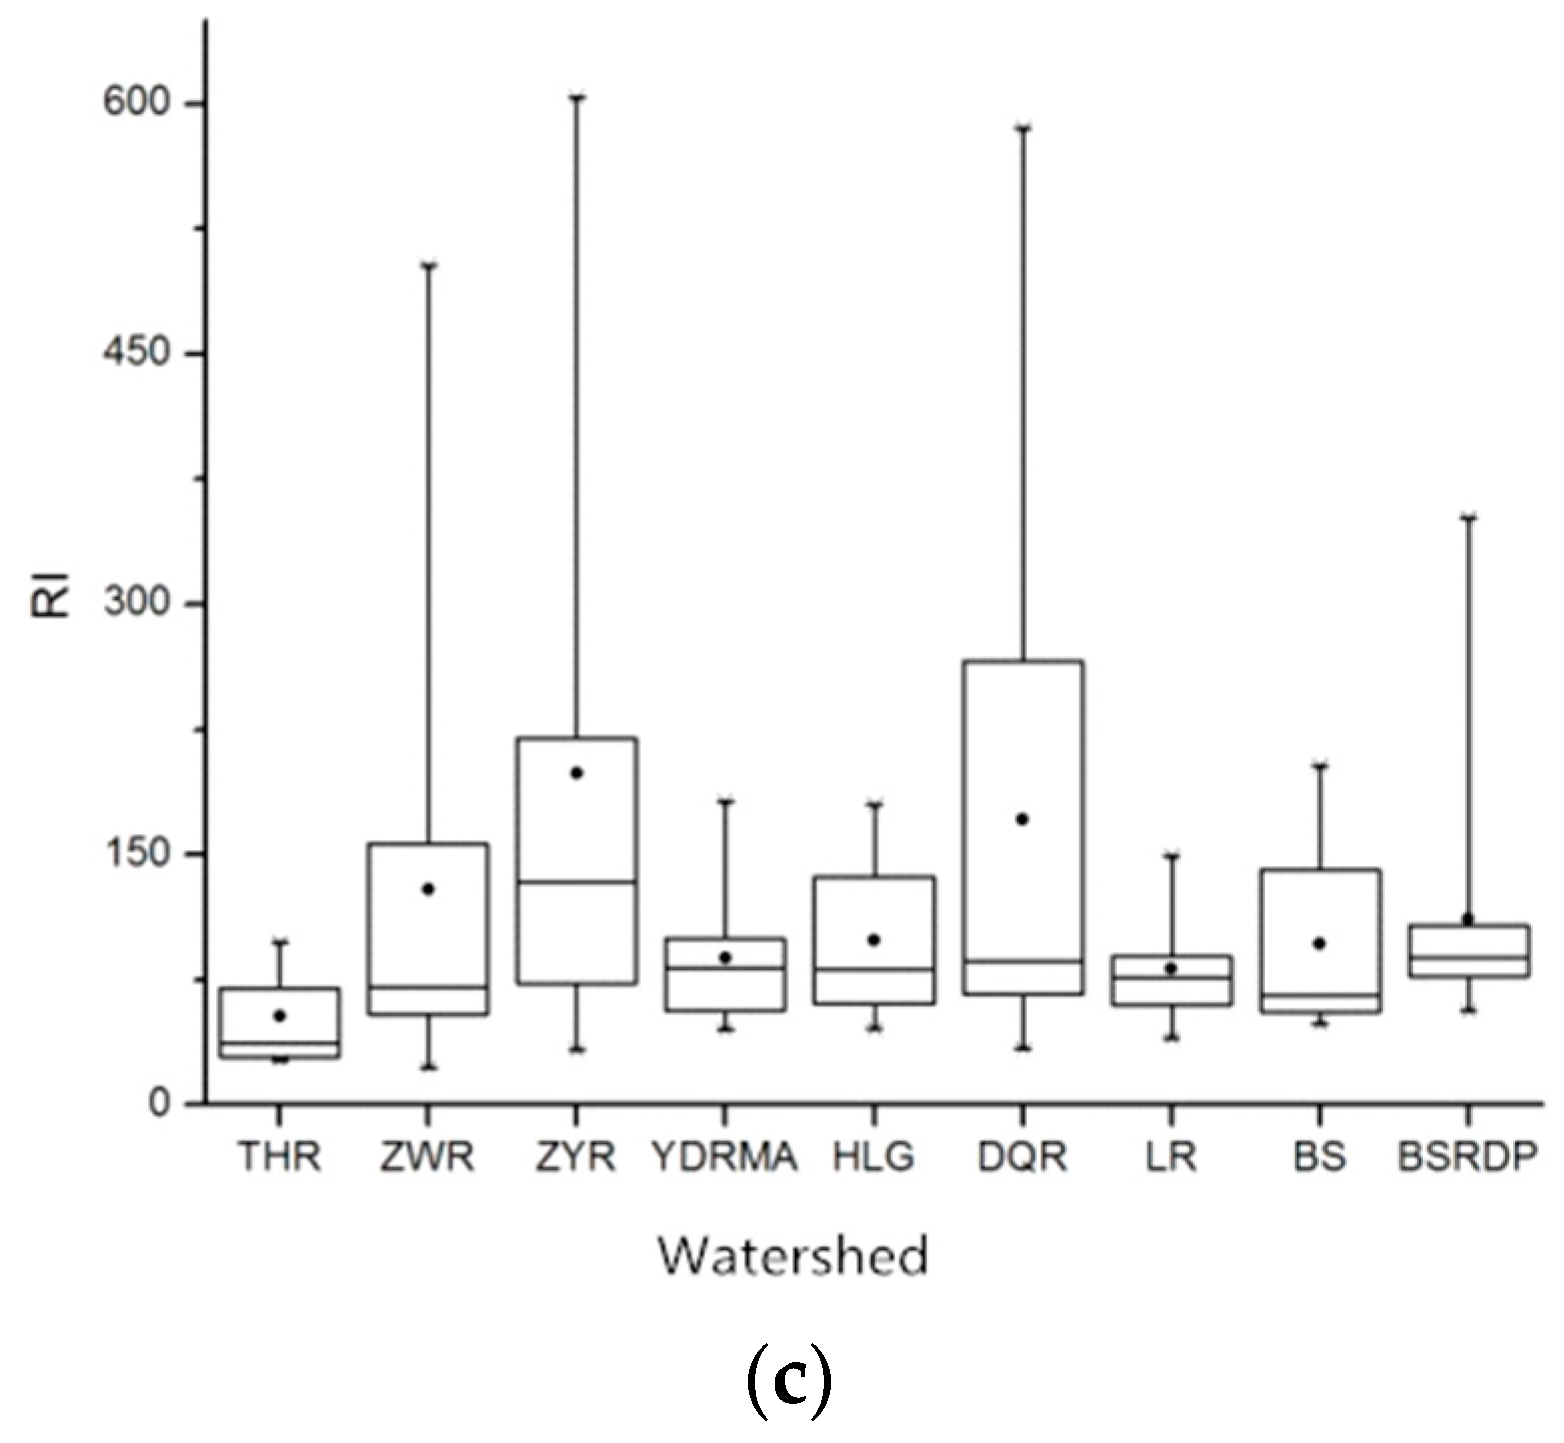
Figure 3.
(a) Correlation between eutrophication in water bodies and potential risk of heavy metals in sediments in BSR Basin; (b) Correlation between eutrophication in water bodies and potential risk of heavy metals in sediments in DPBSR Basin; (c) Correlation between eutrophication in water bodies and potential risk of heavy metals in sediments in DQR Basin; (d) Correlation between eutrophication in water bodies and potential risk of heavy metals in sediments in HLG Basin; (e) Correlation between eutrophication in water bodies and potential risk of heavy metals in sediments in HRB Basin; (f) Correlation between eutrophication in water bodies and potential risk of heavy metals in sediments in LR Basin; (g) Correlation between eutrophication in water bodies and potential risk of heavy metals in sediments in THMJR Basin; (h) Correlation between eutrophication in water bodies and potential risk of heavy metals in sediments in YDRMA Basin; (i) Correlation between eutrophication in water bodies and potential risk of heavy metals in sediments in ZWR Basin; (j) Correlation between eutrophication in water bodies and potential risk of heavy metals in sediments in ZYR Basin.
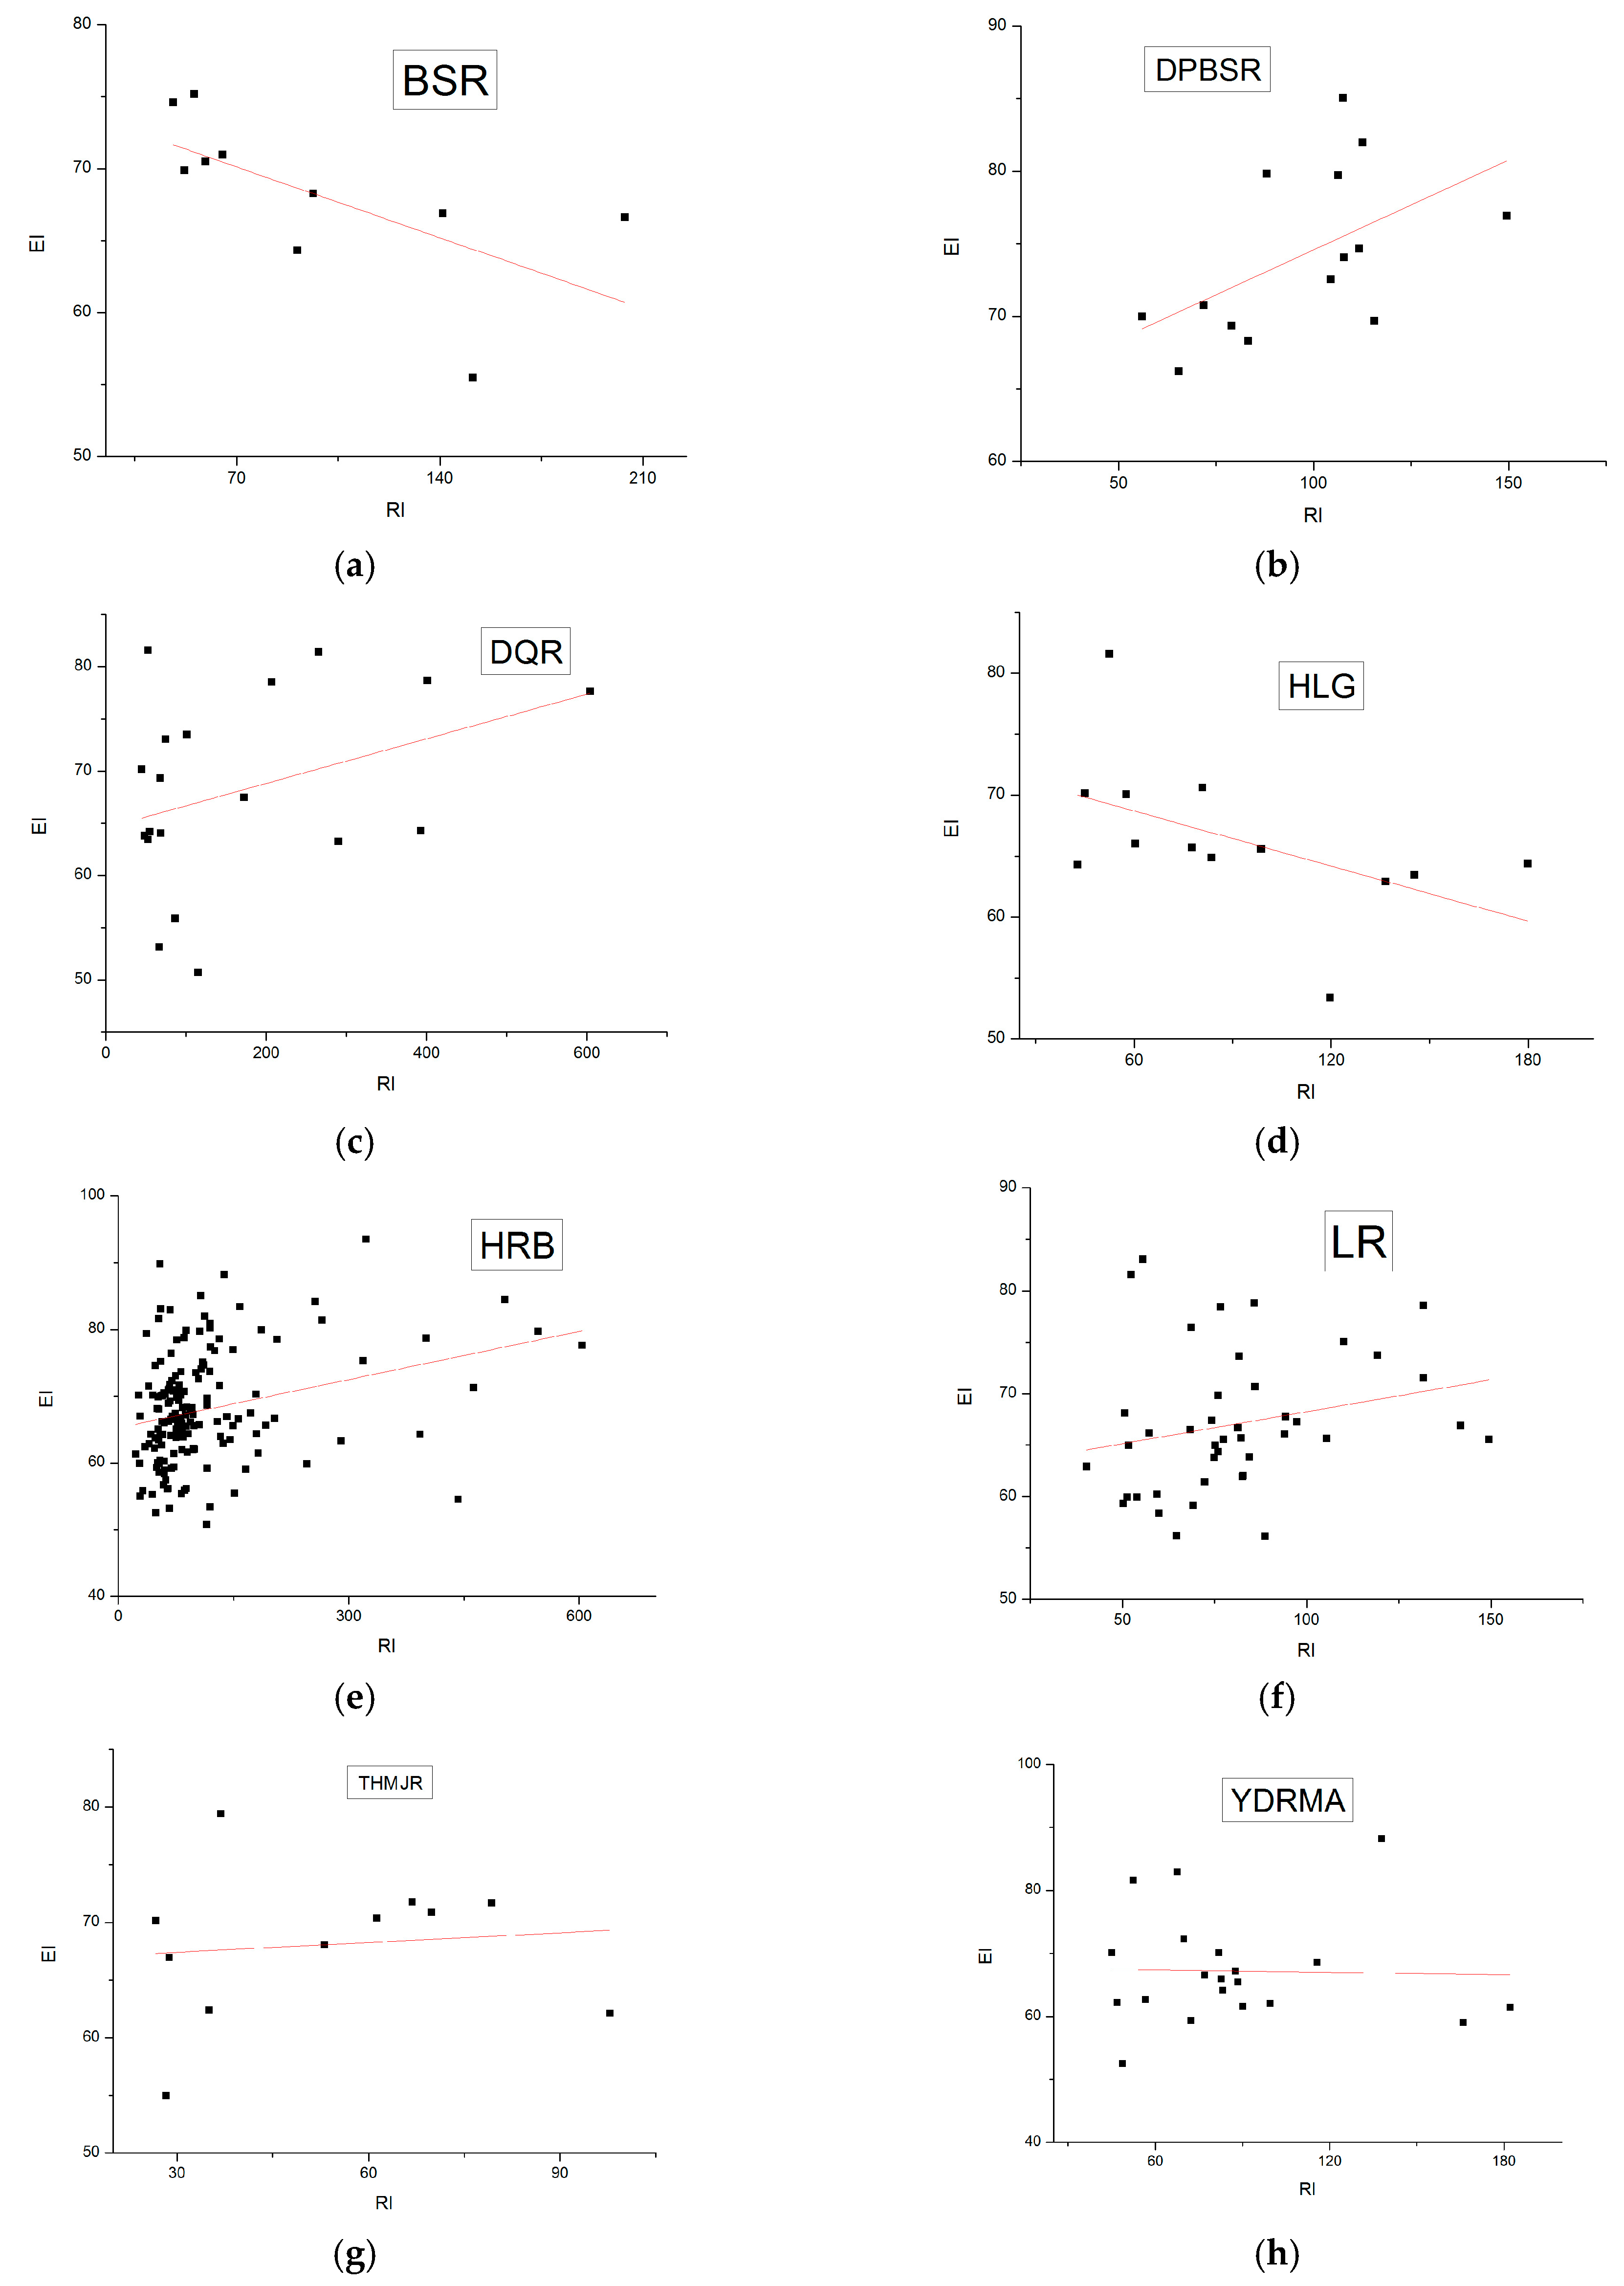

Figure 4.
(a) Correlation between GDP and degree of combined pollution of eutrophication in water bodies and potential risk of heavy metals in sediments in the Haihe River Basin; (b) Correlation between population and degree of combined pollution of eutrophication in water bodies and potential risk of heavy metals in sediments in the Haihe River Basin; (c) Correlation primary industry and degree of combined pollution of eutrophication in water bodies and potential risk of heavy metals in sediments in the Haihe River Basin; (d) Correlation secondary industry and degree of combined pollution of eutrophication in water bodies and potential risk of heavy metals in sediments in the Haihe River Basin; (e) Correlation tertiary industry and degree of combined pollution of eutrophication in water bodies and potential risk of heavy metals in sediments in the Haihe River Basin.


Table 1.
Population and economy data of different watersheds in the Haihe Basin (2011).
| Sub-Watershed | Population | Area (km2) | GDP (10,000 RMB) | Primary Industry | Secondary Industry | Tertiary Industry |
|---|---|---|---|---|---|---|
| TMR | 18,510,849 | 31,791 | 71,021,404 | 7,243,197 | 42,719,075 | 20,781,532 |
| LR | 7,804,268 | 54,714 | 42,525,138 | 5,921,784 | 22,001,459 | 14,606,857 |
| BSR | 2,876,720 | 22,837 | 10,549,533 | 1,085,942 | 5,701,739 | 3,762,852 |
| DPBSR | 22,869,859 | 15,526 | 182,803,065 | 8,309,523 | 60,153,210 | 114,644,832 |
| YDRMA | 8,174,667 | 45,110 | 24,551,780 | 3,074,289 | 11,205,801 | 10,315,630 |
| HLG | 13,973,100 | 22,623 | 31,798,491 | 5,539,002 | 15,609,087 | 8,650,504 |
| ZYR | 22,222,428 | 45,961 | 118,990,777 | 15,780,793 | 63,784,257 | 40,233,729 |
| DQR | 31,539,879 | 44,930 | 149,004,884 | 8,851,276 | 76,784,508 | 62,987,377 |
| ZWR | 7,419,872 | 35,126 | 17,033,732 | 1,600,767 | 10,106,470 | 5,326,496 |
Note: Data source: China’s Statistical Yearbook (2011).
Table 2.
Mean concentration and Guidelines (GB3838-2002) of nutrients compounds in surface water (mg/L).
Table 2.
Mean concentration and Guidelines (GB3838-2002) of nutrients compounds in surface water (mg/L).
| Polluant | I | II | III | VI | V | Haihe |
|---|---|---|---|---|---|---|
| TN | 0.2 | 0.5 | 1 | 1.5 | 2 | 5.05 |
| TP | 0.02 | 0.01 | 0.2 | 0.30 | 0.4 | 0.98 |
| NH3-N | 0.15 | 0.5 | 1 | 1.5 | 2 | 0.45 |
| NO3-N | 2 | 5 | 10 | 20 | 20 | 3.56 |
| COD | 15 | 15 | 20 | 30 | 40 | 37.87 |
Table 3.
Mean concentration, potential ecological risk index (PER) and enrichment factors (EF) of heavy metals in Haihe Basin.
Table 3.
Mean concentration, potential ecological risk index (PER) and enrichment factors (EF) of heavy metals in Haihe Basin.
| Cu | Zn | Cr | Pb | Ni | Cd | As | |
|---|---|---|---|---|---|---|---|
| Concentration (mg/kg) | 51.01 | 167.27 | 112.09 | 37.81 | 41.38 | 0.20 | 7.56 |
| Background value (mg/kg) | 20.00 | 67.7 | 53.9 | 26.0 | 26.9 | 0.074 | 9.21 |
| PER | 10.57 | 2.34 | 3.26 | 8.79 | 7.00 | 68.71 | 10.81 |
| EF | 2.35 | 3.38 | 1.10 | 2.50 | 1.05 | 3.71 | 1.02 |
Table 4.
Pearson correlation coefficients for the relationships between the concentrations of pollutants analyzed in samples from Haihe Basin.
Table 4.
Pearson correlation coefficients for the relationships between the concentrations of pollutants analyzed in samples from Haihe Basin.
| NH3-N | NO3-N | TN | TP | COD | Cu | Zn | Cr | Pb | Ni | Cd | As | |
|---|---|---|---|---|---|---|---|---|---|---|---|---|
| NH3-N | 1 | |||||||||||
| NO3-N | 0.046 | 1 | ||||||||||
| TN | 0.611 ** | 0.605 ** | 1 | |||||||||
| TP | 0.067 | 0.035 | −0.012 | 1 | ||||||||
| COD | 0.286 ** | −0.081 | 0.167 * | 0.169 * | 1 | |||||||
| Cu | 0.212 ** | 0.375 ** | 0.374 ** | 0.150 | 0.190 * | 1 | ||||||
| Zn | 0.355 ** | 0.101 | 0.267 ** | 0.091 | 0.255 ** | 0.581 ** | 1 | |||||
| Cr | 0.135 | 0.065 | 0.158 * | 0.125 | 0.198 * | 0.223 ** | 0.617 ** | 1 | ||||
| Pb | 0.149 | 0.130 | 0.130 | −0.106 | 0.069 | 0.248 ** | 0.537 ** | 0.195 * | 1 | |||
| Ni | 0.288 ** | 0.194 * | 0.328 ** | 0.154 | 0.205 ** | 0.686 ** | 0.809 ** | 0.673 ** | 0.245 ** | 1 | ||
| Cd | 0.090 | 0.071 | 0.089 | −0.002 | 0.118 | 0.241 ** | 0.511 ** | 0.375 ** | 0.468 ** | 0.364 ** | 1 | |
| As | −0.065 | −0.094 | −0.148 | 0.128 | −0.170 * | −0.019 | 0.002 | −0.005 | 0.164 * | −0.017 | 0.183 * | 1 |
Notes: * Correlation significant at the 0.05 level (2-tailed). ** Correlation significant at the 0.01 level (2-tailed).
Table 5.
Pearson correlation coefficients (r) and R2 between calculated EI and RI in the Haihe River Basin.
Table 5.
Pearson correlation coefficients (r) and R2 between calculated EI and RI in the Haihe River Basin.
| TMR | ZWR | ZYR | YDRMA | HLG | DQR | LR | BSR | BSRDP | HRB | |
|---|---|---|---|---|---|---|---|---|---|---|
| r | 0.104 | 0.264 | 0.627 ** | 0.379 | −0.027 | 0.992 ** | 0.235 * | −0.654 | 0.631 ** | 0.318 * |
| R2 | 0.01 | 0.069 | 0.393 | 0.143 | 0.001 | 0.984 | 0.055 | 0.428 | 0.398 | 0.101 |
Notes: * Correlation significant at the 0.05 level (2-tailed). ** Correlation significant at the 0.01 level (2-tailed).
Table 6.
Pearson correlation coefficients (r) and R2 between combined pollution of water environmental and socio-economical factors in the Haihe River Basin.
Table 6.
Pearson correlation coefficients (r) and R2 between combined pollution of water environmental and socio-economical factors in the Haihe River Basin.
| Population | GDP | Primary Industry | Secondary Industry | Tertiary Industry | |
|---|---|---|---|---|---|
| r | 0.789 ** | 0.749 ** | 0.625 | 0.781 ** | 0.642 |
| R2 | 0.625 | 0.559 | 0.388 | 0.608 | 0.412 |
Note: ** Correlation significant at the 0.01 level (2-tailed).
© 2018 by the authors. Licensee MDPI, Basel, Switzerland. This article is an open access article distributed under the terms and conditions of the Creative Commons Attribution (CC BY) license (http://creativecommons.org/licenses/by/4.0/).
Share and Cite
MDPI and ACS Style
Kong, P.; Cheng, X.; Sun, R.; Chen, L. The Synergic Characteristics of Surface Water Pollution and Sediment Pollution with Heavy Metals in the Haihe River Basin, Northern China. Water 2018, 10, 73. https://doi.org/10.3390/w10010073
AMA Style
Kong P, Cheng X, Sun R, Chen L. The Synergic Characteristics of Surface Water Pollution and Sediment Pollution with Heavy Metals in the Haihe River Basin, Northern China. Water. 2018; 10(1):73. https://doi.org/10.3390/w10010073
Chicago/Turabian StyleKong, Peiru, Xian Cheng, Ranhao Sun, and Liding Chen. 2018. "The Synergic Characteristics of Surface Water Pollution and Sediment Pollution with Heavy Metals in the Haihe River Basin, Northern China" Water 10, no. 1: 73. https://doi.org/10.3390/w10010073
Note that from the first issue of 2016, this journal uses article numbers instead of page numbers. See further details here.