Long-Term River Water Quality Trends and Pollution Source Apportionment in Taiwan
by

Marsha Savira Agatha Putri
1, 
Chao-Hsun Lou
1,
Mat Syai’in
2,
Shang-Hsin Ou
3 and
Yu-Chun Wang
1,* 1
Department of Environmental Engineering, College of Engineering, Chung Yuan Christian University, Taoyuan 32023, Taiwan
2
Department of Automation Engineering, Shipbuilding Institute of Polytechnic Surabaya, East Java 60111, Indonesia
3
Taiwan Water Corporation, Taichung 32404, Taiwan
*
Author to whom correspondence should be addressed.
Water 2018, 10(10), 1394; https://doi.org/10.3390/w10101394
Submission received: 23 August 2018
/
Revised: 24 September 2018
/
Accepted: 4 October 2018
/
Published: 8 October 2018
(This article belongs to the Special Issue Emerging Contaminants in Water: Detection, Treatment, and Regulation)
Abstract
:The application of multivariate statistical techniques including cluster analysis and principal component analysis-multiple linear regression (PCA-MLR) was successfully used to classify the river pollution level in Taiwan and identify possible pollution sources. Water quality and heavy metal monitoring data from the Taiwan Environmental Protection Administration (EPA) was evaluated for 14 major rivers in four regions of Taiwan with the Erren River classified as the most polluted river in the country. Biochemical oxygen demand (6.1 ± 2.38), ammonia (3.48 ± 3.23), and total phosphate (0.65 ± 0.38) mg/L concentration in this river was the highest of the 14 rivers evaluated. In addition, heavy metal levels in the following rivers exceeded the Taiwan EPA standard limit (lead: 0.01, copper: 0.03, and manganese: 0.03) mg/L concentration: lead-in the Dongshan (0.02 ± 0.09), Jhuoshuei (0.03 ± 0.03), and Xinhuwei Rivers (0.02 ± 0.02) mg/L; copper: in the Dahan (0.036 ± 0.097), Laojie (0.06 ± 1.77), and Erren Rivers are (0.05 ± 0.158) mg/L; manganese: in all rivers. A total 72% of the water pollution in the Erren River was estimated to originate from industrial sources, 16% from domestic black water, and 12% from natural sources and runoff from other tributaries. Our research demonstrated that applying PCA-MLR and cluster analysis on long-term monitoring water quality would provide integrated information for river water pollution management and future policy making.
1. Introduction
Surface water quality is a matter of critical concern in developing countries because of growing population, rapid industrialization, urbanization, and agricultural modernization [1]. Of all water bodies, rivers are the most vulnerable to pollution because of their role in carrying agricultural run-off and municipal and industrial wastewater [2]. Water quality experts and decision makers are confronted with significant challenges in their efforts to manage surface water resources due to these complex issues [3]. Spatial variation and source apportionment characterization of water quality parameters can provide a detailed understanding of environmental conditions and help researchers to establish priorities for sustainable water management [4].
In recent years, the national income and standard of living in Taiwan have considerably improved following the nation’s focus on economic development [5]. Rapid industrial development in Taiwan, including increased vehicle use, electrical power generation, and manufacturing of food, beverages, textiles, plastic, and metal, has affected pollution levels and other environmental problems, specifically water pollution [6]. In 1998, the Taiwan Environmental Protection Administration (EPA) reported that 16% (2088 km) of the total length of Taiwan’s 21 major rivers was ranked as severely polluted, while another 22% were considered lightly and moderately polluted [7].
The Taiwan EPA uses the river pollution index (RPI) to explore monitoring trends for both long-term planning and day-to-day management of surface water quality. The RPI involves four parameters: dissolved oxygen (DO), biochemical oxygen demand (BOD), suspended solids (SS), and ammonia nitrogen (NH3-N). The overall index is divided into four pollution levels as follow: non-polluted, lightly polluted, moderately polluted, and severely polluted [8]. Previous research has used the RPI to evaluate the pollution levels of the following rivers: the Tanshui River [9,10], Kaoping River [11], Chuo-shui River, Beigang River, Jishui River, Agongdian River, and Sichong River [12] in Taiwan, and the Mahmoudia Canal in Egypt [13].
The application of multivariate statistical analysis for cluster analysis, principal component analysis (PCA), and source apportionment by multiple regression on principal components provides a detailed understanding of water quality and the ecological status of the studied systems for improved interpretation of these complex data matrices [14,15]. Such analyses also facilitate the identification of possible pollution sources that affect the water systems and offers a valuable tool for reliable management of water resources and the determination of potential solutions to pollution problems.
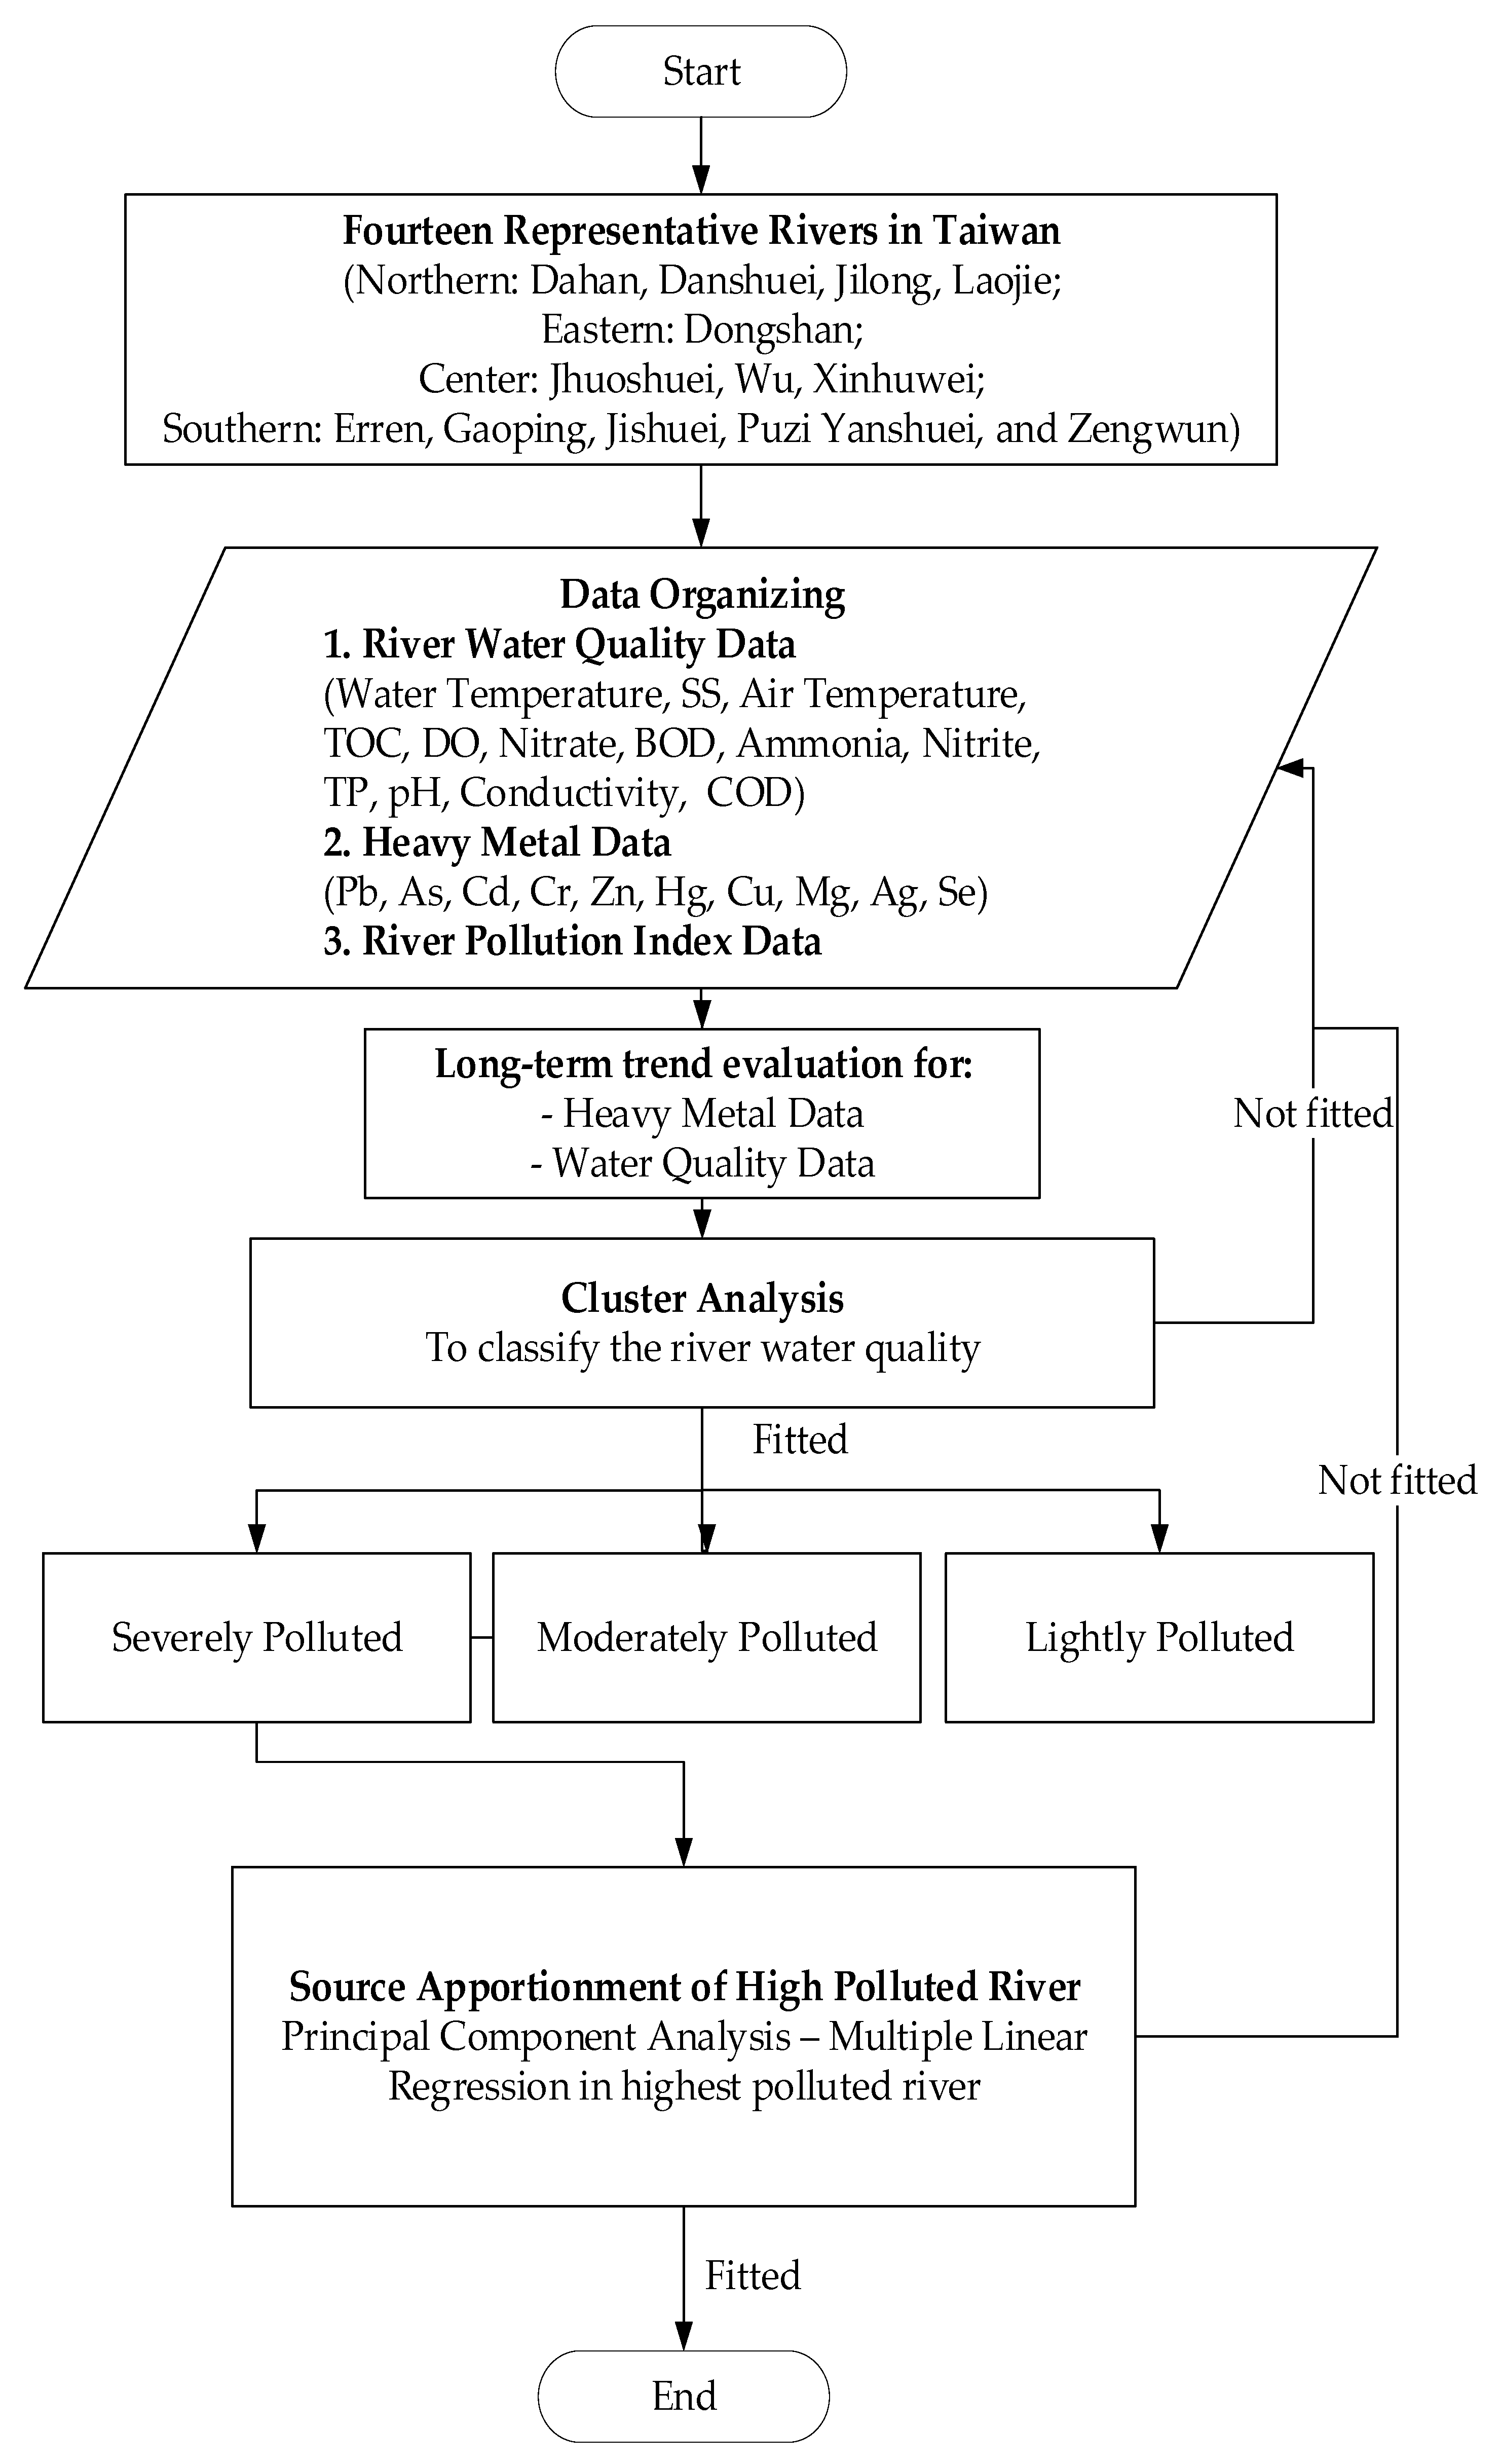
As shown in Figure 1, this study was conducted in three phases with three main objectives: (1) evaluate and compare water quality and heavy metal data of 14 major Taiwan rivers with the Taiwan EPA standards; (2) classify the contamination level of those 14 major Taiwan rivers then determine the most polluted river; and (3) identify the major possible pollution source apportionment affecting water quality in the most polluted river.
2. Materials and Methods
2.1. Study Area and Data Collection
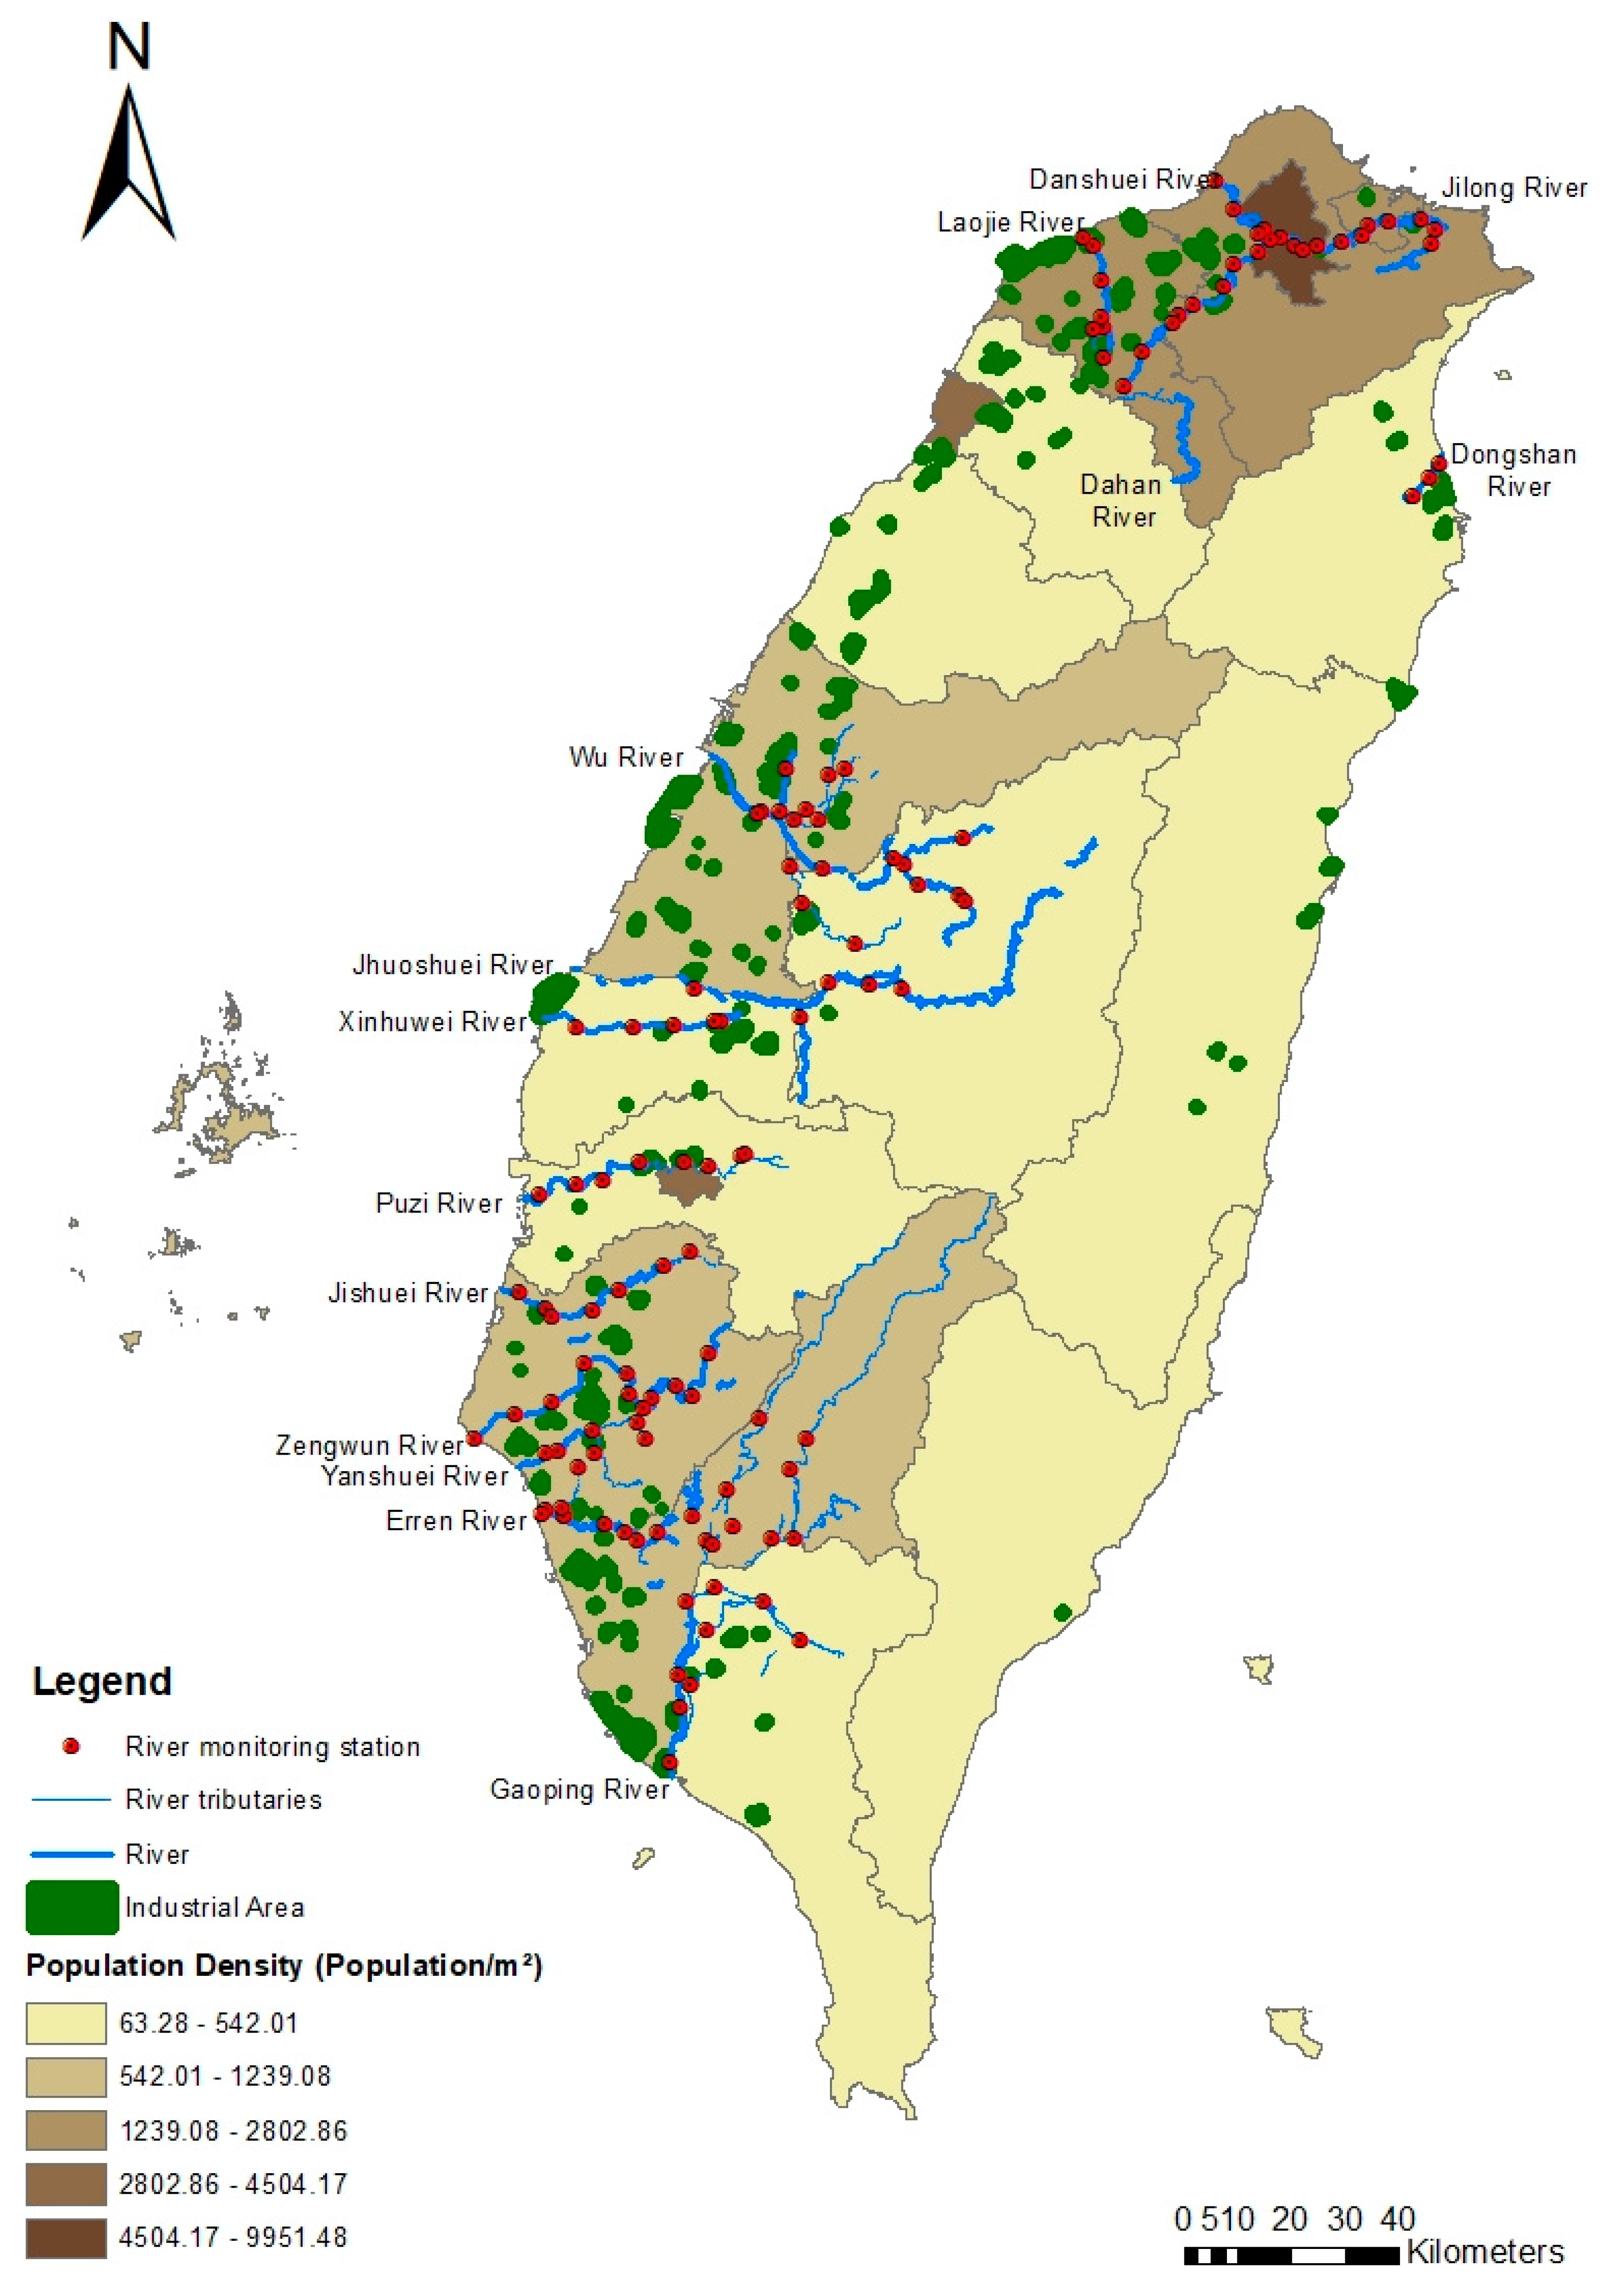
The subtropical island of Taiwan has 151 major and minor rivers with a combined total length of 3717 km. Most rivers flow down from high mountains in short and steep courses [16]. Figure 2 displays the 14 major rivers that were selected for analysis of their water quality and heavy metal concentrations: Dahan, Danshuei, Jilong, and Laojie rivers in Northern Taiwan; Dongshan River in Eastern Taiwan; Jhuoshuei, Wu, and Xinhuwei rivers in Central Taiwan; and Erren, Gaoping, Jishuei, Puzi, Yanshuei, and Zengwun rivers in Southern Taiwan. These 14 rivers were selected because those rivers are the biggest in each area and the most polluted rivers according to the previous Taiwan EPA report.
Table 1 shows information on the 14 major rivers and monitoring stations. Water quality data from 2002 until 2016 were provided by Taiwan EPA for each monitoring site in winter (December–February), spring (March–May), summer (June–August), and fall (September–November). The sampling procedures were conducted according to standard operational procedures summarized in Supplementary Table S1.
The 14 water quality parameters seasonally measured included water temperature, air temperature, RPI, pH, suspended solid (SS), BOD, DO, ammonia, conductivity, chemical oxygen demand (COD), total phosphate (TP), total organic carbon (TOC), nitrite, and nitrate. Moreover, 10 heavy metal parameters were measured: lead (Pb), arsenic (As), cadmium (Cd), chromium (Cr), zinc (Zn), mercury (Hg), Cu, Mn, silver (Ag), and selenium (Se). The unobserved data of all water quality parameters and heavy metal was treated using the random forest algorithm method [17].
2.2. Statistical Methods
Cluster analysis was used to classify the rivers based on the RPI data. Pearson’s correlation analysis was used to test for linear correlation between the RPI and water quality parameters (water temperature, air temperature, conductivity, nitrate, SS, DO, BOD, COD, ammonia, TP, and TOC). PCA-MLR was used to determine source apportionment. These three multivariate analyses were performed using SPSS 22.0 for Windows (IBM Corp., Armonk, NY, USA, 2013).
2.2.1. Cluster Analysis
Hierarchical agglomerative cluster analysis was performed on the normalized RPI data set by Ward’s method, using squared Euclidean distances as a measure of similarity. Ward’s method uses an analysis of variance approach to evaluate the distances between clusters in an attempt to minimize the sum squares of any two clusters that can be formed at each step. To standardize the linkage distance represented on the y-axis, the linkage distance is reported as Dlink/Dmax, where Dlink represents the quotient between the linkage distance for a particular case and Dmax is the maximal distance multiplied by 100 [18,19,20]. The data used for cluster analysis are water quality data of 14 rivers from 2002 to 2016.
2.2.2. Source Apportionment Analysis
Principal component analysis (PCA) is a dimension-reduction technique that provides information on the most significant factors with a simple representation of the data. It is generally used for data structure determination and for obtaining qualitative information about potential pollution sources. However, if used alone, PCA cannot determine the quantitative contributions of the identified pollution sources in each variable [21]. Correlation analysis using Pearson’s analysis was thus employed to select the high significant correlation (r > 0.3 with p < 0.01) between RPI and water quality parameters that would be inputted into PCA. The r > 0.3 indicates strong correlation among parameters and p < 0.01 signs the highly significant result [22].
Kolmogorov–Smirnov (K–S) statistics were used to test the goodness-of-fit of the data to log-normal distribution. To examine the suitability of the data for PCA, the Kaiser-Meyer-Olkin (KMO) and Bartlett’s Sphericity tests were applied on the prepared dataset. In the KMO test, a value closer to 1 indicates high validity while a value <0.7 indicates an invalid analysis. Bartlett’s Sphericity test was used to check the null hypothesis that the inter-correlation matrix comes from a population in which the variables are uncorrelated. For this study, the null hypothesis was rejected due to a significance level >0.01 [23]. These two tests required the selected water quality data to be fitted before PCA interpretation. If these two tests fulfil the requirement, we need to consider the total variance while a value >60%. Rotated variables with factor loading >0.7 are considered relevant and indicate a possible emission source. Next, multiple linear regression (MLR) was applied to determine the percentage of contribution for each pollution source [21,24]. In linear regression, the sum of each parameter standardization was defined as a dependent variable and the absolute principal component score as an independent variable.
3. Results
3.1. Evaluation of River Water Quality and Heavy Metal Data
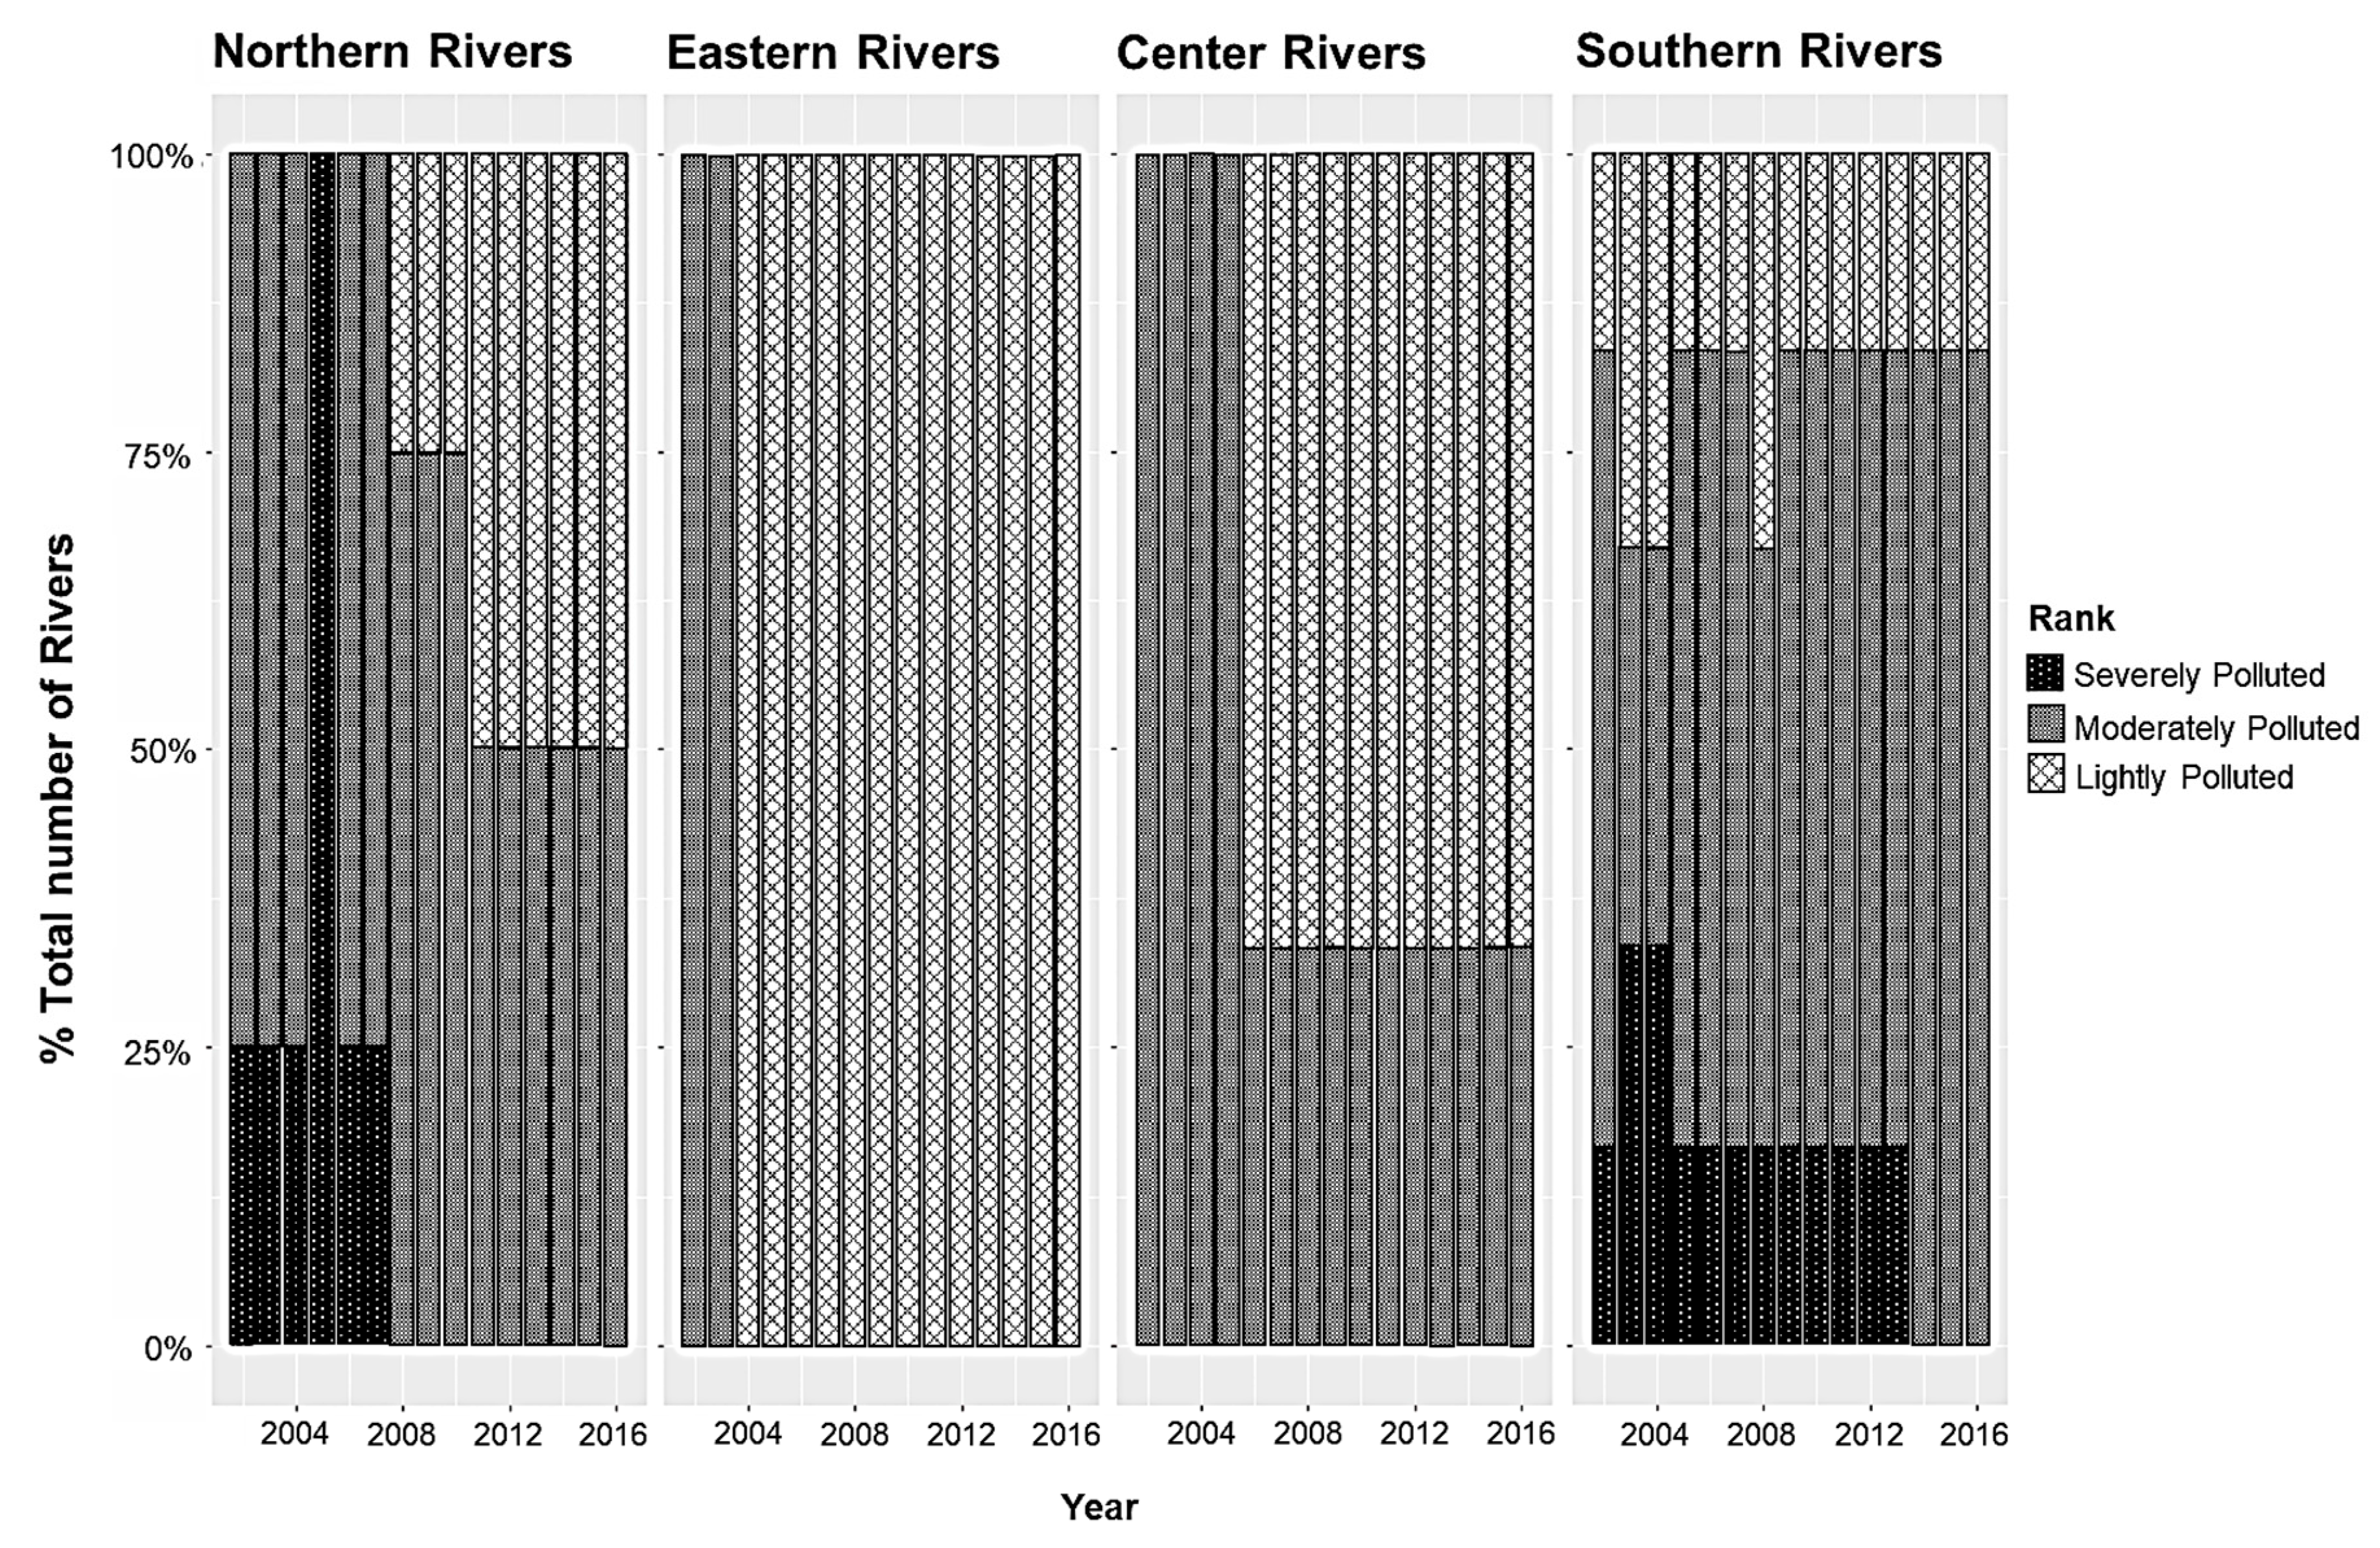
Figure 3 shows the RPI dataset stacked plot from 2002 to 2016 for the 14 rivers. Between 2002 and 2016, for the four rivers in Northern Taiwan, on average 15% were severely polluted, 60% were moderately polluted, and 25% were lightly polluted. The average percentages for the rivers in Eastern Taiwan were 14% moderately polluted and 86% lightly polluted. The average percentages for the three rivers in Central Taiwan were 49% moderately and 51% lightly polluted. The average percentages for the six rivers in Southern Taiwan were 18% severely polluted, 59% moderately polluted, and 23% lightly polluted. In 2016, 65% of the total number of rivers in Taiwan were classified as moderately polluted, while the remaining 35% were classified as lightly polluted. Therefore, according to the average percentages above, from 2002–2016, the rivers in Northern, Eastern, Central, and Southern Taiwan had moderate, highest, moderate, and lowest water quality levels, respectively.
Water quality and heavy metal evaluation in each river were interpreted using the average of the monitoring sampling station data in one river. Figure 4 displays a boxplot of river water quality variables for the 14 rivers. Each boxplot displays the six-number summary of a set of data, including the minimum, first quartile, median, third quartile, maximum, and outliers’ value. Overall, the central and southern rivers in Taiwan had the highest levels of pH, DO, and SS, while BOD, ammonia, and TP were the highest in the Erren River.
Heavy metal concentrations for the 14 rivers are summarized in Table 2 which displays total sample (N), long-term average value (mean), and standard deviation (SD). The overall mean concentrations of heavy metals were found in the following order: Hg < As < Cd < Se < Ag < Cr < Pb < Cu < Zn < Mn. In addition, the highest concentrations of heavy metals, all of which exceeded the Taiwan EPA standard limit (Table S2), were found in the following rivers: Pb in the Dongshan, Jhuoshuei, and Xinhuwei Rivers; Cu in the Dahan, Laojie, and Erren Rivers; and Mn in all rivers.
3.2. Cluster Analysis
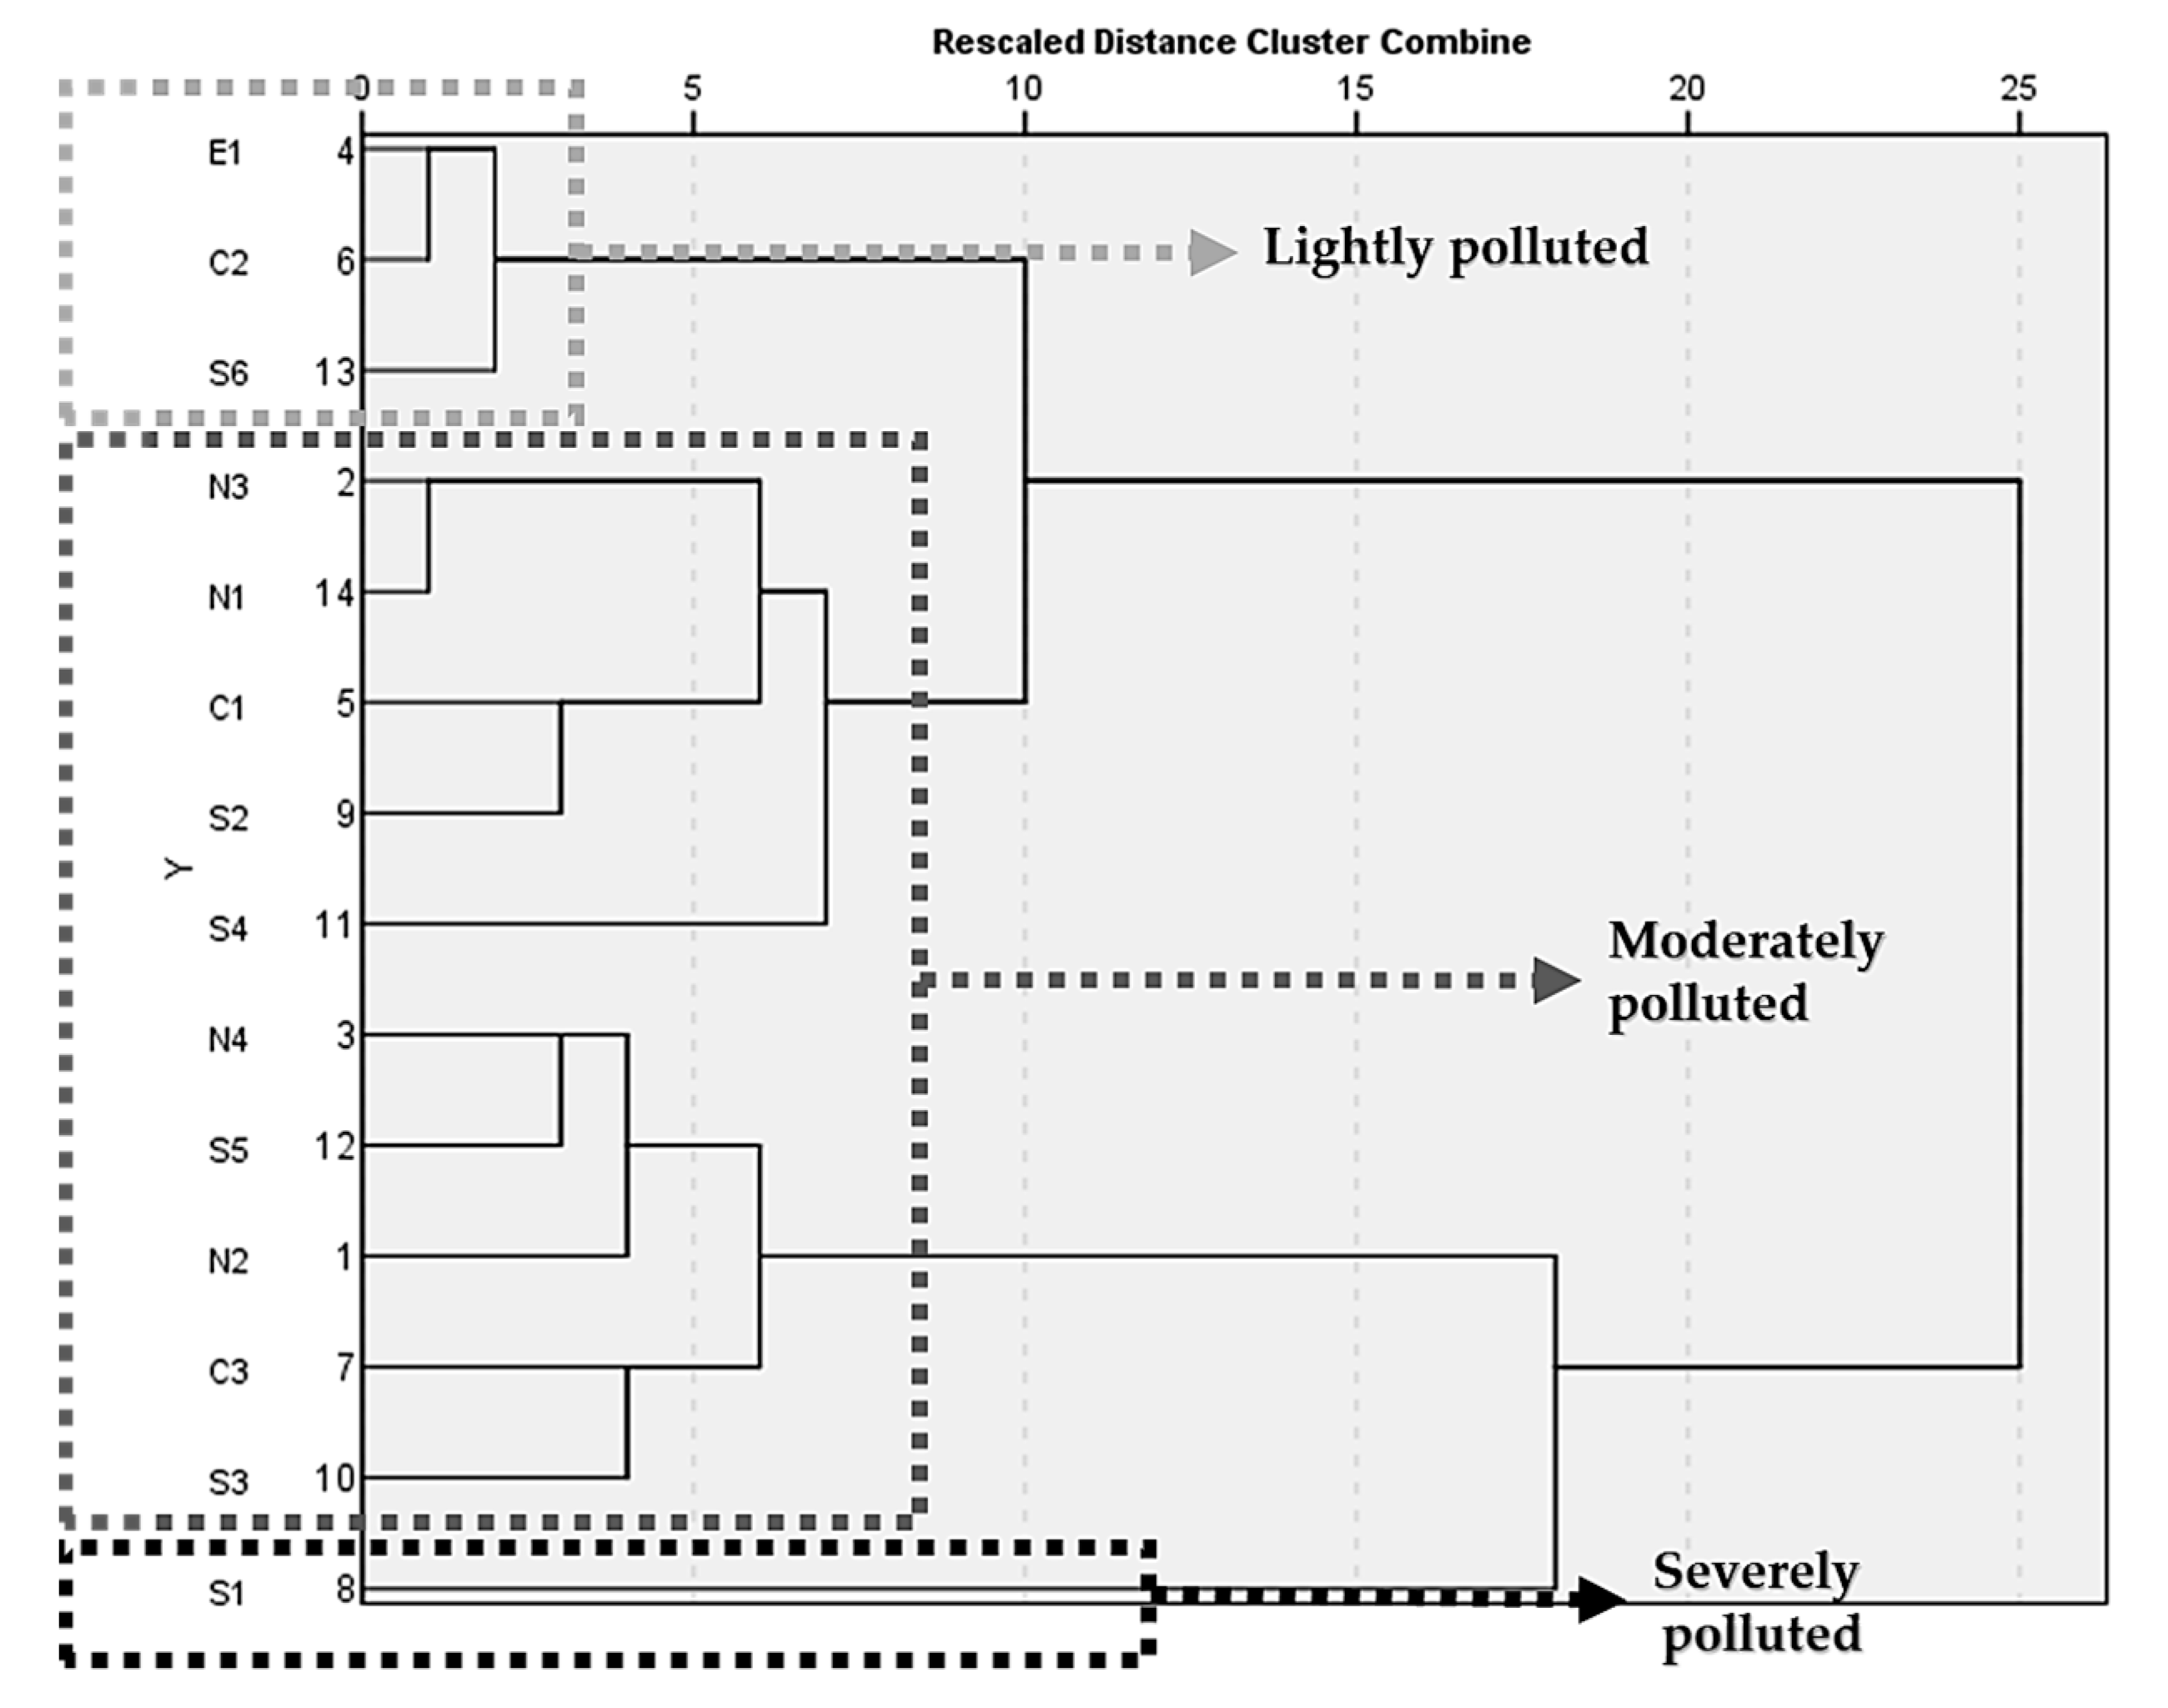
Figure 5 shows the result of cluster analysis of the water quality variation tendencies among the targeted monitoring sites. Three significant groups (p < 0.01) were classified comprehensively based on the RPI value of each river. Cluster 1, classified as lightly polluted, included the Dongshan, Wu, and Zengwun rivers. Cluster 2, classified as moderately polluted, included the Dahan, Danshuei, Jilong, Jhuoshuei, Xinhuwei, Gaoping, Jishuei, Puzi, and Yanshuei rivers. Cluster 3, classified as severely polluted, included the Erren River. These results were fit in comparison with the RPI value of each river presented in Supplementary Table S3.
3.3. Source Identification and Apportionment
This study analyzed source apportionment for the most polluted river, namely, the Erren River. The result of Pearson’s correlation analysis is shown in Table 3. The significant water quality parameters correlated with RPI were −0.376 for conductivity, −0.719 for DO, 0.621 for BOD, 0.339 for COD, 0.512 for SS, 0.533 for coliform, 0.587 for ammonia, 0.402 for TP, 0.383 for TOC, −0.301 for nitrate, and 0.308 for nitrite. Biochemical oxygen demand, DO, SS, and ammonia were correlated with RPI because the RPI value was calculated according to the concentration of these four parameters. However, other parameters including conductivity, COD, coliform, TP, TOC, nitrate, and nitrite also had strong correlation with RPI. Therefore, these water quality parameters can be assumed to have a significant impact on river pollution levels. These significant factors were thus selected for further PCA analysis. Conductivity, likewise, showed high correlation with nitrate (0.564, p < 0.01) indicating that nitrate acts as an electrolyte along with organic matter in water [25].
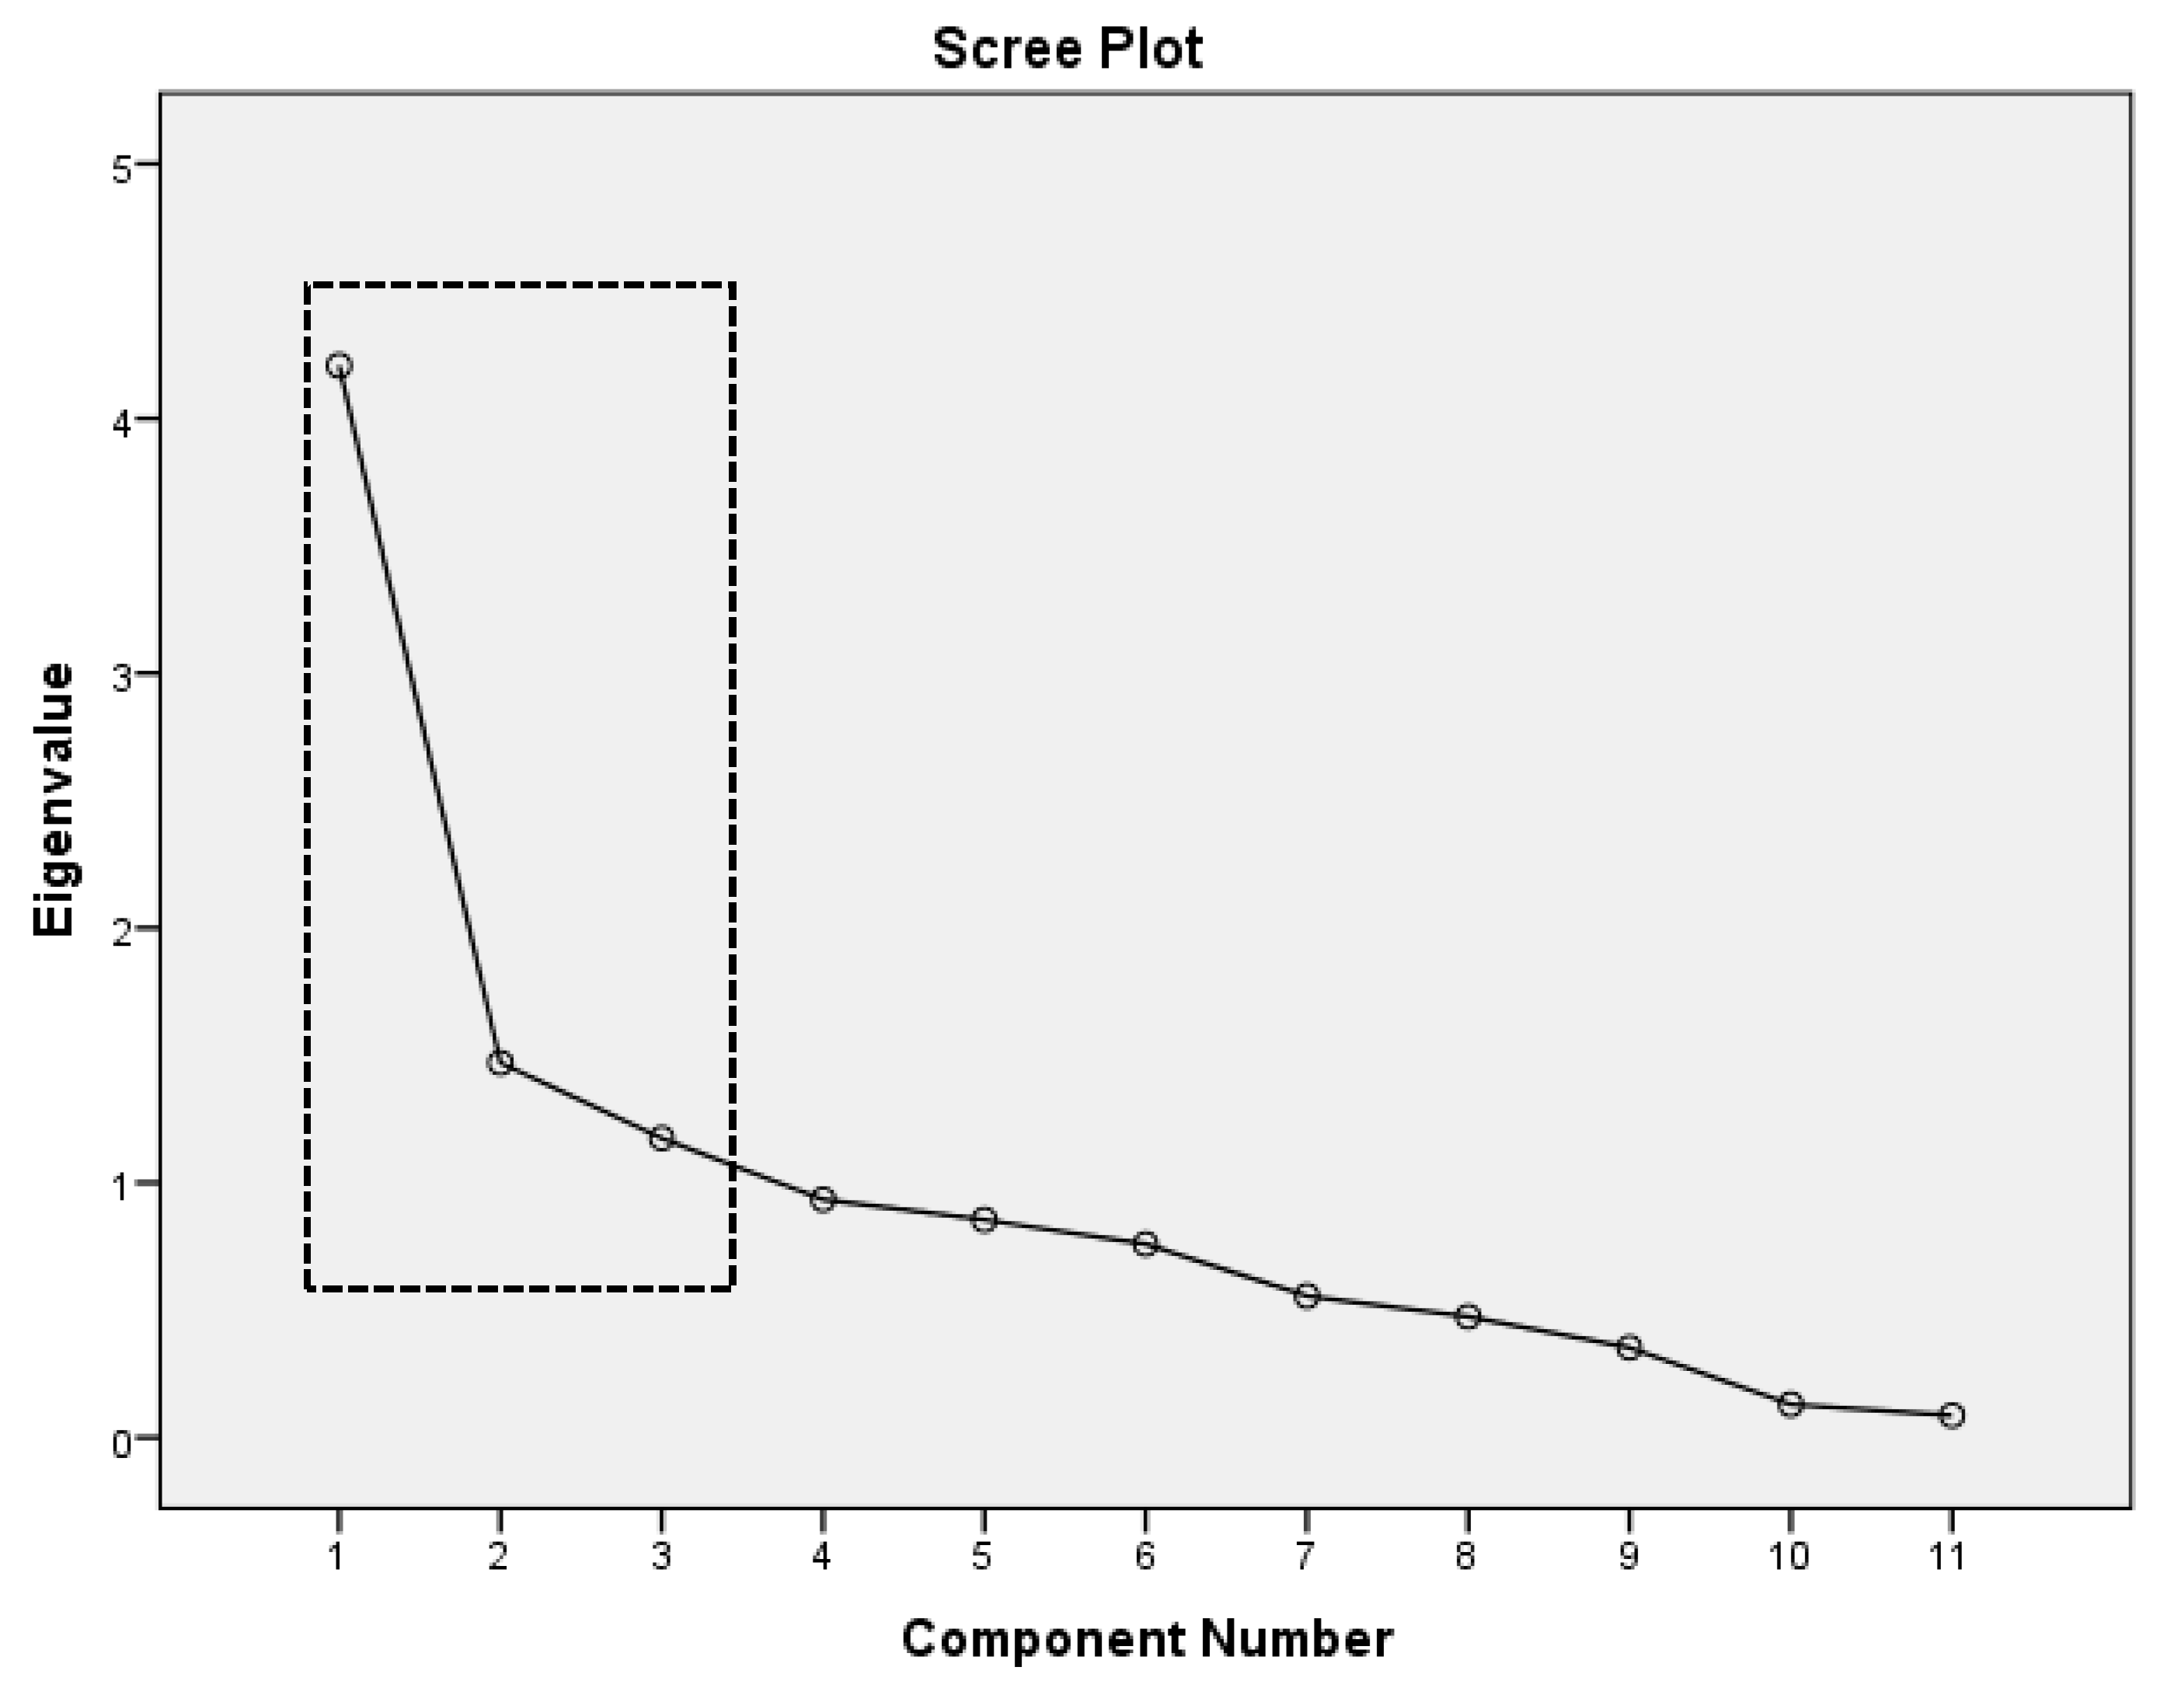
The result indicated that PCA could be applied due to KMO’s value being 0.76 and Barlett’s test significance being 0.00. Figure 6 shows that there were three components in the scree plot defining the most dominant component among all variances. The three selected components in the dash mark will be defined as the three factors in the principal components which have a 62.3% total cumulative of variance percentage (Table 4). It means 62.3% variability in water quality data has been modelled by the extracted factor. Thus, it indicates that this model is properly acceptable to continue to the next step. The extracted varimax rotation of principal components among the selected parameters from correlation analysis is shown in Table 5. The bold and marked values indicate the dominant parameters in each factor.
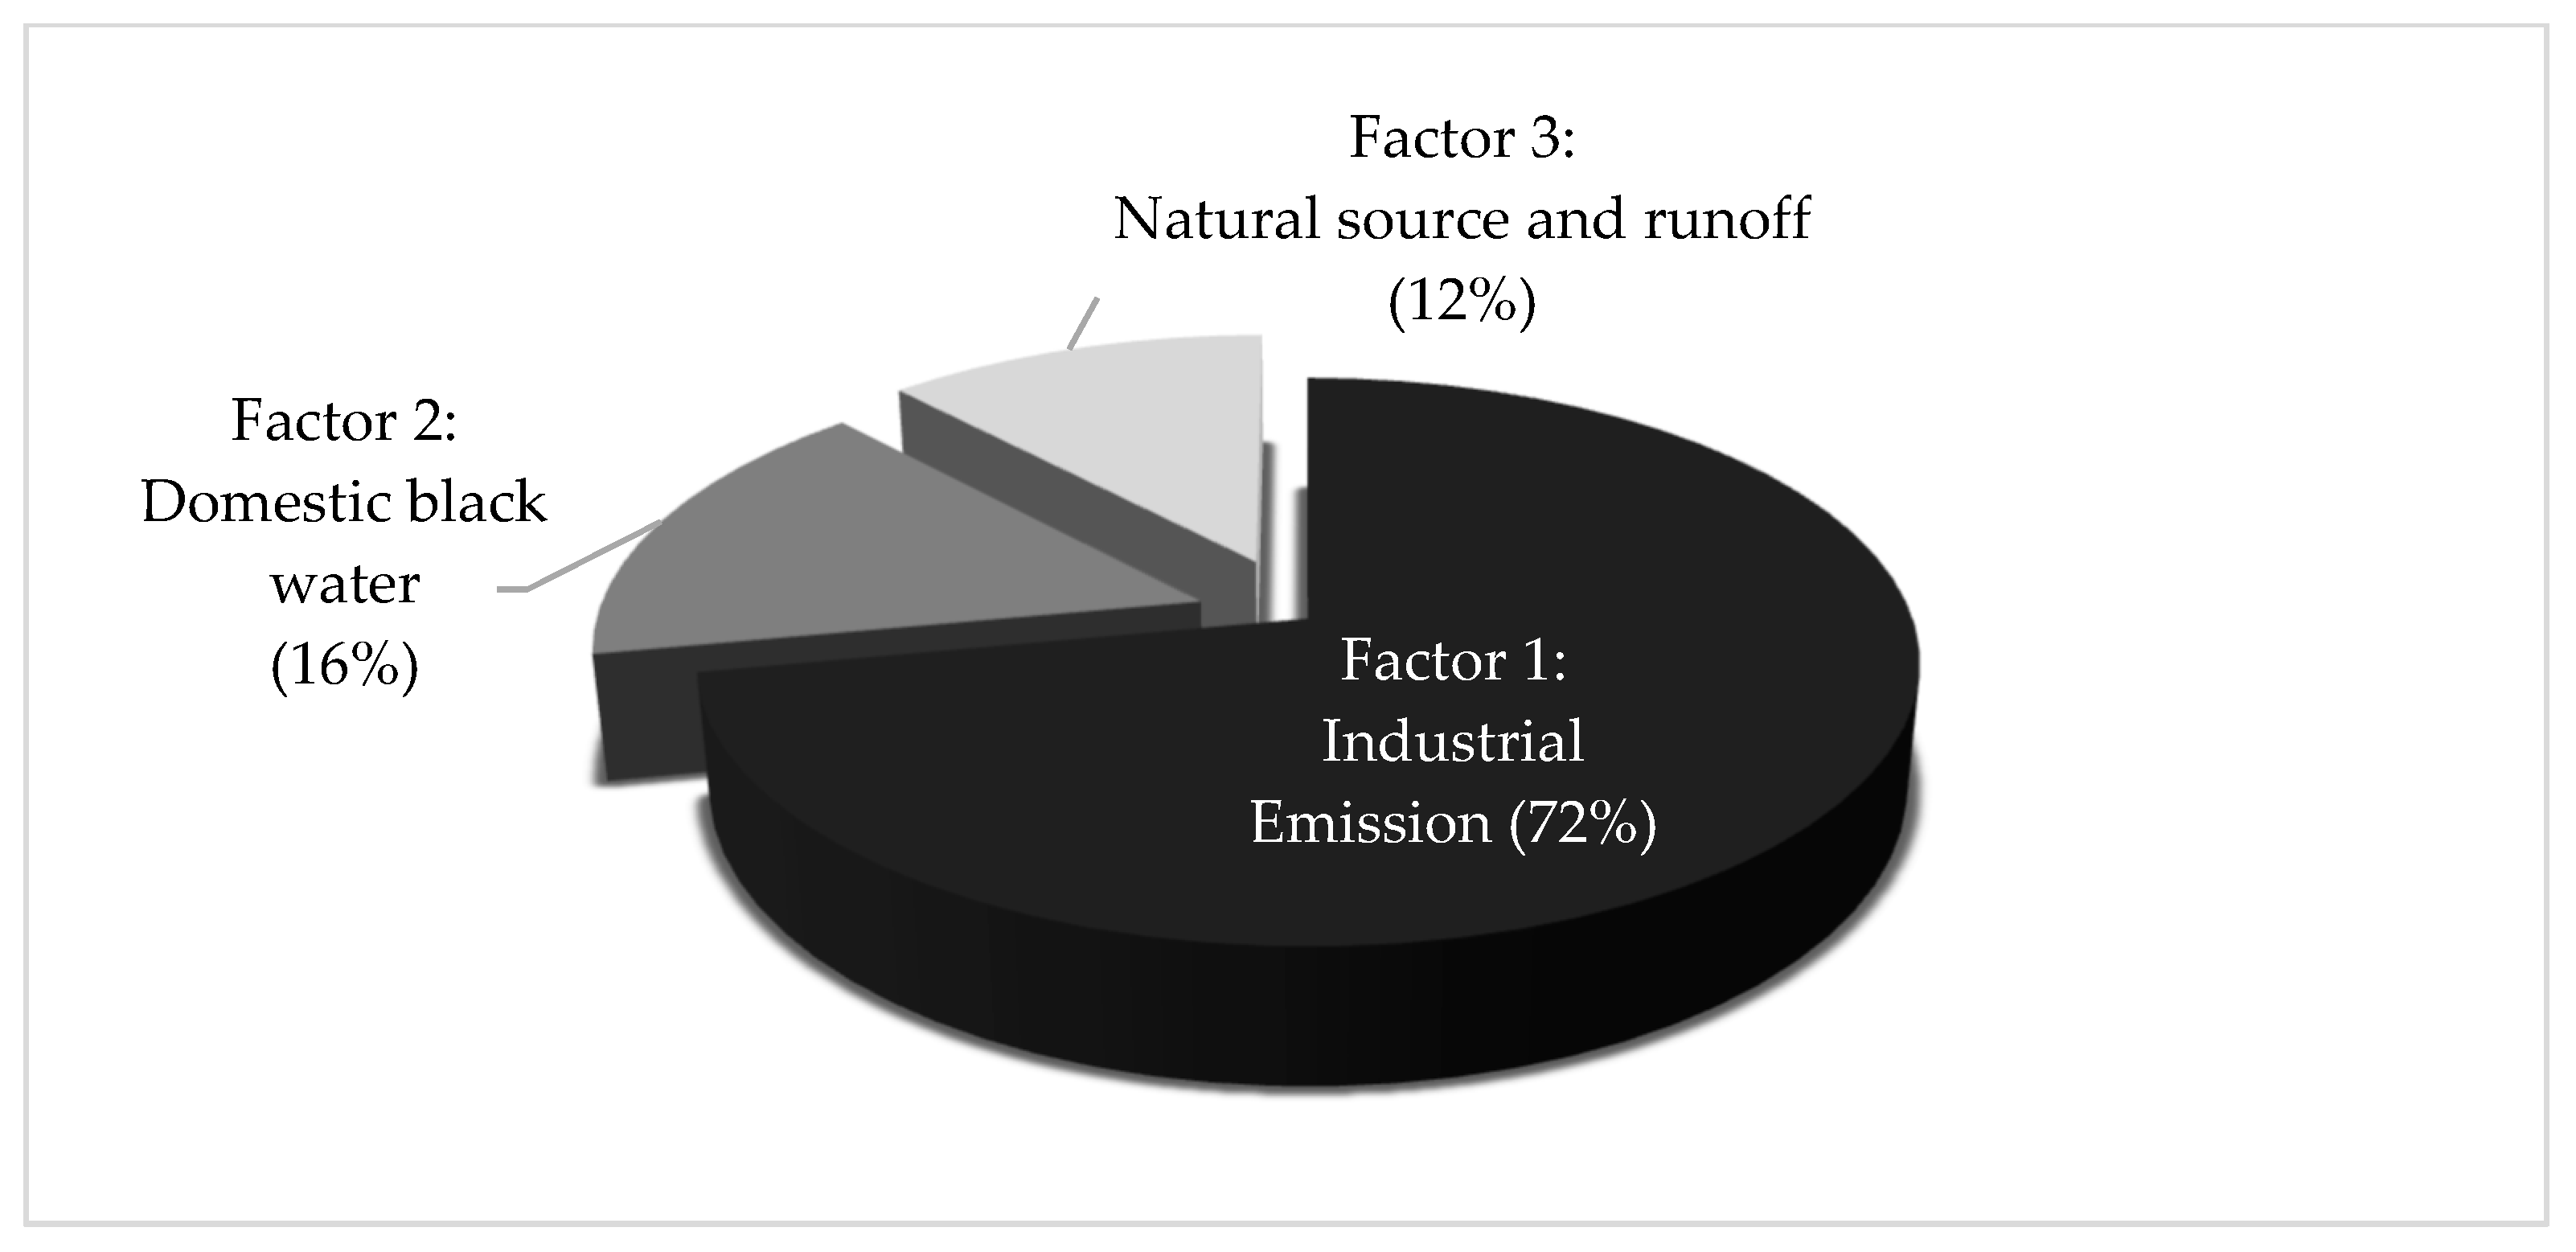
The MLR results in Table 6 show that all regression results were significant (p < 0.01). Factor 1, accounting for 72% of the total variance, had strong and positive loadings on ammonia and TP. High concentrations of TP and ammonia in surface water can come from various sources, including municipal and industrial effluent [14]. Factor 2, accounting for 16% of the total variance, possibly originates from domestic black water factors related to the high loadings on coliform, BOD, COD, TOC, and nitrite [26,27]. Factor 3, accounting for 12% of the total variance, had high and positive loadings on conductivity, nitrate, and SS, and thus was interpreted as a mineral component of river water or runoff precipitation [28]. The source apportionment of this study is reliable because PCA-MLR showed the good fitted receptor model (R2 > 0.74). The contribution percentage of each factor is shown in Figure 7.
4. Discussion
The increasing population density in Taiwan is a significant source of domestic water pollution. Wastewater from agriculture, farming, and urban activities can also be major pollution sources causing diverse problems, such as toxic algal blooms, loss of oxygen, fish kills, loss of biodiversity (including species important for commerce and recreation), and loss of aquatic plant beds and coral reefs [26]. In addition, despite the decreasing number of domestic swine farms in Taiwan after it joined the World Trade Organization, approximately 7 million swine are still being raised in the country and their waste must be disposed of. Aside from domestic pollution sources, industrial wastewater is a major water pollution source as well. During the last three decades, Taiwan developed into a large trading economy with nearly 11,000 manufacturing plants disposing various contaminants [29]. Moreover, the location of industrial area and high population density in Taiwan is scattered. In other words, industrial and high population areas around Taiwan rivers are not only located in the downstream areas, but also in the upstream areas (see Supplementary Figure S1). Thus, water pollution in Taiwan rivers is spread along the river (see Supplementary Figure S2). We interpreted the water quality and heavy metals characteristics for each river that could be used by the Taiwan government to plan proper river management strategy.
Our study used cluster analysis on large-scale data in one country to classify the pollution level of major rivers. Previous research has shown that cluster analysis is useful for classifying rivers that have similar water quality characteristics. For example, Shrestha and Kazama 2007 [18] reported that cluster analysis results represent the influence of land use, residential sewage, agricultural activities, and industrialization, which can have major impacts on water quality. Another study grouped monitoring sites in rivers in South Florida into three groups (low, moderate, and high pollution) on the basis of their similar water quality characteristics [30].
In the current study, Erren River was determined to be the most polluted river among the other major rivers in Taiwan. The most significant water pollutants were identified to have originated from industrial activity, domestic black water, runoff from other rivers, and natural sources, including climate conditions. Given that the Erren River is located in an industrialized and urbanized area [31], the level of water pollutants in the river is very high due to huge amounts of nutrient salts, including organic pollutants, ammonia, and total phosphate. These pollutants are associated with possible pollution sources in Factor 1 of our study. Aneja et al. 2008 [14] reported that ammonia is found in industrial gas emissions or natural sources that evaporate and become particulate matter, and then descend with precipitation and enter surface water. Urbanized areas with high population density in Taiwan also show that domestic wastewater is a major contributor to river water pollution because of the levels of BOD and DO, which show a strong correlation with coliform levels that are associated with domestic wastewater [27]. Runoff from other rivers can be due to flash floods that often occur in Southern Taiwan following typhoons throughout the year. For example, in August 2009, Taiwan experienced the worst floods in 50 years after Typhoon Morakot struck almost the entire southern region. Yang et al. 2012 [32] analyzed the impact of climate change on river water quality in the southern area of Taiwan. High amounts of sediments and debris flowed into the Erren River basin because of the high concentration of suspended sediments in the river, which in turn caused the failure of wastewater treatment plants. Therefore, the river received significantly higher SS, BOD, and ammonia loads from farms and domestic wastewaters. During the dry season, the evapotranspiration rate increase, which may contribute to the increased water salinity. However, during the wet season, precipitation increases and runoff from other tributaries brings SS or nitrate content to the river. Therefore, we assume that climate conditions are one of the factors affecting water quality in rivers.
This study only explored pollution sources that were identified and considered using multivariate statistical analysis of water quality data for all seasons. However, pollution levels vary every season. Therefore, further study is necessary to analyze in detail how different seasons can affect the water quality level. In addition, some water quality variables might be affected by soil types, geological conditions, terrain, and anthropogenic pollution sources [33]. Further work is necessary to determine if these potential sources do significantly impact the rivers in Taiwan.
Our study found that the levels of heavy metal contamination in the Erren River are classified as among the highest in Taiwan. Since the 1970s, the development of a scrap metal industry along the Sanyegong River (a tributary of the Erren River) has severely polluted the river sediment with metals [34]. Chen et al. 2004 [35] determined that concentrations of Fe, As, Cd, Zn, Hg, and Cu in the Erren River were higher than those in other rivers, and that Cu levels exceeded the standard limit. This high heavy metal contamination problem has affected the river ecology and biota. They reported that the highest concentrations of Fe, Zn, Cu, and Mn in muscles were found in tilapia, striped mullet, large-scaled mullet, and milkfish. The highest concentrations of As and Hg were found in striped mullet and Indo-Pacific tarpon. The highest concentrations of Fe, Hg, and Cd were found in the livers of large-scaled mullet, while striped mullet had the highest concentrations of Zn, Cu, and As. Our data in 2002 revealed that As, Cu, Hg, and Zn levels in the Erren River were the highest compared to the other years, indicating that the high levels of the mentioned heavy metals may have affected the biota. However, the trend of heavy metals in the Erren River has been decreasing since the Taiwanese government started a river restoration program in 2002. The restoration program formed an implementation team that united the Water Resources Agency, Industrial Development Bureau, Construction, and Planning Agency, Council of Agriculture, Tainan City Government, Kaohsiung City Government, the river patrol team, and other units to make joint efforts toward improving the water quality of the Erren River. Through the combined efforts of the government and private entities over the long term, the Erren River’s water quality is continuing to improve.
5. Conclusions
In this study, cluster analysis was successfully utilized to classify the water quality of 14 Taiwan rivers and PCA–MLR was conducted to determine the possible pollution sources for the most polluted river in Taiwan. According to the cluster analysis, the most severe water quality pollution problem can be found in the Erren River in Southern Taiwan. According to the PCA–MLR results, 62.3% of water pollutants in the Erren River were contributed by ammonia and TP as the first factor; DO, BOD, COD, nitrite, and coliform as the second factor; and conductivity, nitrate, and SS as the third factor. An estimated 72% of the first factor was found to be from industrial emission, 16% from domestic black water, and 12% from natural sources and runoff from another tributary.
Water quality monitoring programs generate complex multidimensional data that require multivariate statistical treatment for analysis and interpretation to obtain better information about the quality of surface water. Such information can help environmental managers make better decisions regarding action plans. The management of domestic and industrial wastes should strive for low accumulation in rivers to minimize environmental degradation. This objective can be achieved by installing proper treatment methods for municipal and industrial wastewater before being released to the environment.
Supplementary Materials
The following are available online at https://www.mdpi.com/2073-4441/10/10/1394/s1, Table S1: Water Quality and Heavy Metal Monitoring Methods, Table S2: Taiwan EPA water quality standards for heavy metal content in surface water, Table S3: River Pollution Index Descriptive Statistic Table, Figure S1: Laojie river map with industrial area and total population data; Figure S2: Heavy metal distribution in Laojie River (sampling locations S1-S7 are in order from upstream to downstream).
Author Contributions
Data curation, C.-H.L.; Supervision, S.-H.O.; Visualization, M.S.A.P.; Writing—original draft, M.S.A.P.; Writing—review & editing, M.S. and Y.-C.W.
Funding
This research was funded by Taiwan Environmental Protection Administration with this following grant number: [EPA-106-U101-02-A121, 2017]; [EPA-106-E3S4-02-07, 2017]; and [EPA-107-E3S4-02-03].
Acknowledgments
We would like to thank the Environmental Protection Administration and the Executive Yuan R.O.C (Taiwan) for providing research data.
Conflicts of Interest
The authors declare no conflict of interest.
References
- Wang, X.; Zhang, L.; Cai, Y. Heavy metal pollution in reservoirs in the hilly area of southern China: Distribution, source apportionment and health risk assessment. Sci. Total Environ. 2018, 634, 158–169. [Google Scholar] [CrossRef] [PubMed]
- Huang, F.; Wang, X.; Lou, L.; Zhou, Z.; Wu, J. Spatial variation and source apportionment of water pollution in Qiantang River (China) using statistical techniques. Water Res. 2010, 44, 1562–1572. [Google Scholar] [CrossRef] [PubMed]
- Elhatip, H.; Hınıs, M.A.; Gülbahar, N. Evaluation of the water quality at Tahtali dam watershed in Izmir-Turkey by means of statistical methodology. Stochastic Environ. Res. Risk Assess. 2007, 22, 391–400. [Google Scholar] [CrossRef]
- Kolovos, A.; Christakos, G.; Serre, M.L.; Miller, C.T. Computational bayesian maximum entropy solution of a stochastic advection-reaction equation in the light of site-specific information. Water Resour. Res. 2002, 38, 1–17. [Google Scholar] [CrossRef]
- World Bank. Riding the Wave: An East Asian Miracle for the 21st Century; The World Bank: Washington, DC, USA, 2017. [Google Scholar]
- Tsai, D.H.A. The effects of dynamic industrial transition on sustainable development. Struct. Chang. Econ. Dyn. 2018, 44, 46–54. [Google Scholar] [CrossRef]
- Administration, T.E.P. Taiwan River Annual Report; Taiwan Environmental Protection Administration: Taipei, Taiwan, 1998. [Google Scholar]
- Chen, Y.-C.; Yeh, H.-C.; Wei, C. Estimation of River Pollution Index in a Tidal Stream Using Kriging Analysis. Int. J. Environ. Res. Public Health 2012, 9, 3085–3100. [Google Scholar] [CrossRef] [PubMed] [Green Version]
- Liou, S.-M.; Lo, S.-L.; Hu, C.-Y. Application of two-stage fuzzy set theory to river quality evaluation in Taiwan. Water Res. 2003, 37, 1406–1416. [Google Scholar] [CrossRef]
- Hsieh, P.-Y.; Shiu, H.-Y.; Chiueh, P.-T. Reconstructing nutrient criteria for source water areas using reference conditions. Sustain. Environ. Res. 2016, 26, 243–248. [Google Scholar] [CrossRef]
- Lai, Y.C.; Tu, Y.T.; Yang, C.P.; Surampalli, R.Y.; Kao, C.M. Development of a water quality modeling system for river pollution index and suspended solid loading evaluation. J. Hydrol. 2013, 478, 89–101. [Google Scholar] [CrossRef]
- Chiu, Y.-W.; Yeh, F.-L.; Shieh, B.-S.; Chen, C.-M.; Lai, H.-T.; Wang, S.-Y.; Huang, D.-J. Development and assays estradiol equivalent concentration from prawn (p-EEQ) in river prawn, Macrobrachium nipponense, in Taiwan. Ecotoxicol. Environ. Saf. 2017, 137, 12–17. [Google Scholar] [CrossRef] [PubMed]
- Elsayed, E.A. Using QUAL2K Model and river pollution index for water quality management in Mahmoudia Canal, Egypt. J. Nat. Resour. Dev. 2014. [Google Scholar] [CrossRef]
- Aneja, V.P.; Blunden, J.; James, K.; Schlesinger, W.H.; Knighton, R.; Gilliam, W. Ammonia assessment from agriculture: U.S. status and needs. J. Environ. Qual. 2008, 37, 515. [Google Scholar] [CrossRef] [PubMed]
- Morales, M.M.; Martı́, P.; Llopis, A.; Campos, L.; Sagrado, S. An environmental study by factor analysis of surface seawaters in the Gulf of Valencia (Western Mediterranean). Anal. Chim. Acta 1999, 394, 109–117. [Google Scholar] [CrossRef]
- Liou, S.-M.; Lo, S.-L.; Wang, S.-H. A generalized water quality index for Taiwan. Environ. Monit. Assess. 2004, 96, 35–52. [Google Scholar] [CrossRef] [PubMed]
- Li, B.; Yang, G.; Wan, R.; Hormann, G.; Huang, J.; Foher, N.; Zhang, L. Combining multivariate statistical techniques and random forests model to assess and diagnose the trophic status of Poyang Lake in China. Ecol. Indic. 2017, 83, 74–83. [Google Scholar] [CrossRef]
- Shrestha, S.; Kazama, F. Assessment of surface water quality using multivariate statistical techniques: A case study of the Fuji river basin, Japan. Environ. Model. Softw. 2007, 22, 464–475. [Google Scholar] [CrossRef]
- Singh, K.P.; Malik, A.; Sinha, S. Water quality assessment and apportionment of pollution sources of Gomti river (India) using multivariate statistical techniques—A case study. Anal. Chim. Acta 2005, 538, 355–374. [Google Scholar] [CrossRef]
- Singh, K.P.; Malik, A.; Mohan, D.; Sinha, S. Multivariate statistical techniques for the evaluation of spatial and temporal variations in water quality of Gomti River (India)—A case study. Water Res. 2004, 38, 3980–3992. [Google Scholar] [CrossRef] [PubMed]
- Chen, H.; Teng, Y.; Yue, W.; Song, L. Characterization and source apportionment of water pollution in Jinjiang River, China. Environ. Monit. Assess. 2013, 185, 9639–9650. [Google Scholar] [CrossRef] [PubMed]
- Taylor, R. Interpretation of the correlation coefficient: A basic review. J. Diagn. Med. Sonogr. 1990, 6, 35–39. [Google Scholar] [CrossRef]
- Pett, M.A.; Lackey, N.R.; Sullivan, J.J. Making Sense of Factor Analysis: The Use of Factor Analysis for Instrument Development in Health Care Research; SAGE Publications: Dartford, UK, 2003. [Google Scholar]
- Yang, L.; Mei, K.; Liu, X.; Wu, L.; Zhang, M.; Xu, J.; Wang, F. Spatial distribution and source apportionment of water pollution in different administrative zones of Wen-Rui-Tang (WRT) river watershed, China. Environ. Sci. Pollut. Res. Int. 2013, 20, 5341–5352. [Google Scholar] [CrossRef] [PubMed]
- Kim, G.-H.; Jung, K.-Y.; Yoon, J.-S.; Cheon, S.-U. Temporal and spatial analysis of water quality data observed in lower watershed of nam river dam. J. Korean Soc. Hazard Mitig. 2013, 13, 429–437. [Google Scholar] [CrossRef]
- Carpenter, S.R.; Caraco, N.F.; Correll, D.L.; Howarth, R.W.; Sharpley, A.N.; Smith, V.H. Nonpoint pollution of surface waters with phosphorus and nitrogen. Ecol. Appl. 1998, 8, 559. [Google Scholar] [CrossRef]
- Vega, M.; Pardo, R.; Barrado, E.; Debán, L. Assessment of seasonal and polluting effects on the quality of river water by exploratory data analysis. Water Res. 1998, 32, 3581–3592. [Google Scholar] [CrossRef]
- Islam, M.A.; Islam, S.L.; Hassan, A. Impact of Climate Change on Water with Reference to the Ganges–Brahmaputra–Meghna River Basin, in Chemistry and Water; Elsevier: Amsterdam, The Netherlands, 2017. [Google Scholar]
- Chinn, D.L. Rural poverty and the structure of farm household income in developing countries: Evidence from Taiwan. Econ. Dev. Cult. Chang. 1979, 27, 283–301. [Google Scholar] [CrossRef]
- Hajigholizadeh, M.; Melesse, A.M. Assortment and spatiotemporal analysis of surface water quality using cluster and discriminant analyses. Catena 2017, 151, 247–258. [Google Scholar] [CrossRef]
- Lee, C.-C.; Jiang, L.-Y.; Kuo, Y.-L.; Hsieh, C.-Y.; Chen, C.S.; Tien, C.-J. The potential role of water quality parameters on occurrence of nonylphenol and bisphenol A and identification of their discharge sources in the river ecosystems. Chemosphere 2013, 91, 904–911. [Google Scholar] [CrossRef] [PubMed]
- Yang, C.P.; Yu, Y.T.; Kao, C.M. Impact of climate change on kaoping river water quality. Appl. Mech. Mater. 2012, 212, 137–140. [Google Scholar] [CrossRef]
- Wu, C.; Wu, J.; Qi, J.; Zhang, L.; Huang, H.; Lou, L.; Chen, Y. Empirical estimation of total phosphorus concentration in the mainstream of the Qiantang River in China using Landsat TM data. Int. J. Remote Sens. 2010, 31, 2309–2324. [Google Scholar] [CrossRef] [Green Version]
- EPA. Our Erren River—Propaganda Handbook of River Conservation; Environmental Protection Administration, Executive Yuan: Taipei, Taiwan, 2011. [Google Scholar]
- Chen, Y.C.; Hwang, H.J.; Chang, W.B.; Yeh, W.J.; Chen, M.H. Comparison of the metal concentrations in muscle and liver tissues of fishes from the Erren River, southwestern Taiwan, after the restoration in 2000. J. Food Drug Anal. 2004, 12, 358–366. [Google Scholar]
Figure 1.
Flowchart of this study.

Figure 2.
Study area of 14 Taiwan representative rivers and their sampling points, population density, and industrial area map.
Figure 2.
Study area of 14 Taiwan representative rivers and their sampling points, population density, and industrial area map.

Figure 3.
Long-term of RPI rank in 14 Taiwan representative rivers.

Figure 4.
Boxplot of river water quality parameters for 14 representative rivers in Taiwan (see Table 1 for the river names associated with the river codes).
Figure 4.
Boxplot of river water quality parameters for 14 representative rivers in Taiwan (see Table 1 for the river names associated with the river codes).

Figure 5.
Dendrogram of RPI rank for 14 representative rivers in Taiwan (see Table 1 for the river names associated with the river codes).
Figure 5.
Dendrogram of RPI rank for 14 representative rivers in Taiwan (see Table 1 for the river names associated with the river codes).

Figure 6.
Scree plot of PCA.

Figure 7.
Source apportionment of water pollutant in the Erren River.


Table 1.
Representative river water monitoring sites.
| Code | River Name * | Main River Length ** (km) | Average Discharge ** (m3/s) | Number of Monitoring Stations * | Coordinate * | Municipality * |
|---|---|---|---|---|---|---|
| N1 | Dahan | 135 | 59.62 | 7 | 25°2′33.36″ N, 121°29′2.4″ E | New Taipei and Taoyuan |
| N2 | Danshuei | 158.7 | 62.96 | 4 | 25°10′30″ N, 121°24′30″ E | New Taipei and Taipei |
| N3 | Jilong | 96 | 39.5 | 13 | 25°6′43.92″ N, 121°27′50.4″ E | Keelung, New Taipei, and Taipei |
| N4 | Laojie | 36.7 | Not available | 7 | 24°52′21” N, 121°13′17.4” E | Taoyuan |
| E1 | Dongshan | 24 | Not available | 3 | 24°40′3.1″ N, 121°48′41.1″ E | Yilan |
| C1 | Jhuoshuei | 186.6 | 143.73 | 5 | 23°50′22″ N, 120°15′14″ E | Nantou and Yunlin |
| C2 | Wu | 119.13 | 55.86 | 18 | 24° 10′11.5″ N, 120°31′5.7″ E | Nantou, Taichung, and Zhanghua |
| C3 | Xinhuwei | 49.85 | Not available | 5 | 23°44′58.95” N, 120°30′58.69” E | Yunlin |
| S1 | Erren | 61.20 | 8.43 | 18 | 22°54′46.8″ N, 120°10′33.6″ E | Kaohsiung and Tainan |
| S2 | Gaoping | 171 | 216.96 | 9 | 22°28′59″ N, 120°34′47″ E | Kaohsiung and Pingdong |
| S3 | Jishuei | 65 | 9.43 | 7 | 23°17′52.8″ N, 120°6′18″ E | Tainan |
| S4 | Puzi | 75.87 | 13.98 | 8 | 23°30′18.52” N, 120°29′51.53” E | Chiayi |
| S5 | Yanshuei | 41.3 | 5.92 | 11 | 23° 0′14.4″ N, 120°9′0″ E | Tainan |
| S6 | Zengwun | 138.47 | 9.2 | 11 | 23°3′0″ N, 120°4’1.2″ E | Tainan |
*: Environmental Protection Administration Executive Yuan, R.O.C (Taiwan); **: Water Resource Agency, Ministry of Economic Affair R.O.C (Taiwan), N: Northern River; E: Eastern River; C: Center River; S: Southern River.
Table 2.
Descriptive statistic of heavy metals in 14 Taiwan representative rivers between 2002 and 2016.
Table 2.
Descriptive statistic of heavy metals in 14 Taiwan representative rivers between 2002 and 2016.
| River Name | Pb (mg/L) | As (mg/L) | Cd (mg/L) | Cr (mg/L) | Zn (mg/L) | ||||||||||
| N | Mean | SD | N | Mean | SD | N | Mean | SD | N | Mean | SD | N | Mean | SD | |
| Dahan | 412 | 0.01 | 0.02 | 412 | 0.002 | 0.004 | 412 | 0.0013 | 0.0027 | 412 | 0.004 | 0.003 | 412 | 0.059 | 0.13 |
| Danshuei | 236 | 0.01 | 0.01 | 236 | 0.002 | 0.002 | 236 | 0.001 | 0.0003 | 236 | 0.003 | 0.002 | 236 | 0.031 | 0.03 |
| Jilong | 301 | 0.01 | 0.01 | 301 | 0.004 | 0.003 | 301 | 0.0011 | 0.0008 | 301 | 0.004 | 0.003 | 301 | 0.021 | 0.02 |
| Laojie | 767 | 0.01 | 0.03 | 765 | 0.001 | 0.001 | 767 | 0.0011 | 0.0013 | 765 | 0.003 | 0.003 | 767 | 0.03 | 0.04 |
| Dongshan | 413 | 0.02 | 0.09 | 413 | 0.004 | 0.006 | 413 | 0.0013 | 0.0028 | 413 | 0.008 | 0.054 | 413 | 0.187 | 0.34 |
| Jhuoshuei | 267 | 0.03 | 0.03 | 267 | 0.003 | 0.002 | 267 | 0.0013 | 0.001 | 267 | 0.004 | 0.004 | 267 | 0.079 | 0.09 |
| Wu | 1042 | 0.01 | 0.04 | 1040 | 0.001 | 0.001 | 1042 | 0.0011 | 0.0006 | 1041 | 0.007 | 0.019 | 1042 | 0.04 | 0.08 |
| Xinhuwei | 300 | 0.02 | 0.02 | 300 | 0.005 | 0.004 | 300 | 0.0011 | 0.0005 | 300 | 0.004 | 0.004 | 300 | 0.055 | 0.06 |
| Erren | 668 | 0.02 | 0.02 | 668 | 0.008 | 0.005 | 668 | 0.0019 | 0.0026 | 668 | 0.009 | 0.074 | 668 | 0.125 | 0.28 |
| Gaoping | 948 | 0.02 | 0.02 | 944 | 0.003 | 0.005 | 948 | 0.001 | 0.0003 | 944 | 0.004 | 0.006 | 948 | 0.048 | 0.29 |
| Jishuei | 439 | 0.01 | 0.01 | 439 | 0.009 | 0.005 | 439 | 0.001 | 0.0003 | 439 | 0.004 | 0.006 | 438 | 0.022 | 0.03 |
| Puzi | 442 | 0.01 | 0.01 | 442 | 0.005 | 0.003 | 442 | 0.001 | 0.0003 | 442 | 0.005 | 0.01 | 442 | 0.065 | 0.31 |
| Yanshuei | 343 | 0.01 | 0.01 | 343 | 0.009 | 0.005 | 343 | 0.0011 | 0.001 | 343 | 0.005 | 0.012 | 343 | 0.04 | 0.07 |
| Zengwun | 665 | 0.01 | 0.02 | 665 | 0.003 | 0.003 | 665 | 0.001 | 0.0005 | 665 | 0.004 | 0.004 | 665 | 0.023 | 0.04 |
| River Name | Hg (mg/L) | Cu (mg/L) | Mn (mg/L) | Ag (mg/L) | Se (mg/L) | ||||||||||
| N | Mean | SD | N | Mean | SD | N | Mean | SD | N | Mean | SD | N | Mean | SD | |
| Dahan | 384 | 0.0004 | 0.00038 | 412 | 0.036 | 0.097 | 412 | 0.22 | 0.62 | 412 | 0.0026 | 0.0027 | 307 | 0.0013 | 0.00045 |
| Danshuei | 220 | 0.00044 | 0.00051 | 236 | 0.018 | 0.032 | 236 | 0.12 | 0.12 | 236 | 0.0028 | 0.0043 | 176 | 0.0013 | 0.00045 |
| Jilong | 715 | 0.00038 | 0.0003 | 767 | 0.007 | 0.011 | 765 | 0.11 | 0.12 | 765 | 0.0028 | 0.0049 | 570 | 0.0013 | 0.00044 |
| Laojie | 385 | 0.00032 | 0.00015 | 413 | 0.06 | 1.777 | 413 | 0.22 | 0.7 | 413 | 0.0024 | 0.002 | 308 | 0.0013 | 0.00045 |
| Dongshan | 285 | 0.00033 | 0.00012 | 301 | 0.005 | 0.009 | 301 | 0.1 | 0.06 | 301 | 0.0029 | 0.003 | 252 | 0.0013 | 0.00045 |
| Jhuoshuei | 251 | 0.00041 | 0.00036 | 267 | 0.019 | 0.03 | 267 | 0.69 | 1.16 | 267 | 0.0023 | 0.0017 | 191 | 0.0013 | 0.00049 |
| Wu | 970 | 0.00031 | 0.00006 | 1042 | 0.009 | 0.012 | 1040 | 0.11 | 0.17 | 1040 | 0.0023 | 0.0019 | 759 | 0.0013 | 0.0006 |
| Xinhuwei | 280 | 0.00034 | 0.00012 | 300 | 0.012 | 0.019 | 300 | 0.36 | 0.47 | 300 | 0.0022 | 0.0017 | 220 | 0.0013 | 0.00051 |
| Erren | 632 | 0.00058 | 0.00017 | 668 | 0.05 | 0.158 | 668 | 0.23 | 0.24 | 668 | 0.0025 | 0.0033 | 519 | 0.0014 | 0.00087 |
| Gaoping | 879 | 0.00034 | 0.00018 | 948 | 0.009 | 0.016 | 944 | 0.41 | 0.71 | 944 | 0.0028 | 0.0076 | 689 | 0.0013 | 0.00057 |
| Jishuei | 411 | 0.00034 | 0.00017 | 439 | 0.005 | 0.004 | 439 | 0.25 | 0.18 | 439 | 0.0024 | 0.0025 | 330 | 0.0013 | 0.00044 |
| Puzi | 415 | 0.00032 | 0.00013 | 442 | 0.007 | 0.043 | 442 | 0.23 | 0.24 | 442 | 0.0023 | 0.0022 | 327 | 0.0017 | 0.00197 |
| Yanshuei | 319 | 0.00032 | 0.0001 | 343 | 0.011 | 0.016 | 343 | 0.28 | 0.19 | 343 | 0.0023 | 0.0017 | 256 | 0.0013 | 0.00045 |
| Zengwun | 622 | 0.00034 | 0.00016 | 665 | 0.006 | 0.009 | 665 | 0.18 | 0.52 | 665 | 0.0023 | 0.002 | 490 | 0.0013 | 0.00044 |
Table 3.
Correlation matrix between RPI and other water quality data in the Erren River.
| Parameter | RPI | Air Temperature | Water Temperature | pH | Conductivity | DO | BOD | COD | SS | Coliform | Ammonia | TP | TOC | Nitrate | Nitrite |
|---|---|---|---|---|---|---|---|---|---|---|---|---|---|---|---|
| RPI | 1 | −0.089 | −0.0072 | −0.438 | −0.376 ** | −0.719 ** | 0.621 ** | 0.339 ** | 0.512 ** | 0.333 ** | 0.587 ** | 0.402 ** | 0.383 ** | −0.301 ** | 0.308 ** |
| Air Temperature | - | 1 | 0.875 ** | −0.082 ** | −0.067 ** | 0.055 * | −0.165 ** | −0.169 ** | 0.053 * | −0.068 ** | −0.174 ** | −0.313 ** | −0.192 ** | 0.130 ** | −0.006 |
| Water Temperature | - | - | 1 | −0.1 ** | −0.043 | 0.052 * | −0.0167 ** | −0.172 ** | 0.018 | −0.080 ** | −0.178 ** | −0.3 ** | −0.137 ** | 0.063 | −0.046 |
| pH | - | - | - | 1 | 0.039 | 0.607 ** | −0.256 ** | −0.144 ** | 0.001 | −0.119 ** | 0.062 ** | 0.231 ** | −0.227 ** | 0.121 ** | −0.068 |
| Conductivity | - | - | - | - | 1 | 0.515 ** | −0.173 ** | −0.182 ** | −0.561 ** | −0.016 | −0.145 ** | −0.166 ** | −0.247 ** | 0.564 ** | 0.113 ** |
| DO | - | - | - | - | - | 1 | −0.415 ** | −0.346 ** | 0.062 ** | −0.069 ** | −0.194 ** | −0.125 ** | −0.434 ** | 0.254 ** | −0.176 ** |
| BOD | - | - | - | - | - | - | 1 | 0.853 ** | −0.026 | 0.550 ** | 0.419 ** | 0.407 ** | 0.788 ** | −0.203 ** | 0.098 * |
| COD | - | - | - | - | - | - | - | 1 | 0.133 ** | 0.255 ** | 0.548 ** | 0.603 ** | 0.854 ** | −0.150 ** | 0.093 * |
| SS | - | - | - | - | - | - | - | 1 | −0.011 | −0.065 ** | −0.021 | −0.106 ** | 0.245 ** | −0.095 * | |
| Coliform | - | - | - | - | - | - | - | - | 1 | 0.036 | 0.042 | 0.565 ** | −0.051 | −0.046 | |
| Ammonia | - | - | - | - | - | - | - | - | - | 1 | 0.738 ** | 0.562 ** | −0.093 * | 0.098 * | |
| TP | - | - | - | - | - | - | - | - | - | - | 1 | 0.501 ** | −0.006 | 0.102 * | |
| TOC | - | - | - | - | - | - | - | - | - | - | - | 1 | −0.248 ** | 0.094 | |
| Nitrate | - | - | - | - | - | - | - | - | - | - | - | - | 1 | −0.066 | |
| Nitrite | - | - | - | - | - | - | - | - | - | - | - | - | - | 1 |
*: Correlation is significant at the 0.05 level (2-tailed); **: Correlation is significant at the 0.01 level (2-tailed).
Table 4.
Initial eigenvalues and selected component loading after varimax rotation for PCA results in the Erren River.
Table 4.
Initial eigenvalues and selected component loading after varimax rotation for PCA results in the Erren River.
| Component (Factor) | Initial Eigenvalues | ||
|---|---|---|---|
| Total | % of Variance | Cumulative % | |
| 1 | 4.208 | 38.25 | 38.25 |
| 2 | 1.471 | 13.37 | 51.62 |
| 3 | 1.175 | 10.68 | 62.3 |
Table 5.
Varimax rotated factor of PCA of Erren River water quality.
| Parameter | Component (Factor) | ||
|---|---|---|---|
| 1 | 2 | 3 | |
| DO | −0.050 | −0.734 | 0.301 |
| BOD | 0.487 | 0.748 | 0.066 |
| COD | 0.564 | 0.718 | 0.137 |
| Ammonia | 0.858 | 0.069 | −0.086 |
| TP | 0.866 | 0.027 | 0.005 |
| TOC | 0.671 | 0.727 | 0.024 |
| Conductivity | −0.203 | −0.231 | −0.737 |
| Nitrate | −0.097 | −0.458 | 0.700 |
| SS | −0.185 | −0.008 | 0.709 |
| Nitrite | −0.067 | 0.714 | −0.558 |
| Coliform | 0.046 | 0.810 | 0.031 |
Table 6.
Contribution percentage of each factor from MLR results.
| Model | B | Sig. | Percentage | R2 |
|---|---|---|---|---|
| Constant | −0.602 | 0.000 | - | 0.74 |
| Regression Factor 1 | 2.573 | 0.000 | 72% | |
| Regression Factor 2 | 0.554 | 0.000 | 16% | |
| Regression Factor 3 | 0.440 | 0.000 | 12% |
© 2018 by the authors. Licensee MDPI, Basel, Switzerland. This article is an open access article distributed under the terms and conditions of the Creative Commons Attribution (CC BY) license (http://creativecommons.org/licenses/by/4.0/).
Share and Cite
MDPI and ACS Style
Putri, M.S.A.; Lou, C.-H.; Syai’in, M.; Ou, S.-H.; Wang, Y.-C. Long-Term River Water Quality Trends and Pollution Source Apportionment in Taiwan. Water 2018, 10, 1394. https://doi.org/10.3390/w10101394
AMA Style
Putri MSA, Lou C-H, Syai’in M, Ou S-H, Wang Y-C. Long-Term River Water Quality Trends and Pollution Source Apportionment in Taiwan. Water. 2018; 10(10):1394. https://doi.org/10.3390/w10101394
Chicago/Turabian StylePutri, Marsha Savira Agatha, Chao-Hsun Lou, Mat Syai’in, Shang-Hsin Ou, and Yu-Chun Wang. 2018. "Long-Term River Water Quality Trends and Pollution Source Apportionment in Taiwan" Water 10, no. 10: 1394. https://doi.org/10.3390/w10101394
Note that from the first issue of 2016, this journal uses article numbers instead of page numbers. See further details here.