A Single Tube Contactor for Testing Membrane Ozonation
by
 , and
, and
Garyfalia A. Zoumpouli
1,2,3 ,
,
Robert Baker
1,2,
Caitlin M. Taylor
1,2,3,
Matthew J. Chippendale
2,
Chloë Smithers
2,
Sean S. X. Ho
2,
Davide Mattia
2,3,
Y. M. John Chew
2,3 and
Jannis Wenk
2,3,* 1
Centre for Doctoral Training, Centre for Sustainable Chemical Technologies, University of Bath, Bath BA2 7AY, UK
2
Department of Chemical Engineering, University of Bath, Bath BA2 7AY, UK
3
Water Innovation and Research Centre (WIRC), University of Bath, Bath BA2 7AY, UK
*
Author to whom correspondence should be addressed.
Water 2018, 10(10), 1416; https://doi.org/10.3390/w10101416
Submission received: 13 September 2018
/
Revised: 4 October 2018
/
Accepted: 8 October 2018
/
Published: 10 October 2018
(This article belongs to the Special Issue Recent Advances in Water and Wastewater Treatment with Emphasis in Membrane Treatment Operations)
Abstract
:A membrane ozonation contactor was built to investigate ozonation using tubular membranes and inform computational fluid dynamics (CFD) studies. Non-porous tubular polydimethylsiloxane (PDMS) membranes of 1.0–3.2 mm inner diameter were tested at ozone gas concentrations of 110–200 g/m3 and liquid side velocities of 0.002–0.226 m/s. The dissolved ozone concentration could be adjusted to up to 14 mg O3/L and increased with decreasing membrane diameter and liquid side velocity. Experimental mass transfer coefficients and molar fluxes of ozone were 2.4 × 10⁻⁶ m/s and 1.1 × 10⁻⁵ mol/(m2 s), respectively, for the smallest membrane. CFD modelling could predict the final ozone concentrations but slightly overestimated mass transfer coefficients and molar fluxes of ozone. Model contaminant degradation experiments and UV light absorption measurements of ozonated water samples in both ozone (O3) and peroxone (H2O2/O3) reaction systems in pure water, river water, wastewater effluent, and solutions containing humic acid show that the contactor system can be used to generate information on the reactivity of ozone with different water matrices. Combining simple membrane contactors with CFD allows for prediction of ozonation performance under a variety of conditions, leading to improved bubble-less ozone systems for water treatment.
1. Introduction
Ozone is a chemical oxidant used for water treatment for more than a century [1]. Ozone has a wide range of applications [2], including disinfection [3], control of disinfection byproducts [4,5], addressing taste and odour issues [6], and the removal of trace contaminants from both drinking water and during advanced wastewater treatment schemes [7,8,9,10]. Consequently, the usage of ozone has been steadily increasing for decades [11]. Ozone is an unstable gas that needs on-site production. The main costs of ozone operation relate to a combination of energy and oxygen consumption [12]. Usually, ozone is dissolved into the water phase via bubbling using various types of gas diffusers or side stream injection [13]. Knowledge and quantification of ozone mass transfer is crucial for the design of treatment operations [14]. Based on fundamental mass-transfer principles of gas–liquid systems, ozone transfer is dependent on the interfacial area, the mass transfer coefficients, the solubility of gas in liquid and the concentration gradient between the gas and the liquid phase. In practice ozone transfer is also determined by the operating conditions such as mixing, the gas diffuser type, the water matrix, and the setup of the treatment facility.
Bubble-less gas transfer by membranes permeable to ozone is an alternative to bubble-based methods [15]. Membrane contactors provide a constant interfacial surface area separating the gas phase from the liquid phase and result in readily predictable liquid flow patterns that enable straightforward control over ozone gas to liquid mass transfer. The use of membranes may result in increased process efficiencies by significantly reducing off-gas disposal volume [16,17], and diminishing practical challenges such as foaming issues [18]. The modular design of membrane contactors allows accurate responses to changing treatment needs and convenient maintenance. Particularly relevant for ozone applications is the targeted reduction of the regulated ozonation byproduct bromate that can be achieved when employing membrane contactors [19].
Despite obvious advantages and growing commercial interest for membrane ozonation, there is comparatively little available literature on ozone transfer into water through membranes, with most studies focusing on ozone as a supplementary agent within hybrid treatment processes to increase membrane performance by reducing fouling or enhancing biodegradation of contaminants in membrane bioreactors (e.g., [20,21,22]).
Important attributes for ozonation membranes include porosity, surface hydrophobicity, selectivity for transfer of ozone over oxygen, and stability during long-term ozone exposure. Ozone-resistant inorganic ceramic membranes are made of alumina [23,24,25] and porous glass [26]. To prevent wetting of the surface and flooding of membrane pores, ceramic materials usually require surface modification to increase hydrophobicity [27,28,29]. Most polymeric membrane materials are hydrophobic but are prone to reacting with ozone. For example, polymers such as polyethersulfone (PES) and polyetherimide (PEI) possess carbon double bonds that react with ozone, leading to decomposition [30]. Fluoropolymers such as polytetrafluoroethylene (PTFE) or polyvinylidene fluoride (PVDF) and polymers without functional groups exhibiting reactivity towards ozone such as plasticizer-free polydimethylsiloxane (PDMS) are more suitable for ozone [31]. Both PTFE and PDVF membranes have a sponge-like porous morphology and are resistant to ozone, while PDMS membranes have a dense non-porous morphology. Compared to fluoropolymers, PDMS is less resistant towards corrodants other than ozone, including UV [32,33,34]. Testing the long-term use of PDMS membranes in water treatment ozonation is still pending. However, given its availability in various sizes and its low purchase cost, PDMS appears as an appropriate model membrane material for smaller-scale investigations of membrane ozonation processes.
In a previous study we developed a modelling approach based on computational fluid dynamics (CFD) and convection-diffusion theory to calculate ozone and oxygen gradients and their mass transfer through non-porous PDMS membranes into the aqueous phase [35]. The known material properties of PDMS and literature values on ozone mass transfer were used as input values for the model, as our own experimental results were unavailable. The goal of this study was to create the experimental means to further verify and refine our modelling approach and enable data collection on ozonation experiments by using a simple ozone contactor system. Therefore, the objectives of this study were (1) to build a membrane contactor system as a flexible-use platform to investigate tubular membranes for ozonation; (2) to measure the mass transfer of ozone into water through different PDMS membranes; (3) to compare results with the previously developed model; and (4) to conduct tests with established probe compounds for ozonation experiments in pure water, real water samples, and under peroxone process conditions by adding hydrogen peroxide (H2O2) to the aqueous phase.
2. Materials and Methods
All chemicals, including solvents and analytical consumables, were purchased from commercial sources: Potassium indigo trisulfonate (CAS 67627-18-3, Sigma-Aldrich, Saint Louis, MO, USA), para-chlorobenzoic acid (pCBA, 99% purity, Acros Organics, Hampton, NH, USA), humic acid sodium salt (CAS 68131-04-4, technical grade, Sigma Aldrich), N,N-diethyl-p-phenylenediamine (DPD, 99% purity, Acros Organics), and peroxidase horseradish (≥85 units/mgdw, Alfa Aesar, Haverhill, MA, USA).
Ultrapure water (resistivity > 18 MΩ/cm) was used for preparing stock solutions, analysis and experiments and was produced with Milli-Q (Merck, Kenilworth, NJ, USA) or ELGA (Veolia, Paris, France) water purification systems.
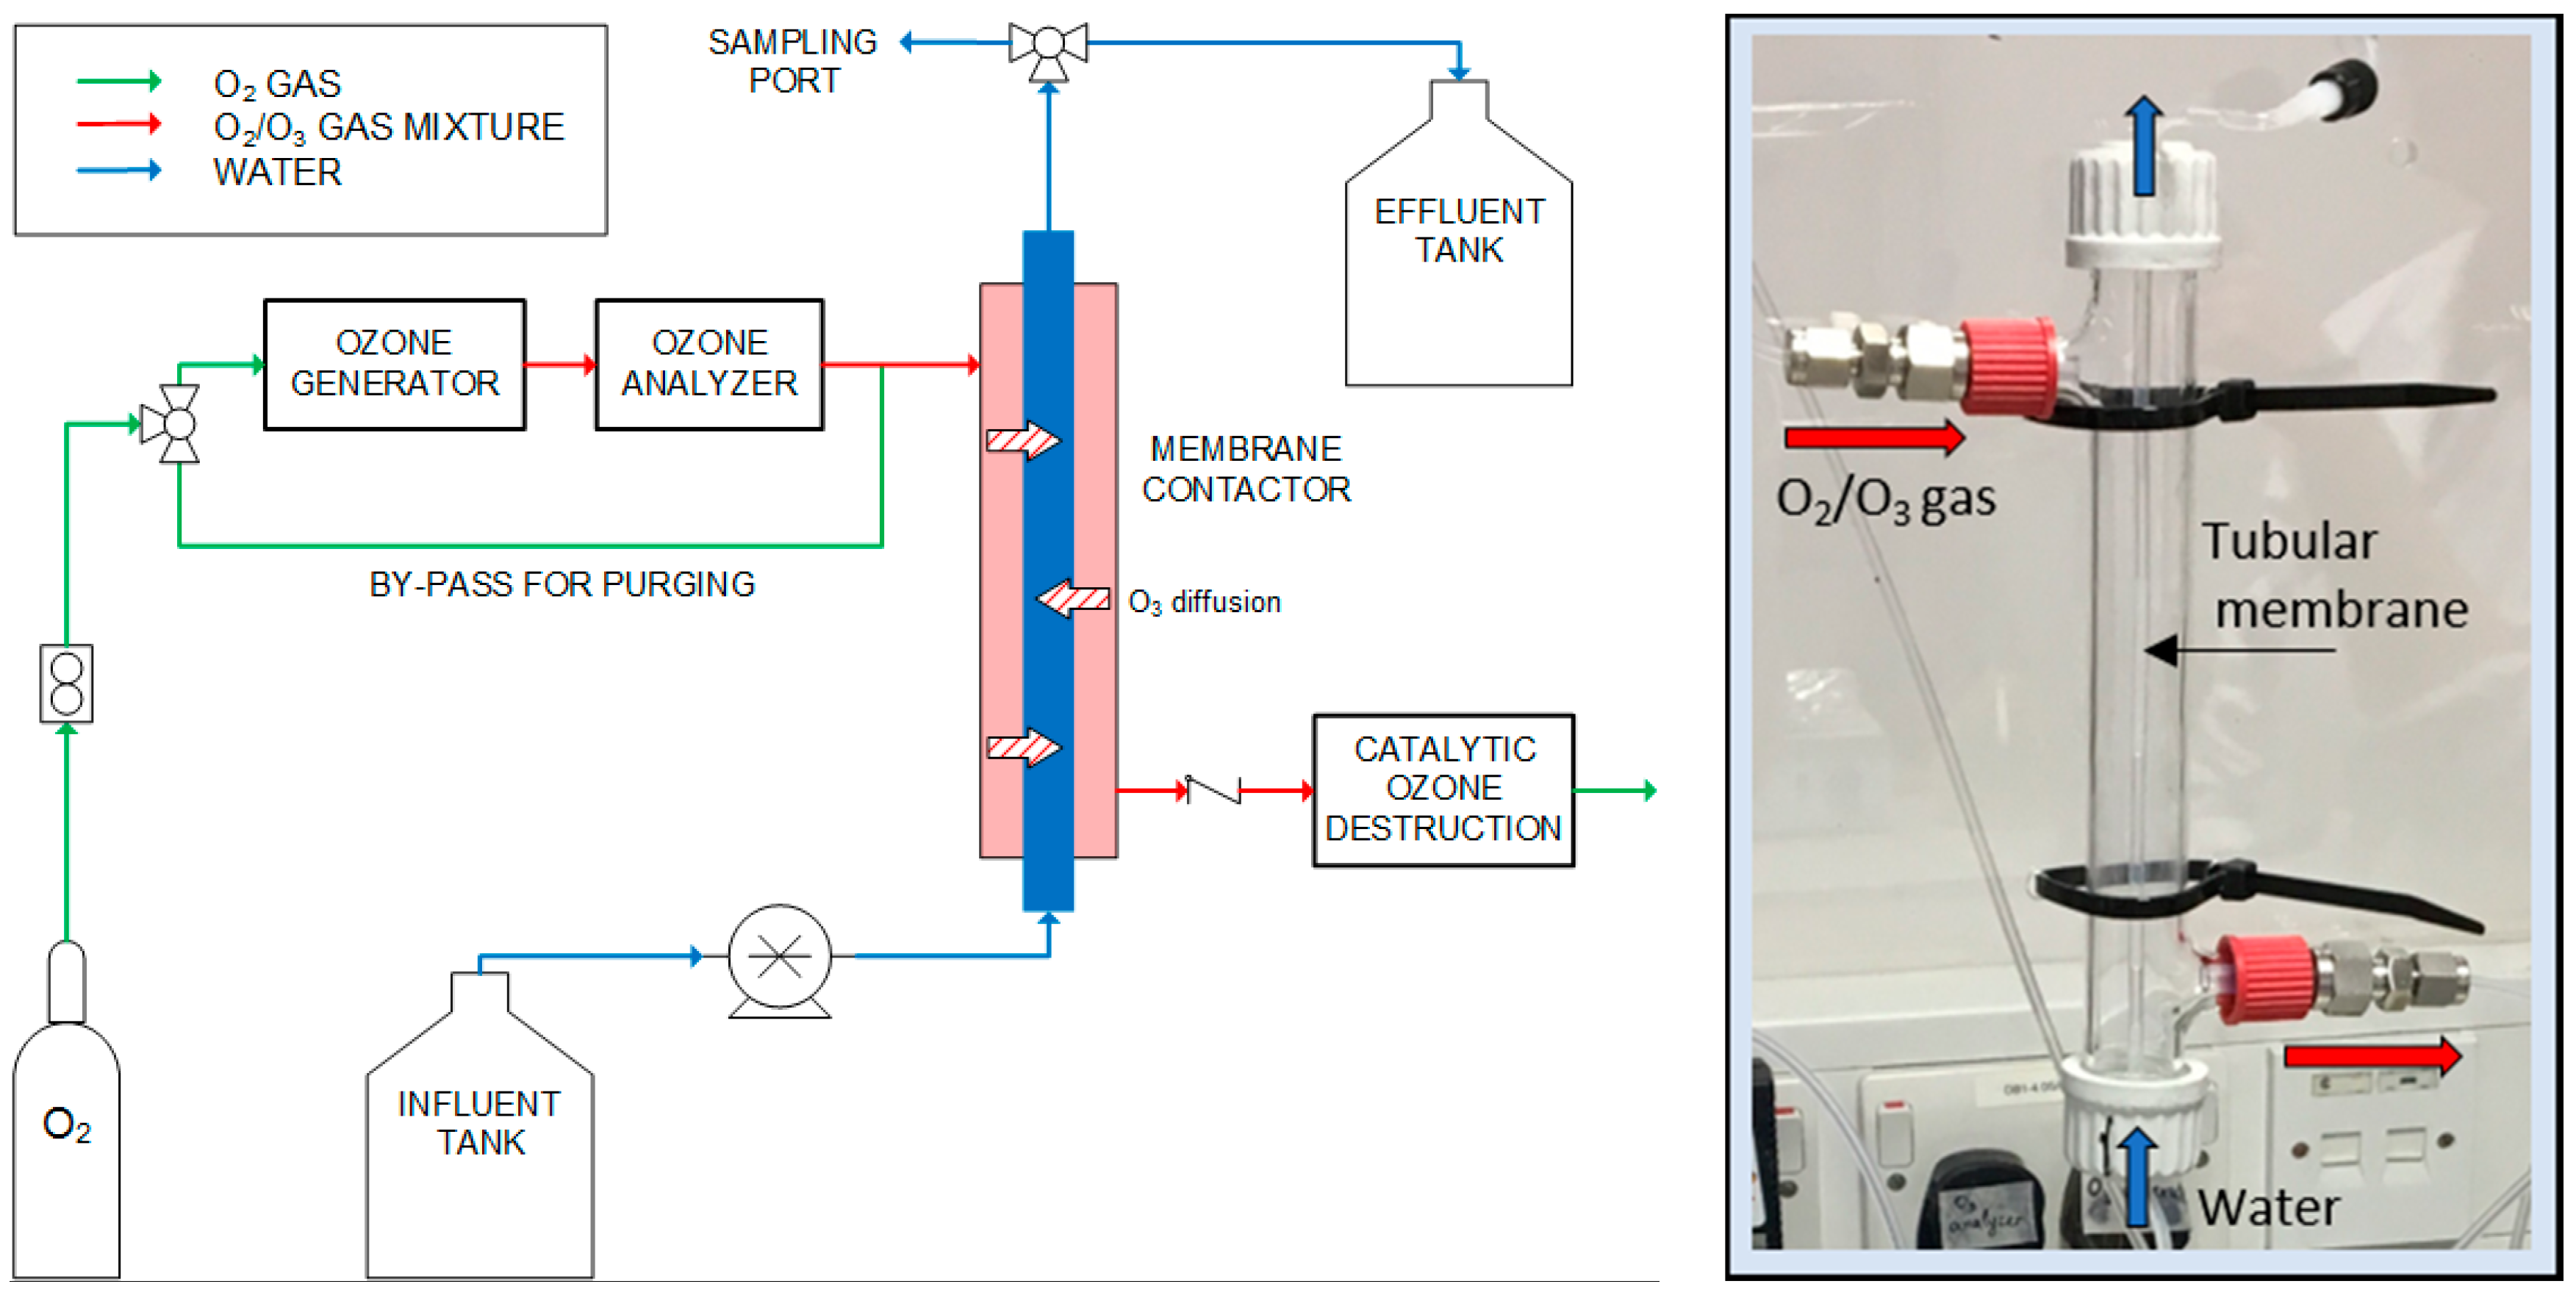
2.1. Membrane Contactor System
A schematic and a photograph of the lab-scale, single tube membrane contactor built for this study are shown in Figure 1. A borosilicate glass tube (length 20 cm, outer diameter (OD) 22 mm, inner diameter (ID) 18 mm) with two vertical and two horizontal screw connections (SQ24 and GL14, respectively) served as a shell for the membrane contactor. Ozone-resistant impermeable perfluoroalkoxy alkane (PFA) tubing (OD 1/8 inch, Swagelok, Solon, OH, USA) and Swagelok fittings (1/8 inch) made of 316 stainless steel were used for connecting both gas lines and liquid lines. The valves used were straight-port HAM-LET H-800 ball valves (FTI Ltd., East Sussex, UK).
An ozone generator (BMT 803N, BMT Messtechnik GmbH, Berlin, Germany) fed with high purity oxygen (industrial grade, 99.5% purity, BOC, Bristol, UK) was used to produce ozone (maximum O3 concentration > 250 g/Nm3, or approximately 18% w/w). The oxygen flow rate was controlled with a rotameter (maximum 300 mL/min, FLDO3306ST, Omega, Manchester, UK). The outlet of the ozone generator was connected to an ozone analyser (maximum 200 g/m3, BMT 964, BMT, Berlin, Germany). The ozone/oxygen mixture was directed to the reactor through a plug valve. The gas mixture outlet was connected to a check valve (Swagelok) to prevent back flow, and then to a heated catalyst ozone to oxygen converter (CAT-RS, BMT). A purge line was included to flush the system off ozone when required.
The influent water was pumped using a diaphragm pump (0.25–20 mL/min, FMM 20 KPDC-P, KNF, Trenton, NJ, USA) and then directed to the reactor using a plug valve. The membrane tube ran through the centre of the reactor. It was held in place at the two ends with silicone seals that provided leak-free operation. The membrane was connected to the liquid line outside the shell with push-on fittings. The water flow was from bottom to top, in counter-flow with the gas.
2.2. Ozonation Experiments
In all the experiments, the oxygen pressure was set to approximately 0.9 bar since the maximum operational pressure of the ozone generator was 1 bar. The oxygen flow rate was set to 100 mL/min. Experiments with different ozone concentrations in the gas phase were performed (7–14% weight O3/weight gas mixture). The minimum concentration that could be achieved with the employed conditions was 110 g O3/m3 (±10%). The maximum ozone concentration was determined by the upper limit of the ozone analyser and was 200 g O3/m3. The main characteristics of the PDMS membranes used are shown in Table 1. Except for membrane longevity tests, a new membrane was used for each experiment (i.e., after a few hours of use, the membrane was replaced).
The pump flow rate was measured at the beginning of each experiment using deionized water and a balance. Based on steady-state experiments, the system was left to stabilize for at least 10 min for flow rates between 5–20 mL/min, and for at least 20 min for flow rates less than 5 mL/min, before samples were taken.
Experiments were performed with different water matrices at room temperature (21 °C ± 2 °C): (1) deionized water with or without phosphate buffer (pH = 7.1), non-spiked, or spiked with pCBA (concentration approximately 10 µM) or humic acid (total organic carbon, TOC of 1.3–13.7 mg/L); (2) secondary treated wastewater (wastewater effluent); or (3) river water. For peroxone experiments, the influent was supplemented with 15–100 μΜ H2O2.
2.3. Wastewater Effluent and River Water
Secondary treated wastewater was collected from a wastewater treatment plant in South-West England, UK. River water was collected from the River Avon in Bath, UK. For stabilization water samples were filtered with pre-rinsed glass microfiber filters grades GF/A or GF/C (nominal particle retention: 1.6 μm or 1.2 μm, respectively, Whatman, GE Life Sciences, Machelen, Belgium) and were stored at 4 °C until used. Water sample properties and sampling dates are shown in Table 2.
2.4. Analytical Methods
The concentration of dissolved ozone was measured with the indigo method [36]. The exact concentration of H2O2 in the feed water was measured with the DPD method [37]. UV-VIS measurements were performed with a UV-VIS spectrophotometer (Cary 100, Agilent Technologies, Santa Clara, CA, USA) using 1-cm quartz glass cuvettes. The pH was measured with a pH meter (FE20, Mettler Toledo). The concentration of total organic carbon (TOC), as non-purgeable organic carbon (NPOC), was measured with a TOC analyser (Shimadzu TOC 5000A, Kyoto, Japan). Alkalinity was determined by titration with 0.1 N hydrochloric acid according to ISO standard 9963-1:1994 [38]. Nitrate was measured with a HANNA® nitrate test kit (HI38050) (Woonsocket, RI, USA).
HPLC analysis of pCBA was performed with an Agilent HPLC System with a UV detector and an Acclaim RSLC 120 C18 column (3 μm, 120 Å, 3 × 75 mm). The mobile phase was 40% acetonitrile and 60% water with 10 mM phosphoric acid (pH = 2.5). The flow rate was 0.5 mL/min and the injection volume was 50 μL. UV absorption was measured at 240 nm.
2.5. Computational Modelling
Computational fluid dynamics (CFD) simulation is the generation of a numerical solution that satisfies a group of conservation equations (here, mass, momentum and species transport) over a computational domain that represents a real physical domain. The computational work was conducted using COMSOL Multiphysics V5.3 (COMSOL Inc., Shanghai, China) to determine the concentration profiles of O3 (and O2) in the gas, membrane, and liquid phase, so that major mass transfer resistances could be identified, i.e., using a similar approach to that reported by Berry et al. (2017) [35]. The main difference, however, was that the liquid and gas phase in this work were in the tube and shell side of the reactor respectively. The dimensions and operating conditions employed were those described in Section 2.2.
3. Results and Discussion
3.1. Ozone Concentration with Liquid Side Velocity and Membrane Size
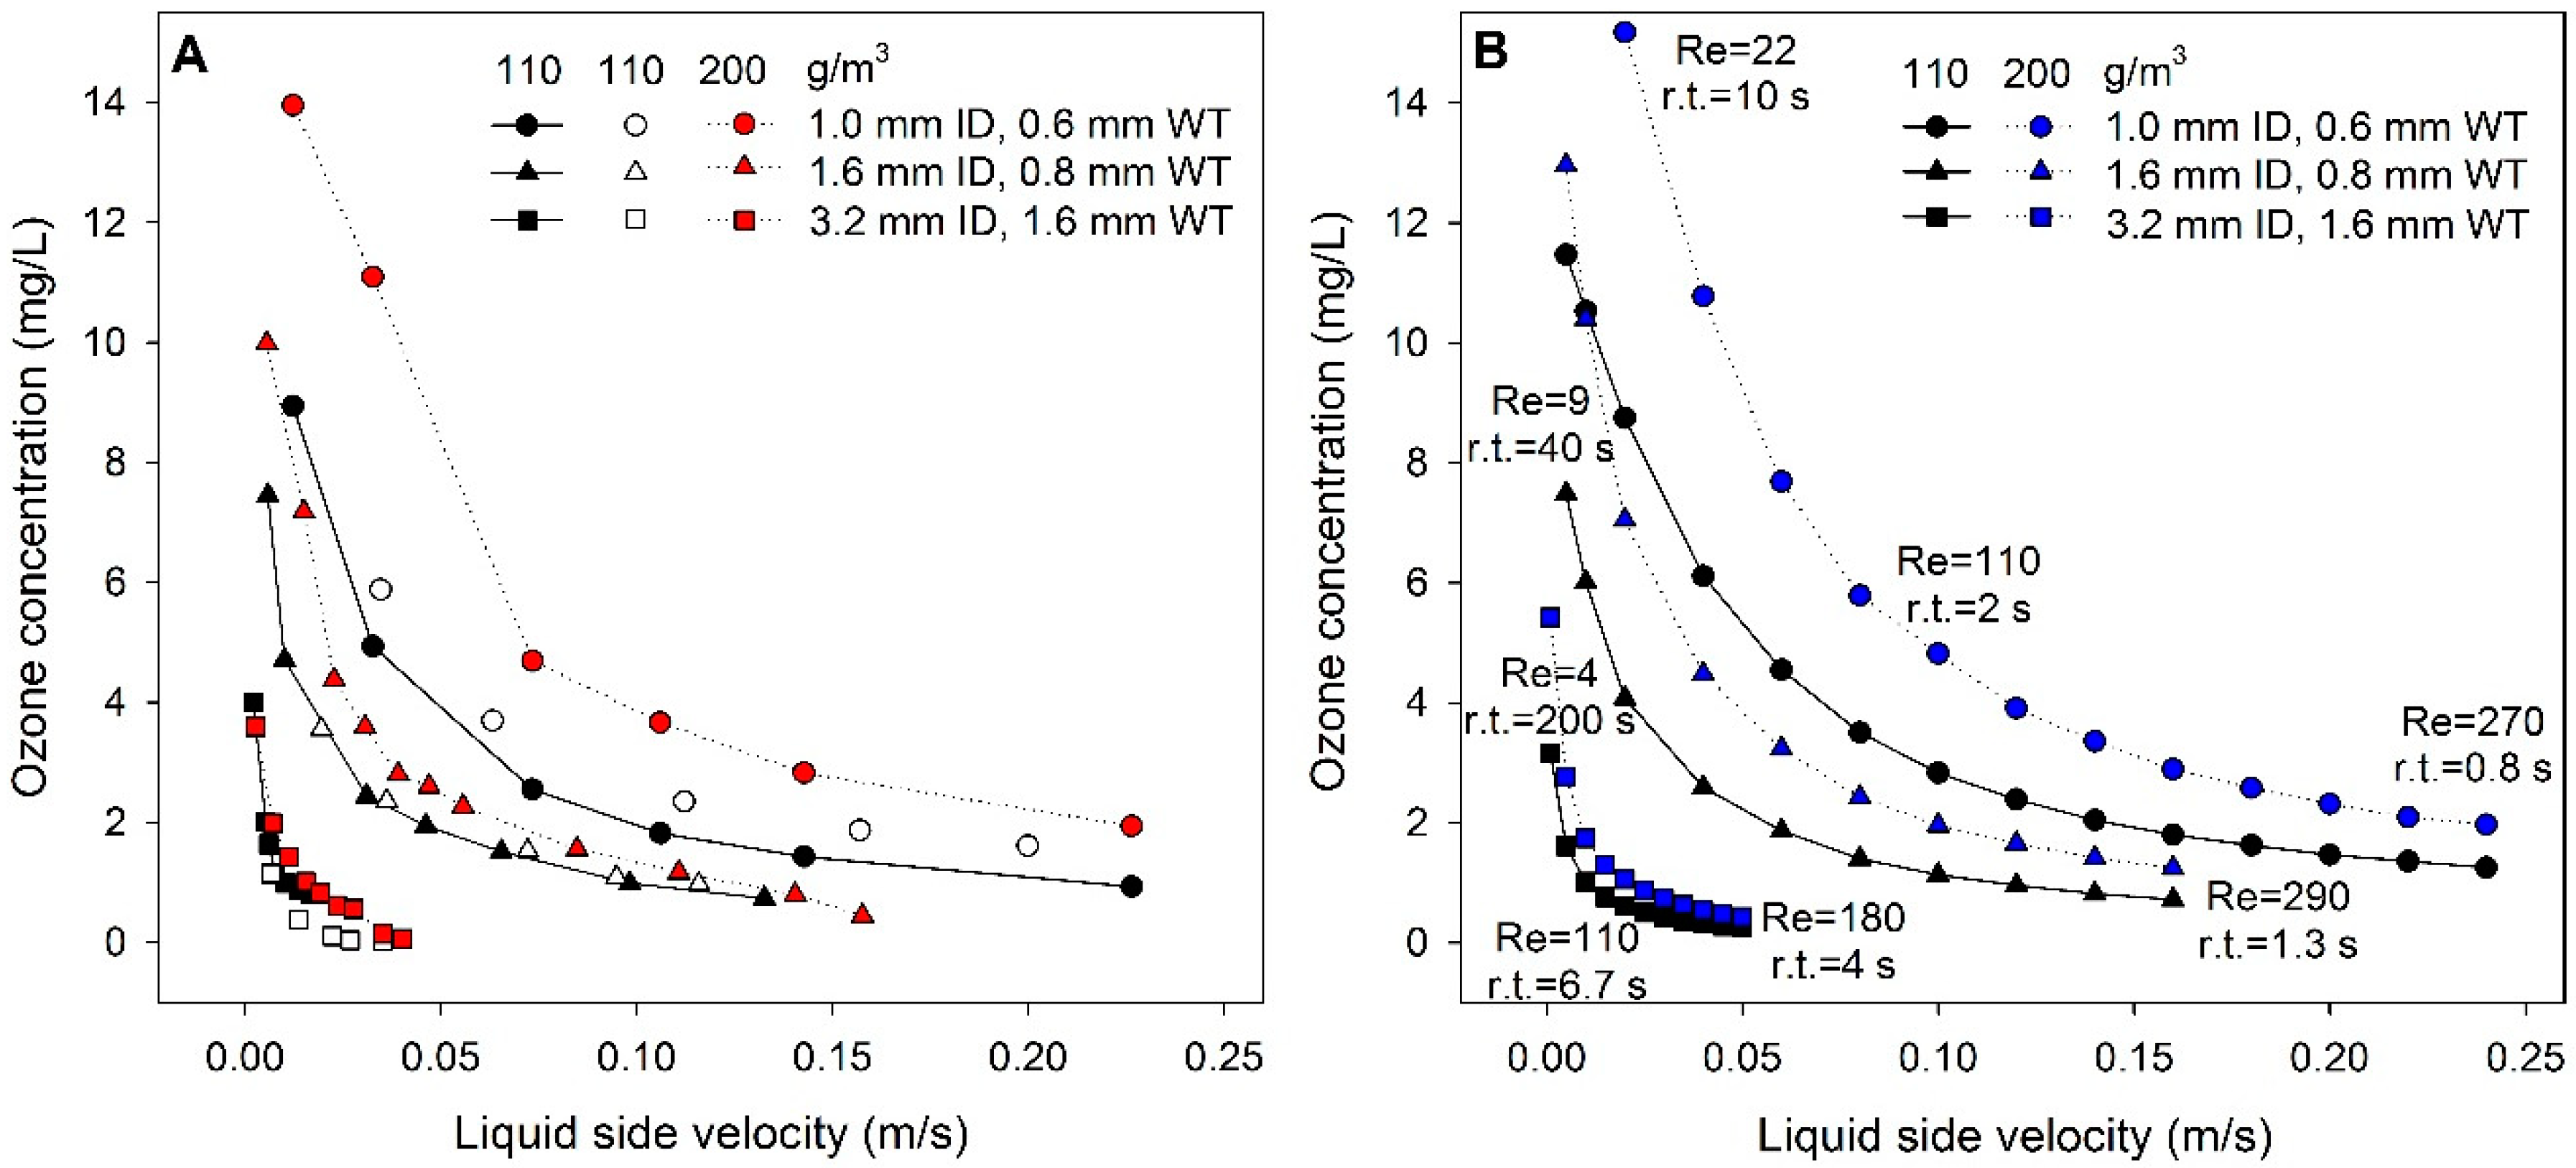
The measured ozone concentrations at the outlet of the contactor compartment for the tested membranes at two different ozone gas concentrations and liquid side velocities ranging from 0.002 to 0.226 m/s are shown in Figure 2a. The corresponding modelled values are provided in Figure 2b, including Reynolds numbers and liquid side residence time (r.t.). The measured ozone concentration increased with smaller membrane diameter and decreasing liquid side velocity. Roughly doubling the ozone concentration from 110 g/m3 to 200 g/m3 in the gas phase resulted in higher dissolved ozone concentrations, especially for the thinner membranes.
Repetition experiments conducted with a different set of membranes, cut from one tube, and different flow rates indicate good reproducibility and an experimental uncertainty of ±0.2 mg/L. In addition, experiments with a preliminary batch contactor setup showed that the relative standard deviation across different experiments was smaller than 10%, and was decreasing with membrane size. Better reproducibility with smaller membranes is ascribed to their faster response upon changes of experimental conditions. At higher liquid side flow rates and larger membrane size, some initial ozone bubble formation occurred along the inside of the membrane, but bubbles dispersed with equilibration. High flow rates caused non-uniform initial internal wetting of the membrane and created hydrophobic patches across the surface with lower resistance for ozone, leading to bubble formation. Both observations underline the importance for sufficient equilibration time at system startup and when altering experimental parameters.
Modelling results based on the previously developed CFD approach [35] agree with the experimental data. The relative deviation between modelling and experimental results was normally below 15%, although higher relative differences were occasionally observed for high liquid side velocities, as the model is not applicable to transitional and turbulent flows. Similarly, for low flow rates, i.e., for Reynolds number (Re) ≤ 100, CFD slightly over-predicted the ozone concentration. A possible explanation for this disagreement is that at lower Re the dispersion of O3 in the liquid phase is not uniform. Over the investigated range, this translates into an absolute deviation of less than 0.5 mg/L in the prediction of ozone concentrations, which is comparable to the experimental error of 0.2 mg/L. Generally, the modelled ozone concentration was higher than observed experimentally, indicating that the model slightly overestimates the actual ozone mass transfer.
Results confirm that liquid side velocity is the dominant parameter to determine the overall mass transfer of ozone followed by membrane thickness and ozone gas concentration. In practice, modules with bundles of thin membranes operating in parallel ensure low flow rates at large overall water fluxes to achieve required ozone concentrations [18]. Note that for data shown here both wall thickness and inner diameter simultaneously change based on the actual membrane dimensions (Table 2). Results for a hypothetical cylindrical membrane with constant inner diameter with increasing wall thickness are provided elsewhere [35].
3.2. Overall Ozone Mass Transfer Coefficient and Molar Flux through the Membrane
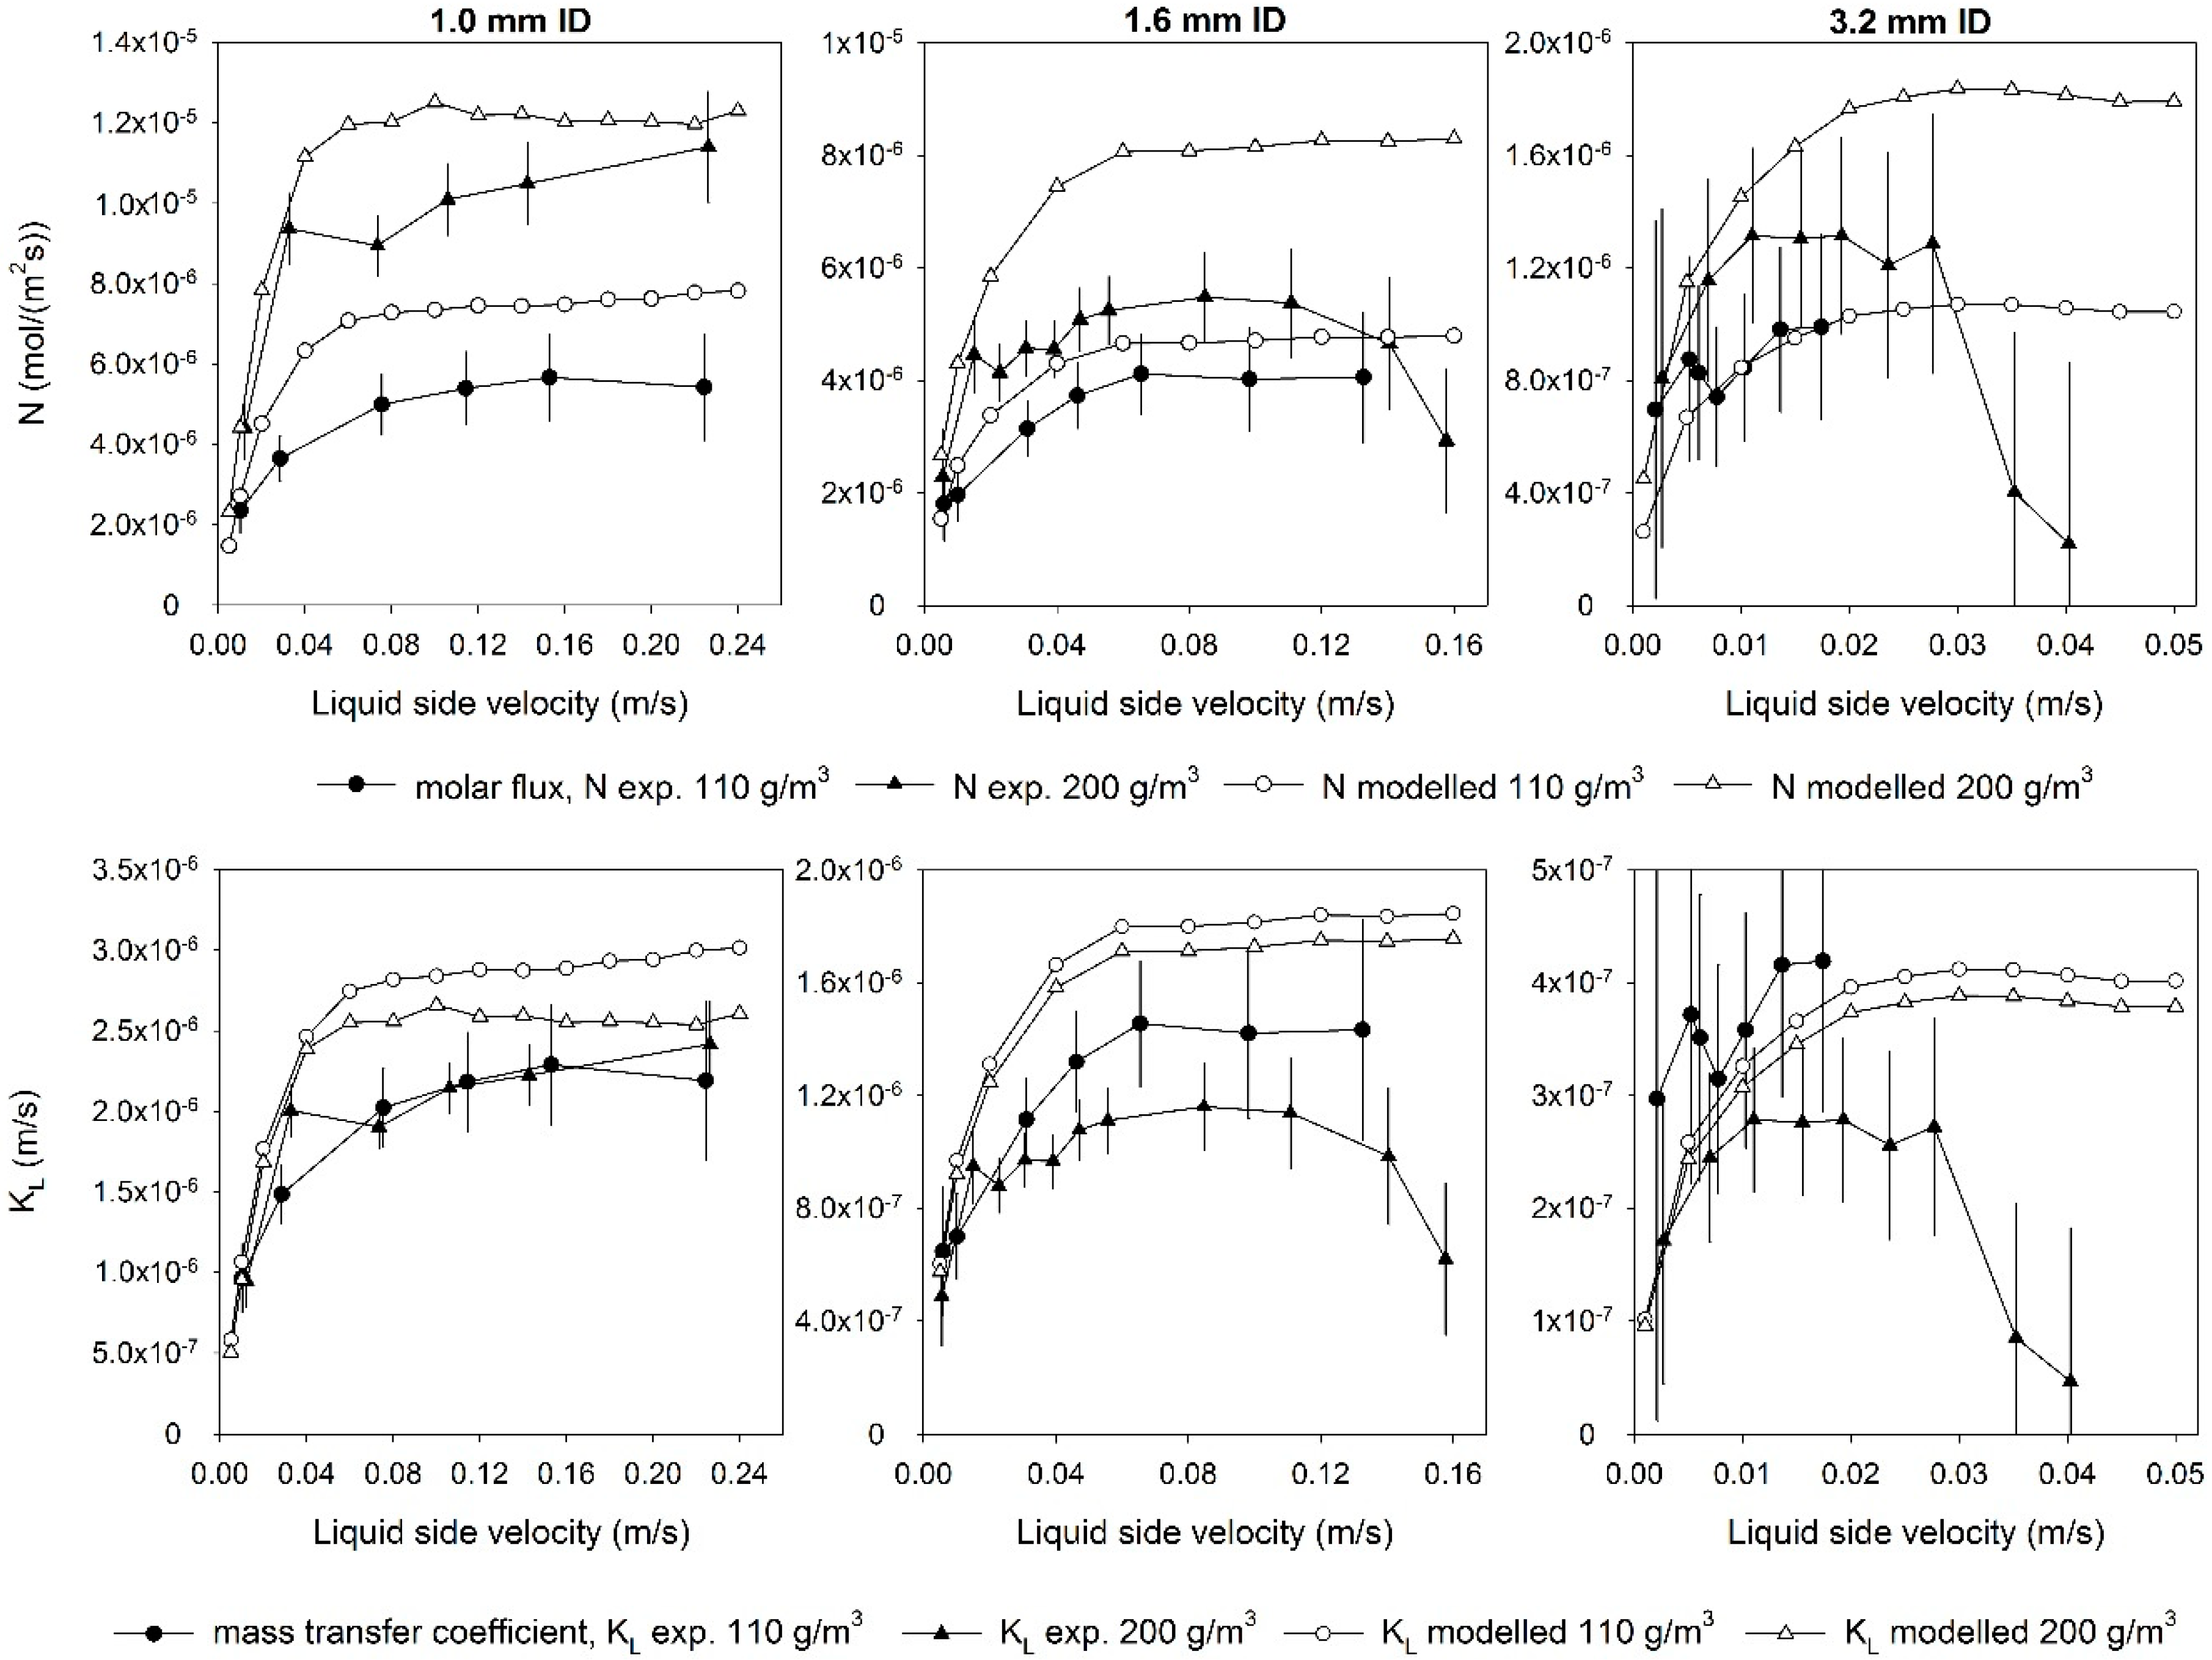
To provide a better overview on mass transfer efficiency and an alternative comparison between experimental and modelling results, overall mass transfer coefficients KL and molar fluxes of ozone were calculated.
The overall mass transfer coefficient was calculated according to Equation (1):
where α is the surface area of the membrane per unit volume of liquid, L is the length of the membrane, uL is the liquid velocity, H is the solubility of ozone in water, S is the solubility of ozone in the PDMS membrane, Cg is the ozone concentration in the gas phase, and CL,out is the measured or modelled ozone concentration at the outlet of the contactor.
The molar flux of ozone across the membrane, N, was calculated according to Equation (2):
The parameters used to calculate KL and N are shown in Table 3. The overall mass transfer coefficients and the molar fluxes of ozone for the three tested membranes are shown in Figure 3. Error bars for experimental data were determined using error propagation based on the uncertainties shown in Table 3. It is expected that the effect of inlet O3 concentration on KL is insignificant since KL largely depends on the hydrodynamics (Re) and the transport properties of O3 in water, in particular the Schmidt number (Sc) [35], which is the ratio of momentum diffusivity and mass diffusivity. In contrast, N is strongly dependent on the inlet O3 concentration, which directly affects the concentration gradient. Values of N for 200 g/m3 can be expected to be about twice those of 110 g/m3.
Mass transfer coefficients and molar fluxes increase with increasing liquid side velocity and level off at higher velocities, while dissolved ozone concentration decreases with increasing velocity, as discussed in Section 3.1. This agrees with both experimental and computational studies employing membranes made of different materials [31,35,39,40].
In addition, the mass transfer coefficients calculated for PDMS are of the same order of magnitude as those reported for porous fluoropolymer membranes. For example, for PTFE and PVDF flat sheet membranes at Re = 60 the mass transfer coefficients of ozone ranged from 5.4 × 10⁻⁶ m/s to 1.1 × 10⁻⁵ m/s [31], while in a hollow fibre PVDF membrane module the mass transfer coefficients ranged from 5.30 × 10⁻⁷ to 1.84 × 10⁻⁵ m/s for liquid side velocities ranging from 0.01 to 0.5 m/s [39].
Mass transfer coefficient and molar flux data confirm the already discussed (Section 3.1) overestimation of ozone mass transfer by the modelling approach, which is beyond the experimental error margin. The discrepancy between modelling and experimental results appears more pronounced using the data representation of Figure 3, while the differences in actual ozone concentrations are modest from an application viewpoint. The experimental uncertainty increases for larger diameters due to the larger relative error on measured ozone concentration. In addition, at higher velocities experimental results show a decrease in both molar flux and mass transfer coefficient, which is different compared to model results and is associated to much longer equilibration times needed to achieve constant gas transfer conditions for these membrane diameters.
3.3. Removal of pCBA by Membrane Ozonation and in Presence of Additional H2O2 (Peroxone Process)
The decomposition of ozone on surfaces and within the water matrix can lead to the formation of further oxidative species via radical chain reactions [43]. Ozone decomposition on the membrane surface is not considered relevant due to the low reactivity of ozone with PDMS. Ozone decomposition in water results in the formation of the OH radical, the major secondary oxidant during ozonation [44]. In contrast to ozone which is a selective oxidant, OH radicals are short lived and undergo fast reaction with most organic reactants [45]. Therefore, OH radicals play an important role in the removal of organic contaminants during ozonation because they effectively transform any organic contaminant present in water at similar reaction rates [46], while disinfection mainly occurs through ozone directly.
To assess OH radical-induced oxidation processes in the experimental setup, pCBA was used as an OH radical probe compound. pCBA is ozone-resistant [47], and an established model contaminant [48]. In addition, pCBA removal experiments were conducted in peroxone systems, i.e., by adding hydrogen peroxide (H2O2). The reaction of hydrogen peroxide with ozone creates an increased OH radical concentration [49]. The peroxone process has been widely used to improve treatment efficiency for compounds that react slowly with ozone [50].
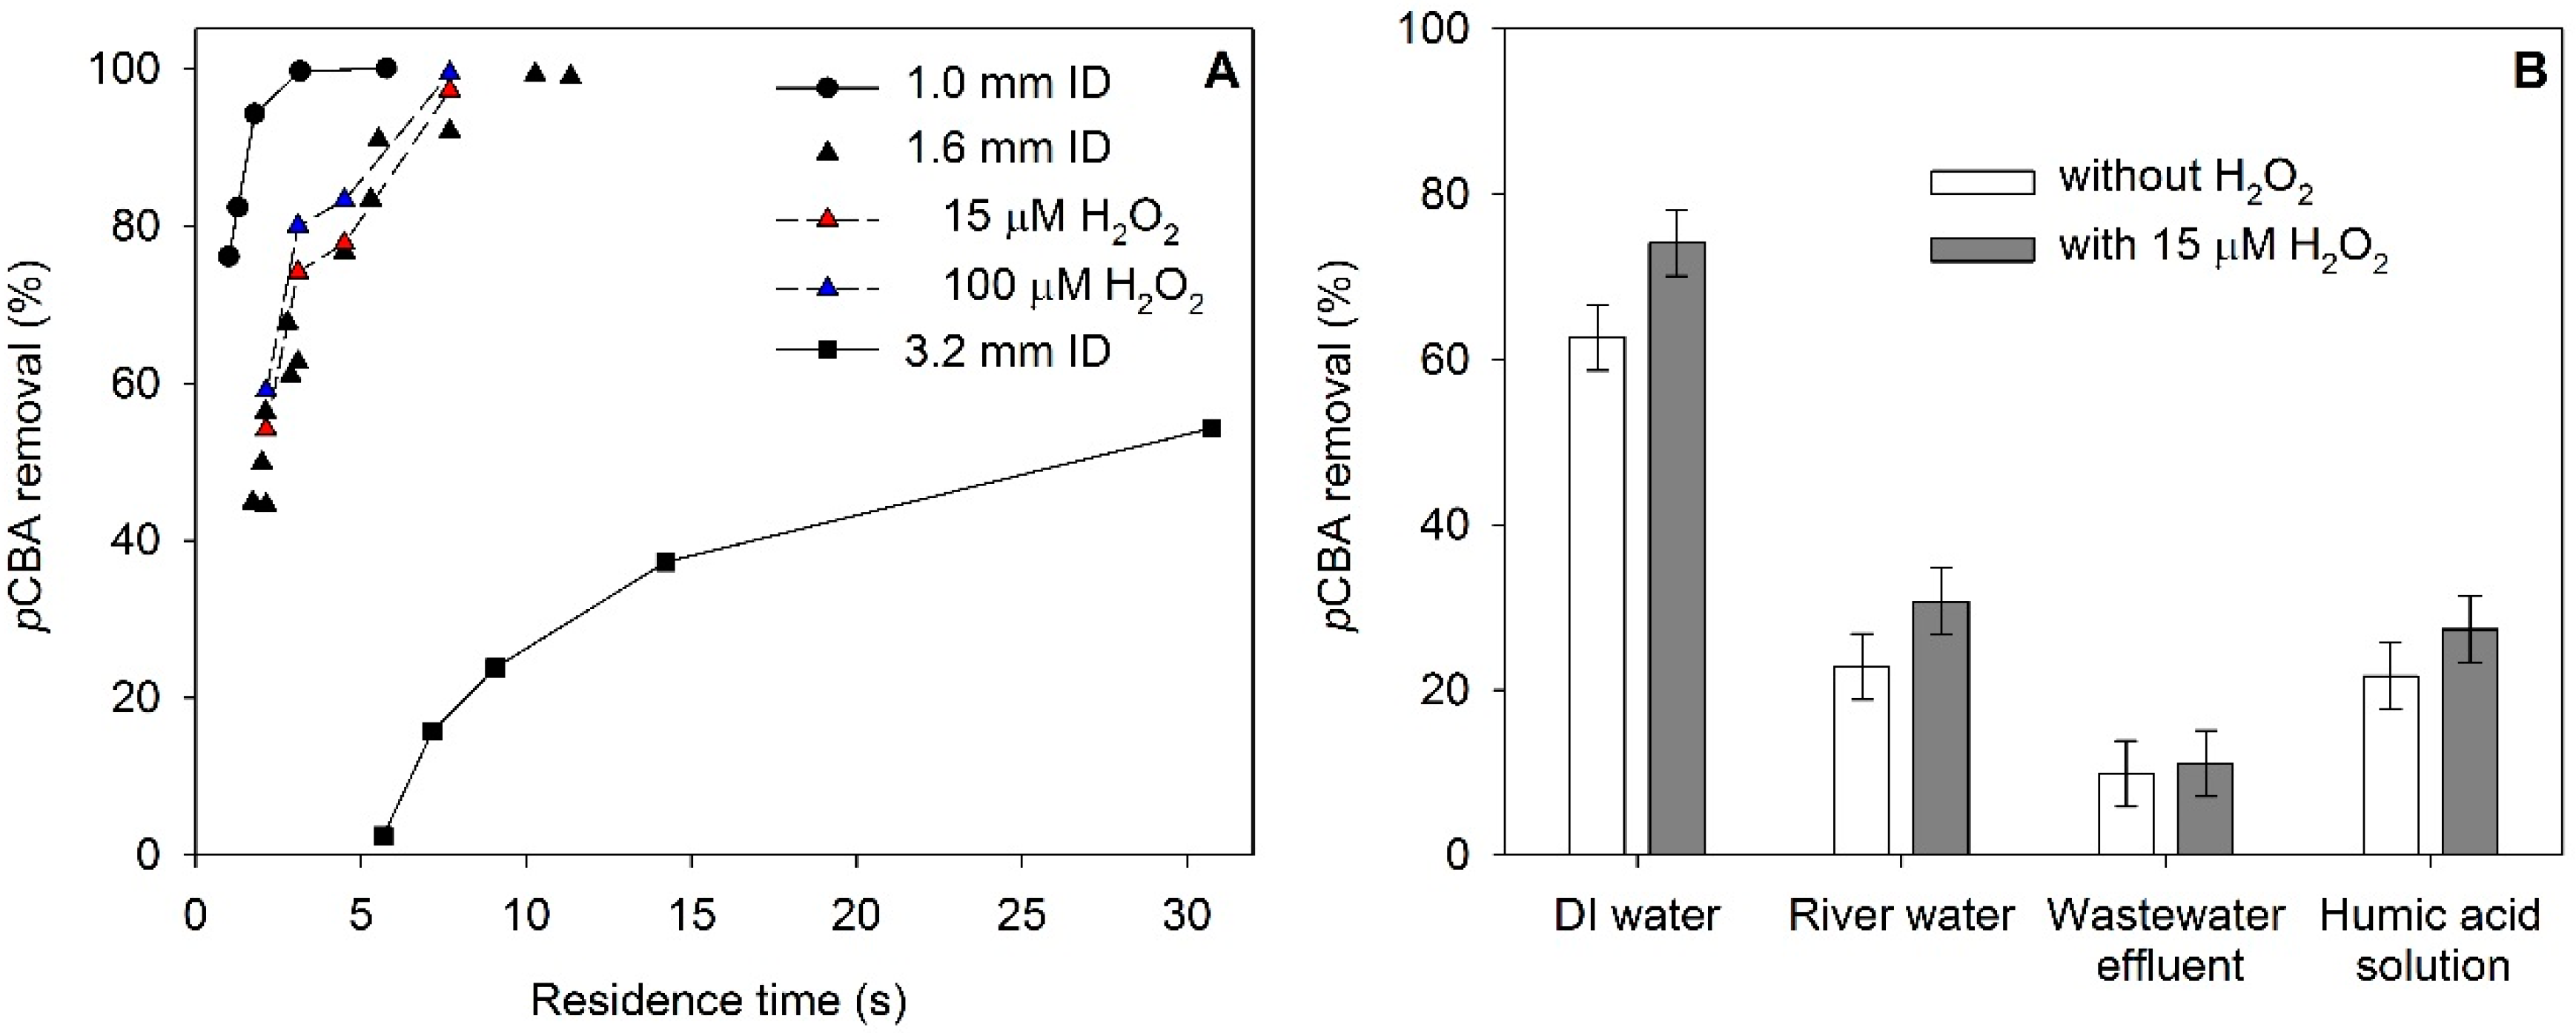
Figure 4a shows the removal of pCBA in pure water for different liquid side velocities and membrane thicknesses. As expected and based on ozone concentration measurements (Section 3.1), the pCBA removal increased with residence time and with decreasing membrane thickness. Note that liquid side chemical reactions promote ozone transfer, by increasing the concentration gradient across the membrane.
To determine accurate mass transfer, an enhancement factor has to be considered that depends on the reaction kinetics of the target contaminants with ozone and its oxidative decomposition products [51].
The added H2O2 concentration to achieve an O3:H2O2 ratio of 2:1 on a molar basis [49,52] was 15 μM (0.5 mg H2O2/L) and was calculated for the ozone transferred in pure water under the tested experimental conditions (1.6 mm ID membrane, v = 0.07 m/s, residence time 3 s), which was approximately 31 μΜ (1.5 mg O3/L). A higher H2O2 concentration of 100 μM was also tested. In pure buffered water the addition of H2O2 did not lead to a significant increase in pCBA removal (Figure 4a). The higher H2O2 concentration tested did not have a substantial additional effect. Measurements of the residual ozone concentration confirmed that the ozone consumption was similar for both H2O2 concentrations. For lower flow rates (residence time more than 3 s) the ozone consumption was incomplete, due to the higher ozone concentration. In a PTFE hollow fibre module the increase of H2O2 concentration led to an increase in pCBA removal, but the experiments were performed with longer residence times and lower ozone gas concentrations [19].
The removal of pCBA in different types of water (Figure 4b) and a humic acid solution was lower than in pure water due to the presence of matrix compounds that act as OH radical and ozone scavengers (Table 2). With the addition of 15 μM H2O2 the pCBA removal showed a small increase in all four water matrices tested. Similar results have been observed in a membrane contacting system employing a ceramic membrane, where the peroxone process increased the removal of pCBA in river water by less than 10% [53]. A higher improvement of pCBA removal has been observed by H2O2 addition in batch experiments [49,54]. The difference between the conventional (batch) peroxone process and the membrane peroxone process can be attributed to the non-uniform concentration of ozone in the membrane, which influences the O3:H2O2 ratio and thus the OH radical yield [53]. Adjusting flow conditions or membrane diameter to achieve a more uniform ozone concentration profile might diminish this discrepancy.
3.4. Ozonation of Dissolved Organic Matter
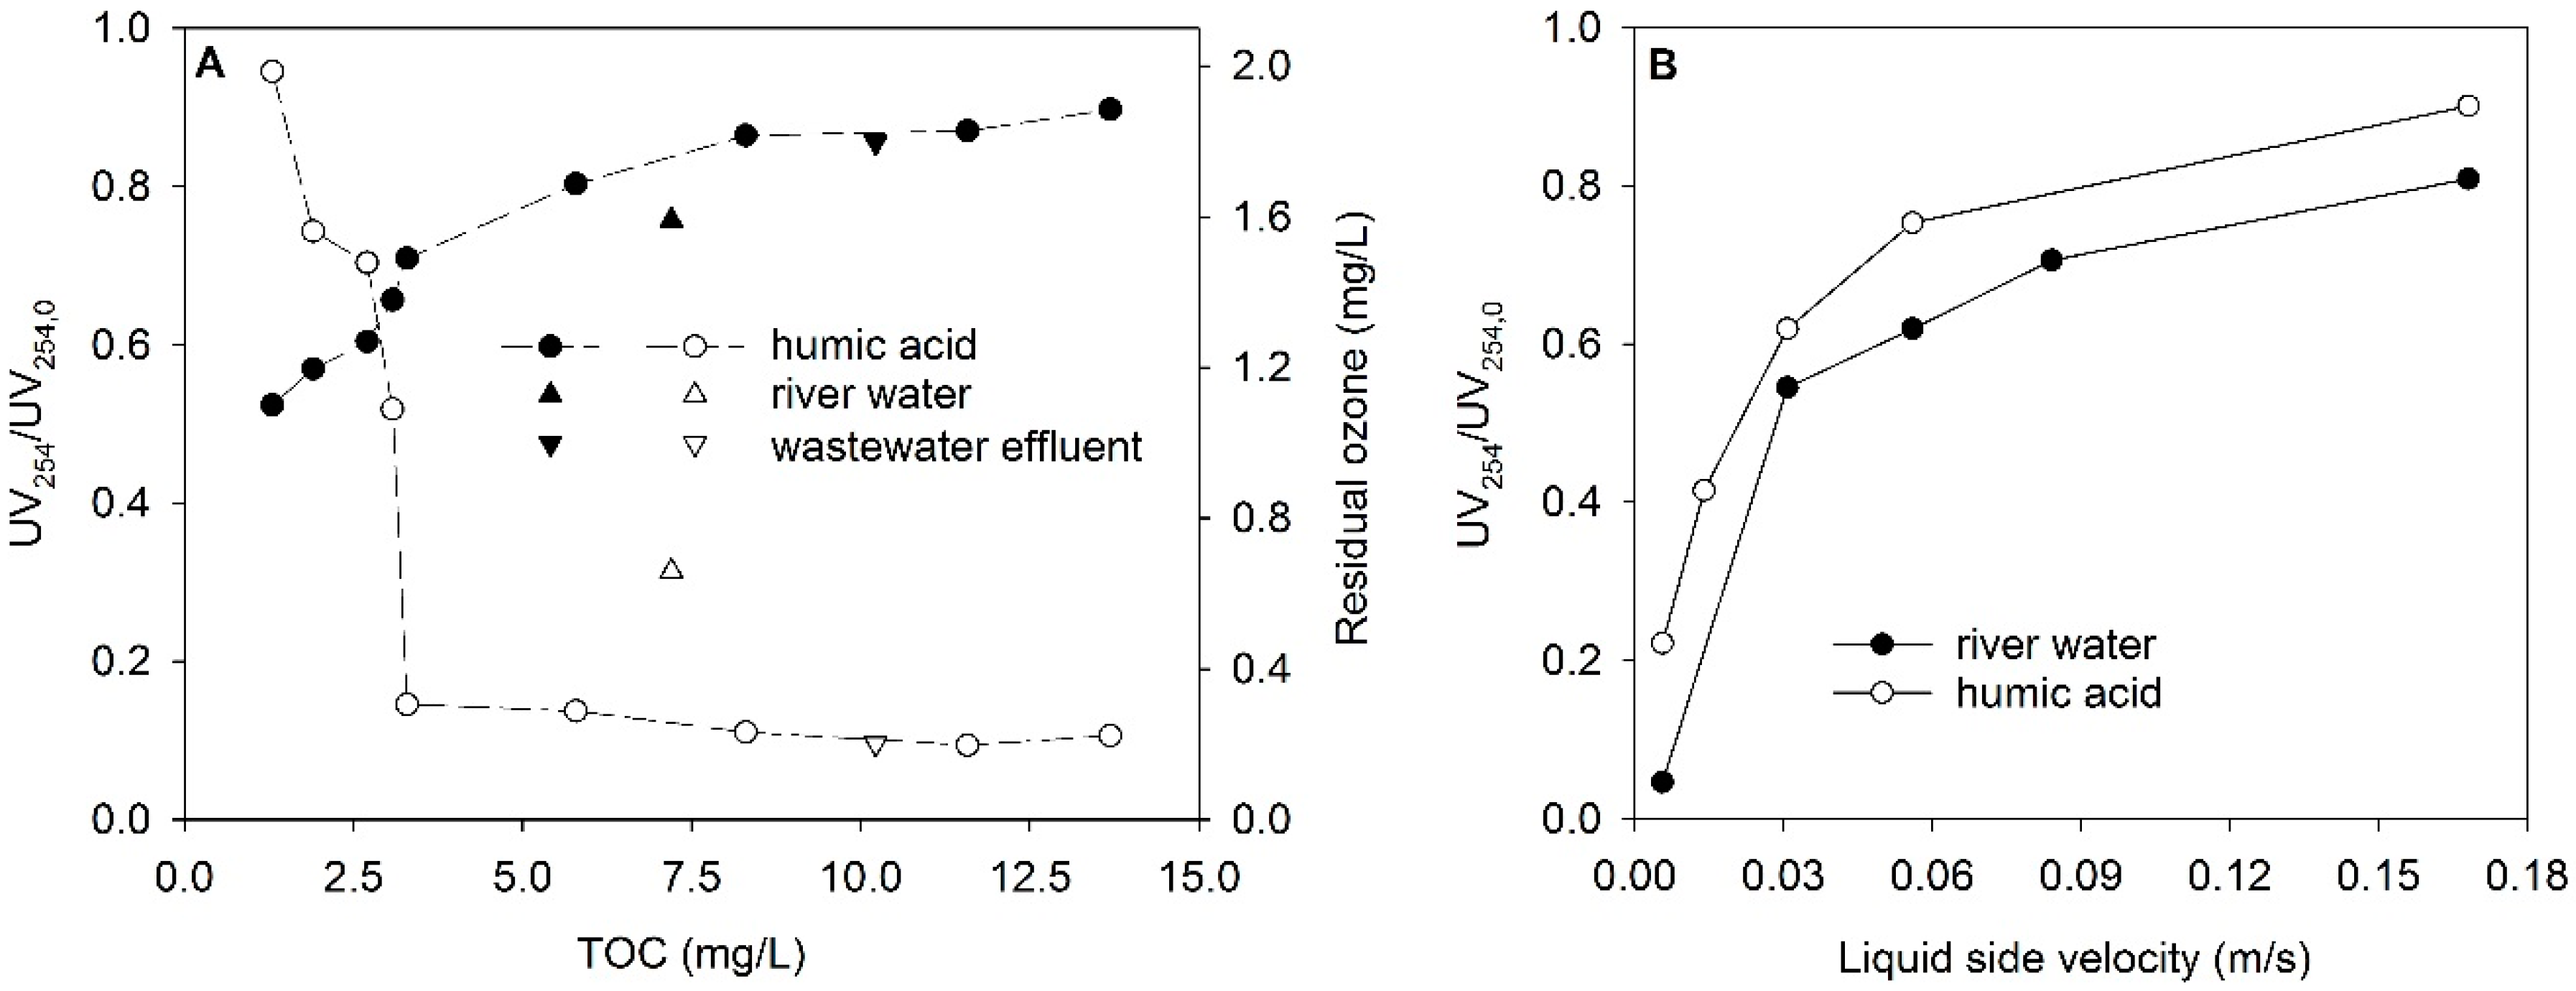
The effect of ozone on the dissolved organic matter present in the three different water matrices (river water, wastewater effluent and humic acid solution) was determined by measuring UV254 absorption before and after passage through the membrane module. Under low ozone doses and short residence times, ozonation increases the biodegradable fraction of dissolved organic matter, but results in little or no mineralization of organic matter (TOC removal) [55,56]. Therefore, removal of UV absorbance (UV254) is presented instead of TOC removal, to demonstrate the transformation of organic compounds. Figure 5A provides relative changes in UV254 and residual ozone concentrations plotted against TOC concentration. The ozone dose measured in pure water with this membrane and liquid side velocity was 2.2 mg/L (0.2 to 1.7 g O3/g TOC). For humic acid, the change in absorption decreases with increasing TOC concentration, along with a decrease in residual ozone concentration. From 3 mg/L TOC, no further reduction of the residual concentration of ozone can be observed due to the short residence time of four seconds in the reactor. At the same TOC, river water shows both a greater decrease in absorption (24%) and a higher residual ozone concentration (0.7 mg/L) than humic acid solution. This indicates that the tested river water is less reactive with ozone. The results for wastewater effluent are comparable to those for humic acid, indicating a high reactivity with ozone. In addition, the river water had a higher alkalinity than the wastewater effluent. Carbonate and bicarbonate species scavenge OH radicals in a way that inhibits the ozone decomposition cycle, leading to lower rates of ozone depletion [57], which explains the higher ozone residual in river water. The UV254 removal of 24% at 0.3 g O3/g TOC achieved for river water with PDMS membrane ozonation is comparable to a removal of 30–40% at 0.5 g O3/g TOC reported for the treatment of river water with ceramic membrane ozonation [52].
Figure 5B gives the change in absorption at different liquid side velocities for river water and humic acid. The ozone dose changes with liquid side velocity as described in Section 3.1. Under the conditions employed in this experiment it ranged from 1 to 10 mg/L (measured in pure water), leading to approximate specific ozone doses of 0.2–2.8 g O3/g TOC. At higher liquid side velocities, the change in absorption decreases due to the lower ozone exposure. Overall, the results for Section 3.3 and Section 3.4 show that the single membrane ozonation experiments can be used to obtain information on the reactivity of the water matrix with ozone with relatively modest experimental effort as, for example, ozone exposure can be controlled via liquid side velocities.
3.5. Membrane Longevity
During repeated use of membranes over several months in a preliminary batch setup and continuous ozonation experiments over 12 h with wastewater effluent and 24 h with pure water, no signs of reduced flexibility or visual changes of the membranes were noticed. However, a slight increase in TOC of water samples after contactor passage, which was detectable but within the analytical error, was found. Ozone exposure induces structural modifications on PDMS [30,32]. Ozone and UV combined oxidize PDMS to form SiOx, by substituting methyl groups with hydroxyl groups [34,58,59], and ozone in the presence of water leads to formation of peroxides on the PDMS surface [60]. The effect of ozone on PDMS, including aging, has no implications for the data presented in this work, but should be considered when planning experimental studies.
4. Conclusions
A single tube ozonation contactor was successfully built and tested with non-porous PDMS membranes. The overall mass transfer coefficient and the molar flux of ozone were found to increase with increasing liquid side velocity, and to level off at higher velocities. A comparison of results with a previously developed computational mass transfer model showed good agreement to predict final ozone concentrations in liquid pure water. The experimental and computational results also showed that the membrane size is an important parameter, while the concentration of ozone in the gas phase has minor importance for the ozone mass transfer. Three different types of water were tested to investigate the effect of the water matrix on the degradation of a model compound under ozone and peroxone conditions. Peroxone conditions led to little improvement of the degradation of the model compound. Overall, PDMS is a suitable material for membrane ozonation studies but its long-term stability might limit its application for water treatment. The integration of computational and experimental studies is a powerful tool to inform the design of membrane ozonation contactors with different membrane materials.
Author Contributions
Y.M.J.C., D.M. and J.W. conceived and designed the study; R.B. built the contactor system; C.M.T., R.B., G.A.Z., C.S. and M.J.C. conducted sampling, experiments, and analysis; S.H.S.X. and Y.M.J.C performed the computational fluid dynamics modelling; G.A.Z. and J.W. interpreted the results; G.A.Z. and J.W. conducted the literature research; G.A.Z, Y.M.J.C. and J.W. wrote the paper.
Funding
This research was partially funded by a Royal Society equipment grant [RG2016-150544] and C.M.T., G.A.Z., and R.B. were supported by EPSRC-funded integrated Ph.D. studentships in Sustainable Chemical Technologies [EP/L016354/1].
Acknowledgments
Support for undergraduate research projects of C.S. and M.J.C. by the Department of Chemical Engineering and start-up infrastructure by the Faculty of Engineering & Design for J.W. is appreciated. S.H.S.X. was supported by an Institute for Mathematical Innovation (IMI) undergraduate research internship. G.A.Z. was also supported by a University of Bath research scholarship.
Conflicts of Interest
The authors declare no conflict of interest.
Abbreviations
| Nomenclature | ||
| α | surface area of the membrane per unit volume of liquid | m−1 |
| L | length of the membrane | m |
| uL | liquid velocity | m/s |
| H | solubility of ozone in water | - |
| S | solubility of ozone in the membrane | - |
| Cg | ozone concentration in the gas phase | g/m3 |
| CL,out | ozone concentration at the outlet of the contactor | mg/L |
| KL | Overall mass transfer coefficient | m/s |
| N | Molar flux | mol/(m2 s) |
| Re | Reynolds number | - |
| Sc | Schmidt number | - |
| Acronyms | ||
| CFD | Computational fluid dynamics | |
| PDMS | Polydimethylsiloxane | |
| PES | Polyethersulfone | |
| PEI | Polyetherimide | |
| PFA | Perfluoroalkoxy alkane | |
| PTFE | Polytetrafluoroethylene | |
| PVDF | Polyvinylidene difluoride | |
| DPD | N,N-diethyl-p-phenylenediamine | |
| pCBA | para-chlorobenzoic acid | |
| ID | inner diameter | |
| OD | outer diameter | |
| TOC | total organic carbon | |
References
- Le Paulouë, J.; Langlais, B. State-of-the-art of ozonation in France. Ozone Sci. Eng. 1999, 21, 153–162. [Google Scholar] [CrossRef]
- Von Gunten, U. Oxidation processes in water treatment: Are we on track? Environ. Sci. Technol. 2018, 52, 5062–5075. [Google Scholar] [CrossRef] [PubMed]
- Gottschalk, C.; Libra, J.A.; Saupe, A. Ozonation of Water and Waste Water: A Practical Guide to Understanding Ozone and Its Applications; John Wiley & Sons: Hoboken, NJ, USA, 2009. [Google Scholar]
- Chuang, Y.-H.; Mitch, W.A. Effect of ozonation and biological activated carbon treatment of wastewater effluents on formation of N-nitrosamines and halogenated disinfection byproducts. Environ. Sci. Technol. 2017, 51, 2329–2338. [Google Scholar] [CrossRef] [PubMed]
- Hua, G.; Reckhow, D.A. Comparison of disinfection byproduct formation from chlorine and alternative disinfectants. Water Res. 2007, 41, 1667–1678. [Google Scholar] [CrossRef] [PubMed]
- Nakamura, H.; Oya, M.; Hanamoto, T.; Nagashio, D. Reviewing the 20 years of operation of ozonation facilities in Hanshin Water Supply Authority with respect to water quality improvements. Ozone Sci. Eng. 2017, 39, 397–406. [Google Scholar] [CrossRef]
- Camel, V.; Bermond, A. The use of ozone and associated oxidation processes in drinking water treatment. Water Res. 1998, 32, 3208–3222. [Google Scholar] [CrossRef]
- Snyder, S.A.; Wert, E.C.; Rexing, D.J.; Zegers, R.E.; Drury, D.D. Ozone oxidation of endocrine disruptors and pharmaceuticals in surface water and wastewater. Ozone Sci. Eng. 2006, 28, 445–460. [Google Scholar] [CrossRef]
- Loeb, B.L.; Thompson, C.M.; Drago, J.; Takahara, H.; Baig, S. Worldwide ozone capacity for treatment of drinking water and wastewater: A review. Ozone Sci. Eng. 2012, 34, 64–77. [Google Scholar] [CrossRef]
- Bourgin, M.; Beck, B.; Boehler, M.; Borowska, E.; Fleiner, J.; Salhi, E.; Teichler, R.; von Gunten, U.; Siegrist, H.; McArdell, C.S. Evaluation of a full-scale wastewater treatment plant upgraded with ozonation and biological post-treatments: Abatement of micropollutants, formation of transformation products and oxidation by-products. Water Res. 2018, 129, 486–498. [Google Scholar] [CrossRef] [PubMed]
- Loeb, B.L. Forty years of advances in ozone technology. A review of ozone: Science & engineering. Ozone Sci. Eng. 2018, 40, 3–20. [Google Scholar] [CrossRef]
- Mundy, B.; Kuhnel, B.; Hunter, G.; Jarnis, R.; Funk, D.; Walker, S.; Burns, N.; Drago, J.; Nezgod, W.; Huang, J.; et al. A review of ozone systems costs for municipal applications. Report by the Municipal Committee—IOA Pan American Group. Ozone Sci. Eng. 2018, 40, 266–274. [Google Scholar] [CrossRef]
- Rakness, K.L.; Hunter, G.; Lew, J.; Mundy, B.; Wert, E.C. Design considerations for cost-effective ozone mass transfer in sidestream systems. Ozone Sci. Eng. 2018, 40, 159–172. [Google Scholar] [CrossRef]
- Zhou, H.; Smith, D.W. Ozone mass transfer in water and wastewater treatment: Experimental observations using a 2D laser particle dynamics analyzer. Water Res. 2000, 34, 909–921. [Google Scholar] [CrossRef]
- Basile, A.; Cassano, A.; Rastogi, N.K. Advances in Membrane Technologies for Water Treatment: Materials, Processes and Applications; Woodhead Publishing: Sawston, UK, 2015; pp. 1–342. [Google Scholar]
- Zhou, H.; Smith, D.W. Ozonation dynamics and its implication for off-gas ozone control in treating pulp mill wastewaters. Ozone Sci. Eng. 2000, 22, 31–51. [Google Scholar] [CrossRef]
- Oneby, M.A.; Bromley, C.O.; Borchardt, J.H.; Harrison, D.S. Ozone treatment of secondary effluent at U.S. municipal wastewater treatment plants. Ozone Sci. Eng. 2010, 32, 43–55. [Google Scholar] [CrossRef]
- Gabelman, A.; Hwang, S.-T. Hollow fiber membrane contactors. J. Membr. Sci. 1999, 159, 61–106. [Google Scholar] [CrossRef]
- Merle, T.; Pronk, W.; von Gunten, U. MEMBRO3X, a novel combination of a membrane contactor with advanced oxidation (O3/H2O2) for simultaneous micropollutant abatement and bromate minimization. Environ. Sci. Technol. Lett. 2017, 4, 180–185. [Google Scholar] [CrossRef]
- Van Geluwe, S.; Braeken, L.; Van der Bruggen, B. Ozone oxidation for the alleviation of membrane fouling by natural organic matter: A review. Water Res. 2011, 45, 3551–3570. [Google Scholar] [CrossRef] [PubMed]
- Kim, J.; Davies, S.H.R.; Baumann, M.J.; Tarabara, V.V.; Masten, S.J. Effect of ozone dosage and hydrodynamic conditions on the permeate flux in a hybrid ozonation–ceramic ultrafiltration system treating natural waters. J. Membr. Sci. 2008, 311, 165–172. [Google Scholar] [CrossRef]
- Laera, G.; Cassano, D.; Lopez, A.; Pinto, A.; Pollice, A.; Ricco, G.; Mascolo, G. Removal of organics and degradation products from industrial wastewater by a membrane bioreactor integrated with ozone or UV/H2O2 treatment. Environ. Sci. Technol. 2012, 46, 1010–1018. [Google Scholar] [CrossRef] [PubMed]
- Stylianou, S.K.; Sklari, S.D.; Zamboulis, D.; Zaspalis, V.T.; Zouboulis, A.I. Development of bubble-less ozonation and membrane filtration process for the treatment of contaminated water. J. Membr. Sci. 2015, 492, 40–47. [Google Scholar] [CrossRef]
- Wenten, I.G.; Julian, H.; Panjaitan, N.T. Ozonation through ceramic membrane contactor for iodide oxidation during iodine recovery from brine water. Desalination 2012, 306, 29–34. [Google Scholar] [CrossRef]
- Janknecht, P.; Picard, C.; Larbot, A.; Wilderer, P.A. Membrane ozonation in wastewater treatment. Acta Hydroch. Hydrob. 2004, 32, 33–39. [Google Scholar] [CrossRef]
- Kukuzaki, M.; Fujimoto, K.; Kai, S.; Ohe, K.; Oshima, T.; Baba, Y. Ozone mass transfer in an ozone–water contacting process with Shirasu porous glass (SPG) membranes—A comparative study of hydrophilic and hydrophobic membranes. Sep. Purif. Technol. 2010, 72, 347–356. [Google Scholar] [CrossRef]
- Stylianou, S.K.; Szymanska, K.; Katsoyiannis, I.A.; Zouboulis, A.I. Novel water treatment processes based on hybrid membrane-ozonation systems: A novel ceramic membrane contactor for bubbleless ozonation of emerging micropollutants. J. Chem. 2015, 2015, 214927. [Google Scholar] [CrossRef]
- Mosadegh-Sedghi, S.; Rodrigue, D.; Brisson, J.; Iliuta, M.C. Wetting phenomenon in membrane contactors—Causes and prevention. J. Membr. Sci. 2014, 452, 332–353. [Google Scholar] [CrossRef]
- Zhang, Y.; Li, K.; Wang, J.; Hou, D.; Liu, H. Ozone mass transfer behaviors on physical and chemical absorption for hollow fiber membrane contactors. Water Sci. Technol. 2017, 76, 1360–1369. [Google Scholar] [CrossRef] [PubMed] [Green Version]
- Santos, F.R.A.D.; Borges, C.P.; Fonseca, F.V.D. Polymeric materials for membrane contactor devices applied to water treatment by ozonation. Mater. Res. 2015, 18, 1015–1022. [Google Scholar] [CrossRef]
- Pines, D.S.; Min, K.-N.; Ergas, S.J.; Reckhow, D.A. Investigation of an ozone membrane contactor system. Ozone Sci. Eng. 2005, 27, 209–217. [Google Scholar] [CrossRef]
- Shanbhag, P.V.; Sirkar, K.K. Ozone and oxygen permeation behavior of silicone capillary membranes employed in membrane ozonators. J. Appl. Polym. Sci. 1998, 69, 1263–1273. [Google Scholar] [CrossRef]
- Shanbhag, P.V.; Guha, A.K.; Sirkar, K.K. Membrane-based ozonation of organic compounds. Ind. Eng. Chem. Res. 1998, 37, 4388–4398. [Google Scholar] [CrossRef]
- Ouyang, M.; Yuan, C.; Muisener, R.J.; Boulares, A.; Koberstein, J.T. Conversion of some siloxane polymers to silicon oxide by UV/ozone photochemical processes. Chem. Mater. 2000, 12, 1591–1596. [Google Scholar] [CrossRef]
- Berry, M.; Taylor, C.; King, W.; Chew, Y.; Wenk, J. Modelling of ozone mass-transfer through non-porous membranes for water treatment. Water 2017, 9, 452. [Google Scholar] [CrossRef]
- Bader, H.; Hoigné, J. Determination of ozone in water by the indigo method. Water Res. 1981, 15, 449–456. [Google Scholar] [CrossRef]
- Bader, H.; Sturzenegger, V.; Hoigné, J. Photometric method for the determination of low concentrations of hydrogen peroxide by the peroxidase catalyzed oxidation of N,N-diethyl-p-phenylenediamine (DPD). Water Res. 1988, 22, 1109–1115. [Google Scholar] [CrossRef]
- International Organization for Standardization. ISO 9963-1:1994: Water Quality—Determination of Alkalinity—Part 1: Determination of Total and Composite Alkalinity; ISO: Geneva, Switzerland, 1994. [Google Scholar]
- Atchariyawut, S.; Phattaranawik, J.; Leiknes, T.; Jiraratananon, R. Application of ozonation membrane contacting system for dye wastewater treatment. Sep. Purif. Technol. 2009, 66, 153–158. [Google Scholar] [CrossRef]
- Stylianou, S.K.; Kostoglou, M.; Zouboulis, A.I. Ozone mass transfer studies in a hydrophobized ceramic membrane contactor: Experiments and analysis. Ind. Eng. Chem. Res. 2016, 55, 7587–7597. [Google Scholar] [CrossRef]
- Sander, R. Compilation of Henry’s law constants (version 4.0) for water as solvent. Atmos. Chem. Phys. 2015, 15, 4399–4981. [Google Scholar] [CrossRef]
- Dingemans, M.; Dewulf, J.; Van Hecke, W.; Van Langenhove, H. Determination of ozone solubility in polymeric materials. Chem. Eng. J. 2008, 138, 172–178. [Google Scholar] [CrossRef]
- Kasprzyk-Hordern, B.; Ziółek, M.; Nawrocki, J. Catalytic ozonation and methods of enhancing molecular ozone reactions in water treatment. Appl. Catal. B Environ. 2003, 46, 639–669. [Google Scholar] [CrossRef]
- Von Gunten, U. Ozonation of drinking water: Part I. Oxidation kinetics and product formation. Water Res. 2003, 37, 1443–1467. [Google Scholar] [CrossRef]
- Buxton, G.V.; Greenstock, C.L.; Helman, W.P.; Ross, A.B. Critical review of rate constants for reactions of hydrated electrons, hydrogen atoms and hydroxyl radicals (OH/O−) in aqueous solution. J. Phys. Chem. Ref. Data 1988, 17, 513–886. [Google Scholar] [CrossRef]
- Lee, Y.; von Gunten, U. Oxidative transformation of micropollutants during municipal wastewater treatment: Comparison of kinetic aspects of selective (chlorine, chlorine dioxide, ferrate VI, and ozone) and non-selective oxidants (hydroxyl radical). Water Res. 2010, 44, 555–566. [Google Scholar] [CrossRef] [PubMed]
- Elovitz, M.S.; von Gunten, U. Hydroxyl radical/ozone ratios during ozonation processes. I. The Rct concept. Ozone Sci. Eng. 1999, 21, 239–260. [Google Scholar] [CrossRef]
- Wenk, J.; von Gunten, U.; Canonica, S. Effect of dissolved organic matter on the transformation of contaminants induced by excited triplet states and the hydroxyl radical. Environ. Sci. Technol. 2011, 45, 1334–1340. [Google Scholar] [CrossRef] [PubMed] [Green Version]
- Katsoyiannis, I.A.; Canonica, S.; von Gunten, U. Efficiency and energy requirements for the transformation of organic micropollutants by ozone, O3/H2O2 and UV/H2O2. Water Res. 2011, 45, 3811–3822. [Google Scholar] [CrossRef] [PubMed]
- Ferguson, D.W.; McGuire, M.J.; Koch, B.; Wolfe, R.L.; Aieta, E.M. Comparing peroxone and ozone for controlling taste and odor compounds, disinfection by-products, and microorganisms. J. Am. Water Works Assoc. 1990, 82, 181–191. [Google Scholar] [CrossRef]
- Phattaranawik, J.; Leiknes, T.; Pronk, W. Mass transfer studies in flat-sheet membrane contactor with ozonation. J. Membr. Sci. 2005, 247, 153–167. [Google Scholar] [CrossRef]
- Stylianou, S.K.; Katsoyiannis, I.A.; Ernst, M.; Zouboulis, A.I. Impact of O3 or O3/H2O2 treatment via a membrane contacting system on the composition and characteristics of the natural organic matter of surface waters. Environ. Sci. Pollut. Res. Int. 2018, 25, 12246–12255. [Google Scholar] [CrossRef] [PubMed]
- Stylianou, S.K.; Katsoyiannis, I.A.; Mitrakas, M.; Zouboulis, A.I. Application of a ceramic membrane contacting process for ozone and peroxone treatment of micropollutant contaminated surface water. J. Hazard. Mater. 2018, 358, 129–135. [Google Scholar] [CrossRef] [PubMed]
- Acero, J.L.; Von Gunten, U. Characterization of oxidation processes: Ozonationn and the AOP O3/H2O2. J. Am. Water Works Assoc. 2001, 93, 90–100. [Google Scholar] [CrossRef]
- Drewes, J.E.; Jekel, M. Behavior of DOC and AOX using advanced treated wastewater for groundwater recharge. Water Res. 1998, 32, 3125–3133. [Google Scholar] [CrossRef]
- Yavich, A.A.; Lee, K.H.; Chen, K.C.; Pape, L.; Masten, S.J. Evaluation of biodegradability of NOM after ozonation. Water Res. 2004, 38, 2839–2846. [Google Scholar] [CrossRef] [PubMed]
- Elovitz, M.S.; von Gunten, U.; Kaiser, H.-P. Hydroxyl radical/ozone ratios during ozonation processes. II. The effect of temperature, pH, alkalinity, and DOM properties. Ozone Sci. Eng. 2000, 22, 123–150. [Google Scholar] [CrossRef]
- Fu, Y.J.; Qui, H.Z.; Liao, K.S.; Lue, S.J.; Hu, C.C.; Lee, K.R.; Lai, J.Y. Effect of UV-ozone treatment on poly (dimethylsiloxane) membranes: Surface characterization and gas separation performance. Langmuir 2010, 26, 4392–4399. [Google Scholar] [CrossRef] [PubMed]
- Graubner, V.-M.; Jordan, R.; Nuyken, O.; Schnyder, B.; Lippert, T.; Kötz, R.; Wokaun, A. Photochemical modification of cross-linked poly (dimethylsiloxane) by irradiation at 172 nm. Macromolecules 2004, 37, 5936–5943. [Google Scholar] [CrossRef]
- Fujimoto, K.; Takebayashi, Y.; Inoue, H.; Ikada, Y. Ozone-induced graft polymerization onto polymer surface. J. Polym. Sci. Part A Polym. Chem. 1993, 31, 1035–1043. [Google Scholar] [CrossRef]
Figure 1.
Schematic of the experimental setup and photograph of the membrane contactor.

Figure 2.
Dissolved ozone concentration in pure water in the outlet of the reactor against liquid velocity for different membranes diameters (ID: inner diameter, WT: wall thickness) and ozone gas concentrations. (A) Experimental results. Repeats (open symbols) were performed with a different set of membranes. (B) Computational fluid dynamics (CFD) modelling results, including Reynolds numbers (Re) and liquid side residence times (r.t.).

Figure 3.
Experimental and modelled overall mass transfer coefficients KL and molar fluxes of ozone N in pure water at ozone gas concentration of 110 g/m3 and 200 g/m3 versus liquid side velocity.
Figure 3.
Experimental and modelled overall mass transfer coefficients KL and molar fluxes of ozone N in pure water at ozone gas concentration of 110 g/m3 and 200 g/m3 versus liquid side velocity.

Figure 4.
(A) Removal of para-chlorobenzoic acid (pCBA) in pure buffered water and with added H2O2 for different membrane sizes. Three repeats performed with a different membrane each time are shown for the 1.6 mm ID membrane without added H2O2. (B) Removal of pCBA in different water matrices, with and without addition of H2O2, for the 1.6 mm ID membrane at a residence time of three seconds. River Water I (TOC 7.2 mg/L, pH 7.2), wastewater effluent (TOC 10.2 mg/L, pH 7.9), and humic acid solution (TOC 8.3 mg/L, pH 7.1) were used. TOC: total organic carbon, ID: inner diameter.

Figure 5.
(A) Relative change in UV254 absorbance (closed symbols) and residual ozone concentration (open symbols) for river water I (pH 7.2), wastewater effluent (pH 7.9) and humic acid solutions (pH 7.1) at different TOC, 1.6 mm ID membrane, 4 s residence time, 110 g/m3 ozone gas concentration. (B) Relative change in UV254 absorbance at different liquid side velocity for river water II (TOC 4.3 mg/L, pH 8.2) and humic acid (TOC 3.6 mg/L, pH 7) for a 1.6 mm ID membrane and 200 g/m3 ozone gas concentration. TOC: total organic carbon, ID: inner diameter.


Table 1.
Polydimethylsiloxane (PDMS) tubing used as non-porous membranes. OD: outer diameter, ID: inner diameter.
Table 1.
Polydimethylsiloxane (PDMS) tubing used as non-porous membranes. OD: outer diameter, ID: inner diameter.
| Material | Product Code | Supplier | OD (inch) | ID (inch) | ID (mm) | Wall Thickness (mm) |
|---|---|---|---|---|---|---|
| Silastic® (PDMS) | WZ-96115-22 | Cole Parmer | 1/4 | 1/8 | 3.2 | 1.6 |
| Silastic® (PDMS) | WZ-96155-00 | Cole Parmer | 1/8 | 1/16 | 1.6 | 0.8 |
| Silastic® (PDMS) | WZ-96115-08 | Cole Parmer | 1/12 | 1/25 | 1.0 | 0.6 |
Table 2.
Water sample characteristics. TOC: total organic carbon.
| Property | Wastewater Effluent (March 2018) | River Water I (March 2018) | River Water II (July 2017) |
|---|---|---|---|
| pH | 7.9 | 7.2 | 8.2 |
| TOC (mg/L) | 10.2 | 7.2 | 4.3 |
| UV254 (cm−1) | 0.14 | 0.20 | 0.10 |
| Alkalinity (mg CaCO3/L) | 181 | 236 | n/a 1 |
| Nitrate (mg/L) | 31 | 22 | n/a |
1 n/a: not analysed.
Table 3.
Parameters used for calculation of KL and N. ID: inner diameter.
| Property | Units | Value | Experimental Uncertainty (±) | Reference |
|---|---|---|---|---|
| α | m−1 | 4000 (1.0 mm ID) 2500 (1.6 mm ID) 1250 (3.2 mm ID) | - | calculated |
| L | m | 0.2 | - | contactor length |
| uL | m/s | 0.002–0.224 | 0.002 | calculated |
| H | - | 0.248 | - | [41] |
| S | - | 0.881 | - | [42] |
| Cg | mol/m3 | 2.1–2.5 | 0.2 | measured |
| CL,out | mol/m3 | 0.014–0.186 | 0.004 | measured (experimental) or calculated (modelled) |
© 2018 by the authors. Licensee MDPI, Basel, Switzerland. This article is an open access article distributed under the terms and conditions of the Creative Commons Attribution (CC BY) license (http://creativecommons.org/licenses/by/4.0/).
Share and Cite
MDPI and ACS Style
Zoumpouli, G.A.; Baker, R.; Taylor, C.M.; Chippendale, M.J.; Smithers, C.; Ho, S.S.X.; Mattia, D.; Chew, Y.M.J.; Wenk, J. A Single Tube Contactor for Testing Membrane Ozonation. Water 2018, 10, 1416. https://doi.org/10.3390/w10101416
AMA Style
Zoumpouli GA, Baker R, Taylor CM, Chippendale MJ, Smithers C, Ho SSX, Mattia D, Chew YMJ, Wenk J. A Single Tube Contactor for Testing Membrane Ozonation. Water. 2018; 10(10):1416. https://doi.org/10.3390/w10101416
Chicago/Turabian StyleZoumpouli, Garyfalia A., Robert Baker, Caitlin M. Taylor, Matthew J. Chippendale, Chloë Smithers, Sean S. X. Ho, Davide Mattia, Y. M. John Chew, and Jannis Wenk. 2018. "A Single Tube Contactor for Testing Membrane Ozonation" Water 10, no. 10: 1416. https://doi.org/10.3390/w10101416
Note that from the first issue of 2016, this journal uses article numbers instead of page numbers. See further details here.