Evaluation of the Structure of Urban Stormwater Pipe Network Using Drainage Density


1
Department of Civil Engineering, Hoseo University, Asan-si, Chungcheongnam-do 31499, South Korea
2
Department of Land, Water and Environment Research, Korea Institute of Civil engineering and building Technology, Goyang-si, Gyeonggi-do 10223, South Korea
3
Department of Civil Engineering, Hanseo University, Seosan-si, Chungcheongnam-do 31962, South Korea
*
Author to whom correspondence should be addressed.
Water 2018, 10(10), 1444; https://doi.org/10.3390/w10101444
Submission received: 9 July 2018
/
Revised: 8 September 2018
/
Accepted: 10 October 2018
/
Published: 13 October 2018
(This article belongs to the Section Hydrology)
Abstract
:In mega cities such as Seoul in South Korea, it is very important to protect the cities from surface flooding even for a short time period due to the enormous economic damage. That is why stormwater pipe networks are commonly applied to mega cities with large impervious areas to drain runoff from the city. Therefore, the stormwater pipe networks in urban catchments should be carefully designed for quick and efficient runoff removal. In this study, the structures of different stormwater pipe networks were evaluated based on the relationship between peak rainfall and runoff in the urban catchments in South Korea. More than 400 historical rainfall events from five urban catchments were used to develop respective linear regression models for estimating peak runoff for different pipe network structures. The developed regression models exhibited greater than 0.9 in determination coefficients and demonstrated overall the broader ranges in peak runoff with the greater rainfall amount, especially when the pipe networks were branched. This implies that the effect of pipe network structures on runoff is more profound in the branched networks whose runoff water flow is one-directional and thus tends to concentrate to the catchment outlet. In the case of the looped networks in which runoff paths are multiple, rainfall runoff can be routed to several alternative water paths depending on rainfall events resulting in the reduced peak runoff. The structures of pipe networks can be measured in drainage density which is defined as the ratio of total pipe length to catchment area. As a result, the range of the estimated runoff at the 95% confidence level increased as the drainage density increased, which implies increased uncertainty with the looped networks which commonly involve more pipe installation for unit area as compared to the branched. However, the looped networks with multiple water paths can reduce the time to drain rainfall from the catchments and thus the 95% confidence interval becomes narrow, which means greater reliability in peak runoff estimation. It would therefore be favorable to adopt looped stormwater pipe networks within an affordable budget and the complexity of pipe networks needs to be counted to reduce urban flood risk.
1. Introduction
The frequency of torrential rainfall events has increased particularly in urban areas in South Korea [1]. Torrential rains in urban areas can cause temporal and local severe surface flooding, which are commonly due to the lack of discharge capacity [2]. Torrential rains in Seoul have caused ithe njury of 64,752 people and about 0.6 billion USD of property damage [3]. As such, flooding in urban catchments could result in massive property damage and loss of human life. Therefore, it is important to estimate accurate runoff amount and inundated area. Urban floods caused by torrential rains can cause massive damage to property as well as life [4]. According to Reference [5], a primary cause of frequent flooding in cities was the poor drainage system. More specifically, drainage pipes do not have enough capacity to discharge the torrential rains, thus lowlands are inundated, failing to deliver runoff to drainage systems.
The Storm Water Management Model (SWMM) developed by US-EPA is popularly applied to calculate runoff in urban catchments. However, it is difficult to simulate natural phenomena caused by every single rainfall event. Therefore, the uncertainty of urban runoff is commonly used to the interpretation of natural phenomenon for reliable flow analysis.
The uncertainty of runoff from the SWMM model was evaluated through parameter calibration [6,7,8]. Runoff caused by extreme rainfall and the overflowing manholes were simulated [9]. To simulate stormwater pipe network, the network must be simplified [10]. This simplification causes the error in the calculated runoff. Therefore, the pipe network was optimized using observed discharge. Detention tanks were optimized in an urban drainage network to determine an optimal position and size [11]. There have been many studies to estimate uncertainty in the data. Daily streamflow was generated using a hybrid spectral and time domain calibration method in Reference [12] for calibration of the short noise model.
The uncertainty included in rainfall data was quantitatively assessed to analyze its impact on runoff using errors from rainfall observations [13]. Also, the structured and unstructured uncertainty of rainfall were examined [14]. According to Reference [15], it is noted that spatial variability of rainfall was one of the major causes of uncertainty. Therefore, radar rainfall data were used to determine probability distributions of urban runoff events [16].
This study focuses on the effectiveness of the different stormwater pipe networks on urban runoff. Therefore, it is assumed that the uncertainty on urban runoff was caused by the structures of the stormwater pipe network. There are many researches that present the relationship between drainage density or impervious area and rainfall. The relationship between drainage density and rainfall runoff in the natural watersheds was presented by Reference [17] using 13 river basin data in eastern United States. For the natural watersheds where the effect of drainage density was the largest, the impact of impervious areas and drainage density on runoff was analyzed [18]. The stormwater pipe networks artificially constructed in urban areas function similarly with natural rivers. Therefore, the characteristics of a stormwater pipe network should be understood for efficient design and thus, mitigation of flooding.
In this study, drainage density was applied in urban stormwater networks and the relationship between peak rainfall and peak runoff was analyzed to improve the accuracy of urban rainfall runoff estimation.
2. Data Collection
2.1. Weather Data
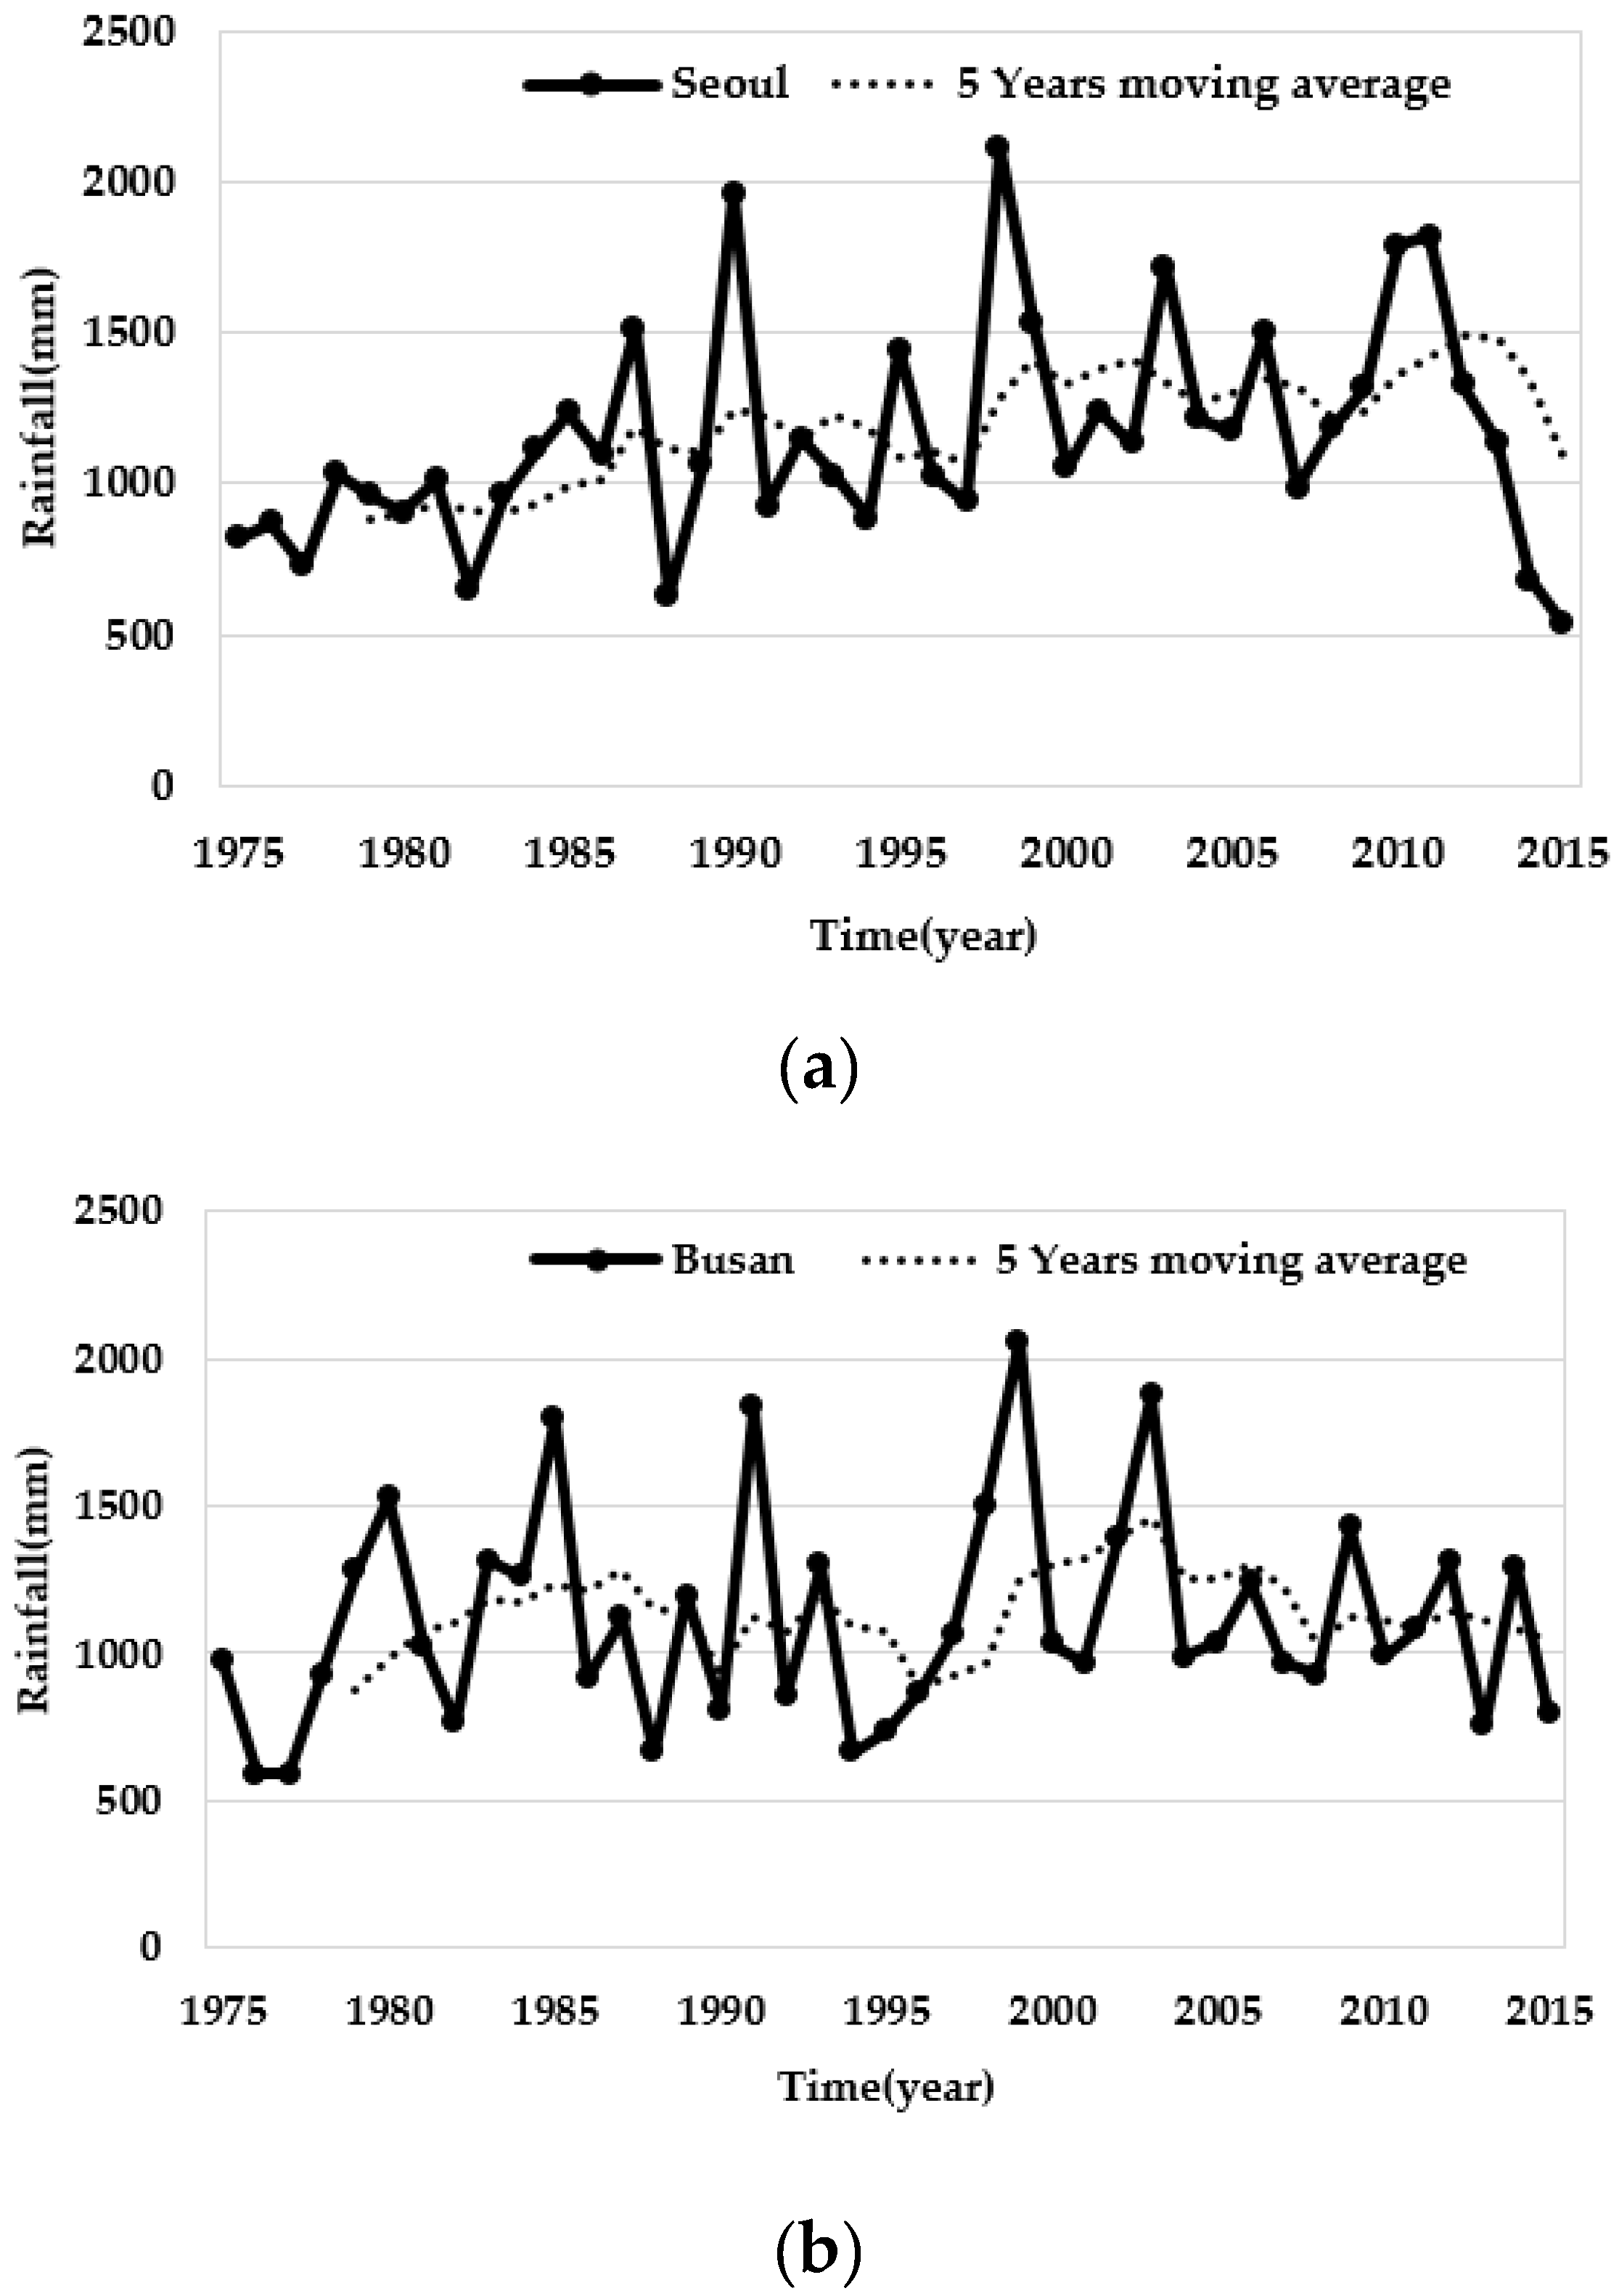
To analyze flood characteristics and stormwater pipe networks, the past flood damage data from Seoul and Busan, the two largest cities in South Korea, were collected as shown in Table 1.
The two cities have greater urbanization rates than the other cities in Korea and involve more than at least one meteorological station for each city. The changes in annual rainy season rainfall amounts (June to October) for the past 40 years from 1975 to 2015 are shown in Figure 1.
2.2. Urban Catchments
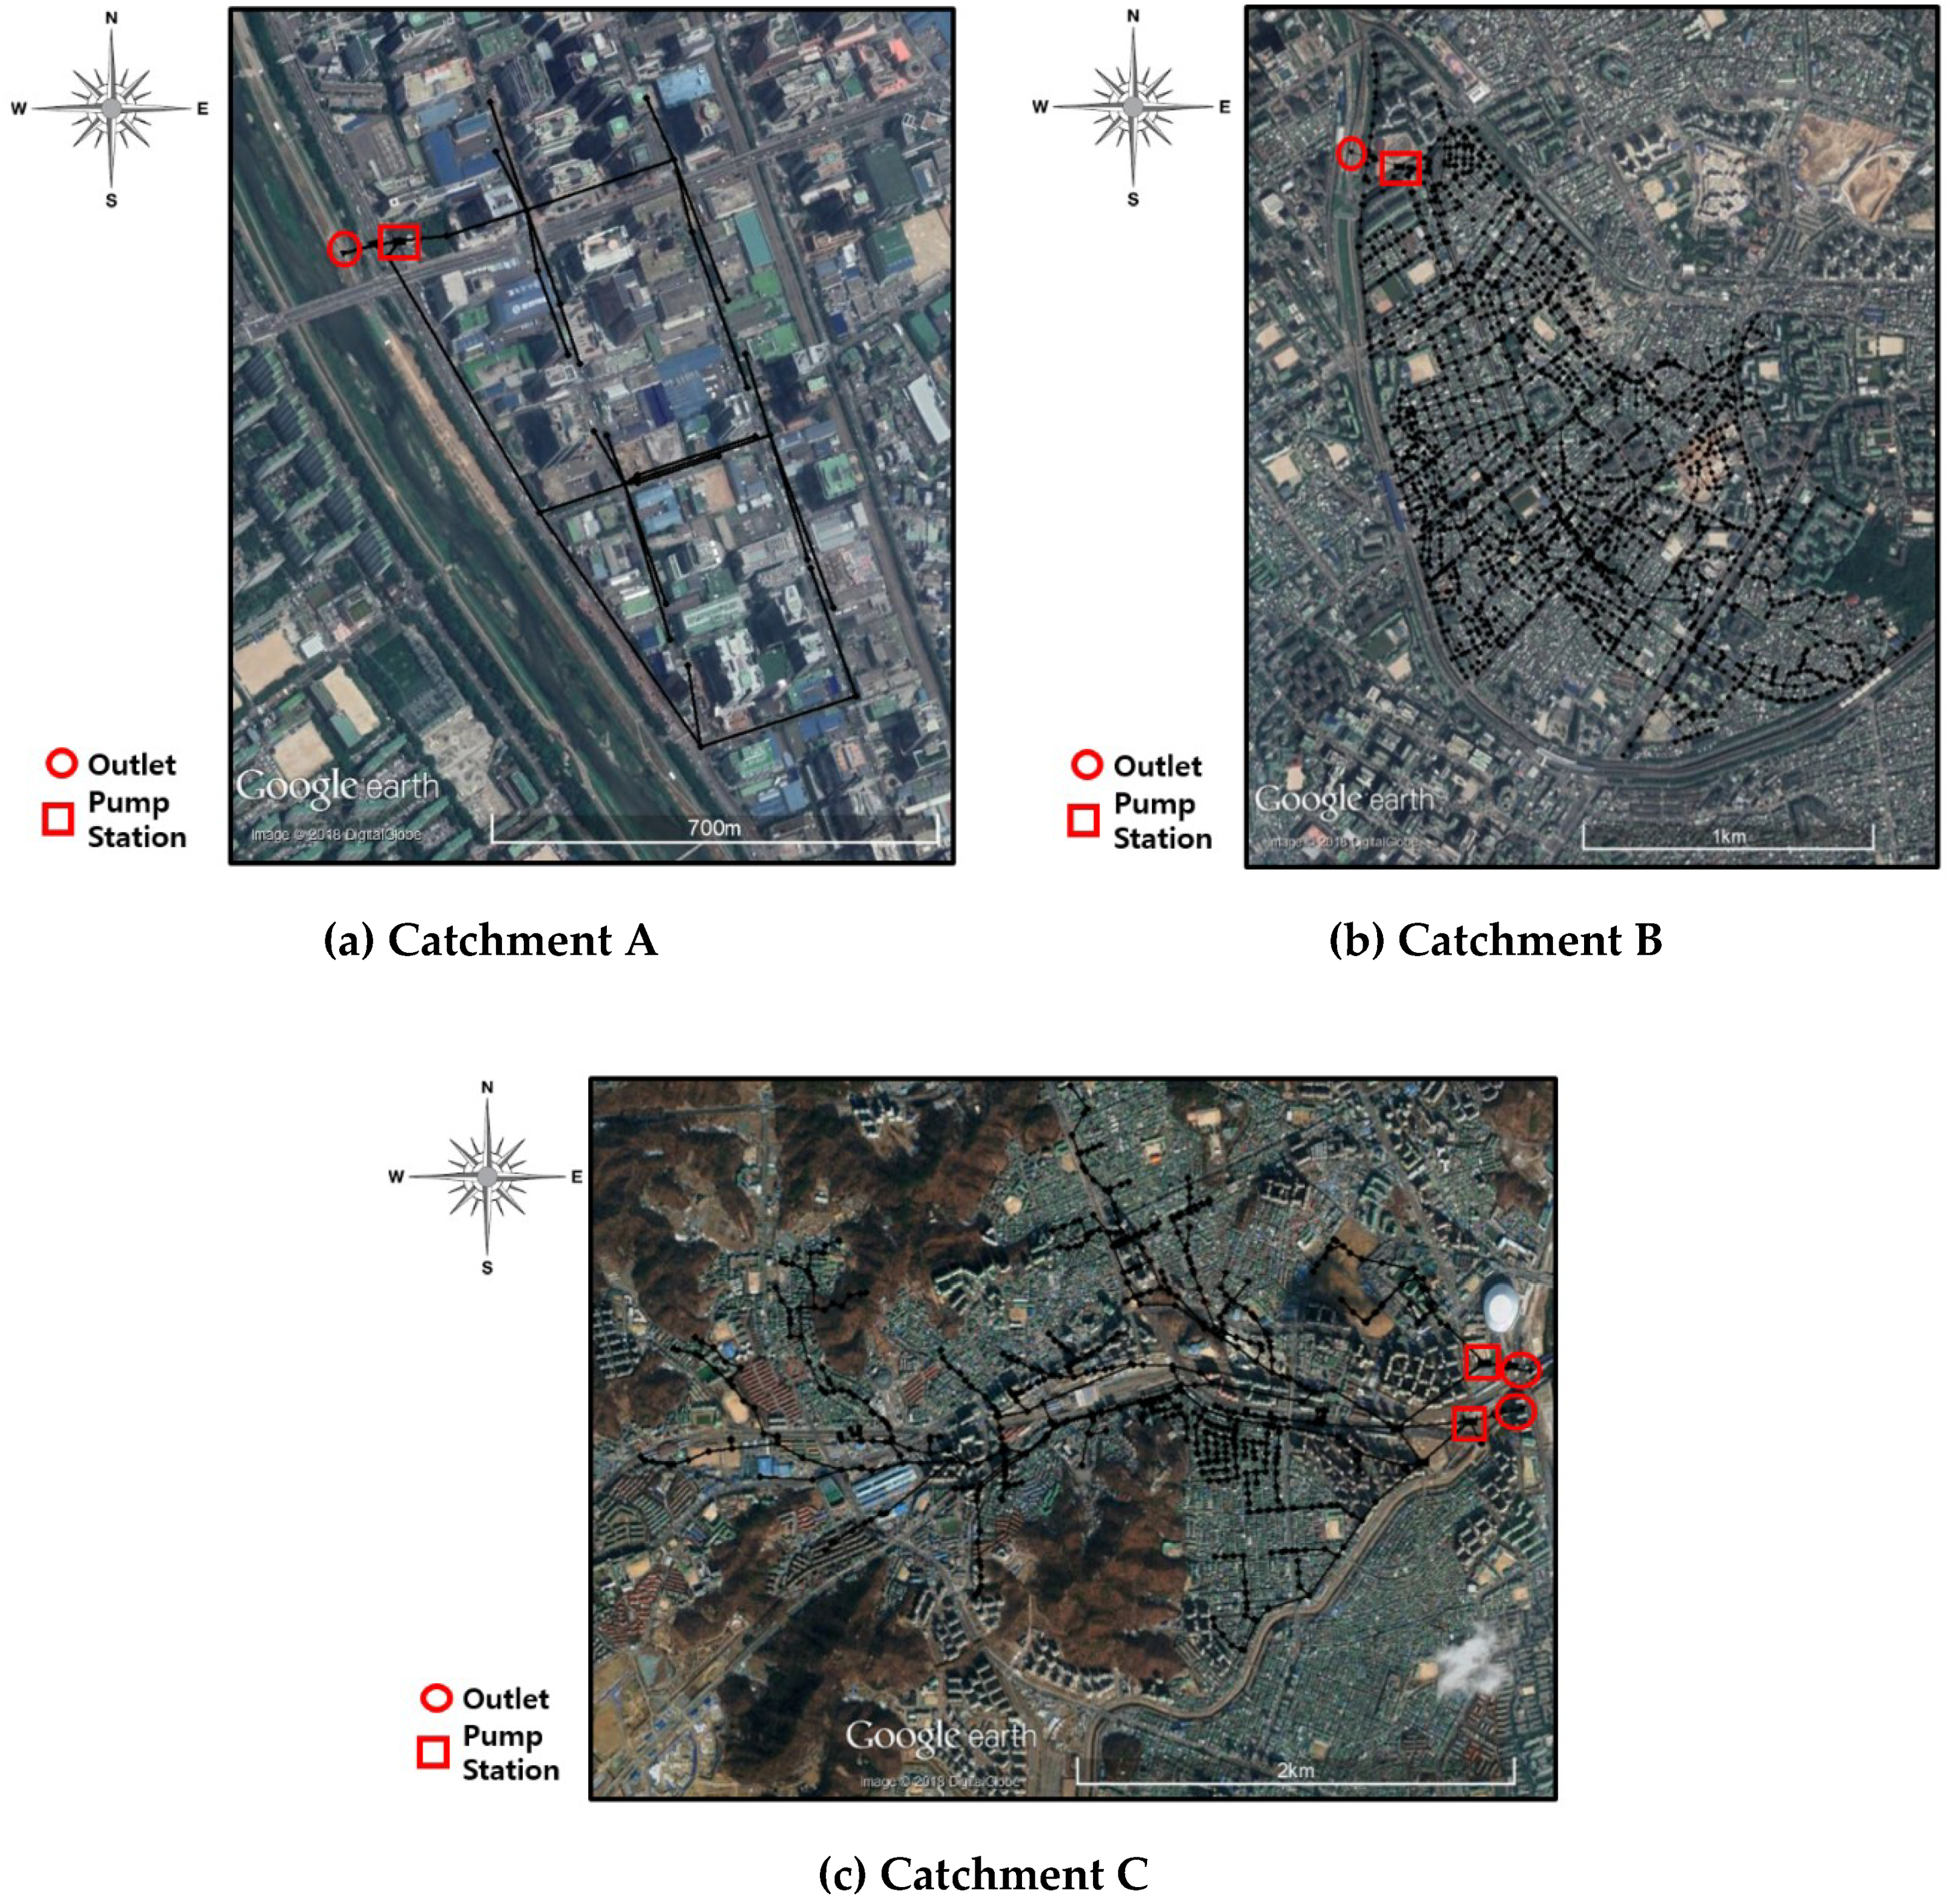
The five urban catchments and respective pipe networks in Seoul and Busan were selected as shown in Figure 2. The number of sub-catchments, the number of nodes and links, catchment area, and total pipe length are listed in Table 2. The stormwater pipe networks were originally constructed using the GIS data provided by the respective stormwater pipe information systems of Seoul and Busan cities. Then, the original structures were simplified and calibrated using historical rainfall data and the method as described in Reference [20].
Catchment A located in Gasan-dong, Geumcheon-gu, Seoul was designed for the design flood of 30-year occurrence. It has a reservoir capacity of 9000 m3. The drainage area is 4.8 km2, of which 73% is covered with industrial areas [21]. Although the area consists of a few nodes and pipe links, the overall shape looks like branched pipe networks.
Catchment B located in Daelim 3-dong, Yeongdeungpo-gu, Seoul was also designed for the 30-year frequency flood and has a reservoir capacity of 36,200 m3. The catchment consisted of residential area (60%), commercial and business districts (15%), and a highly dense residential area (9%) [22]. Catchment B is the second largest in area and consists of a complex looped pipe networks.
In Catchment C, located in Guro, Seoul, two stormwater pump stations are installed in Gaebong 1 and 2, which is located near the catchment outlet. The Gaebong 1 pump station is equipped with a reservoir capacity of 156,000 m3 of 5-year frequency flood, while Gebong 2 pump station is designed for 10-year frequency flood with a reservoir capacity of 3460 m3. The land use of the catchment is 19% of the forest and 39% of the impervious area [23]. As shown in Figure 2, the primary pipe networks are branched and looped pipes cover small parts of the catchment area.
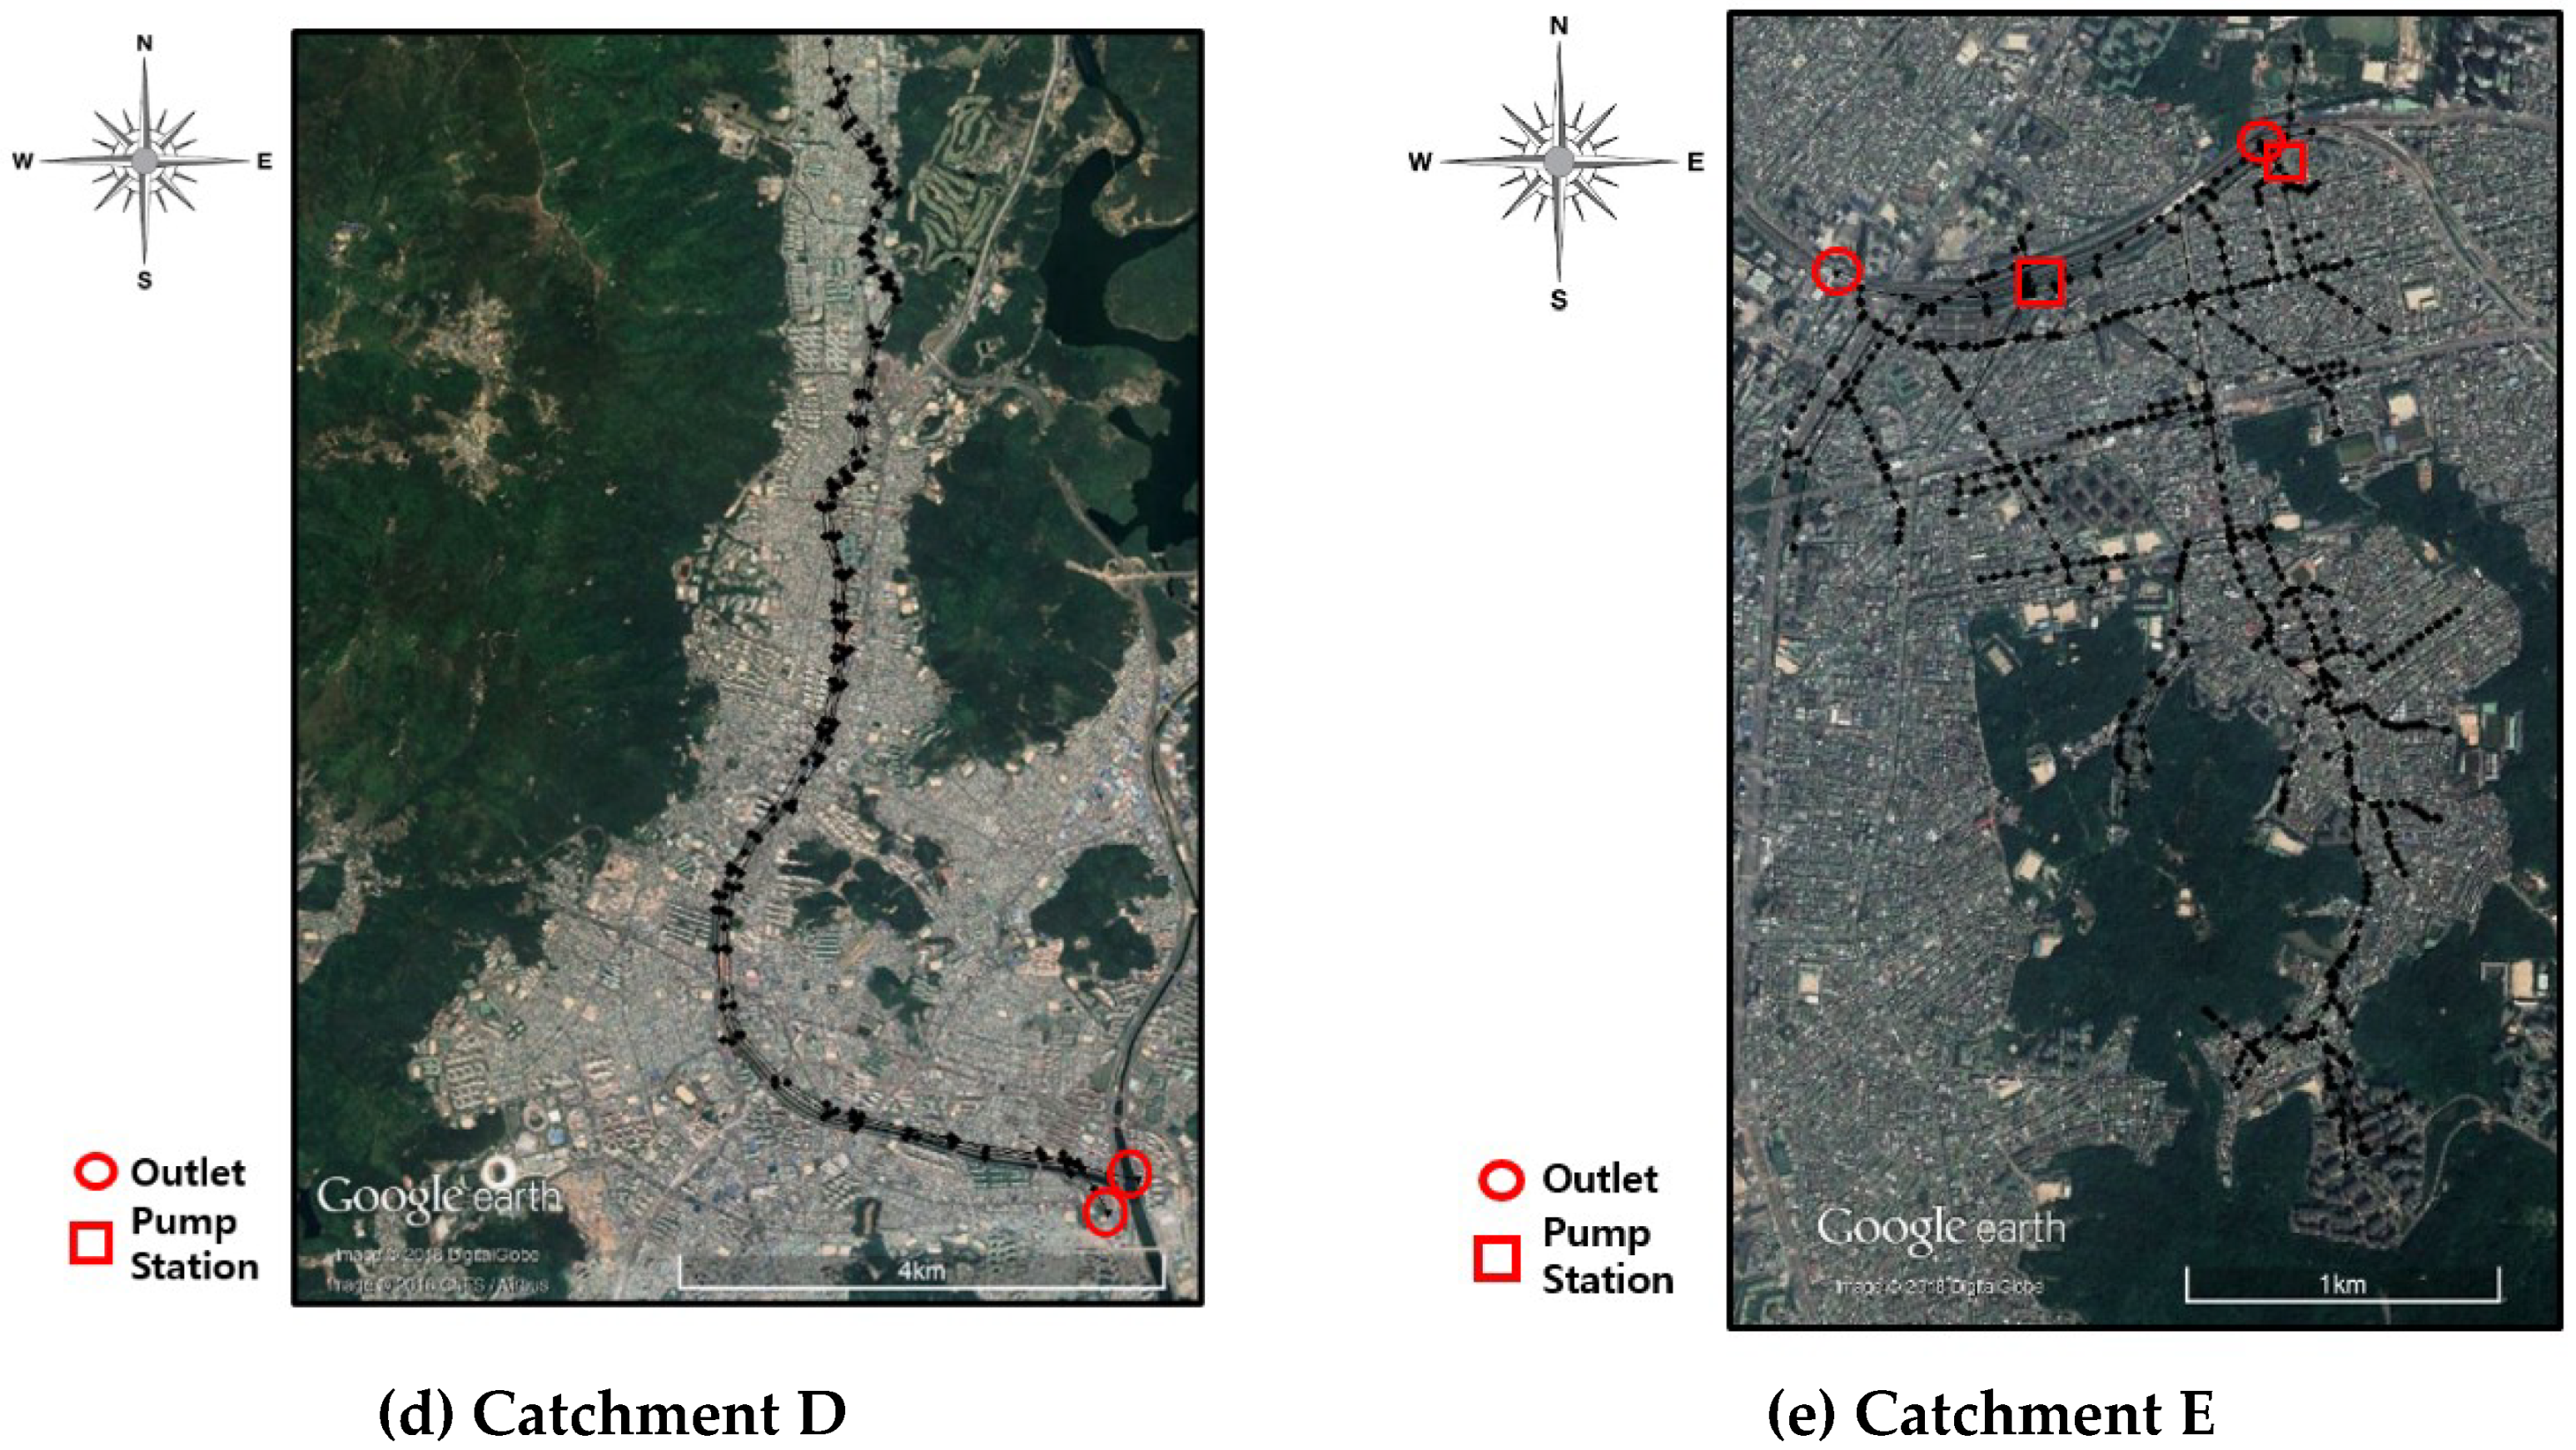
Catchment D is located in the downtown of Busan metropolitan area. Since the water level of a nearby river is commonly higher than the city ground, natural discharge of rainwater to the river is difficult due to backflow of sewer pipes [24]. This is why the pipe network’s structure is long-branched to the lower river area although the catchment area is relatively large.
Catchment E of the Dorimcheon Stream is located in Sinrim-dong, Gwanak-gu, Seoul. The Simlim 1 pumping station is designed for a 20-year frequency flood with the reservoir capacity of 8400 m3. Sinlim 2 stormwater pumping with a 30-year frequency flood was newly installed with the reservoir capacity of 5300 m3.
As shown in Figure 2, Network A is the simplest network with loops, while Network B is the most complicated network with complex loops. Networks C and E are the typical type of branch-loop-combined pipe networks, which is common in South Korea. Network D is a long-branched network at the lowland area.
3. Methods
3.1. EPA-SWMM
EPA-SWMM was developed in 1971 to estimate flow amount and water quality with rainfall runoff in urban areas. Runoff in the SWMM is simulated for single or continuous rainfall and snowmelt [25]. The SWMM model is simulated by three types of runoff analysis methods: steady state, kinematic wave, and dynamic wave methods. The kinematic wave method assumes that the friction gradient is the same as the slope gradient. The kinematic wave method has a large time interval and thus, is generally applied to long-term prediction. The dynamic wave method is applied in the unsteady flow to solve continuity and momentum equations. The dynamic wave method is also used for surface flow analysis when pipes are full of rainfall [26].
Equation (1) is the dynamic wave method used in the momentum equation.
where is time; is distance in the flow direction; is the average flow velocity; is the depth of water; is the friction slope of the energy line; is the lateral inflow; is the gravitational acceleration; is the wetted perimeter of the cross section and is the surface slope.
The first term in the dynamic wave method is related to inertia force, the second term and the third term are the pressure, the fourth term is the momentum change, and the fifth term is related to gravity and frictional forces. To simplify the equation, the fourth term can be ignored. This is commonly used to calculate flood wave movements in natural rivers, which are wide and shallow.
3.2. Simple Linear Regression Analysis
When observations are given in pairs, one variable is used to predict another variable. Linear regression analysis is a statistical analysis method that assumes a linear relationship between two variables. The basic formula of the linear regression model is given in Equation (2).
where is the dependent variable; is the independent variable; is the intercept; and is the regression coefficient. is independent as an error term and follows the distribution of . is normal distribution with zero mean and of variation.
The coefficient of determination ( value) is a measure of whether the proposed equation is appropriate to represent the dataset and is the percentage of the variable that can be explained by the proposed model. The coefficient of determination is defined by Equation (3).
where is the total sum of squares, and is the sum of squares due to the regression. is observed value, is estimated value using the regression, and is the mean value of observed values. represents how far the observed value is from , and is how far the estimate is from . The range of the coefficient of determination is 0 ≤ ≤ 1. The closer the value to 1, the better the regression model fits the observations.
3.3. Drainage Density
Drainage density is a numerical value defined as the ratio of total pipe length to catchment area representing the degree of pipe network density in the watershed. High drainage density means that relatively long pipe lines per unit area are installed and thus rainfall runoff can be drained more rapidly as compared to lower drainage density [27].
4. Analysis and Results
4.1. Peak Runoff and Peak Rainfall
In order to analyze runoff from urbanized catchments, historical rainfall runoff data are separated into independent rainfall events using the concept of inter-event time definition (IETD). As recommended in Reference [28], rainfall events were separated based on 11 hours of the IETD for each of the five catchments. Rainfall events were prepared using the hourly precipitation data of 1975 to 2015 obtained from the Seoul and Busan Korea Metropolitan Administration (KMA). The rainfall events greater than 30 mm were utilized for runoff calculation. The number of the rainfall events were 427 and 419 in Seoul and Busan, respectively.
The SWMM model was adopted to simulate rainfall runoff from the study catchments. The dynamic wave method was used to consider the flow characteristics during surface flooding and the pressure effects due to inverse slope in some parts of the catchments.
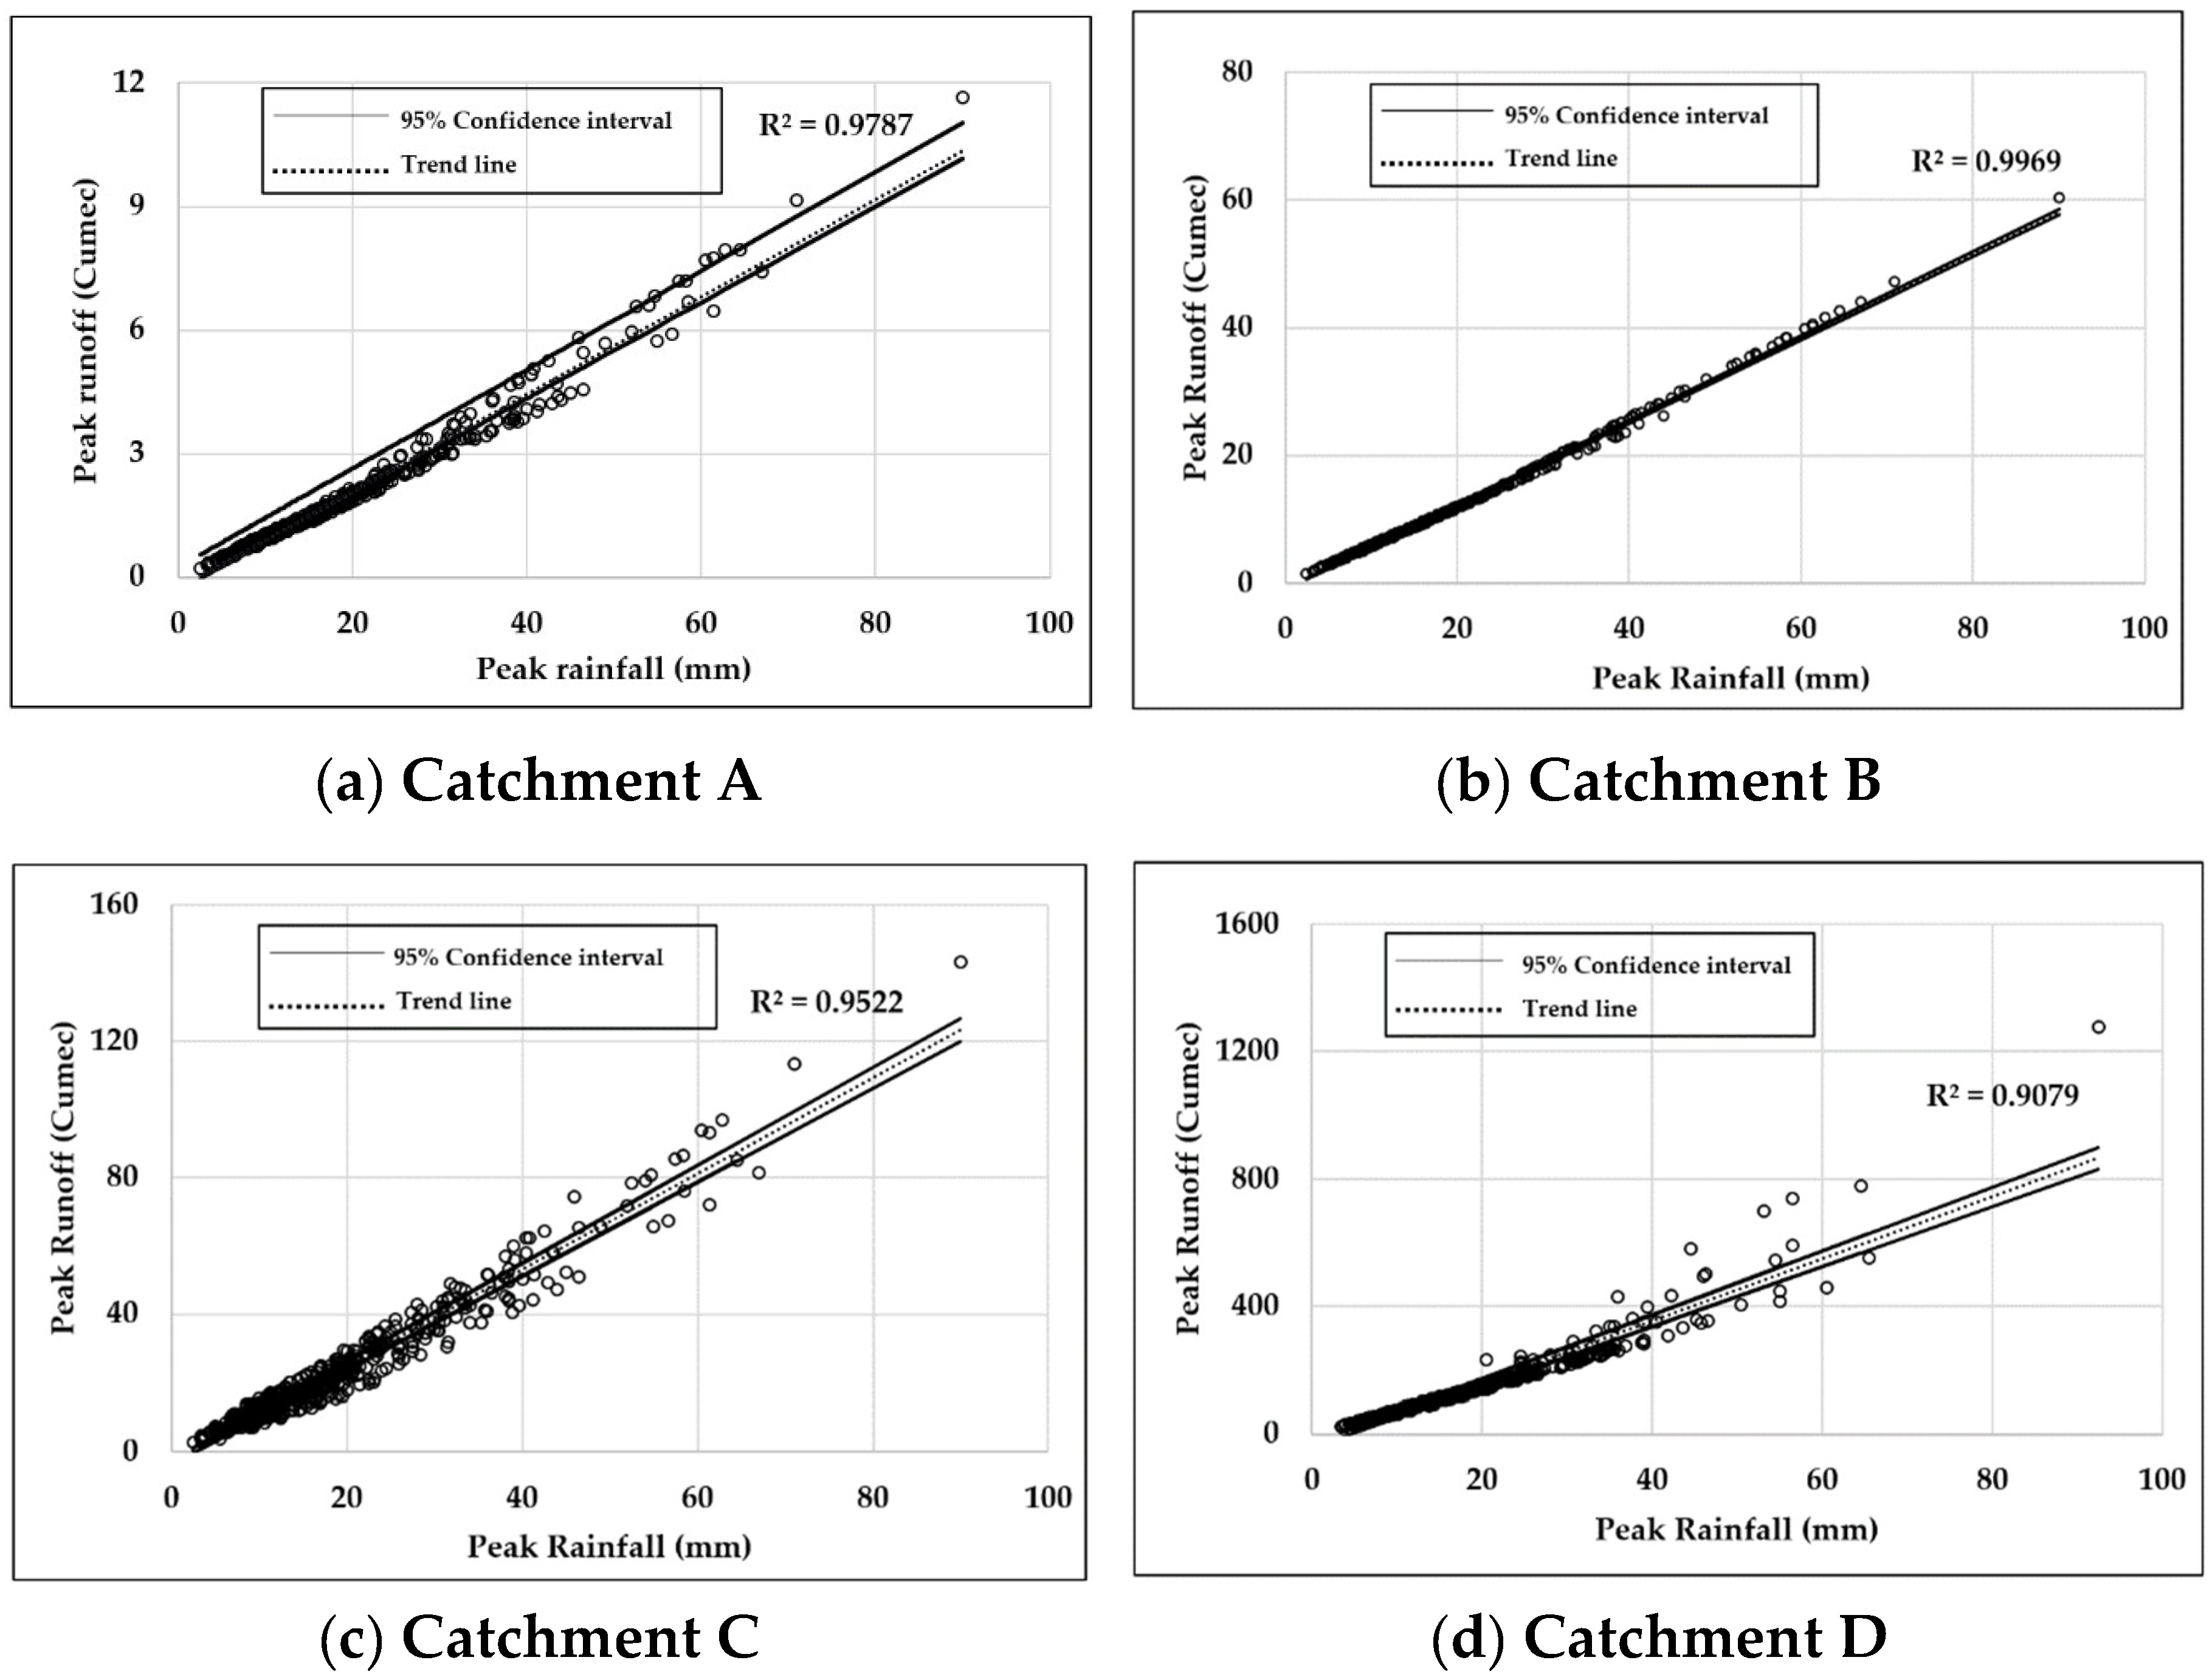
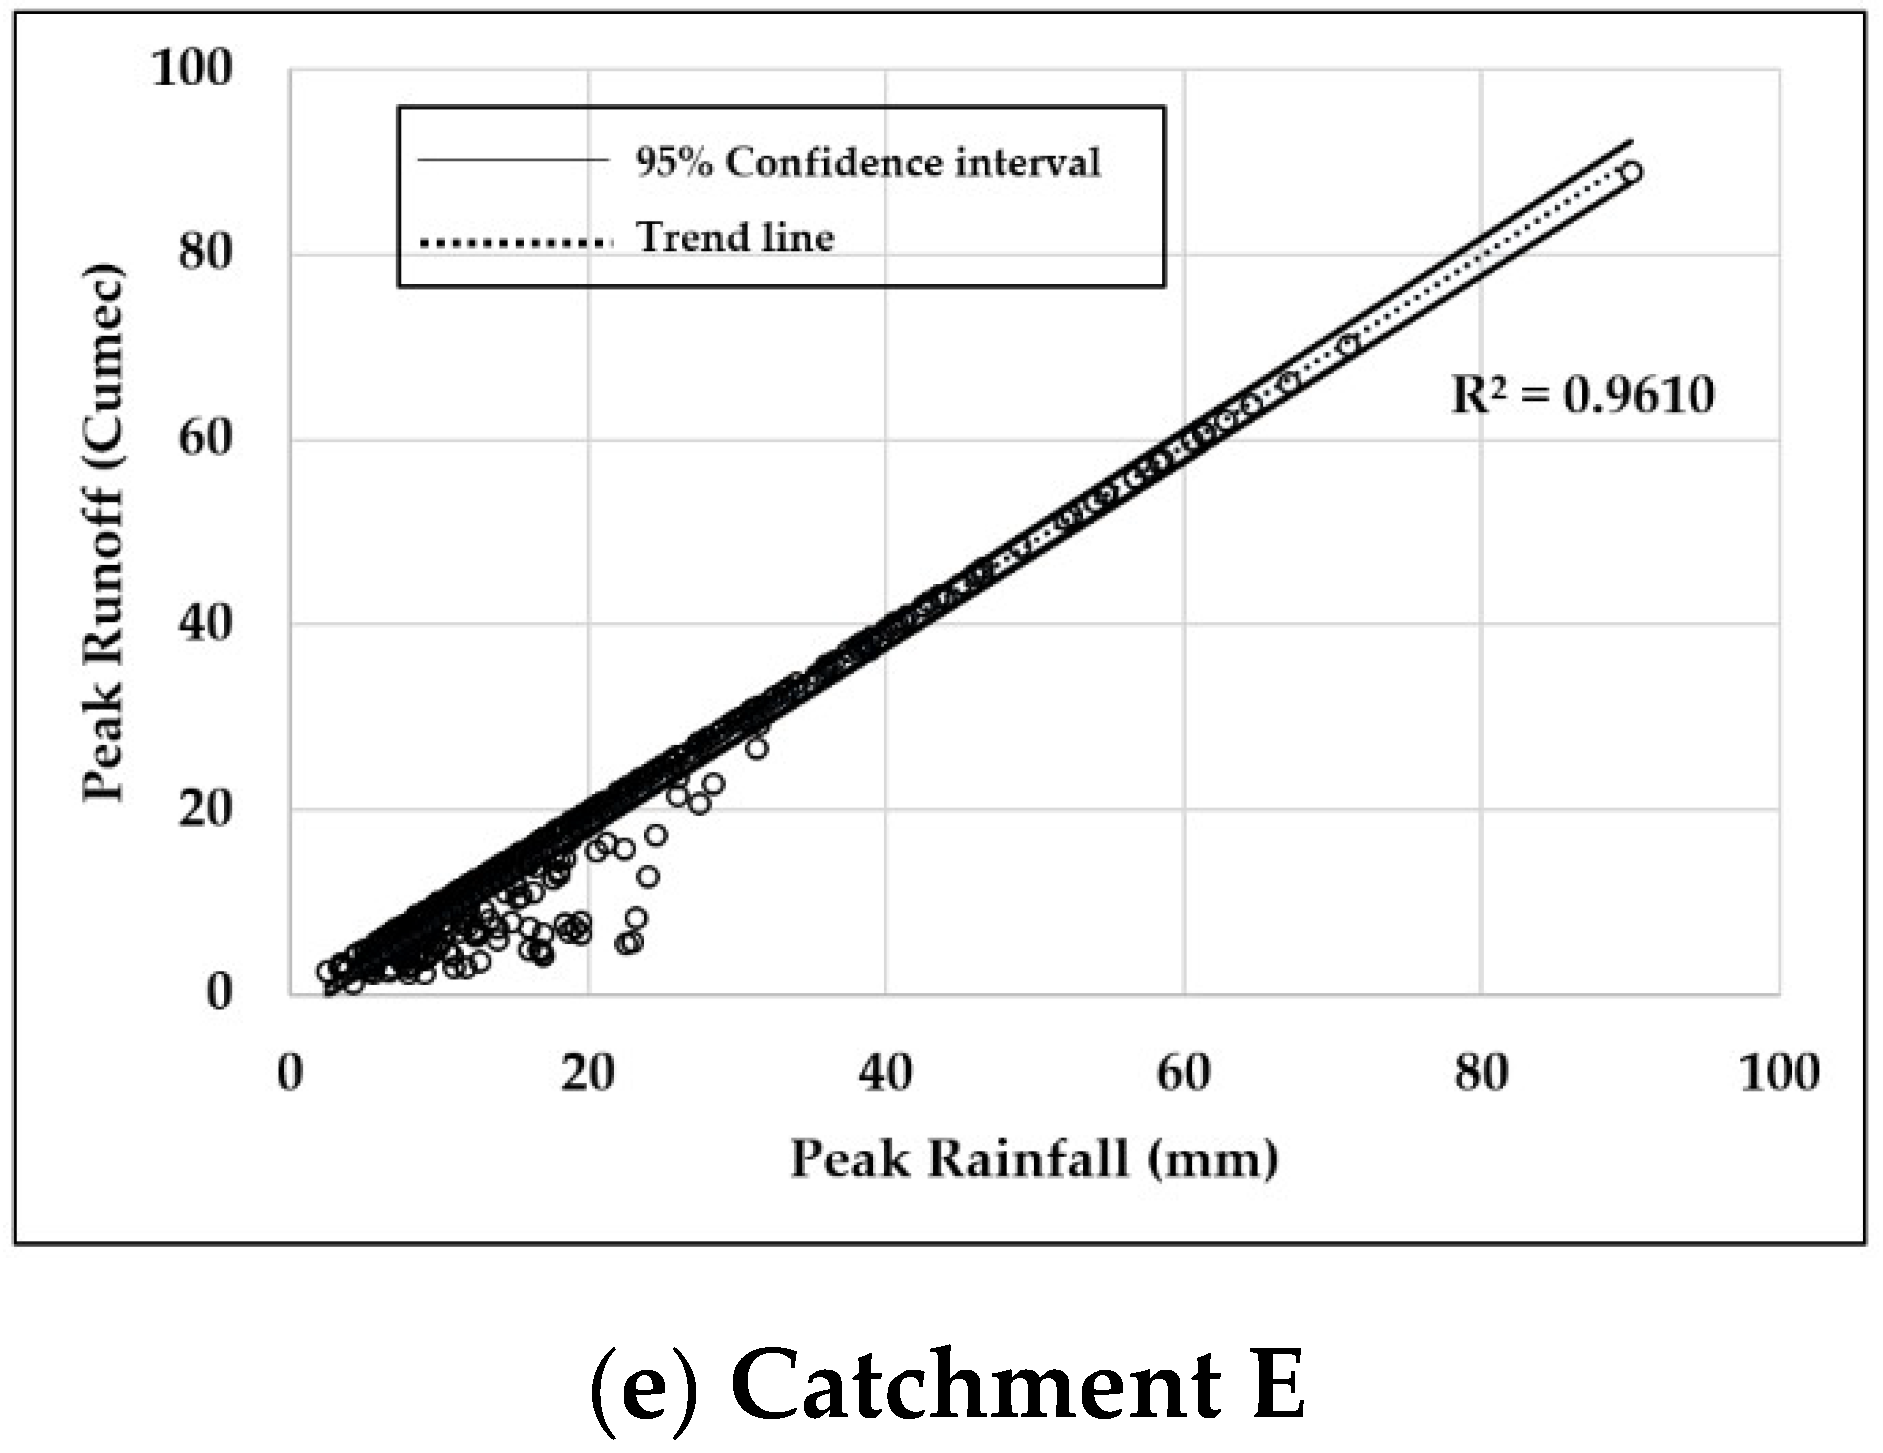
Regression analysis between peak rainfall and runoff was conducted and the resulting equations are listed in Table 3. The coefficients of determination () in all cases were greater than 0.9. As shown in Figure 3, the peak runoffs increased almost linearly as the peak rainfall increased. However, when the peak rainfall was large, the variation of peak runoff also increased. Average widths of peak runoff, i.e., the 95% confidence intervals for respective catchments A, B, C, D and E were 0.6 m3/s, 0.3 m3/s, 2.56 m3/s, 20.8 m3/s, and 1.6 m3/s, respectively. Catchment B showed the smallest width of 95% confidence interval with the greatest , implying greater accuracy in peak runoff estimation as compared to the other catchments. This might be due to the structural characteristics of catchment B that many loops were combined into a complicated network as shown in Figure 2. Unlike the branched networks in which stormwater flows in one direction, many alternative water flow paths existed to deliver the peak rainfall and thus, shorten the time to discharge the resulting runoff to nearby river systems.
In contrast, Catchment D showed the greatest width of 95% confidence interval in rainfall runoff while was the smallest. As shown in Figure 2, the stormwater pipe networks in Catchment D are a long-branched structure which has a simple one-directional water path to the river. When rainfall intensity and peak rainfall increase, the capacity of the stormwater pipes may be exceeded with the instant runoff increase, resulting in local surface flooding since there is only one way out for runoff water. After a certain time period, the exceeded runoff could have also been discharged through the pipes, however, the instant surface flooding could have caused damages to metropolitan areas.
Catchments C and E were also the branched networks; however, the average width of 95% confidence intervals in the runoff were smaller than Catchment D. This is probably because the catchment areas of C and E were much smaller than Catchment D. It was, therefore, expected that the catchment area and the length of water flow paths can be important factors in estimating the rainfall peak runoff. The short travel time of Catchments C and E decreased the uncertainty of the peak runoff prediction and increased the reliability.
4.2. Drainage Density Analysis
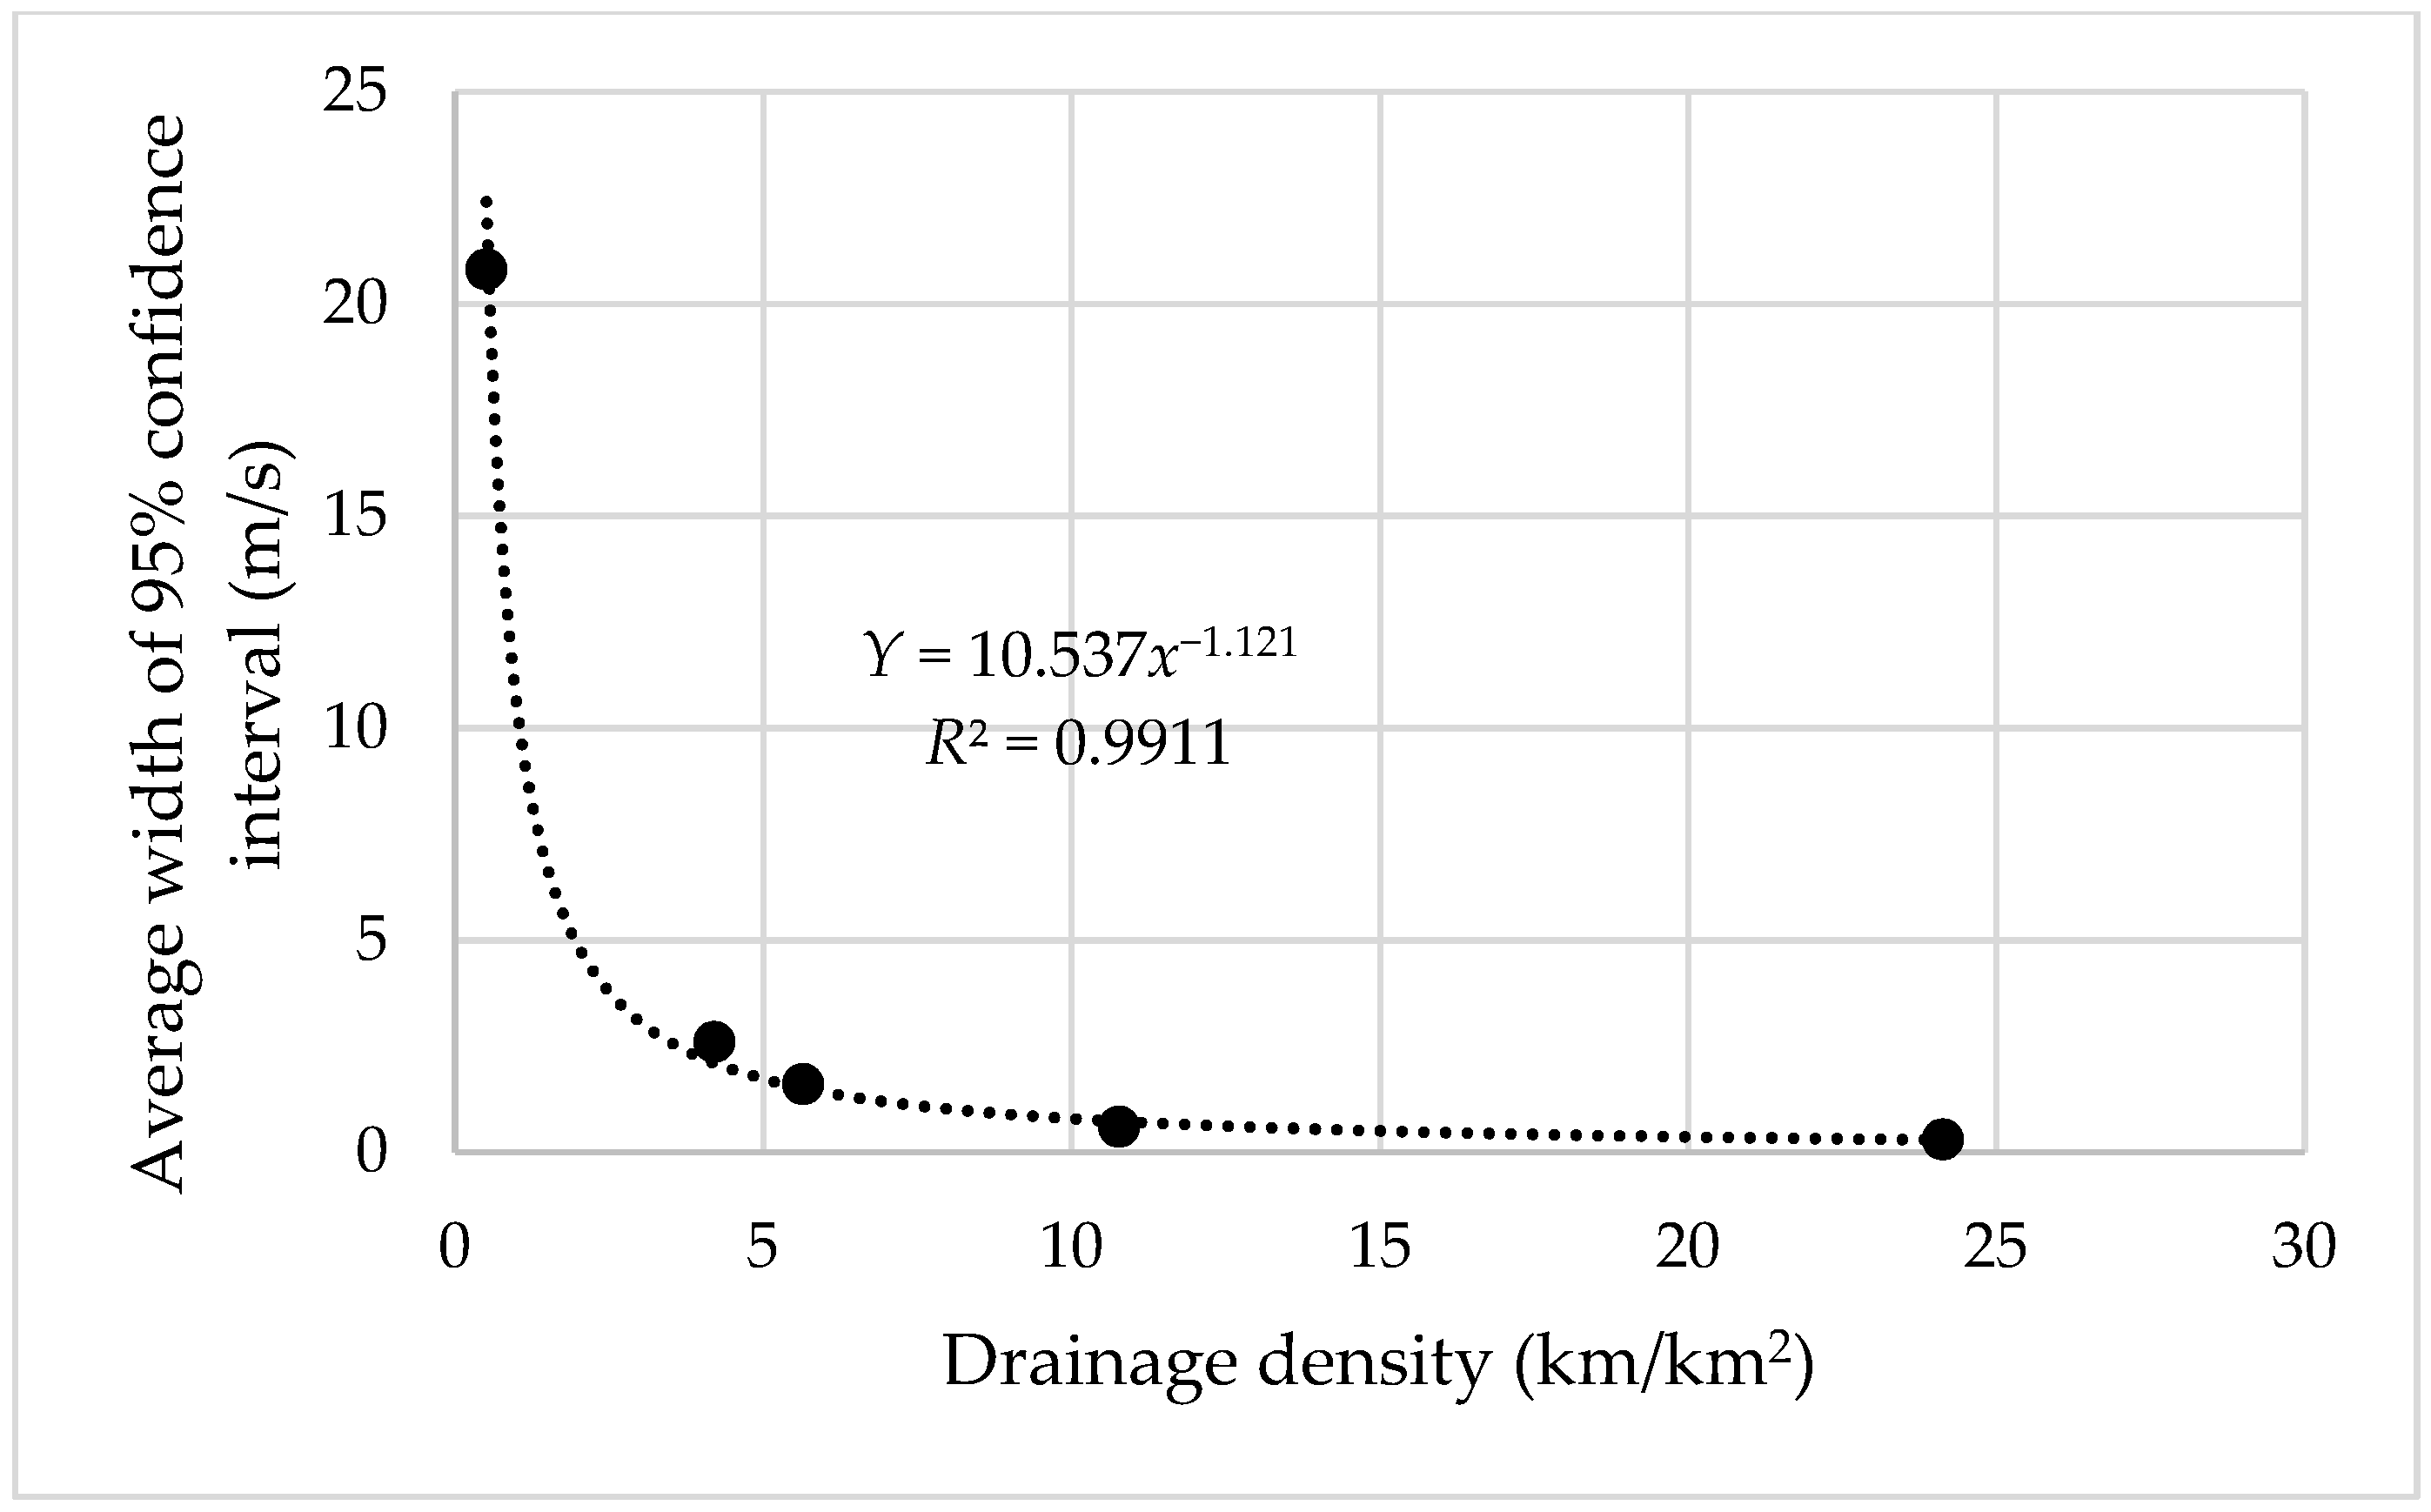
To take into account the catchment area and the length of the water flow path, the concept of drainage density was utilized. Drainage density is defined as the ratio of the total pipe length to the catchment area and is calculated in Table 4. The drainage densities for catchments A, B, C, D, and E were 10.77 km/km2, 24.13 km/km2, 4.21 km/km2, 0.51 km/km2, and 5.65 km/km2, respectively.
Catchment B showed the greatest drainage density while the lowest average width of 95% confidence interval and coefficient of variation were the smallest among the catchments. As aforementioned, the pipe networks in Catchment B are complicated with the looped structure and the peak runoff could be estimated more accurately as the peak rainfall increased, owing to rapid runoff discharge through various water paths and thus narrower 95% confidence interval. This means that Catchment B discharged the rainfall to the drainage system the most efficiently among the study catchments.
On the other hand, the drainage density of Catchment D was the lowest, while the average width of the 95% confidence interval and coefficient of variation were the greatest. The lower pipe density means less installation of pipes over unit area and thus may lead to the lack of capacity of the pipes. Particularly in the case of extreme rainfall events, the lack of the capacity can cause surface flooding that may result in substantial damages to human society even for a short time period.
Figure 4 compares the average widths of the 95% confidence interval against the drainage densities. As shown in Figure 4, along with the increase in the drainage density, the average width of the 95% confidence interval decreased. This means that the uncertainty in the estimation of peak runoff increased as the drainage density decreased.
5. Conclusions
In this study, the structures of stormwater pipe networks were evaluated using the relationship between the peak rainfall and runoff in urban catchments of Seoul and Busan in South Korea. Forty-one years of historical rainfall data from 1975 to 2015 and more than 400 rainfall events were applied in five urban catchments. Linear regression analysis was implemented to estimate peak runoff from different peak rainfalls. The coefficients of determination of the regressions were higher than 0.9, which meant that the regression model represented the relationship between the two peaks very well. However, the variation of the prediction became large as the peak rainfall increased, as it depends on the structure of the stormwater pipe network. When the water paths in the pipe network were unique (branched network), the increased amount of rainfall congested around the rainwater inlets and the uncertainty of peak runoff prediction increased. If there were many possible water paths depending on the amount of discharge (looped network), the increased rainfall was discharged through the many water paths in the relatively shorter time. This can be a way to represent the reliability of the stormwater pipe network. The structures of the stormwater pipe network were evaluated using drainage density, which is the length of pipes over the unit catchment area and the 95% confidence interval. As a result, the 95% confidence interval was decreased as the drainage density increased as the accuracy of the peak runoff prediction was increased. As mentioned earlier, as the looped networks had many alternative water flowing paths, the elimination time of rainfall from the catchments became short, the 95% confidence interval became narrow, and the reliability of the peak runoff prediction became high. Therefore, it is beneficial to install a looped stormwater pipe network within an affordable budget. Particularly, in mega city, the stormwater pipe network should be complicated and looped despite of inefficiency for leakage detection and management. It is an important factor to determine the amount of complexity in a stormwater pipe network to decrease the risk of urban flooding.
Author Contributions
Conceptualization, G.C. and J.L.; Methodology, G.C. and J.L.; Software, J.L. and H.P.; Validation, G.C.; Formal Analysis, J.L.; Data Curation, J.L. and G.C.; Writing-Original Draft Preparation, J.L.; Writing-Review & Editing, G.C.; Visualization, J.L. and H.P.; Supervision, G.C. and I.P; Funding Acquisition, I.P.
Funding
This research was supported by a grant (18SCIP-B089409-05) from the Development of Design and Construction Technology for Double Deck Tunnel in Great Depth Underground Space by the Ministry of Land, Infrastructure and Transport of the Korean government.
Conflicts of Interest
The authors declare no conflicts of interest.
References
- Park, C.; Moon, J.Y.; Cha, E.J.; Yun, W.T.; Choi, Y. Recent changes in summer precipitation characteristics over South Korea. J. Korean Geog. Soc. 2008, 43, 324–336. [Google Scholar]
- National Disaster management portal, Disaster Year Book. 2010. Available online: http://www.safekorea.go.kr (accessed on 30 July 2017).
- KMA (Korea Meteorological Administration), Meteorological Technology & Policy Publications. 2009. Available online: http://www.kma.go.kr (accessed on 15 July 2017).
- Kim, B.S.; Kim, B.K.; Kwon, H.H. Evaluation of the uncertainties in rainfall-runoff model using Meta-Gaussian approach. J. Korean Wetlands Soc. 2009, 11, 49–64. [Google Scholar]
- Shim, U.B. Characteristics of the flood damage in Korea and the corresponding task. J. Korea Water Resour. Assoc. 2008, 41, 41–46. [Google Scholar]
- Chung, G.H.; Sim, K.B.; Kim, E.S. Uncertainty Quantification Index of SWMM Model Parameters. J. Korea Water Resour. Assoc. 2015, 48, 105–114. [Google Scholar] [CrossRef] [Green Version]
- Enrique, M.; Pedro, T.; Gabriel, O. Uncertainty in rainfall input data in a conceptual water balance model: effects on outputs and implications for predictability. Earth Sci. Res. J. 2014, 18, 69–75. [Google Scholar] [CrossRef]
- Li, M.; Yang, X.; Sun, B.; Chen, L.; Shen, Z. Parameter uncertainty analysis of SWMM based on the method of GLUE. In Proceedings of the 2016 7th International Conference on Biology, Environment and Chemistry, San Francisco, CA, USA, 26–28 October 2016. [Google Scholar]
- Nasrin, T.; Sharma, A.K.; Muttil, N. Impact of short duration intense rainfall events on sanitary sewer network performance. Water 2017, 9, 225. [Google Scholar] [CrossRef]
- Cimorelli, L.; Cozzolino, L.; Covelli, C.; Mucherino, C.; Palumbo, A.; Pianese, D. Optimal design of rural drainage networks. J. Irrig. Drain. Eng. 2013, 139, 137–144. [Google Scholar] [CrossRef]
- Cimorelli, L.; Morlando, F.; Cozzolino, L.; Covelli, C.; Della Morte, R.; Pianese, D. Optimal positioning and sizing of detention tanks within urban drainage networks. J. Irrig. Drain. Eng. 2016, 142, 04015028. [Google Scholar] [CrossRef]
- Morlando, F.; Cimorelli, L.; Cozzolino, L.; Mancini, G.; Pianese, D.; Garofalo, F. Shot noise modeling of dailystreamflows: A hybrid spectral- andtime-domain calibration approach. Water Resour. Res. 2016, 52, 4730–4744. [Google Scholar] [CrossRef]
- Choi, K.S.; Kyoung, M.S.; Kim, H.S.; Kim, B.S. Evaluation of effects of rainfall errors on Discharge. In Proceedings of the 33rd Annual Meeting of the Korean Society of Civil Engineers CIVIL EXPO, Daegu, Republic of Korea, 10–12 October 2007; pp. 1958–1961. [Google Scholar]
- Lee, H.; Jeon, M.W.; Balin, D.; Rode, M. Application of rainfall runoff model with rainfall uncertainty. J. Korea Water Resour. Assoc. 2009, 42, 773–783. [Google Scholar] [CrossRef]
- Hilary, M.; Bethanna, J.; Martyn, C.; Dmitri, K.; Ross, W. Rainfall uncertainty in hydrological modelling: An evaluation of multiplicative error models. J. Hydrol. 2011, 400, 83–94. [Google Scholar] [CrossRef]
- Kang, N.; Joo, H.; Lee, M.; Kim, H.S. Generation of radar rainfall ensemble using probabilistic approach. J. Korea Water Resour. Assoc. 2017, 50, 155–167. [Google Scholar] [CrossRef]
- Carlston, C.W. Drainage Density and Streamflow; US Govt. Print. Off.: Washington, DC, USA, 1963; 422-C, 1–8.
- Ogden, F.L.; Pradhan, N.R.; Downer, C.W.; Zahner, J.A. Relative importance of impervious area, drainage density, width function, and subsurface storm drainage on flood runoff from an urbanized catchment. Water Resour. Res. 2011, 47, W12503. [Google Scholar] [CrossRef]
- WAMIS. Available online: http://www.wamis.go.kr (accessed on 30 July 2017).
- Park, J.; Lee, S.; Lee, B. Development of Storm Sewer-Network Extraction Tool (SS-NET) for creating pipe network input data of urban rainfall-runoff model. J. Korean Soc. Hazard Mitig. 2017, 17, 79–86. [Google Scholar] [CrossRef]
- Jang, H.C. Basic and Detailed Design for Improvement of Rainwater Pump Station Facilities (Expansion 1 Area) Gasan 1 Rainwater Pump Station Report; River management section: Seoul, Republic of Korea, 2009.
- Jang, H.C. Basic and Detailed Design for Improvement of Rainwater Pump Station Facilities (Extension 3 Area) Daerim 3 Rainwater Pump Station Report; River management section: Seoul, Republic of Korea, 2009.
- Jang, H.C. Basic and Detailed Design for Improvement of Rainwater Pump Station Facilities (Expansion 3 Area) Gaebong 1 Rainwater Pump Station Report; River management section: Seoul, Republic of Korea, 2009.
- Shon, T.S.; Kang, D.H.; Jang, J.K.; Shin, H.S. A study of Assessment for Internal Inundation Vulnerability in Urban Area using SWMM. J. Korean Soc. Hazard Mitig. 2010, 10, 105–117. [Google Scholar]
- Hong, J.B. Assessment of Food Flow Conveyance for Urban Stream Using XP-SWMM. Master’s Thesis, Inha University, Incheon, Republic of Korea, 2005. [Google Scholar]
- Kang, S.H.; Heo, W.M.; Kang, S.H. Water balance estimate of LID technique for circulating urban design. J. Environ. Sci. Int. 2015, 24, 1065–1073. [Google Scholar] [CrossRef]
- KMA, Meteorological Data Link Portal. Available online: https://data.kma.go.kr/cmmn/main.do (accessed on 30 July 2017).
- Lee, J. Estimation of InterEvent Time Definition using in urban areas. J. Korean Soc. Hazard Mitig. 2017, 17, 287–294. [Google Scholar] [CrossRef]
Figure 1.
Annual rainfall during the rainy season (June–October) and moving average of meteorological stations in Seoul (a) and Busan (b).
Figure 1.
Annual rainfall during the rainy season (June–October) and moving average of meteorological stations in Seoul (a) and Busan (b).

Figure 2.
Study catchments and respective stormwater pipe networks.


Figure 3.
Regression analysis between peak rainfall and runoff in urban catchments.


Figure 4.
Changes of 95% confidence interval depending on drainage density.


Table 1.
Flood damage in the study catchments during the last 10 years (2004~2013) [19].
Table 1.
Flood damage in the study catchments during the last 10 years (2004~2013) [19].
| District | Total Amount of Flooding Damage ($) | Number of Flooding Years |
|---|---|---|
| Yeongdeungpo-gu (Seoul) | 900,000 | 4 |
| Guro-gu (Seoul) | 870,000 | 6 |
| Geumcheon-gu (Seoul) | 900,000 | 4 |
| Yeonje-gu (Busan) | 3,580,000 | 5 |
Table 2.
Statistics of stormwater pipe networks in SWMM.
| Catchment | No. of Subcatchments | No. of Nodes | No. of Links | Area (km2) | Total Pipe Length (km) |
|---|---|---|---|---|---|
| A | 32 | 35 | 35 | 0.48 | 5.22 |
| B | 1643 | 1881 | 2053 | 2.48 | 59.98 |
| C | 620 | 620 | 632 | 8.92 | 37.59 |
| D | 196 | 196 | 236 | 57.24 | 29.13 |
| E | 451 | 512 | 526 | 3.56 | 20.12 |
Table 3.
Results of regression analysis between peak rainfall and peak runoff in urban catchments.
| Catchment | Regression Equation | Average Width of 95% Confidence Interval (m/s) | |
|---|---|---|---|
| A | = 0.1182x – 0.2834 | 0.9787 | 0.6 |
| B | = 0.6554x – 0.9070 | 0.9969 | 0.3 |
| C | = 1.4049x – 3.0924 | 0.9522 | 2.6 |
| D | = 9.7278x – 34.355 | 0.9079 | 20.8 |
| E | = 1.0245x – 2.2035 | 0.9610 | 1.6 |
Table 4.
Results of drainage density calculation.
| Watersheds | Drainage Density (km/km2) | Average Width of 95% Confidence Interval (m/s) | Coefficient of Variation |
|---|---|---|---|
| A | 10.77 | 0.6 | 77.8 |
| B | 24.13 | 0.3 | 72.7 |
| C | 4.21 | 2.6 | 80.0 |
| D | 0.51 | 20.8 | 85.6 |
| E | 5.65 | 1.6 | 77.4 |
© 2018 by the authors. Licensee MDPI, Basel, Switzerland. This article is an open access article distributed under the terms and conditions of the Creative Commons Attribution (CC BY) license (http://creativecommons.org/licenses/by/4.0/).
Share and Cite
MDPI and ACS Style
Lee, J.; Chung, G.; Park, H.; Park, I. Evaluation of the Structure of Urban Stormwater Pipe Network Using Drainage Density. Water 2018, 10, 1444. https://doi.org/10.3390/w10101444
AMA Style
Lee J, Chung G, Park H, Park I. Evaluation of the Structure of Urban Stormwater Pipe Network Using Drainage Density. Water. 2018; 10(10):1444. https://doi.org/10.3390/w10101444
Chicago/Turabian StyleLee, Jinwoo, Gunhui Chung, Heeseong Park, and Innjoon Park. 2018. "Evaluation of the Structure of Urban Stormwater Pipe Network Using Drainage Density" Water 10, no. 10: 1444. https://doi.org/10.3390/w10101444
Note that from the first issue of 2016, this journal uses article numbers instead of page numbers. See further details here.