Article

Defining Seasonal Functional Traits of a Freshwater Zooplankton Community Using δ13C and δ15N Stable Isotope Analysis

1
National Research Council-Institute of Ecosystem Study, Largo Tonolli 50, 28922 Verbania, Italy
2
Advanced Technology Institute, University of Surrey, Guildford GU2 7XH, UK
3
University of Sassari, Department of Science for Nature and Environmental Resources, Piazza Università 21, 07100 Sassari, Italy
*
Author to whom correspondence should be addressed.
Water 2018, 10(2), 108; https://doi.org/10.3390/w10020108
Submission received: 30 November 2017 / Revised: 17 January 2018 / Accepted: 23 January 2018 / Published: 27 January 2018

Abstract

:
Functional-based approaches are increasingly being used to define the functional diversity of aquatic ecosystems. In this study, we proposed the use of δ13C and δ15N stable isotopes as a proxy of zooplankton functional traits in Lake Maggiore, a large, deep subalpine Italian lake. We analyzed the seasonal pattern of δ13C and δ15N signatures of different crustacean zooplankton taxa to determine food sources, preferred habitats, and trophic positions of species throughout one year. The cladocerans Daphnia longispina galeata gr., Diaphanosoma brachyurum, and Eubosmina longispina were grouped into a primary consumer functional group from their δ13C and δ15N isotopic signatures, but while the former two species shared the same food sources, the latter exhibited a more selective feeding strategy. Cyclopoid copepods occupied a distinct functional group from the other secondary consumers, being the most 15N enriched group in the lake. The δ15N signature of calanoid copepods showed trophic enrichment in comparison to Daphnia and Eubosmina and linear mixing model results confirmed a predator-prey relationship. In our study, we have demonstrated that the use of δ13C and δ15N stable isotopes represented an effective tool to define ecological roles of freshwater zooplankton species and to determine functional diversity in a lake.

1. Introduction

Functional-based approaches are increasingly being used to study aquatic ecosystems as an alternative to traditional taxonomy-based approaches. Functional diversity is a biodiversity measure based on the ecological role of the species present in a community. Species-specific functional traits, or “what they do” [1], allows species to be defined by their interactions within an ecosystem [2] in terms of their ecological roles and how they interact with the environment and with other species [3].
Many recent ecological studies [2,4,5] suggest the importance of species ecological roles, and not just the number of taxonomic species, in the relationship between biodiversity and ecosystem functioning. This is a central concept if we are to understand and predict the resilience of a community to perturbations. If two species are deemed to be functionally alike and to occupy a similar trophic niche [6,7], the loss of one of those species is not likely to have an impact on the resource pool, as the other will increase its activity accordingly. The loss of functional diversity in the ecosystem is mitigated, as the species lost does not possess unique functional traits. Thus, the sum of organism functional traits within an ecosystem can be said to represent an indirect measure of its functional diversity [1,8]. Although the importance of functional diversity is widely recognized, there is no consensus on how to quantify functional diversity within a community, as relationships between the various indices have not yet been established [9].
Freshwater zooplankton play a key role in aquatic ecosystems in the transferal of biomass and energy from phytoplankton to top predators, e.g., [10,11]. While studies on phytoplankton have increasingly highlighted the importance of functional traits and functional classification in ecological studies, only a few have attempted this approach with zooplankton. Barnett et al. [2] applied the measure of functional diversity [12] to crustacean zooplankton communities. Quantitative functional traits considered were the C:N ratio, mean body size, and preferred food size range, while qualitative traits described the preferred habitat, food selectivity, and trophic position of each species.
Analysis of δ13C and δ15N stable isotopes is widely used to quantify food sources, trophic positions, and the interactions of organisms, as the δ13C of a consumer can infer the assimilated source of dietary carbon [13,14] and δ15N the trophic role [14,15]. Considering a functional-based perspective, δ13C and δ15N could identify ecological relations among taxa, such as competition and predation, ecological niche, habitat preference, and taxa redundancy, and help to define functional groups in an ecosystem. In this study, we propose the use of δ13C and δ15N stable isotope analysis to quantify some of the “qualitative functional traits” [2] for pelagic crustacean zooplankton taxa in Lake Maggiore, a large, deep subalpine lake in Italy. As species composition, diversity, and biomass of zooplankton can change significantly seasonally, especially in temperate lakes [16], the seasonal variation of δ13C and δ15N was used to define seasonal patterns in habitat preference, food sources, and taxa trophic position. This allowed an interpretation of taxa redundancy and a hypothesis of bottom-up and top-down mechanisms potentially driving the observed changes.
One use of stable isotopes is to determine the proportional contributions of several sources in a mixture. An example of a source proportion calculation includes the determination of various food sources in an animal’s diet [17]. Linear mixing models are used to estimate proportions for two sources using isotopic signatures for a single element (e.g., δ13C), or for three sources using isotopic signatures for two elements (e.g., δ13C and δ15N; [18]). In this study, we have used a linear mixing model [18,19] in order to discriminate the relative contribution of different preys in the diet of zooplankton consumers such as calanoid and cyclopoid copepods and the predatory cladoceran Leptodora kindtii. This further contributed to the understanding of food preference and taxa trophic position in the zooplankton community of Lake Maggiore.

2. Materials and Methods

Lake Maggiore (45°57′ N 8°32′ E 3°47′ W) is the second deepest (dmax 370 m) and largest (area 212.5 km2, volume 37.5 km3) subalpine lake in Italy. Being phosphorus-limited (TPmax ca. 10 μg L−1), the lake is oligotrophic and has recovered from eutrophication of the late 1970s [20,21].
Except for September, vertical zooplankton hauls from the surface to a depth of 50 m were collected. This follows the standard routine sampling for deep subalpine lakes, in which samples are collected within the upper 50 m depth, as previous research on the vertical distribution of zooplankton showed that this is the water layer in which zooplankton live [22]. Monthly samples were collected from April to November 2009, when total zooplankton biomass was ≥3 mg·m−3, using a wide-mouth 450 μm mesh zooplankton net of diameter 0.58 m, filtering 13 m3 lake water from three pelagic stations (G: 45°58′30″ N 8°39′09″ E, B: 45°54′28″ N 8°31′44″ E, L: 45°49′70″ N 8°34′70″ E) [16].
Zooplankton samples for the quantification of biomass were collected with a Clarke-Bumpus plankton sampler of a 126 μm mesh size and fixed in ethanol 96% to estimate the taxa-specific population density (ind·m−3) and standing stock biomass (dry weight, mg·m−3) [22]. Organisms for isotopic analyses were kept overnight in filtered (1.2 μm GF/C filters) lake water for gut clearance, before sorting into taxa and quantities suitable for isotopic analyses. The taxa analyzed were Daphnia longispina galeata gr., Eubosmina longispina, Diaphanosoma brachyurum, Bythotrephes longimanus, Leptodora kindtii, adults of the calanoid copepods Eudiaptomus padanus and Eudiaptomus gracilis, and of the cyclopoid copepods Mesocyclops leuckarti and Cyclops abyssorum.
Samples were oven-dried for 24 h at 60 °C, before homogenizing and transferal into tin capsules of 5 × 9 mm in size. Depending on body mass, 50 to 700 individuals of each taxa were pooled to reach a minimum dry weight (DW) of 1 mg per sample. Three replicates of each taxa were run from each of the three sampling stations, as among-station differences were statistically non-significant (p > 0.05, Friedman Analysis of Variance, ANOVA test; [16]). The isotopic composition of organic carbon and nitrogen was determined from the analyses of CO2 and N2 by the G. G. Hatch Stable Isotope Laboratory at the University of Ottawa, Ontario, Canada, using a CE 1110 Elemental Analyser (Vario EL III manufactured by Elementar, Germany) and a DeltaPlus Advantage isotope ratio mass spectrometer (Delta XP Plus Advantage manufactured by Thermo, Bremen, Germany) coupled to a ConFlo III interface (Conflo II manufactured by Thermo, Bremen, Germany). The standard deviation of the analyses (SD) based on laboratory internal standards (C-55) was < 0.2‰ for both δ13C and δ15N. Isotope ratios were expressed as the parts per thousand (‰) difference from a standard reference of PeeDee Belemnite for carbon and atmospheric N2 for nitrogen:
δ C 13 , δ N 15 = [ ( R sample R standard ) 1 ] × 1000  
where R is the isotopic ratio: 13C/12C and 15N/14N.
Lipids can be δ13C -depleted as a consequence of fractionation during lipid synthesis [23], which can lead to a misrepresentation of results as differences in predator-prey δ13C could be greater than the expected 0.8‰ [24]. The C:N ratio was used as an indicator of lipid content. Invertebrates, including crustacean zooplankton, tend to have a C:N ratio of 4 [25], but C:N varies seasonally [26] and was as high as 7, so we used a revised version of the lipid normalizing procedure based on the C:N ratio [27], substituting the corrected parameters into Equations (2) and (3):
L = 93 1 + ( 0.246 × ( C ÷ N ) 0.75 ) 1
δ C 13 = δ C 13 + D × ( I + 390 1 + 287 L )
where L is the proportion of lipid in the sample; C and N are the proportions of carbon and nitrogen in the sample, respectively; δ13C′ is the lipid normalized sample signature; δ13C is the measured sample signature; D is the isotopic difference between the protein and lipid (7.018 ± 0.263); and I is a constant of 0.048 ± 0.013 [28].
Zooplankton δ13C and δ15N isotopic signatures were referred to that of the pelagic baseline, which was expressed by the primary consumer, Daphnia longispina galeata gr. This choice came from previous stable isotope studies in Lake Maggiore [16], showing that Daphnia’s δ13C signature in the different seasons was closely correlated with the signature of seston (r = 0.86; p < 0.01; N = 13), confirming that Daphnia was an appropriate proxy for the pelagic baseline against which the carbon isotopic signals of other zooplankton can be compared. Δ13C was used to detect seasonal changes in taxa specific feeding behavior and assess the origin of carbon sources fueling the pelagic food web.
The carbon fractionation between consumer and resource (F = δ13Ccons − δ13Cdiet) is ≤ 0.8‰ (±1.1‰ S.D.) [24]. The δ15N of consumers has been shown to be enriched 2.55‰ [29] for zooplankton, and was used to assess seasonal change in taxa-specific trophic position (T), as a consumer’s carbon signature is related to the baseline (F ≤ 0.8 ± 1.1) by:
T = (E/λ) + 2
where λ is the stepwise enrichment, E = 2.55‰ [29], and 2 is the value commonly assigned to the deviation of primary consumers from the pelagic isotopic baseline. A trophic level of T = 3 indicates that a consumer is feeding on a primary consumer, whereas T = 4 suggests that there is an intermediate prey.
When δ13C of the predator lies between that of two different prey taxa, suggesting a simultaneous use of both sources, the percent carbon contribution (p; q) of each prey to the predator’s diet was calculated by the 2-endmember linear mixing model (2-em LMM), [18,19] as:
p = (δ13Cpredator − δ13Cprey2)/(δ13Cprey1 − δ13Cprey2); q = 1 − p
where p and q are the relative contributions (%) of prey1 and prey2 carbon signatures to the predator δ13C carbon signature (δ13Cpredator).
When three potential prey sources were assessed, their isotopic signatures were partitioned by applying a 3-end member mixing model [18] to calculate the fractional contribution (p; q; z) of each of the three food sources to the predator’s diet as:
p = ((δ15Nprey3 − δ15Nprey2)(δ13Cpredator − δ13Cprey2) − (δ13Cprey313Cprey2)(δ15Npredator − δ15Nprey2))/
((δ15Nprey3 − δ15Nprey2)(δ13Cprey1 − δ13Cprey2) − (δ13Cprey3 − δ13Cprey2)(δ15Nprey1 − δ15Nprey2));
q = ((δ13Cpredator − δ13Cprey3) − (δ13Cprey1 − δ13Cprey3)p/(δ13Cprey2 − δ13Cprey3);
z = 1 − p − q
where p, q, and z are the relative carbon contribution (%) of prey (prey 1, 2, and 3). As required by the mixing model, δ13Cpredator and δ15Npredator were corrected for trophic fractionation, by weighting the isotopic signature of the prey against their percentage contribution to total biomass on each sampling date.
The software IsoError 04 (https://www.epa.gov/eco-research/stable-isotope-mixing-models-estimating-source-proportion) [18] was used to perform all 3-end member LMM calculations. Statistical analyses (Shapiro-Wilkinson W-test, Spearman-Rank correlation, Hierarchical Cluster Analysis) were performed using the software Statistica 12 (version 12, TIBCO Statistica Company, Palo Alto, CA, USA) and Sigmaplot 11.0 (version 11, Systat Software Inc., San Jose, CA, USA).
Cluster analysis of the seasonal variation in δ13C and δ15N for each taxa was performed with the software Sigmaplot 11.0. An Euclidean distance measure was used as the data were continuous [30].

3. Results

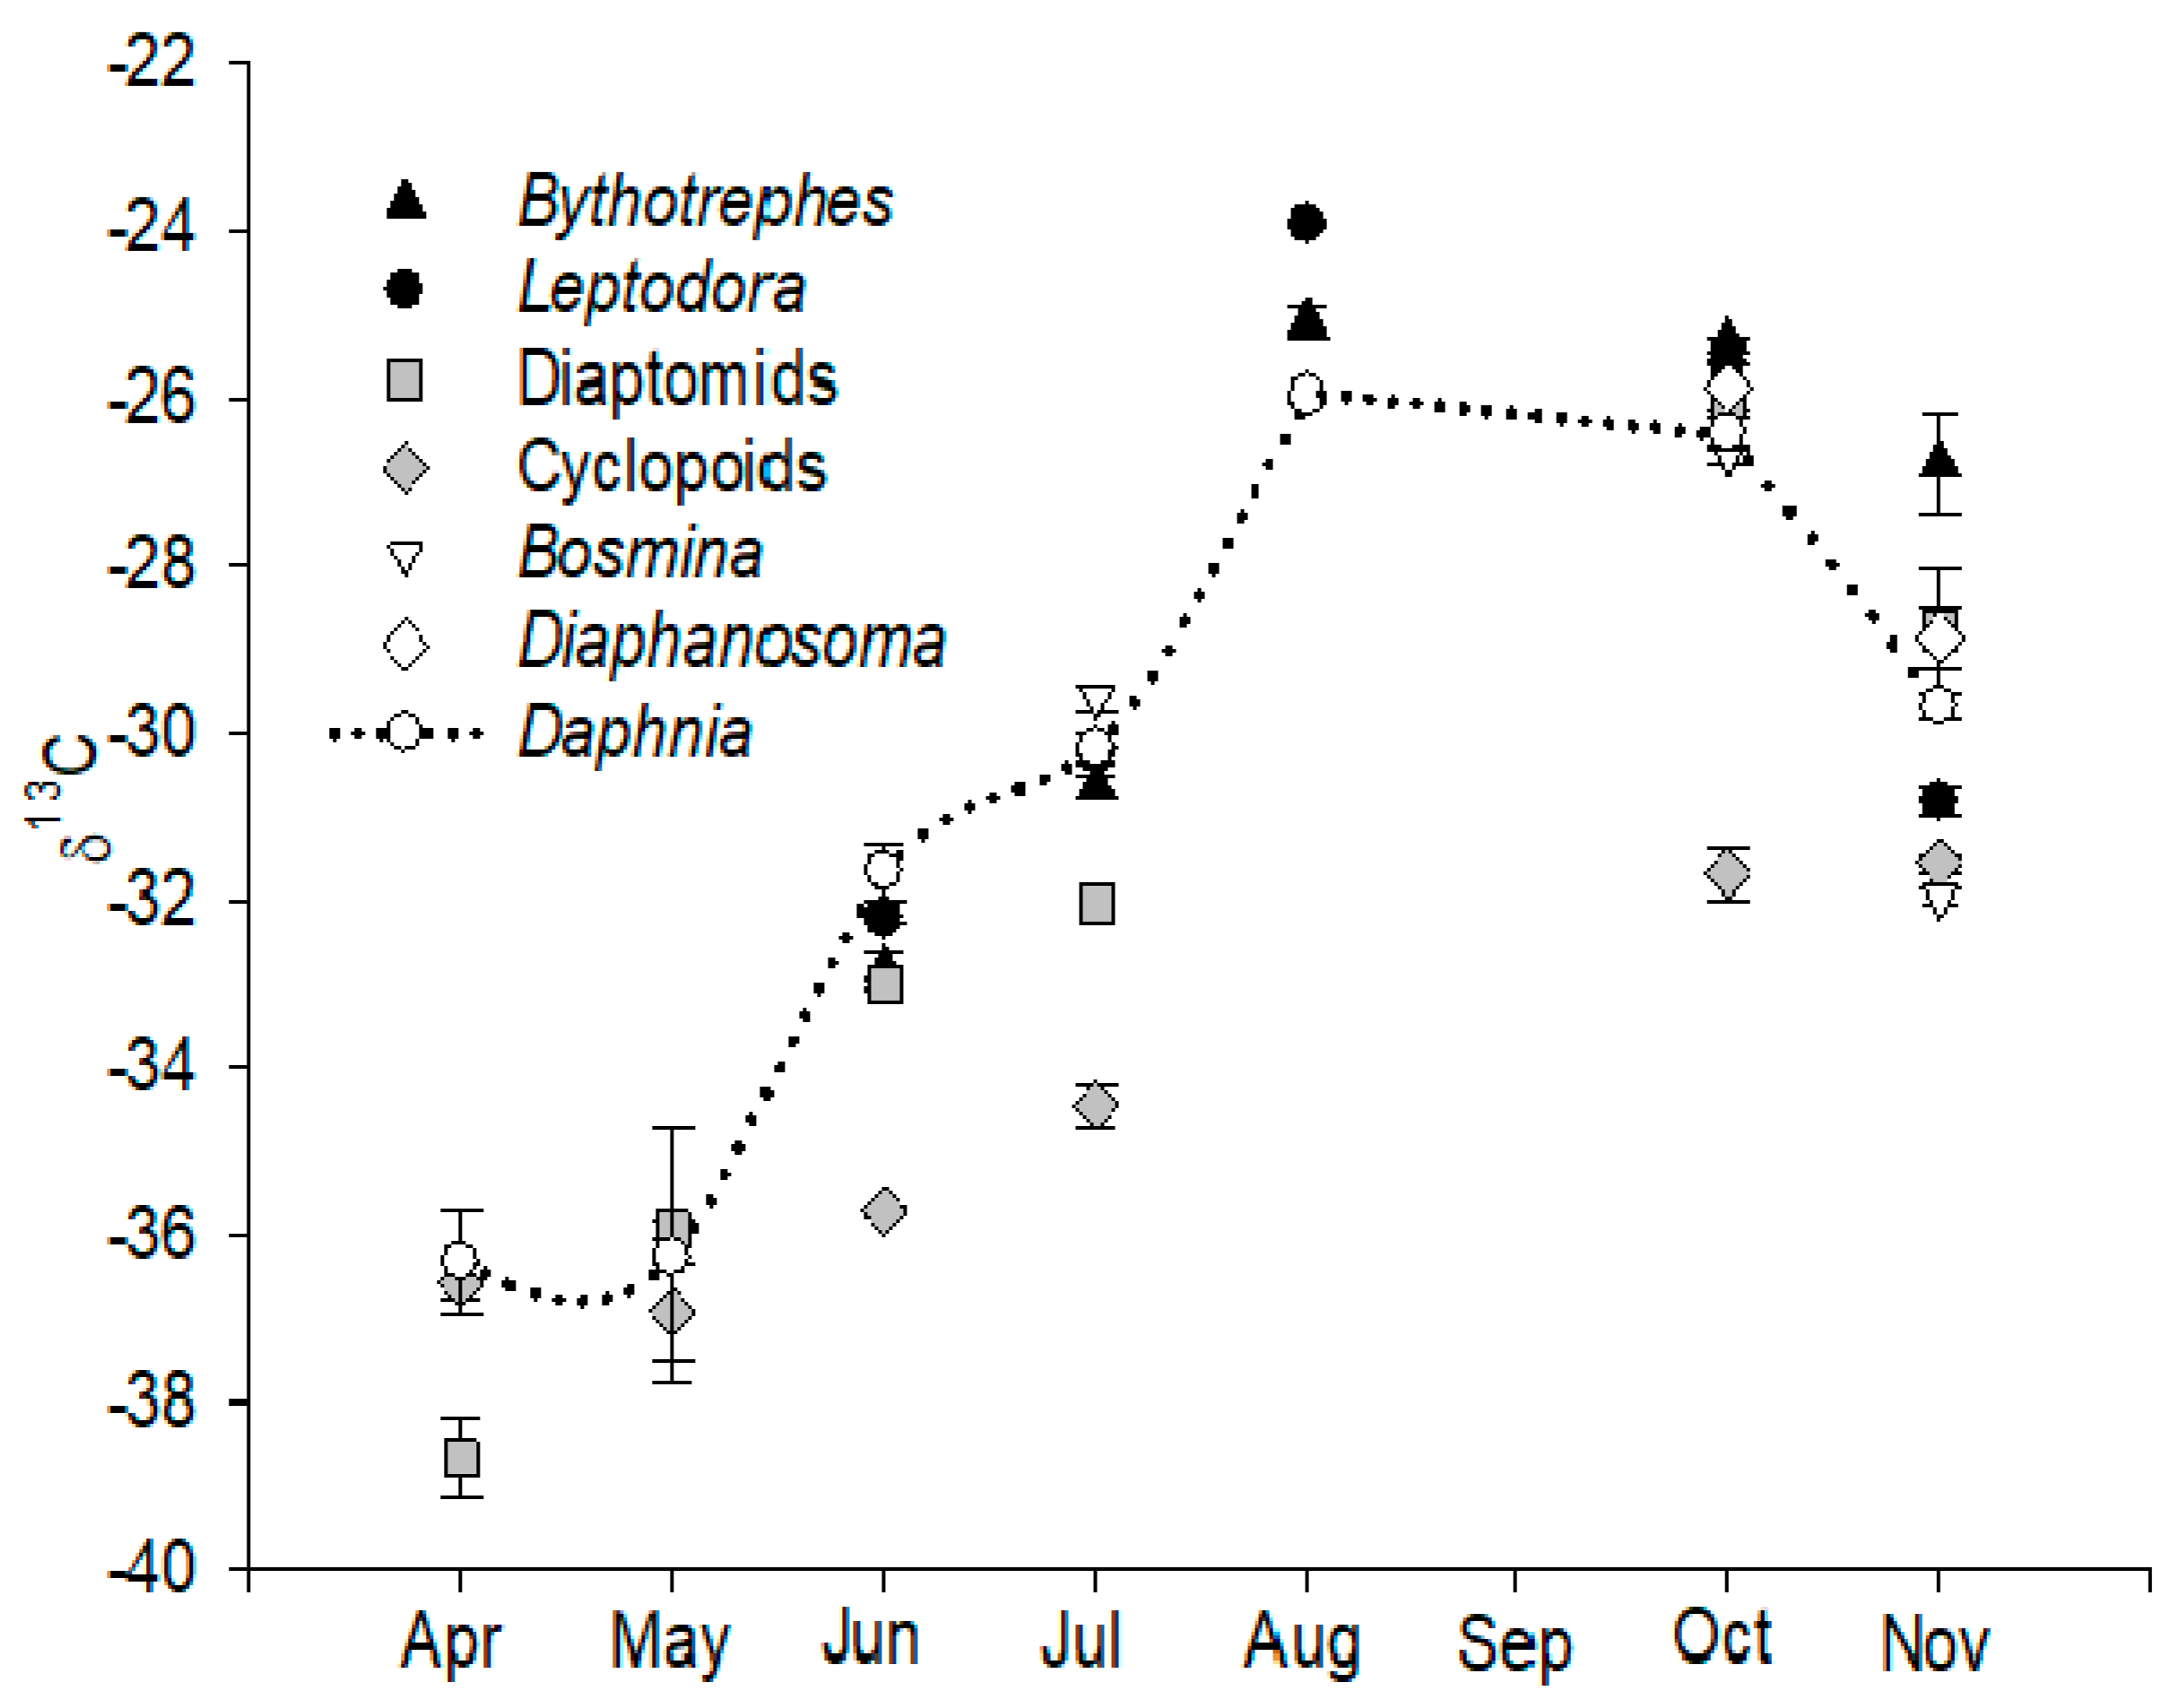
3.1. Seasonal Variation in δ13C and the Determination of Consumer Resources

The seasonal variation of δ13C for the different zooplankton species is shown in Figure 1. The variation of δ13C in Daphnia was most depleted in spring, with a value of −36.3‰ ± 0.6 (SD), and became most enriched during the summer in August, with a value of −26.0‰ ± 0.1 (SD). Diaphanosoma was present in the lake in October and November and its δ13C signature overlapped with a strong correlation (p = 0.06; R = 0.66) with the δ13C signature of Daphnia. Also, the δ13C signature of Bosmina overlapped with that of Daphnia in June, July, and October. This similarity in δ13C indicates that herbivorous cladocerans are sharing the same type of resources. When more δ13C-depleted values were recorded for Bosmina (−32.0‰ ± 0.1, SD) than for Daphnia (−29.7‰ ± 0.1, SD), this might suggest a deviation in dietary sources over the winter months (November).
The δ13C signature of copepods was more δ13C -depleted than that of the pelagic baseline (annual mean of −26.4‰ ± 4.4, SD) all year round, with a δ13C annual mean of −32.4‰ ± 4.6 (SD) for calanoid copepods and −34.5‰ ± 2.4 (SD) for cyclopoid copepods.
The procedure of lipid normalization for cyclopoid copepods decreased their average value of the δ13C signature, but the relative values between species were unaffected. The seasonal trend of δ13C signature for calanoid copepods generally traced the δ13C pelagic baseline signature (F < 0.8). The δ13C signature of Bythotrephes overlapped with the pelagic baseline (F < 0.8) from June to October, suggesting a tight dependence of this predatory cladoceran on pelagic food resources. However, in November, the δ13C signature of Bythotrephes was less δ13C -depleted (−26.8‰) and the least 13C-depleted of all zooplankton taxa. The δ13C signature of the other predatory cladoceran Leptodora was also related to the pelagic baseline (F < 0.8).

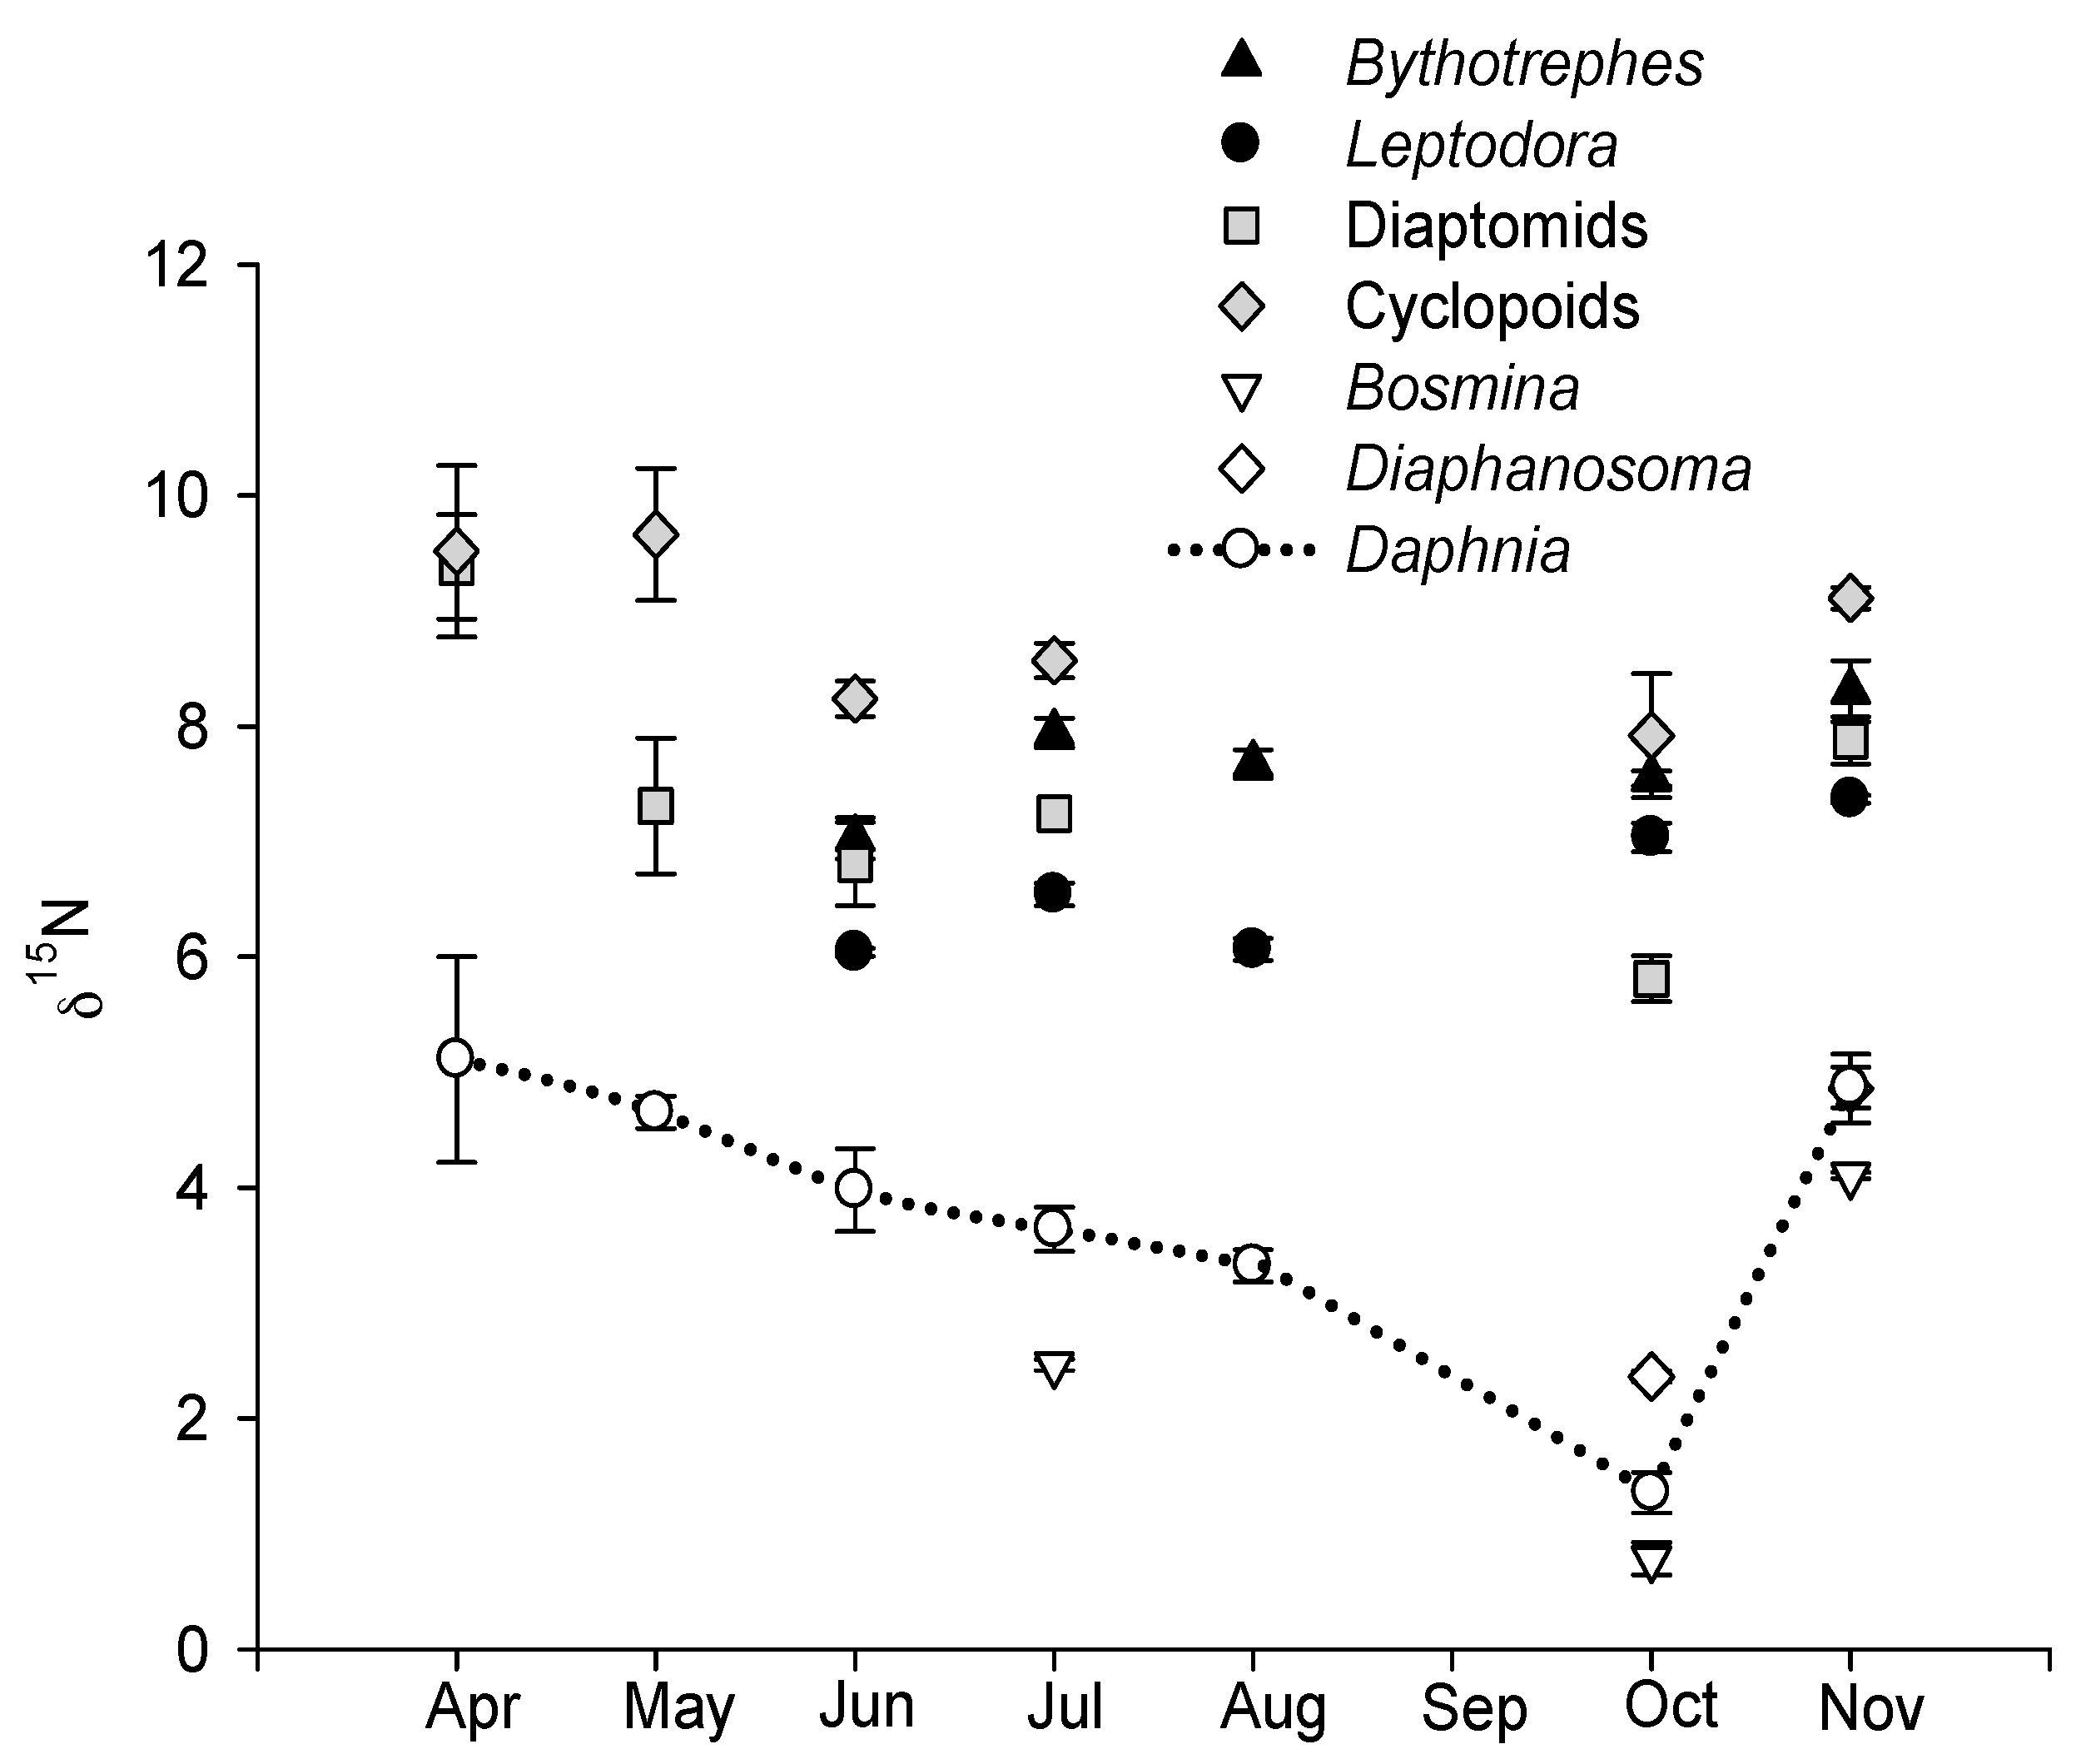
3.2. Seasonal Variation in δ15N and Determination of Trophic Levels

The δ15N seasonal pattern was the same for all zooplankton taxa, with more N-enriched values in early spring and late autumn, and less δ15N-enriched values during the warm months (Figure 2). The seasonal variation in δ15N was more pronounced in primary than in secondary consumers, as the predatory taxa Bythotrephes, Leptodora, and cyclopoid copepods had a small δ15N range (NR) of 1.27‰, 1.32‰, and 1.74‰, respectively, whilst Daphnia, Bosmina, Diaphanosoma, and Eudiaptomus had a wider NR range of 3.75‰, 3.32‰, 3.57‰, and 2.50‰, respectively.
Cyclopoid copepods were the most δ15N-enriched group, with δ15N ranging between 7.92‰ in October and 9.67‰ in May, and with a Fmax of 6.6‰.
On average, predatory cladocerans were more δ15N-enriched than the pelagic isotopic baseline. The δ15N signature of Daphnia, Bosmina, and Diaphanosoma overlapped (≤5‰), with δ15N of the latter two taxa significantly correlated with Daphnia (p < 0.001; Spearman Rank Correlation coefficient R > 0.9; N = 8, 12, respectively).
Calanoid copepods had enriched δ15N signatures, ranging from 5.81‰ in October to 9.38‰ in April. Δ15N enrichment with respect to the pelagic baseline varied between a maximum of 4.45‰ in October and a minimum of 2.65‰ in April, suggesting a change in trophic feeding level and differential exploitation of food resources.
Using mixing models to quantify the contribution of different prey to predators’ diet, the contribution of the zooplankton preys assimilated by the consumer did not always match the zooplankton prey biomass present in the lake (Figure 3a,b). For example, in July, the estimated proportion of Daphnia and Bosmina in the diet of calanoid copepods was 53.2% and 46.8%, respectively, when Daphnia was present in the lake with a biomass of 80%. In October and November, the diet of calanoids copepods maintained a similar estimated contribution of Daphnia 57.7% and Bosmina 42.3%, when Daphnia was present in the lake with a biomass of 16.9% of total zooplankton biomass.
The diet of Leptodora in July was partitioned between Daphnia and Bosmina with 87.2% and 12.8%, respectively, while in autumn, the 3-linear mixing model indicated a higher consumption of Diaphanosoma (76.6%) than Daphnia (5.9%) and Bosmina (17.5%).
The diet of cyclopoid copepods in October and November was estimated by the mixing model to be 83.1% Bosmina and 16.9% Daphnia, when Bosmina was present in the lake, representing 75% of the total zooplankton biomass.

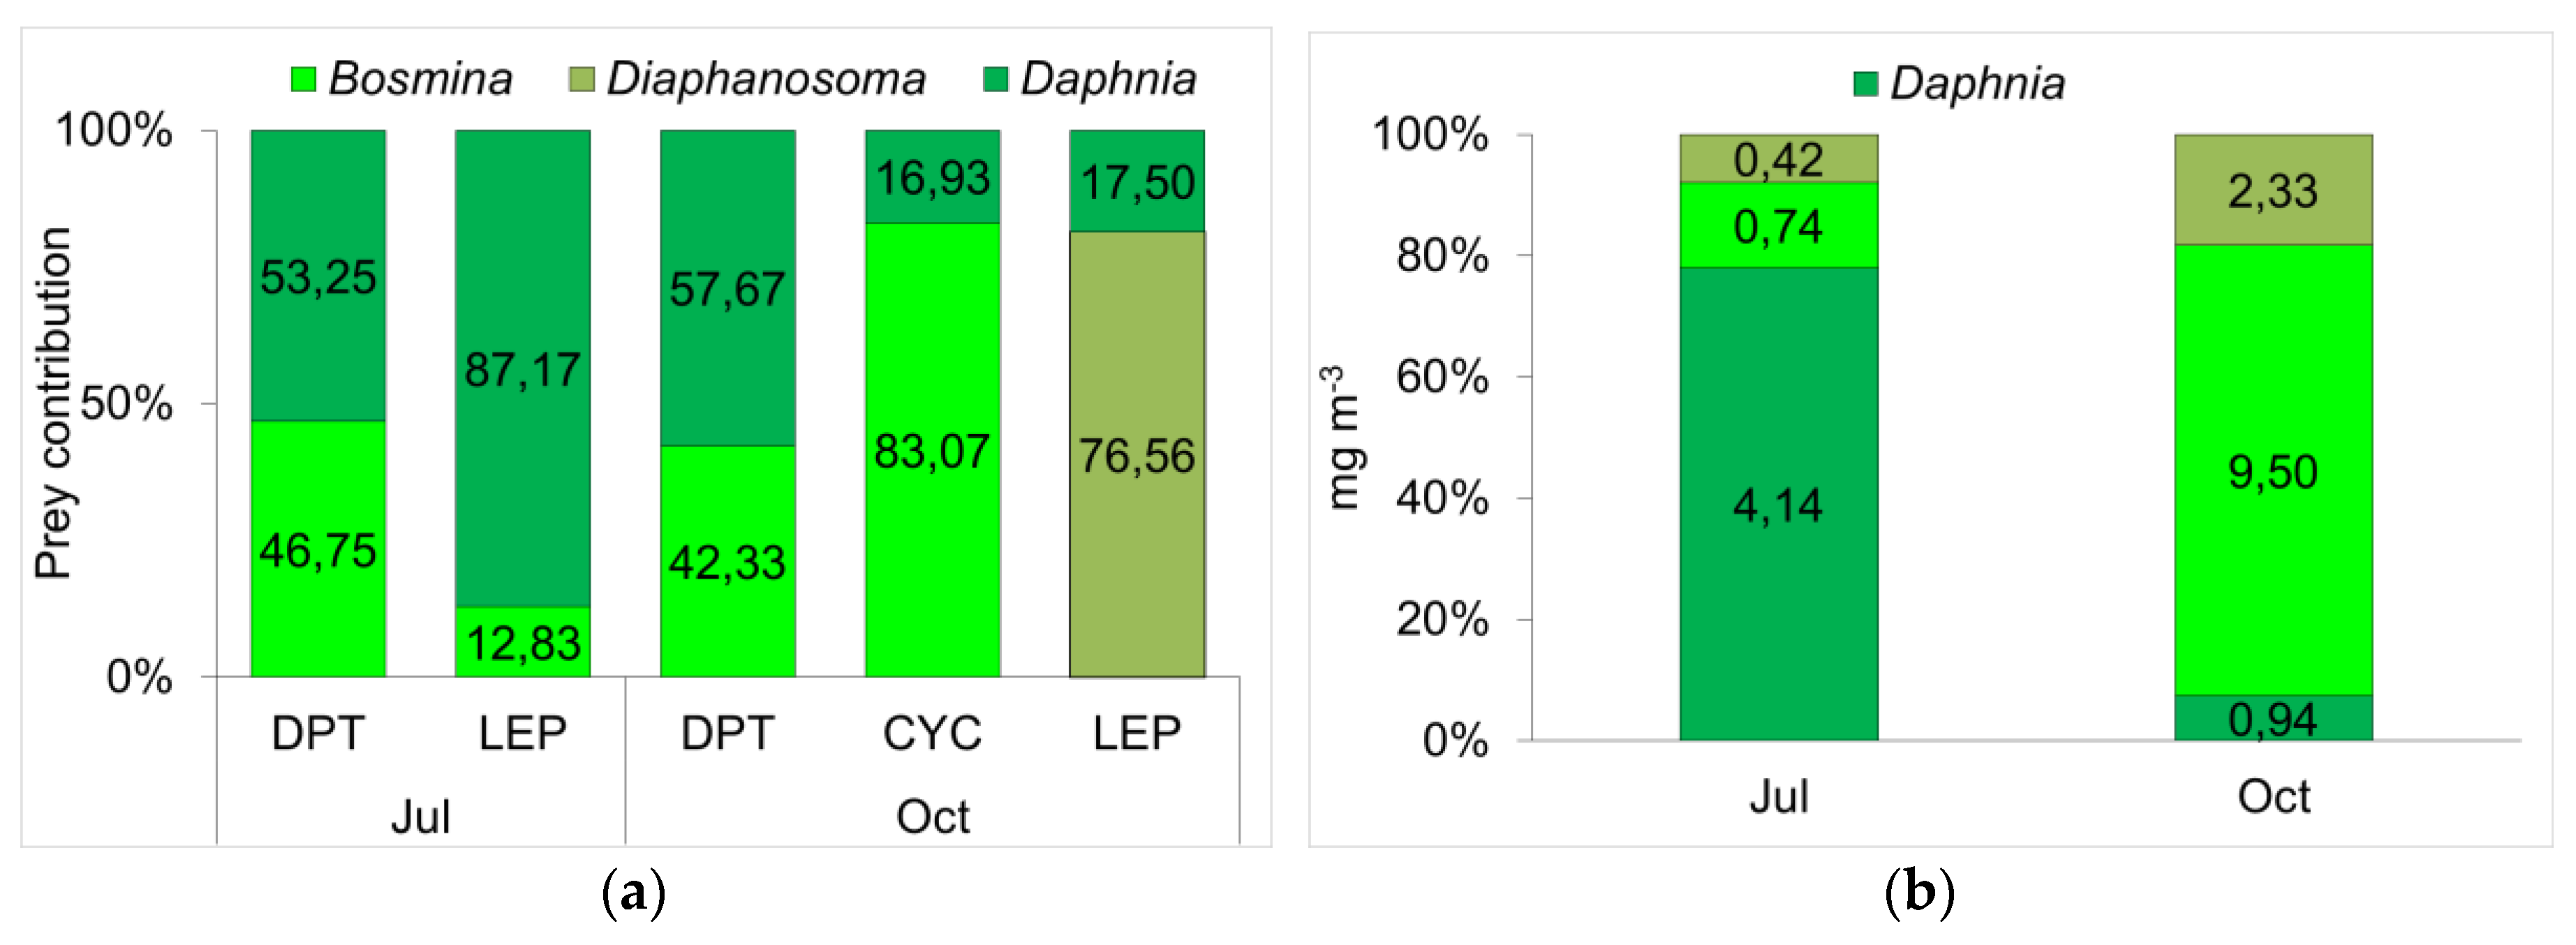
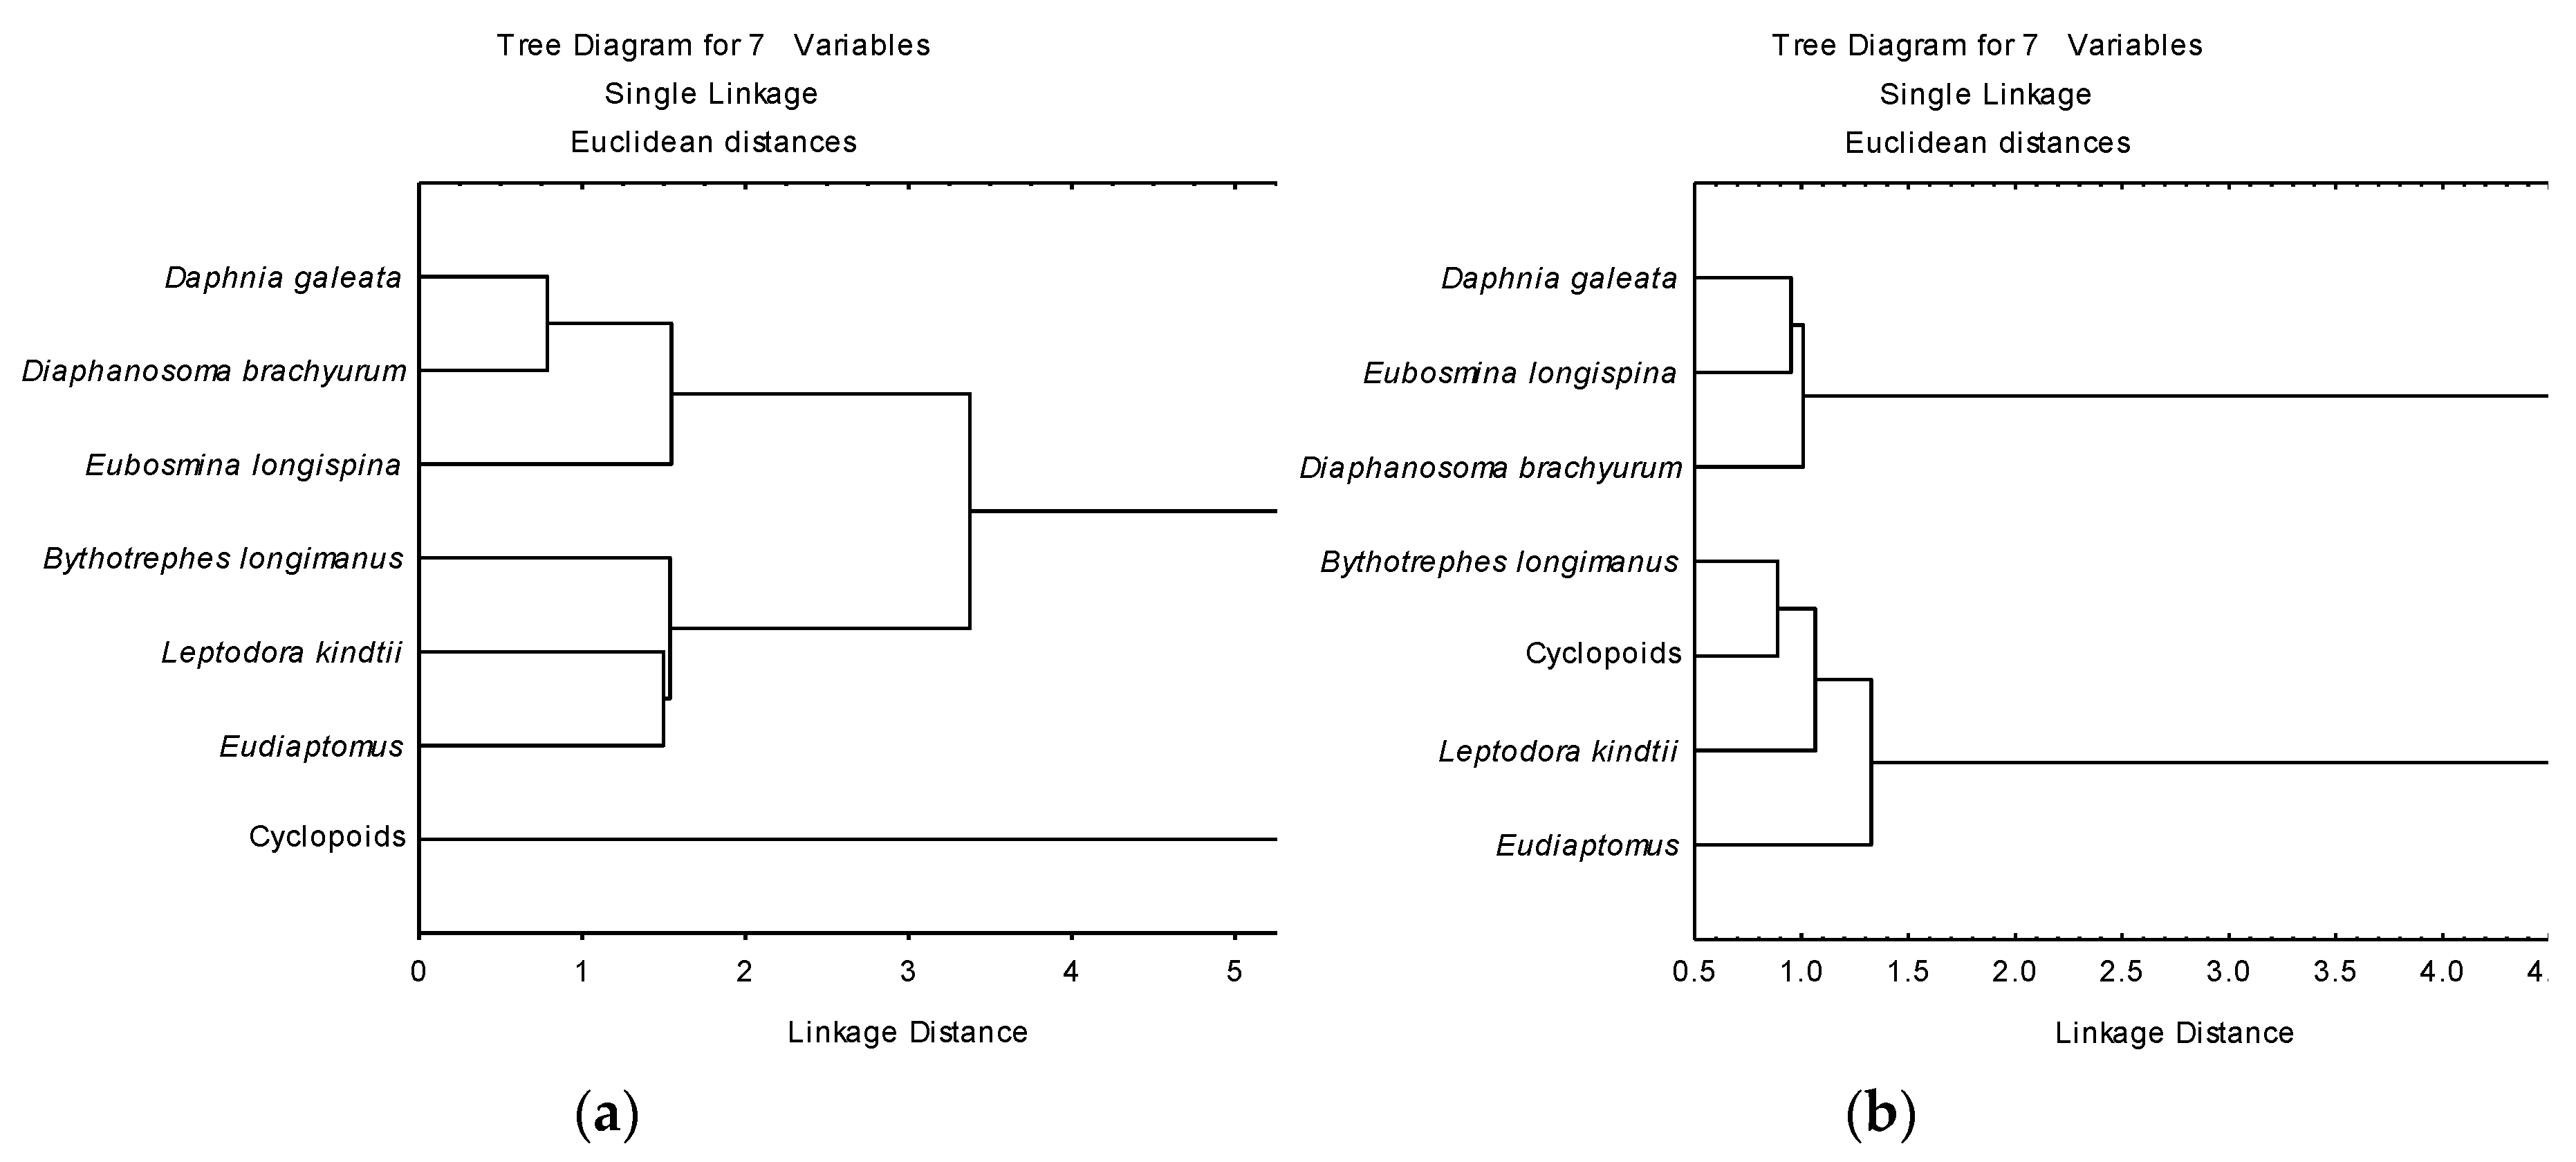
3.3. Determination of Functional Roles from δ13C and δ15N

Cluster analysis of the seasonal variation in δ13C for each taxon (Figure 4a) identified three major groups. The first split of the ordination separates the cyclopoid copepods from the other taxa, most likely as a result of the group utilizing deeper carbon sources in the pelagic zone. Lipid correction applied to δ13C did not affect the seasonal pattern observed in the taxa. The second and further split in the cluster analysis grouped together the primary herbivorous cladocera Daphnia longispina galeata gr., Diaphanosoma brachyurum, and Eubosmina longispina, and the secondary consumers Bythotrephes longimanus, Leptodora kindtii, and calanoid copepods.
Cluster analysis of the seasonal variation in δ15N for each taxon (Figure 4b) clearly grouped the taxa into two functional groups, the primary consumers, D. longispina galeata gr., D. brachyurum, and E. longispina, and the secondary consumers B. longimanus, L. kindtii, and copepods.

4. Discussion

Functional biodiversity measures are based on the functional traits of the species in a community, rather than species richness, as it is interactions that determine the response of the ecosystem to a perturbation [31,32,33]. A methodology to determine the functional diversity within an ecosystem is quantifying the functional relationships between species as the distance measure of the branch length of the connecting functional dendrogram [12]. But it is not just the distance measure or clustering algorithm used that is important, it is the choice of which functional traits to include that is crucial [34].
In this study, we propose to use δ13C signature as a proxy for determining habitat preference and foraging zone by inferring pelagic vs. littoral feeding preferences. We further analyzed the relationship between δ13C taxa signature and phytoplankton succession during the studied year of 2009.
Confounding factors in a dynamic ecosystem like Lake Maggiore include seasonality and predation pressure variation. Seasonal changes in the littoral and pelagic δ13C isotopic baseline were identified by a temporal shift towards less 13C-depleted values in the summer, which is a trend commonly observed in thermally-stratified lakes [35,36]. In lacustrine systems, δ13C and δ15N of suspended particulate matter (seston) varies seasonally [37] because of differences in the allochthonous input, phytoplankton species composition, and primary productivity [38,39]. In Lake Maggiore, it has been demonstrated that δ13C of the primary consumer Daphnia longispina galeata gr. tracks the isotopic composition of seston (50 ≤ size ≤ 126 μm) and of the pelagic baseline [16,35]. The choice of Daphnia as a useful isotopic baseline is supported by other studies [27], considering this taxa as a short-lived organism suited for fine scale temporal integration of pelagic δ13C or δ15N signatures.
If we consider the phytoplankton component of seston, there is variation in the fractionation of δ13C between phytoplankton groups, with Chrysophycee and Bacillariophycee being more depleted in δ13C than Cyanobacteria [37]. In Lake Maggiore, Bacillariophycee are the most dominant phytoplankton group with a high biomass throughout the year [37,40]. In the year of our study (2009), a peak in the Bacillariophycee biomass of Aulacoseira sp., Asterionella sp., and Fragilaria sp. was recorded in spring [37], when the cladoceran Daphnia longispina galeata gr. had the most δ13C-depleted values, while when Cyanobacteria biomass increased in the lake during the summer and autumn, Daphnia longispina galeata gr. had more δ13C-enriched values. This is suggestive of the opportunist nature of Daphnia longispina galeata gr., feeding on the most abundant component of the phytoplankton.
Rather than simply attributing organisms to different trophic groups per se from isolated values of δ15N, we analyzed the seasonal variation in δ13C and δ15N fractionation to identify changes in trophic interactions and feeding niche change. Daphnia longispina galeata gr., Diaphanosoma brachyurum, and Eubosmina longispina can be grouped into a “primary consumer” functional group from their δ13C and δ15N isotopic signatures and known trophic interactions. Determination of functional groups is important and consensus is being placed on the importance of how species are likely to react to a perturbation, which is particularly crucial in considering the consequences of species loss. In the cluster analysis we performed, the grouping of the δ13C and δ15N isotopic signature of the herbivorous cladocerans Daphnia longispina galeata gr. and Diaphanosoma brachyurum, indicates a use of the same seasonal carbon pool. This is also confirmed by the similar values of the two cladoceran taxa in their δ13C signature. The position of Eubosmina in the cluster analysis might show a slightly different use of food resources, a hypothesis confirmed by its δ13C depletion values observed in November. These results indicate a deviation in dietary sources and a possible shift towards a more selective feeding strategy for phytoplankton [29,41] over the winter, as phytoplankton tends to be more δ13C-depleted than detritus [28,41,42].
A redundant species can be generically defined as one that co-exists with an overlapping functional role and trophic niche to other species [5] in a community.
Bythotrephes is a cladoceran known to actively predate on Daphnia [43], which was indicated by its trophic δ15N enrichment in comparison to Daphnia. However, in our study, when Daphnia was scarce in the lake in October and November, Bythotrephes seemed to switch its feeding preference to Diaphanosoma as its prey. This diet switching from Daphnia to Diaphanosoma during periods of Daphnia scarcity was also observed for Leptodora, as the δ15N of Leptodora did not indicate that they fed on calanoid or cyclopoid copepods, rather that they preferentially exploit cladocerans.
Thus, the results in our study might indicate that Daphnia longispina galeata gr. and Diaphanosoma brachyurum are redundant species in the zooplankton community of Lake Maggiore, as their trophic roles are overlapping and interchangeable. Our hypothesis is further supported by the well-known interspecific competition of these two taxa for the same food sources in lakes [44].
The δ13C signature of calanoid copepods in our study was more depleted than the Daphnia δ13C signature. This has been observed in previous studies on freshwater zooplankton [28,38,41], and has been attributed to the calanoid copepods omnivorous diet of seston and small zooplankton like Eubosmina and rotifers [45,46,47,48].
The δ15N isotopic signature of calanoid copepods showed a trophic stepwise enrichment in comparison to Daphnia and Eubosmina, indicative of a predator-prey relationship. This was confirmed by the results of the linear mixing model [18], showing that calanoid copepods preyed on Daphnia and Eubosmina in similar percentages in spring and in autumn. Although herbivorous during some life stages, copepods are one of the main groups of invertebrate predators in limnetic and littoral inland waters [45].
In our study, cyclopoid copepods occupied a distinct functional group from the other secondary consumers, being the most 15N -enriched zooplankton group in the lake during the year. We recorded highly δ13C depleted values for cyclopoid copepods, and a high fractionation with respect to the pelagic baseline (F ~ 7.6), suggesting that cyclopoids may be relying upon deeper carbon sources than those exploited by Daphnia. In deep lakes, the carbon isotopic signature is strongly influenced by depth, with organisms living in deeper layers characterized by more negative values than those living closer to the surface and in the littoral zone [42,49,50]. Moreover, in oligotrophic clear lakes, especially in periods of water column stratification, it is common to have a gradient of δ13C POM (Particulate Organic Matter) with depth [51,52]. Matthew and Mazumder (2006) conducting a study in the oligotrophic Council Lake, recorded a δ13C of POM decrease with depth in the water column, and zooplankton taxa at deeper depths also had a lower δ13C. Our hypothesis is reinforced by the cluster analysis with δ13C values, which clearly show that cyclopoid copepods represented a distinct group, indicating a different utilization of carbon sources than other zooplankters, possibly found in deeper parts of the pelagic zone [49,53,54,55].
Because seasonal changes in the δ13C isotopic baseline were identified by a temporal shift towards less 13C depleted values in the littoral in the summer, this enabled the determination of the preferred foraging habitat of zooplankton taxa. The seasonal trend of cyclopoid copepods δ13C values could also be related to the observed presence of the plankivorous fish roach (Rutilus rutilus) in the lake during the summer, as a predation-avoidance strategy by cyclopoid copepods from the increase in predator pressure in the pelagic. The δ13C -enrichment observed in cyclopoid copepods in autumn may be explained by their return to the upper part of the pelagic zone when roach have migrated to the littoral zone to spawn [35].
The variation in δ15N of Bythotrephes could also be related to the presence or absence of plankivorous fish in the pelagic zone, as they exhibit δ15N depletion for the entirety of the period when plankivorous fish are feeding in the pelagic [35]. δ15N enrichment increases when the predation-pressure decreases. As the variation of δ15N between prey-predator decreases with niche occupation of increasing trophic levels, it is likely to be led by a top-down mechanism.
Cluster analysis with δ15N seasonal variation clearly split the zooplankton taxa into two functional groups, the primary consumers, Daphnia longispina galeata gr., Diaphanosoma brachyurum, and Eubosmina longispina, and the secondary consumers, Bythotrephes longimanus, Leptodora kindtii, and the copepods. The secondary consumers were more 15N -enriched than primary consumers. Cyclopoid copepods were feeding on the highest trophic level, which can be estimated to be 2–3 trophic levels higher than the primary producers, depending on whether a fractionation factor of 2.55 [29] or 3.4‰ [14] is used.
In this study, three or four trophic levels were identified in crustacean zooplankton of Lake Maggiore. In bio-magnification and energy and matter transfer in a pelagic food web, zooplankton is considered a crucial link between the primary producers and fish. In bio-energetic models, zooplankton are categorized as a “source” [56], or pooled into a singular grouping [57] of the trophic level of 2 [58,59], without taking into account species-specific traits or differences in life stage. Because the relative biomass of zooplankton taxa can significantly change during a calendar year [60], and because trophic positions of taxa and their relationships are dynamic during the year, we can conclude that freshwater zooplankton cannot be clustered together in the same ecological compartment. We propose the inclusion of seasonality and the dynamic of species trophic roles of zooplankton in the construction of models predicting bio-magnification capability.
In our study, we have demonstrated that the use of δ13C and δ15N stable isotope analysis represents an effective way to investigate the relationships present in the zooplankton community of a lake. In fact, the preferred habitat, food selectivity, and trophic position of each species could be defined. Through the use of δ13C and δ15N stable isotopes as a proxy of zooplankton functional traits, we can gain a better understanding of the ecological roles of the zooplankton species in the lake and thus define the functional diversity of the ecosystem. Moreover, combining the use of δ13C and δ15N stable isotopes with dietary analysis, we provided evidence that this could be an effective approach to infer functional groups, helping us understand the impact of functional differences in resource use. In particular, we have demonstrated that seasonal variations of δ13C and δ15N stable isotopes indicated a dynamic process of change in the relationships among zooplankton taxa, according to the different availability of food sources and of potential bottom-up and top-down (in particular fish predation) mechanisms present in the lake.

Acknowledgments

This study was funded by the CIPAIS (Commissione Internazionale per la Protezione delle Acque Italo-Svizzere) within the research program ‘Research on the evolution of Lake Maggiore, Italy. Limnological studies. 2008–2012’. The authors would like to dedicate this paper to the memory of Giuseppe Morabito, limnologist and expert in freshwater phytoplankton ecology, who significantly contributed to the morpho-functional characterization of phytoplankton of subalpine deep lakes. He loved water, where he felt in perfect harmony and in which he found comfort and peace also during the course of his illness. We wish to thank three anonymous reviewers for critical comments that greatly contributed to improve the paper.

Author Contributions

M.M. conceived and designed the experiments; A.V., A.F., and R.P. performed the laboratory analysis; M.M. and A.V. analyzed the data; R.C. and A.V. wrote the paper with the contribution of other authors; R.R. helped with the Discussion.

Conflicts of Interest

The authors declare no conflict of interest.

References

  1. Moss, B.R. Ecology of Fresh Waters: Man and Medium, Past to Future; John Wiley & Sons: Hoboken, NJ, USA, 2009. [Google Scholar]
  2. Barnett, A.J.; Finlay, K.; Beisner, B.E. Functional diversity of crustacean zooplankton communities: Towards a trait-based classification. Freshwat. Biol. 2007, 52, 796–813. [Google Scholar] [CrossRef]
  3. Dı́az, S.; Cabido, M. Vive la difference: Plant functional diversity matters to ecosystem processes. Trends Ecol. Evol. 2001, 16, 646–655. [Google Scholar] [CrossRef]
  4. Tilman, D.; Knops, J.; Wedin, D.; Reich, P.; Richie, P.; Siemann, E. The influence of functional diversity and composition on ecosystem processes. Science 1997, 277, 1300–1302. [Google Scholar] [CrossRef]
  5. Walker, B.; Kinzig, A.; Langridge, J. Plant attribute diversity, resilience, and ecosystem function: The nature and significance of dominant and minor species. Ecosystems 1999, 2, 95–113. [Google Scholar] [CrossRef]
  6. Elton, C.S. Animal Ecology; University of Chicago Press: Chicago, IL, USA, 1927; p. 260. [Google Scholar]
  7. Leibold, M.A. The niche concept revisited: Mechanistic models and community context. Ecology 1995, 76, 1371–1382. [Google Scholar] [CrossRef]
  8. Petchey, O.L.; Gaston, K.J. Functional diversity: Back to basics and looking forward. Ecol. Lett. 2006, 9, 741–758. [Google Scholar] [CrossRef] [PubMed]
  9. Mouchet, M.A.; Villeger, S.; Mason, N.W.; Mouillot, D. Functional diversity measures: An overview of their redundancy and their ability to discriminate community assembly rules. Funct. Ecol. 2010, 24, 867–876. [Google Scholar] [CrossRef]
  10. Loseto, L.L.; Stern, G.A.; Ferguson, S.H. Size and biomagnification: How habitat selection explains beluga mercury levels. Environ. Sci. Technol. 2008, 42, 3982–3988. [Google Scholar] [CrossRef] [PubMed]
  11. Forest, A.; Sampei, M.; Makabe, R.; Sasaki, H.; Barber, D.G.; Gratton, Y.; Fortier, L. The annual cycle of particulate organic carbon export in Franklin Bay (Canadian Artica): Environmental control and food web implications. J. Geophys. Res. Oceans 2008, 113, C03S05. [Google Scholar]
  12. Petchey, O.L.; Gaston, K.J. Functional diversity (FD), species richness and community composition. Ecol. Lett. 2002, 5, 402–411. [Google Scholar] [CrossRef]
  13. Peterson, B.J.; Fry, B. Stable isotopes in ecosystem studies. Annu. Rev. Ecol. Syst. 1987, 18, 293–320. [Google Scholar] [CrossRef]
  14. Post, D.M. Using stable isotopes to estimate trophic position: Models, methods, and assumptions. Ecology 2002, 83, 703–718. [Google Scholar] [CrossRef]
  15. Minagawa, M.; Wada, E. Stepwise enrichment of 15N along food chains: Further evidence and the relation between δ15N and animal age. Geochim. Cosmochim. Acta 1984, 48, 1135–1140. [Google Scholar] [CrossRef]
  16. Visconti, A.; Manca, M. Seasonal changes in the δ13C and δ15N signatures of the Lago Maggiore pelagic food web. J. Limnol. 2011, 70, 263–271. [Google Scholar] [CrossRef]
  17. Szepanski, M.M.; Ben-David, M.; Van Ballenberghe, V. Assessment of anadromous salmon resources in the diet of the Alexander Archipelago wolf using stable isotope analysis. Oecologia 1999, 120, 327–335. [Google Scholar] [CrossRef] [PubMed]
  18. Phillips, D.L. Mixing models in analyses of diet using multiple stable isotopes: A critique. Oecologia 2001, 127, 166–170. [Google Scholar] [CrossRef] [PubMed]
  19. Phillips, D.L.; Gregg, J.W. Uncertainty in source partitioning using stable isotopes. Oecologia 2001, 127, 171–179. [Google Scholar] [CrossRef] [PubMed]
  20. De Bernardi, R.; Giussani, G.; Manca, M.; Ruggiu, D. Trophic status and the pelagic system in Lago Maggiore. Hydrobiologia 1990, 191, 1–8. [Google Scholar] [CrossRef]
  21. Guilizzoni, P.; Marchetto, A.; Lami, A.; Gerli, S.; Musazzi, S. Use of sedimentary pigments to infer past phosphorus concentration in lakes. J. Paleolimnol. 2011, 45, 433–445. [Google Scholar] [CrossRef]
  22. Manca, M.; Ruggiu, L. Consequences of pelagic food-web changes during a long-term lake oligotrophication process. Limnol. Oceanogr. 1998, 43, 1368–1373. [Google Scholar] [CrossRef]
  23. McCutchan, J.H.; Lewis, W.M.; Kendall, C.; McGrath, C.C. Variation in trophic shift for stable isotope ratios of carbon, nitrogen, and sulfur. Oikos 2003, 102, 378–390. [Google Scholar] [CrossRef]
  24. DeNiro, M.J.; Epstein, S. Influence of diet on the distribution of nitrogen isotopes in animals. Geochim. Cosmochim. Acta 1981, 45, 341–351. [Google Scholar] [CrossRef]
  25. Matthews, B.; Mazumder, A. Temporal variation in body composition (C: N) helps explain seasonal patterns of zooplankton δ13C. Freshwat. Biol. 2005, 50, 502–515. [Google Scholar] [CrossRef]
  26. McConnaughey, T.; McRoy, C.P. Food-web structure and the fractionation of carbon isotopes in the Bering Sea. Mar. Biol. 1979, 53, 257–262. [Google Scholar] [CrossRef]
  27. Matthews, B.; Mazumder, A. Compositional and interlake variability of zooplankton effect baseline stable isotope signatures. Limnol. Oceanogr. 2003, 48, 1977–1987. [Google Scholar] [CrossRef]
  28. Kiljunen, M.; Grey, J.; Sinisalo, T.; Harrod, C.; Immonen, H.; Jones, R.I. A revised model for lipid-normalizing δ13C values from aquatic organisms, with implications for isotope mixing models. J. Appl. Ecol. 2006, 43, 1213–1222. [Google Scholar] [CrossRef]
  29. Petchey, O.L.; Gaston, K.J. Dendrograms and measuring functional diversity. Oikos 2007, 116, 1422–1426. [Google Scholar] [CrossRef]
  30. Petchey, O.L.; Hector, A.; Gaston, K.J. How do different measures of functional diversity perform? Ecology 2004, 85, 847–857. [Google Scholar] [CrossRef]
  31. McCann, K.S. The diversity–stability debate. Nature 2000, 405, 228–233. [Google Scholar] [CrossRef] [PubMed]
  32. Woodward, G.; Papantoniou, G.; Edwards, F.; Lauridsen, R.B. Trophic trickles and cascades in a complex food web: Impacts of a keystone predator on stream community structure and ecosystem processes. Oikos 2008, 117, 683–692. [Google Scholar] [CrossRef]
  33. Petchey, O.L.; O’Gorman, E.J.; Flynn, D.F. A functional guide to functional diversity measures. In Biodiversity, Ecosystem Functioning, and Human Wellbeing. An Ecological and Economic Perspective; Oxford University Press: Oxford, UK, 2009; pp. 49–60. ISBN 9780199547951. [Google Scholar]
  34. Visconti, A.; Volta, P.; Fadda, A.; Di Guardo, A.; Manca, M. Seasonality, littoral versus pelagic carbon sources, and stepwise 15N-enrichment of pelagic food web in a deep subalpine lake: the role of planktivorous fish. Can. J. Fish. Aquat. Sci. 2013, 71, 436–446. [Google Scholar] [CrossRef]
  35. Poma, G.; Volta, P.; Roscioli, C.; Bettinetti, R.; Guzzella, L. Concentrations and trophic interactions of novel brominated flame retardants, HBCD, and PBDEs in zooplankton and fish from Lake Maggiore (Northern Italy). Sci. Total Environ. 2014, 481, 401–408. [Google Scholar] [CrossRef] [PubMed]
  36. Lehmann, M.F.; Bernasconi, S.M.; Barbieri, A.; Simona, M.; McKenzie, J.A. Interannual variation of the isotopic composition of sedimenting organic carbon and nitrogen in Lake Lugano: A long-term sediment trap study. Limnol. Oceanogr. 2004, 49, 839–849. [Google Scholar] [CrossRef]
  37. Caroni, R.; Free, G.; Visconti, A.; Manca, M. Phytoplankton functional traits and seston stable isotopes signature: A functional-based approach in a deep, subalpine lake, Lake Maggiore (N. Italy). J. Limnol. 2012, 71, 84–94. [Google Scholar] [CrossRef] [Green Version]
  38. Grey, J.; Jones, R.I.; Sleep, D. Seasonal changes in the importance of the source of organic matter to the diet of zooplankton in Loch Ness, as indicated by stable isotope analysis. Limnol. Oceanogr. 2001, 46, 505–513. [Google Scholar] [CrossRef]
  39. Vuorio, K.; Meili, M.; Sarvala, J. Taxon-specific variation in the stable isotopic signatures (δ13C and δ15N) of lake phytoplankton. Freshwat. Biol. 2006, 51, 807–822. [Google Scholar] [CrossRef]
  40. Morabito, G.; Sili, C.; Panzani, P.; Oggioni, A. Dinamica stagionale e distribuzione orizzontale di fitoplancton, carbonio organico e batterio plankton: Struttura dei popolamenti fitoplanctonici. In Ricerche Sull’evoluzione del Lago Maggiore. Aspetti Limnologici. Programma Quinquennale 2008–2012; Commissione Internazionale per la Protezione delle Acque Italo-Svizzere; ISSN 1013-8099. 2009; pp. 53–66. Available online: http://www.cipais.org/pdf/Limno_Maggiore_-_Rapporto_2009.pdf (accessed on 26 January 2018).
  41. Grey, J.; Jones, R.I.; Sleep, D. Stable isotope analysis of the origins of zooplankton carbon in lakes of differing trophic state. Oecologia 2000, 123, 232–240. [Google Scholar] [CrossRef] [PubMed]
  42. Jones, R.I.; Grey, J.; Sleep, D.; Quarmby, C. An assessment, using stable isotopes, of the importance of allochthonous organic carbon sources to the pelagic food web in Loch Ness. Proc. R. Soc. Lond. B Biol. Sci. 1998, 265, 105–110. [Google Scholar] [CrossRef]
  43. Manca, M.; Vijverberg, J.; Polishchuk, L.; Voronov, D.A. Daphnia body size and population dynamics under predation by invertebrate and fish predators in Lago Maggiore: An approach based on contribution analysis. J. Limnol. 2008, 67, 15–21. [Google Scholar] [CrossRef]
  44. Matveev, V.F. Effect of Competition on the Demography of Planktonic Cladocerans: Daphnia and Diaphanosoma. Oecologia 1987, 74, 468–477. [Google Scholar] [CrossRef] [PubMed]
  45. Brandl, Z. Freshwater copepods and rotifers: Predators and their prey. Hydrobiologia 2005, 546, 475–489. [Google Scholar] [CrossRef]
  46. Williamson, C.E.; Butler, N.M. Predation on rotifers by the suspension-feeding calanoid copepod Diaptomus pallidus. Limnol. Oceanogr. 1986, 31, 393–402. [Google Scholar] [CrossRef]
  47. Kling, G.W.; Fry, B.; O’Brien, W.J. Stable isotopes and planktonic trophic structure in arctic lakes. Ecology 1992, 73, 561–566. [Google Scholar] [CrossRef]
  48. Luecke, C.; O’Brien, W.J. The effect of Heterocope predation on zooplankton communities in arctic ponds. Limnol. Oceanogr. 1993, 28, 367–377. [Google Scholar] [CrossRef]
  49. Vander Zanden, M.J.; Rasmussen, J.B. Primary consumer δ13C and δ15N and the trophic position of aquatic consumers. Ecology 1999, 80, 1395–1404. [Google Scholar] [CrossRef]
  50. Vander Zanden, M.J.; Chandra, S.; Park, S.K.; Vadeboncoeur, Y.; Goldman, C.R. Efficiencies of benthic and pelagic trophic pathways in a subalpine lake. Can. J. Fish. Aquat. Sci. 2006, 63, 2608–2620. [Google Scholar] [CrossRef]
  51. Cattaneo, A.; Manca, M.; Rasmussen, J.B. Peculiarities in the stable isotope composition of organisms from an alpine lake. Aquat. Sci. 2004, 66, 440–445. [Google Scholar] [CrossRef]
  52. Post, D.M.; Pace, M.L.; Hairston, N.G. Ecosystem size determines food-chain length in lakes. Nature 2002, 405, 1047–1049. [Google Scholar] [CrossRef] [PubMed]
  53. Quay, P.D.; Emerson, S.R.; Quay, B.M.; Devol, A.H. The carbon cycle for Lake Washington—A stable isotope study. Limnol. Oceanogr. 1986, 31, 596–611. [Google Scholar] [CrossRef]
  54. Del Giorgio, P.A.; France, R.L. Ecosystem-specific patterns in the relationship between zooplankton and POM or microplankton δ13C. Limnol. Oceanogr. 1996, 41, 359–365. [Google Scholar] [CrossRef]
  55. Jeppesen, E.; Søndergaard, M.; Christoffersen, K.; Theil-Nielsen, J.; Jürgens, K. Cascading trophic interactions in the littoral zone: An enclosure experiment in shallow Lake Stigsholm, Denmark. Arch. Hydrobiol. 2002, 153, 533–555. [Google Scholar] [CrossRef]
  56. Barwick, M.; Maher, W. Biotransference and biomagnification of selenium copper, cadmium, zinc, arsenic and lead in a temperate seagrass ecosystem from Lake Macquarie Estuary, NSW, Australia. Mar. Environ. Res. 2003, 56, 471–502. [Google Scholar] [CrossRef]
  57. Paterson, M.J.; Rudd, J.W.; St. Louis, V. Increases in Total and Methylmercury in Zooplankton following Flooding of a Peatland Reservoir. Environ. Sci. Technol. 1998, 32, 3868–3874. [Google Scholar] [CrossRef]
  58. Connolly, J.P.; Pedersen, C.J. A thermodynamic-based evaluation of organic chemical accumulation in aquatic organisms. Environ. Sci. Technol. 1988, 22, 99–103. [Google Scholar] [CrossRef] [PubMed]
  59. Campfens, J.; Mackay, D. Fugacity-based model of PCB bioaccumulation in complex aquatic food webs. Environ. Sci. Technol. 1997, 31, 577–583. [Google Scholar] [CrossRef]
  60. Morabito, G.; Mazzocchi, M.G.; Salmaso, N.; Zingone, A.; Bergami, C.; Flaim, G.; Accoroni, S.; Basset, A.; Bastianini, M.; Belmonte, G.; et al. Plankton dynamics across the freshwater, transitional and marine research sites of the LTER-Italy Network. Patterns, fluctuations, drivers. Sci. Total Environ. 2017. submitted. [Google Scholar]
Figure 1. Seasonal changes in δ13C signature (mean, ±SE) in pelagic zooplankton taxa of Lake Maggiore in 2009. White symbols refer to primary consumers, grey and black to secondary consumers, with the dotted line referring to the pelagic isotopic baseline.
Water 10 00108 g001
Figure 2. Seasonal changes in δ15N signature (mean, ±SE) in pelagic zooplankton taxa of Lake Maggiore in 2009. White symbols refer to primary consumers, grey and black to secondary consumers, with the dotted line referring to the pelagic isotopic baseline.
Water 10 00108 g002
Figure 3. (a) Comparison between (a) contribution of different preys to the predators’ diet calculated with the 2-em-LMM (JUL) and the 3-em-LMM (OCT-NOV); (b) biomasses (mg m−3) of the potential preys in the sampling moment. Numbers within the bars correspond to calculated percentage values. DPT = calanoids; CYC = cyclopoids; LEP = Leptodora.
Water 10 00108 g003
Figure 4. Cluster analysis of the seasonal variation of (a) δ13C and (b) δ15N for each zooplankton taxa using the Euclidean measure of distance.
Water 10 00108 g004

