Article

Streambank Alluvial Unit Contributions to Suspended Sediment and Total Phosphorus Loads, Walnut Creek, Iowa, USA

1
Department of Natural Resource Ecology and Management, Iowa State University, 2310 Pammel Dr., Ames, IA 50011, USA
2
Iowa Geological Survey, University of Iowa, 340A Trowbridge Hall, Iowa City, IA 52242, USA
3
National Laboratory for Agriculture and the Environment, Agricultural Research Service, United States Department of Agriculture, 2110 University Boulevard, Ames, IA 50011, USA
*
Author to whom correspondence should be addressed.
Water 2018, 10(2), 111; https://doi.org/10.3390/w10020111
Submission received: 16 January 2018 / Revised: 23 January 2018 / Accepted: 25 January 2018 / Published: 28 January 2018
(This article belongs to the Special Issue Streambank Erosion: Monitoring, Modeling and Management)

Abstract

:
Streambank erosion may represent a significant source of sediment and phosphorus (P) to overall watershed loads; however, watershed-scale quantification of contributions is rare. In addition, streambanks are often comprised of highly variable stratigraphic source materials (e.g., alluvial deposits), which may differentially impact in-channel P dynamics once eroded. The objective of this study was to quantify sediment and total phosphorus (TP) losses from four materials comprising streambanks within a 5218 ha watershed in Iowa, USA. Streambank-face surveys, erosion pins, and soil analyses were used to quantify surface area representation, recession, and losses of sediment and TP over a two-year period. Cumulative, whole-bank gross mean recession totaled 18.6 cm over two years, and material-specific gross mean recession ranged from 15.5 to 64.1 cm. Cumulative, whole-bank mean gross mass losses totaled 0.28 Mg sediment and 0.7 × 10⁻⁵ Mg TP per meter channel length. Annual sediment losses equated to 4–44% of historic suspended sediment loads. Stratigraphy was significant in gross material erosion and losses, with lower materials (i.e., bank toe region) exhibiting the greatest recession rates and cumulative recession. Weathered/colluvial material dominated total bank face surface area (88.3%), and contributed the greatest proportion of sediment and TP mass loss (66, 68%, respectively) versus other streambank materials.

Graphical Abstract

1. Introduction

Excessive loadings of sediment and phosphorus (P) to waterways are prime water quality impairments within both the agricultural Midwestern United States of America (USA) and globally [1,2]. Excessive sedimentation negatively impacts aquatic habitat, reduces drinking water reservoir storage capacity, increases drinking water treatment costs, and diminishes waterbody-associated economic and recreational opportunities. Phosphorus is often the limiting nutrient for algal primary production in freshwater systems [3], and excess loading may contribute to accelerated eutrophication, harmful algal blooms (HABs), and coastal hypoxic zones.
A growing body of literature suggests that streambank erosion often represents a significant, albeit highly variable, source of both suspended sediment (SS) and P to stream loads [4]. In the Midwestern and southern USA, studies have documented a wide range of streambank contributions to annual SS loads, with contributions ranging from 25–60% [5,6,7,8,9], up to 80–96% [10,11,12]. In Walnut Creek, recent work by Gellis et al. [13] suggests that in-channel material is the primary source of watershed suspended sediment. Research by Palmer et al. [14] also suggests streambanks as a significant source of Walnut Creek annual suspended sediment loads; however, high variability in annual contributions exists (0–53%). Global studies have documented similar ranges, with streambanks contributing between <19% [15,16,17], and up to 89% [18] of annual suspended sediment loads. Significant, yet highly variable, streambank contributions have also been documented for total phosphorus (TP) annual loads [8,19,20] within the USA and globally [18,21]. However, studies quantifying streambank SS and TP loading remain limited in both number and regional representation [4]. Because of the relative paucity and high variability of data, streambank SS and TP loading is commonly absent from local and regional water quality strategies aimed at reducing nutrient loading, such as the Iowa Nutrient Reduction Strategy (INRS) [22].
Streambank material characteristics (e.g., bulk density, structure, texture) exhibit a high degree of variation at the individual bank and watershed scales [23,24,25,26], and banks in alluvial streams may be comprised of numerous, distinct, stratigraphic alluvial units [27,28]. Material variation among units, along with stratigraphic position, may have significant implications for sediment and P loading, as units may be impacted differently, both spatially and temporally, by specific erosional processes [29,30]. Inherent unit material characteristics (e.g., equilibrium P concentration, degree of P saturation) may influence in-channel P dynamics (e.g., adsorption, desorption) following erosion [31]. Despite the importance of such differences in individual bank materials, the vast majority of studies that aim to quantify streambank sediment and P loading focus solely on whole-bank contributions. Very few studies to date have investigated load contributions from the distinct alluvial units that comprise banks, with many of these focusing on post-European settlement alluvium [32,33,34,35]. For many erosional studies, points of measurement have not been stratified by alluvial unit, but rather by general bank region (e.g., upper, mid, lower bank) [36,37]. In addition, the objectives of these studies have been to elucidate erosional processes spatially and temporally [34,38], and not to quantify annual load contributions.
The overall objective of this study was to quantify sediment and TP loading over a two-year period from four distinct Holocene materials comprising streambanks in Walnut Creek, Iowa, USA. Specific objectives were to assess alluvial unit differences in (i) surface area representation on eroding streambank surfaces; (ii) lateral recession; (iii) sediment mass contribution at the watershed scale; (iv) TP mass contribution at the watershed scale; and (v) erosional response to stream discharge. This study provides a unique, high temporal resolution dataset of alluvial unit-specific erosion and potential contribution to SS and TP loads at the watershed scale. Datasets such as this are valuable for increasing the regional representation of streambank loading studies, informing Total Maximum Daily Loads (TMDLs) and state and basin-wide nutrient reduction strategies, as well as augmenting modeling efforts intent on predicting long-term in-channel P dynamics.

2. Materials and Methods

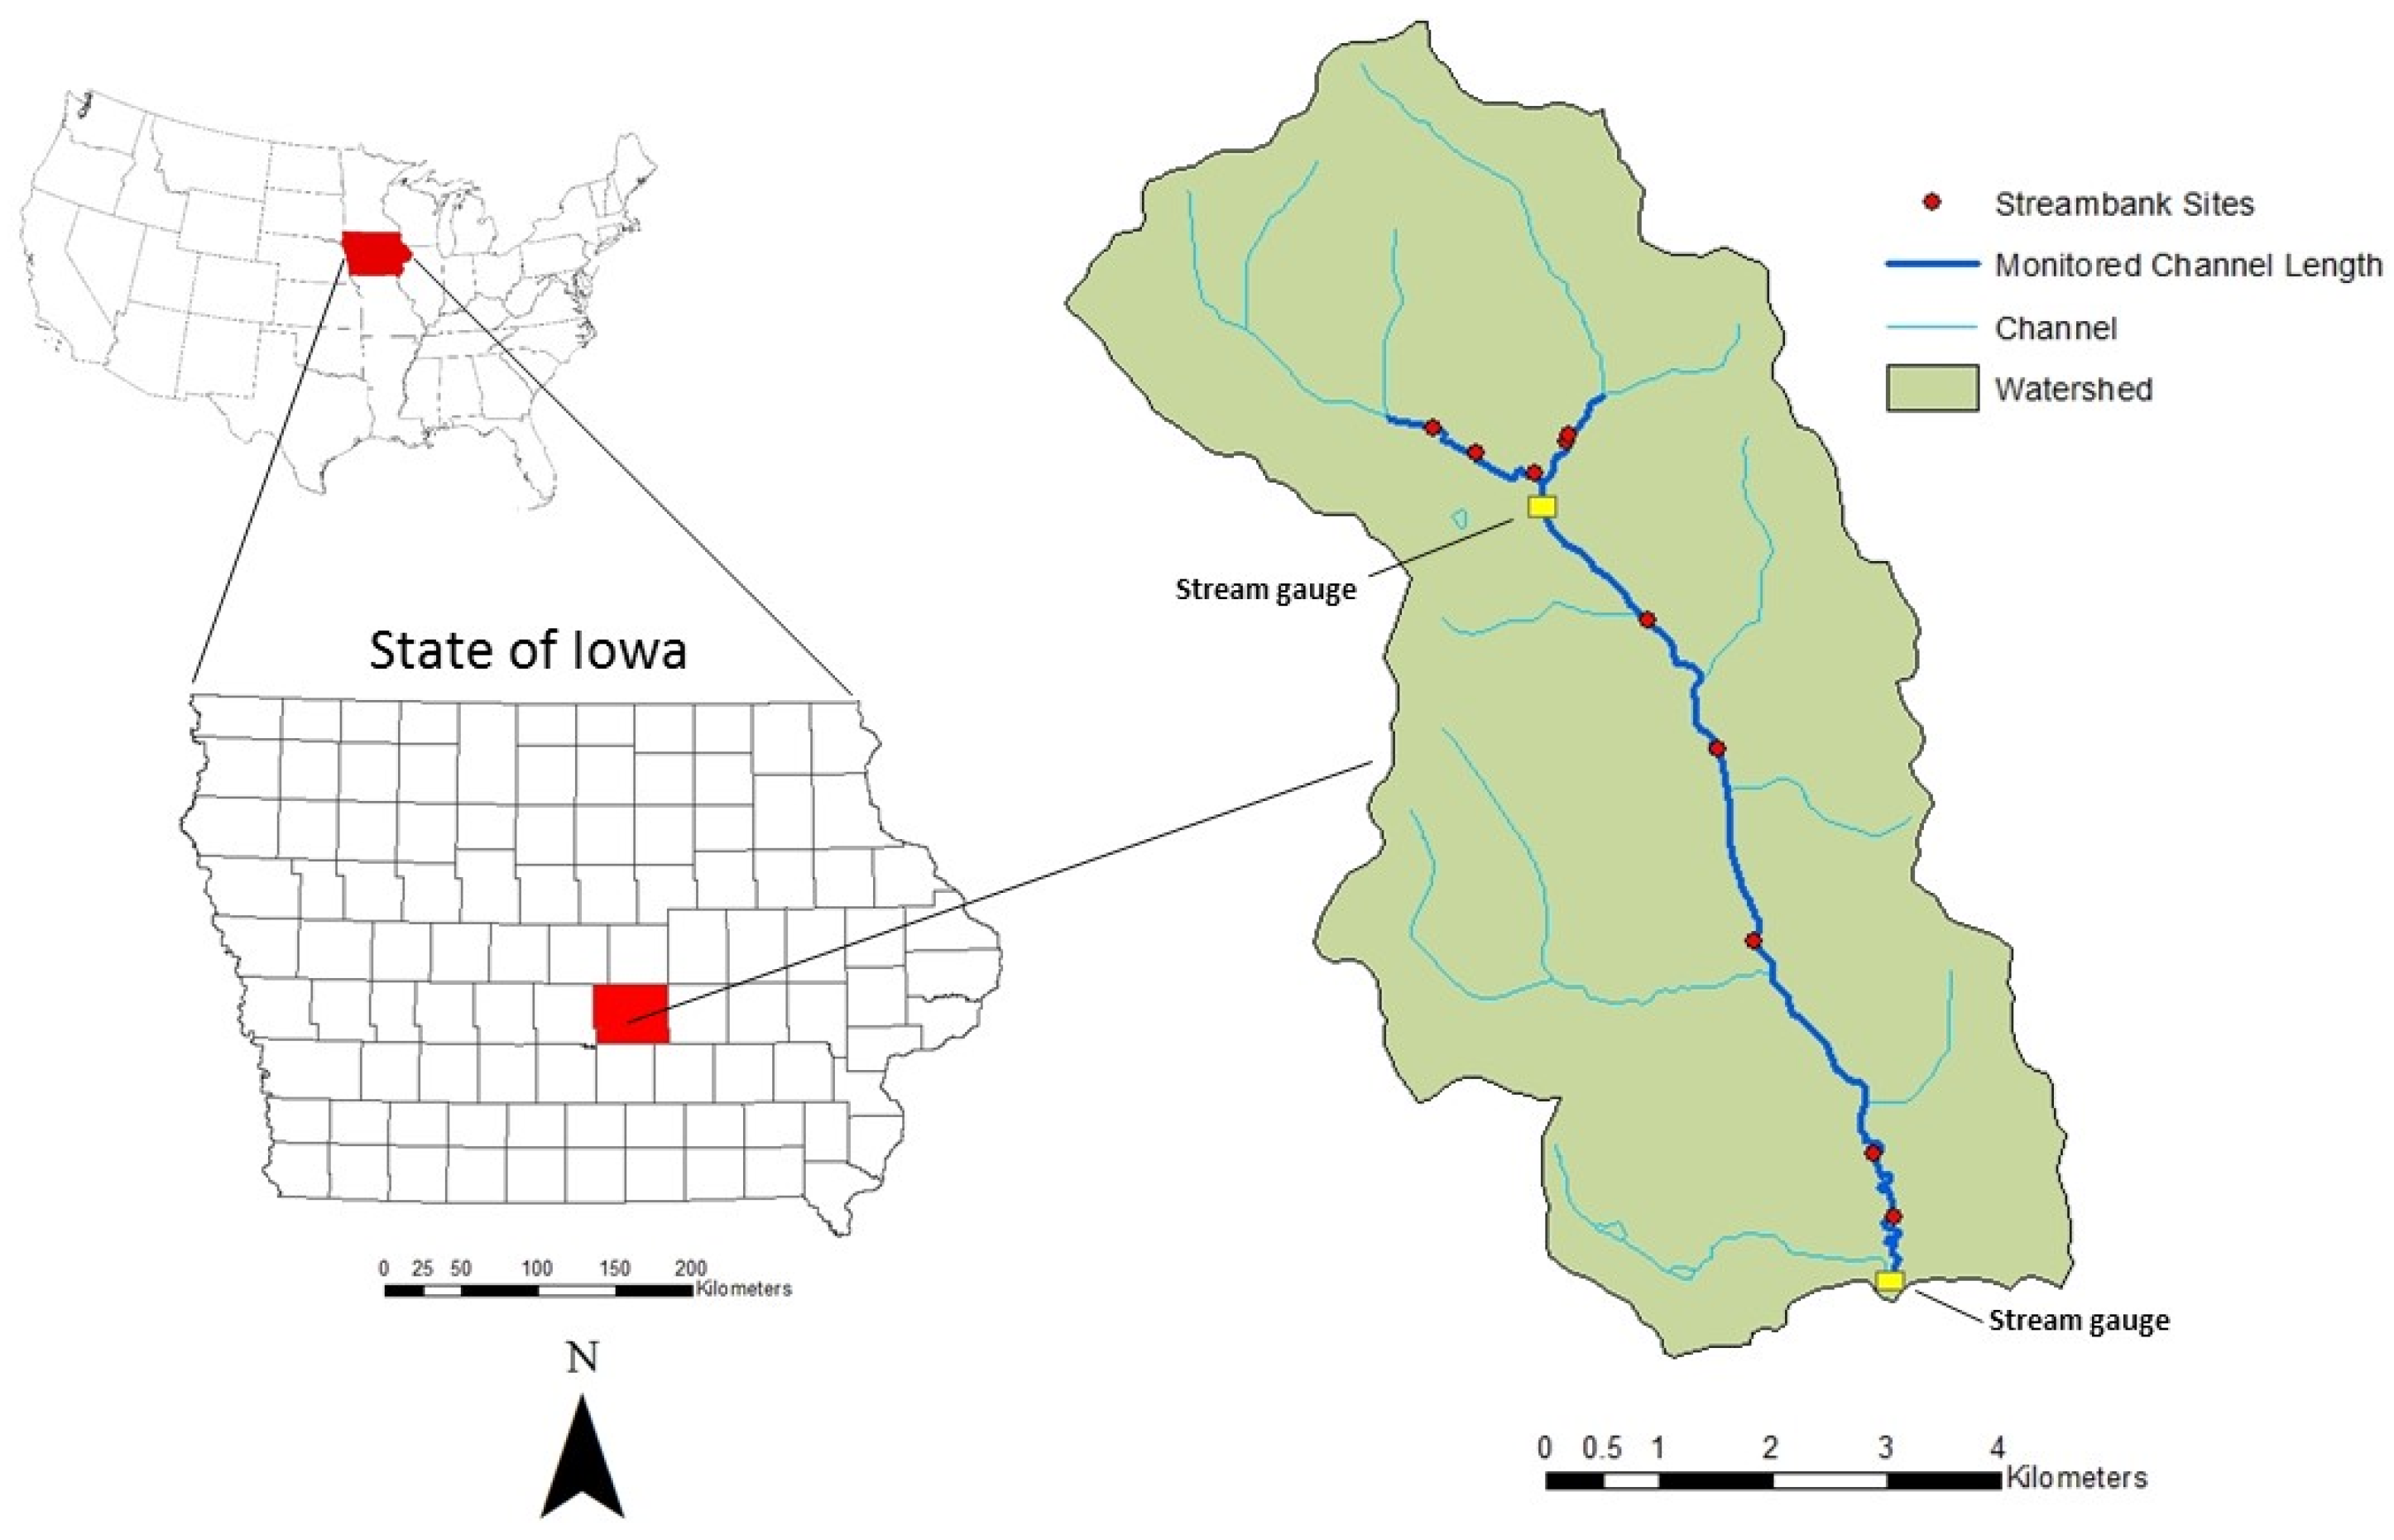
2.1. Watershed Description

Walnut Creek is a perennial, third order stream draining 5218 ha in Jasper County, Iowa (Figure 1). The Walnut Creek watershed is located in the Rolling Loess Prairies Level IV Ecoregion (47f), a region typified by rolling topography and well-developed drainage systems [39]. The ecoregion is a subdivision of the Western Corn Belt Plains Level III Ecoregion (47), which is characterized as having 75% of the land area used for cropland agriculture, and a significant portion of the remaining landscape used for livestock grazing and forage. Walnut Creek is located within a humid, continental region with average annual precipitation of approximately 750 mm. The months of May and June generally exhibit the highest monthly precipitation totals, however, large convective thunderstorms can occur during the summer months and may produce rapid increases in stream discharge.
Watershed land use consists of 54% row crop agriculture (primarily corn-soybean rotation), 36% grassland, and 4% forest, with the remainder comprising roads, farmsteads, and urban areas [40]. Of the grassland area, 25.4% is recently restored tallgrass prairie established by the U.S. Fish and Wildlife Service (USFWS) as part of the Neal Smith National Wildlife Refuge (NSNWR). Since refuge creation in 1991, large tracts of row crop agricultural land have been converted to native tallgrass prairie and savanna. The riparian area of the watershed’s upper reaches is dominated by single-species stands of reed canary grass (RCG) (Phalaris arundinacea), while interspersed RCG-riparian forest is typical of the watershed’s lower reaches.
Watershed soils are primarily silty clay loams, or clays formed in loess or till. The upland surficial geology is comprised of a 1–6 m loess cap overlaying pre-Illinoian glacial till, with Holocene alluvial deposits being comprised primarily of silty clay loams, clay loams, or silt loams [27]. A majority of watershed soils exhibit moderate to high erosion potential, with 54% being classified as highly erodible [41].
Walnut Creek is incised more than 3 m into its floodplain, and is typified by tall, cohesive streambanks. The effects of historic agricultural-associated practices such as row crop conversion, stream straightening, subsurface drainage, and removal of riparian vegetation [42,43], have led to a flashy hydrology, with Walnut Creek frequently exhibiting rapid responses to precipitation. Mean daily stream discharge at the watershed outlet ranged from a high of 11.28 to a low of 0.09 m3 s−1 over the study duration. Several stages of stream channel evolution have been documented through ~20 years of channel cross sectional measurements initiated by Schilling and Wolter [42], with areas of Stage III (degradation), Stage IV (degradation and widening), and Stage V (aggradation and widening) present [44]. Field observations indicate Stage IV as the most prevalent along Walnut Creek’s main stem.

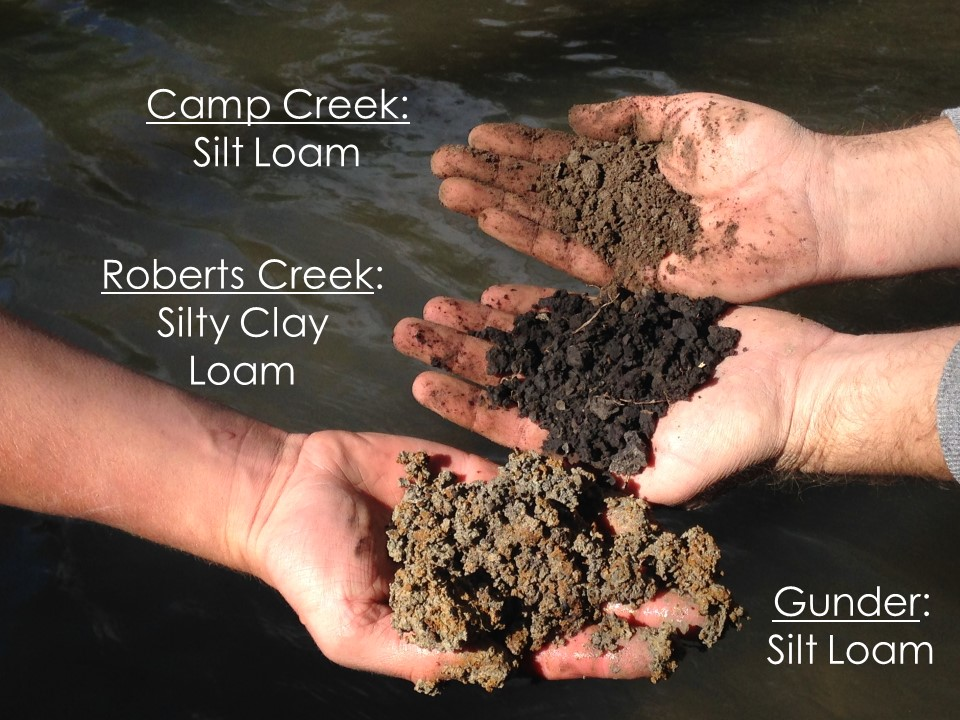
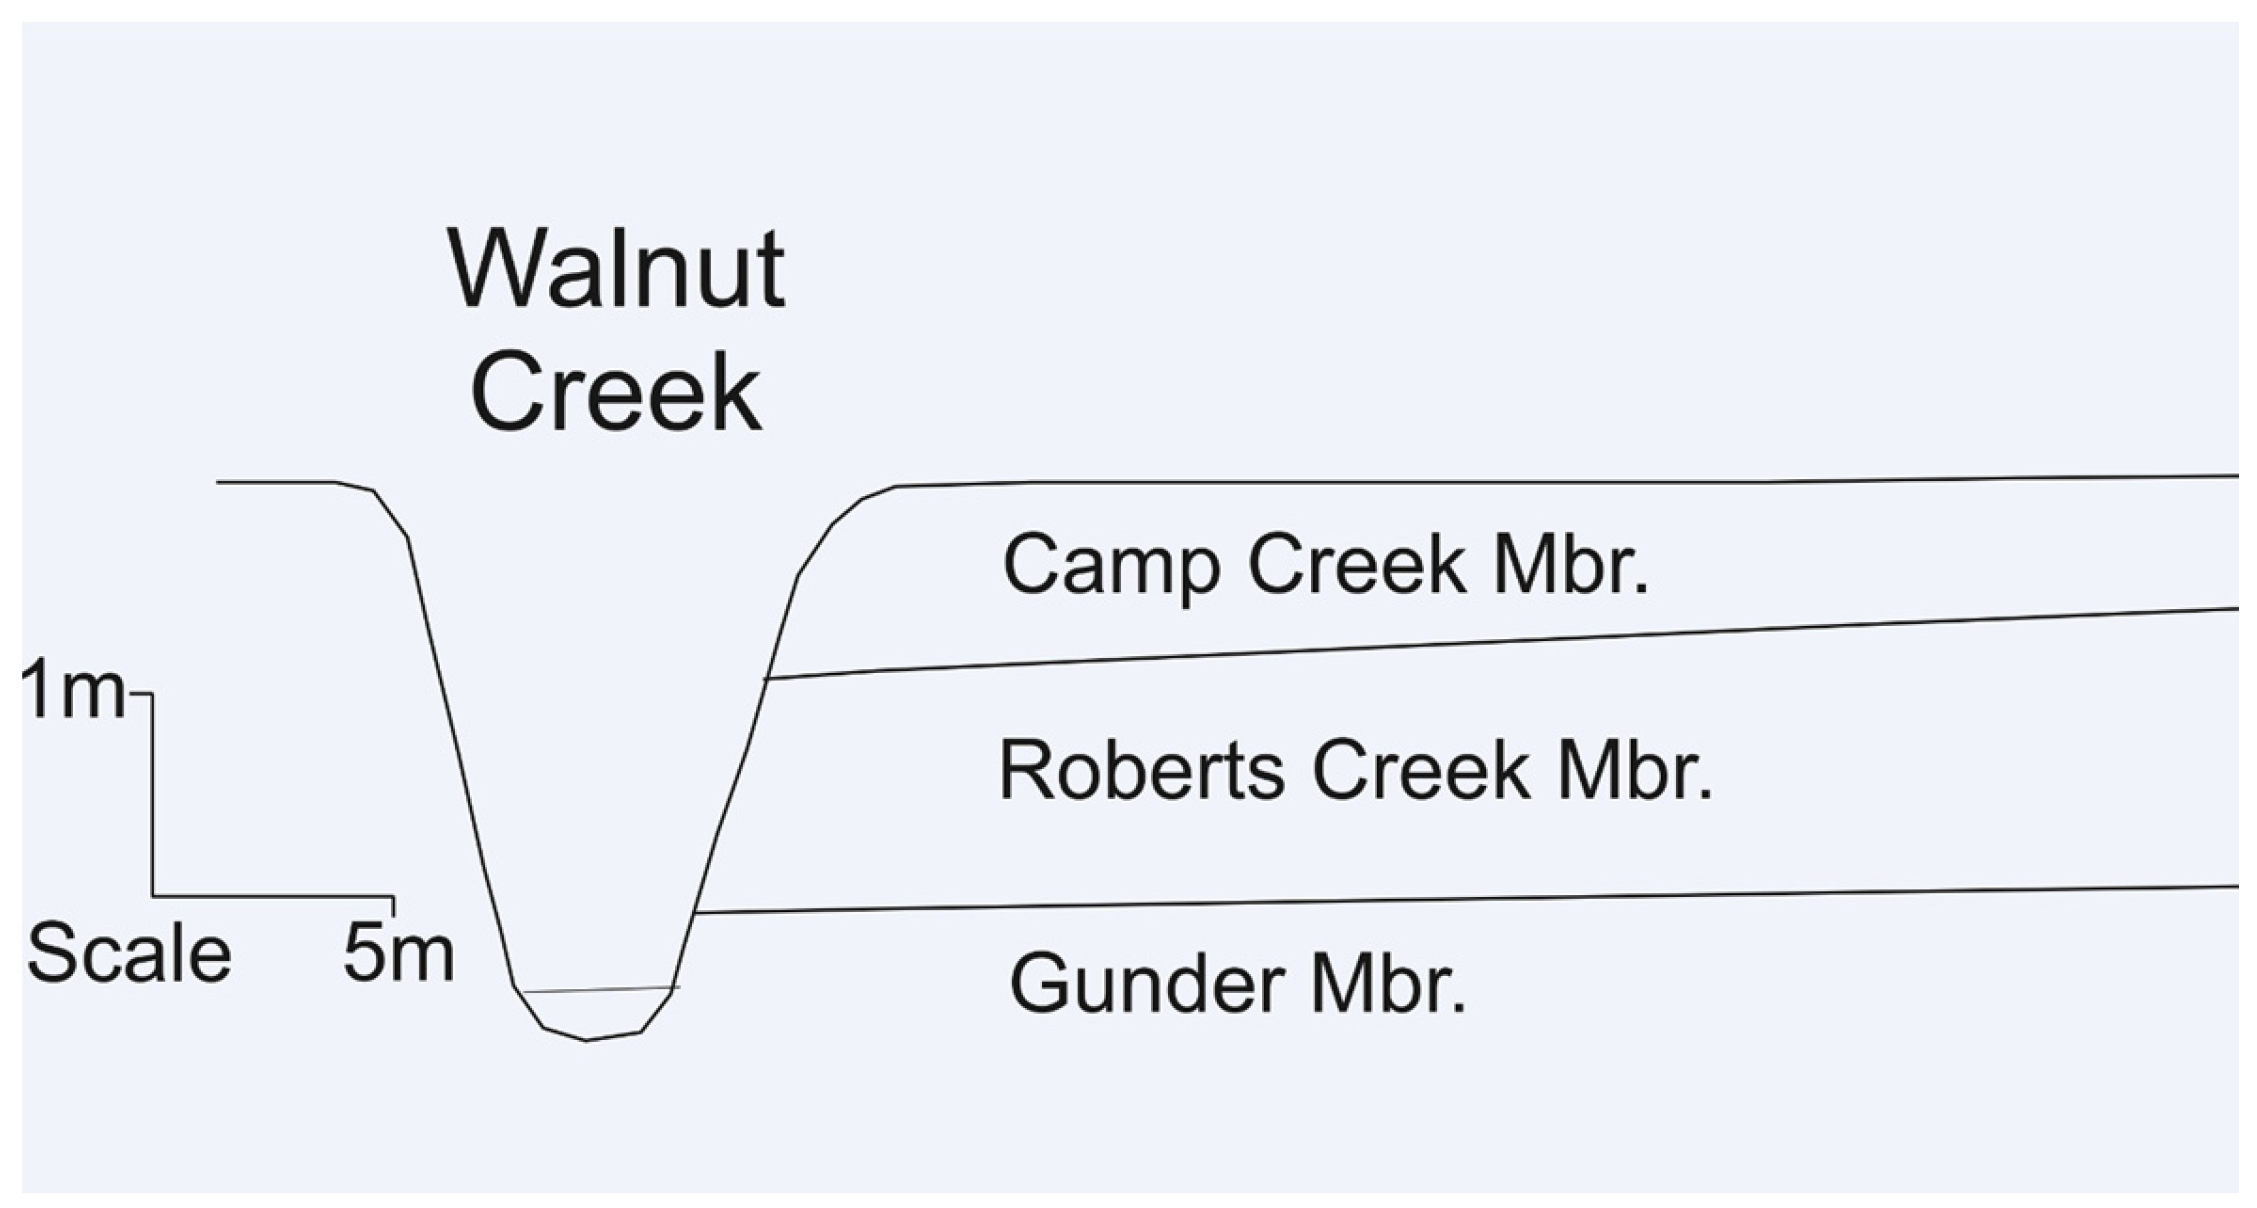
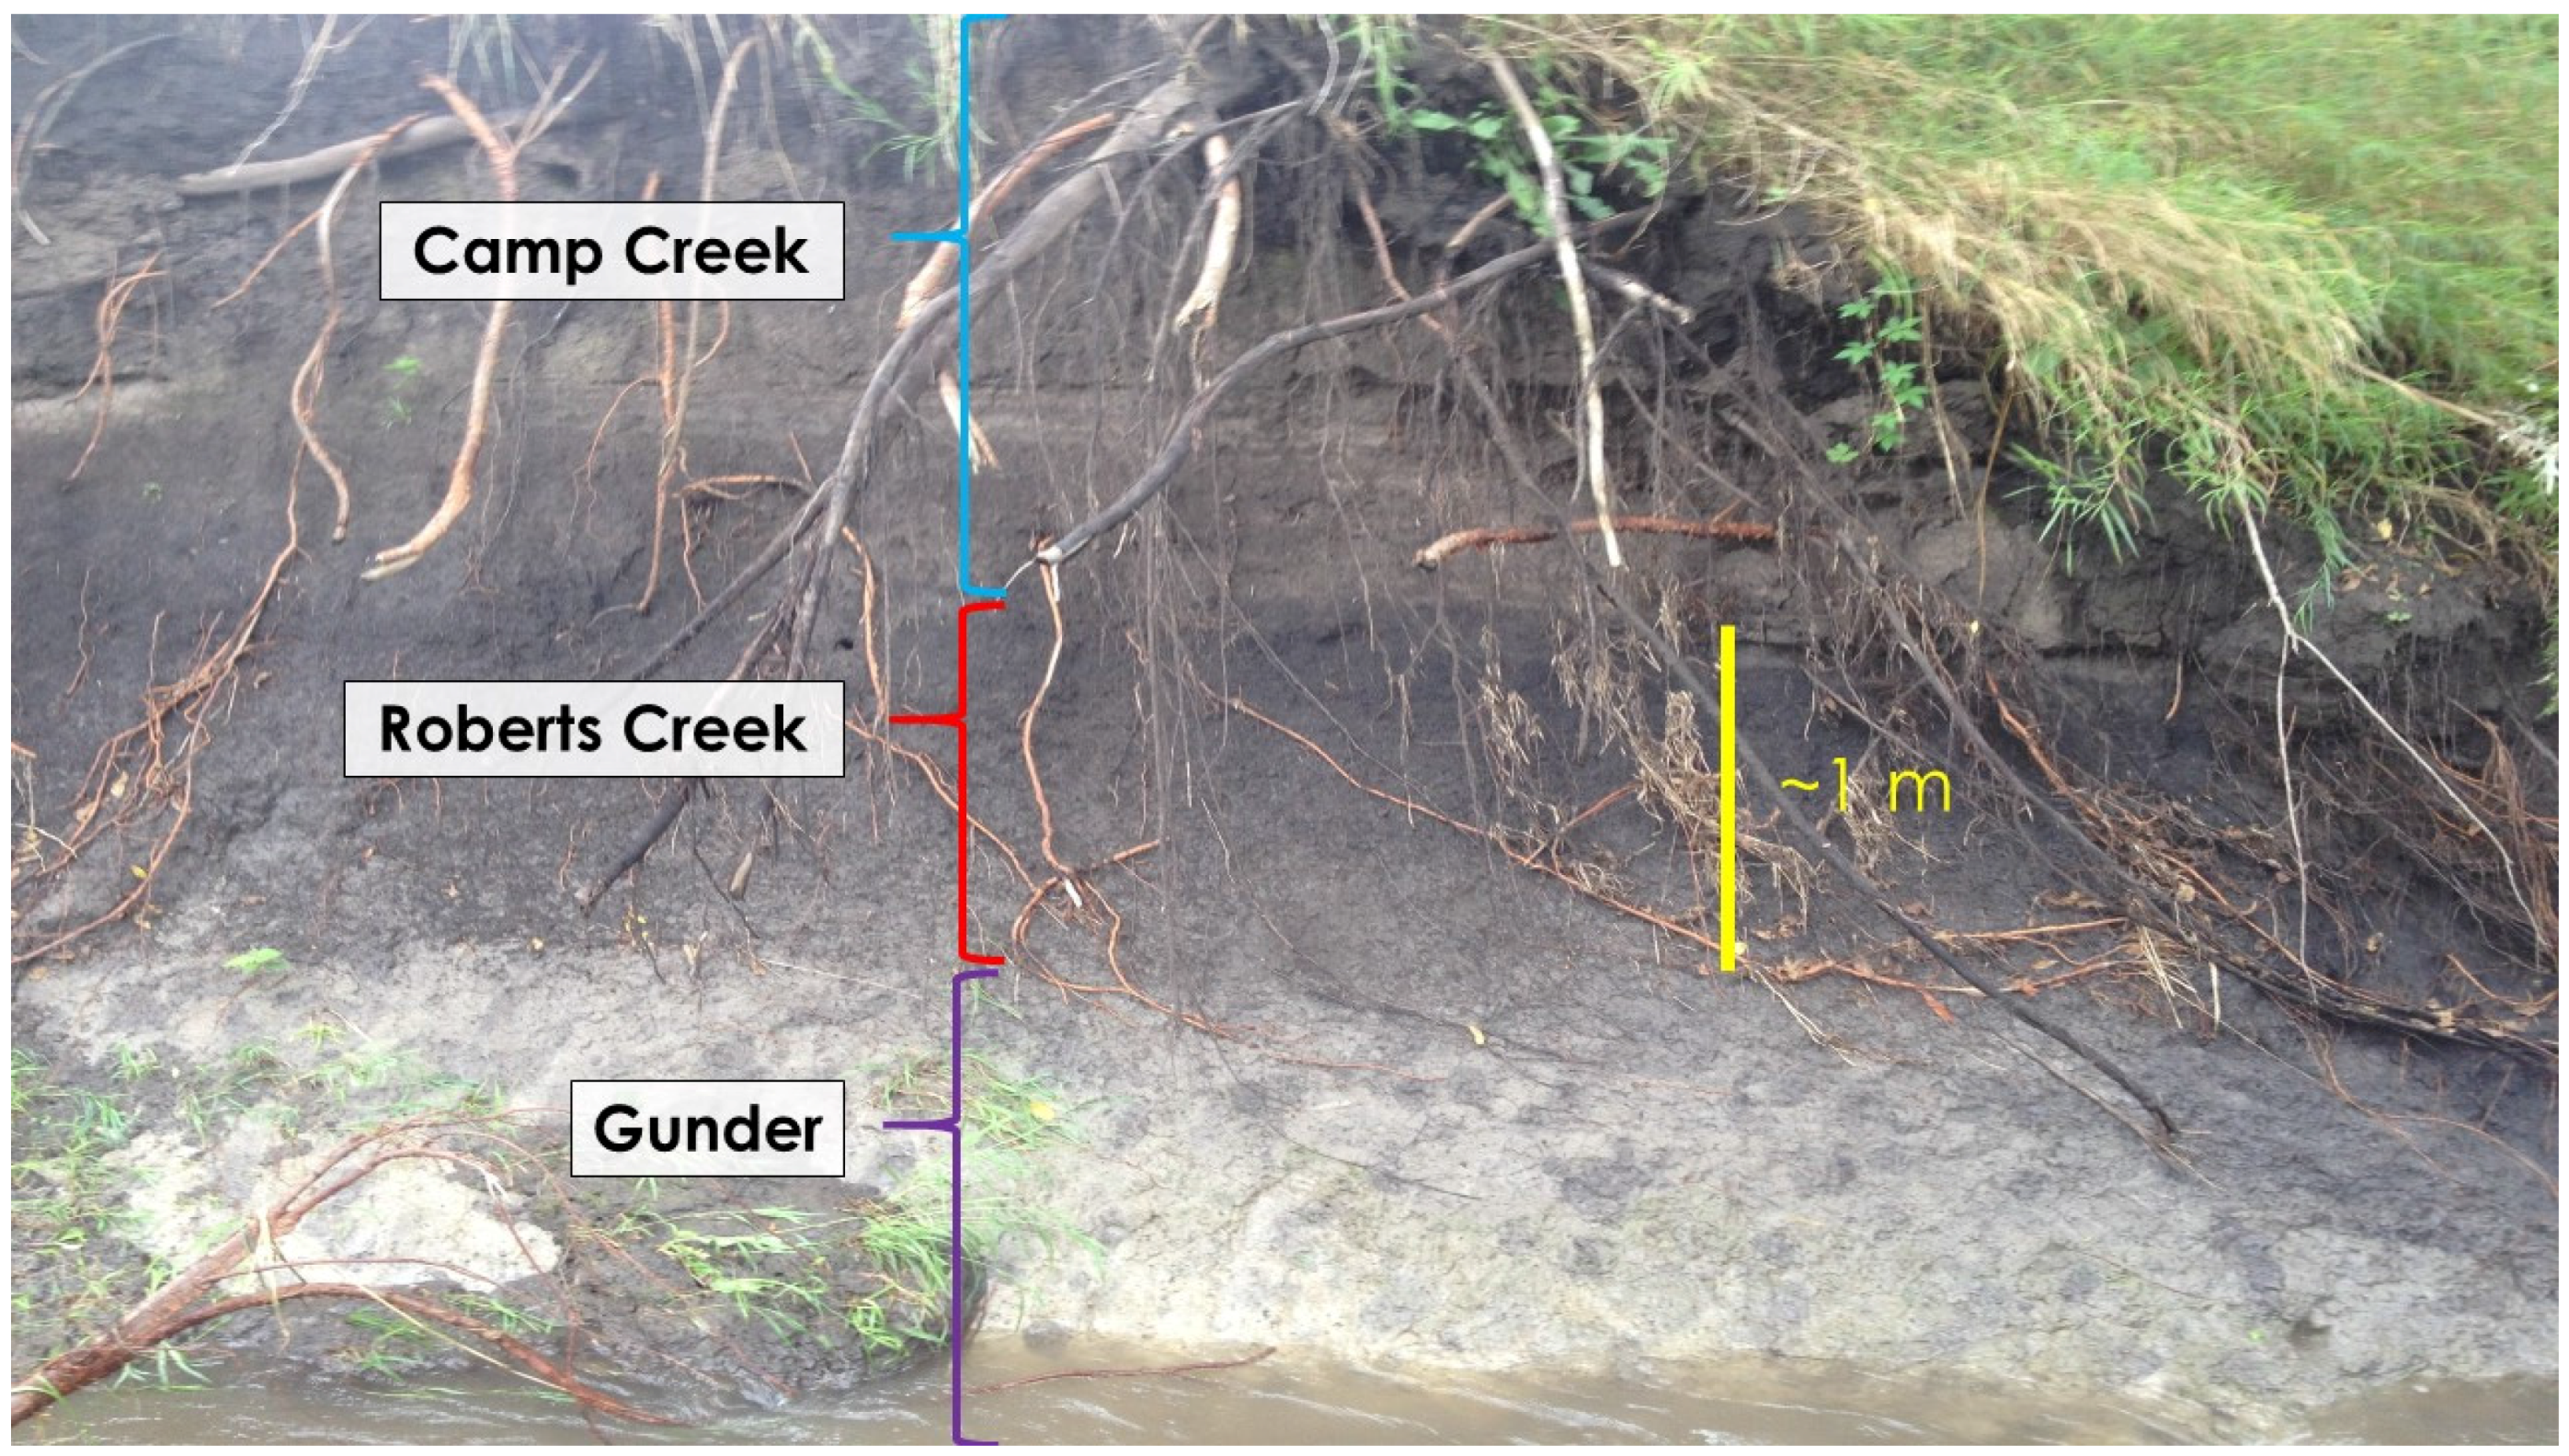
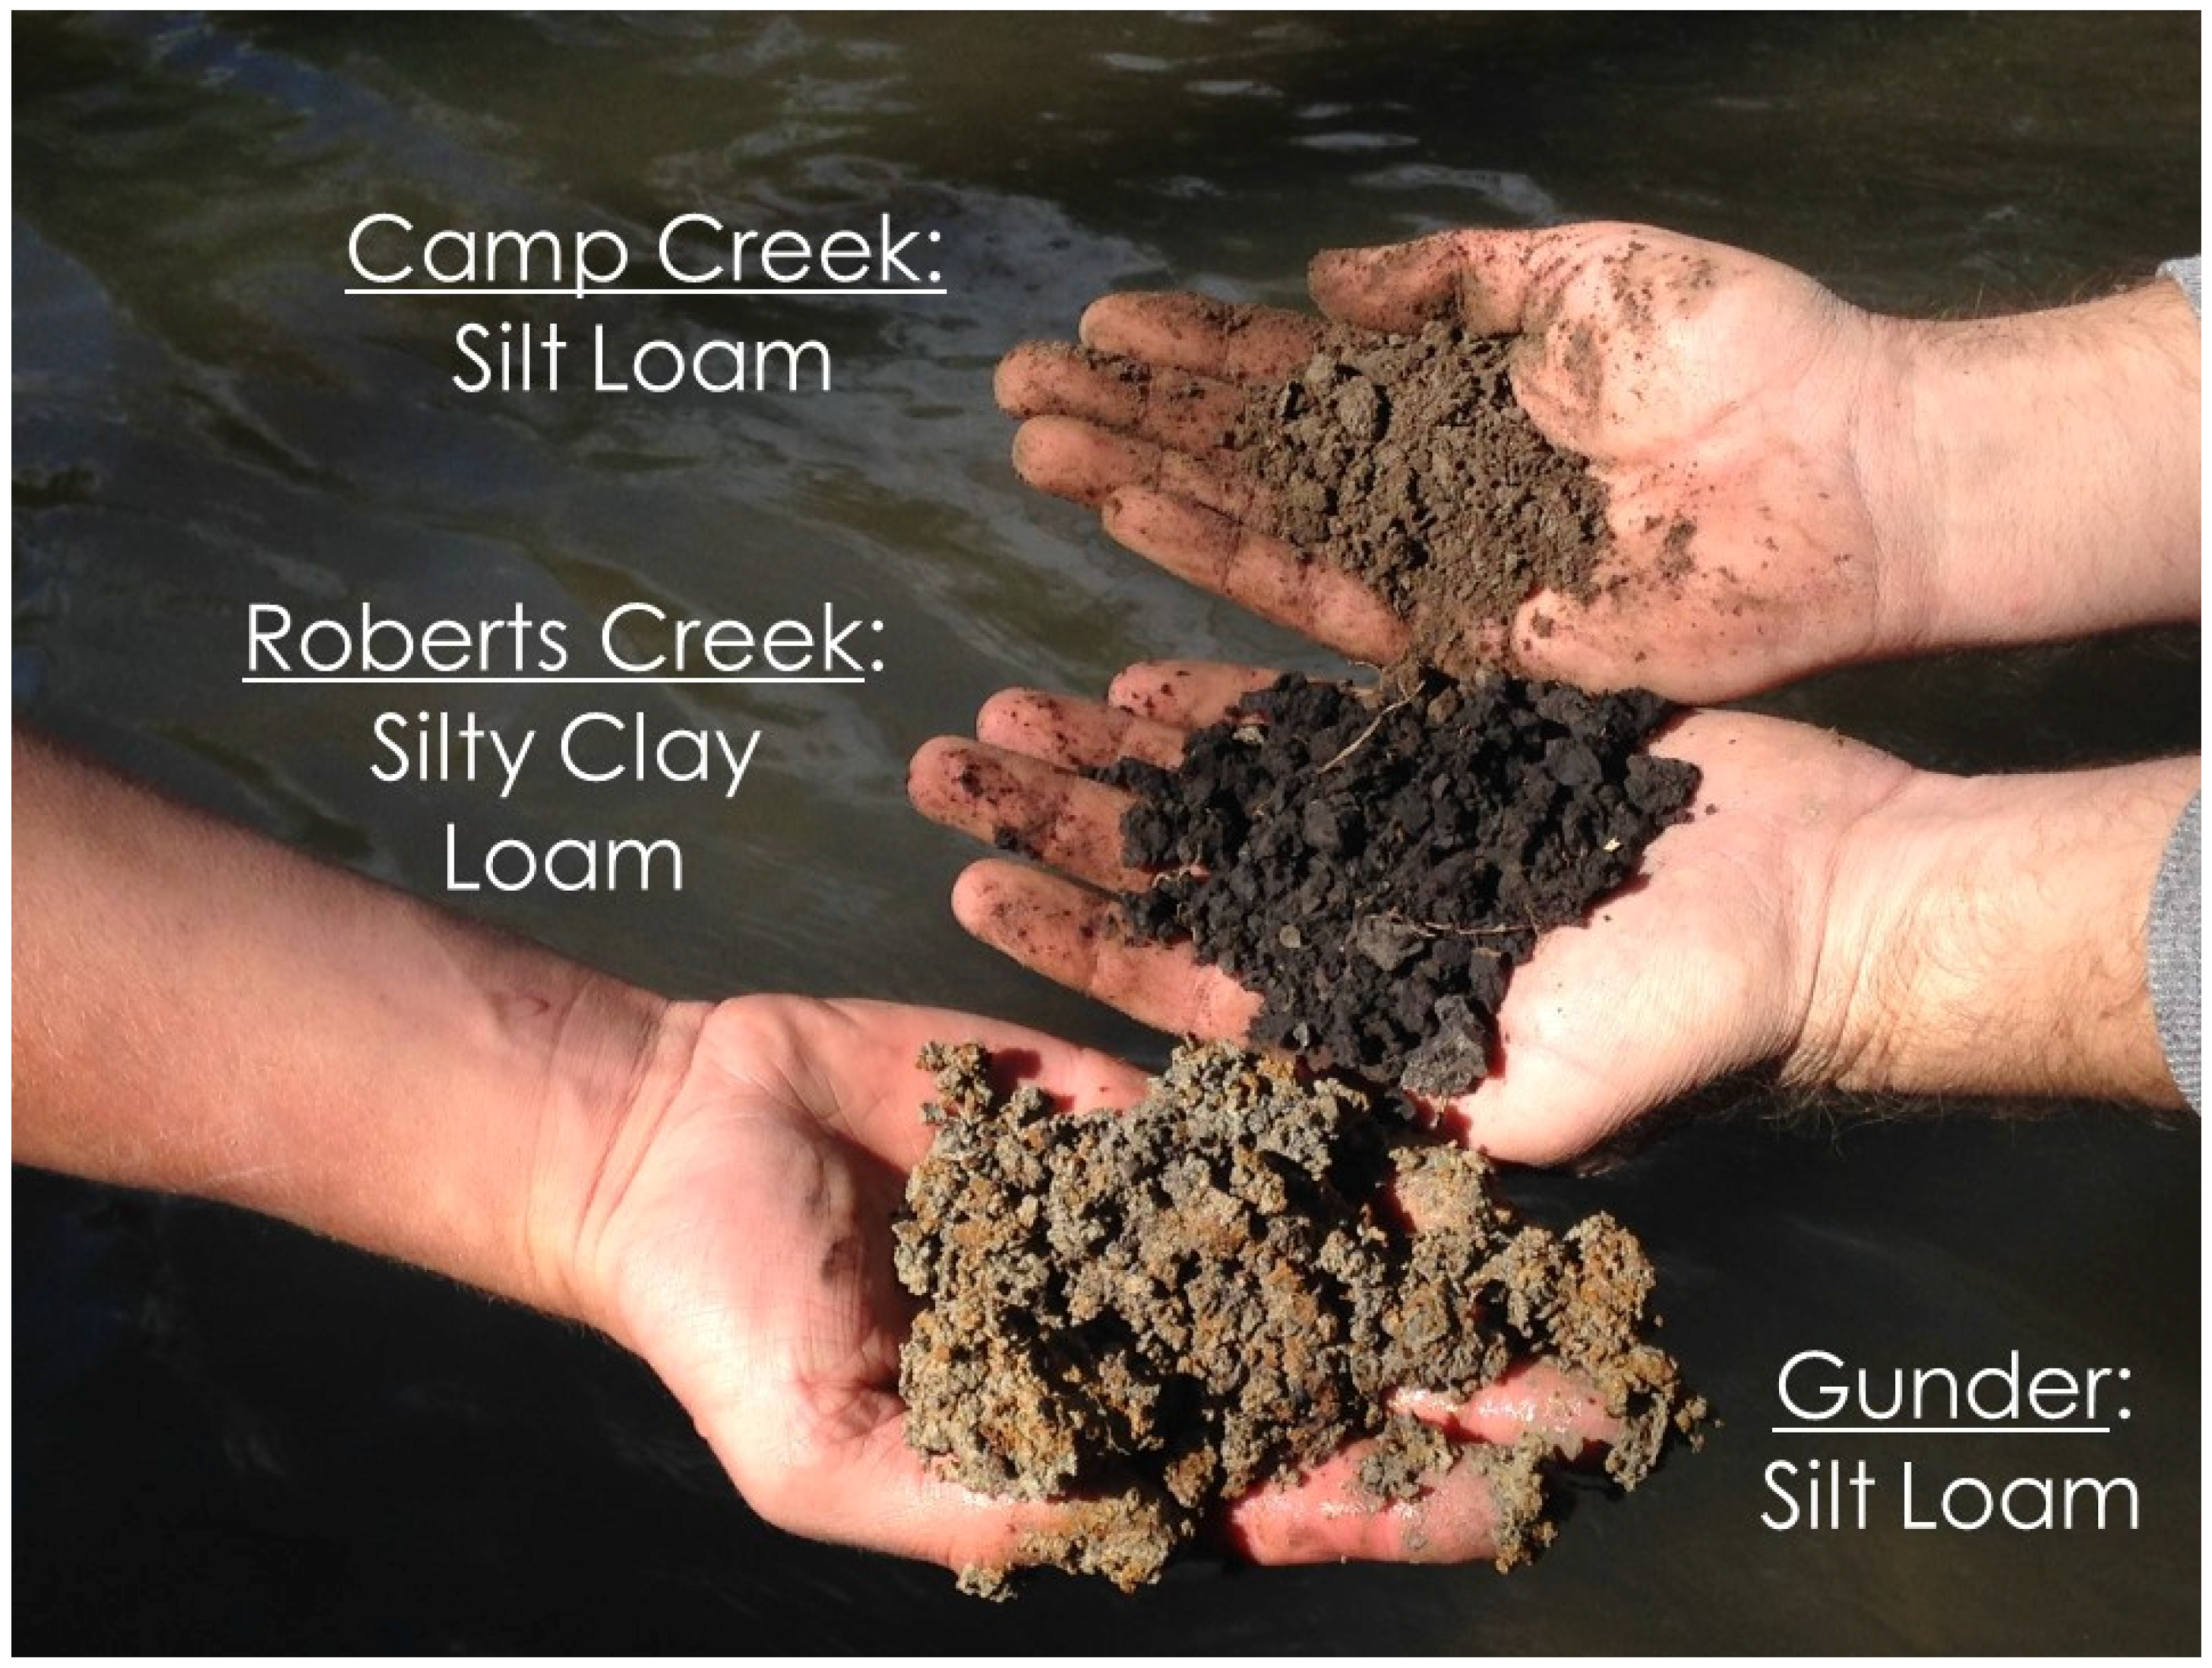
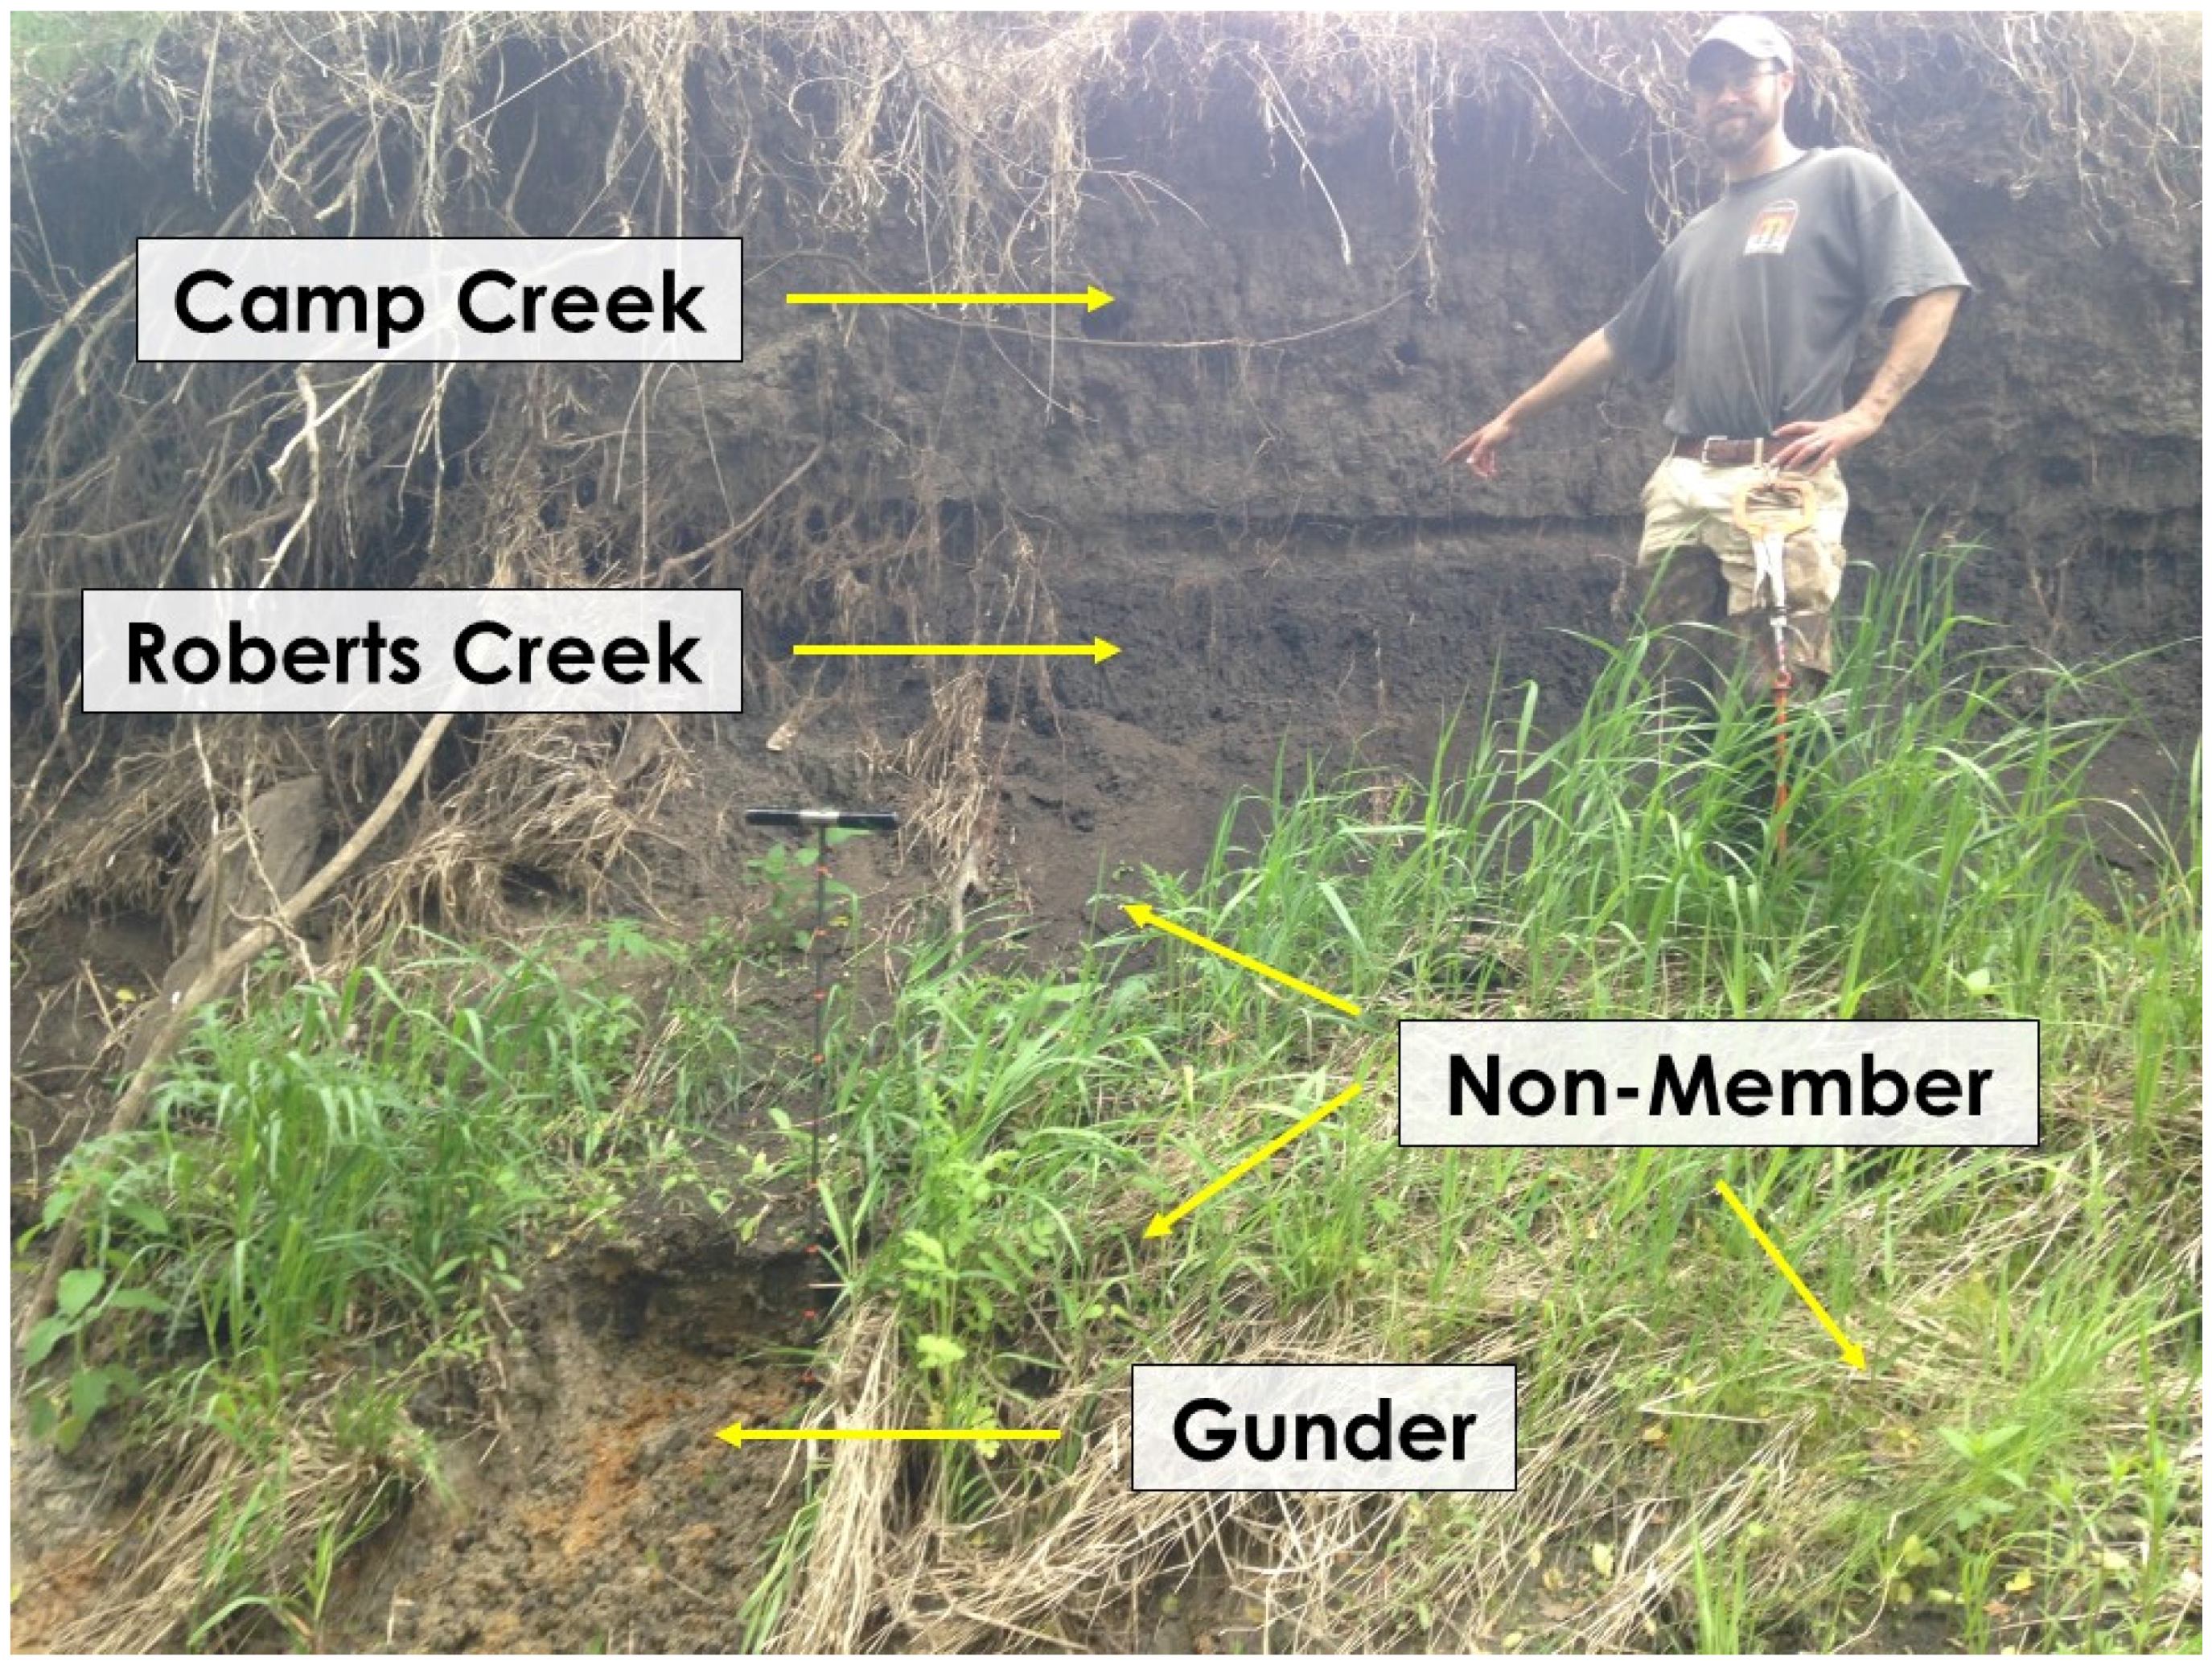
2.2. Streambank Alluvial Units

Walnut Creek’s floodplain is comprised of a series of loess-derived Holocene alluvial deposits, collectively known as the DeForest Formation [45]. The formation is divided into members based on lithologic properties (e.g., color, texture, pedogenic alterations). Three primary members of the DeForest Formation comprise Walnut Creek’s streambanks (Figure 2 and Figure 3).
The Gunder member represents the oldest streambank material, deposited ~10,000–3500 years before present (ybp) [46], and is found at depths of approximately 1–3 m [27] (Figure 2). The Gunder was deposited during a relatively cool and wet climatic period, typified by higher magnitude streamflow events and a deciduous forest landcover [47,48]. The high flow regime during deposition resulted in the Gunder having the coarsest texture (sand content 28.5%) of the three members [46]. The Gunder occupies the lowest stratigraphic position and, when exposed, comprises the bank toe and streambed (Figure 3). The Gunder has been classified as a silt loam, with massive structure, and a gleyed/reduced matrix with redoximorphic concentrations generated from past water table fluctuations [27] (Figure 4).
The Roberts Creek member overlies the Gunder (Figure 3), and is described as a silty clay loam [27] (Figure 4). Deposition occurred ~3500–500 ybp, in the context of a tallgrass prairie-savanna dominated landscape [46,49]. The Roberts Creek represents the pre-Euro-American settlement landscape surface, and exhibits a relatively high organic matter content [27], and well defined subangular blocky structure. Flow regime during deposition was typified by smaller, less intense streamflows [49], which resulted in the Roberts Creek having the greatest clay content of the three members.
The Camp Creek member overlies the Roberts Creek and represents the upper stratigraphic position (i.e., floodplain surface) (Figure 3). Camp Creek was deposited during the last ~400 years [46], and is typically referred to as ‘post-European settlement alluvium’. Camp Creek is described as a silt loam, with fine granular structure, light color, and the highest silt content of the three members (Figure 4). Thickness of the Camp Creek ranges from 0.6 to 1.8 m [27]. Camp Creek is heavily stratified, with abundant striations resulting from layering during floods. For this paper, the terms ‘alluvial unit’ and ‘member’ will be used interchangeably.
A fourth material of interest is streambank non-member material (NMM) that amasses at the toe and mid zones of streambanks (Figure 5). The NMM was observed as being comprised of material eroded from upper stratigraphic units (termed colluvial material), weathered but non-detached member material, and recent deposits of alluvium. Although three sources are recognized as comprising NMM, colluvial material was by far the greatest observed component. Colluvium is transported to the lower and mid bank regions gravitationally as a result of mass wasting and subaerial processes (e.g., freeze-thaw cycles). The NMM was ubiquitous in all study reaches, albeit highly variable both spatially and temporally. When present, the NMM would drape bank faces, creating a non-vertical wedge that covered all or parts of specific units (Figure 5). The exposed bank face thickness of Camp Creek, Roberts Creek and Gunder units generally depends on stream reach incision, and the prevalence of NMM.
Distribution, stratigraphic position, thickness, and inherent soil characteristics (e.g., texture, bulk density) of the Camp Creek, Roberts Creek, and Gunder members have been documented as being consistent throughout the watershed [27]. The alluvial stratigraphy in the watershed is typical of many other loess-mantled areas of the Midwestern USA [45].

2.3. Eroding Streambank Length Survey and Streambank Plot Selection

In November 2013, an on-the-ground streambank erosion survey was conducted along 13.5 km of the main stem of Walnut Creek. Banks identified as exhibiting severe or very severe erosion based on Natural Resources Conservation Service (NRCS) protocol [50] were georeferenced. Length and average bank height were recorded for all identified banks using meter tape and survey rods. Upon completion of the assessment, banks were randomly selected until a length equivalent to 20% of total main stem eroding length was reached. This set of banks was to become an overall set for a related, large-scale study, and comprised 61 total streambanks. A subset of banks equivalent to 20% of the 61-bank set length was also randomly selected. This subset comprised 10 banks, which ranged in length from 16 to 108 m. The 10-bank subset was designated for fine temporal scale streambank erosion quantification, as well as member-specific erosion quantification, and is the focus of this paper. The eroding length survey was repeated in April 2016 and March 2017. It should be noted, however, that the additional surveys were intended to quantify total eroding length for watershed-scale erosion extrapolation purposes, and not to select new sets of streambanks for this study.

2.4. Streambank Plot Design and Measurement Protocol

Streambank erosion pins [30] were used to quantify streambank recession. Pins were made of steel, with dimensions of 762 mm length and 6.2 mm diameter. Pins of these dimensions were utilized based on successful use during previous Walnut Creek [14] and Iowa [51,52] streambank erosion studies. The pin method was selected based on the practically for measurement of small changes in bank surfaces that may be subjected to erosion or deposition [53]. Pins were installed in a rectangular, column-row grid pattern, with columns spaced at 2 m horizontal intervals. Vertical row spacing was based on stratigraphic alluvial units (i.e., Camp Creek, Roberts Creek, Gunder), with pins being installed at the vertical midpoint of exposed units. Within NMM-draped alluvial units, pins were installed at the estimated unit midpoint based on adjacent areas of exposure. Pins were inserted perpendicular to the streambank face, with a 9 cm section left exposed. During measurement periods, the exposed length of each pin was recorded using a three-sided engineering ruler, with a positive change from previous measurement (i.e., increase in exposed length) indicating bank recession, and a negative change (i.e., decrease in exposed length) indicating deposition. If measured exposed length exceeded 9 cm, pins were reset to the original measurement of 9 cm following measurement. Resetting occurred on all >9 cm exposure pins unless researchers believed the act of resetting would cause excessive soil disturbance (e.g., extremely dry, brittle bank face conditions). Lost pins were recorded as having a recession of 600 mm based on previous studies [29,51] and personal observations of that threshold being the point where pins could maintain position under their own weight. Buried pins were located using a metal detector, and deposition was recorded as previous length of exposure. Both lost and buried pins were recorded as such, and replaced in their respective locations.
Member-specific pin measurements occurred on an approximate monthly basis beginning in May 2015 and continued until April 2017. In addition, measurements were preformed immediately following flow events where peak discharge at the watershed outlet exceeded 8.5 m3 s−1, which represents an approximate 1.5 m increase in stream stage. The intervals between measurement periods were extended during times of ice cover and other scenarios that would inhibit accurate pin measurement. A total of 21 individual measurement periods were recorded for the 10-bank subset.
During individual pin measurements, the alluvial unit present at the pin-bank surface interface was recorded. This allowed for future linking of recession rate with individual unit. Consistency was adhered to when identifying units in the field, with identification based heavily on descriptions by Bettis [45]. The NMM was identified as being in a state other than that described by Bettis [45]. Common justifications for assigning NMM included evidence of recent downward movement as well as significant deviation from described member color, texture, and bulk density (i.e., indicative of material detachment and mixing).

2.5. Streambank Soil Sample Extraction and Analyses

Soil samples were extracted from each streambank in the 10-bank subset and analyzed for bulk density, particle size, wet aggregate stability, and total phosphorus (TP). At each bank, one bulk density and one bulk soil sample were collected from all exposed units. Bulk density samples were extracted using a 7.62 cm × 7.62 cm open-ended bulk density cylinder. Bulk soil was used for particle size, wet aggregate stability, and TP analyses. Bulk density was determined by drying core samples at 105 °C for 24 h to determine dry weight. Dry weight of samples was then divided by core volume to calculate bulk density. Wet aggregate stability was determined by machine sieving, and particle size analysis was performed using the pipette method [54]. Samples were analyzed for TP using the aqua regia method [55]. Readings from individual banks were averaged to produce a watershed-mean estimate for each unit.

2.6. Quantification of Streambank Alluvial Unit Surface Area

Exposed streambank face surface area of alluvial units was measured annually each August using bank-face grid surveys. During surveys, a survey rod was extended from bank toe to top bank lip along each vertical pin column. Bank angle, height, and member depth were recorded for each column. For each individual bank, column data were compiled to calculate the total surface area representation (%) of respective units. For each unit, all individual bank surface area percentages were averaged to produce a watershed-mean surface area percent (i.e., percent total eroding streambank surface area represented by each unit). Data from the August 2015 survey were applied to May 2015–April 2016 pin recession data, while data from the August 2016 survey were applied to May 2016–April 2017 pin recession data.

2.7. Quantification of Sediment and TP Mass Contribution

2.7.1. Calculation of Mass Contribution

For each measurement period, unit-specific sediment mass contribution was calculated using the product of watershed-mean unit recession (m), total watershed unit surface area (m2), and watershed-mean unit bulk density (kg m−3) (Equation (1)). Mean unit recession was calculated by averaging individual unit-specific pin readings. Total watershed unit surface area was calculated by multiplying the average unit representation (percent total bank surface area) from all banks by the total streambank surface area calculated during respective eroding length surveys. This allowed for extrapolation of individual bank measurements to the watershed scale. Eroding length totals from the 2016 survey were applied to May 2015–April 2016 pin measurement periods (hereafter referred to as Year 1), and those from the 2017 survey were applied to May 2016–April 2017 pin measurement periods (hereafter referred to as Year 2). Unit-specific TP mass contribution per bank was calculated using the product of bank sediment mass contribution (kg) and watershed-mean TP concentration (kg m−3) (Equation (2)). Period sediment and TP masses were summed to produce cumulative mass contributions for the study duration. Unit recession rates were calculated by dividing mean period recession by time (days) between sampling periods.
[ ( M e a n   u n i t   r e c e s s i o n   ( m ) × T o t a l   u n i t   s u r f a c e   a r e a   ( m 2 ) ) × ( M e a n   b u l k   d e n s i t y   ( kgm 3 ) ) ] = U n i t   s e d i m e n t   m a s s   c o n t r i b u t i o n   ( kg )
Equation (1) Watershed-scale sediment mass contribution per individual unit, per pin measurement period.
[ ( U n i t   s e d i m e n t   m a s s   c o n t r i b u t i o n   ( kg ) × M e a n   u n i t   T P   c o n c e n t r a t i o n   ( mgkg 1 ) ) / ( 1 × 10 6 ) ] = U n i t   T P   m a s s   c o n t r i b u t i o n   ( kg )
Equation (2) Watershed-scale TP mass contribution per individual unit, per pin measurement period.

2.7.2. Assigning Units to Individual Pin Readings

Because of the dynamic nature of streambank erosion, individual pins often alternated between NMM and a specific unit in subsequent measurements. In order to properly assign a pin recession reading to either NMM or the respective unit, assumptions were adhered to based on in-field observations of bank material erosion and the flashiness of Walnut Creek’s hydrology. As a result, three scenarios existed where NMM could have been assigned to an individual pin during a measurement period (Table 1): (1) NMM was present at the bank-pin interface for both the previous and current measurement dates; (2) NMM was present at the bank-pin interface during the previous measurement date, but unit material present during current measurement date; and (3) unit material present during previous measurement date, but NMM present during current measurement date. These scenarios assume (1) change within NMM; (2) erosion of NMM to expose units; and (3) deposition of NMM to cover units, respectively. Scenario 4 entailed unit presence at the bank-pin interface on both previous and current measurement dates. Scenario 4 assumes lateral recession of unit material. Observations of streambank NMM dynamics, Walnut Creek’s flashy hydrology, as well the hypothesis that NMM material has greater potential to be eroded (e.g., lower bulk density), supports that rapid bursts of flow would primarily affect the NMM draped over members.
When analyzing pin data, NMM was split into two categories. The category NMM Net contained all NMM pin readings, both recession (i.e., positive change pin readings) and accretion (i.e., negative change pin readings). The NMM Net category was utilized in all analyses to represent the dynamic nature of streambanks (i.e., alternating recession and accretion). The category NMM Gross contained only those NMM pins that exhibited recession. The NMM Gross category was utilized in recession and flow correlation analyses only, as a means to directly compare positive lateral erosion values with those of the alluvial units. A final category, Total Bank, was calculated as a means to compare recession, as well as sediment and TP mass losses, with similar studies that relied on whole-bank estimates (i.e., no unit categories) of erosion. Total Bank was calculated by averaging all pin readings for each measurement period, without placing pins into material categories.

2.7.3. Negative Pin Readings

Negative pin readings (i.e., reduction in exposed pin length) were observed for all units and NMM during the study. Negative readings present a challenge, and decisions on when and how to include negative pin readings in calculations should be based on study objectives [56]. For this study, negative pin readings were included in calculations related to NMM-assigned pin readings, as we wanted to document both recession and deposition of this material. All negative readings for actual units, however, were changed to 0 cm prior to recession calculations. The reasoning behind this was twofold. First, researchers were consistent in identification of unit vs. NMM in the field. Thus, the identification of bank material as a unit would preclude the deposition/presence of NMM. Secondly, if presence of NMM was precluded, likely causes of a negative reading could have been bank soil shrink/swell, and/or human measurement error [56]. Because our study objective was to quantify contributions of bank material to stream loads, there was essentially no difference (utility-wise) between a negative unit reading and a 0 cm reading. Pin studies involve inherent measurement error and assumptions [53], and it should be noted that the vast majority of negative unit readings were <1 cm of change, which is not unreasonable to attribute to human measurement error.

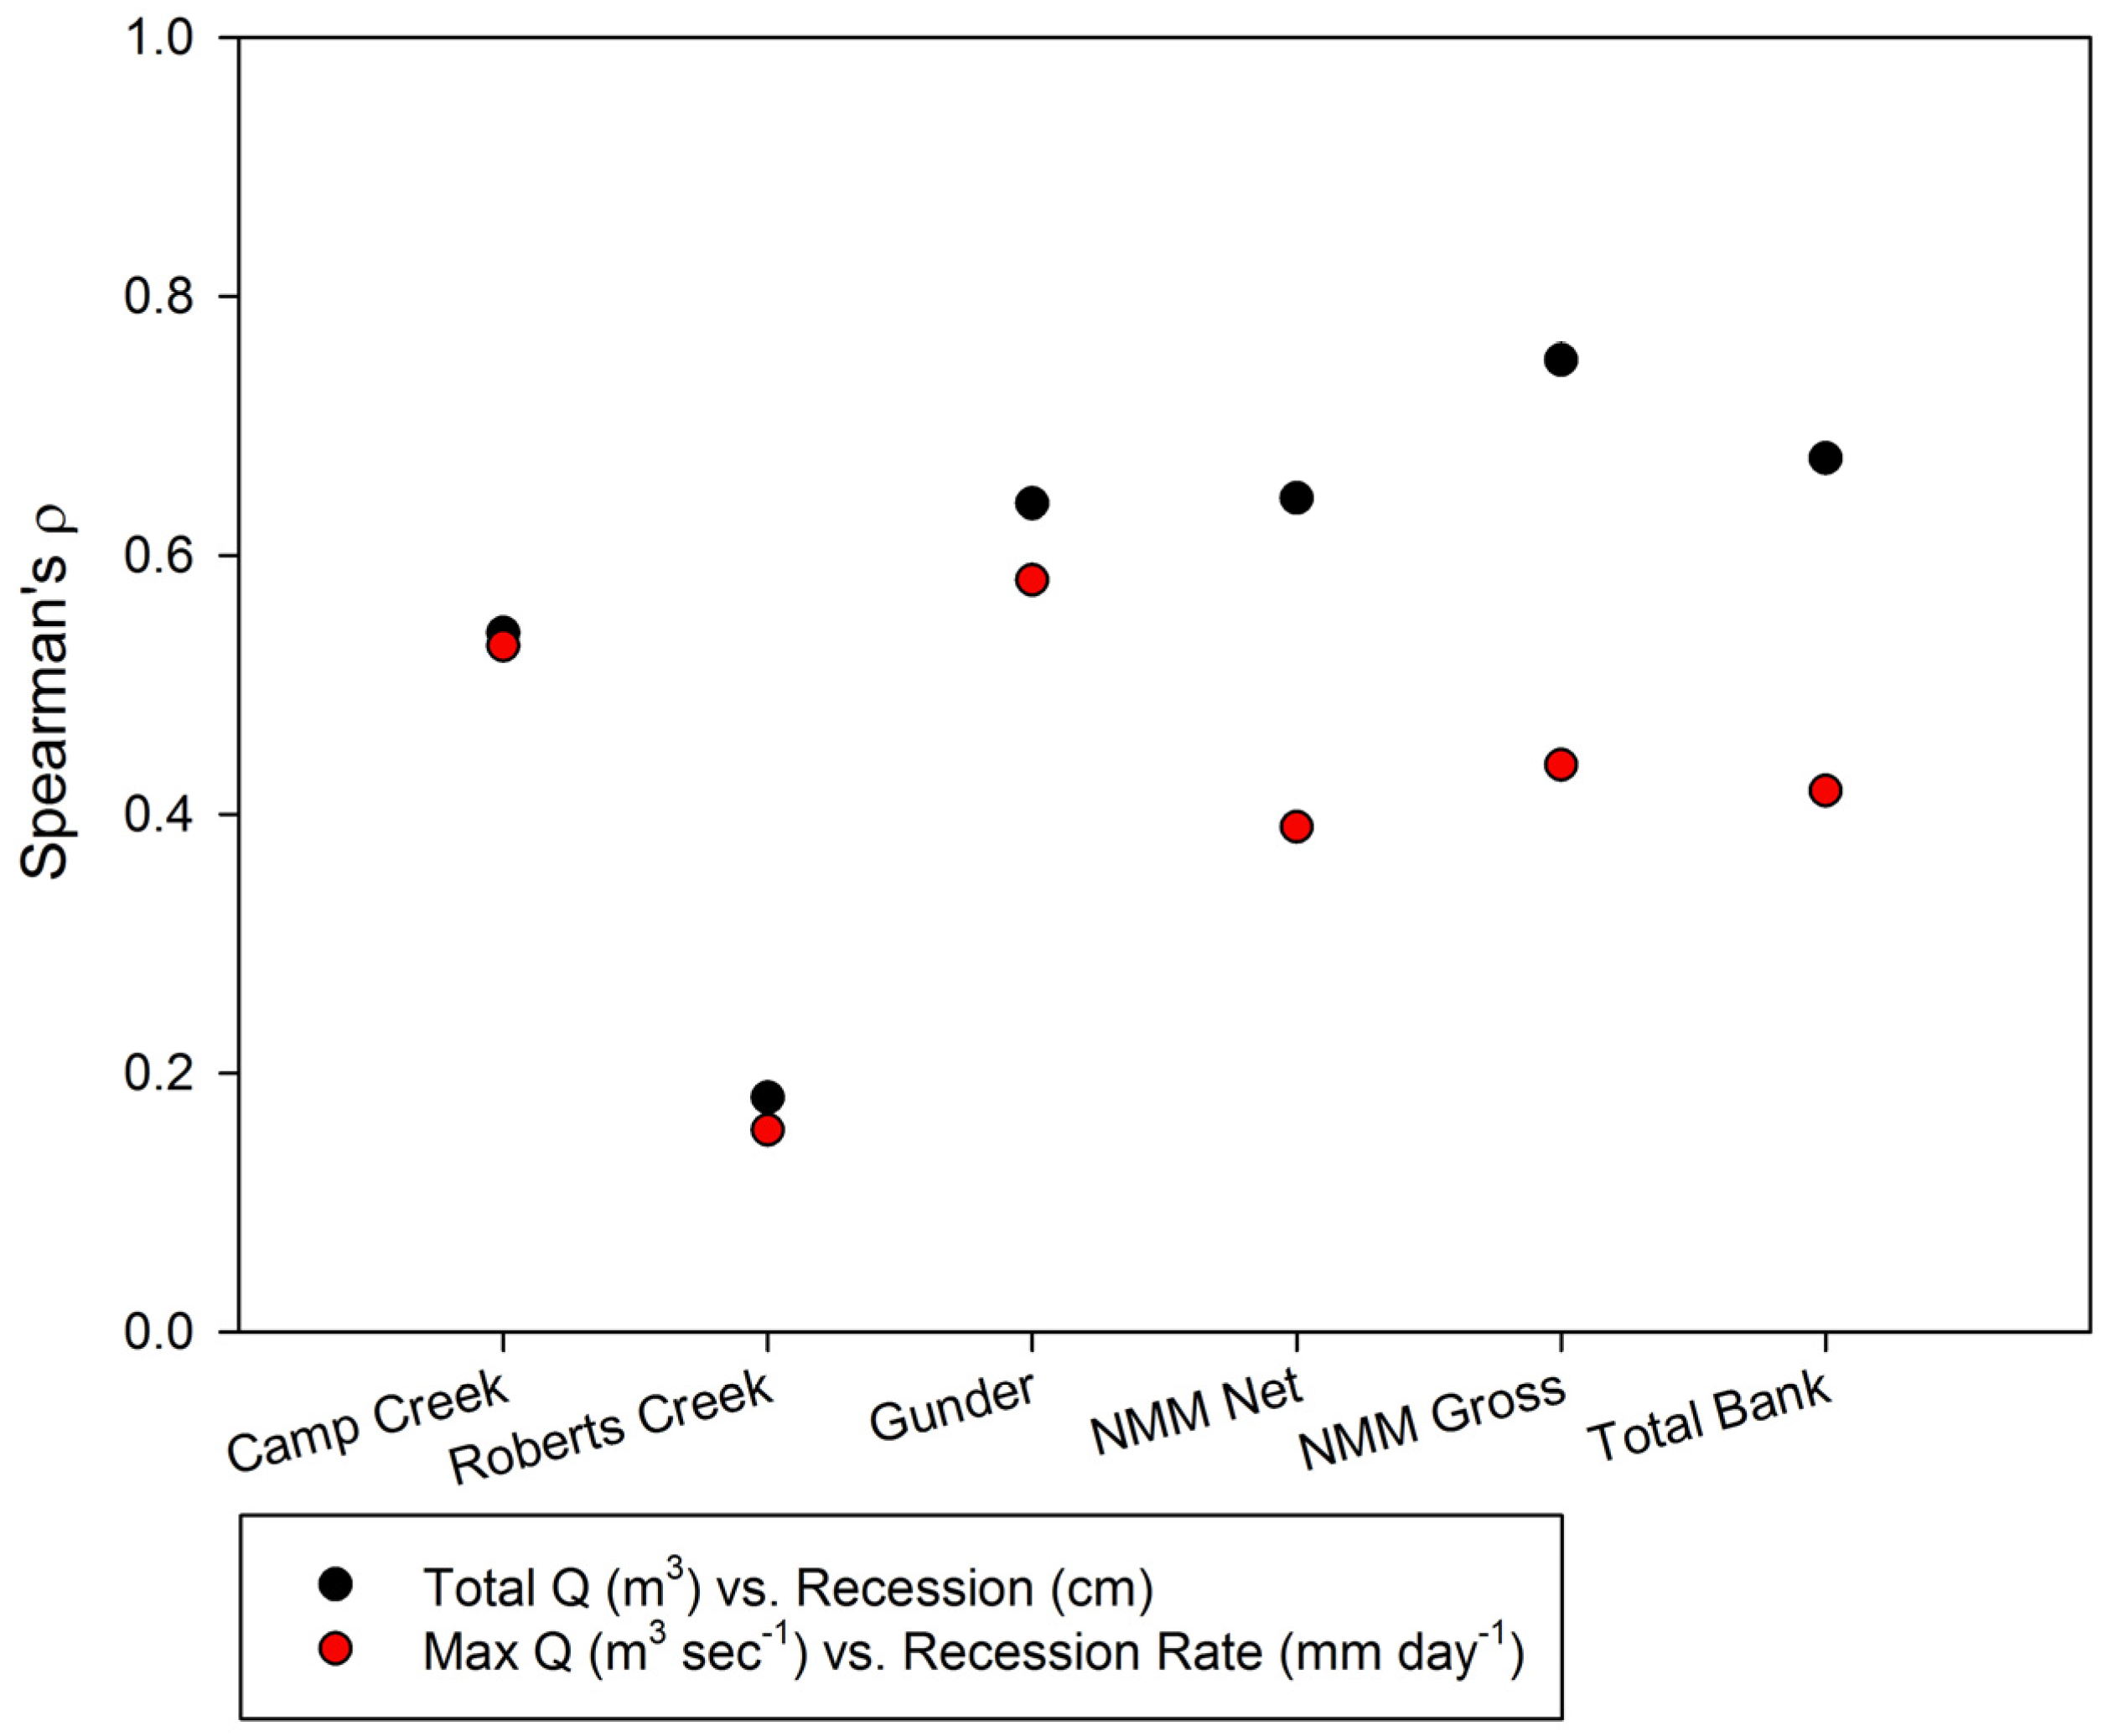
2.8. Correlation with Discharge

For each pin sampling period, watershed-outlet total discharge (m3) and maximum daily mean discharge (m3 s−1) were individually correlated with mean pin recession and mean pin recession rate. Correlation was investigated for alluvial units, as well as NMM Net, NMM Gross, and Total Bank categories.

2.9. Statistical Methods

Data were checked for normality using the Shapiro-Wilk test. If data were normal, means were compared through the use of one-way analysis of variance (ANOVA) procedure with a post hoc Tukey HSD test. If data were non-normal, medians were compared using the non-parametric Kruskal-Wallis procedure with a post hoc Wilcoxon test with Bonferroni correction. Correlation between pin data and stream discharge data was determined using either the Spearman’s rank correlation coefficient or the Pearson’s correlation coefficient. All procedures were performed using R v. 3.4.1 [57].

3. Results

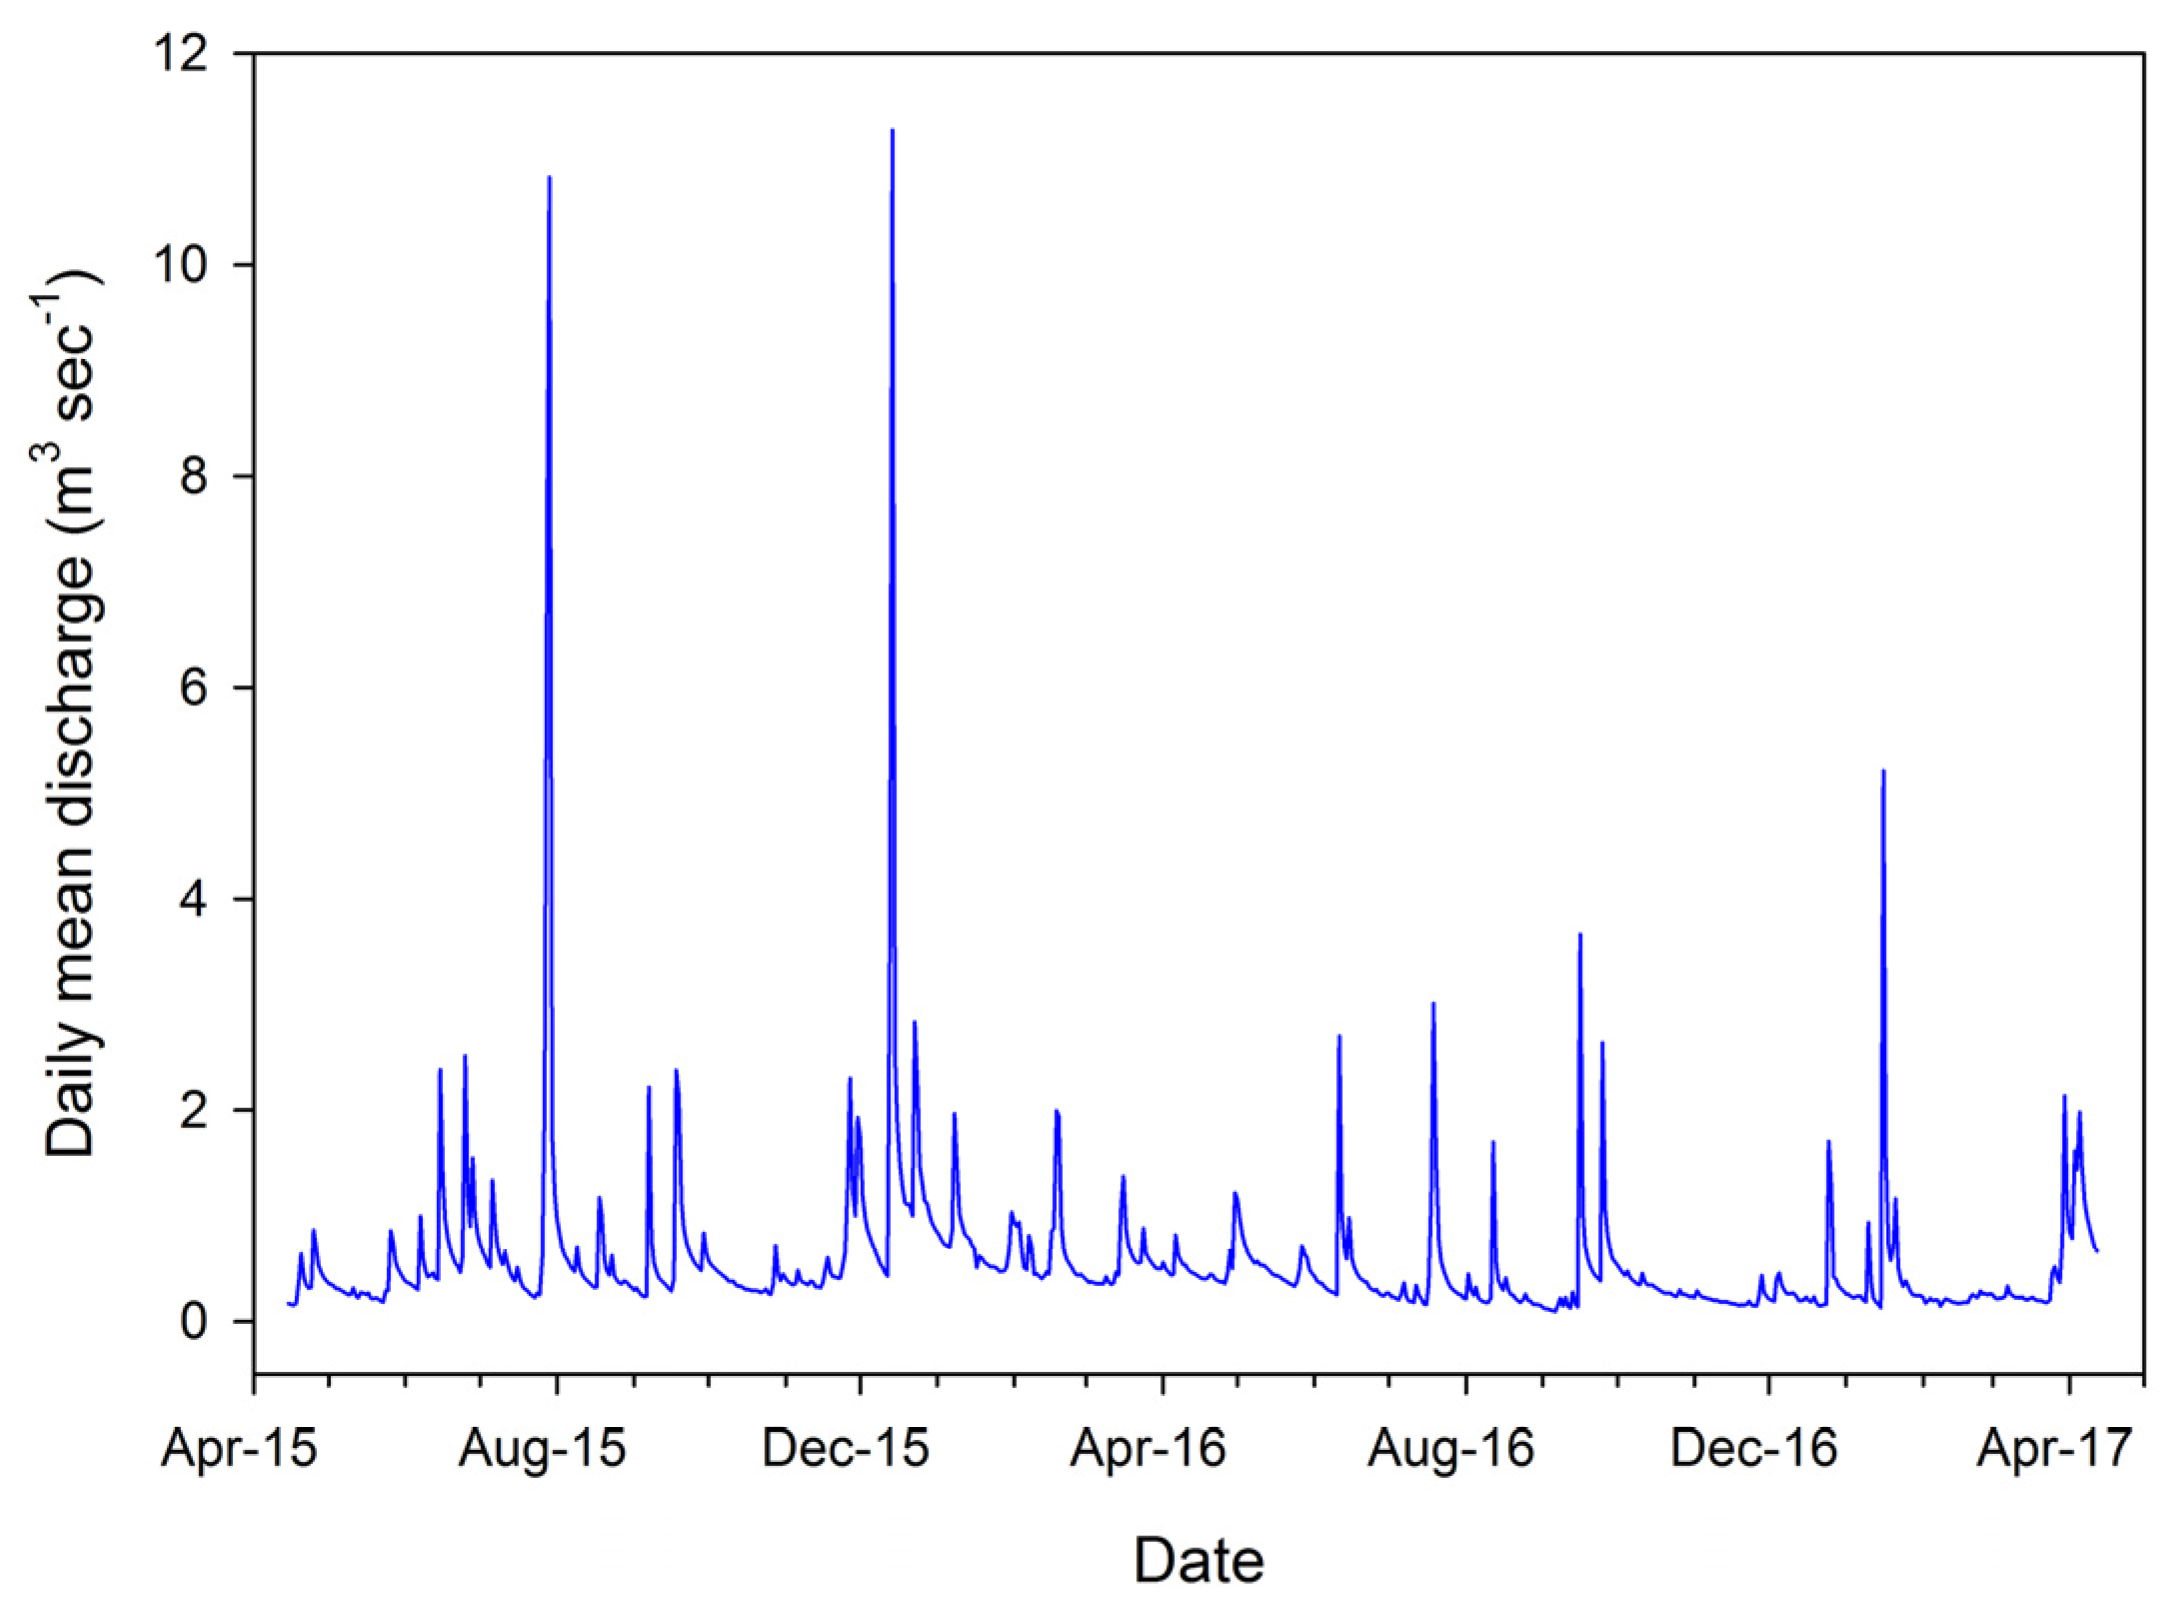
3.1. Precipitation, Hydrology, and Streambank Eroding Length

Pin measurement spanned May 2015 to April 2017. The duration was divided into two periods with approximately equal number of days (Table 1). The period of May 2015–April 2016 will be referred to as Year 1, while the period of May 2016–April 2017 will be referred to as Year 2. Due to specific dates of pin measurement, the lengths of both periods varied slightly, with Year 1 spanning 358 days and Year 2 spanning 371 days.
Precipitation in Year 1 (1118 mm) was higher than Year 2 (977 mm) (Table 2). Average stream discharge was also higher in Year 1, with an annual mean daily discharge at watershed outlet of 0.71 m3 s−1, versus 0.43 m3 s−1 for Year 2 (Table 2). Maximum daily mean discharge varied as well, with a maximum of 11.28 m3 s−1 recorded in Year 1 versus a maximum of 5.43 m3 s−1 recorded in Year 2 (Figure 6).

3.2. Alluvial Unit Total Phosphorus Concentration and Soil Parameters

Alluvial unit TP concentrations ranged from 170.8 (Camp Creek) to 304.2 mg kg−1 (Gunder) (Table 3). The Camp Creek and Roberts Creek units had the highest silt-clay content by weight, at 94.0 and 91.2%, respectively, with the Gunder unit the lowest (71.5). Gunder represented the greatest bulk density (1.6 g cm−3), followed by Camp Creek (1.3 g cm−3), Roberts Creek (1.27 g cm−3), and NMM (1.2 g cm−3). Roberts Creek represented the greatest percentage by weight for both large macro-aggregates (>2 mm) and macro-aggregates (>0.25 mm) at 11.3 and 44.9%, respectively. Gunder represented the lowest percentage by weight for both large macro-aggregates and macro-aggregates at 3.8 and 15.5%, respectively.

3.3. Alluvial Unit Surface Area Representation within Eroding Streambank Faces

For both Year 1 and Year 2, significant differences in surface area percent were detected among units (p value = 0.1) (Table 4). For both Year 1 and Year 2, NMM dominated streambank surface area, and was greater than the combined surface area of Camp Creek, Roberts Creek, and Gunder. Although no significant difference was detected for individual units between years (p value = 0.05), Camp Creek, Roberts Creek, Gunder and NMM all exhibited a trend in decreased surface area percent from Year 1 to Year 2.

3.4. Streambank Recession

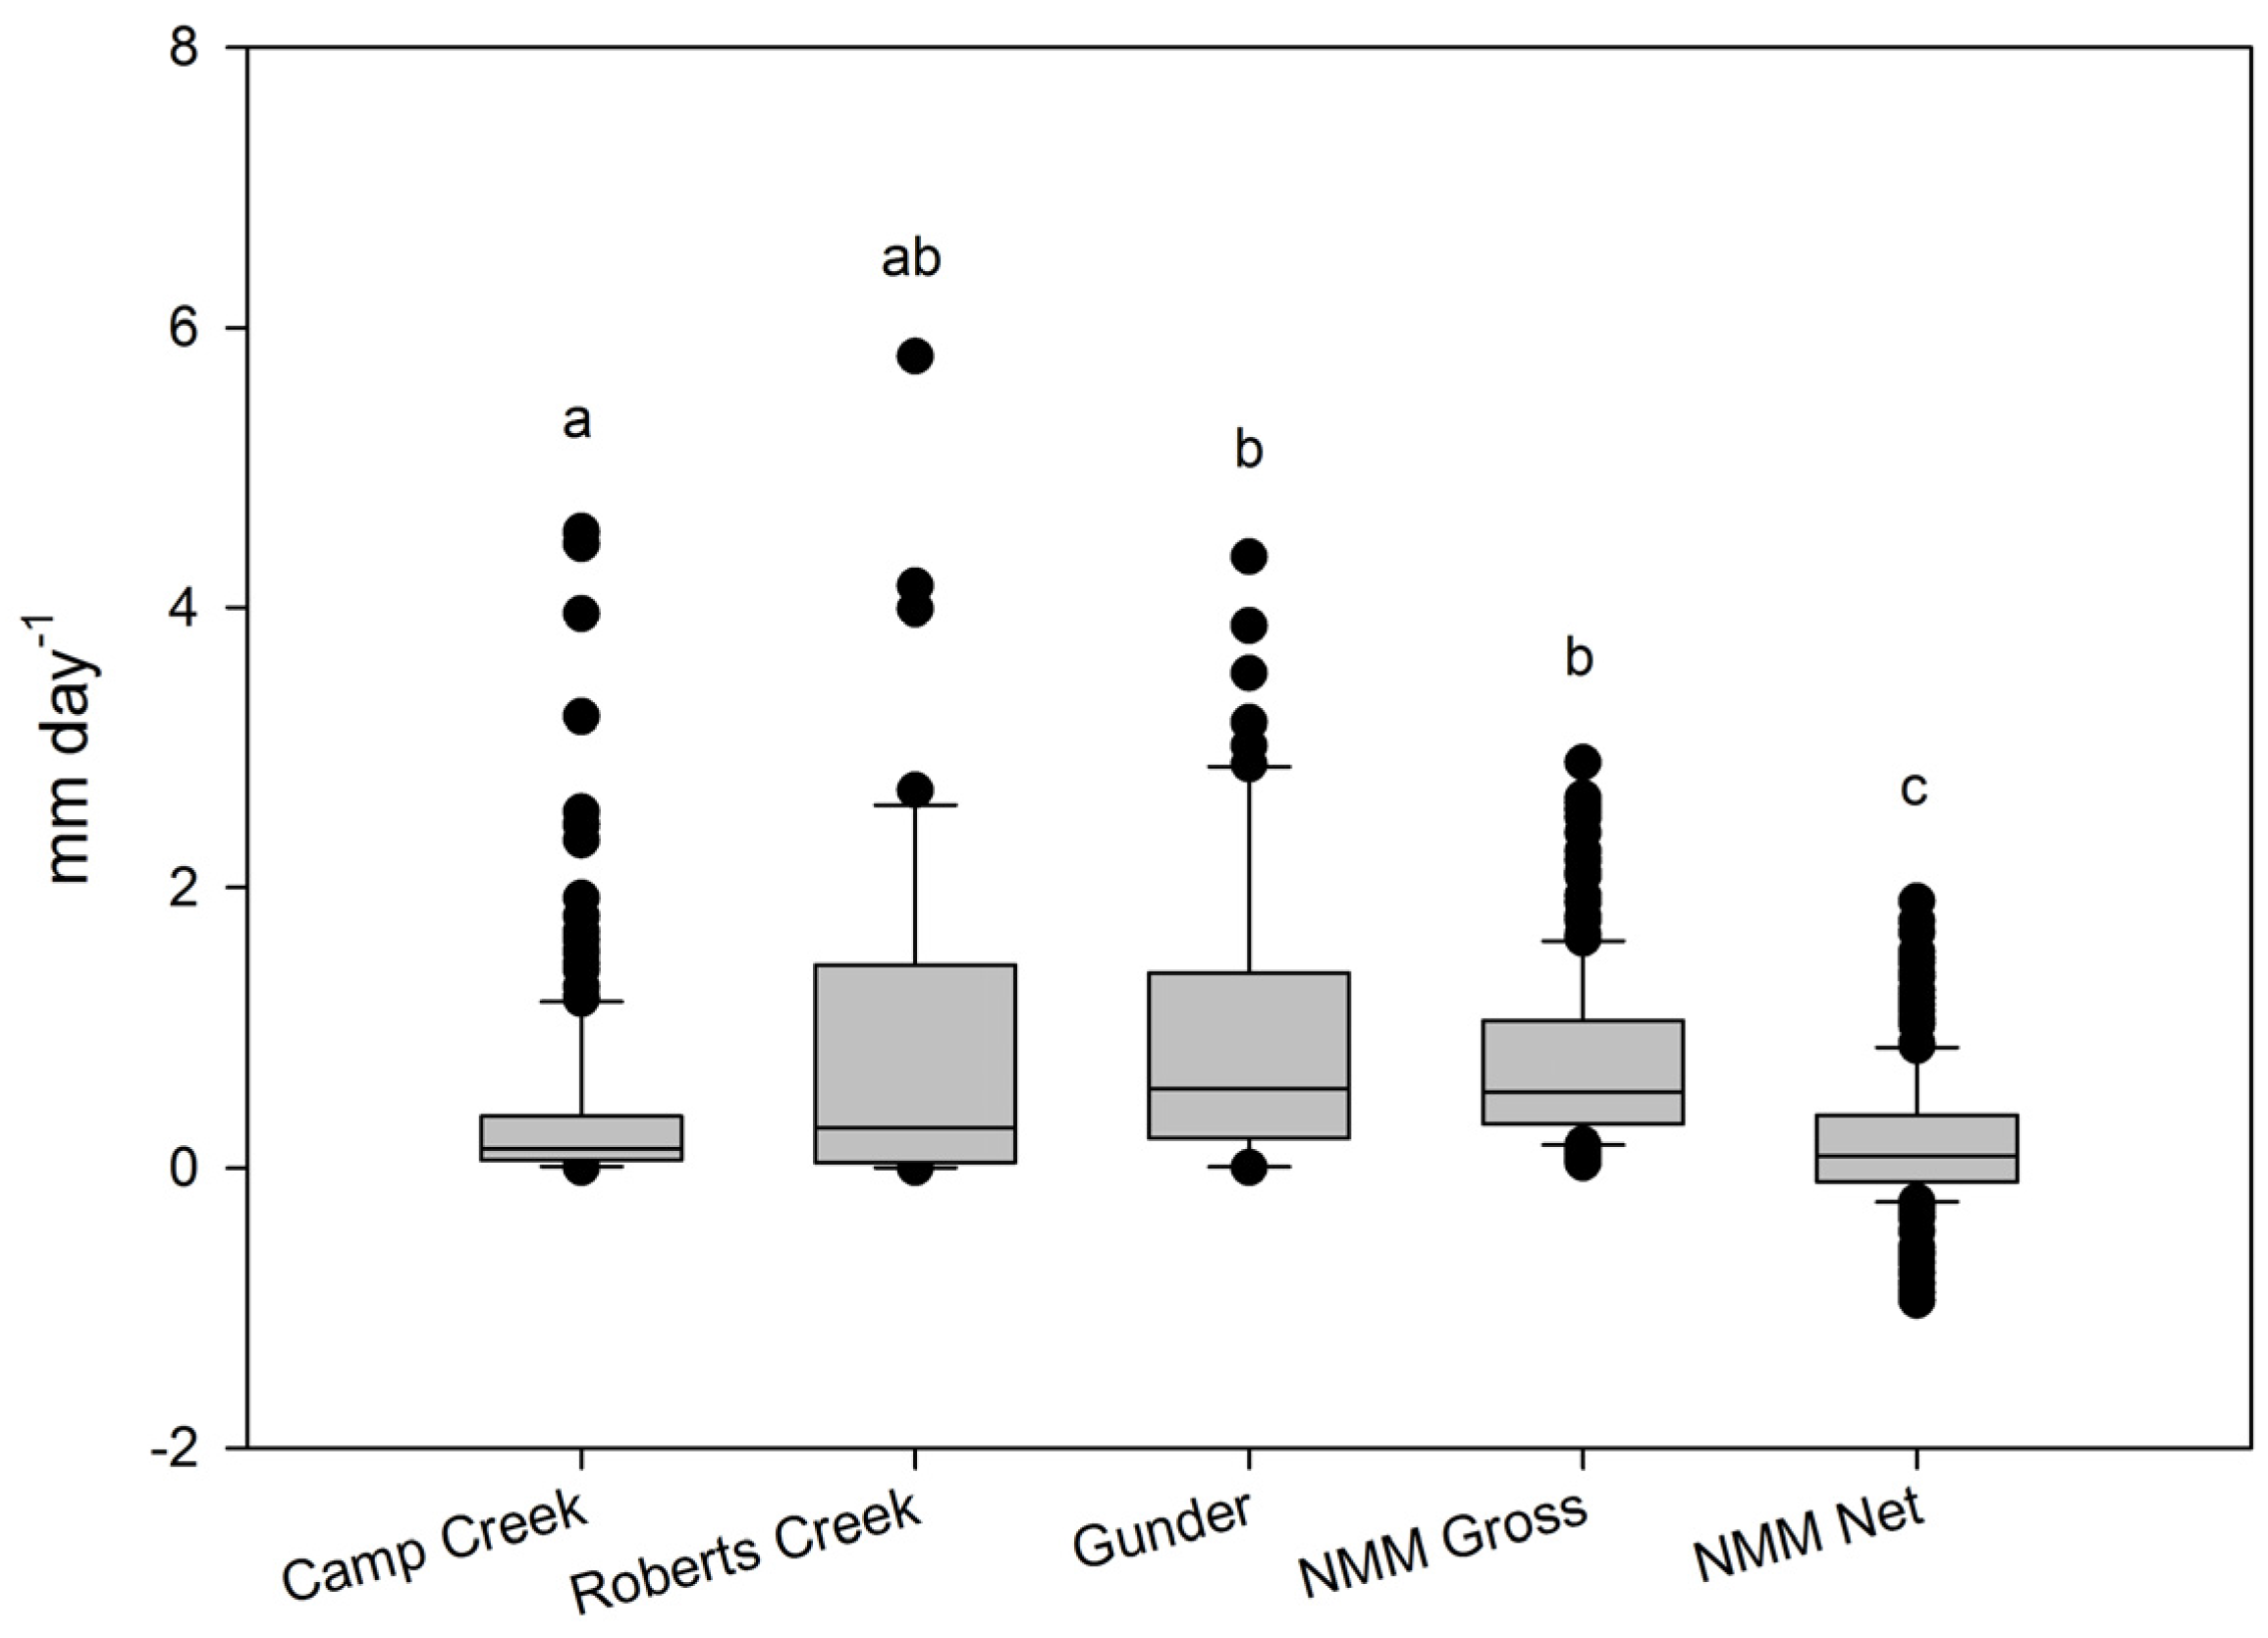
3.4.1. Daily Erosion Rate

No significant difference (p value < 0.05) in mean daily erosion rate was detected between Roberts Creek (0.89 mm day−1), Gunder (0.99 mm day−1), and NMM Gross (0.74 mm day−1) (Figure 7). The Camp Creek mean recession rate (0.39 mm day−1) was significantly lower (p value < 0.05) than Gunder, and NMM Gross, but not significantly different to Roberts Creek. The mean daily recession rate of NMM Net (0.19 mm day−1) was found to be significantly lower than all alluvial units, as well as NMM Gross. As noted in the methodology, NMM Net was the only unit to include negative recession rates (i.e., deposition).

3.4.2. Cumulative Recession

The Gunder and NMM Gross represented the greatest cumulative lateral recession over the study duration (64.1, 53.1 cm, respectively) (Figure 8). Gunder and NMM Gross were found to be significantly greater (p value < 0.1) than Camp Creek (26.8 cm), Roberts Creek (27.3 cm), and NMM Net (15.5 cm). No significant difference was detected between Camp Creek, Roberts Creek, and NMM Net (p value < 0.1).
Although not a primary study objective, cumulative mean recession for Total Bank (i.e., mean pin recession for individual banks, regardless of unit) was calculated for Year 1, Year 2, and study duration, for comparison to regional studies (Table 5). Total Bank mean cumulative recession was found to be 18.6 cm, and ranged from a minimum of 6.0 to a maximum of 42.3 cm. Year 1 exhibited a mean cumulative recession (12.3 cm) nearly double that of Year 2 (6.3 cm).

3.5. Streambank Sediment and TP Mass Loss

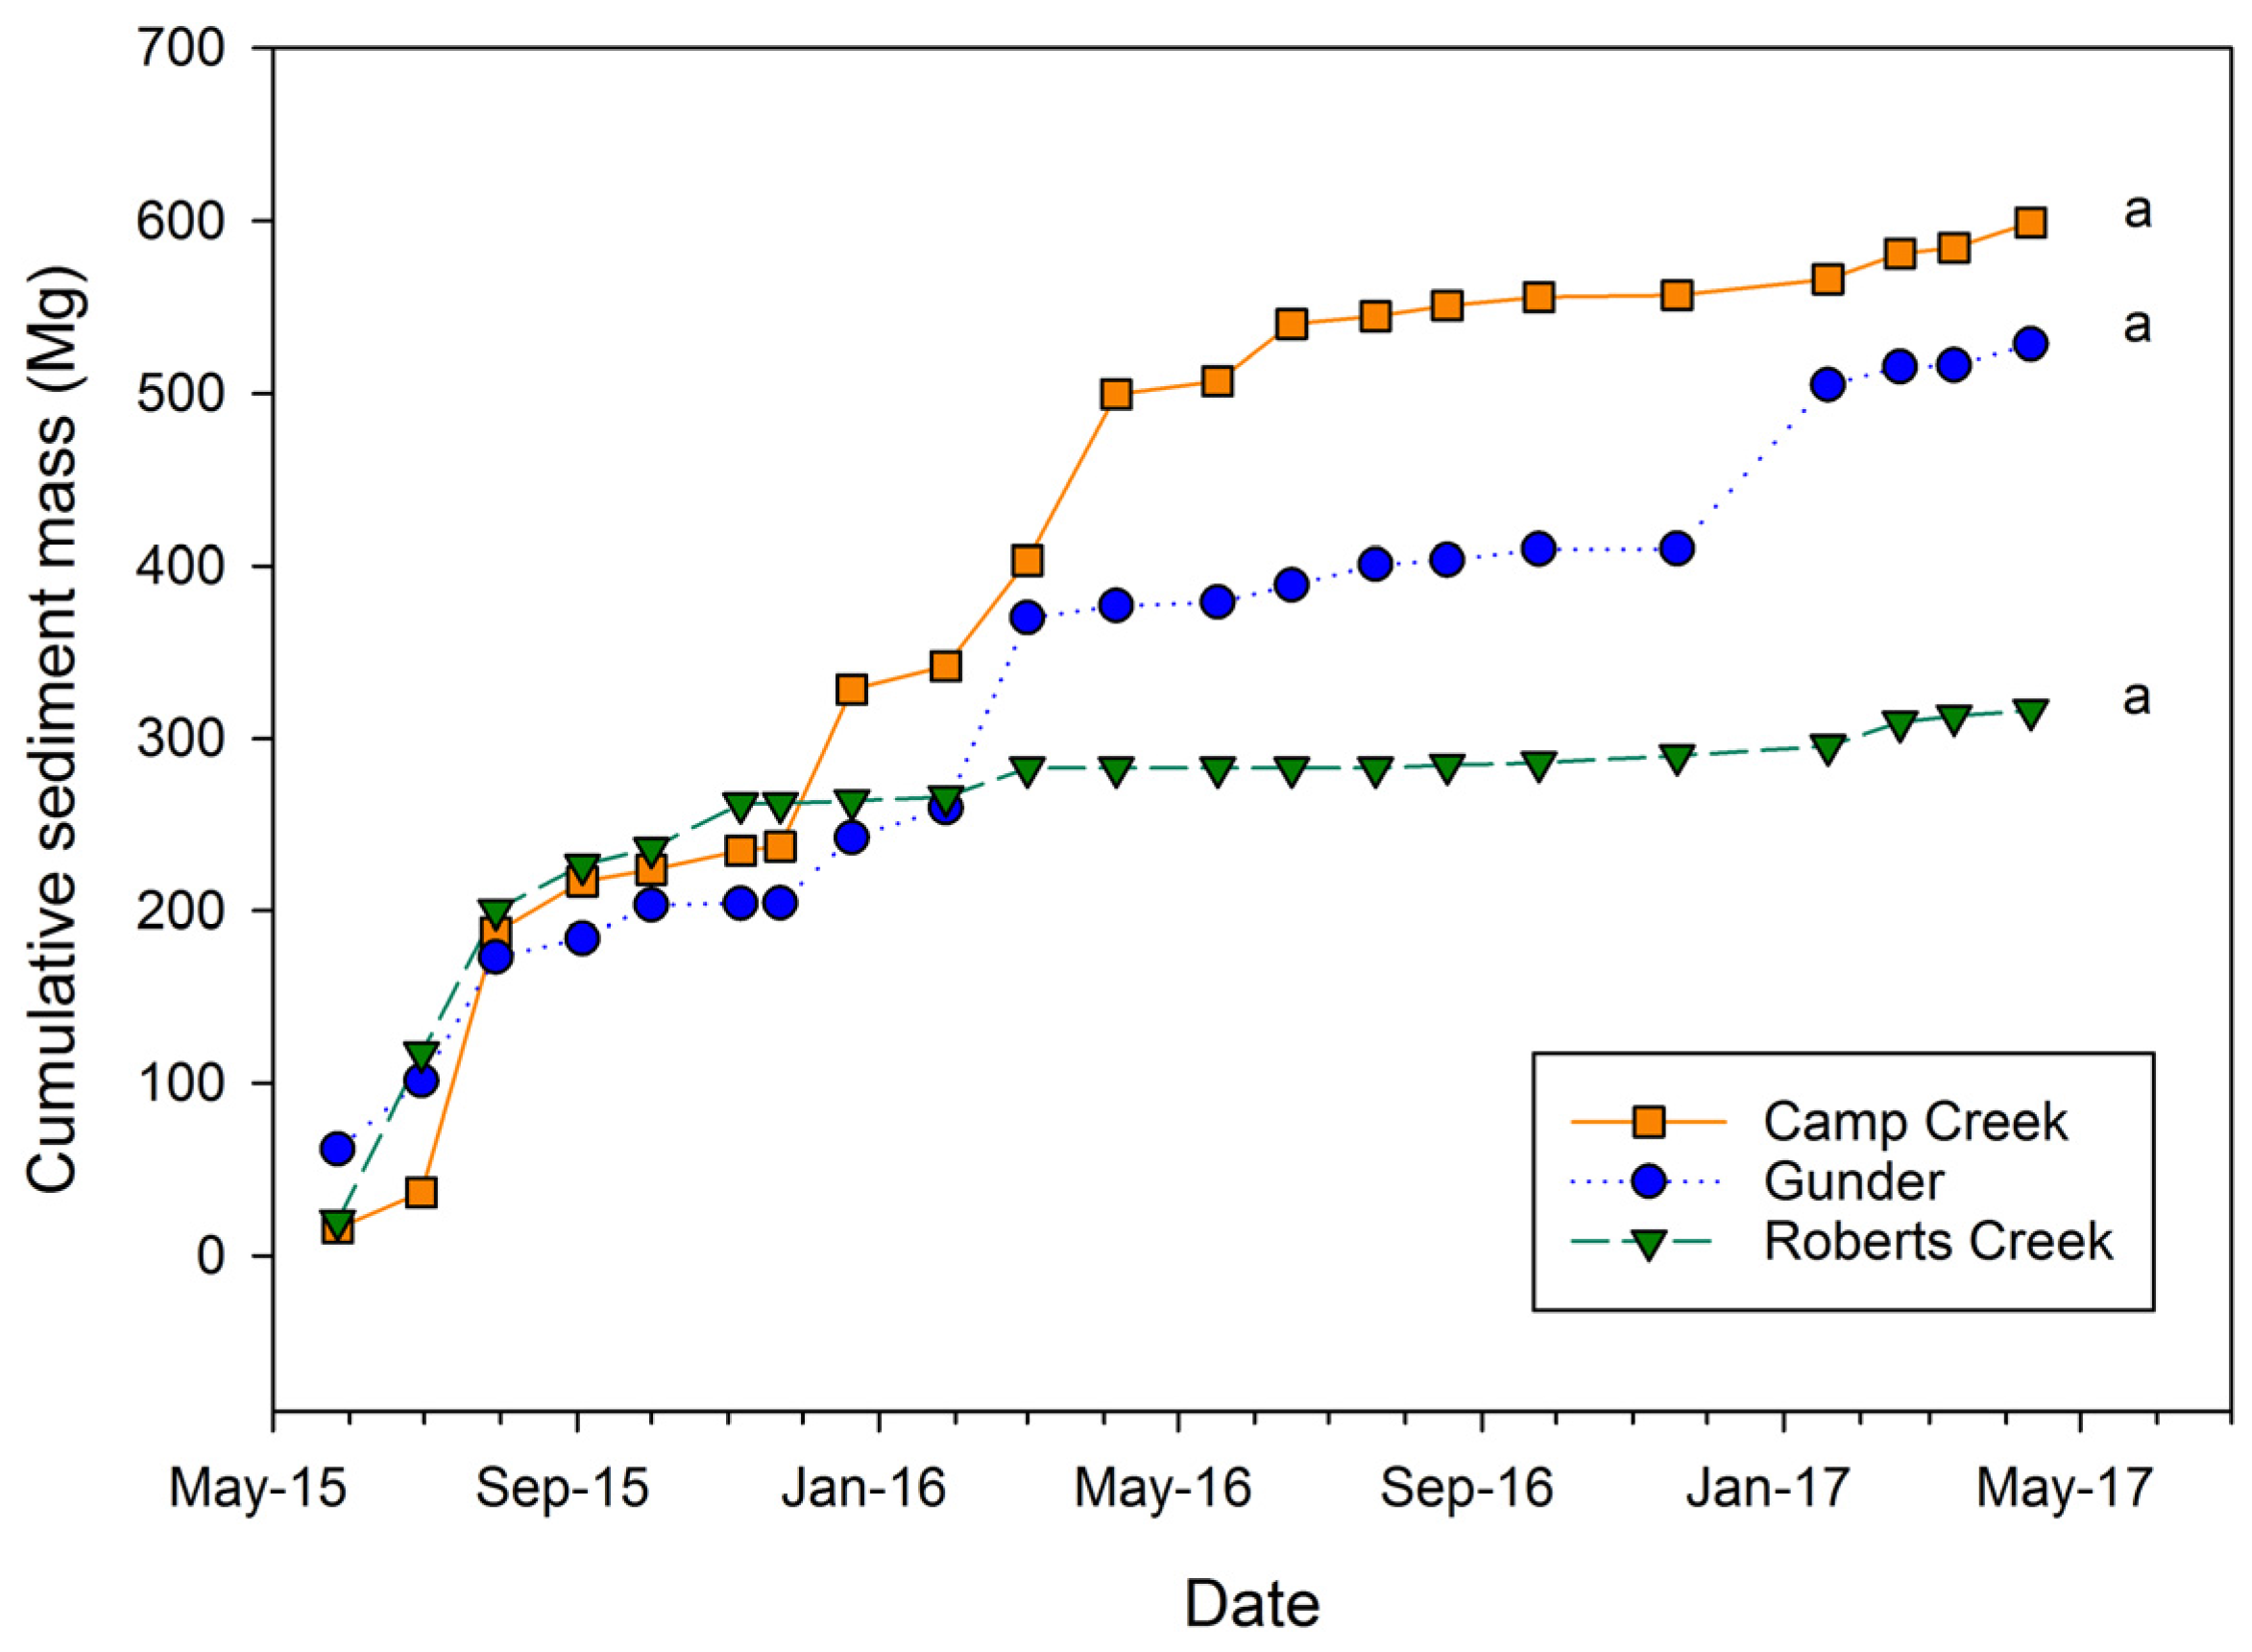
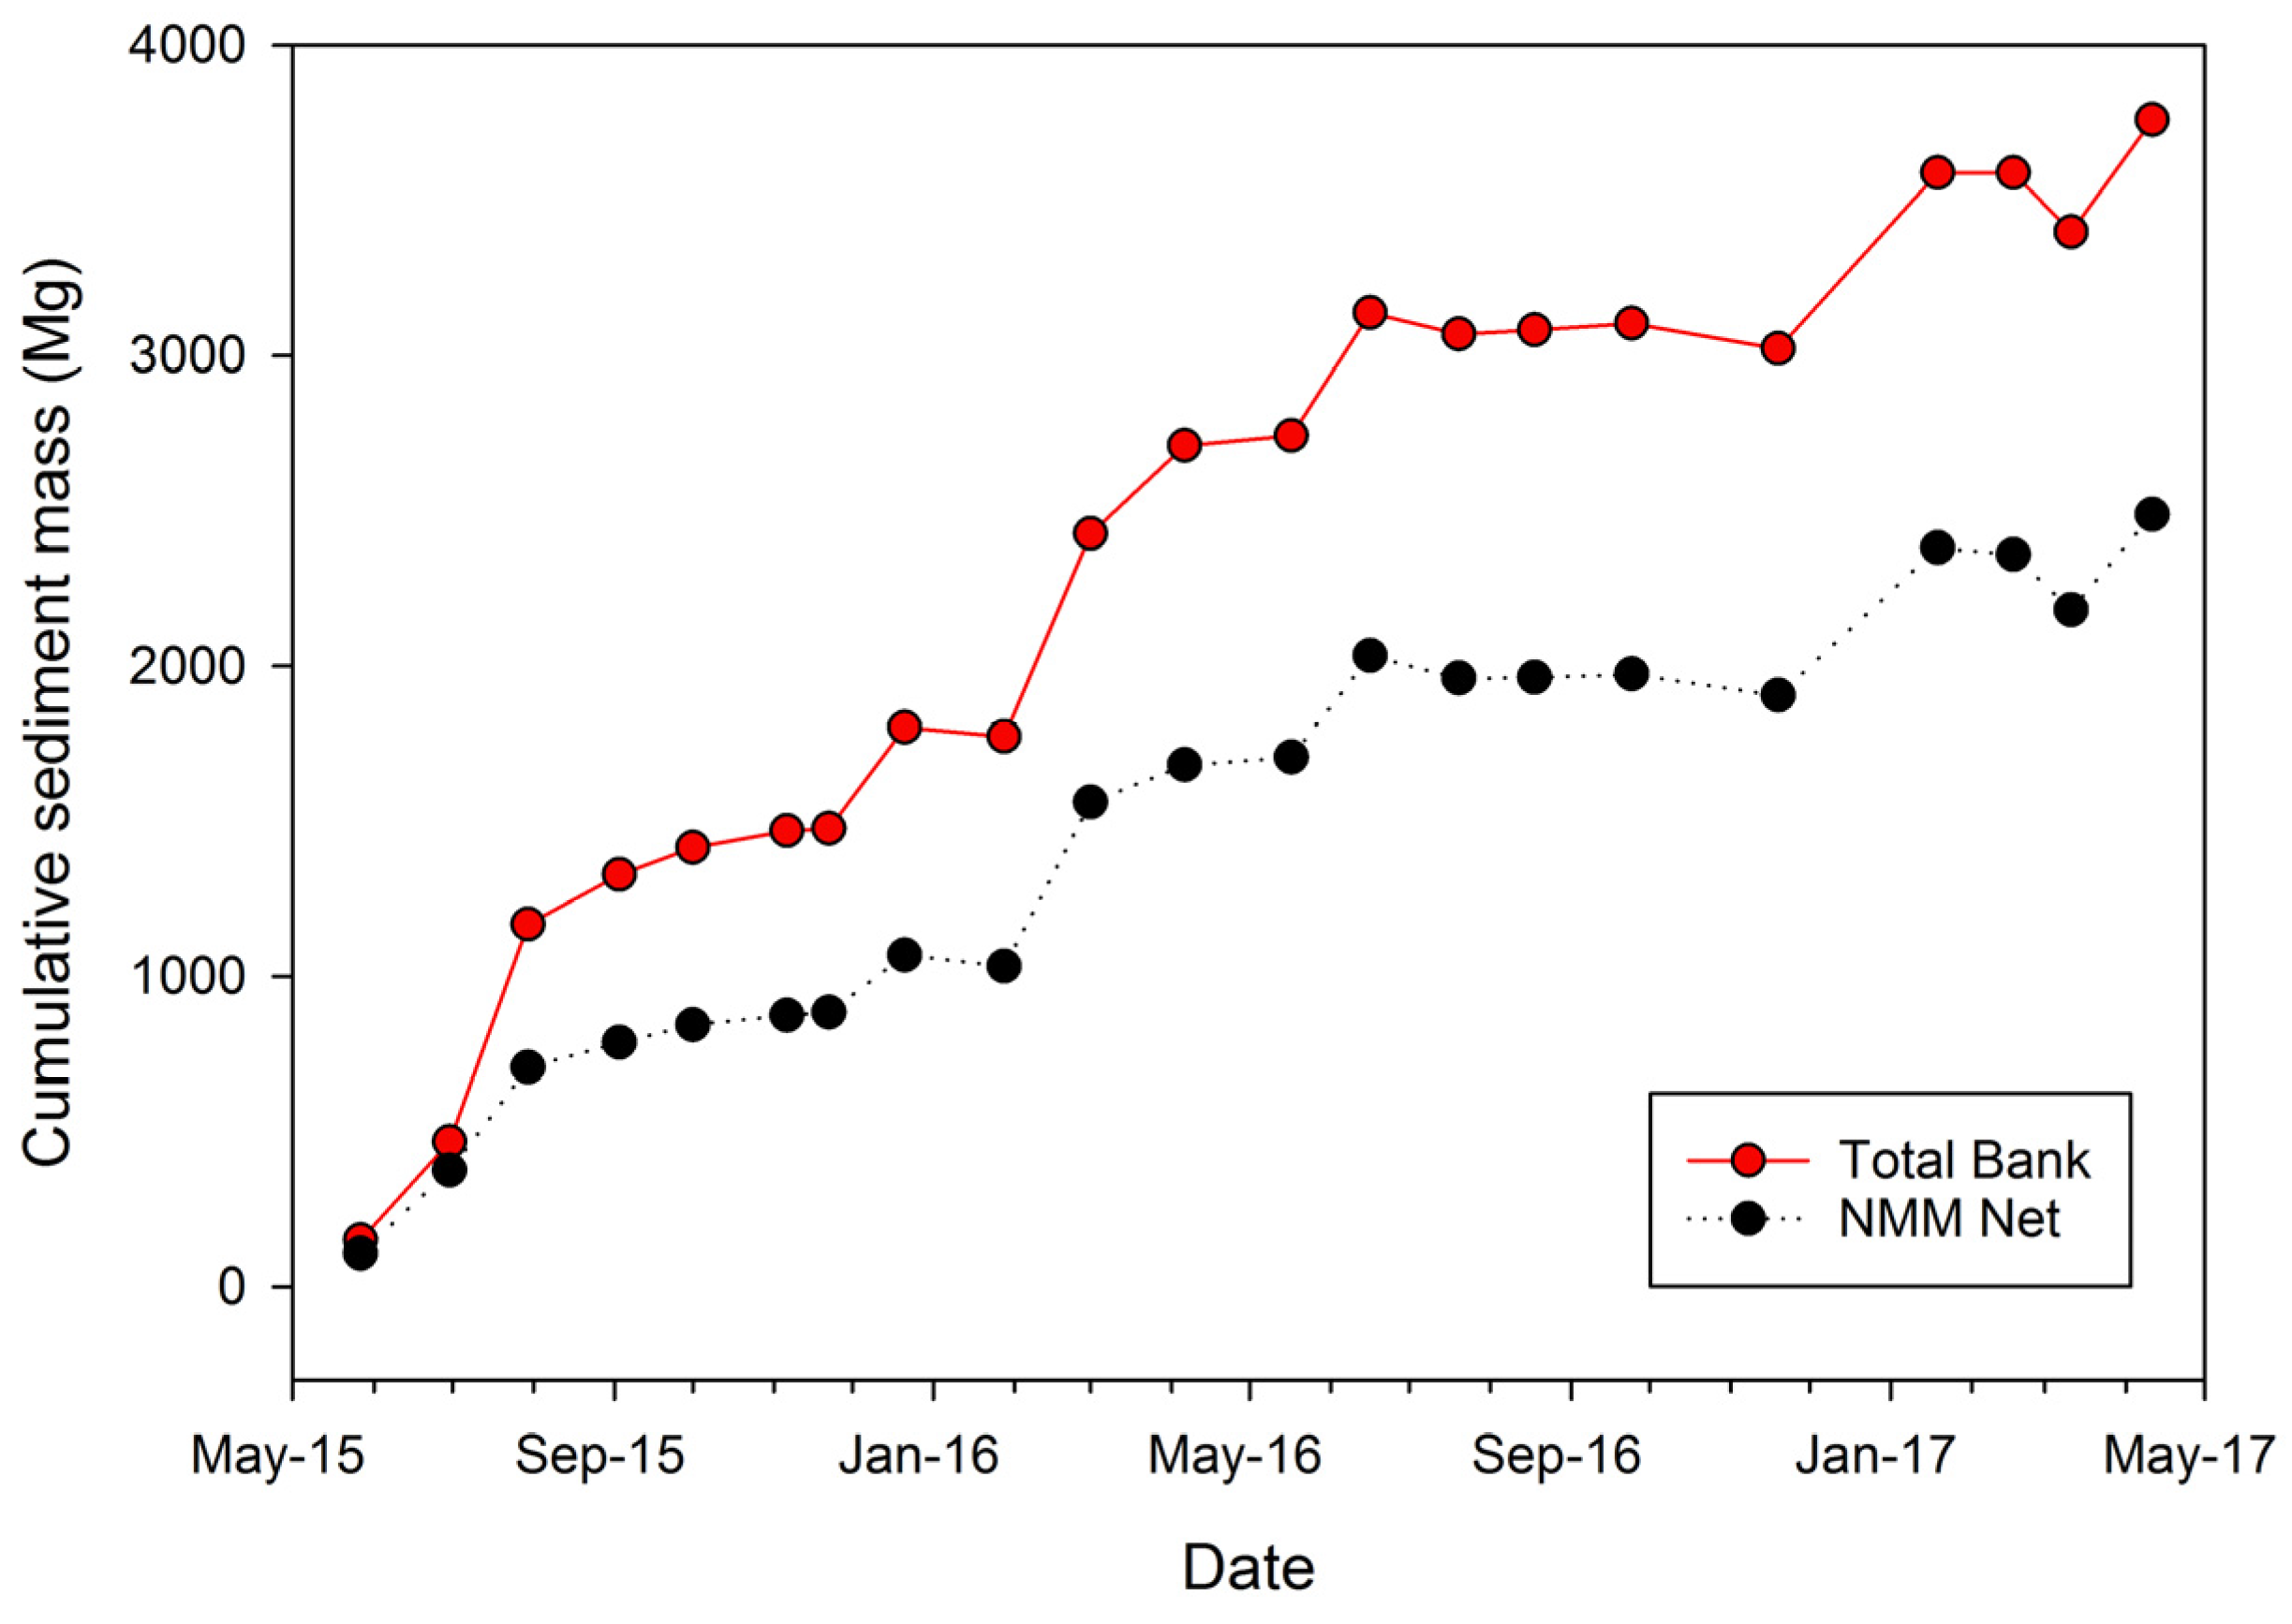
3.5.1. Cumulative Sediment Mass

Camp Creek exhibited the greatest mean cumulative sediment mass loss (598.9 Mg), followed by Gunder (528.31 Mg), and Roberts Creek (316.17 Mg) (Figure 9). Differences were not significant (p value = 0.13) among the three units, however, probably due to high variability among individual bank estimates. Although not tested statistically, a clear trend is apparent that the majority of sediment mass was lost from the Camp Creek, Roberts Creek, and Gunder units during Year 1 (Figure 9). Over the study duration, combined mean sediment mass loss from the Camp Creek, Roberts Creek, and Gunder units along Walnut Creek’s main stem totaled 1443.43 Mg.
NMM Net exhibited a mean of 2488.52 Mg cumulative sediment mass loss over the study duration (Figure 10). This mass was 1005.09 Mg greater than the combined loss of the Camp Creek, Roberts Creek, and Gunder units. Net NMM mean cumulative sediment mass loss was found to be significant greater (p value < 0.1) than individual contributions from the Camp Creek (p value = 0.023), Roberts Creek (p value = 0.063), and Gunder (p value = 0.096) units. Total bank mean cumulative sediment mass loss totaled 3759.95 Mg along Walnut Creek’s main stem (Figure 10). As with the three individual alluvial units, NMM Net and total bank cumulative sediment mass losses were greatest during Year 1.

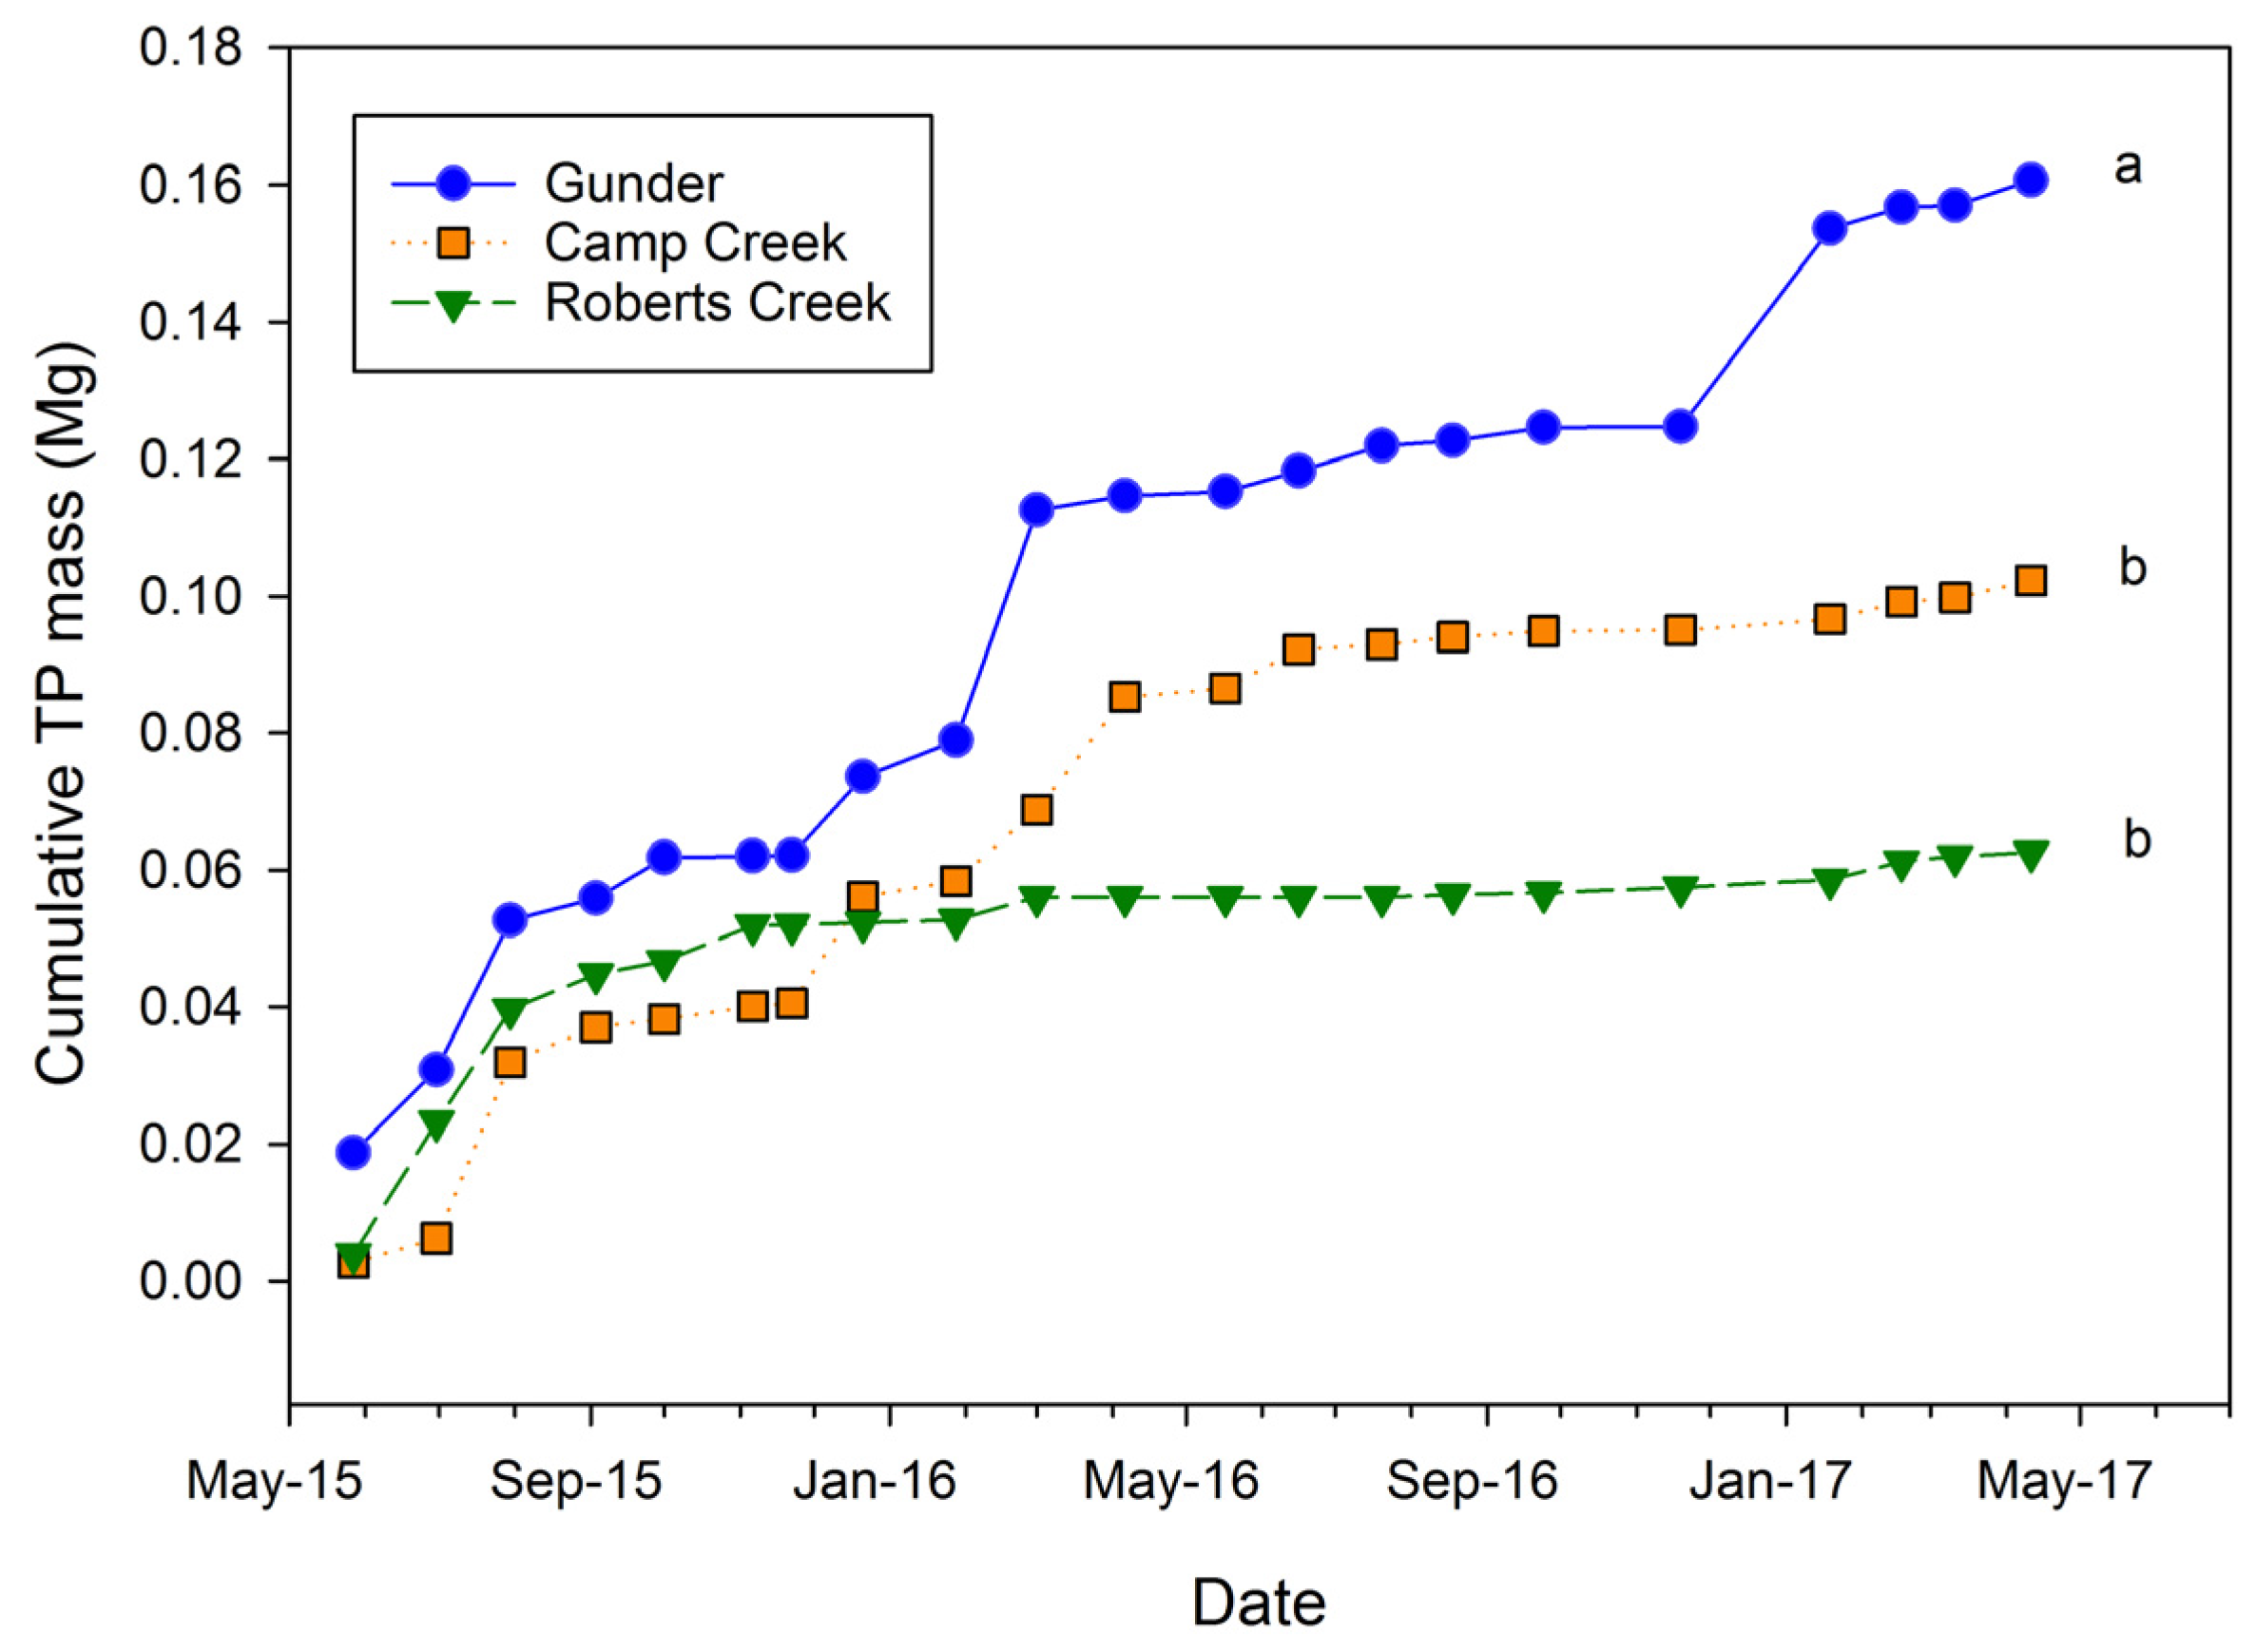
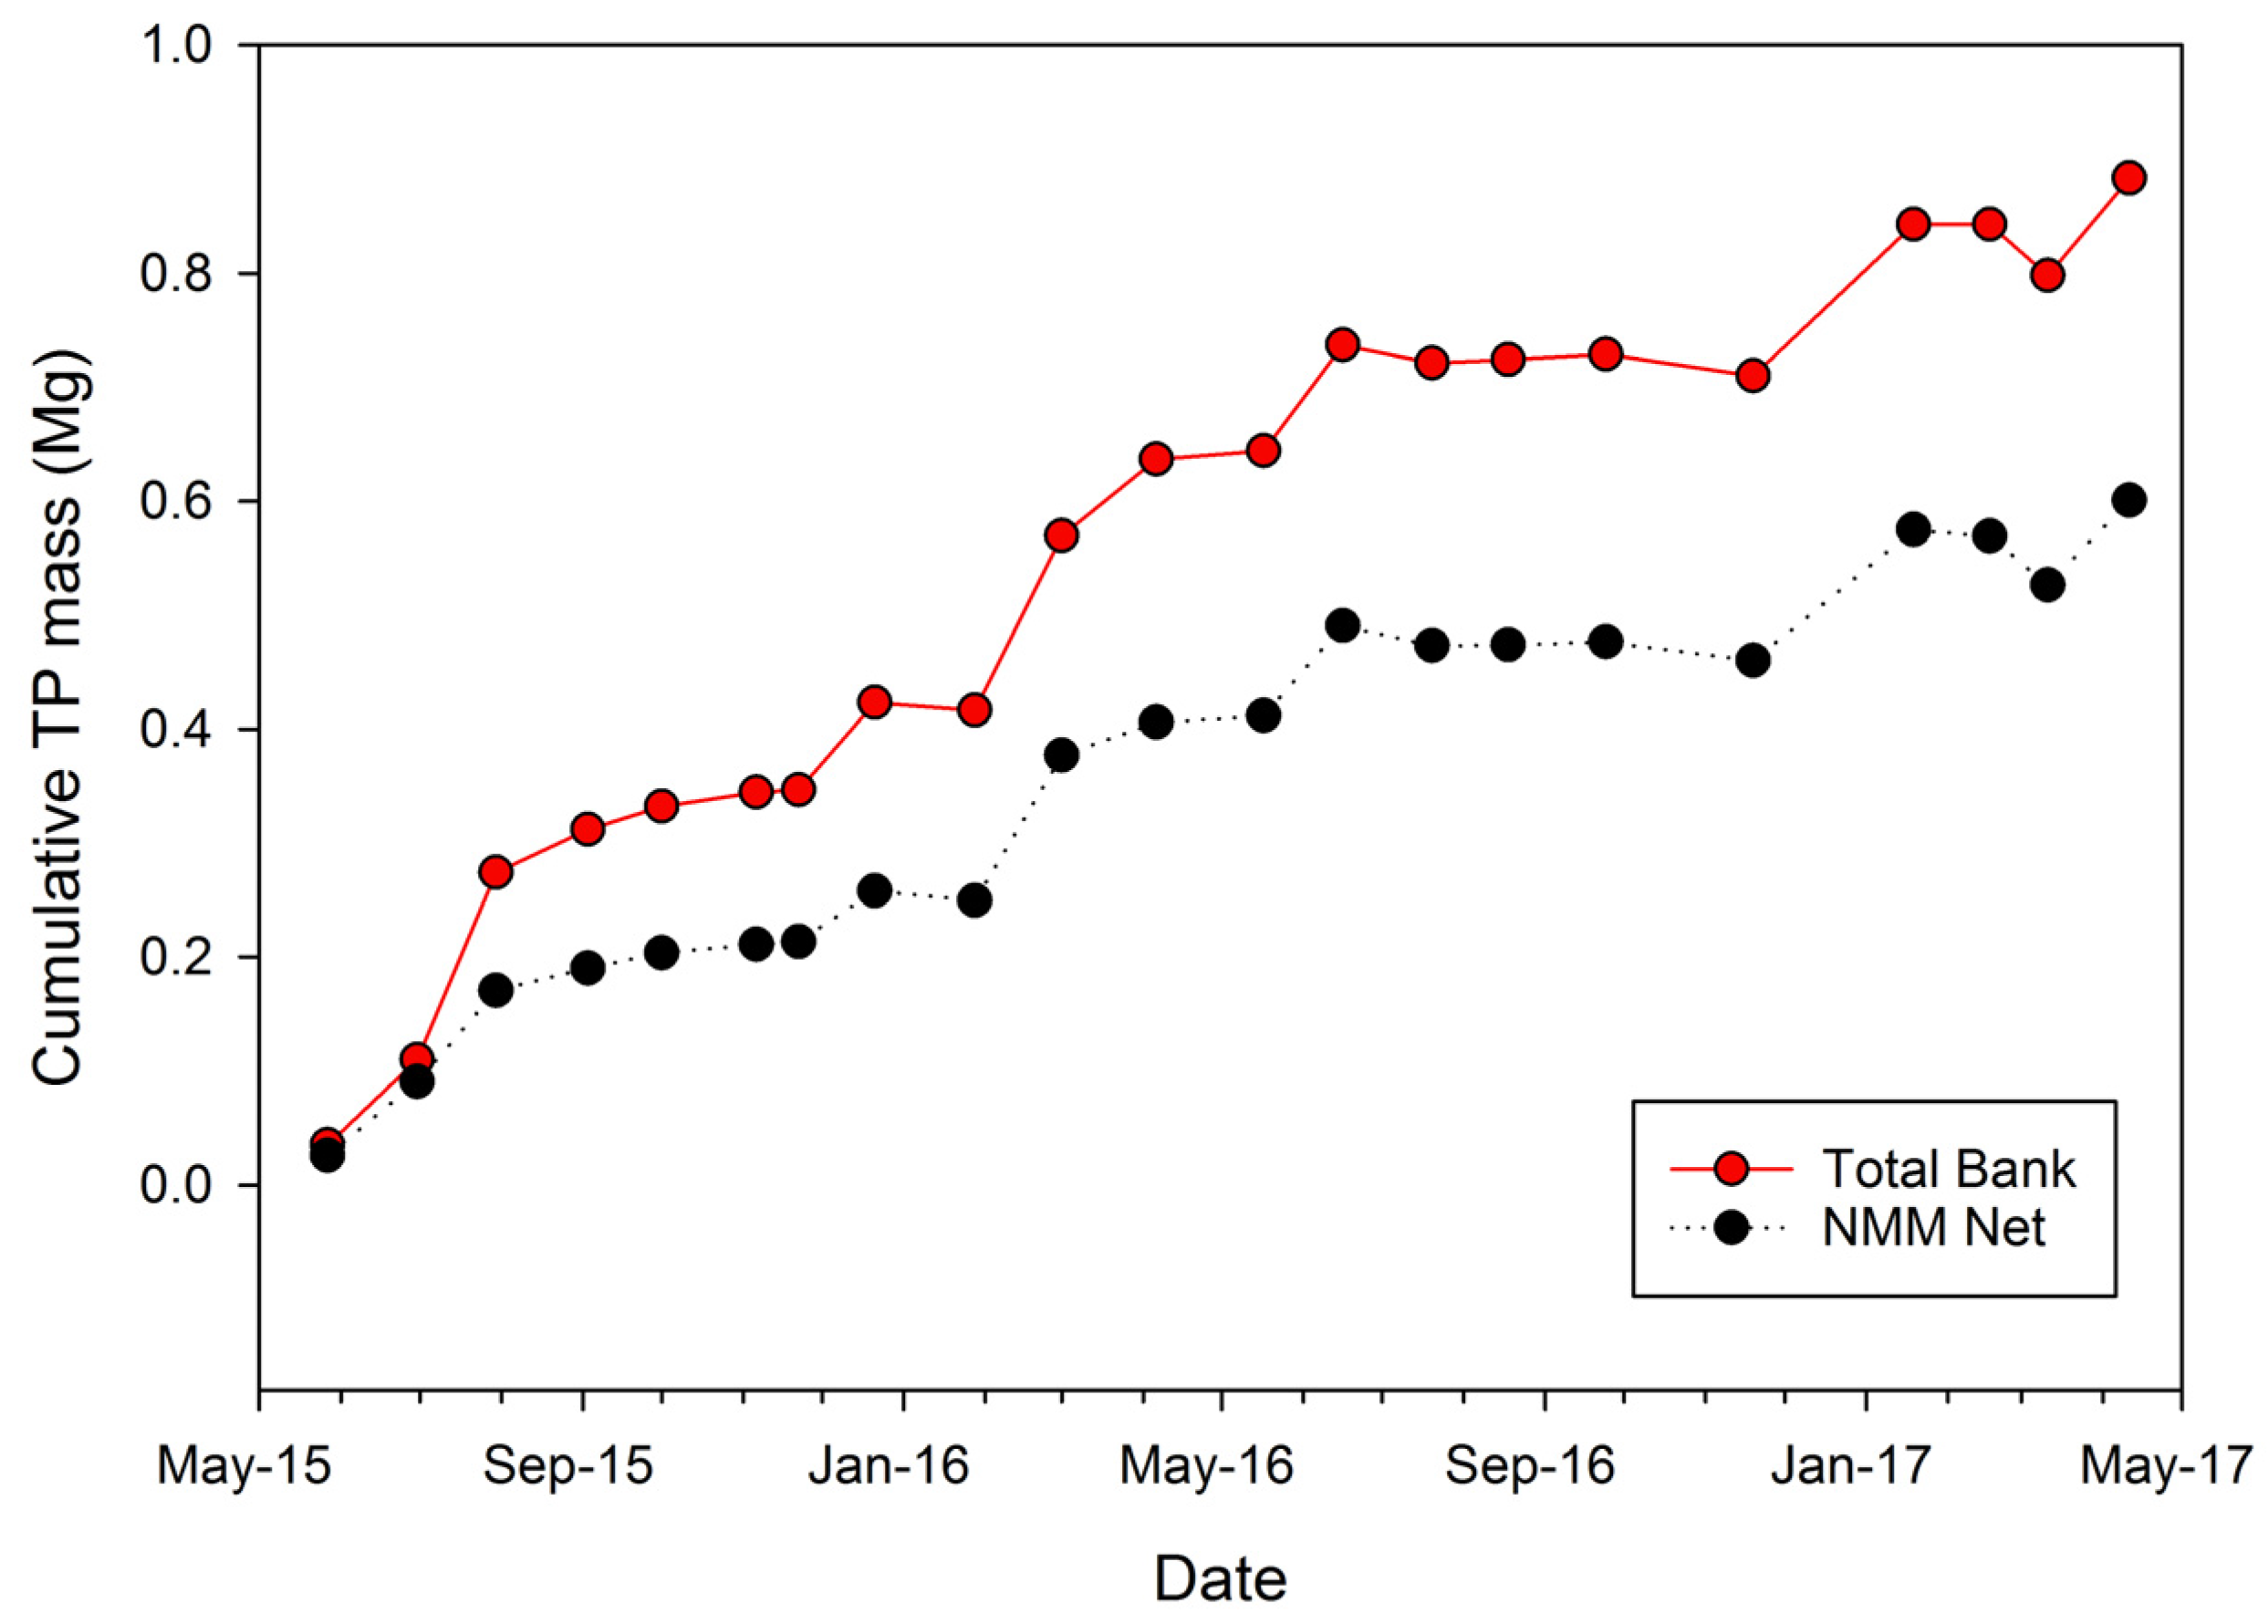
3.5.2. Cumulative TP Mass

Gunder exhibited the greatest cumulative mean TP mass loss (0.167 Mg) of the alluvial units, followed by Camp Creek (0.102 Mg), and Roberts Creek (0.062 Mg) (Figure 11). Similar to trends visible in Figure 9 and Figure 10, the majority of TP mass loss from all alluvial units occurred during Year 1 (Figure 11 and Figure 12). Over the study duration, combined mean TP mass loss from the Camp Creek, Roberts Creek, and Gunder units along Walnut Creek’s main stem totaled 0.326 Mg.
NMM Net exhibited 0.600 Mg cumulative mean TP mass loss (Figure 12). This mass was 0.274 Mg greater than the combined loss of the Camp Creek, Roberts Creek, and Gunder units. NMM Net cumulative mean TP mass loss was found to be significantly greater (p value < 0.1) than individual contributions from the Camp Creek (p value = 0.009), Roberts Creek (p value = 0.063), and Gunder (p value = 0.072) units. Total bank mean cumulative TP mass loss totaled 0.883 Mg along Walnut Creek’s main stem (Figure 12). As with the three individual alluvial units, NMM Net and total bank cumulative TP mass losses were greatest during Year 1.

3.6. Impact of Flow on Recession

Correlation estimates between total measurement period discharge (m3) and mean period recession (cm) were greater for all members than correlation between maximum measurement period discharge (m3 s−1) and mean period recession rate (mm day−1) (Figure 13). For correlation between total discharge and recession, Gunder exhibited the largest Pearson correlation coefficient (ρ = 0.64, p value = 0.002) as compared with Camp Creek (ρ = 0.54, p value = 0.012) and Roberts Creek (ρ = 0.18, p value = 0.43). Total bank and NMM Net exhibited correlations similar to Gunder (ρ = 0.68, 0.64, respectively, p value = 0.001, 0.002, respectively). NMM Gross recession exhibited the greatest correlation between total discharge of any streambank material (ρ = 0.75, p value = 0.0001).
Correlation between maximum measurement period discharge (m3 s−1) and mean period recession rate (mm day−1) was greatest for Gunder (ρ = 0.58, p value = 0.007) versus the other alluvial units (Figure 13). NMM Gross represented the greatest correlation with maximum discharge (ρ = 0.4, p value = 0.05) compared with total bank (ρ = 0.42, p value = 0.06) and NMM Net (ρ = 0.39, p value = 0.08).

4. Discussion

4.1. Streambank Suface Area

Alluvial units and NMM were found to represent different proportions of total streambank surface area, with NMM dominating coverage (Table 4). Mass wasting and subaerial erosion (e.g., freeze-thaw cycling leading to soil detachment) were pervasive during the study. These processes often produce an angled accumulation of material that builds upwards from the bank toe, veiling portions of the lower and mid bank [29,44,58,59]. These processes may drive alluvial unit exposure, as lower and mid bank (i.e., Gunder, Roberts Creek) units were covered to a disproportionately greater degree than the upper bank (i.e., Camp Creek) (Table 4). NMM coverage could have significant impacts on unit erosion, as the NMM may act to protect units from weathering and fluvial erosion. This pattern of NMM dominance is not uncommon in streams currently classified within stage IV of channel evolution [44].
Streamflow patterns may also influence streambank unit exposure. Surface area for streambank units and NMM decreased between Year 1 and Year 2 of the study. The locations and degree of change may be partially explained by stratigraphy and streamflow. Greater total streamflow in Year 1 (Table 2), along with two large, near out-of-bank events may have reduced upper bank NMM, allowing for a greater Camp Creek and Roberts Creek exposure. The lower flow in Year 2 may have allowed for increased NMM accretion, primarily as colluvium from upper units, with the resulting buildup reducing Camp Creek and Roberts Creek exposure. Gunder exposure decreased from Year 1 to Year 2, however, to a lesser degree than the Camp Creek and Roberts Creek. Stratigraphy may have played a role in this, as the Gunder’s position near the bank toe subjects it to near-continuous contact with flowing water.

4.2. Streambank Material Recession and Streamflow Impacts

Alluvial units and NMM differed significantly in both recession rate (mm day−1) and cumulative recession (cm). Materials spanned a wide spectrum of inherent soil properties (e.g., bulk density, texture, structure) which impact erodibility [60,61,62] (Table 3). However, in incised systems such as Walnut Creek, alluvial stratigraphy may also be a significant controlling factor.
Camp Creek exhibited both the lowest mean gross recession rate, and cumulative gross recession of all streambank materials (Figure 7). Compared with other streambank materials, Camp Creek has inherent soil properties that suggest low resistance to fluvial erosion, such as relatively low bulk density, high silt content, and granular structure. In addition, Layzell and Mandel [28] estimated the Camp Creek’s critical shear stress to be a relatively low 1.0 Pa, by means of an in situ submerged jet test in northeast Kansas. However, its position at the top of Walnut Creek’s incised streambanks suggests that its contact with the stream is limited to only the largest of flow events. This assumption has been verified by in situ time-lapse camera footage, flood modeling and has been suggested in other investigations Midwestern watersheds exhibiting channel incision [28]. In addition, given Walnut Creek’s flashy hydrology, the rare contact that Camp Creek does have with flowing water is brief in duration, which may reduce erosion potential at top of bank. Thus, it is likely that subaerial processes are an important erosional mechanism impacting the Camp Creek unit in Walnut Creek.
The Gunder member has inherent properties that suggest greater resistance to fluvial erosion, such as high bulk density, low silt content, and a critical shear stress of 10.4 Pa [28]. The Gunder, however, exhibited the greatest mean gross recession rate and cumulative recession of all streambank materials. Results are similar to those of Veihe et al. [38] and Laubel et al. [37] who reported highest erosion rates on lower bank regions. Again, stratigraphy may have played a significant role, as the Gunder’s position at the bank toe provides for near constant interaction with streamflow. In addition, proximity to flowing water and frequent water level fluctuations make the Gunder more susceptible to soil weakening through wetting-drying cycles [29,59] and needle ice formation [63] (field observation). The recession rate and cumulative recession of NMM Gross was slightly less than Gunder, albeit not significantly. Its inherent soil properties would suggest lower resistance to fluvial erosion (e.g., low bulk density, low clay content) (Table 3). It represented the majority of the bank toe and mid-bank regions of study streambanks, and thus may be subject to the same erosional processes as Gunder. The slight lower recession than Gunder may be due to presence of bank vegetation and non-vertical nature of the material (field observations).
The Roberts Creek member also has inherent properties, although different in nature than those of the Gunder, that suggest high resistance to fluvial erosion, such as high organic matter [27], relatively high clay content, and well-defined structure (Table 3). However, Roberts Creek exhibited a high gross recession rate, but low cumulative gross recession among the bank materials. Its relatively high range of period recession rates (Figure 7), along with its low cumulative recession (Figure 8) may suggest that the Roberts Creek is subject to infrequent mass wasting events. Its proximity mid-bank may result in reduced contact with streamflow, as well as reduced saturation frequency from wetting fronts below and above, which would act to increase soil cohesion [61].
Most streambank units exhibited a moderate correlation between mean period recession (cm) and total pin measurement period discharge (m3), as well as between mean period recession rate (mm day−1) and maximum mean daily discharge (m3 s−1) (Figure 13). Units present at bank toe region (i.e., Gunder, NMM Net, NMM Gross) had the greatest correlation with total period discharge. Total bank also exhibited a relatively strong correlation with total discharge. This may be expected, as NMM was found to represent 79.4–87.1% of total bank surface area. Among alluvial units, the correlation between recession rate and maximum discharge was strongest for Gunder and Camp Creek, and weakest for Roberts Creek. This trend may indicate that mass wasting may be a more important erosional process for Roberts Creek, compared with fluvial erosion.
Our recorded total streambank recession rates of 12.3 cm year−1 (Year 1) and 6.3 cm year−1 (Year 2) (Table 5) fell within the range of recession recorded during a previous Walnut Creek study [14]. During that study, total bank recession rates averaged 18.8 cm year−1 over a five-year period, with a minimum of −0.64 and a maximum of 34.2 cm year−1.

4.3. Sediment and TP Mass Losses

Camp Creek exhibited the greatest watershed-scale sediment mass loss among alluvial units (Figure 9). No significant difference was detected between units, however, most likely due to high variability among individual bank readings. This trend differs from that seen in the recession analyses, where Gunder exhibited a significantly higher recession rate and cumulative recession than Camp Creek. NMM Net contributed the greatest sediment mass of any streambank material, nearly 2.5 times the mass contributed by Camp Creek, Roberts Creek, and Gunder combined. This trend points to the importance of surface area representation, as NMM Net exhibited lower recession rate and cumulative recession than any alluvial unit. Total bank sediment mass contribution closely followed the temporal trends of NMM Net (Figure 10), again underscoring the importance of streambank surface area representation in terms of potential load contributions. Alluvial units, however, contributed greater sediment mass per unit surface area than NMM Net, especially Gunder (Figure 9 and Figure 10, Table 4). Gunder may be expected to contribute more mass per surface area, due to its relatively high bulk density and greater recession (Table 3, Figure 7 and Figure 8). Sediment mass contributions may be influenced temporally by stratigraphy. Because of position, material that comprises the bank toe (i.e., Gunder, NMM) may act as an immediate source of sediment to waterways once eroded. Mass losses from upper units (i.e., Camp Creek, Roberts Creek), however, may be stored as NMM following detachment, thus acting as a longer-term source of sediment as compared with losses from a lower stratigraphic position.
Trends in TP mass loss closely follow those of sediment mass. As with sediment mass, NMM Net TP mass contribution was nearly double than the combined contributions of Camp Creek, Roberts Creek, and Gunder (Figure 11 and Figure 12). As opposed to sediment mass trends, Gunder represented the greatest TP mass contributor among alluvial units, being significantly higher than contributions of Camp Creek and Roberts Creek (Figure 11). This is most likely due to Gunder’s greater TP concentration (Table 3). Similar to sediment mass trends, alluvial units contributed more TP per unit surface area than NMM Net, with Gunder again contributing the most TP per unit surface area of the alluvial units (Figure 11 and Figure 12, Table 3).
At time of publication, Walnut Creek suspended sediment and TP loads for Year 1 and Year 2 were not yet quantified. However, Palmer et al. [14] previously reported Walnut Creek annual suspended sediment loads ranging from 6172 to 25,815 Mg with streambank contributions ranging from 1.5 to 53% of watershed loads. Our calculated total bank sediment losses for Year 1 and Year 2 were 2710.5 and 1049.3 Mg, respectively. Our reported losses would equate to between 4.0 and 43.9% of annual loads reported by Palmer et al. [14]. When estimated by individual units, sediment losses would equate to 0.4–8.0% (Camp Creek), 0.1–4.6% (Roberts Creek), 0.5–6.1% (Gunder) and 3.1–27.3% (NMM Net) of previously reported annual loads.
No TP loads were reported during the previous Walnut Creek study; however, Schilling et al. [40] reported Walnut Creek annual TP loads ranging from 1.7 to 9.0 Mg year−1 for the years 2000 through 2005. In the context of these data, total streambank annual TP mass losses measured in this study would be equivalent to between 2.7 and 37.5% of annual loads. Individual alluvial unit contributions would range from <0.1 to 6.7%. Our streambank suspended sediment and TP load contribution estimates fall within ranges reported in the literature [5,6,8,15,21]; however, they occupied the mid-to-lower end of the spectrum.

5. Conclusions

The three members of the Holocene DeForest Formation that comprise Walnut Creek streambanks (i.e., Camp Creek, Roberts Creek, Gunder) represented a relatively small proportion of total streambank-face surface area, and were relatively minor contributors to the overall sediment and TP mass losses coming from streambanks. Individual member (i.e., alluvial unit) mass losses equated to between 0.1 and 8% of historic annual watershed suspended sediment loads, and between <0.1 and 6.7% of historic annual watershed TP loads. Non-member material (NMM) dominated the streambank-face surface area and contributed the majority of sediment and TP mass streambank losses. NMM is a mixture of colluvium, weathered member material, and alluvium that frequently draped portions of banks. Specific alluvial units exhibited significantly greater net recession rates, cumulative recession, and represented a greater sediment and TP source per unit surface area versus NMM. However, the dominance of bank surface area by NMM resulted in NMM acting as the primary source material for sediment and TP losses from streambanks.
Stratigraphic position may have played a significant role in the recession and resulting sediment and TP losses of alluvial units, and should be considered in future research intent on quantifying sediment and TP contributions from streambanks. Position will determine frequency and duration of alluvial unit contact with eroding streamflow, as well as the degree to which each unit is impacted by varying erosional processes (e.g., fluvial, subaerial, mass wasting). Although alluvial unit sediment mass contribution to overall bank losses was minor, further research is needed as to the proportional impact these specific materials will have on in-stream P dynamics once eroded.

6. Patents

No patents resulted from this work.

Acknowledgments

This project was supported by the Agriculture and Food Research Initiative (AFRI), Competitive Grant # 2013-67019-21393, from the United States Department of Agriculture National Institute of Food and Agriculture. Funds from this grant were used to cover the cost of publish in open access. The authors thank The United States Department of Agriculture, Agricultural Research Service, National Laboratory for Agriculture and the Environment, Ames, IA, USA for assistance with total phosphorus analysis, wet aggregate stability analysis, and providing hydrological data pertinent to this study. The authors thank Leigh Ann Long, Iowa State University, Department of Agricultural and Biosystems Engineering, for assistance with soil textural analysis. The authors thank The United States Fish and Wildlife Service, Department of Interior, Neal Smith National Wildlife Refuge, as well as Jasper County, IA landowners, for providing access to field study sites.

Author Contributions

Tom Isenhart, Richard Schultz, Keith Schilling, Peter Moore, Mark Tomer, and William Beck conceived and designed the experiments associated with this paper. William Beck primarily performed the experiments, with field data collection assistance from Richard Schultz, Peter Moore, and Keith Schilling. William Beck wrote the paper, with editorial assistance from all co-authors.

Conflicts of Interest

The authors declare no conflict of interest.

References

  1. EPA National Summary of Impaired Waters and TMDL Information|Water Quality Assessment and TMDL Information|US EPA. Available online: https://iaspub.epa.gov/waters10/attains_nation_cy.control?p_report_type=T (accessed on 12 January 2018).
  2. Smith, V.H. Eutrophication of freshwater and coastal marine ecosystems a global problem. Environ. Sci. Pollut. Res. 2003, 10, 126–139. [Google Scholar] [CrossRef]
  3. Daniel, T.C.; Sharpley, A.N.; Lemunyon, J.L. Agricultural Phosphorus and Eutrophication: A Symposium Overview. J. Environ. Qual. 1998, 27, 251. [Google Scholar] [CrossRef]
  4. Fox, G.A.; Purvis, R.A.; Penn, C.J. Streambanks: A net source of sediment and phosphorus to streams and rivers. J. Environ. Manag. 2016, 181, 602–614. [Google Scholar] [CrossRef] [PubMed]
  5. Hamlett, J.M.; Baker, J.L.; Johnson, H.P. Channel morphology changes and sediment yield for a small agricultural watershed in Iowa. Am. Soc. Agric. Eng. 1983, 26, 1390–1396. [Google Scholar] [CrossRef]
  6. Odgaard, A.J. Streambank erosion along two rivers in Iowa. Water Resour. Res. 1987, 23, 1225–1236. [Google Scholar] [CrossRef]
  7. Wilkin, D.C.; Hebel, S.J. Erosion, redeposition, and delivery of sediment to midwestern streams. Water Resour. Res. 1982, 18, 1278–1282. [Google Scholar] [CrossRef]
  8. Thoma, D.P.; Gupta, S.C.; Bauer, M.E.; Kirchoff, C.E. Airborne laser scanning for riverbank erosion assessment. Remote Sens. Environ. 2005, 95, 493–501. [Google Scholar] [CrossRef]
  9. Mukundan, R.; Radcliffe, D.E.; Ritchie, J.C.; Risse, L.M.; McKinley, R.A. Sediment Fingerprinting to Determine the Source of Suspended Sediment in a Southern Piedmont Stream. J. Environ. Qual. 2010, 39, 1328. [Google Scholar] [CrossRef] [PubMed]
  10. Wilson, C.G.; Kuhnle, R.A.; Bosch, D.D.; Steiner, J.L.; Starks, P.J.; Tomer, M.D.; Wilson, G.V. Quantifying relative contributions from sediment sources in Conservation Effects Assessment Project watersheds. J. Soil Water Conserv. 2008, 63, 523–532. [Google Scholar] [CrossRef]
  11. Belmont, P.; Gran, K.B.; Schottler, S.P.; Wilcock, P.R.; Day, S.S.; Jennings, C.; Lauer, J.W.; Viparelli, E.; Willenbring, J.K.; Engstrom, D.R.; et al. Large shift in source of fine sediment in the upper Mississippi River. Environ. Sci. Technol. 2011, 45, 8804–8810. [Google Scholar] [CrossRef] [PubMed]
  12. Willett, C.D.; Lerch, R.N.; Schultz, R.C.; Berges, S.A.; Peacher, R.D.; Isenhart, T.M. Streambank erosion in two watersheds of the Central Claypan Region of Missouri, United States. J. Soil Water Conserv. 2012, 67, 249–263. [Google Scholar] [CrossRef]
  13. Gellis, A.C.; Fuller, C.C.; Van Metre, P.C. Sources and ages of fine-grained sediment to streams using fallout radionuclides in the Midwestern United States. J. Environ. Manag. 2017, 194, 73–85. [Google Scholar] [CrossRef] [PubMed]
  14. Palmer, J.A.; Schilling, K.E.; Isenhart, T.M.; Schultz, R.C.; Tomer, M.D. Streambank erosion rates and loads within a single watershed: Bridging the gap between temporal and spatial scales. Geomorphology 2014, 209, 66–78. [Google Scholar] [CrossRef]
  15. Bull, L.J. Magnitude and variation in the contribution of bank erosion to the suspended sediment load of the River Severn, UK. Earth Surf. Process. Landf. 1997, 22, 1109–1123. [Google Scholar] [CrossRef]
  16. Walling, D.E.; Woodward, J.C. Tracing sources of suspended sediment in river basins: A case study of the River Culm, Devon, UK. Mar. Freshw. Res. 1995, 46, 327–336. [Google Scholar] [CrossRef]
  17. Russell, M.A.; Walling, D.E.; Hodgkinson, R. Suspended sediment sources in two small lowland agricultural catchments in the UK. J. Hydrol. 2001, 252, 1–24. [Google Scholar] [CrossRef]
  18. Kronvang, B.; Laubel, A.; Grant, R. Suspended sediment and particulate phosphorus transport and delivery pathways in an arable catchment, Gelbaek Stream, Denmark. Hydrol. Process. 1997, 11, 627–642. [Google Scholar] [CrossRef]
  19. Sekely, A.C.; Mulla, D.J.; Bauer, D.W. Streambank slumping and its contribution to the phosphorus and suspended sediment loads of the Blue Earth River, Minnesota. J. Soil Water Conserv. 2002, 57, 243–250. [Google Scholar] [CrossRef]
  20. Miller, R.B.; Fox, G.A.; Penn, C.J.; Wilson, S.; Parnell, A.; Purvis, R.A.; Criswell, K. Estimating sediment and phosphorus loads from streambanks with and without riparian protection. Agric. Ecosyst. Environ. 2014, 189, 70–81. [Google Scholar] [CrossRef]
  21. Walling, D.E.; Collins, A.L.; Stroud, R.W. Tracing suspended sediment and particulate phosphorus sources in catchments. J. Hydrol. 2008, 350, 274–289. [Google Scholar] [CrossRef]
  22. Iowa Department of Agriculture and Land Stewardship; Iowa Department of Natural Resources. ISU Iowa Nutrient Reduction Strategy; Iowa State University: Ames, IA, USA, 2014; Volume 27. [Google Scholar]
  23. Parker, C.; Simon, A.; Thorne, C.R. The effects of variability in bank material properties on riverbank stability: Goodwin Creek, Mississippi. Geomorphology 2008, 101, 533–543. [Google Scholar] [CrossRef]
  24. Kessler, A.C.; Gupta, S.C.; Brown, M.K. Assessment of river bank erosion in Southern Minnesota rivers post European settlement. Geomorphology 2013, 201, 312–322. [Google Scholar] [CrossRef]
  25. Daly, E.R.; Fox, G.A.; Al-Madhhachi, A.-S.T.; Storm, D.E. Variability of fluvial erodibility parameters for streambanks on a watershed scale. Geomorphology 2015, 231, 281–291. [Google Scholar] [CrossRef]
  26. Konsoer, K.M.; Rhoads, B.L.; Langendoen, E.J.; Best, J.L.; Ursic, M.E.; Abad, J.D.; Garcia, M.H. Spatial variability in bank resistance to erosion on a large meandering, mixed bedrock-alluvial river. Geomorphology 2016, 252, 80–97. [Google Scholar] [CrossRef]
  27. Schilling, K.E.; Palmer, J.A.; Bettis, E.A.; Jacobson, P.; Schultz, R.C.; Isenhart, T.M. Vertical distribution of total carbon, nitrogen and phosphorus in riparian soils of Walnut Creek, southern Iowa. Catena 2009, 77, 266–273. [Google Scholar] [CrossRef]
  28. Layzell, A.L.; Mandel, R.D. An assessment of the erodibility of Holocene lithounits comprising streambanks in northeastern Kansas, USA. Geomorphology 2014, 213, 116–127. [Google Scholar] [CrossRef]
  29. Hooke, J.M. An analysis of the processes of river bank erosion. J. Hydrol. 1979, 42, 39–62. [Google Scholar] [CrossRef]
  30. Wolman, M.G. Factors Influencing Erosion of a Cohesive River Bank. Am. J. Sci. 1959, 257, 204–216. [Google Scholar] [CrossRef]
  31. Hongthanat, N.; Kovar, J.L.; Thompson, M.L. Sorption indices to estimate risk of soil phosphorus loss in the Rathbun Lake watershed, Iowa. Soil Sci. 2011, 176, 237–244. [Google Scholar] [CrossRef]
  32. Lyons, N.J.; Starek, M.J.; Wegmann, K.W.; Mitasova, H. Bank erosion of legacy sediment at the transition from vertical to lateral stream incision. Earth Surf. Process. Landf. 2015, 40, 1764–1778. [Google Scholar] [CrossRef]
  33. Schenk, E.R.; Hupp, C.R. Legacy effects of colonial millponds on floodplain sedimentation, bank erosion, and channel morphology, MID-Atlantic, USA. J. Am. Water Resour. Assoc. 2009, 45, 597–606. [Google Scholar] [CrossRef]
  34. Starek, M.J.; Mitasova, H.; Wegmann, K.W.; Lyons, N. Space-time cube representation of stream bank evolution mapped by terrestrial laser scanning. IEEE Geosci. Remote Sens. Lett. 2013, 10, 1369–1373. [Google Scholar] [CrossRef]
  35. Donovan, M.; Miller, A.; Baker, M.; Gellis, A. Sediment contributions from floodplains and legacy sediments to Piedmont streams of Baltimore County, Maryland. Geomorphology 2015, 235, 88–105. [Google Scholar] [CrossRef]
  36. Harden, C.P.; Foster, W.; Morris, C.; Chartrand, K.J.; Henry, E. Rates and Processes of Streambank Erosion in Tributaries of the Little River, Tennessee. Phys. Geogr. 2009, 30, 1–16. [Google Scholar] [CrossRef]
  37. Laubel, A.; Kronvang, B.; Hald, A.B.; Jensen, C. Hydromorphological and biological factors influencing sediment and phosphorus loss via bank erosion in small lowland rural streams in Denmark. Hydrol. Process. 2003, 17, 3443–3463. [Google Scholar] [CrossRef]
  38. Veihe, A.; Jensen, N.H.; Schiøtz, I.G.; Nielsen, S.L. Magnitude and processes of bank erosion at a small stream in Denmark. Hydrol. Process. 2011, 25, 1597–1613. [Google Scholar] [CrossRef]
  39. Griffith, G.E.; Omernik, J.M.; Wilton, T.F.; Pierson, S.M. Ecoregions and Subregions of Iowa: A Framework for Water Quality Assessment and Management. J. Iowa Acad. Sci. JIAS 1994, 101, 5–13. [Google Scholar]
  40. Schilling, K.E.; Hubbard, T.; Luzier, J.; Spooner, J. Iowa Geological Survey Walnut Creek Watershed Restoration and Water Quality Monitoring Project: Final Report; Iowa Department of Natural Resources: Des Moines, IA, USA, 2006.
  41. Schilling, K.E.; Thompson, C.A. Walnut Creek Watershed Monitoring Project, Iowa Monitoring Water Quality in Response to Prairie Restoration. J. Am. Water Resour. Assoc. 2000, 36, 1101–1114. [Google Scholar] [CrossRef]
  42. Schilling, K.E.; Wolter, C.F. Application of GPS and GIS to Map Channel Features in Walnut Creek. Iowa J. Am. Water Resour. Assoc. 2000, 36, 1423–1434. [Google Scholar] [CrossRef]
  43. Schilling, K.E.; Isenhart, T.M.; Palmer, J.A.; Wolter, C.F.; Spooner, J. Impacts of Land-Cover Change on Suspended Sediment Transport in Two Agricultural Watersheds1. JAWRA J. Am. Water Resour. Assoc. 2011, 47, 672–686. [Google Scholar] [CrossRef]
  44. Simon, A. A model of channel response in disturbed alluvial channels. Earth Surf. Process. Landf. 1989, 14, 11–26. [Google Scholar] [CrossRef]
  45. Bettis, E.A. The Deforest Formation of Western Iowa: Lithologic Properties, Stratigraphy, and Chronology; Iowa Department of Natural Resources: Des Moines, IA, USA, 1990.
  46. Bettis, E.A.; Baker, R.G.; Green, W.R.; Whelan, M.K.; Benn, D.W. Late Wisconsin and Holocene Alluvial Stratigraphy, Paleoecology, and Archaeological Geology of East-Central Iowa: Guidebook Series No. 12; Iowa Department of Natural Resources: Des Moines, IA, USA, 1992; pp. 1–61.
  47. Bettis, E.A.; Autin, W.J. Complex response of a midcontinent North America drainage system to late Wisconsinan sedimentation. J. Sediment. Res. 1997, 67, 740–748. [Google Scholar]
  48. Baker, R.G.; Bettis, E.A.; Horton, D.G. Late Wisconsinan-early Holocene riparian paleoenvironment in southeastern. Iowa Geol. Soc. Am. Bull. 1993, 105, 206–212. [Google Scholar] [CrossRef]
  49. Baker, R.G.; Bettis, E.A.; Denniston, R.F.; Gonzalez, L.A.; Strickland, L.E.; Krieg, J.R. Holocene paleoenvironments in southeastern Minnesota—Chasing the prairie-forest ecotone. Palaeogeogr. Palaeoclimatol. Palaeoecol. 2002, 177, 103–122. [Google Scholar] [CrossRef]
  50. United States Department of Agriculture; Natural Resources Conservation Service. National Biology Handbook Subpart B—Conservation Planning: Part 614, Stream Visual Assessment Protocol Version 2; 190-NBH, Amend. 3, December, 2009; United States Department of Agriculture; Natural Resources Conservation Service: Washington, DC, USA, 2009.
  51. Zaimes, G.N.; Schultz, R.C.; Isenhart, T.M. Stream bank erosion adjacent to riparian forest buffers, row-crop fields, and continuously-grazed pastures along Bear Creek in central Iowa. J. Soil Water Conserv. 2004, 59, 19–27. [Google Scholar]
  52. Tufekcioglu, M.; Isenhart, T.M.; Schultz, R.C.; Bear, D.A.; Kovar, J.L.; Russell, J.R. Stream bank erosion as a source of sediment and phosphorus in grazed pastures of the Rathbun Lake Watershed in southern Iowa, United States. J. Soil Water Conserv. 2012, 67, 545–555. [Google Scholar] [CrossRef]
  53. Lawler, D.M. The measurement of river bank erosion and lateral channel change: A review. Earth Surf. Process. Landf. 1993, 18, 777–821. [Google Scholar] [CrossRef]
  54. Klute, A.; Gee, G.W.; Bauder, J.W. Particle-size Analysis. In Methods of Soil Analysis: Part 1—Physical and Mineralogical Methods; Soil Science Society of America-American Society of Agronomy: Madison, WI, USA, 1986; Volume 9, pp. 383–411. [Google Scholar]
  55. McGrath, S.P.; Cunliffe, C.H. A simplified method for the extraction of the metals Fe, Zn, Cu, Ni, Cd, Pb, Cr, Co and Mn from soils and sewage sludges. J. Sci. Food Agric. 1985, 36, 794–798. [Google Scholar] [CrossRef]
  56. Couper, P.; Stott, T.; Maddock, I. Insights into river bank erosion processes derived from analysis of negative erosion-pin recordings: Observations from three recent UK studies. Earth Surf. Process. Landforms 2002, 27, 59–79. [Google Scholar] [CrossRef]
  57. R Core Team. R: A Language and Environment for Statistical Computing; R Foundation for Statistical Computing: Vienna, Austria, 2017. [Google Scholar]
  58. Wynn, T.M.; Henderson, M.B.; Vaughan, D.H. Changes in streambank erodibility and critical shear stress due to subaerial processes along a headwater stream, southwestern Virginia, USA. Geomorphology 2008, 97, 260–273. [Google Scholar] [CrossRef]
  59. Couper, P.R.; Maddock, I.P. Subaerial river bank erosion processes and their interaction with other bank erosion mechanisms on the River Arrow, Warwickshire, UK. Earth Surf. Process. Landf. 2001, 26, 631–646. [Google Scholar] [CrossRef]
  60. Couper, P. Effects of silt-clay content on the susceptibility of river banks to subaerial erosion. Geomorphology 2003, 56, 95–108. [Google Scholar] [CrossRef]
  61. Bryan, R.B. Soil erodibility and processes of water erosion on hillslope. Geomorphology 2000, 32, 385–415. [Google Scholar] [CrossRef]
  62. Julian, J.P.; Torres, R. Hydraulic erosion of cohesive riverbanks. Geomorphology 2006, 76, 193–206. [Google Scholar] [CrossRef]
  63. Lawler, A.D.M. River bank erosion and the influence of frost : A statistical examination. Trans. Inst. Br. Geogr. 2016, 11, 227–242. [Google Scholar] [CrossRef]
Figure 1. Location of watershed, monitored channel length, and streambank sites, Walnut Creek, Iowa, USA.
Water 10 00111 g001
Figure 2. Floodplain cross section depicting stratigraphic position and scale of streambank alluvial units, Walnut Creek, Iowa. Image adapted from Schilling et al. [27].
Water 10 00111 g002
Figure 3. Photograph depicting stratigraphic position and scale of streambank alluvial units, Walnut Creek, Iowa. Photo credit: Hanna McBrearty, Iowa State University.
Water 10 00111 g003
Figure 4. Extracted soil that highlights the color and texture of the Camp Creek, Roberts Creek, and Gunder alluvial streambank units, Walnut Creek, Iowa. Photo credit Hanna McBrearty, Iowa State University.
Water 10 00111 g004
Figure 5. A streambank with all four materials of interest present, Walnut Creek, Iowa. Note the fully exposed Camp Creek and partially exposed Roberts Creek. The Gunder was completely draped by non-member material (NMM), and exposed using a shovel. Photo credit: Hanna McBrearty, Iowa State University.
Water 10 00111 g005
Figure 6. Study duration daily mean discharge (m3 s−1) measured at watershed outlet, Walnut Creek, Iowa. Data from USDA-ARS.
Water 10 00111 g006
Figure 7. Mean individual pin daily erosion rate (mm day−1) by alluvial unit, NMM Gross, and NMM Net, Walnut Creek, Iowa. Lower-case letters indicate significant difference between units (p value < 0.05).
Water 10 00111 g007
Figure 8. Cumulative lateral recession by alluvial unit (cm), NMM Gross, and NMM Net, Walnut Creek, Iowa. Lower-case letters indicate significant difference between units (p value < 0.1).
Water 10 00111 g008
Figure 9. Cumulative mean sediment mass loss for Camp Creek, Roberts Creek, and Gunder alluvial units, for the main stem of Walnut Creek, Iowa. Significant differences (p value < 0.1) indicated by differing lower-case letters. Error bars omitted for clarity.
Water 10 00111 g009
Figure 10. Cumulative mean sediment mass loss for NMM Net and total bank, for the main stem of Walnut Creek, Iowa.
Water 10 00111 g010
Figure 11. Cumulative mean TP mass loss for Camp Creek, Roberts Creek, and Gunder alluvial units, for the main stem of Walnut Creek, Iowa. Significant differences (p value < 0.1) indicated by differing lower-case letters. Error bars omitted for clarity.
Water 10 00111 g011
Figure 12. Cumulative mean TP mass loss for NMM Net and total bank, for the main stem of Walnut Creek, Iowa.
Water 10 00111 g012
Figure 13. Correlation between total pin measurement period discharge (Total Q) and measurement period mean pin recession rate (Recession), and correlation between maximum pin measurement period discharge (Max Q) and pin measurement period mean recession rate (Recession Rate) for streambank materials, Walnut Creek Iowa. Spearman’s rank correlation coefficient denoted as Spearman’s ρ.
Water 10 00111 g013
Table 1. The four erosional scenarios used to assign specific material to an individual streambank pin recession measurement, Walnut Creek, Iowa.
ScenarioMaterial Present at Previous MeasurementMaterial Present at Current MeasurementAssign
1NMMNMMNMM
2NMMUnitNMM
3UnitNMMNMM
4UnitUnitUnit
Table 2. Precipitation, hydrology, and eroding streambank length data for Walnut Creek, Iowa, for May 2015 to April 2017. Year 1 represents April, 2016 streambank eroding length assessment data, Year 2 represents March, 2017 streambank eroding length assessment data.
PeriodDuration (Days)Total Precipitation (mm)Annual Mean Daily Discharge (m3 s−1)Maximum Mean Daily Discharge (m3 s−1)Total Discharge (m3)Main Stem Eroding Length (%) 1
Year 1 (May 2015–April 2016)35811180.7111.2822,099,90425.1
Year 2 (May 2016–April 2017)3719770.435.4313,667,10316.1
1 Percent of total main stem streambank length classified as severely or very severely eroding (USDA-NRCS).
Table 3. Mean total phosphorus concentration and soil parameters of alluvial units, Walnut Creek, Iowa. Non-member material denoted by NMM. Silt-clay content by weight denoted by SC. Water stable macro-aggregates by weight denoted by WSA. Numbers in parentheses indicate standard errors.
Alluvial UnitTP (mg kg−1)SC (%)Bulk Density (g cm−3)WSA >2 mm (%)WSA >0.25 mm (%)
Camp Creek170.8 (12.8)94.0 (1.1)1.30 (0.04)11.3 (1.3)44.9 (2.6)
Roberts Creek197.9 (33.8)91.2 (2.0)1.27 (0.02)21.5 (4.0)68.7 (3.5)
Gunder304.2 (62.5)71.5 (7.1)1.60 (0.04)3.8 (0.7)15.5 (2.7)
NMM241.4 (10.4)80.9 (1.9)1.20 (0.02)12.2 (3.2)31.0 (3.6)
Table 4. Alluvial unit surface area representation within eroding streambank faces for Year 1 (May 2015–April 2016) and Year 2 (May 2016–April 2017) for main stem of Walnut Creek, Iowa. Numbers in parentheses indicate standard errors.
Alluvial UnitYear 1 1Year 2 2
Alluvial Unit% SA% SA
Camp Creek11.2 (2.4) a7.2 (1.2) a
Roberts Creek5.8 (2.4) ab3.2 (2.1) bc
Gunder3.6 (1.1) b2.5 (1.1) c
NMM79.4 (4.9) c87.1 (3.4) d
1 Data from August 2015 survey. 2 Data from August 2016 survey. a,b,c,d Within years, differing lower-case letters indicate significant difference in surface area (p value < 0.1) between units.
Table 5. Total Bank cumulative mean recession for Year 1, Year 2, and study duration, Walnut Creek, Iowa. Results derived from individual bank cumulative recession data. Numbers in parentheses represent standard error.
Total Bank Cumulative Recession
Time PeriodMean (cm)Minimum (cm)Maximum (cm)
Year 1 (May 2015–April 2016)12.3 (2.6)1.827.9
Year 2 (May 2016–April 2017)6.3 (1.4)0.614.4
Study Duration (May 2015–April 2017)18.6 (3.8)6.042.3

