Using DPSIR and Balances to Support Water Governance

Laboratory of Environmental Toxicology and Aquatic Ecology, Ghent University, Coupure Links 653, 9000 Ghent, Belgium
Water 2018, 10(2), 118; https://doi.org/10.3390/w10020118
Submission received: 9 November 2017
/
Revised: 22 January 2018
/
Accepted: 24 January 2018
/
Published: 29 January 2018
(This article belongs to the Special Issue Advances in Ecological Water System Modeling: Integration and Leanification as a Basis for Application in Environmental Management)
Abstract
:The DPSIR framework has proven to be an effective communication tool, but has become subject to criticism upon increasing practical application. It is assumed that this is the consequence of the combination of terminological unclarity, absence of a methodological description for analyzing disturbances, and a confined conceptual basis when dealing with complex environmental issues. DPSIR has been embedded within the broader conceptual Pentatope Model (PTM), by making use of an ‘interface’ called GASI. GASI, which means Governance by Actor–Subject Impact Assessment, deals explicitly with governance as a framework and impact analysis as a process. The result is an extended version of DPSIR. Illustrated by means of a water balance, the importance of a combined PTM–GASI–DPSIR tool for impact assessments to support evidence-based governance is shown.
1. Introduction
The megatrends described in United Nations (UN), Organisation for Economic Co-operation and Development (OECD), and European Environment Agency (EEA) outlooks [1,2,3] make clear that society is still in an initial phase of merging global trends. These global societal developments result in environmental complexity [4], and the development of appropriate tools to support adequate and evidence-based policy and management is required. Increases in the number and scale of environmental issues urge policy-makers to think about the wider implications of a changing societal equilibrium (the combined socio-economic and natural equilibrium [5]) forcing a societal transition. With climate change, impacts on water systems gain increasing attention from policy makers.
With the agreement on the Water Framework Directive (WFD; EU Directive 2000/60/EC) in 2000, environmental disturbances of aquatic systems became an obligatory reporting element for EU member states and a crucial part of the river basin management plans (RBMPs). The emphasis was put on the causal links between pressures from sources and the state of the water bodies, as well as on the measures required to meet the good ecological status (GES). Although in 1996 the European Parliament urged for an approach that would implement environmental quality standards (EQSs) related to emission reductions (see [6]), it was not explicitly included in the WFD. Much of the content of RBMPs, including the level of ambition, the types of measures, the distance to target, and the costs involved, is subject to EQSs, which are considered a cornerstone of GES. The European Commission also seeks to propose additional measures to meet the GES, to describe future environmental conditions, and to evaluate cost-effectiveness within the planning period running till 2027. Although the WFD formulates only broad requirements to obtain the GES, this needs a coherent approach in practice, combining inter alia scenario analyses, economic valuation and collection of monetary data, definition of cost-effective measures, and determination of the distance to target (GES). Since the biological component is most critical to a GES, combined modelling of water flows, substance loads, and biological effects is essential. With this, the European Commission runs ahead of the data requests of international authorities (EEA, Eurostat, OECD) that focus on the development of water quantity balances and description of the water quality status and apply the concept of the UN water accounting methodology (SEEAW—System of Environmental–Economic Accounting of Water; see [7]). The SEEAW is a water flow chart for the purpose of water accounting. In practice, even the design of and data collection for a water balance is a challenge for public environmental authorities. This highlights the importance of a conceptual framework for disturbance analyses, as well as of using (water) balances.
DPSIR is a widely recognized analytical framework and specifically addresses a sequence of steps for analyzing environmental disturbances: drivers (D), pressures (P), states (S), impacts (I), and responses (R). It is applied by EU member states for WFD impact and cost-effectiveness analyses [8,9]. DPSIR helps to identify relations and to structure information, and allows understanding and overview of an environmental problem [10]. However, its value often seems greater for communication than for practical use, with the figures being produced for separate DPSIR factors, and relations between factors remaining descriptive. The combination of both requires scientific modelling and some kind of simplification into balances. Both policy-makers and scientists struggle with this for different reasons when it comes to implementation or application. For instance, the publication of the WFD-IMPRESS Guidance [11] raised fundamental discussions on the meaning and terminology of driving forces, (significant) pressures, and impacts. Also, the difficulty of unravelling complex processes is one of the concerns. Cooper [12] mentions its limitations in terms of definitional clarity and conceptual foundations, undermining the comparability between studies. Major concerns relate to its clarity, flexibility, and practicability, resulting in a large number of critics among users with differences in view, background, and requirements. This document examines the DPSIR framework as a beneficial tool for environmental analyses, but also contributes to the discussion of its conceptual and practical value, questioned orally and in writing by practitioners and authors (amongst others [12,13]). The conceptual and practical value will be evaluated with a broader conceptual framework called the Pentatope Model, and water balances, respectively. Both approaches aim to support governance in a different way.
In Vannevel [5], the Pentatope Model (PTM) is presented as a holistic framework for environmental analyses. As an umbrella framework, it shows the main relationships between the (sub)frameworks Societal Capitals, Environmental Information Cycle (EIC), Governance, and DPSIR. Each of these frameworks consists of five factors; this will be explained further. Such a common framework allows for systematic and progressive detailing according to the needs of the study envisaged. For instance, Societal Capitals include human (socio-economic) and natural capitals, which are of importance when dealing with environmental impacts. The strength of such frameworks is that they force us to think in terms of processes at different levels between concept and practice. So far, it has remained unclear as to how to apply DPSIR in relation to the other PTM frameworks.
Water balances indicate the strength and importance of quantified substance flows for environmental decision-making. They offer a basis for a more refined approach, for instance, for weighting the outcomes of human- or nature-oriented measures, or supporting the discussion on ecosystem goods and services (ES G&Ss). Water mass balances are essential to calculating the Water Exploitation Index (WEI+)—an important reporting parameter to the European Commission (WFD), EEA, and Eurostat—and other indicators (see [14]). Flow charts and balances contribute to decision-making by defining type, priority, and feasibility of measures, and indicate the need to combine environmental and socio-economic models, to develop tailor-made monitoring strategies, and to ‘translate’ policy objectives into future monitoring needs. Depending on the spatial and thematic scale, balances can be populated with physical data or common indicator values, offering a reliable platform for clear, objective, and knowledge-based communication with stakeholders. This meets the findings of Tscherning et al. [15] who consider the DPSIR framework a means to bridge the gap between research and decision-making. However, addressing responses to end users is still a weak point in DPSIR studies, as well as the integration of decision-makers and end users in a participative process. As Everard [16] argues, the public must not be convinced by stressing the achievement of environmental thresholds (e.g., the WFD’s GES), but by stressing the benefits in terms of environmental improvements, protection, etc. The lack of benefit assessments that are quantified, monetized, and expressed in social-relevant terms, makes environmental measures prone to public questions on the relevance and the financing.
The aim of this paper is to position DPSIR in the wider spectrum of environmental analyses. On the one hand, integration of DPSIR into the broader conceptual PTM framework is pursued; on the other hand, its applicability for impact analyses of water-related issues by means of water balances is evaluated. Both contribute to evidence-based policy-making. This results in the following steps:
- Description of the Pentatope Model in relation to disturbances and impacts;
- Evaluation of DPSIR as an analytical tool for disturbance analyses and the development of an extended DPSIR;
- Proposal of a concept of impact assessment—Governance by Actor–Subject Impact Assessment (GASI)—for integrating DPSIR into PTM;
- Application of DPSIR/GASI by means of a water balance, relating physical water data to governance.
2. The Pentatope Model for Environmental Analyses
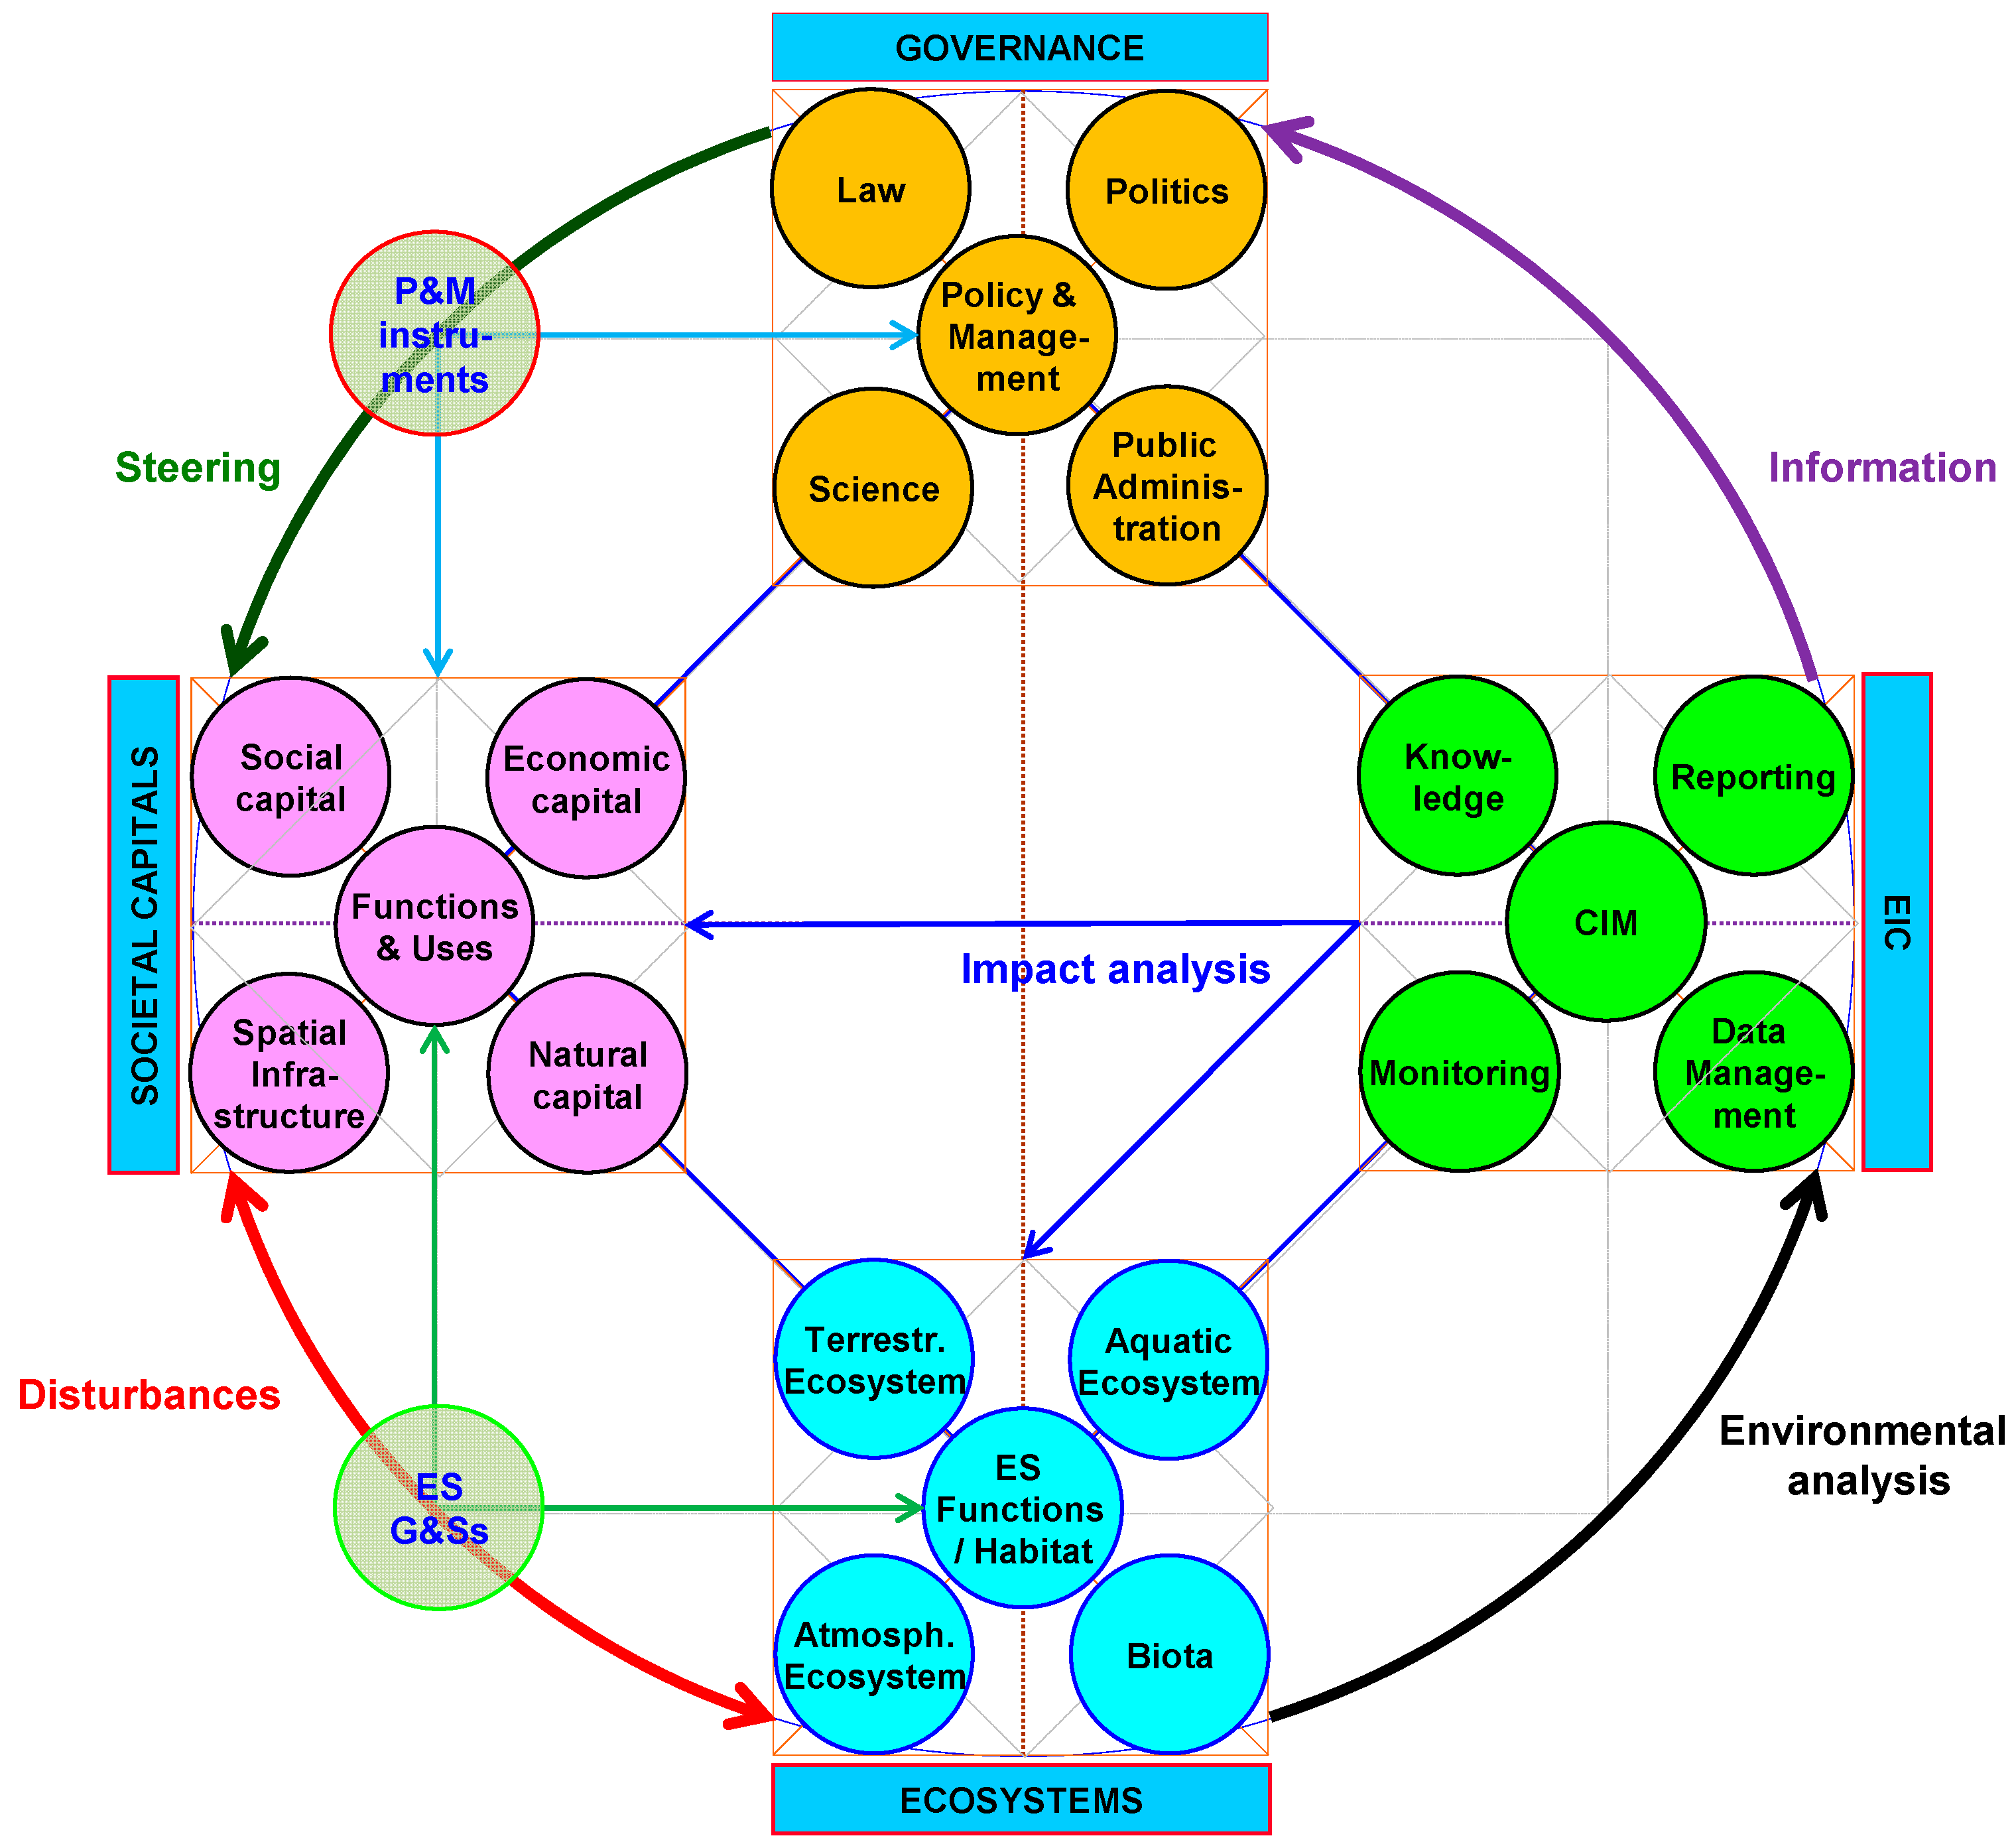
In its most condensed form, the Pentatope Model (PTM) includes five (sub)frameworks, with each composed of five factors (Figure 1):
- Societal Capitals: The social, economic, and natural capital; spatial infrastructure; and their ‘functions and uses’. Natural capital is detailed as ‘ecosystems’;
- Ecosystems: The terrestrial, aquatic, and atmospheric ecosystems; biota; and their ecosystem functions. A habitat is a physical integration of these factors;
- Environmental Information Cycle (EIC): Monitoring, data management, reporting, knowledge, and Central and Intermediate Modules (CIM; including IT tools, modelling, inventories, templates, etc., for data and information treatment);
- Governance: Law, science, politics, public administration, resulting in policy and management;
- DPSIR: Driving forces, pressures, states, impacts, and responses.
The Societal Capitals framework includes three main factors (social, economic, and natural capital) that physically determine the spatial infrastructure (e.g., landscape, traffic infrastructure). All factors strongly interact, mainly by material flows, depending on societal functioning and use of resources. The natural capital factor is detailed as ecosystems. Ecosystem functions refer to the ecological processes in and between the ecosystem factors. The EIC framework is slightly modified compared with its original presentation, following alignment with EEA’s MDIAK concept of data and information flows. MDIAK stands for Monitoring–Data–Information–Analysis–Knowledge ([17]), with Information roughly comparing to Reporting and Analysis to CIM. Policy and Management (P&M) is the central element in the governance framework, of which P&M instruments are an output. There is a simple relation between the first four subframeworks: Societal Capitals cause disturbances, having an impact on Ecosystems. Environmental analysis should provide information to Governance to define the measures for steering the Societal Capitals. Most disturbances result from the use of natural resources as both physical goods and nonphysical services, termed ecosystem goods and services (ES G&Ss; see [18]).
The challenge is to perform an environmental analysis. The EIC provides a framework for data and information generation and use, but does not describe the analytical process when dealing with (environmental) disturbances. As shown in the figure, there is a need for a tool allowing the analysis of impacts between Societal Capitals and Ecosystems in a structured way. The clear choice is DPSIR, although the difficulty is how to apply it in practice. Having mentioned disturbances and impacts, these terms first need some clarification.
A disturbance is a general denomination of changing environmental conditions, indicating the process (e.g., eutrophication, salinization, drought). Ecosystem changes are the result of natural (endogenous) or human-induced (exogenous) events that directly and/or indirectly affect nature and humans. Both can be actor or subject to interaction, although most environmental issues are relating to the case where humans (actor) influence (impact) the natural environment (subject) as a result of their socio-economic activities. Essentially, disturbances alter (deteriorate or improve) the initial status (either good or bad) of the subject to a different status (either improving or deteriorating). Defining and assessing a single cause–effect trajectory relates to an impact analysis. This means that a single disturbance may include multiple impacts. The following definition should apply to any impact: a change of status (effect) of an entity (B) as a result of an action of entity A (actor, emitter) exercised on entity B (subject, receiver). This is illustrated by a simplified eutrophication scheme (Figure 2). In the disturbance process, impacts are detailed as interactions between activities, pressures, and statuses according to (D)PSI(R). Note that ‘activities’ is not explicitly part of the DPSIR concept; impacts are restricted to the water body, and do not include impacts to other ecosystem factors or the social and economic capitals; and interactions with driving forces and responses are omitted. Nevertheless, the figure indicates that analyses of disturbances quickly result in complex networks of physico-chemical, hydro-morphological, and biological interactions, revealing the intrinsic functioning of ecosystems.
The next focus in this paper is on the beneficial use of the entire DPSIR for environmental analyses applicable to the PTM concept.
3. DPSIR as an Analytical Tool
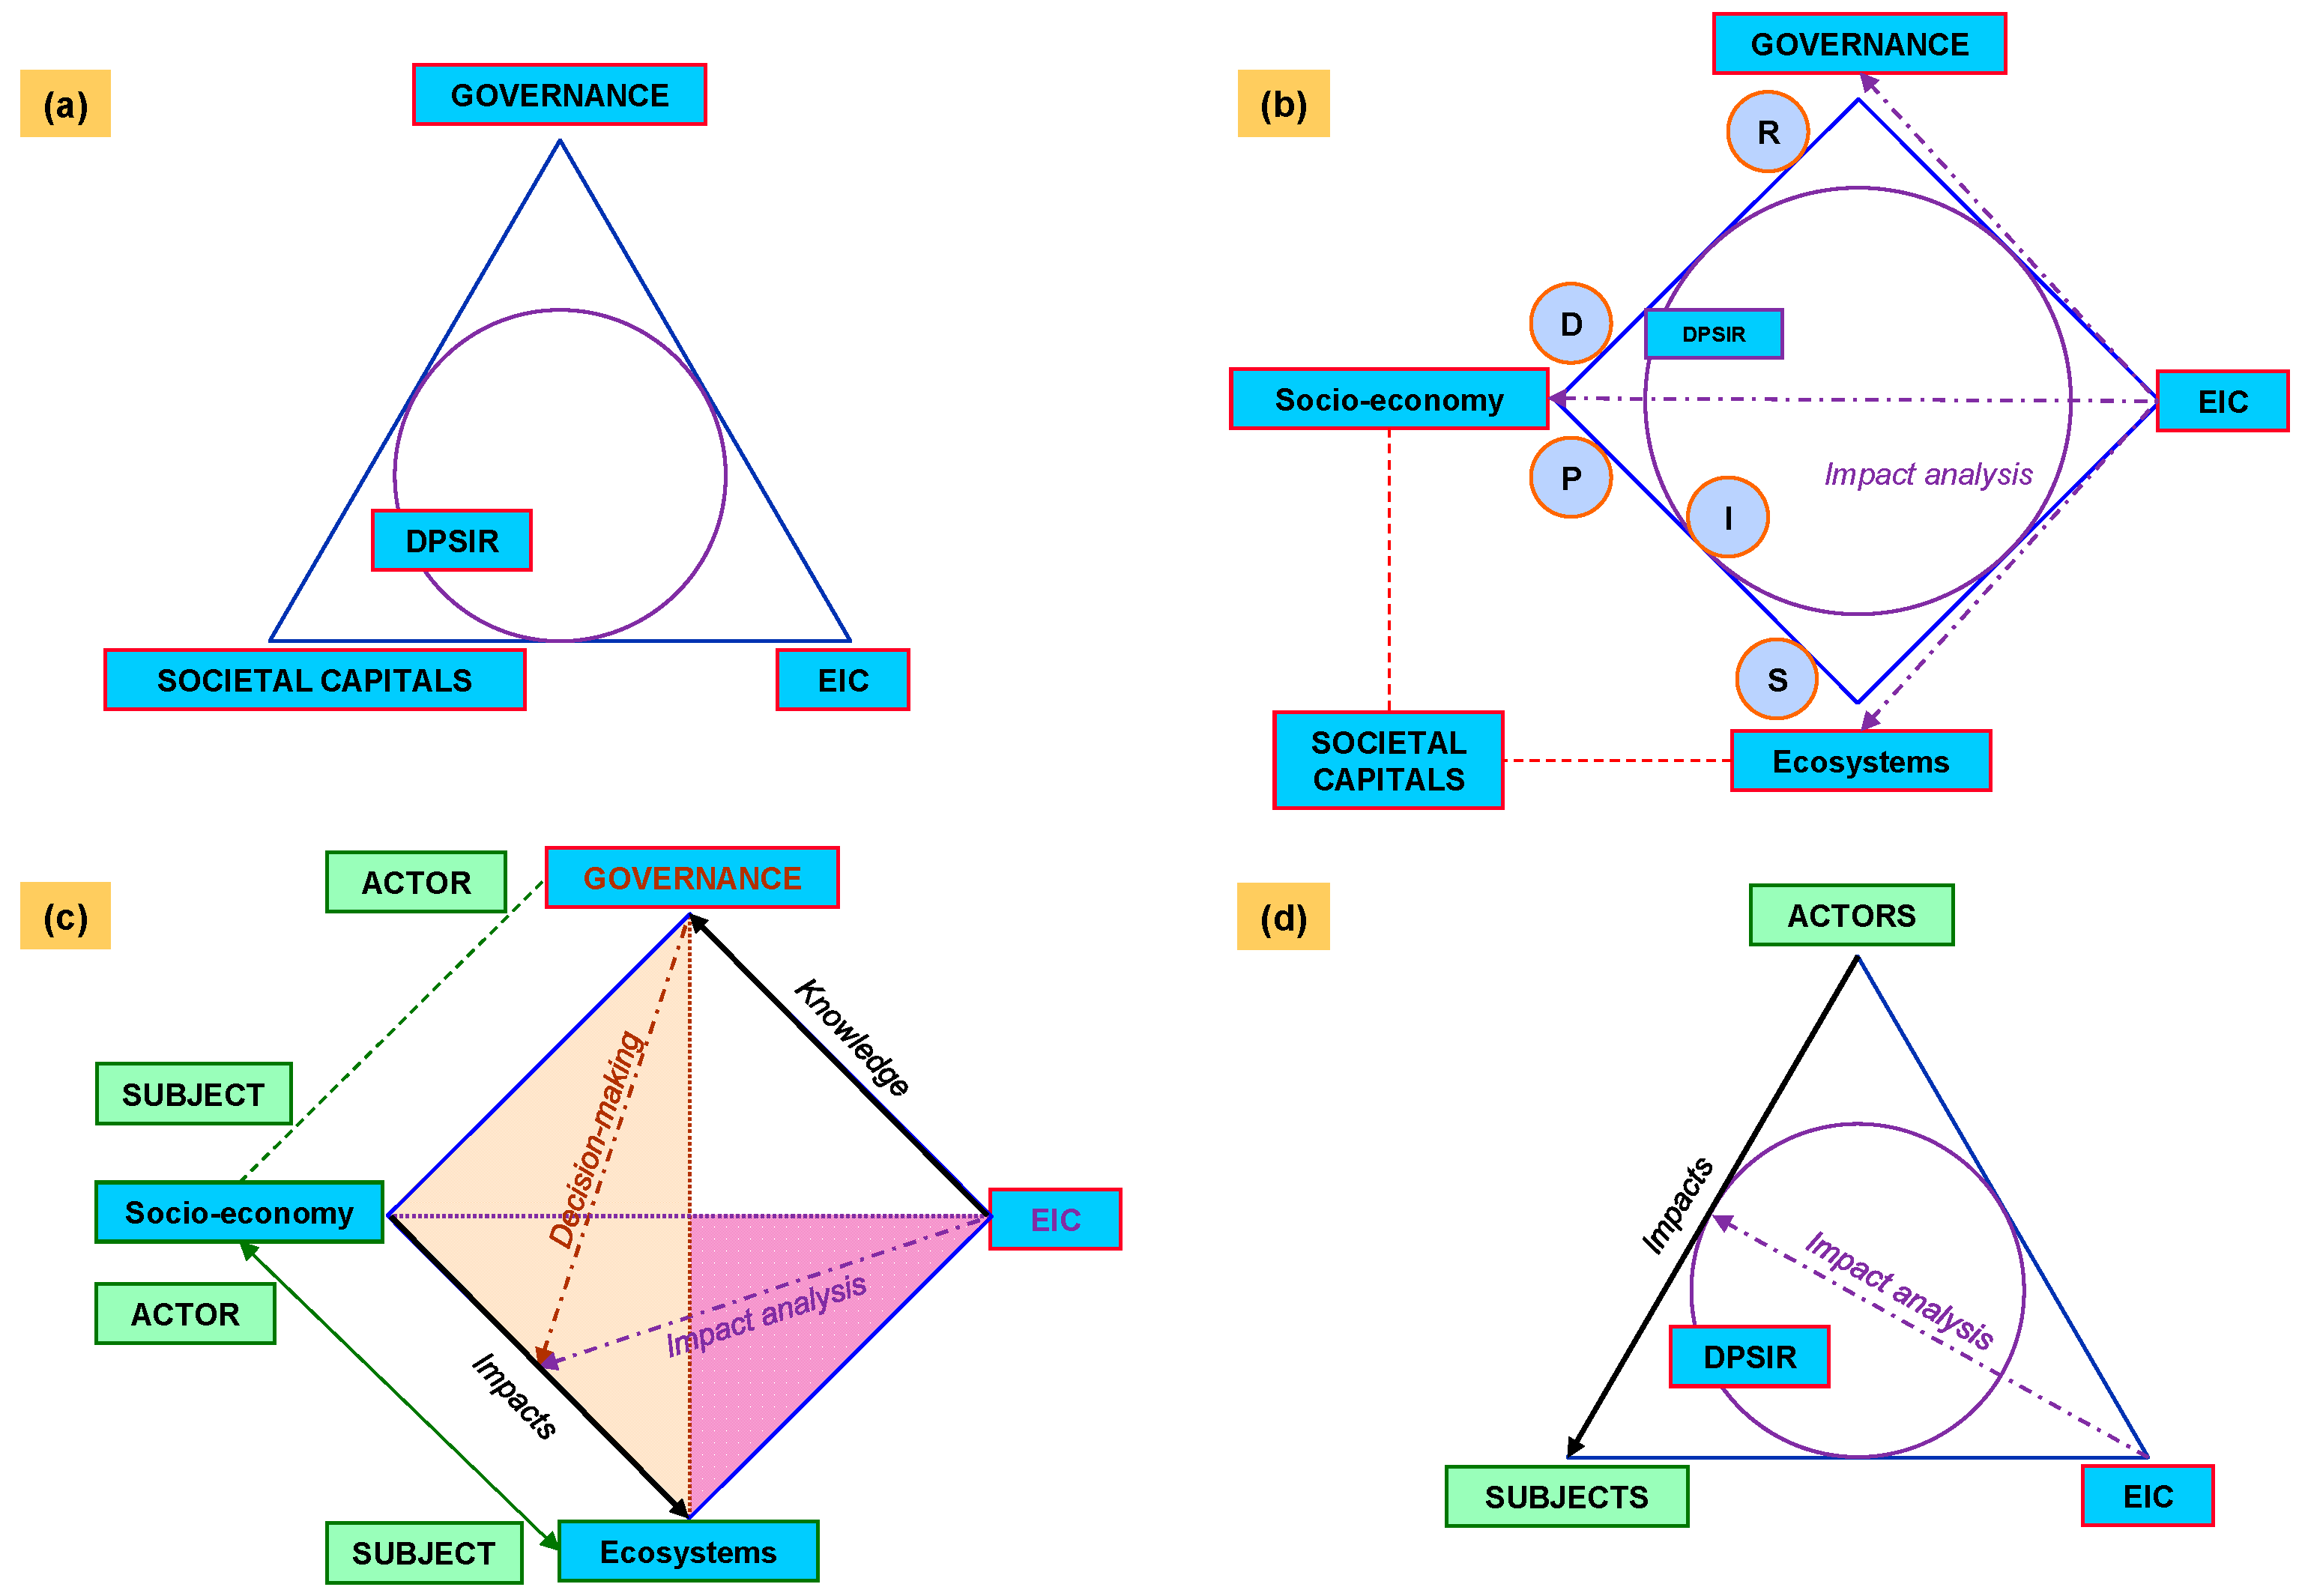
The origin of DPSIR dates back to 1979 and has gradually developed since, mainly addressing causal links between pressures, states, and societal responses ([19]). Initially developed as a concept for structuring and communicating environmental problems in a simple way and for classifying indicators for reporting, it evolved into a tool for analyzing disturbances, although Smeets and Weterings [20] did not elaborate on this methodology. DPSIR allows the connection of societal developments to human activities causing pressures that change environmental conditions. These changes have an impact on the human and natural environment, which should be responded to by appropriate measures. As such, DPSIR seems suitable for environmental analysis within a PTM context. Mapping DPSIR onto PTM should then secure interactions between the Governance, Societal Capitals, and EIC frameworks (Figure 3a). Considering that Societal Capitals concern an interplay between the socio-economic and natural systems, it becomes clear that DPSIR factors mainly show interactions between these capitals, and, to some extent, also with Governance, but not explicitly with EIC (Figure 3b). In relation to DPSIR, EIC plays a solitary role in collecting and structuring data and information, in particular from socio-economic and environmental monitoring. This missing link is a weak point in the PTM approach, since EIC is designed to transfer knowledge to the decision-making process by means of data and information flows obtained from impact analyses (Figure 3c). It can be concluded that DPSIR and PTM address different parts of the same storyline: (1) (D)PSI(R) impact assessments are clear about PSI, but remain vague about D and R and on how to process data and information; and (2) an EIC impact process clearly describes data and information flows between Societal Capitals and Governance, but does not explicitly address pressures and states (Figure 3b). In addition, DPSIR impacts are considered ‘second order’ impacts, whilst PTM impact analysis indicates the overall process of identifying and quantifying significant changes. Detailing PTM with DPSIR seems necessary. Examination of the properties and applications of DPSIR may define how DPSIR fits within PTM.
Based on the short historical descriptions of the DPSIR framework, its applications, and the critiques following its application, it looks as though DPSIR was initially proposed as a conceptual view, rather than as a practical guidance. Most remarks that emerge from the different versions of this ‘disturbance chain’ deal with addressing only socio-economic drivers, oversimplification, or the exclusion of system dynamics, and its linear, unidirectional, and noncyclic causal chain (see [10,12,13,15,19,21,22,23,24]). To become more practical, the linear DPSIR approach should evolve towards a ramified structure with feedback loops, if possible, applicable at different levels of governance. This inevitably results in a more complex tool, but meets the criticism of, amongst others, Maxim et al. [13] (p. 12) that DPSIR does not address “multiple dimensions of causality inherent in complex environmental and socio-economic systems”. This could be a reason why the embedding of DPSIR within a more holistic approach, in particular including socio-economic and governance aspects, has been pursued for about a decade (see [10,12,13,25,26,27,28]). The critics of DPSIR make it clear that an adapted tool should take a more complex approach, being able to deal with dynamism (trends), nonlinear (many-to-many) interactions, different spatial scales (from local to global), and thematic boundaries (adding the water chain to ecosystems; adding groundwater to surface water).
Particularly, DPSIR impacts only apply to changes of societal capitals that result from environmental changes (already mentioned as ‘secondary’ impacts), which is any S-I sequence according to EEA [29] (p. 10): “impacts on population, economy and ecosystems caused by the changes in state”. However, any interaction between two successive DPSIR factors, such as between pressures and states, is considered an impact. An impact analysis includes a description or quantification of these interactions, to which EIC applies. In the case of water pollution, this implies the identification and monitoring of a pollution source (e.g., industrial plant, agriculture) and the ‘impacted’ environmental condition (e.g., oxygen level, the nitrogen concentration of a receiving water body). An effect quantifies the changing conditions of any DPSIR factor by comparing the initial state with the impacted state (e.g., an oxygen concentration drop from 8 to 4 mg/L). ‘Effects’ continuously occur within any dynamic and complex system—both societal capitals and governance—and result from and induce alterations in biogeochemical (BGC), socio-economic, and decision-making processes. This approach offers opportunities to define ‘significant environmental impacts’ (according to the WFD IMPRESS terminology [11]) as those (changing) ‘causes’ having an effect on the environmental status to the extent that environmental quality standards (EQSs) are exceeded.
Essentially, two major impact categories are distinguished: (1) human impacts: impacts caused by human pressure on the environmental status, followed by (2) environmental responses: impacts of a changing environmental status on one or more societal (social, economic, natural) capital factors. Impact evaluations may be restricted to one of those categories, or a combination of both, or—since they are mutually dependent—can consist of a sequence of (alternating) impacts. Human impacts usually relate to environmental impact analyses and assessments (EIAs). Environmental response impacts include:
- Impacts of the aquatic system on the water chain or related parts of the social and economic capitals.
- Impacts of the aquatic system on other parts of the aquatic system (Figure 2) or on other ecosystems (natural capital impacts).
- Impacts of other ecosystem compartments (terrestrial, atmospheric) on the aquatic ecosystem.
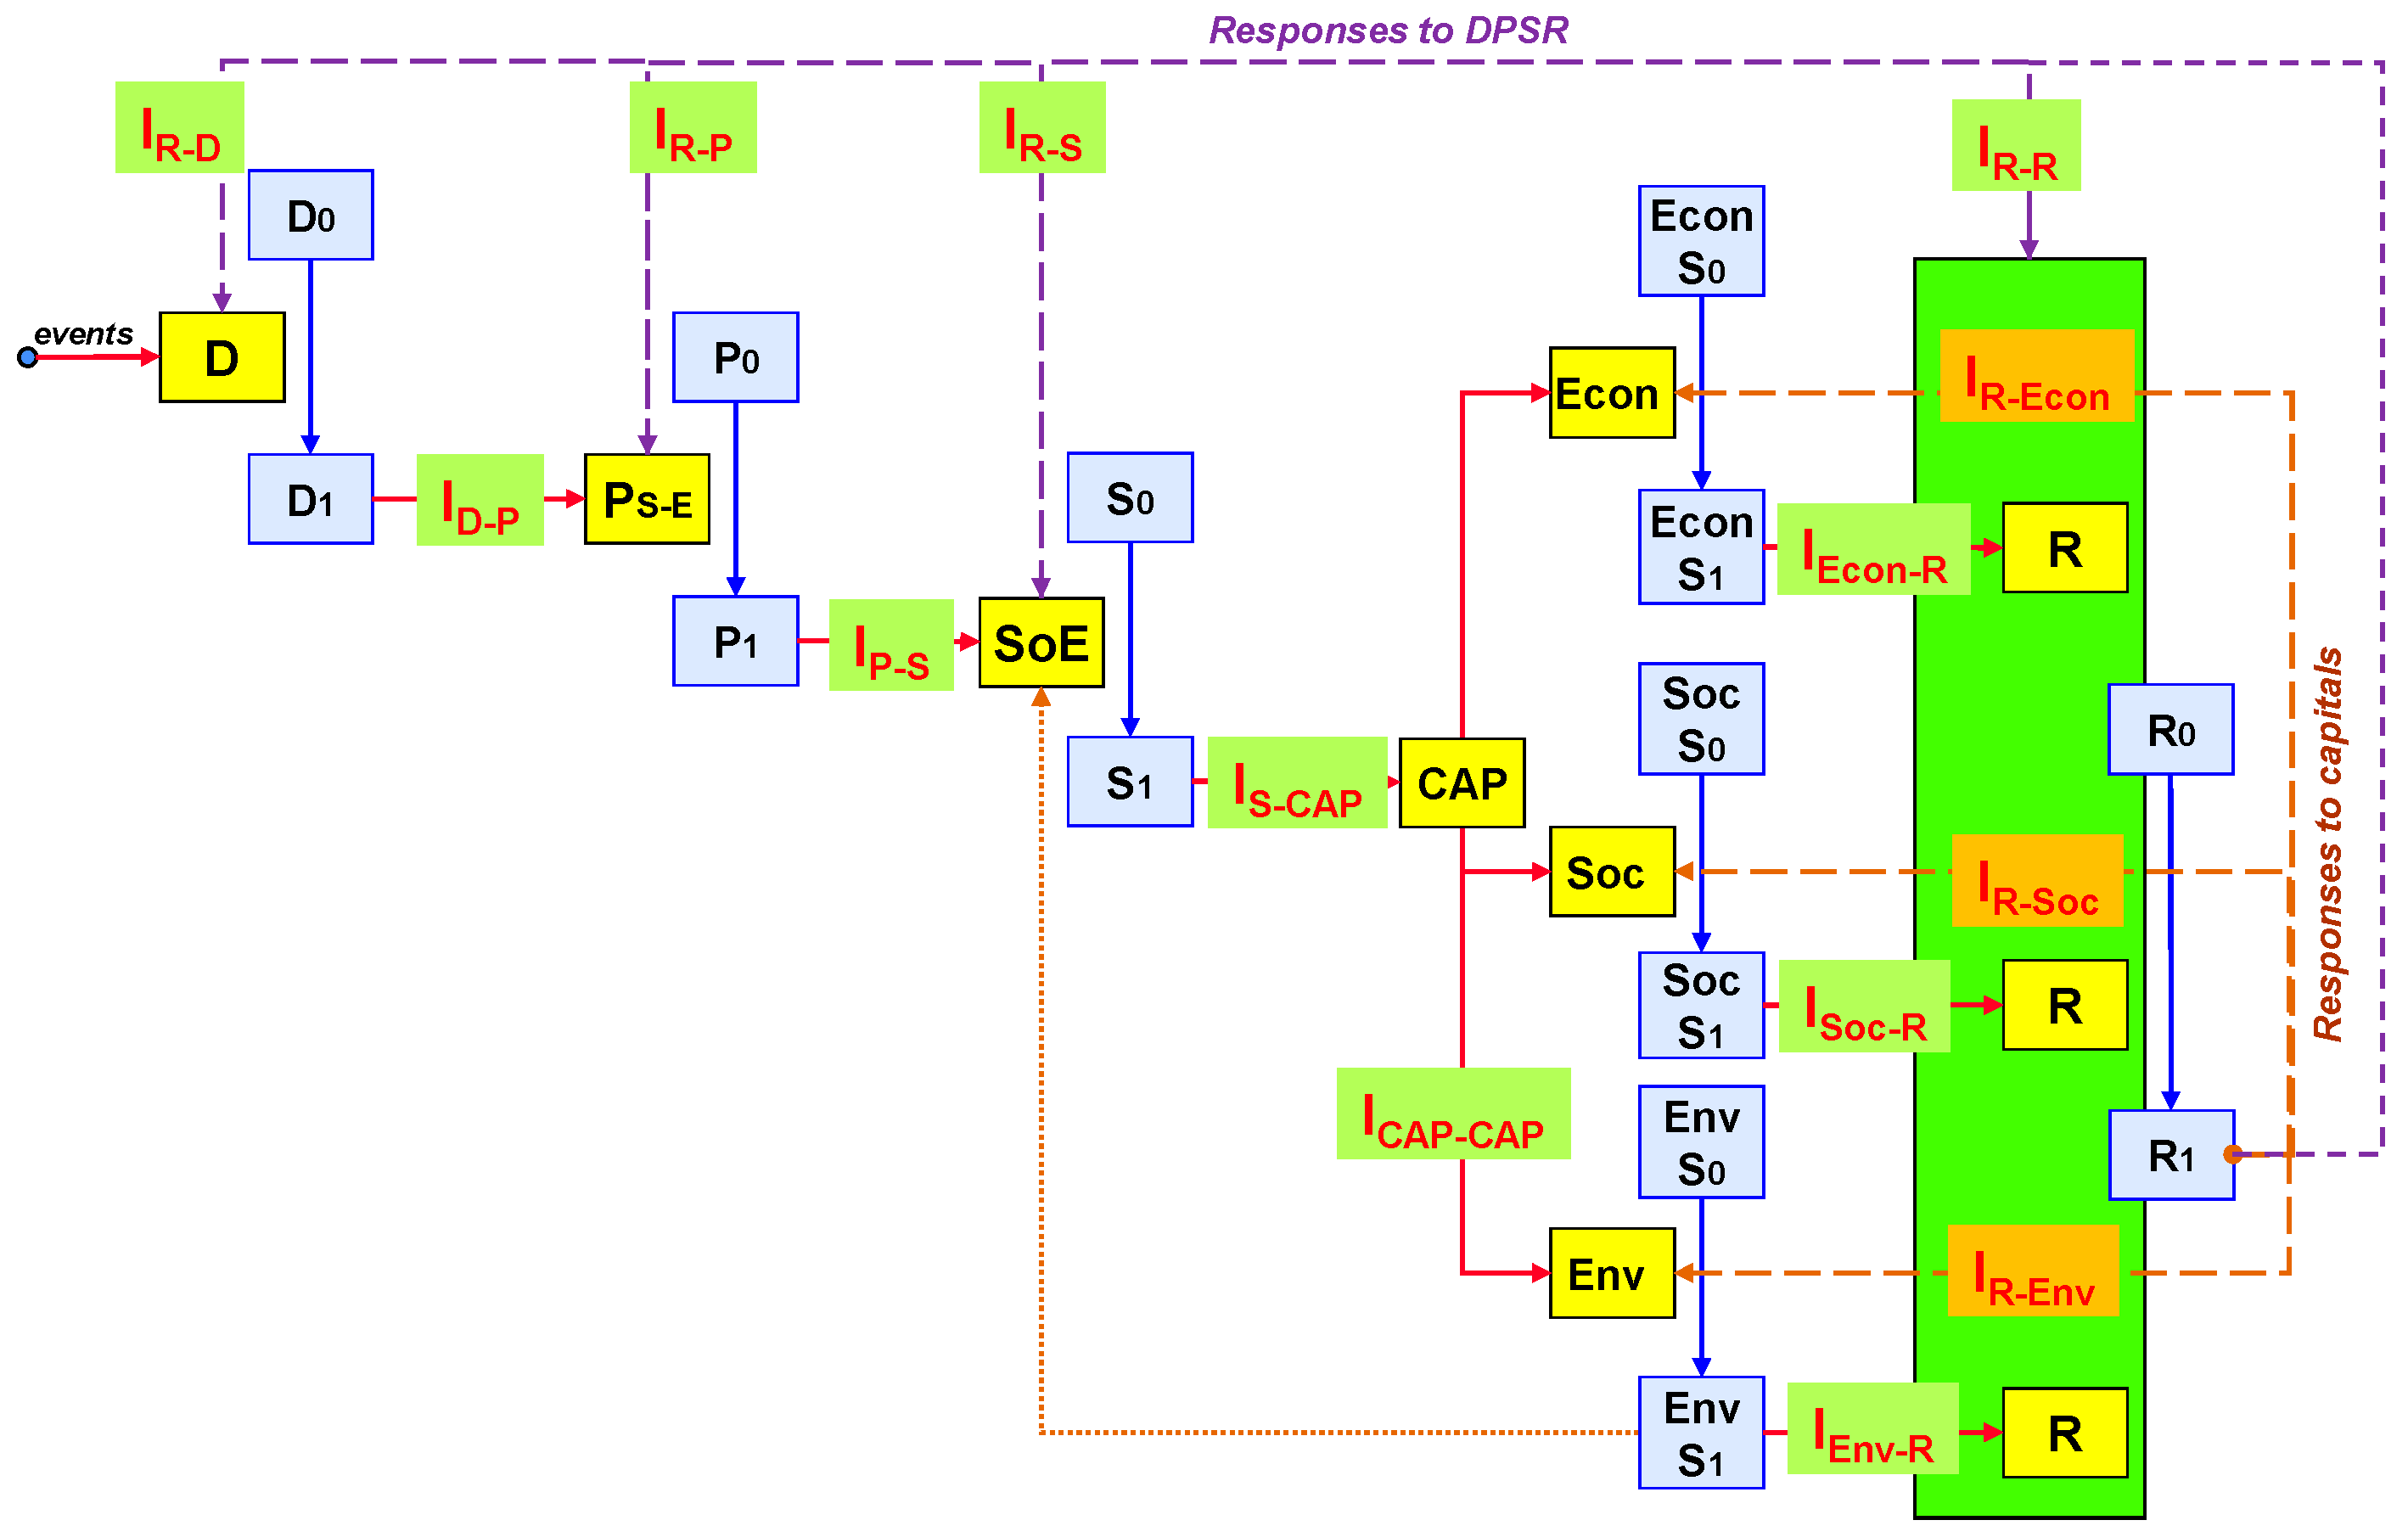
To visualize the above-mentioned considerations and suggestions, a more ‘extended’ DPSIR scheme is drawn (Figure 4). This hybrid scheme shows the D, P, S, and R factors and PTM capitals as elements (yellow boxes), impacts as interactions between elements (lines), and effects as changes of status (from time 0 to 1) of these elements (blue boxes). The combination of DPSIR (with a sequential dependency of the framework factors), PTM capitals, a broadened impact approach, and the specification of effects as a change of status, leads towards a cascade of effects. This approach may serve as an illustration of the work by inter alia Benitez-Capistros et al. [30]. The figure shows the case of human pressures (PS-E, socio-economic) affecting the environmental status (SoE, state of the environment). All impacts on capitals may induce a number of policy responses (Figure 4). DPS(I)R responses are directed to drivers (IR-D, e.g., by influencing human behaviour), to pressures (IR-P, e.g., by regulating polluting activities), to states (IR-S, e.g., nature restoration), and to responses themselves (IR-R, in the sense of questioning and adapting existing (or developing new) policy strategies and instruments). They depend on the natural, social, and economic state analyses, affect all other DPSIR factors, and may be called response impacts (comparable to the ‘response measures’ of Rounsevell et al. [28]). This offers opportunities for making sustainable development and integrated water management more tangible: responses are not only defined to meet environmental requirements, but also to improve the social and economic states accordingly, which, in turn, improve environmental conditions. R-to-R impacts are a necessity to deal with increasing environmental complexity and require adaptive governance. For that reason, it is suggested to replace ‘Responses’ by a broader concept of ‘governance’, covering, for instance, new legislation, innovative research, administrative reform, and changing political views. This seems of utmost importance when facing megatrends. Although impact analyses show sequences of impacts between physical entities in most cases, they can also be nonphysical. D’Arcy et al. [31] describe a diversity of impacts from diffuse pollution sources (to be considered pressures). Along with environmental impacts on the receiving waters (attempting to apportion point and diffuse sources and to quantify impacts), impacts on research and monitoring requirements (monitoring, analysis, and modelling) and economic impacts expressed as costs (ranging from monitoring to sanitation, damage, and sectoral costs, etc.) are also included. Nonphysical entities relate to decision-making, bringing governance (covering responses) into the impact approach. From this, it must be concluded that Responses needs a broader perspective to cover the governance framework as a whole.
Thus far, a number of modifications to DPSIR have been proposed: (1) the application of a ramified structure, (2) the broadening of responses to governance, (3) the use of a wider definition of impacts, and (4) the inclusion of activities (or actors) in between drivers and pressures. These adaptations have already been addressed by Smeets and Weterings [20], although not explicitly, as their objective was to present indicators in a simple manner. However, simplicity conflicts when dealing with disturbance analysis of complex systems. Otherwise, the application of DPSIR remains often limited (see [32]) and seems to have narrowed down since state-of-environment reports are very often indicator reports, using indicators as an end point, or restricted to PSI trajectories of the kind shown in Figure 2. In addition, indicator reports are often thematically structured, or structured according to policy objectives (see [33]). The increasing attention to global trends (e.g., [1,2]) and importance of sustainable development forces a focus on D-P and R-D impacts. Reports on drivers (e.g., megatrends) or responses (e.g., policy evaluation) are less frequent, or at a different level of authority, or part of restricted and delineated studies. Future challenges will require a full DPSIR analysis, addressing all PTM frameworks. Trend analysis and evidence-based policy and management should be in conjunction with SoE analysis; quantified elements should be balanced. This requires new elements to be included—such as environmental quality standards (EQSs), ES G&Ss, modelling, or scenario-analysis—that are currently lacking in the DPSIR framework. This brings about an adapted approach that uses (the Extended) DPSIR within the PTM concept, allowing a broader basis for practical applications; for this reason, GASI is proposed. In addition, the Extended DPSIR will be applied to the design of a water balance, with the focus on quantification of pressures (P) from pollution sources (Figure 4: CAP-Econ/Soc) on the environmental status (SoE) of surface waters (Figure 4: CAP-Env) and the way this relates to measures (R).
4. GASI: Governance by Actor–Subject Impact Assessment
GASI—Governance by Actor–Subject Impact Assessment—describes the process of assessing impacts between actors and subjects and the way this interacts with DPSIR and PTM. As the main objective of PTM is to steer Societal Capitals, Governance becomes a key player in this process. Figure 3c, a simplification of the Extended DPSIR, shows the overlap of areas covered by both impact analysis and decision-making. This overlap is the result of the fact that—depending on the case—both socio-economic capital and ecosystems can be actor and subject. Opposite to the impact side, there is the transfer of knowledge between EIC and Governance. The connections between impact analysis, knowledge transfer, and decision-making are the reason for the securing of data and information flows. A simplified figure (Figure 3d), by restricting to actors and subjects, shows GASI as the broader conceptual basis and DPSIR as a tool to which the PTM factors apply. This can be the basis of any impact analysis: selecting D, P, S, I, and R elements according to the objectives of the study, and drawing the pathways of a flowchart. This will be illustrated in the next chapters by means of a pollution load balance.
The value of GASI is that it enables the fitting of the conceptual basis of DPSIR into PTM, and that it may serve as a guide to environmental analyses. The latter can be explained by using the sequence in Figure 3 in a reverse sense: (1) decide whether an issue is a disturbance and start an impact analysis by identifying actors and subjects (Figure 3c,d); (2) determine the type of impacts, the methods and sources to perform an analysis, the objectives of decision-making, and the kind of knowledge to be produced (Figure 3c); (3) apply (the Extended) DPSIR and select the impacts to be examined, describe the methods applied and the data and information sources, and structure the results according to the DPSIR or PTM frameworks (Figure 3b); (4) provide content (data, information, and knowledge) according to the objectives of the study, structured as DPSIR (data questionnaires, indicator reports), PTM (thematic reports), PTM subframeworks (e.g., Societal Capitals: states, trends, outlooks; Governance: objectives, measures; EIC: monitoring procedures, data storage), or another classification (e.g., [32]) (Figure 3a).
GASI allows for easy insertion into the Pentatope model, as shown in Figure 5. Additional elements can be added to this combined figure that cannot be shown in a DPSIR scheme. Some of these elements will be discussed first, because they are of importance when dealing with water balances.
Considering all PTM factors, the focus is on the central framework factors which are assigned a functional or practical role within their framework: policy and management (resulting in decision-making), the role (functions and uses) of societal capitals, the ecosystem functions, and the modular approach (CIM) to handling data and information. Connecting these central factors results in a cycle that may be the most holistic representation of a model, interactively depending on governance structures, socio-economic and natural systems, and on the available modelling tools themselves. These modelling tools are also part of the factor CIM, including any structuring practice (e.g., lists of data elements, spreadsheets, relational flow charts, models, etc.) interacting with any other EIC factor. In the case of water balances, quantification ends up in physical flows, in particular of natural resources and return flows (wastewater) from production and consumption. When balanced against each other, ecosystem goods and services (ES G&Ss) can be defined that should meet a societal equilibrium that is sustainable, and that can be maintained by establishing environmental quality standards (EQSs). EQSs are not only defined to preserve environmental conditions, but also to set safe limits for the exploitation of natural resources. As the figure shows, balances indicate the need to align ES G&Ss, EQSs, and a societal equilibrium, to define a societal equilibrium based on both a socio-economic and a natural equilibrium, but also to balance data, information, and knowledge demand (from governance to EIC) against supply (from EIC to governance). Defining the natural equilibrium depends on EQSs, a key element of environmental policy and management [4], along with other determining ecosystem factors, including carrying capacity, resilience, and biodiversity. Defining the societal equilibrium is the challenge of decision-making and is, as already mentioned, supported by impact analyses providing evidence: evidence-based policy. With the tendency towards evidence-based policy-making, there is or should be a common area that scientists and policy-makers can rely on, using the same kind of diagrams to communicate. In this way, Smith et al. [34] (p. 4) consider conceptual models “diagrams which bring together and summarise information from many areas”. Applied to the water domain, this kind of diagram is called water balances by the European Commission [35].
5. Water Balances for Water Governance
A single scientific model cannot fully describe all interactions of complex processes. On the other hand, a model should also not be over-simplified [34]. There is an evolution towards models becoming more descriptive in the sense of (eco)system functioning, and balances collecting only relevant data for decision-making. Ironically, with scientific models becoming more detailed and specialized, and providing more and more reliable evidence, data and information also become less accessible, which increases the distance between science and governance. Although balance flow charts provide insight into systemic processes, they cannot serve governance if not quantified. A balance, basically a quantified flow chart, also includes a concept of cyclic resource and material flows and of an ecosystem equilibrium. Ecosystem equilibrium is termed GES by the European Commission and is defined by EQSs, with ‘significant impacts’ indicating conditions exceeding EQSs. This meets the concern of Song and Frostell [36] (p. 677) to move towards a pressure-oriented approach, with an economy–environment analysis that requires us “to systematically trace pollutant fluxes between the socio-economic system and river water systems”. Borja et al. [37] explains this in a more practical four-step process: (1) describing the driving forces; (2) identifying (‘significant’) pressures and their impacts on the water body and water uses, considering the magnitude of the pressures and the susceptibility of the water body; (3) assessing the impact; and (4) evaluating the risk of failing the objectives.
The next figure (Figure 6) shows how a water mass and load balance scheme relates to DPSIR, GASI, and PTM; all impacts are indicated. The basic idea of the pollution disturbance (central part of the figure) is that water use and emissions of pollutants change the initial water quantity and quality conditions of the aquatic ecosystem, requiring measures to halt adverse effects or restore initial conditions. Although often considered socio-economic actors, drivers in this schema have no direct influence on balances. Pressures include pollutant emissions and inventories of gross emissions leaving the pollution source and net emissions entering the receiving water body. Pressures and environmental state are monitored, and modelled elements reflect present conditions. Only the left part of the balance applies to DPSIR. The right part (reduction calculations; dashed lines) is not clearly covered by DPSIR, although it allows the calculation of effects and efforts that are most important to governance. In the case of pollution load balances, emission reductions are quantified as future effects to be reached by applying measures. Equating effects to efforts is a crucial principle to translating status changes into policy objectives. This is a transformation of (physical, numerical) monitoring data into evidence-based decision-making, or a switch from societal capital descriptions to governance.
Effect calculations determine maximum allowable discharges into the water bodies (net emission reductions). Based on the idea that the degree of effect caused by pollution should equal the degree of effort to restore initial conditions, quantified measures are imposed on S-E actors (gross emission reductions). In the load balance scheme, ‘eff’ stands for both effects and efforts. In the most simple and conservative formulation, effects are considered to be the degree of change resulting from an impact, which is also the degree of effort required for restoration by means of responses (R): ΔR = −Δeffect. Decision-making or systemic processes make ΔR ≠ −Δeffect. Examples that influence decision-making are the feasibility of measures, or not applying the stand-still principle; an example of systemic processes is the occurrence of ecosystem shifts [38,39]. In the case of a water load balance, this includes load (gross and net emission) reductions according to the natural requirements as defined by environmental quality standards. The sequence of a load reduction approach consists of identifying interactions (pressure–status impacts), comparing emitted pollutant loads with allowable loads (according to EQSs, to define the distance-to-target) or a previous observation (to observe trends), and responding to the altered conditions. Responses include defining the types (policy and management tools), the degree (load reductions), and the allocation and implementation of measures. The effectiveness of measures can be evaluated by modelling impacts of measures on the environment (scenario analysis).
The eutrophication scheme (Figure 2) details the actor–subject interactions according to the Extended DPSIR, and part of it—more precisely, those related to nitrogen releases—will be used hereafter to design a water load balance. Figure 7 shows such a balance as a cycle of physical flows between the water chain (socio-economy) and the water system (aquatic ecosystem) on the left-hand side, and an impact/effect analysis of these flows for calculating load reductions on the right-hand side. Combined, they provide the necessary and sufficient information to formulate measures. This balance can be populated with data of water masses (volumes, Q) or substance loads (L) of a water body, catchment, or river basin. Gross emissions relate to the pollution produced by the socio-economy. Net emissions are direct or indirect pollution discharges into the receiving water system. The main differences between gross and net emissions are a result of wastewater treatment and terrestrial interactions (nutrient retention and uptake, erosion). Pollution loads, surface water loads, and allowable loads (according to the EQSs) can be compared to calculate reductions, so as to reach the EQSs or other objectives. Load reductions (L-values) offer better opportunities for policy and management to define measures compared to the traditional concentration-based (C-values) water quality approach.
7. Practical Illustration: A River Basin Load Balance
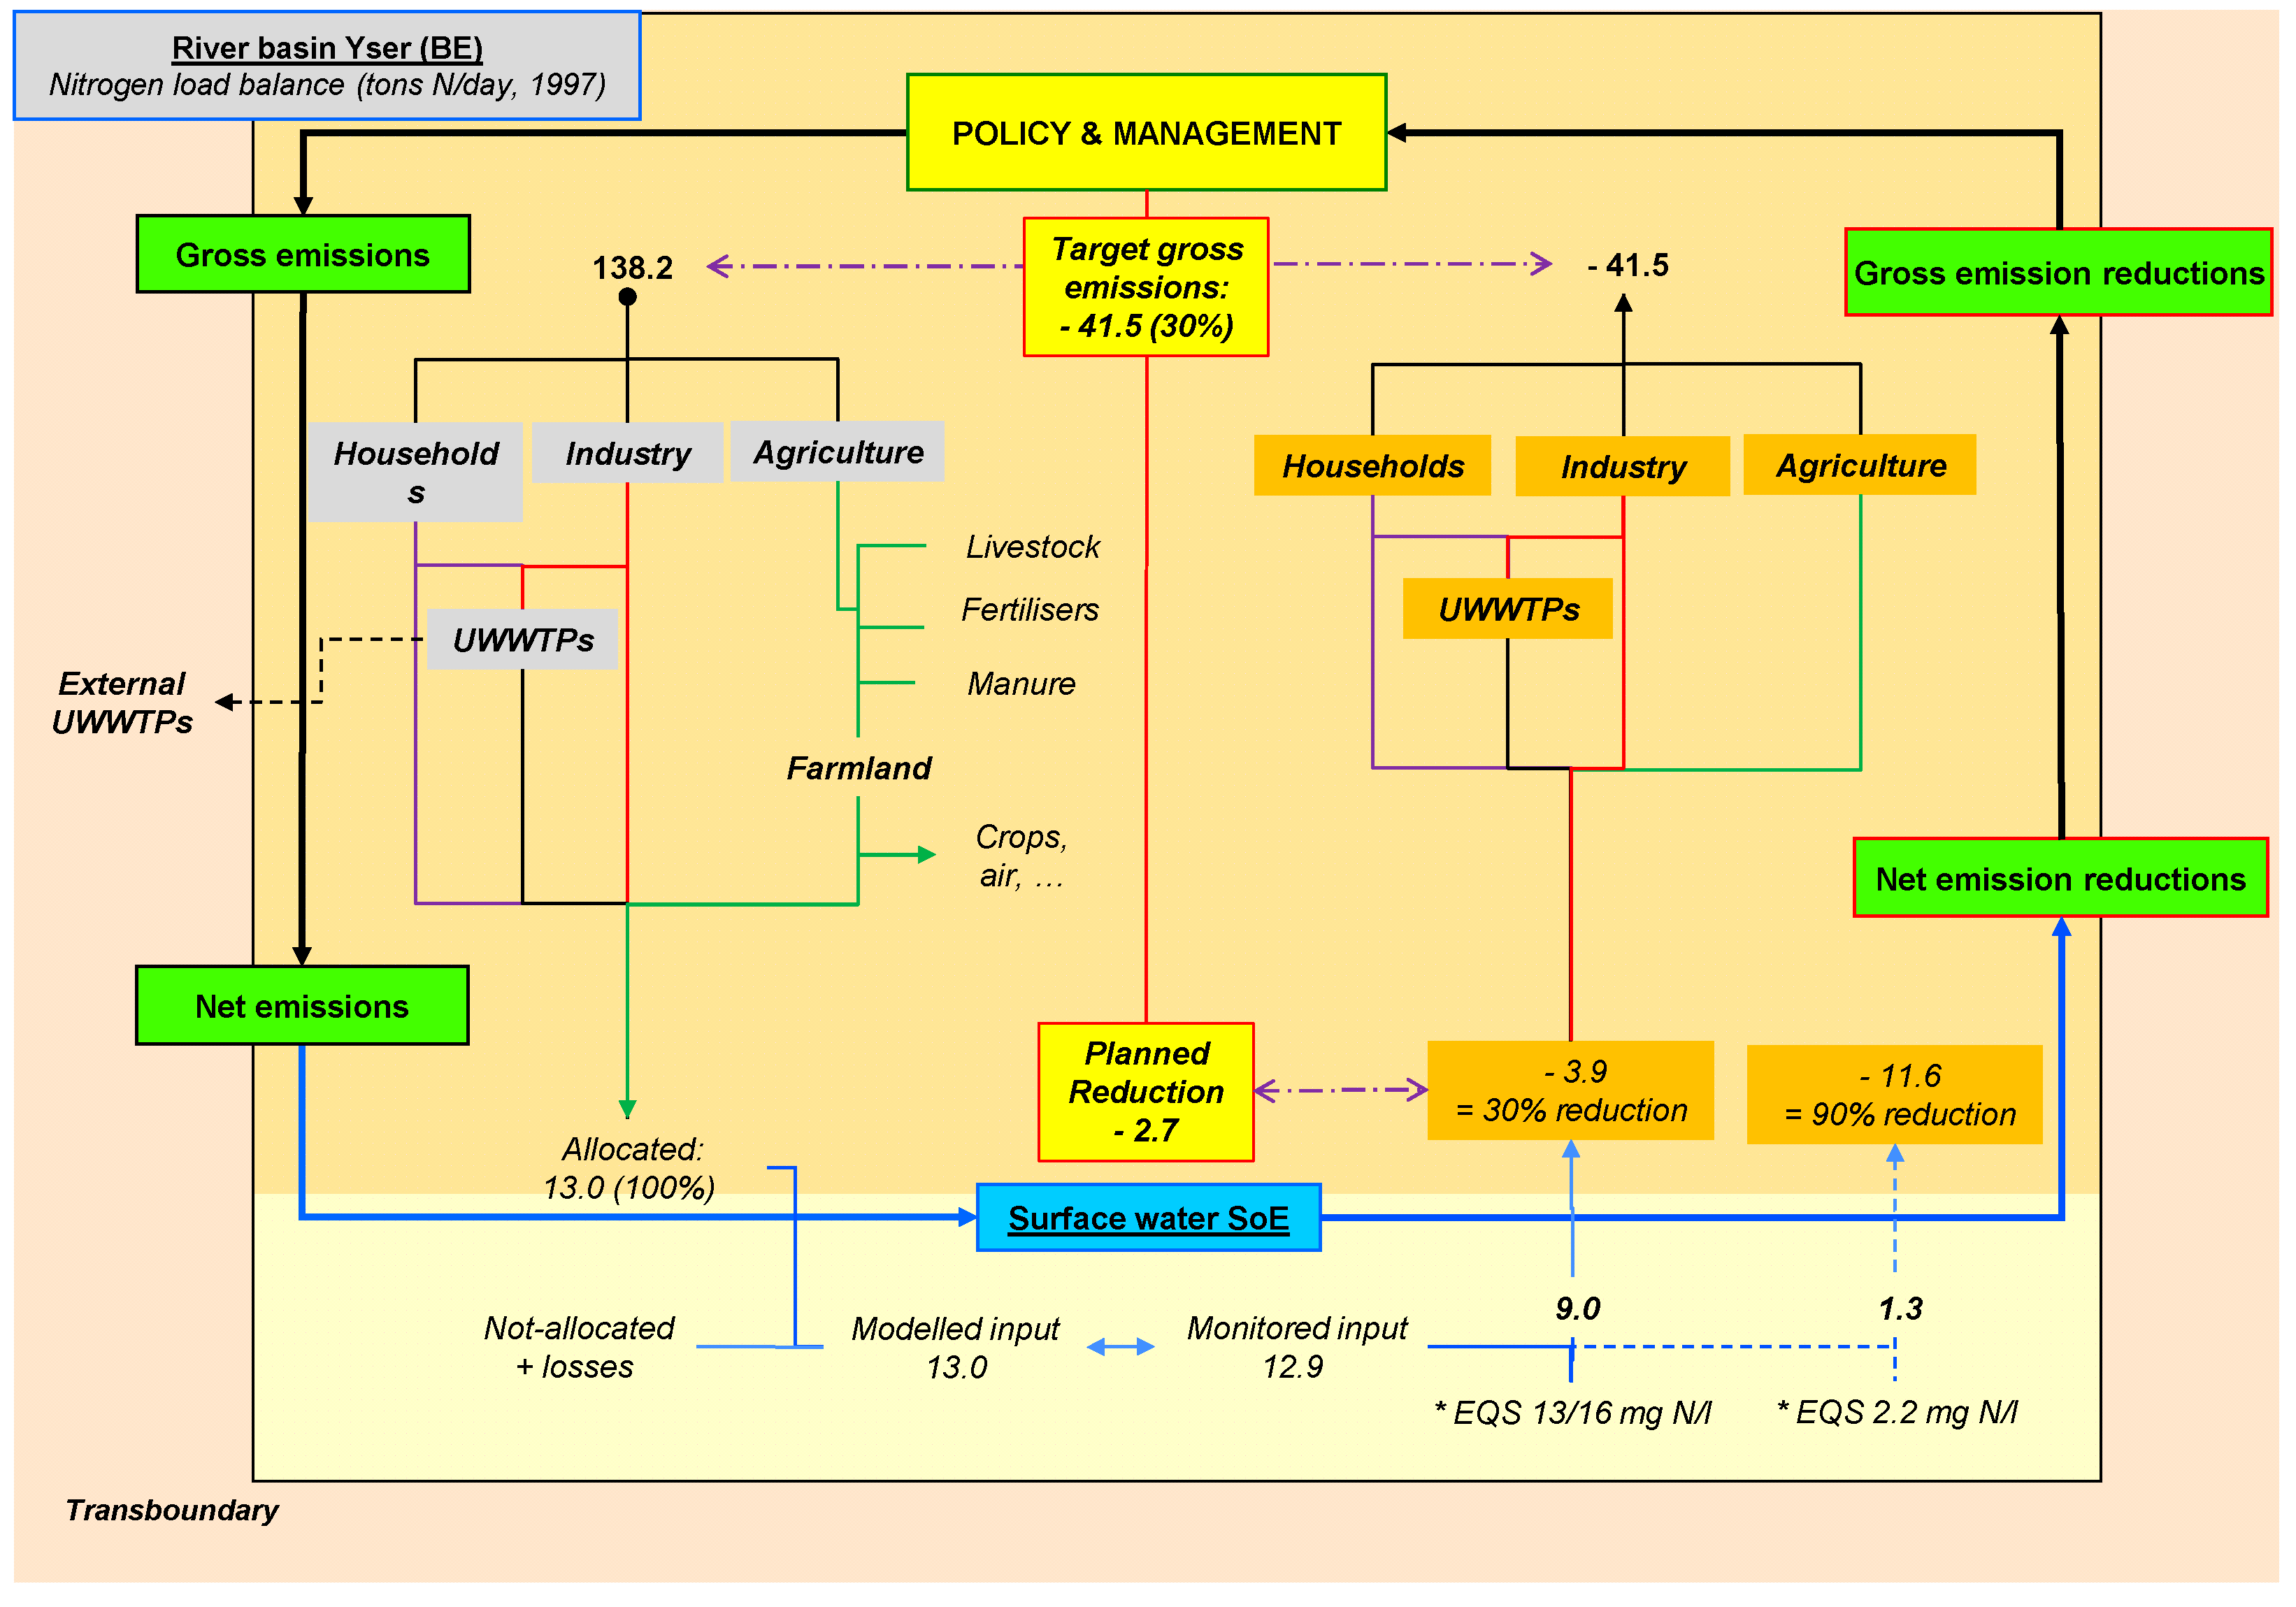
An example of a water load balance is presented for nitrogen in the Yser River basin (Flanders, Belgium), highly impacted by agriculture (piggery) and the food industry (Figure 8). Gross emissions are calculated for the pollution sources of households, industry, and agriculture. Their wastewater is partially treated in urban wastewater treatment plants (UWWTPs). Net emissions are calculated and compared to the surface water load. In this case, calculated net emissions—based on models, estimations, and monitoring—are almost equal to the monitored load in the water body, which means that the total of the net emissions can be allocated to one or another pollution source. Comparison of the surface water load with different sets of EQS values—of which the choice is a matter of decision-making—leads to net emission reductions of 30% and 90%. This is the degree of reduction to be obtained by reducing discharges into the water body. The values can be broken down to the polluter’s level in a linear way (using the ratio gross/net emissions): gross emission reductions should reach nearly 42 tons of nitrogen per day (or 30% of actual pollution) if conditions remain unchanged (BAU, business as usual). For the reference year, planned measures reached a net emission reduction of 2.7 tons N/d, insufficient to meet the less stringent EQSs of 13/16 mg N/L (3.9 t/d). This impact calculation does not consider additional load reduction efforts by UWWTPs, which are subject to discussions between polluters and governance.
Even a simple balance has several shortcomings and difficulties that, if not addressed in more detail in models and balances, will become part of the policy and management discourse:
- It is assumed that the balance displays a linear source–effect relationship, which implies that the net emission reduction percentages can serve as a basis for gross emission reduction, using the same gross–net emission ratios.
- It is assumed that the share of the polluters to the total pollution load (net emission) can be used for allocation of net emission reductions. This does not include unknown or uninvestigated pollution sources, and does not anticipate future additional loads.
- Gross emission reductions do not include previous sanitation efforts.
- Gross emission reductions allow the discussion of trade-offs of sanitation efforts between (groups of) polluters, e.g., according to investment affordability.
- Allocation of reduction efforts requires an assessment of the UWWTPs in terms of optimal and maximal functioning.
- Detailed allocation of gross emission reductions to individual polluters (e.g., at plant level) is possible, however, with the inevitable increase of uncertainty.
In practice, balances, as well as the produced figures, require making choices in very different ways, such as defining the need for more detailed balances, setting EQS levels, applying and adapting policy instruments, allocating sanitation efforts to other polluters, or developing an implementation plan.
8. Discussion
This paper illustrates the conceptual and practical complexity of environmental impact analyses, which justifies a stepwise approach using frameworks and tools. PTM is a generic framework, not only useful for environmental analyses, but potentially also for socio-economic analyses. This also applies to DPSIR as a tool. The diversity and complexity of environmental issues exceed the DPSIR approach, but PTM offers a conceptual umbrella. However, it becomes clear that DPSIR does not easily fit into PTM. GASI enables the incorporation of DPSIR into PTM, using a different meaning of ‘impacts’, and the description of environmental analyses as a process of decision-making, impact analysis, and knowledge transfer.
There is a rationale in the hierarchy of concepts, with the Pentatope Model combining Governance and Societal Capitals; GASI explaining the relational forces of impact analyses; and DPSIR factors allowing quantification of the process steps of disturbances, the development of substance balances to support decision-making, and the scientific modelling of complex systemic relationships to support balances. Across this hierarchy, the notions of impacts, actors/subjects, and effects/efforts seem essential when dealing with environmental disturbances. The case of water balances illustrates that additional elements in the context of the envisaged aquatic issue must be considered when applying DPSIR: aquatic EQSs, load calculations, and emission reductions, amongst others. Both PTM and balances allow an easy explanation of the context of these elements.
Despite the critics, DPSIR still has great value as a conceptual framework and communicative tool. The focus of this paper is on the strengthening of its conceptual basis, in order to deal with complex issues. Using the water balance as an example, it is concluded that DPSIR is not ready-made and needs ‘modelling’ according to the purpose of its application. This means that there is still room for improvement of its practical application, in particular when related to responses. This requires a clear and coherent terminology, and a methodological foundation for steering governance. Using DPSIR to merely produce indicators is a small basis for effective and efficient governance. It only warns governance, and often results in a ‘trial and error’ policy and management, and monitoring programs only allowing ex post evaluation. To improve its applicability, DPSIR is used to structure the balance flowchart. Hence, its value exceeds the mere classification of indicators. This paper mainly focuses on the PSI-R interaction; similar studies on R-D (elaborating on decision-making) and D-PSI (elaborating on megatrends) should complete this evaluation.
A water balance is only one part of a complete substance balance, nitrogen only one parameter of all relevant aquatic substances, and Figure 2 only a small part of the impacts to be examined. In this respect, an overall environmental analysis of even a single disturbance seems complex, cumbersome, and time-consuming. Size and scale tend to be weak points when developing balances. On the other hand, current and local policy becomes increasingly dependent on global environmental issues and international policy. This makes the design of the impact analysis of utmost importance, to which PTM, GASI, and DPSIR are of help. A water balance illustrates how to produce evidence suitable for governance. In this case, balances support evidence-based and ‘purposive’ policy and management by calculating the distance-to-target (effects and efforts). The definition of effects follows the terminological review on ‘impacts’. The effects/efforts equation is an important additional element in the case of substance balances. Further research on the generic application of the principle, as well as on the need for other additional features, seems necessary. The water balance showed the difference between measures based on a business-as-usual approach and ‘modelled’ data, serving as an input to governance. Governance has its own process rules, not discussed in this paper, and was addressed in a rather static way, reducing the complexity of the decision-making process to the application of measures. Yet, the figures provide a basis to differentiate sanitation efforts according to socio-economic and governance criteria.
Further development of a combined PTM–GASI–DPSIR approach, as well as scientific models and balances, is required. At the conceptual level, this relates to the role of ES G&Ss, EQSs, valuation of natural resources, and environmental accounts. This includes more sophisticated aquatic models, scenario analyses related to EQSs, economic analyses (to define cost-effective measures), other ecosystem components (terrestrial, atmospheric, biotic), or transboundary and external (e.g., imported) water and substance flows for models and balances.
9. Conclusions
DPSIR is a valuable conceptual and communicative framework, but can be improved as a tool for disturbance analyses. To that end, an extended DPSIR, including societal capitals and explicitly showing impacts, is proposed. Incorporation into a larger conceptual basis such as PTM may also increase its applicability, for instance, on water balances. In that sense, GASI serves as a DPSIR–PTM interface, but also as a guide to start impact analyses, although its initial purpose was to clarify the terminology on impacts. To support evidence-based governance, it is important to use a combined PTM–GASI–DPSIR approach, which makes substance models and balances indispensable.
Acknowledgments
The author is very grateful to the three anonymous reviewers of this paper for their valuable comments, and wishes to acknowledge the suggestions and support of Peter Goethals during the drafting process. Many thanks also to Marie-Ange Buyse for the textual improvements.
Conflicts of Interest
The author declares no conflicts of interest.
References
- European Environment Agency (EEA). European Environment—State and Outlook 2015: Assessment of Global Megatrends; European Environment Agency: Copenhagen, Denmark, 2015; p. 134. [Google Scholar] [CrossRef]
- The Organisation for Economic Co-operation and Development (OECD). OECD Environmental Outlook to 2050; OECD Publishing: Paris, France, 2012. [Google Scholar]
- United Nations Environment Programme (UNEP). Early Warning Systems: A State of the Art Analysis and Future Directions; United Nations Environment Programme: Nairobi, Kenya, 2012; p. 63. [Google Scholar]
- Vannevel, R. Consequences of increasing environmental complexity in the water domain. Water Resour. Dev. 2011, 27, 639–653. [Google Scholar] [CrossRef]
- Vannevel, R. The Pentatope Model: A holistic approach for analysing and reviewing environmental complexity. Sustain. Water Qual. Ecol. 2013, 1–2, 10–23. [Google Scholar] [CrossRef]
- European Parliament (EP). Report on the Commission Communication to the Council and the European Parliament on European Community Water Policy; (COM(96) 0059-C4-0144/96); European Parliament: Brussels, Belgium, 1996; p. 19. [Google Scholar]
- United Nations Statistics Division (UNSD). SEEA-Water—System of Environmental-Economic Accounting for Water; ST/ESA/STAT/SER.F/100; United Nations (New York), Department of Economic and Social Affairs, Statistics Division: New York, NY, USA, 2012; p. 197. [Google Scholar]
- Fernandez, S.; Bouleau, G.; Treyer, S. Bringing politics back into water planning scenarios in Europe. J. Hydrol. 2014, 518, 17–27. [Google Scholar] [CrossRef]
- Kagalou, I.; Leonardos, I.; Anastasiadou, C.; Neofytou, C. The DPSIR Approach for an Integrated River Management Framework. A Preliminary Application on a Mediterranean Site (Kalamas River-NW Greece). Water Resour. Manag. 2012, 26, 1677–1692. [Google Scholar] [CrossRef]
- Ness, B.; Anderberg, S.; Olsson, L. Structuring problems in sustainability science: The multi-level DPSIR framework. Geoforum 2010, 41, 479–488. [Google Scholar] [CrossRef]
- IMPRESS. Guidance for the Analysis of Pressures and Impacts in Accordance with the Water Framework Directive; Final Version 5.3; IMPRESS: London, UK, 2002; p. 152. [Google Scholar]
- Cooper, P. Socio-ecological accounting: DPSWR, a modified DPSIR framework, and its application to marine ecosystems. Ecol. Econ. 2013, 94, 106–115. [Google Scholar] [CrossRef] [Green Version]
- Maxim, L.; Spangenberg, J.H.; O’Connor, M. An analysis of risks for biodiversity under the DPSIR framework. Ecol. Econ. 2009, 69, 12–23. [Google Scholar] [CrossRef]
- European Environment Agency (EEA). Results and Lessons from Implementing the Water Assets Accounts in the EEA Area—From Concept to Production; EEA Report; European Environment Agency: Copenhagen, Denmark, 2013; p. 259. [Google Scholar]
- Tscherning, K.; Helming, K.; Krippner, B.; Sieber, S.; y Paloma, S.G. Does research applying the DPSIR framework support decision making? Land Use Policy 2012, 29, 102–110. [Google Scholar] [CrossRef]
- Everard, M. Why does ‘good ecological status’ matter? Water Environ. J. 2012, 26, 165–174. [Google Scholar] [CrossRef]
- European Environment Agency (EEA). EEA Programming Document 2017–2019—Expanding the Knowledge Base for Policy Implementation and Long-Term Transitions; European Environment Agency: Copenhagen, Denmark, 2016; p. 144. [Google Scholar]
- Costanza, R.; d’Arge, R.; de Groot, R.; Farber, S.; Grasso, M.; Hannon, B.; Limburg, K.; Naeem, S.; O’Neill, R.V.; Paruelo, J.; et al. The value of the world’s ecosystem services and natural capital. Nature 1997, 387, 253–260. [Google Scholar] [CrossRef]
- Rekolainen, S.; Kämäri, J.; Hiltunen, M. A conceptual framework for identifying the need and role of models in the implementation of the Water Framework Directive. Int. J. River Basin Manag. 2003, 1, 347–352. [Google Scholar] [CrossRef]
- Smeets, E.; Weterings, R. Environmental Indicators: Typology and Overview; Technical Report No. 25; European Environment Agency: Copenhagen, Denmark, 1999; p. 19. [Google Scholar]
- Gregory, A.J.; Atkins, J.P.; Burdon, D.; Elliott, M. A problem structuring method for ecosystem-based management: The DPSIR modelling process. Eur. J. Oper. Res. 2013, 227, 558–569. [Google Scholar] [CrossRef]
- Kristensen, P. The DPSIR Framework. In Proceedings of the Workshop on a Comprehensive/Detailed Assessment of the Vulnerability of Water Resources to Environmental Changes in Africa Using River Basin Approach. UNEP Headquarters, Nairobi, Kenya, 27–29 September 2004. [Google Scholar]
- Pissourios, I.A. An interdisciplinary study on indicators: A comparative review of quality-of-life, macroeconomic, environmental, welfare and sustainability indicators. Ecol. Indic. 2013, 34, 420–427. [Google Scholar] [CrossRef]
- Tapio, P.; Williamo, R. Developing interdisciplinary environmental frameworks. Ambio 2008, 37, 125–133. [Google Scholar] [CrossRef]
- Atkins, J.P.; Burdon, D.; Elliott, M.; Gregory, A.J. Management of the marine environment: Integrating ecosystem services and societal benefits with the DPSIR framework in a systems approach. Mar. Pollut. Bull. 2011, 62, 215–226. [Google Scholar] [CrossRef] [PubMed]
- Kelble, C.R.; Loomis, D.K.; Lovelace, S.; Nuttle, W.K.; Ortner, P.B.; Fletcher, P.; Cook, G.S.; Lorenz, J.J.; Boyer, J.N. The EBM-DPSER Conceptual Model: Integrating Ecosystem Services into the DPSIR Framework. PLoS ONE 2013, 8, e70766. [Google Scholar] [CrossRef] [PubMed] [Green Version]
- Reis, S.; Morris, G.; Fleming, L.E.; Beck, S.; Taylor, T.; White, M.; Depledge, M.H.; Steinle, S.; Sabel, C.E.; Cowie, H.; et al. Integrating health and environmental impact Analysis. Public Health 2015, 129, 1383–1389. [Google Scholar] [CrossRef] [PubMed] [Green Version]
- Rounsevell, M.D.A.; Dawson, T.P.; Harrison, P.A. A conceptual framework to assess the effects of environmental change on ecosystem services. Biodivers. Conserv. 2010, 19, 2823–2842. [Google Scholar] [CrossRef]
- European Environment Agency (EEA). Sustainable Use and Management of Natural Resources; EEA Report No 9/2005; European Environment Agency: Copenhagen, Denmark, 2005; p. 68. ISBN 92-9167-770-1. [Google Scholar]
- Benitez-Capistros, F.; Hugé, J.; Koedam, N. Environmental Impacts on the Galapagos Islands: Identification of interactions, perceptions and steps forward. Ecol. Indic. 2014, 38, 113–123. [Google Scholar] [CrossRef]
- D’Arcy, B.J.; Ellis, J.B.; Ferrier, R.C.; Jenkins, A.; Dils, R. Diffuse Pollution Impacts—The Environmental and Economic Impacts of Diffuse Pollution in the UK; Terence Dalton Publishers: Suffolk, UK, 2000; p. 180. [Google Scholar]
- Martins, J.H.; Camanho, A.S.; Gaspar, M.B. A review of the application of driving forces–Pressure–State–Impact–Response framework to fisheries management. Ocean Coast. Manag. 2012, 69, 273–281. [Google Scholar] [CrossRef]
- European Environment Agency (EEA). Environmental Indicator Report 2017—In Support to the Monitoring of the Seventh Environment Action Programme; EEA Report No. 21/2017; European Environment Agency: Copenhagen, Denmark, 2017; p. 27. [Google Scholar] [CrossRef]
- Smith, C.; Papadopoulou, N.; Barnard, S.; Mazik, K.; Patrício, J.; Elliott, M.; Solaun, O.; Little, S.; Borja, A.; Bhatia, N.; et al. Conceptual Models for the Effects of Marine Pressures on Biodiversity; Deliverable 1.1; Hellinic Centre for Marine Research: Pasaia, Spain, 2014; p. 82. [Google Scholar]
- European Commission (EC). Guidance Document on the Application of Water Balances for Supporting the Implementation of the WFD; Final-Version 6.1—18/05/2015; European Union: Brussels, Belgium, 2015; p. 126. [Google Scholar] [CrossRef]
- Song, X.; Frostell, B. The DPSIR framework and a pressure-oriented water quality monitoring approach to ecological river restoration. Water 2012, 4, 670–682. [Google Scholar] [CrossRef]
- Borja, A.; Galparsoro, I.; Solaun, O.; Muxika, I.; Tello, E.M.; Uriarte, A.; Valencia, V. The European Water Framework Directive and the DPSIR, a methodological approach to assess the risk of failing to achieve good ecological status. Estuar. Coast. Shelf Sci. 2006, 66, 84–96. [Google Scholar] [CrossRef]
- Scheffer, M.; Carpenter, S.; Foley, J.A.; Folke, C.; Walker, B. Catastrophic shifts in ecosystems. Nature 2001, 413, 591–596. [Google Scholar] [CrossRef] [PubMed]
- Suding, K.N.; Gross, K.L.; Houseman, G.R. Alternative states and positive feedbacks in restoration ecology. Trends Ecol. Evolut. 2004, 19, 46–53. [Google Scholar] [CrossRef] [PubMed]
- Muylle, K.; Vannevel, R. Algemeen Waterkwaliteitsplan 2 (AWP 2)—1. IJzer; Vlaamse Milieumaatschappij: Aalst, Belgium, 2000; p. 215. (In Dutch) [Google Scholar]
Figure 1.
The Pentatope Model (PTM). PTM shows the way that Governance, Societal Capitals, Ecosystems, and the Environmental Information Cycle (EIC) interact: disturbances between Societal Capitals must be analyzed in order to provide information to governance. Governance—in particular, policy and management (P&M) instruments—allows steering of the Societal Capitals. Disturbances of ecosystems are caused by the use or exchange of ecosystem goods and services (ES G&Ss). The fifth PTM framework, DPSIR, cannot be easily shown in this figure.

Figure 2.
Simplified eutrophication scheme. Arrows show sequences of impacts within and between aquatic ecosystem factors (ESFs). The figure is based on the idea that the final status is the result of a chain reaction of activities (A), partial pressures (P) and related statuses (S).
Figure 2.
Simplified eutrophication scheme. Arrows show sequences of impacts within and between aquatic ecosystem factors (ESFs). The figure is based on the idea that the final status is the result of a chain reaction of activities (A), partial pressures (P) and related statuses (S).
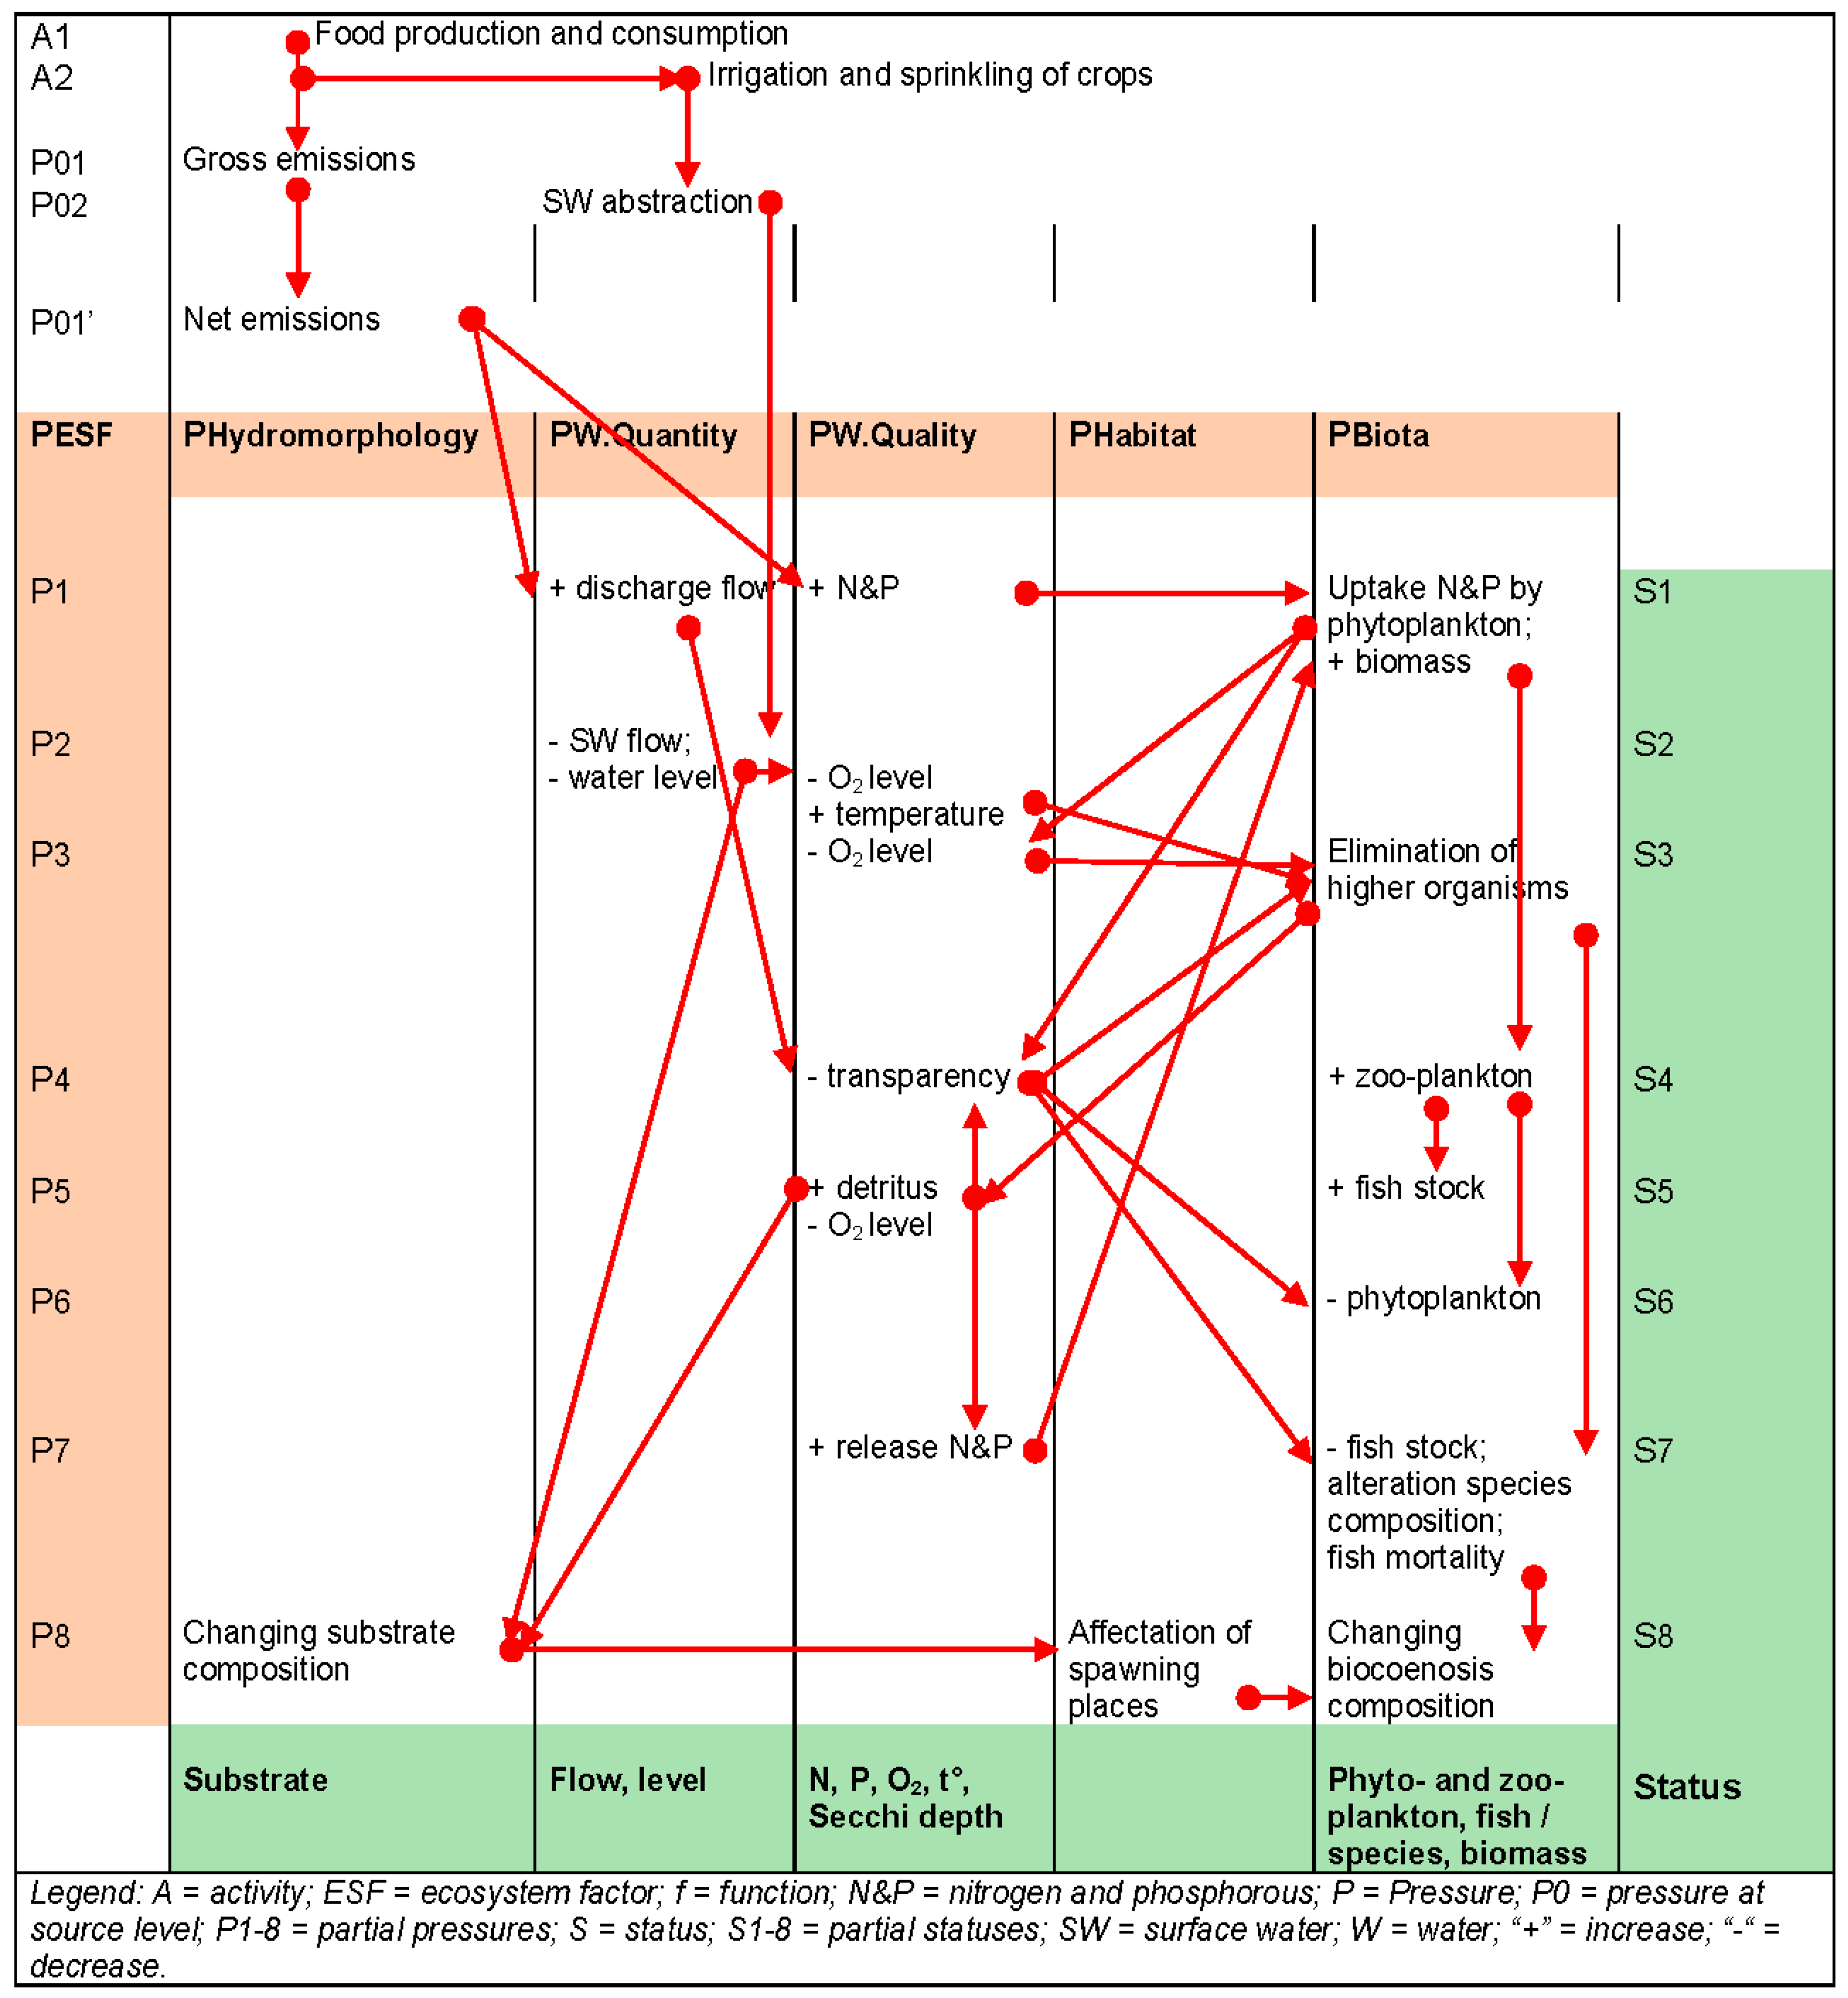
Figure 3.
The Pentatope Model (PTM) and the DPSIR to Governance by Actor–Subject Impact Assessment (GASI) transformation. (a) DPSIR as a framework interacting with other PTM factors; (b) Mapping of DPSIR onto PTM factors, stressing the importance of Societal Capitals (in particular the human (socio-economic) and natural (ecosystem) environment); (c) GASI relating to actors and subjects by means of impact analyses (bottom triangular area), providing knowledge to support decision-making (left triangular area); (d) The defined role of governance as an actor and the reversible role of socio-economy and ecosystems as actor or subject resulting in an alternative conceptual approach to impacts—GASI—to which DPSIR still applies.

Figure 4.
Extended DPSIR scheme. For each DPSIR factor, effects are shown as changes of the initial condition (0) to the final condition (1). Effects result from impacts between successive DPSIR factors. Impacts on the societal capitals are emphasized by showing the economic (Econ), social (Soc), and environmental (Env, or natural) capitals. Some impacts are secondary ‘natural’ (intrinsic, systemic) reactions of (parts of) capitals on impacted capitals (ICAP-CAP). Changing conditions force policy to respond, by addressing the capitals themselves (IR-CAP) or by influencing the disturbance process, i.e., drivers (IR-D), pressures (IR-P), and status (IR-S) conditions. Driving forces can be influenced by either policy responses or external events. Most challenging is to keep pace with increasing environmental complexity by questioning the responses themselves (IR-R), gradually moving towards an adapted form of policy and management (R0→R1). (Solid lines show straight impacts between DPSIR factors, dashed lines show responses between societal capitals and DPSIR factors; the dotted line indicates secondary environmental status (SoE) impacts).

Figure 5.
Superposition of the PT Model and GASI. Integration of GASI allows simplification of the PT Model framework, as only two key interactions are added: impact analysis and decision-making. Additional features such as modelling and balances are added, allowing the linkage of fundamental topics related to sustainable development. (See text for further description and abbreviations.)
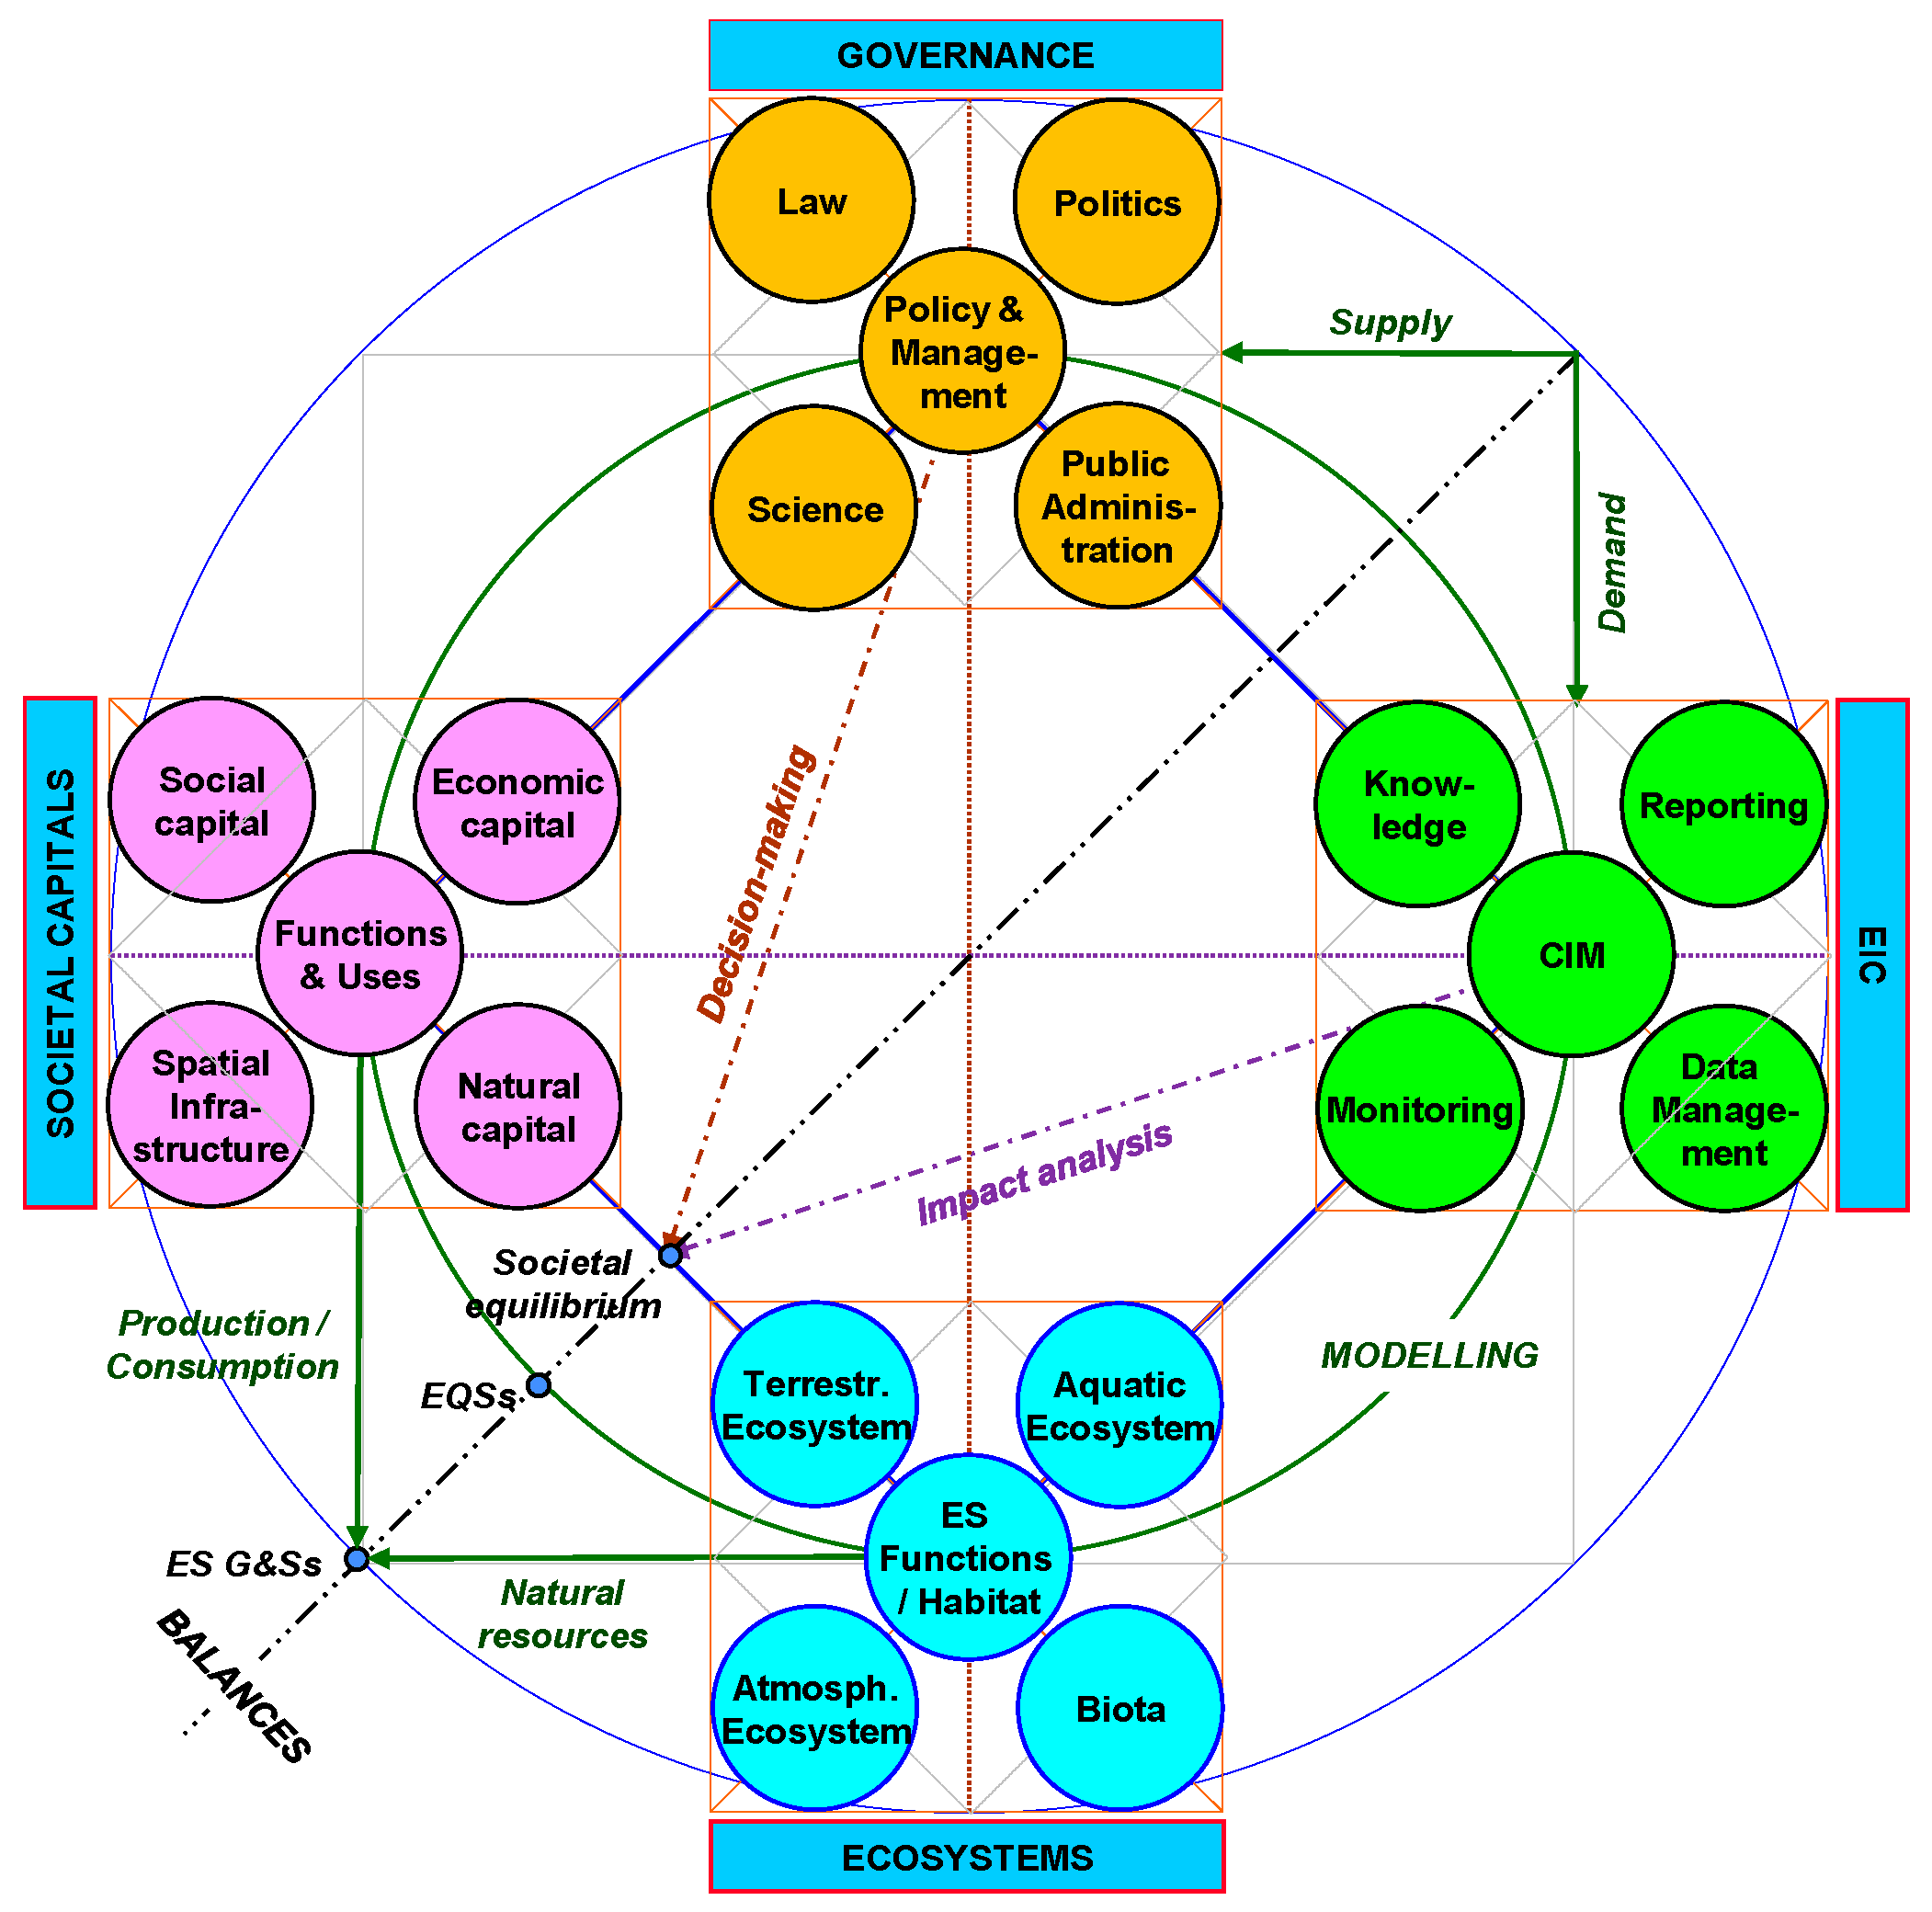
Figure 6.
GASI, PTM, and DPSIR impacts (I) related to water mass and load balances. The central part shows the water balance with interactions between pressures (emissions), status (S) monitoring (of water quantity and quality), and calculated effects/efforts (eff) and responses (R, measures) based on emission reductions. Grey zones show corresponding factors of frameworks and balances. (CAP: Societal Capitals, eff: effects/efforts, ES: ecosystems, S-E: socio-economy). Arrows show impacts between factors.
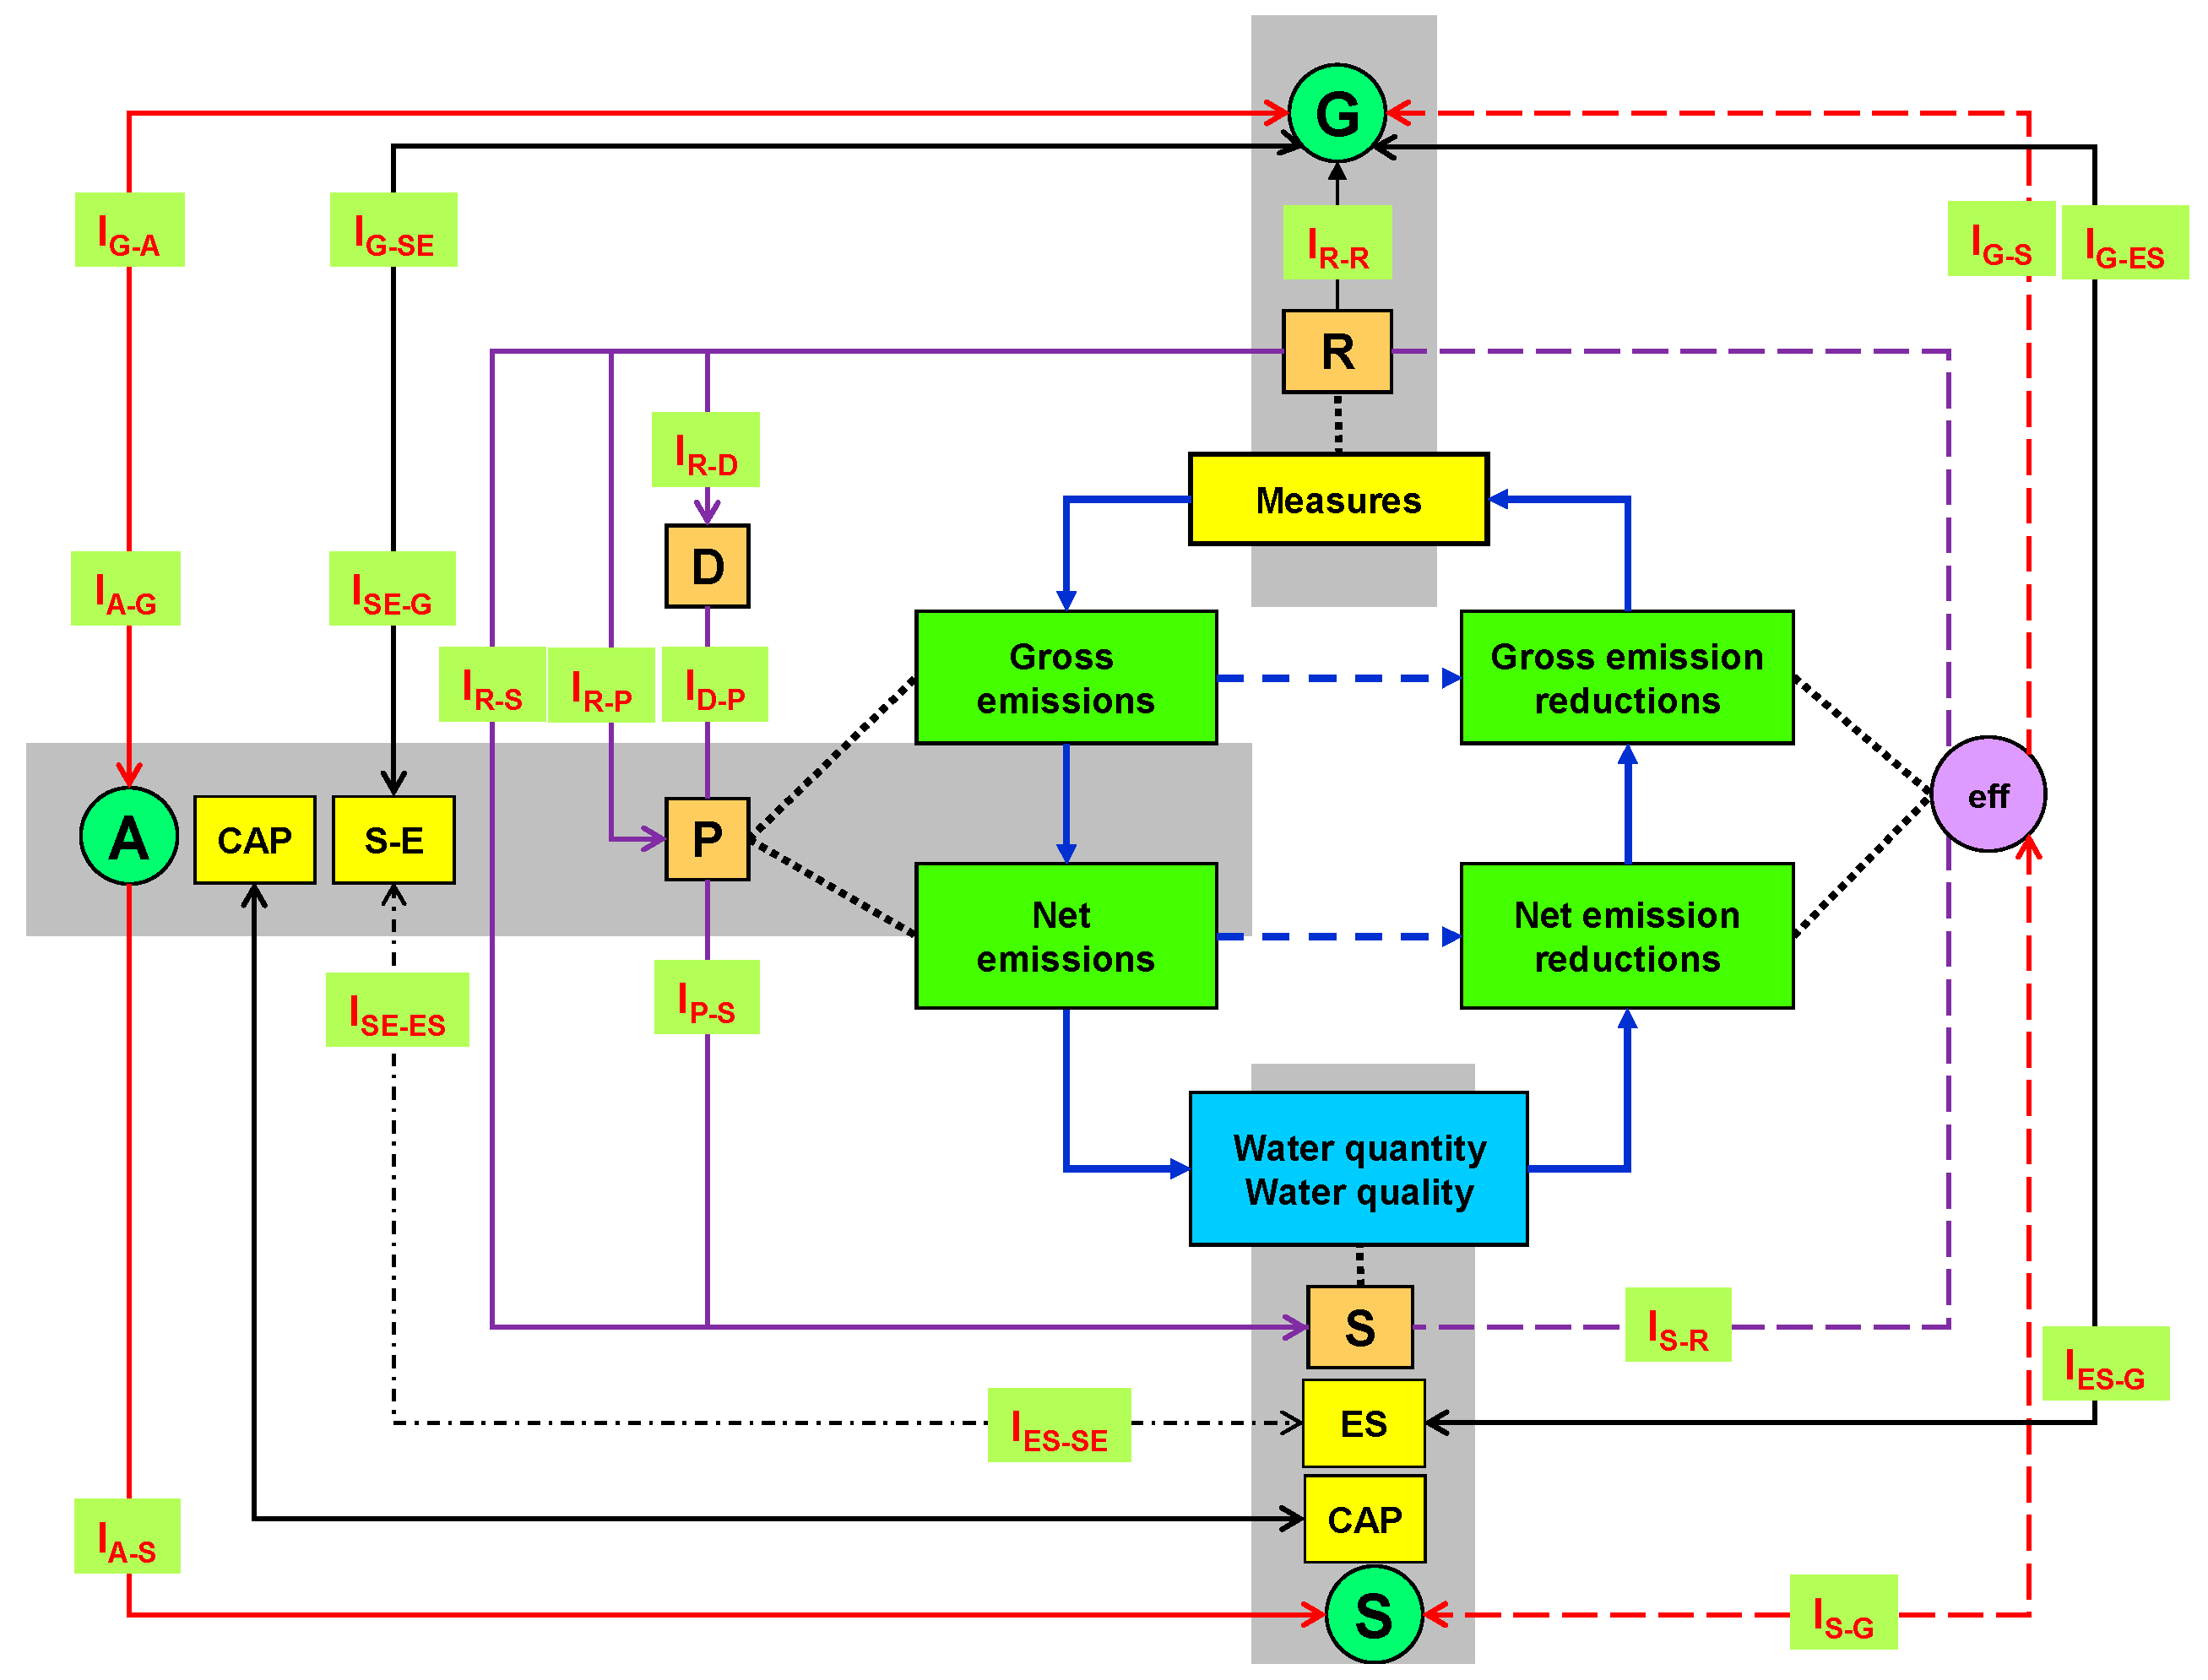
Figure 7.
Measures based on a water balance. A complete and workable balance requires the introduction of the notion of ‘net emission’ (entering the surface water (SW) body) beside ‘gross emission’ (leaving the pollution source). Environmental status (S) depends on the monitoring of water quantity and quality. Source-oriented measures intend to regulate the polluter’s impact by limiting emissions, possibly by means of urban wastewater treatment plants (UWWTPs); effect-oriented measures aim to restore natural conditions of ecosystems. ‘Measures’ is about decision-making that depends on monitoring of the environmental status. The schema includes a flow- (Q-), concentration- (C-) and load- (L-)based approach (with Q * C = L). Decision-making using a C-based approach is a widely applied, less secure trial-and-error strategy that systematically compares the monitored parameter concentration (CSW) with environmental quality standards (EQSs) (CEQS). Calculation of load reductions allows the definition of measures at both the ecosystem level (net emission reductions) and the polluter level (gross emission reductions).
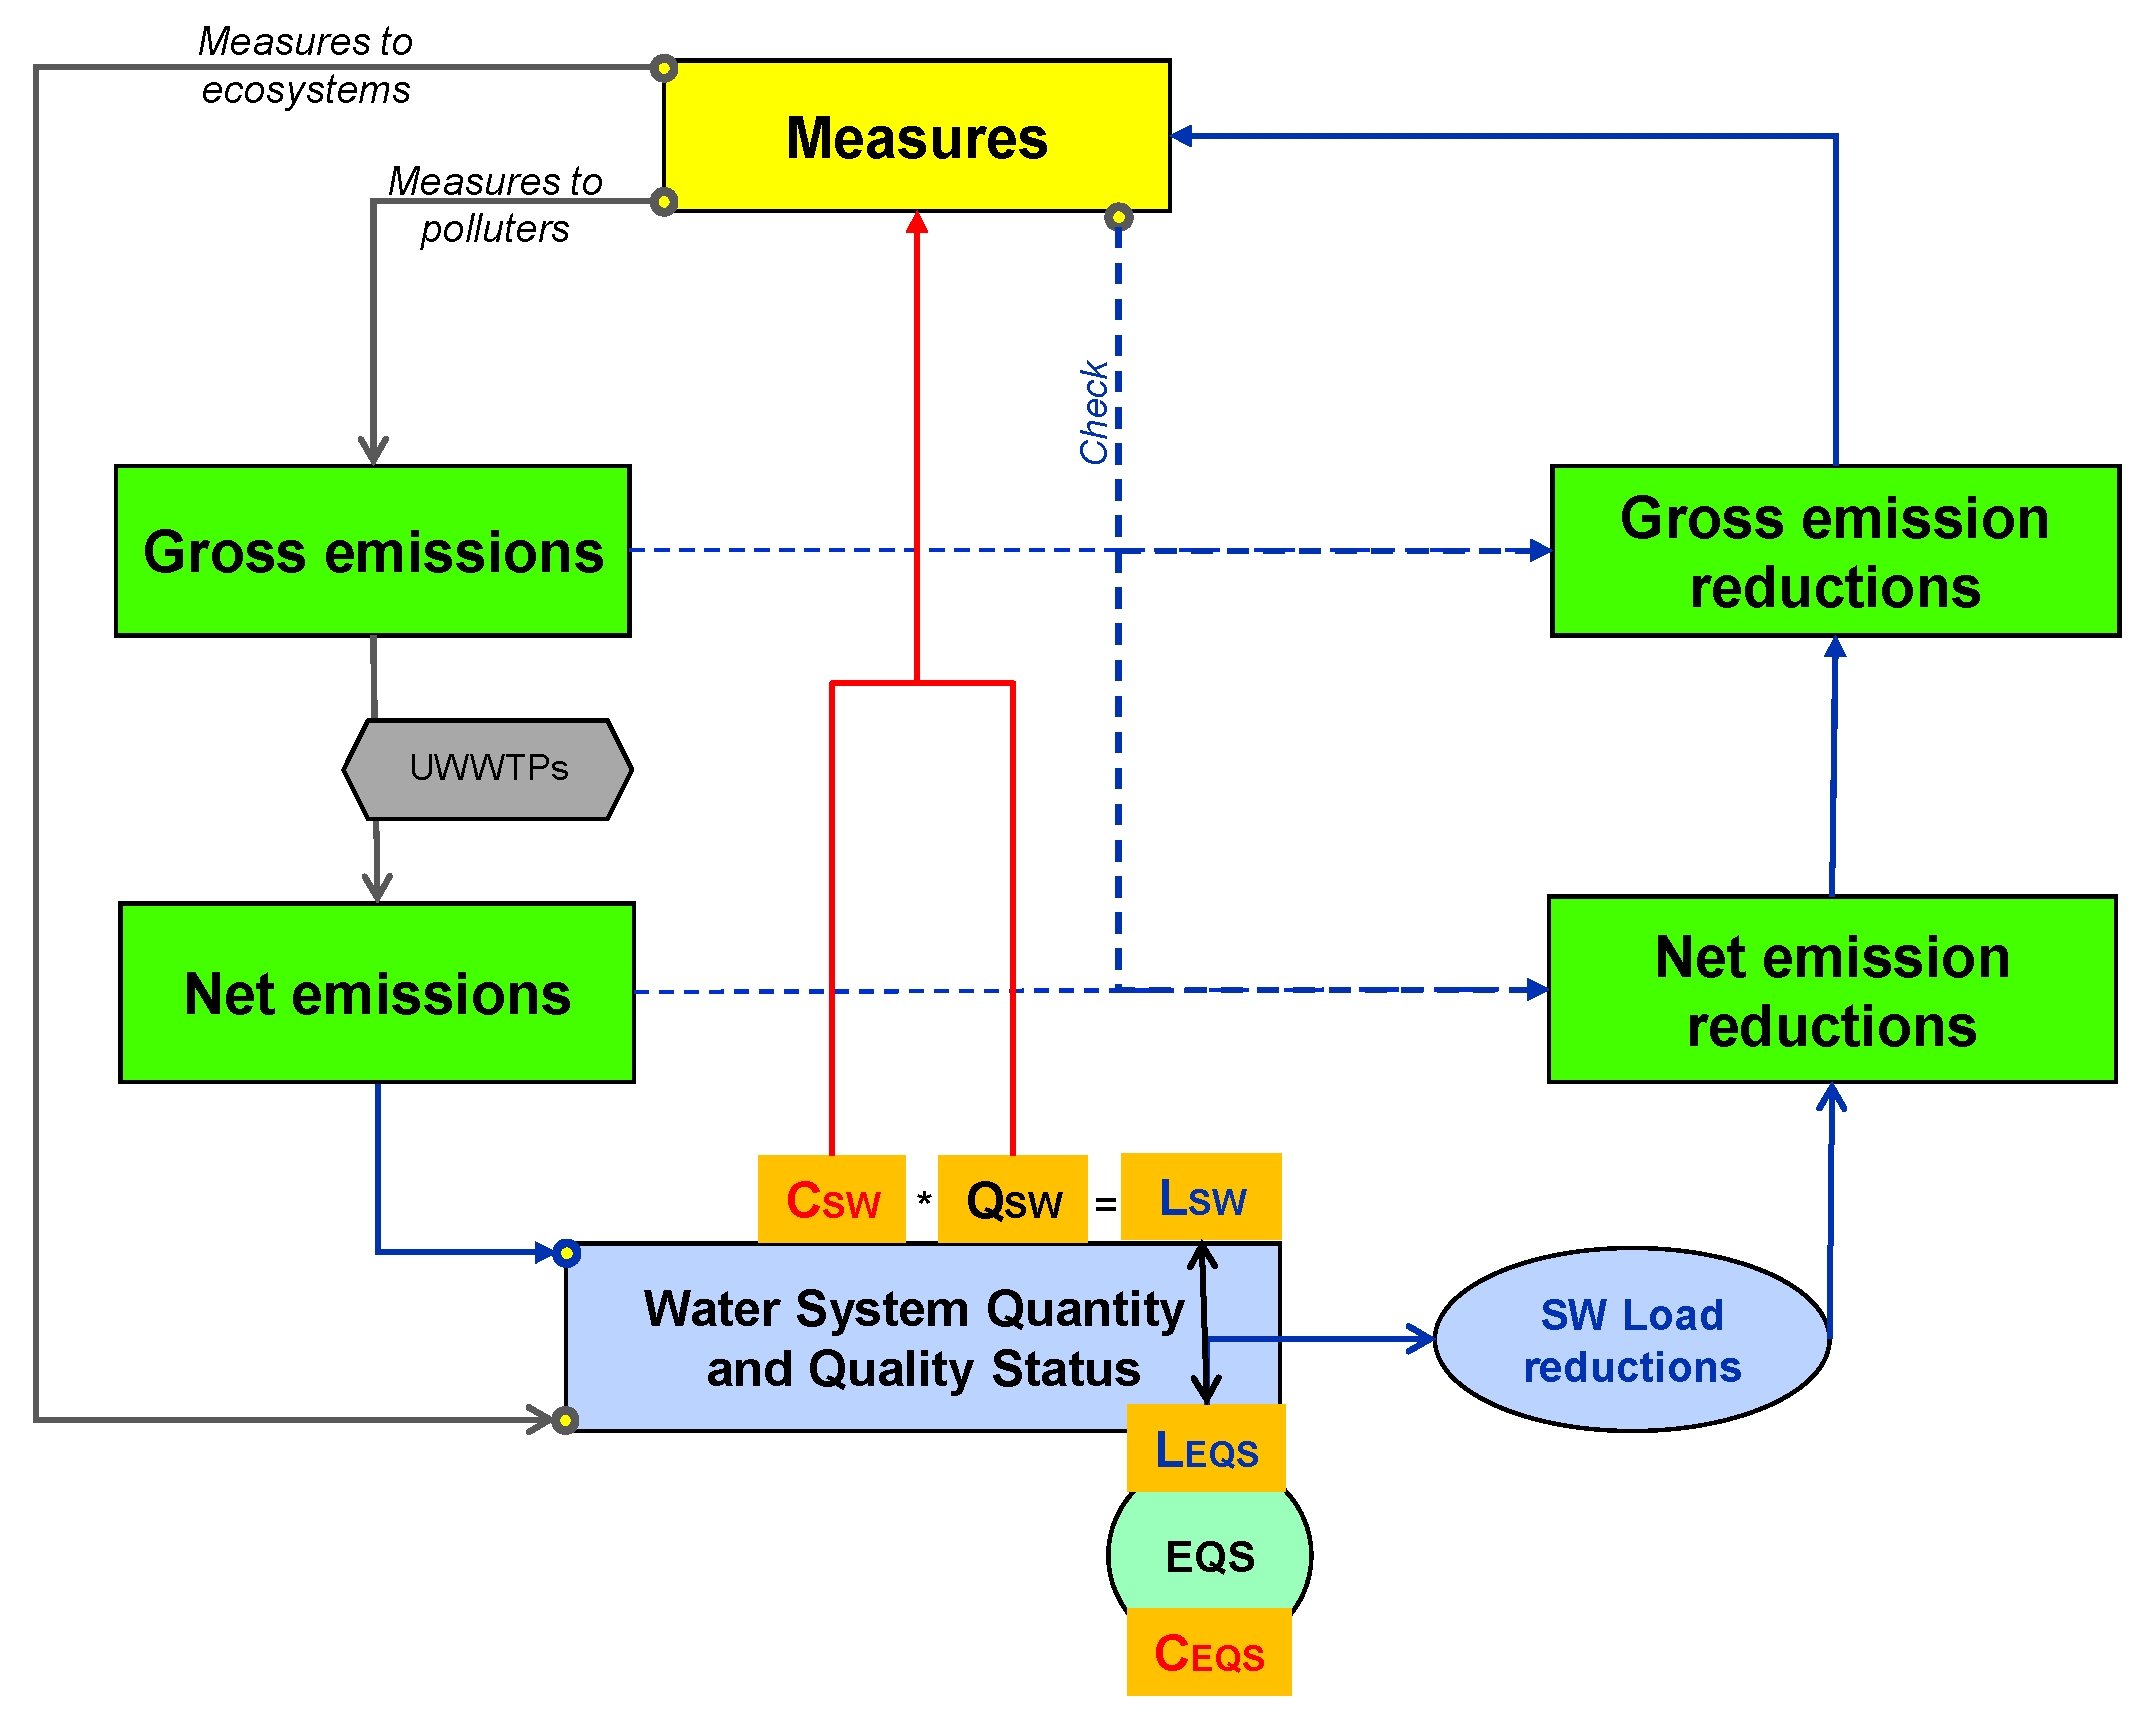
Figure 8.
Nitrogen load balance of the Belgian Yser river basin. Gross and net emissions are calculated for different pollution sources (households, industry, agriculture, and urban wastewater treatment plants) and compared with the surface water pollution load. Required reductions according to the EQS values are calculated at the surface water (net emission reduction) and pollution source (gross emission reduction) levels. Comparison with the reduction effort calculated for a mix of measures (planned reduction) reveals that these measures are not sufficient to meet the least stringent environmental objectives. Figures are generated using several databases, algorithms, and models, applying estimations and other approaches to reduce uncertainty and data gaps. EQS 13/16 mg N/L is applied to protected drinking water areas and areas where basic quality standards apply; EQS 2.2 mg N/L equals a eutrophication level. (Data obtained from Muylle and Vannevel [40]).
© 2018 by the author. Licensee MDPI, Basel, Switzerland. This article is an open access article distributed under the terms and conditions of the Creative Commons Attribution (CC BY) license (http://creativecommons.org/licenses/by/4.0/).
Share and Cite
MDPI and ACS Style
Vannevel, R. Using DPSIR and Balances to Support Water Governance. Water 2018, 10, 118. https://doi.org/10.3390/w10020118
AMA Style
Vannevel R. Using DPSIR and Balances to Support Water Governance. Water. 2018; 10(2):118. https://doi.org/10.3390/w10020118
Chicago/Turabian StyleVannevel, Rudy. 2018. "Using DPSIR and Balances to Support Water Governance" Water 10, no. 2: 118. https://doi.org/10.3390/w10020118
Note that from the first issue of 2016, this journal uses article numbers instead of page numbers. See further details here.