Comparing Mixed-Media and Conventional Slow-Sand Filters for Arsenic Removal from Groundwater

 ,
,
Abstract
:
1. Introduction
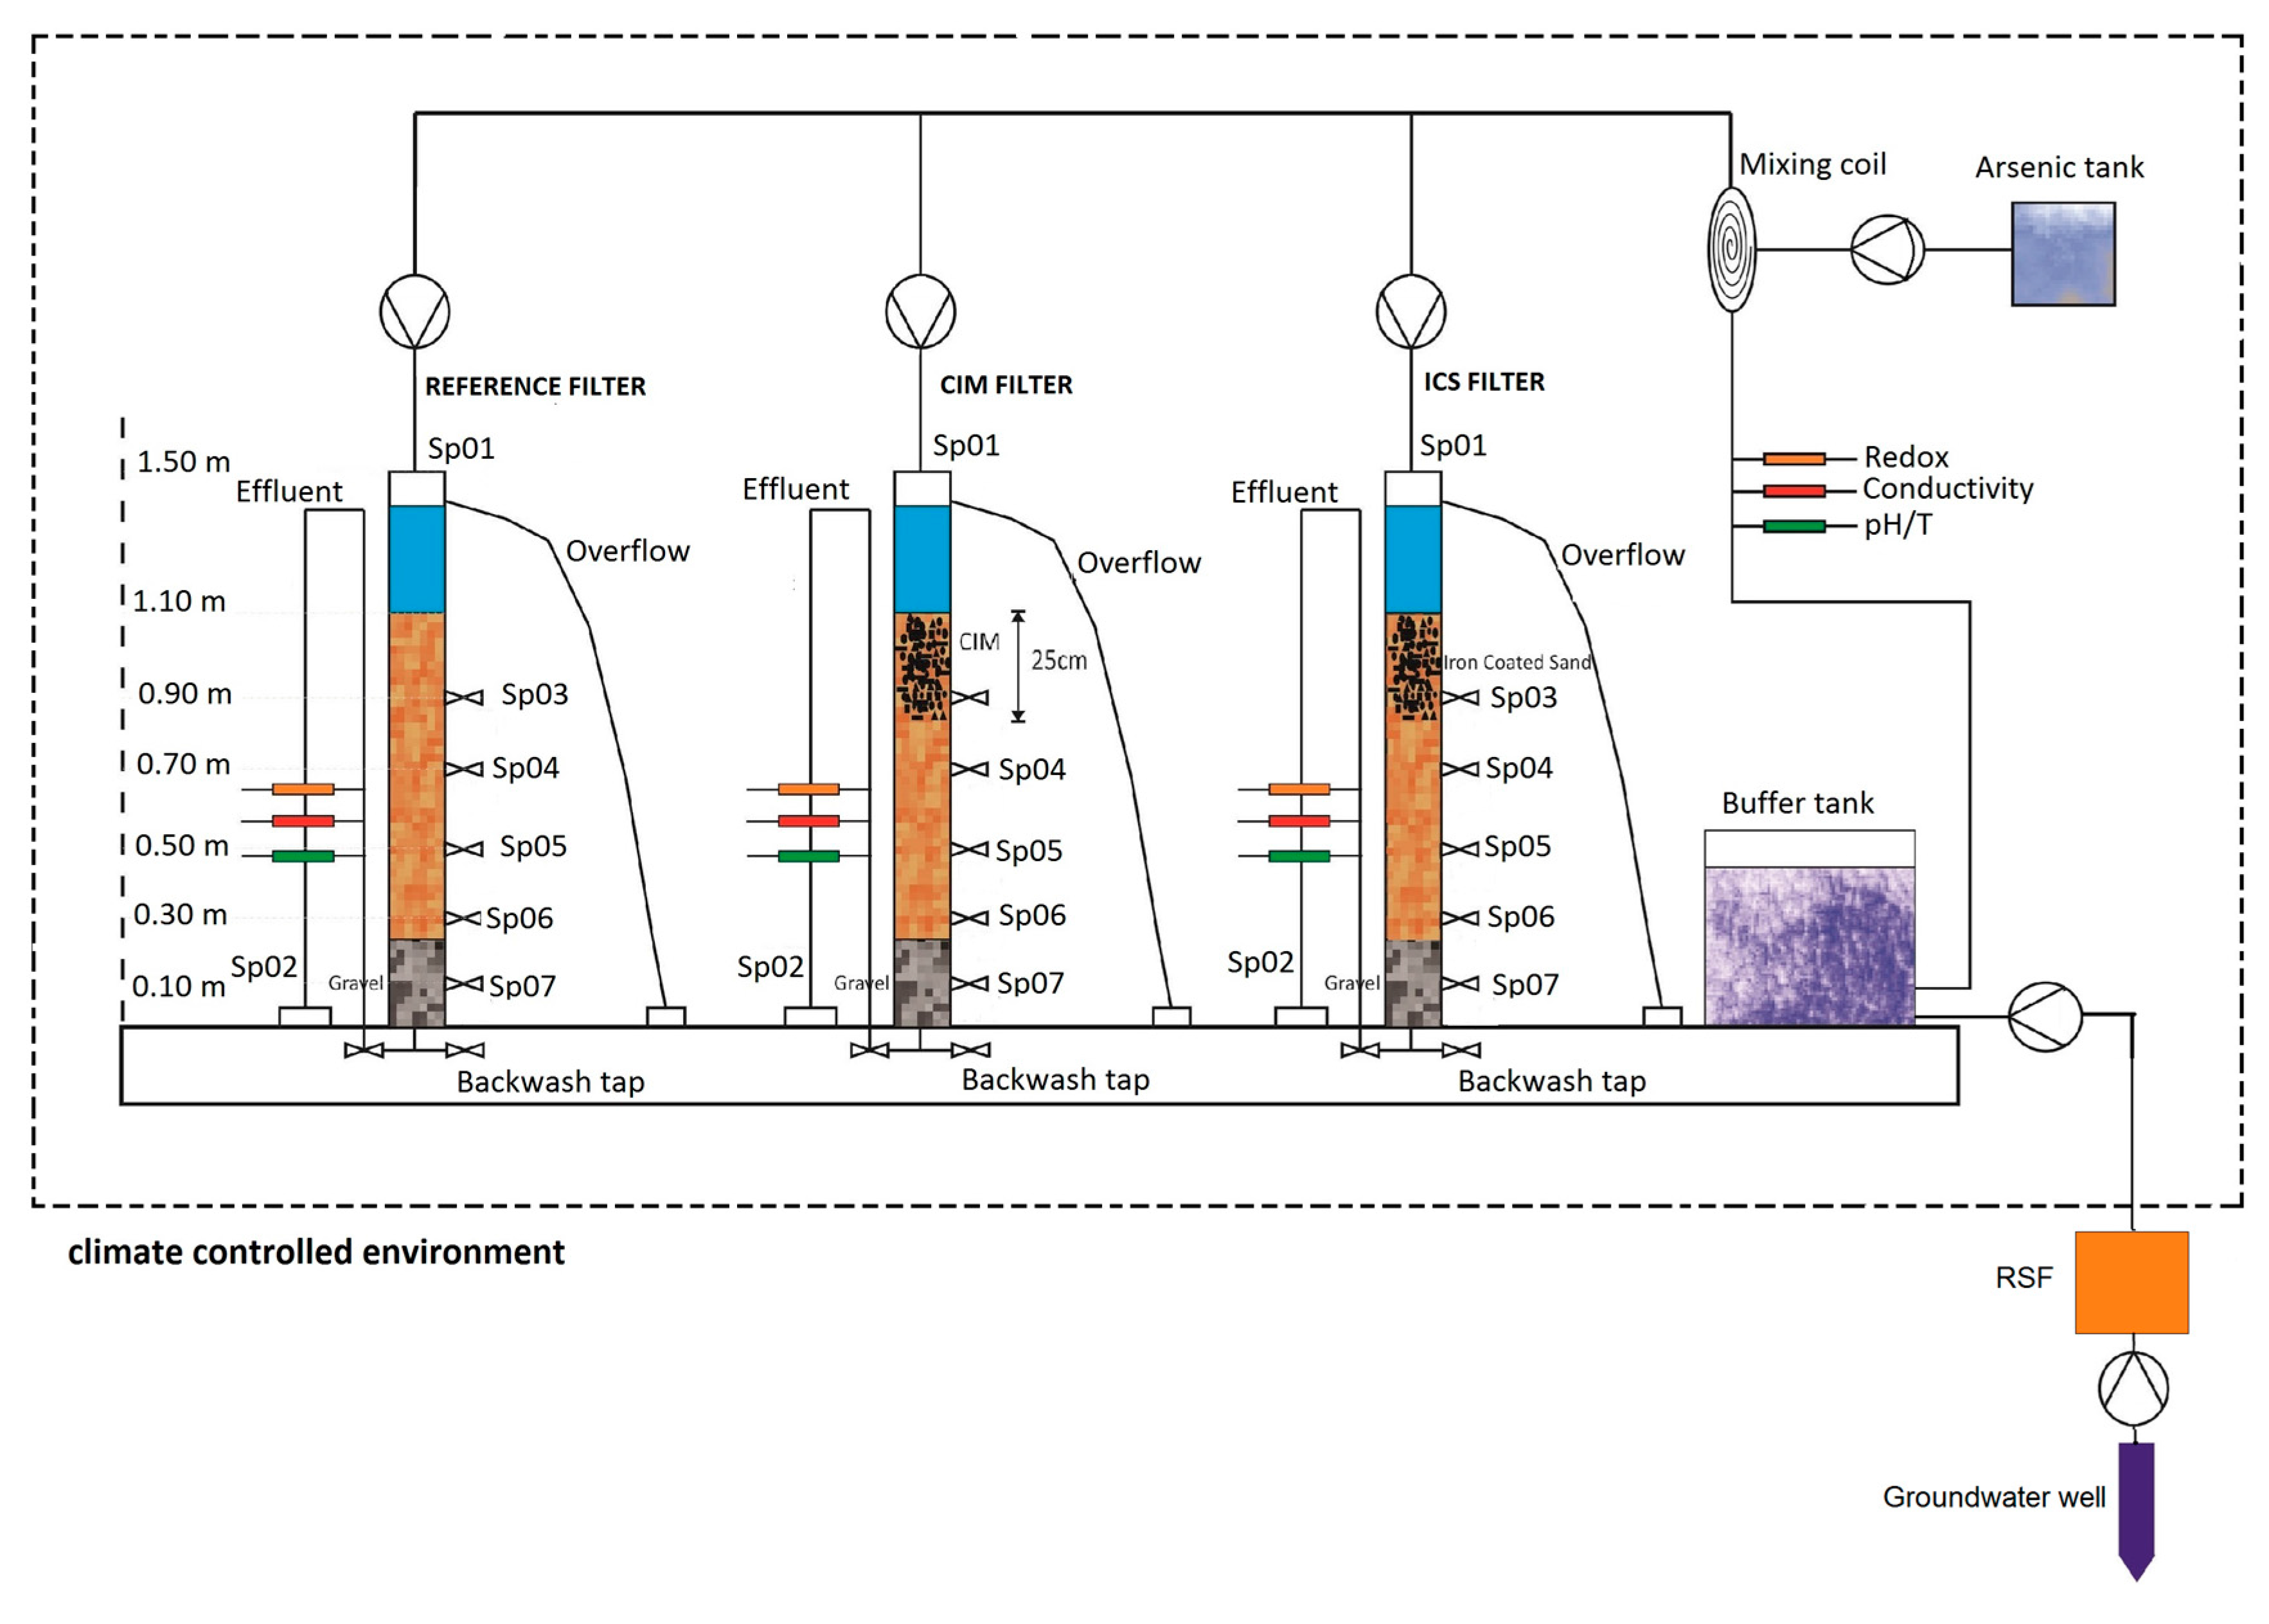
2. Materials and Methods
2.1. Common Media (In All Filters)
2.2. Specific Media
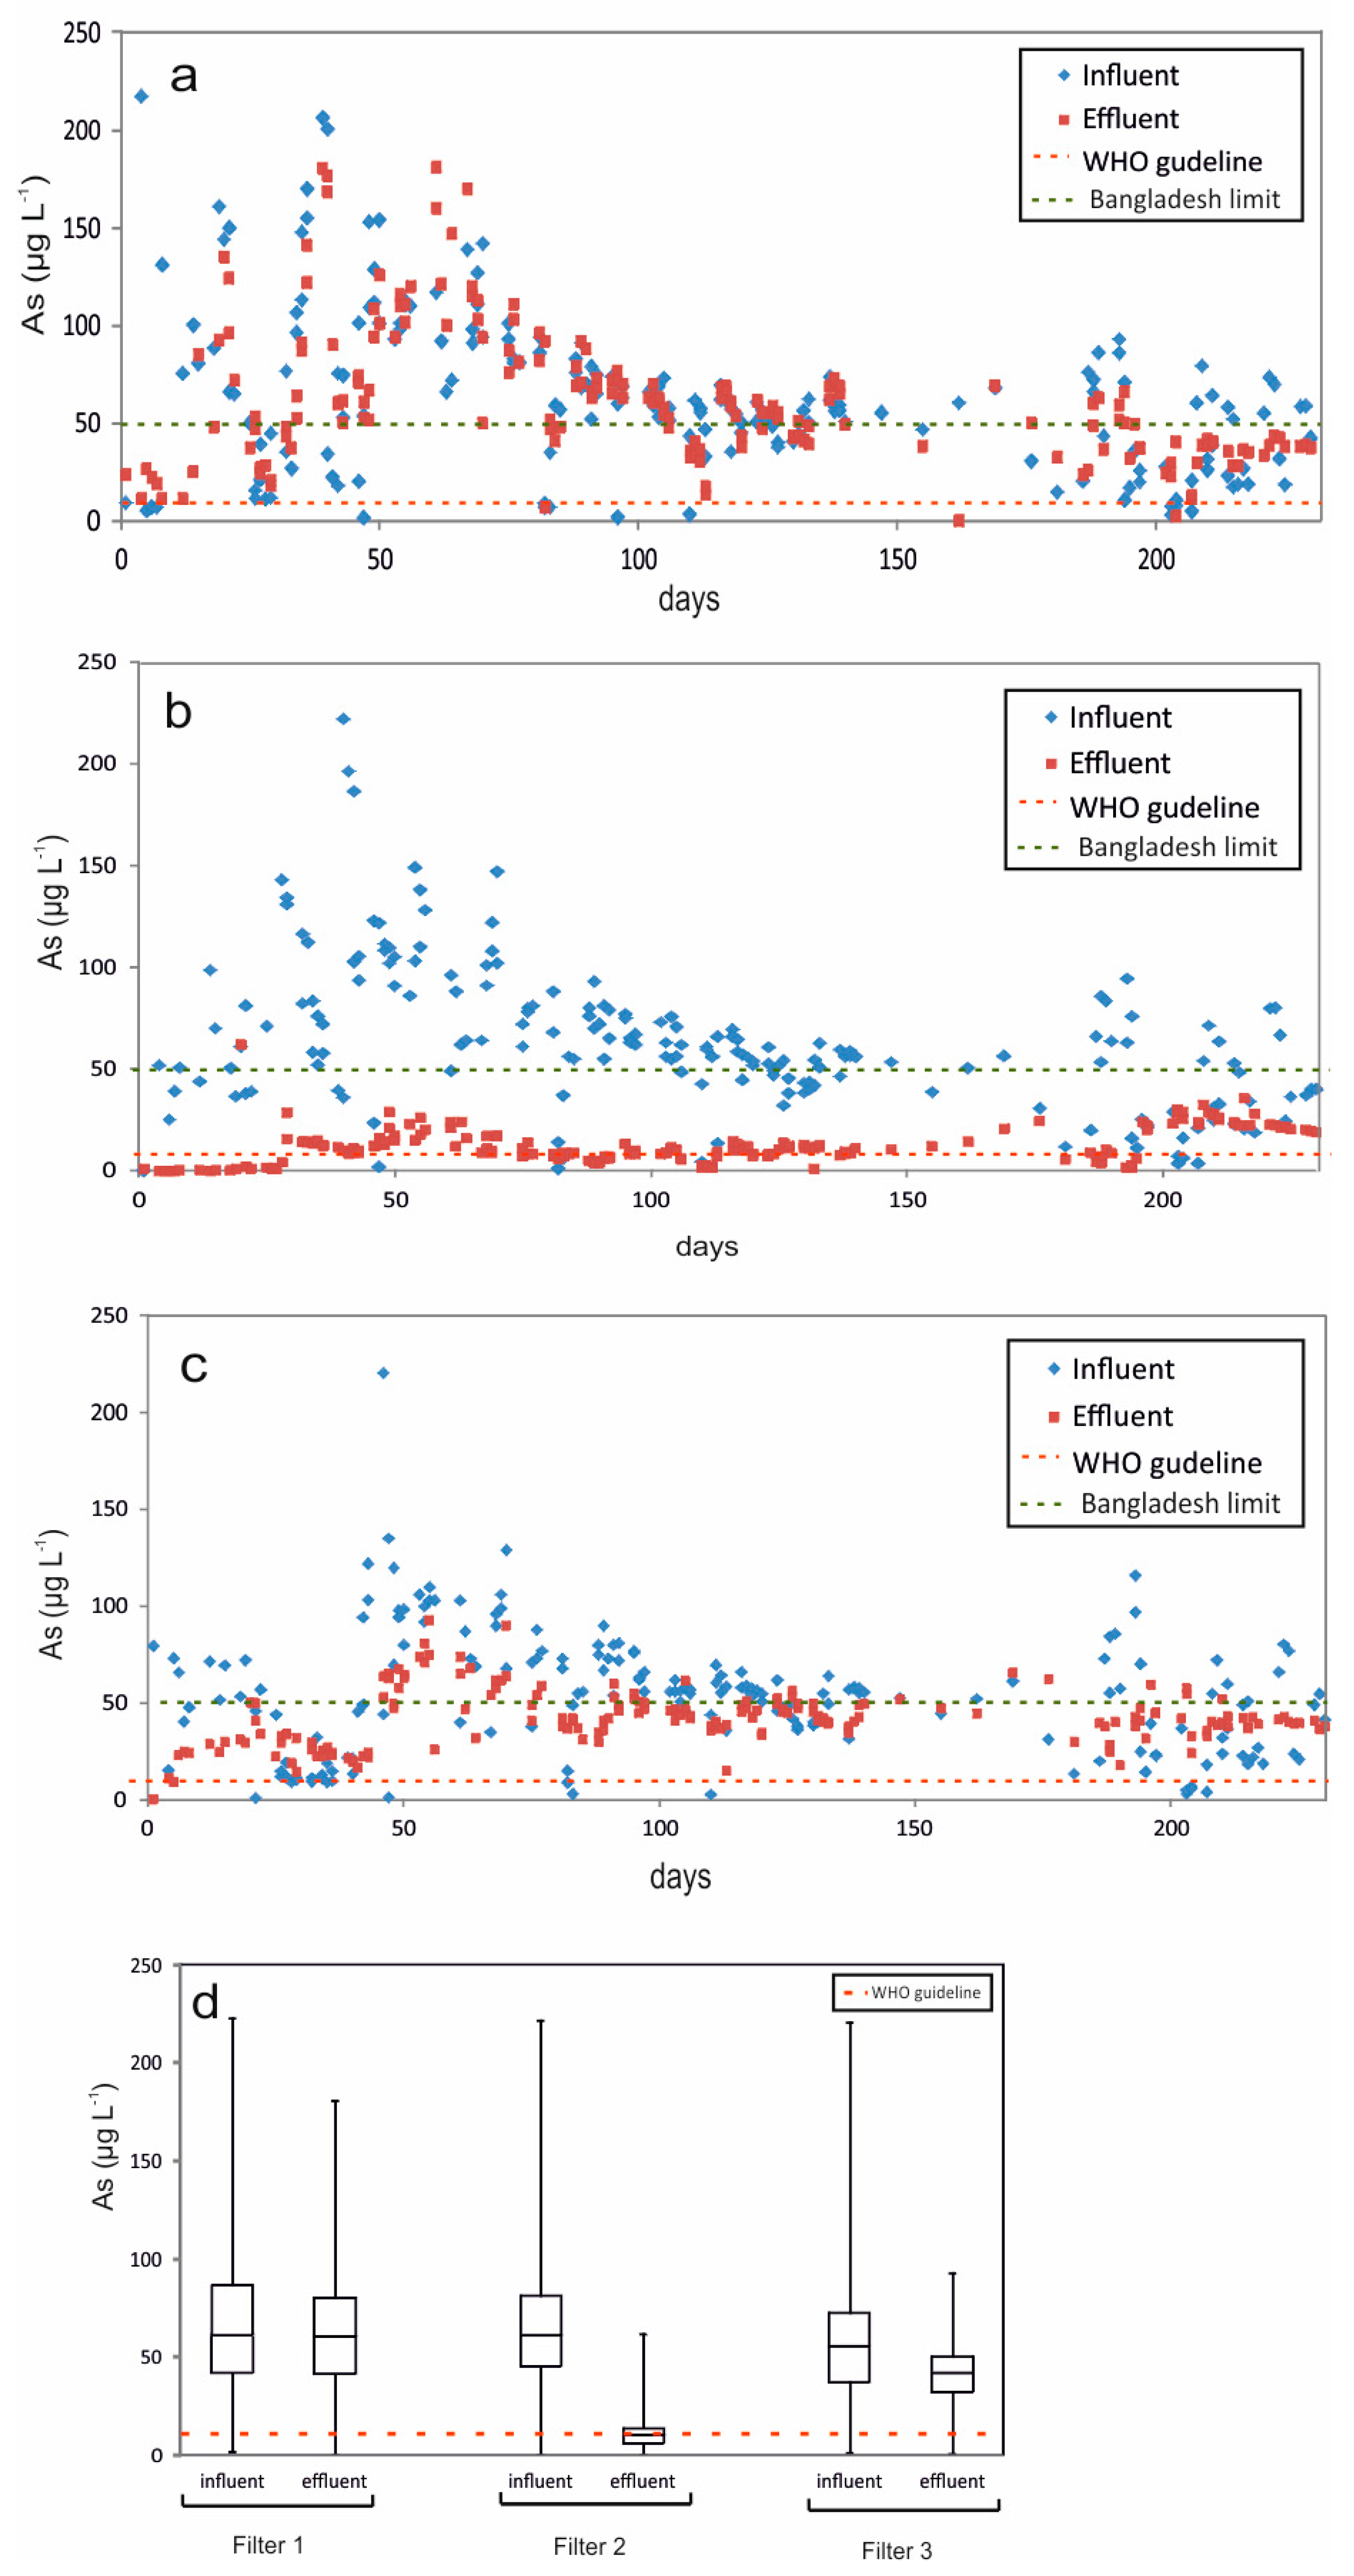
- Filter 1
- (reference): On top of the 57 cm sand layer, an extra 25 cm sand layer (same specifications) was placed.
- Filter 2
- (CIM filter): On top of the 57 cm sand layer, a 25 cm layer containing CIM mixed with sand was placed. The CIM and sand layer was prepared as follows: 600 g of washed and dried CIM in the form of iron fillings from a metal sawing machine (diameter 0.3–1.25 mm) was mixed with 12 L dry sand. The resulting CIM/sand ratio in this layer was thus 50 g·L−1.
- Filter 3
- (ICS filter): On top of the 57 cm sand layer, a 25 cm layer composed of iron-coated sand (4 L) mixed with sand (8 L, same specifications as the intermediate layer). The iron-coated sand had a diameter range of 0.5–5 mm and average iron content of 40 g·L−1 i.e., the total 160 g of iron was mixed into the specific media of Filter 3. The iron-coated sand was taken from a rapid sand-filtration (RSF) unit (Remon, type R700, Marum, The Netherlands) which is used in the lab for groundwater treatment.
2.3. Groundwater
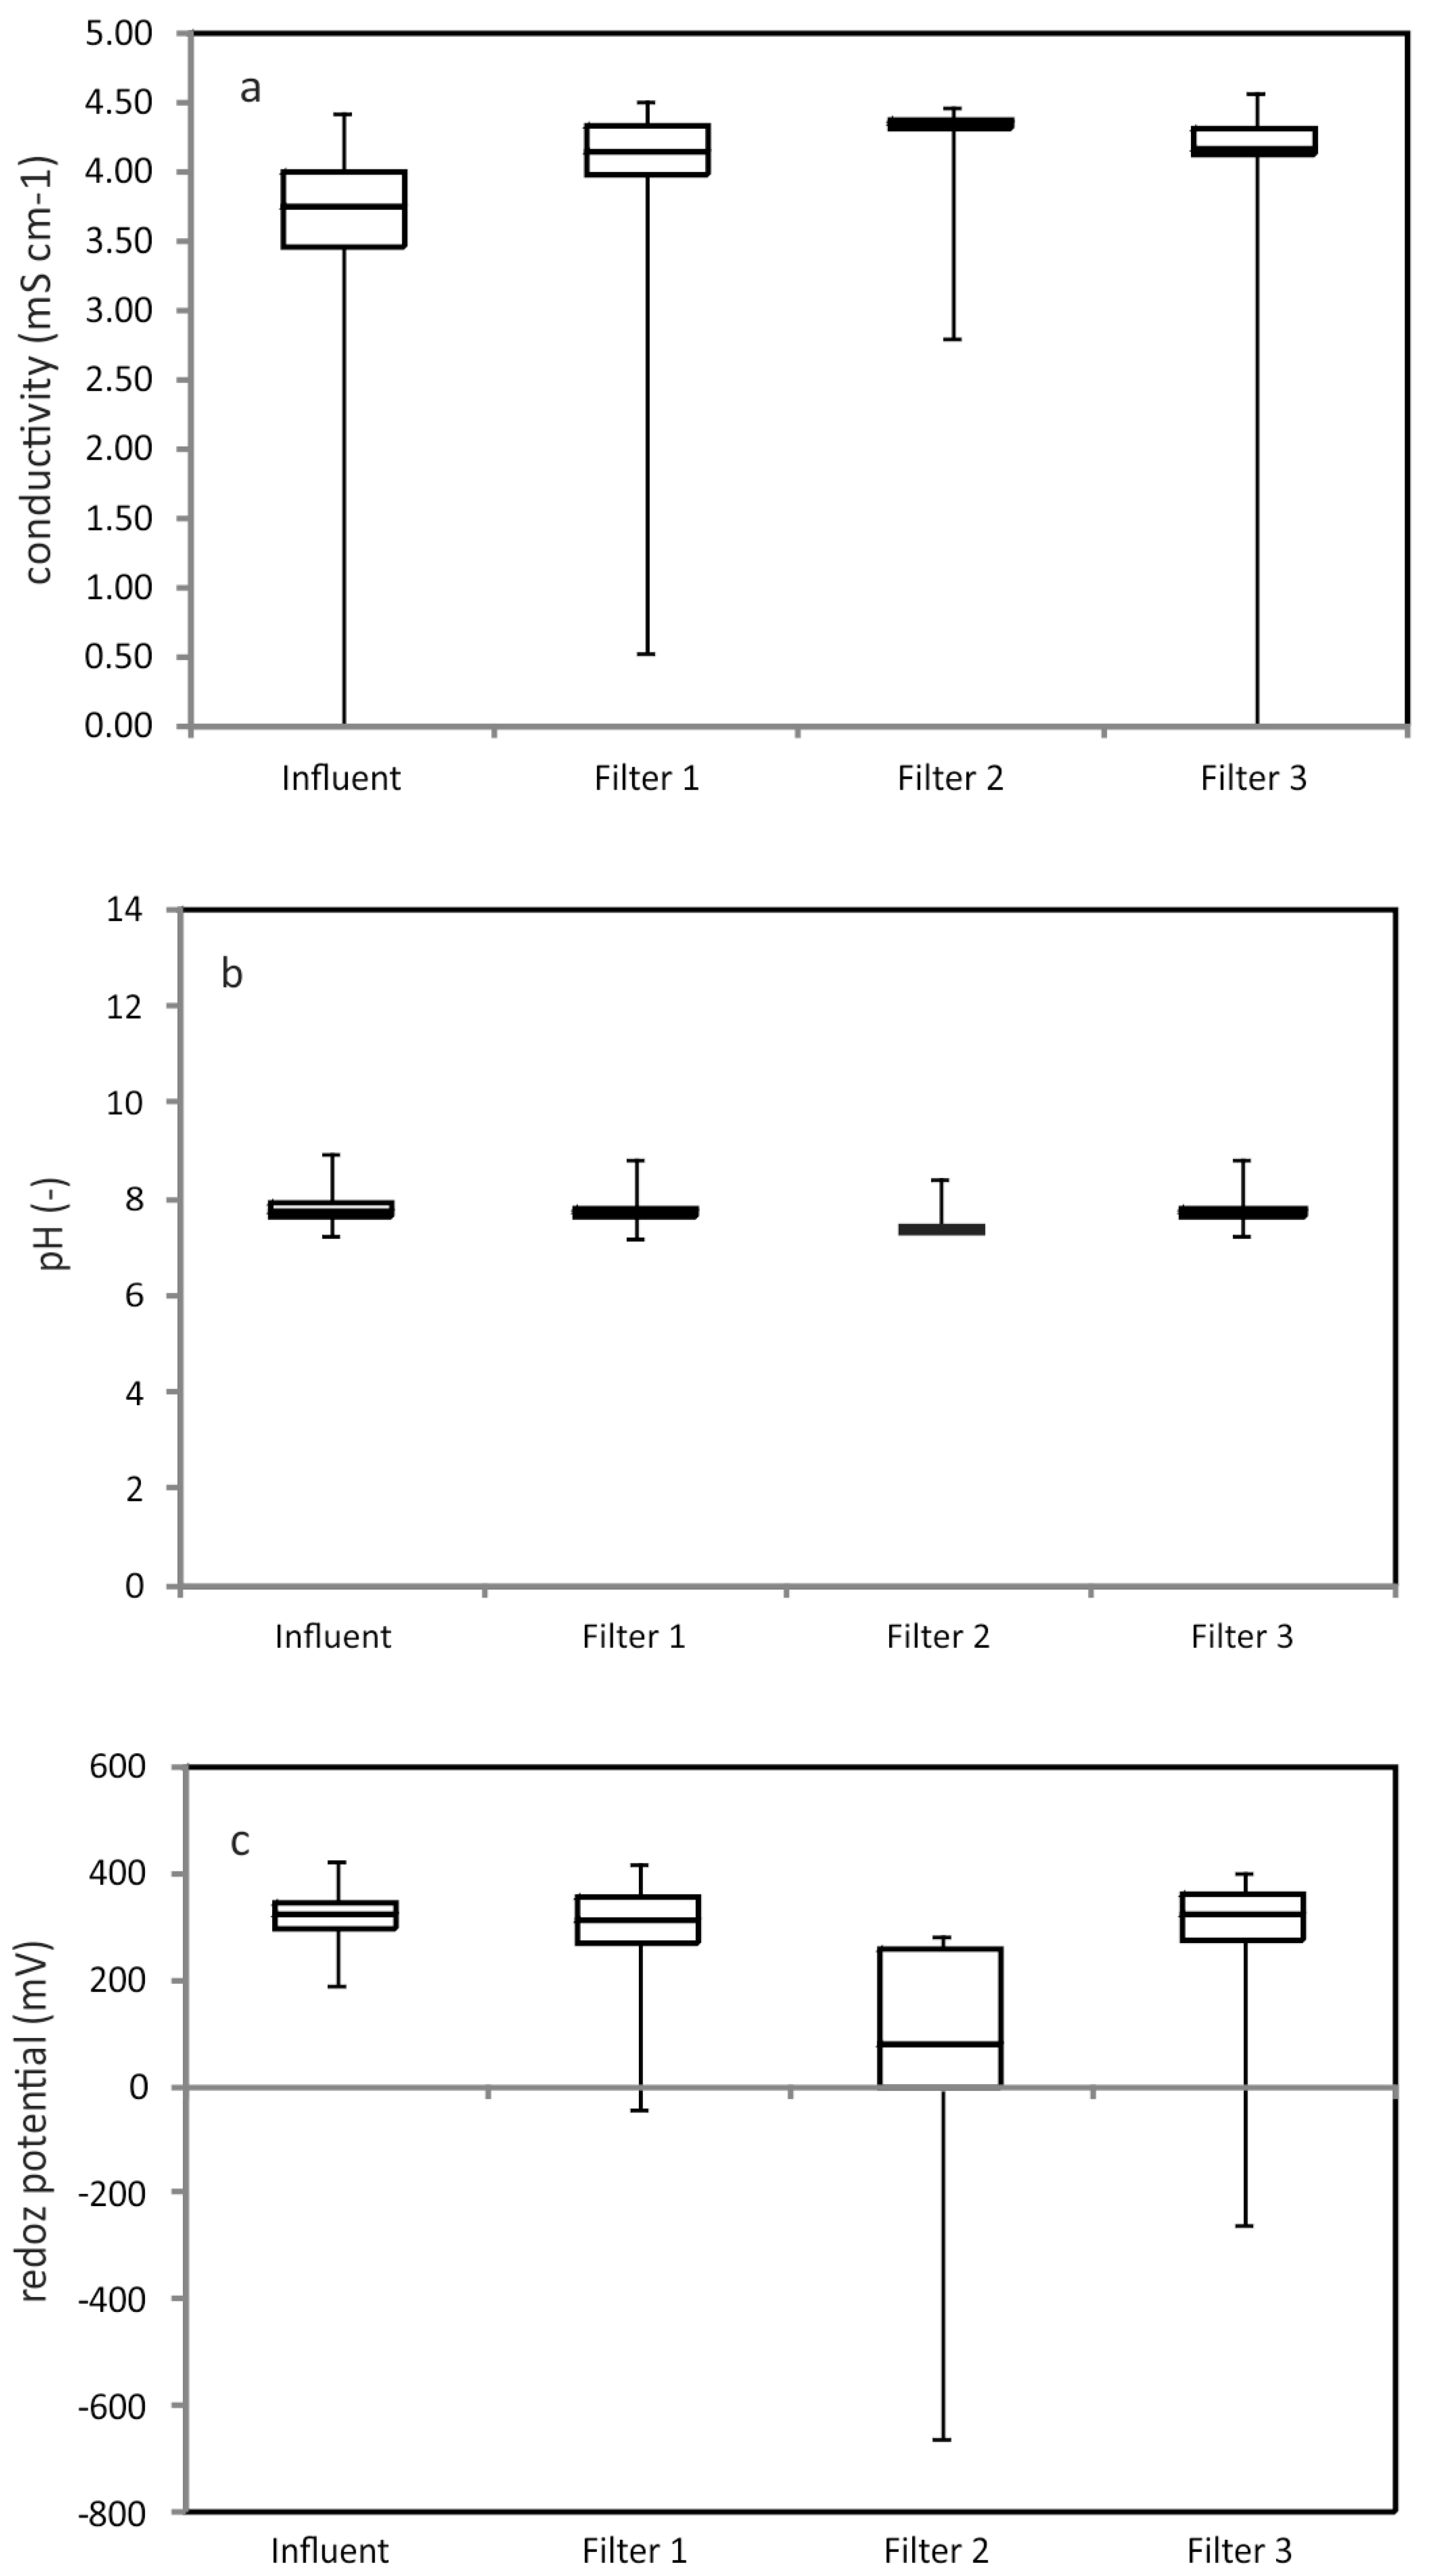
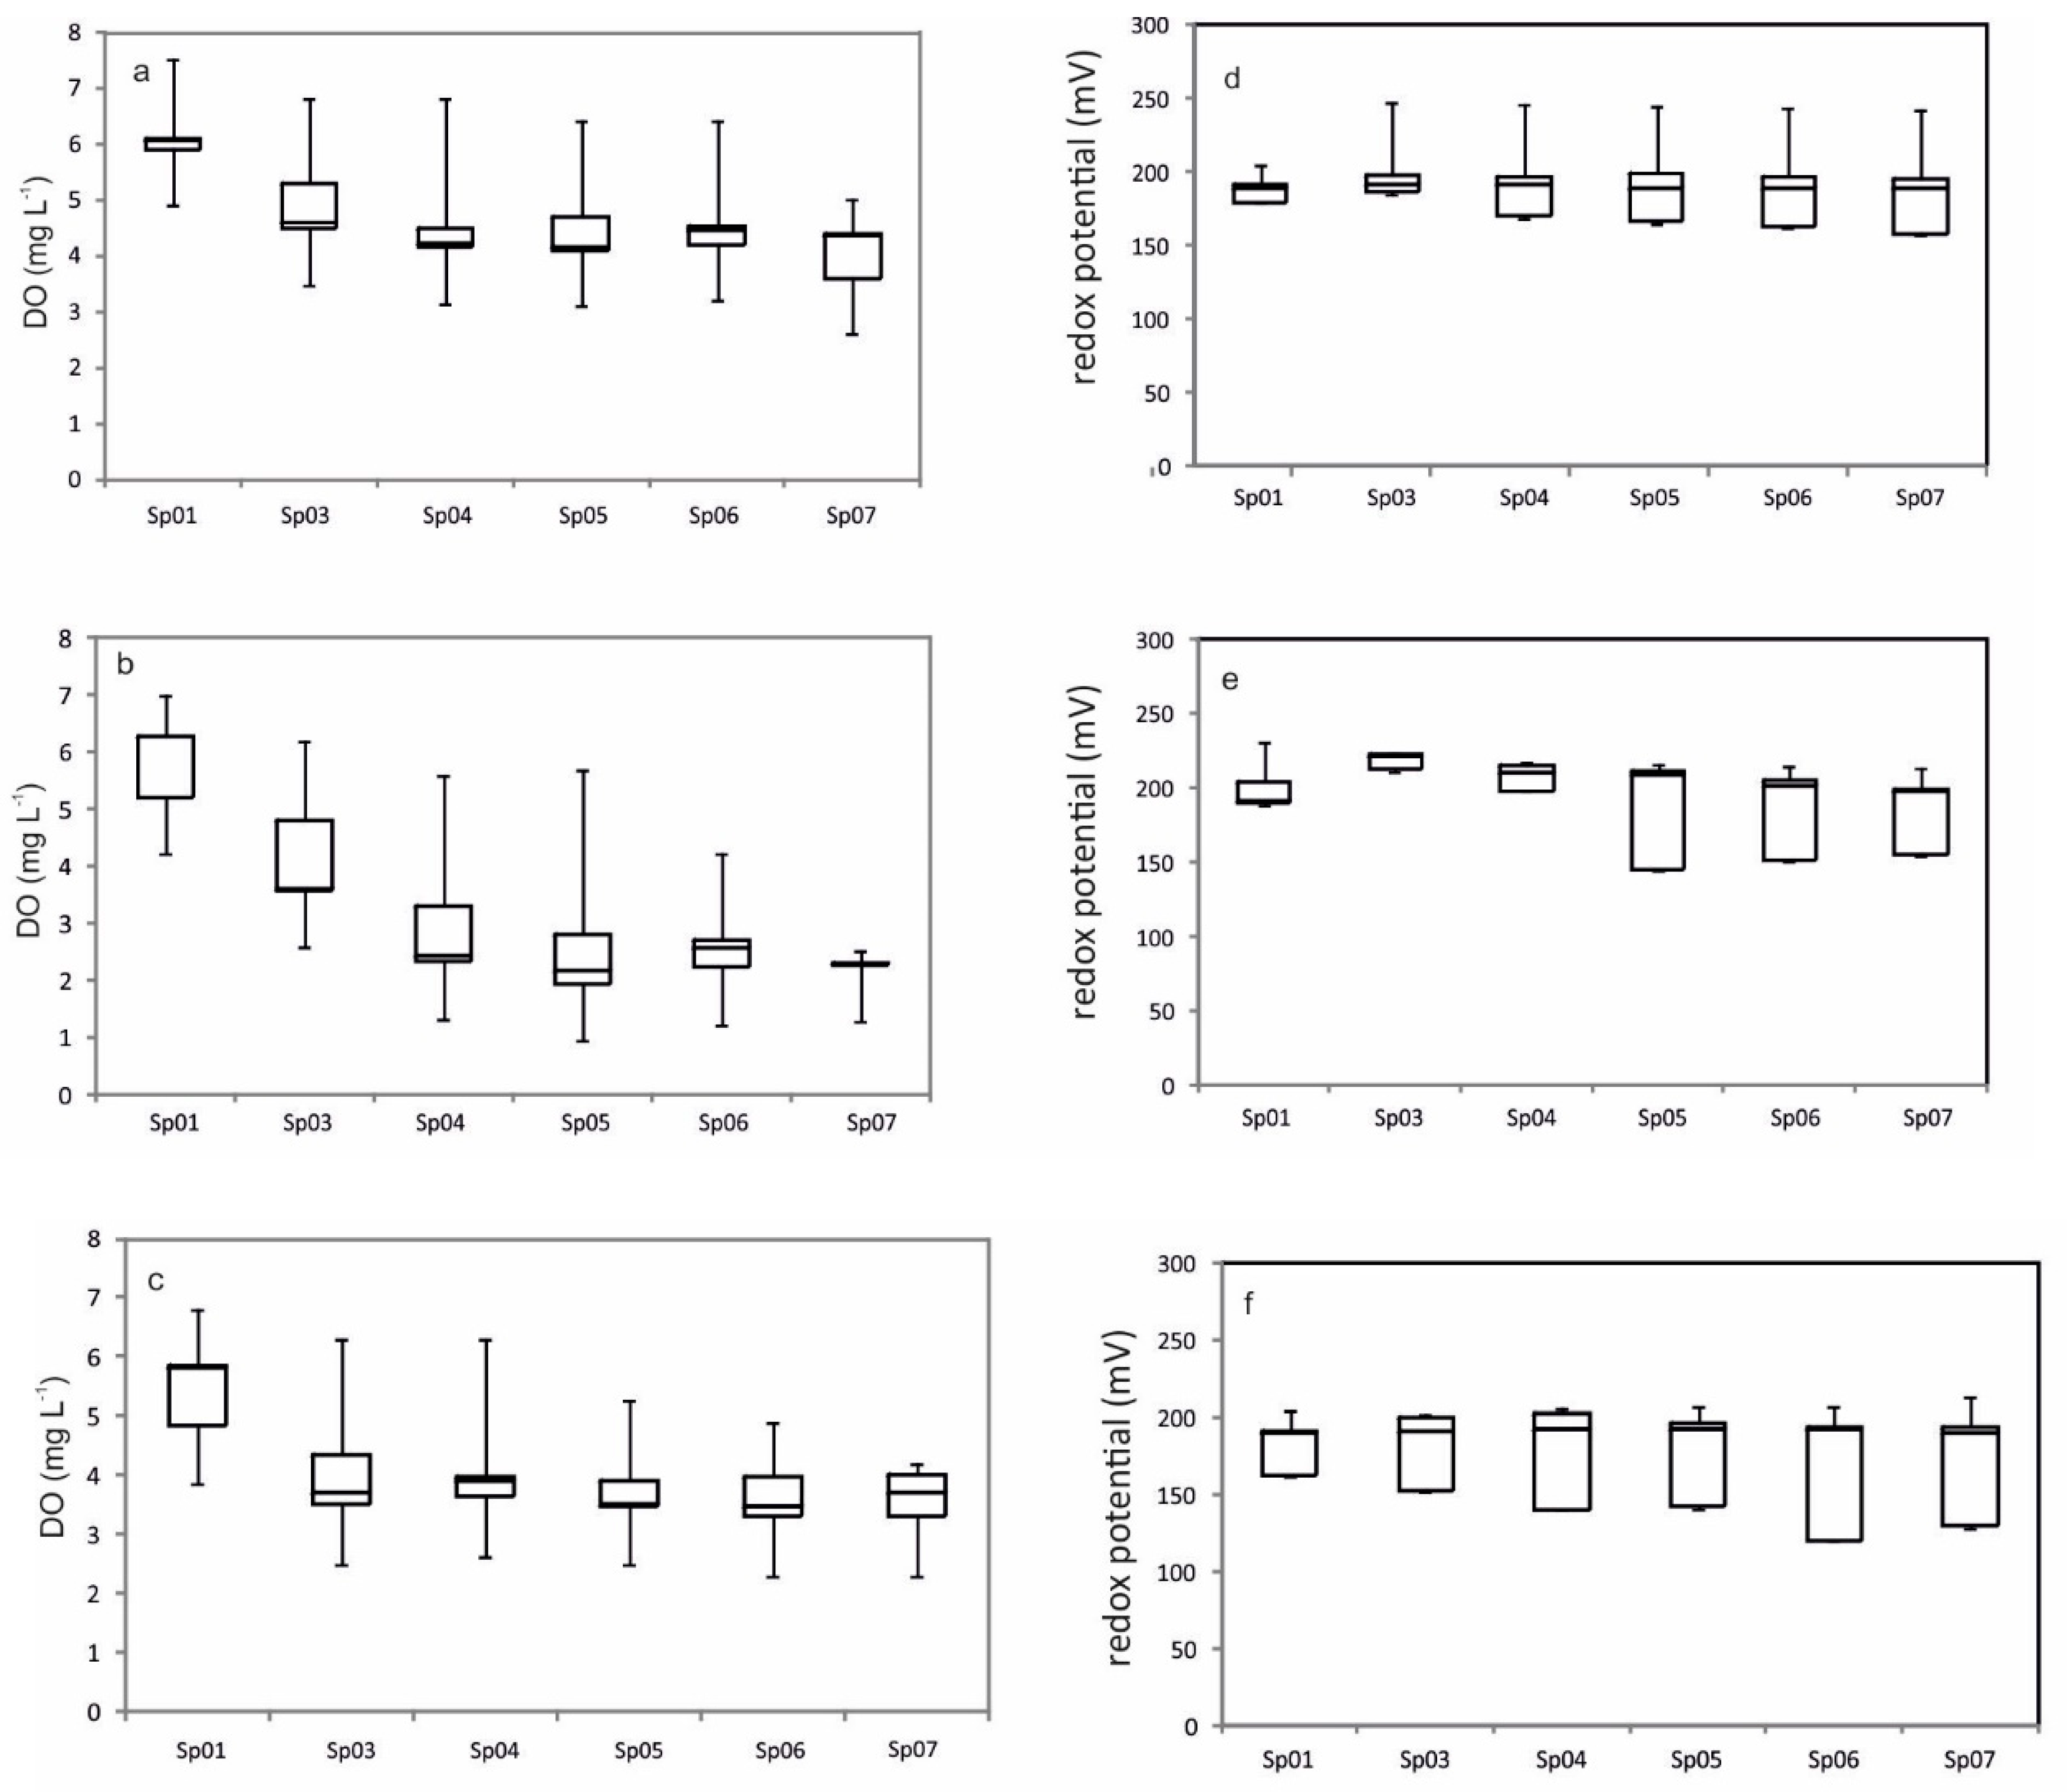
2.4. Physical–Chemical Analyses
2.5. Microbiological Analyses
2.6. Solid Vertical Profiles
3. Results and Discussion
3.1. Corrosive Iron Matter (CIM) Composition
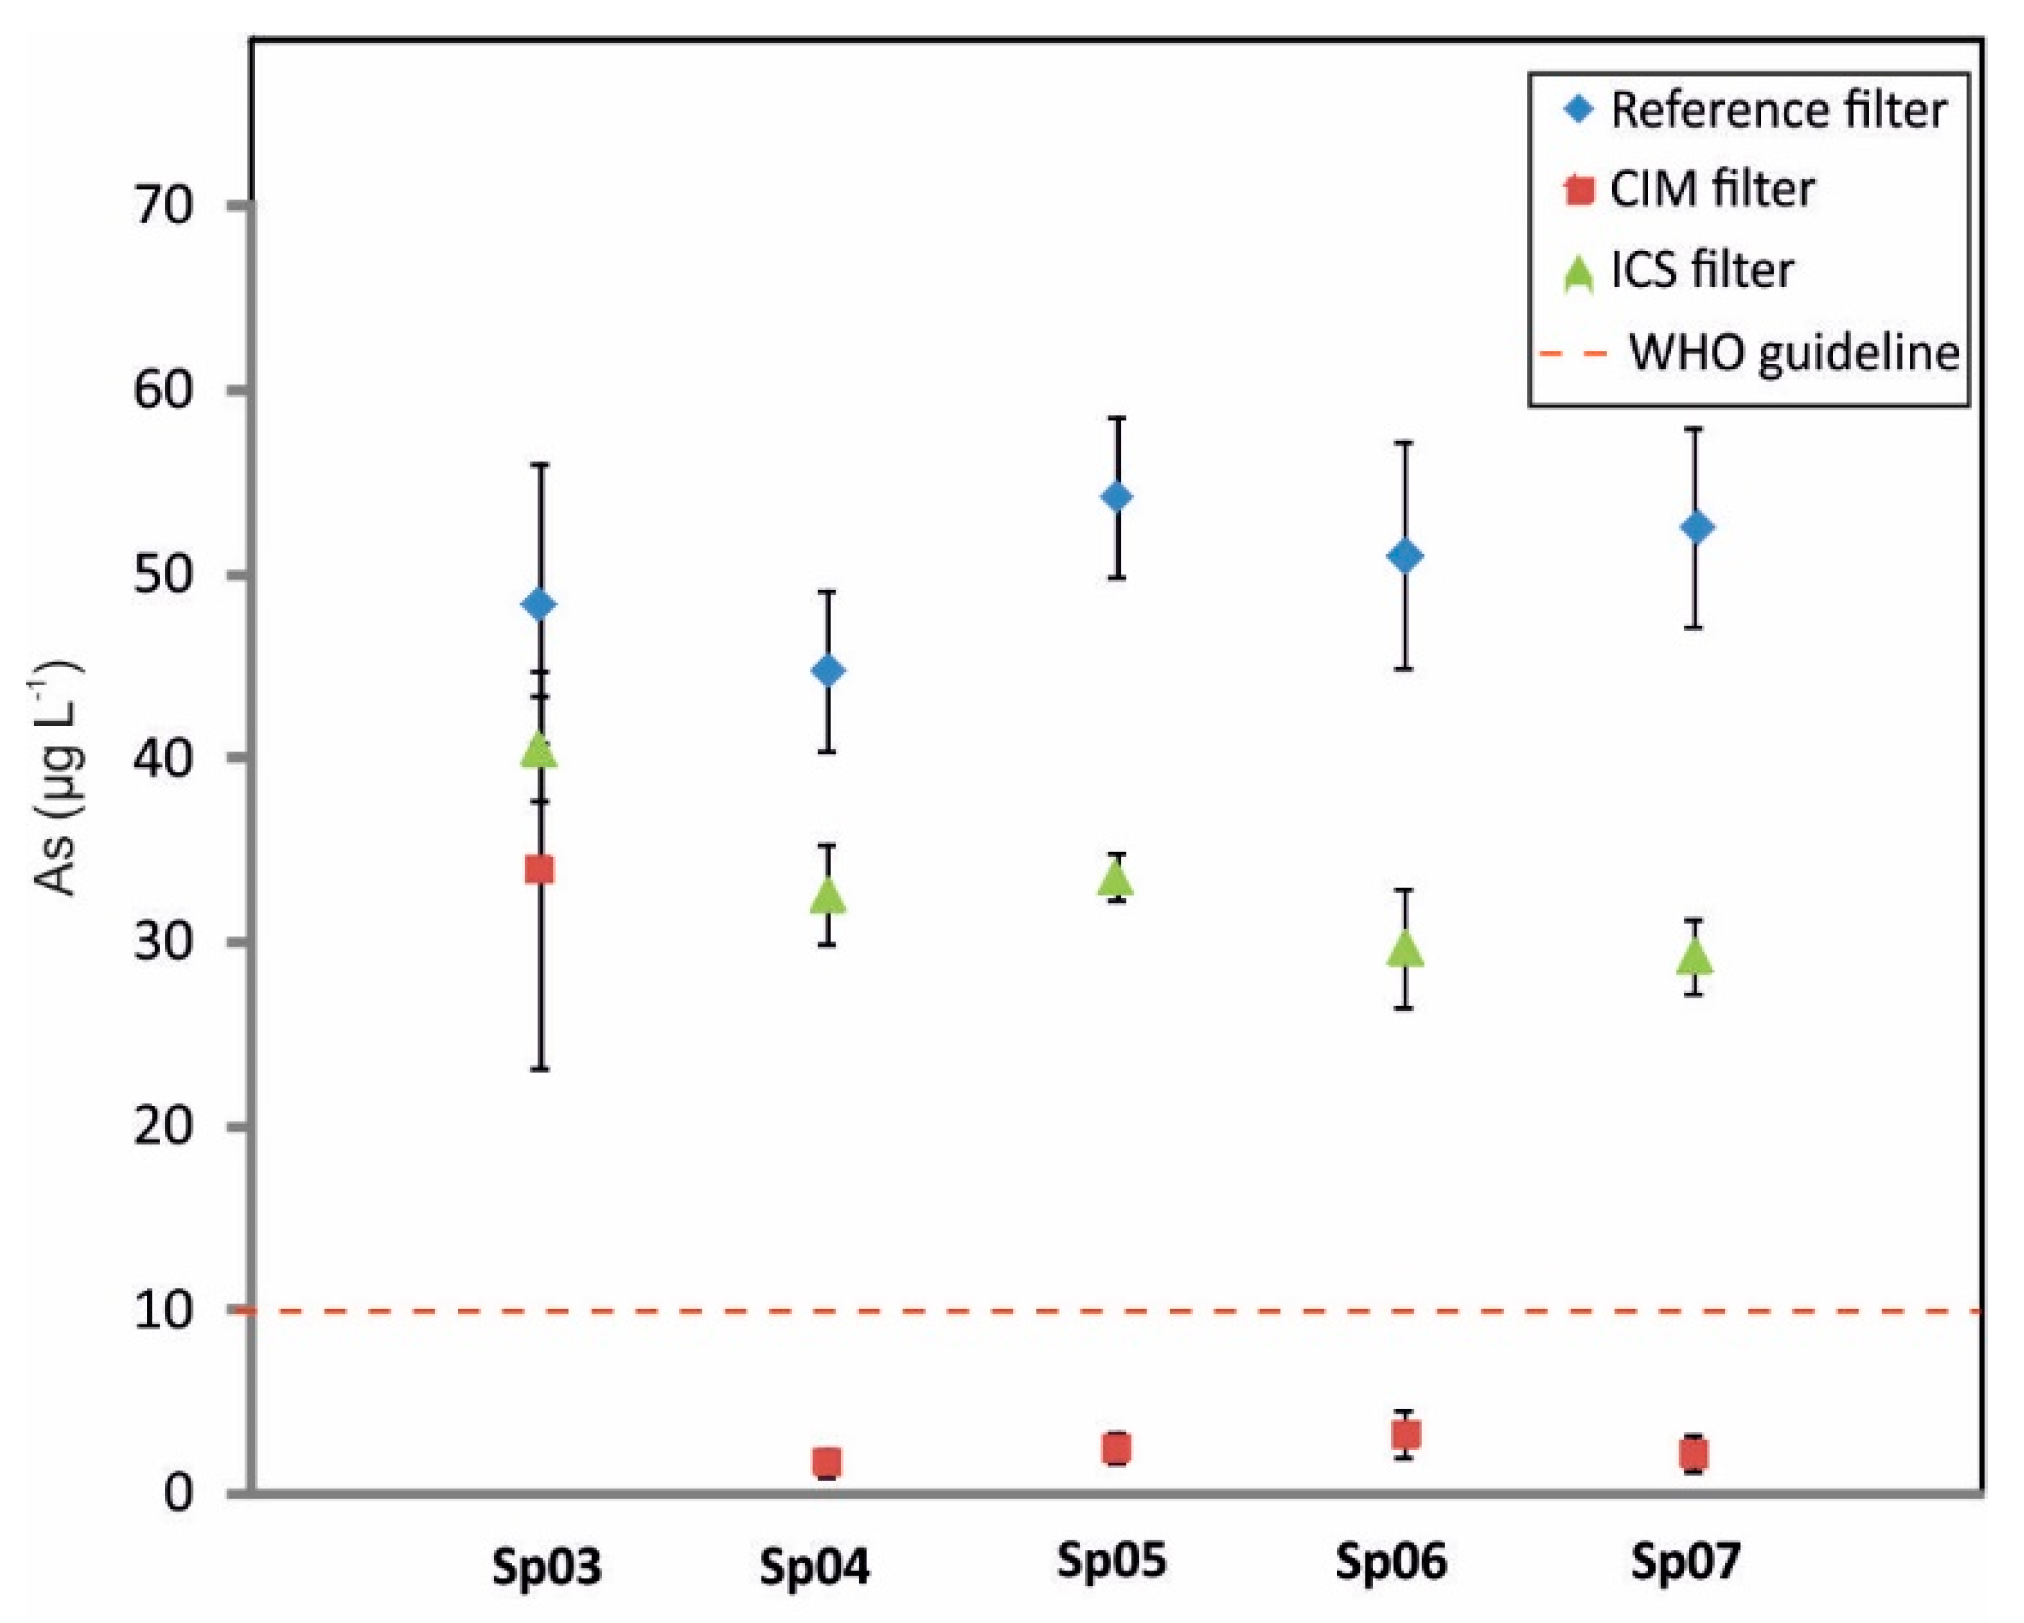
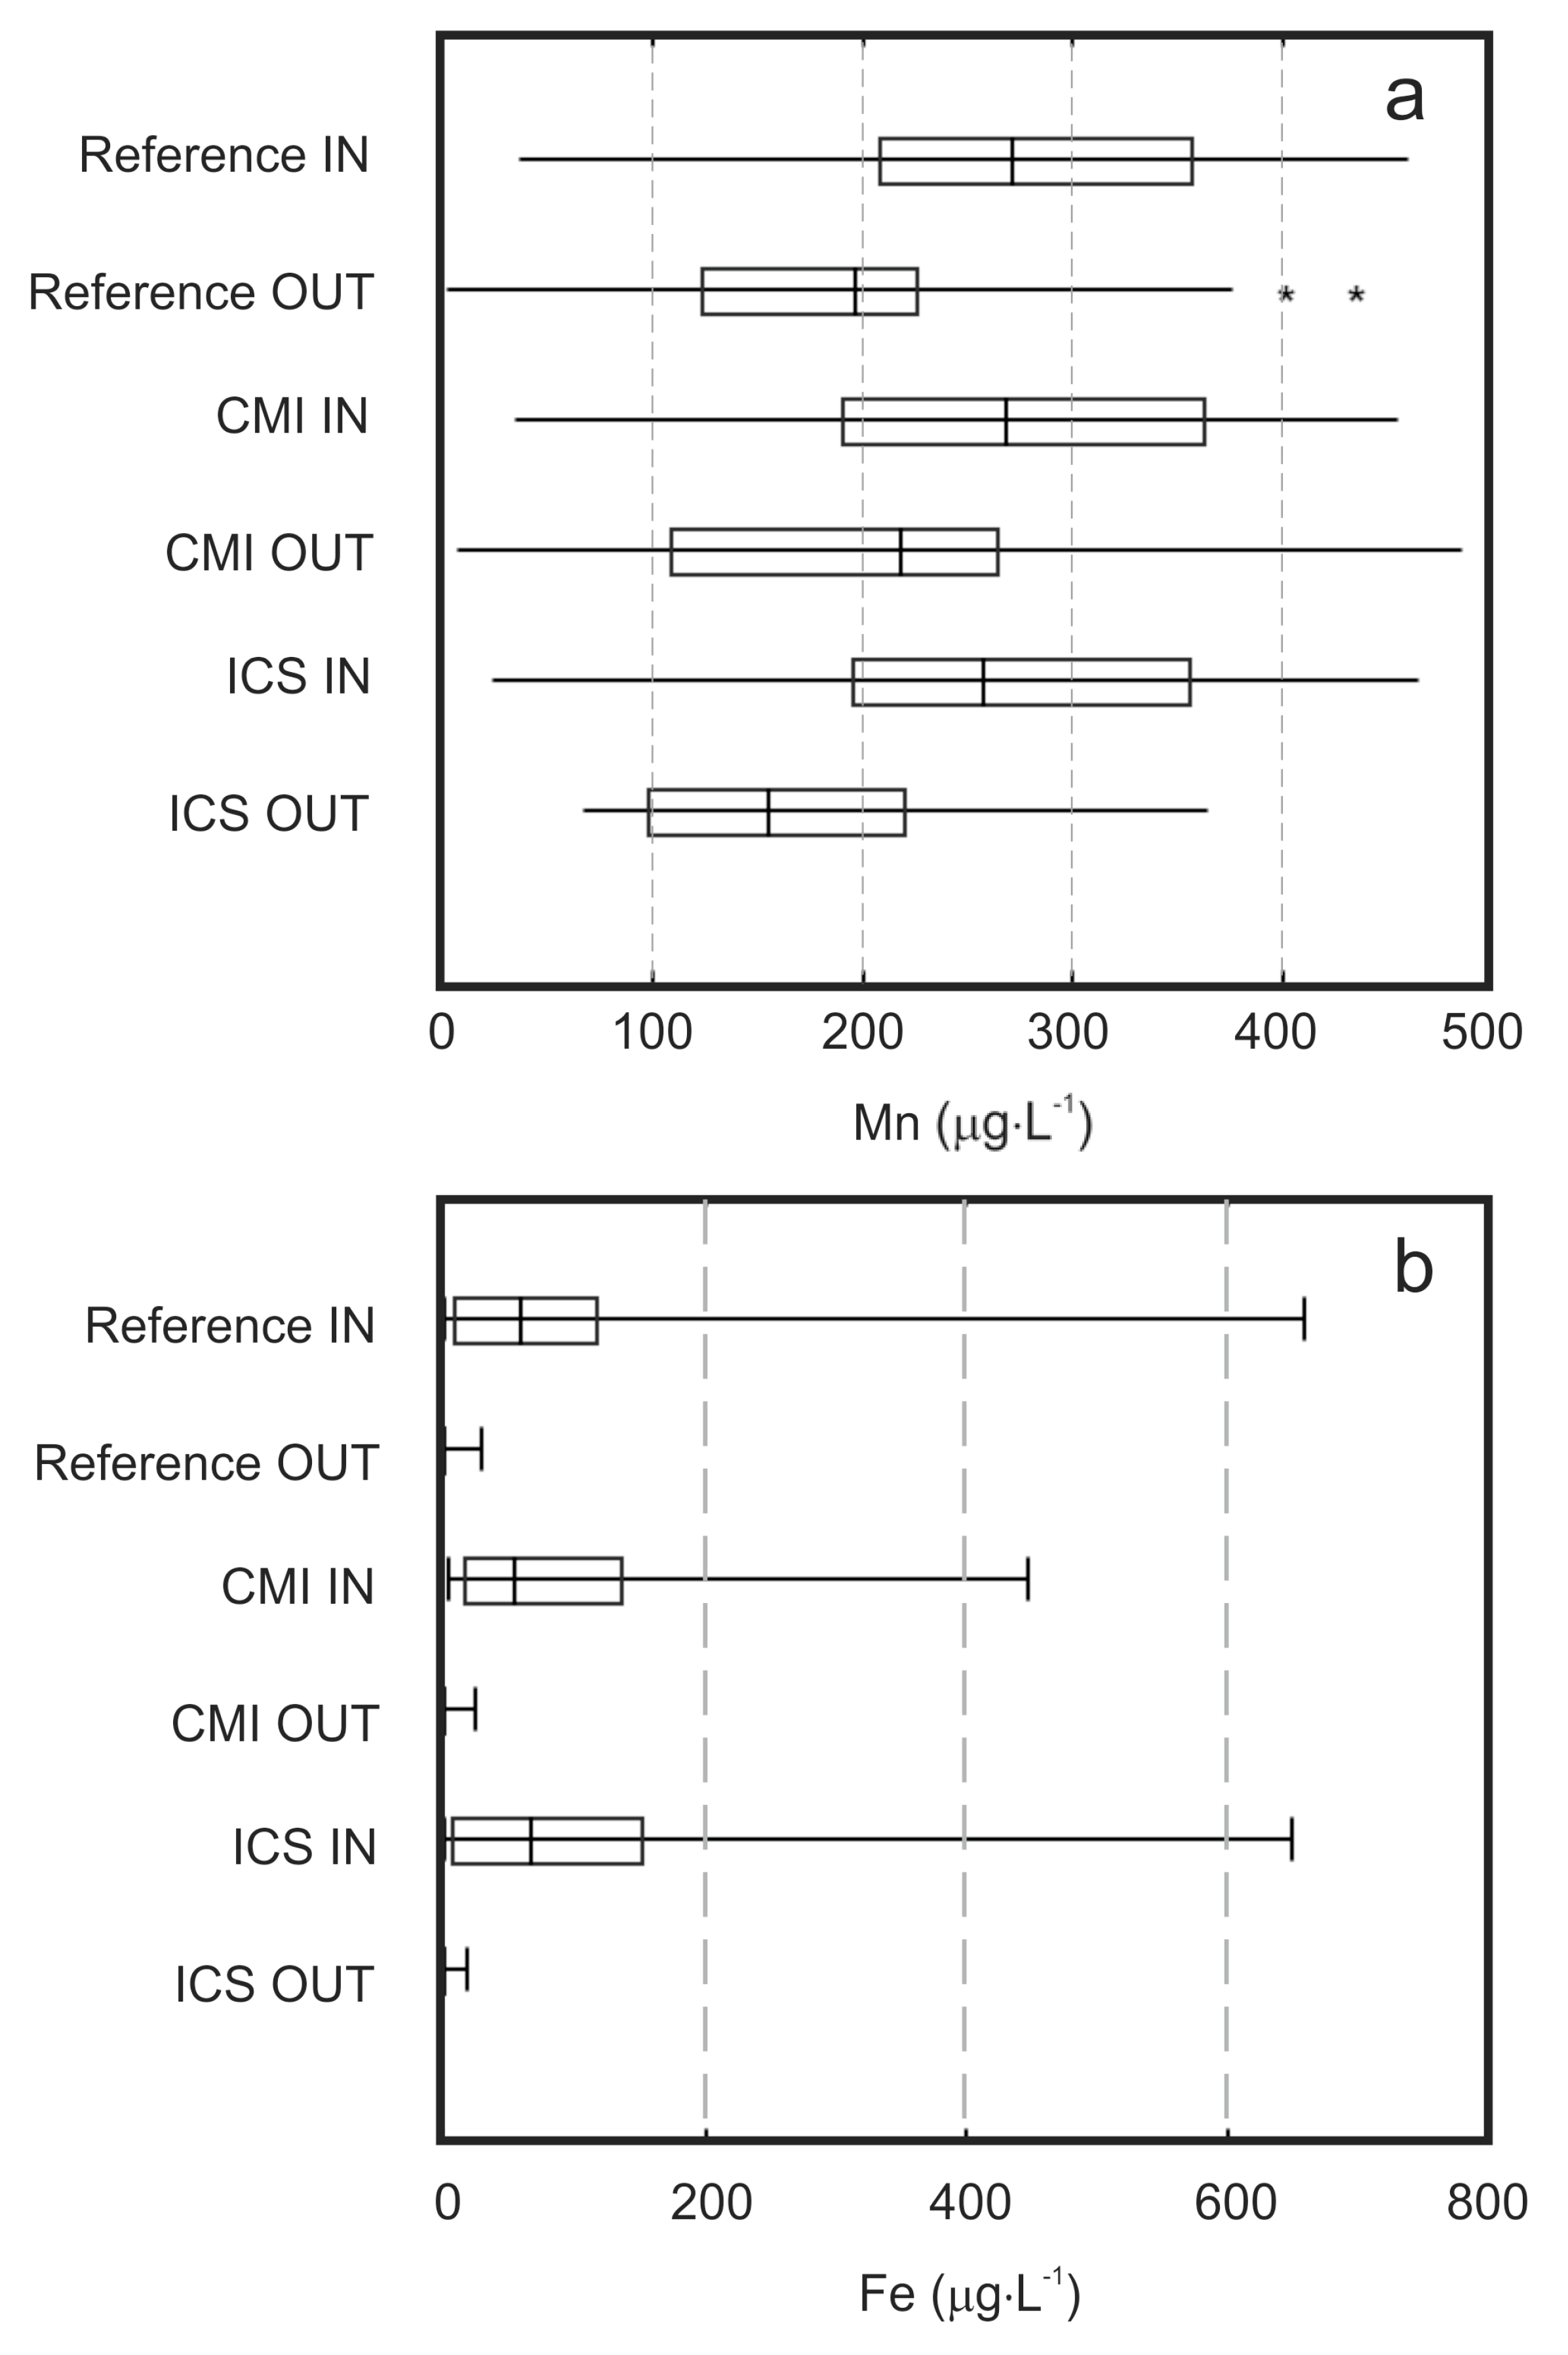
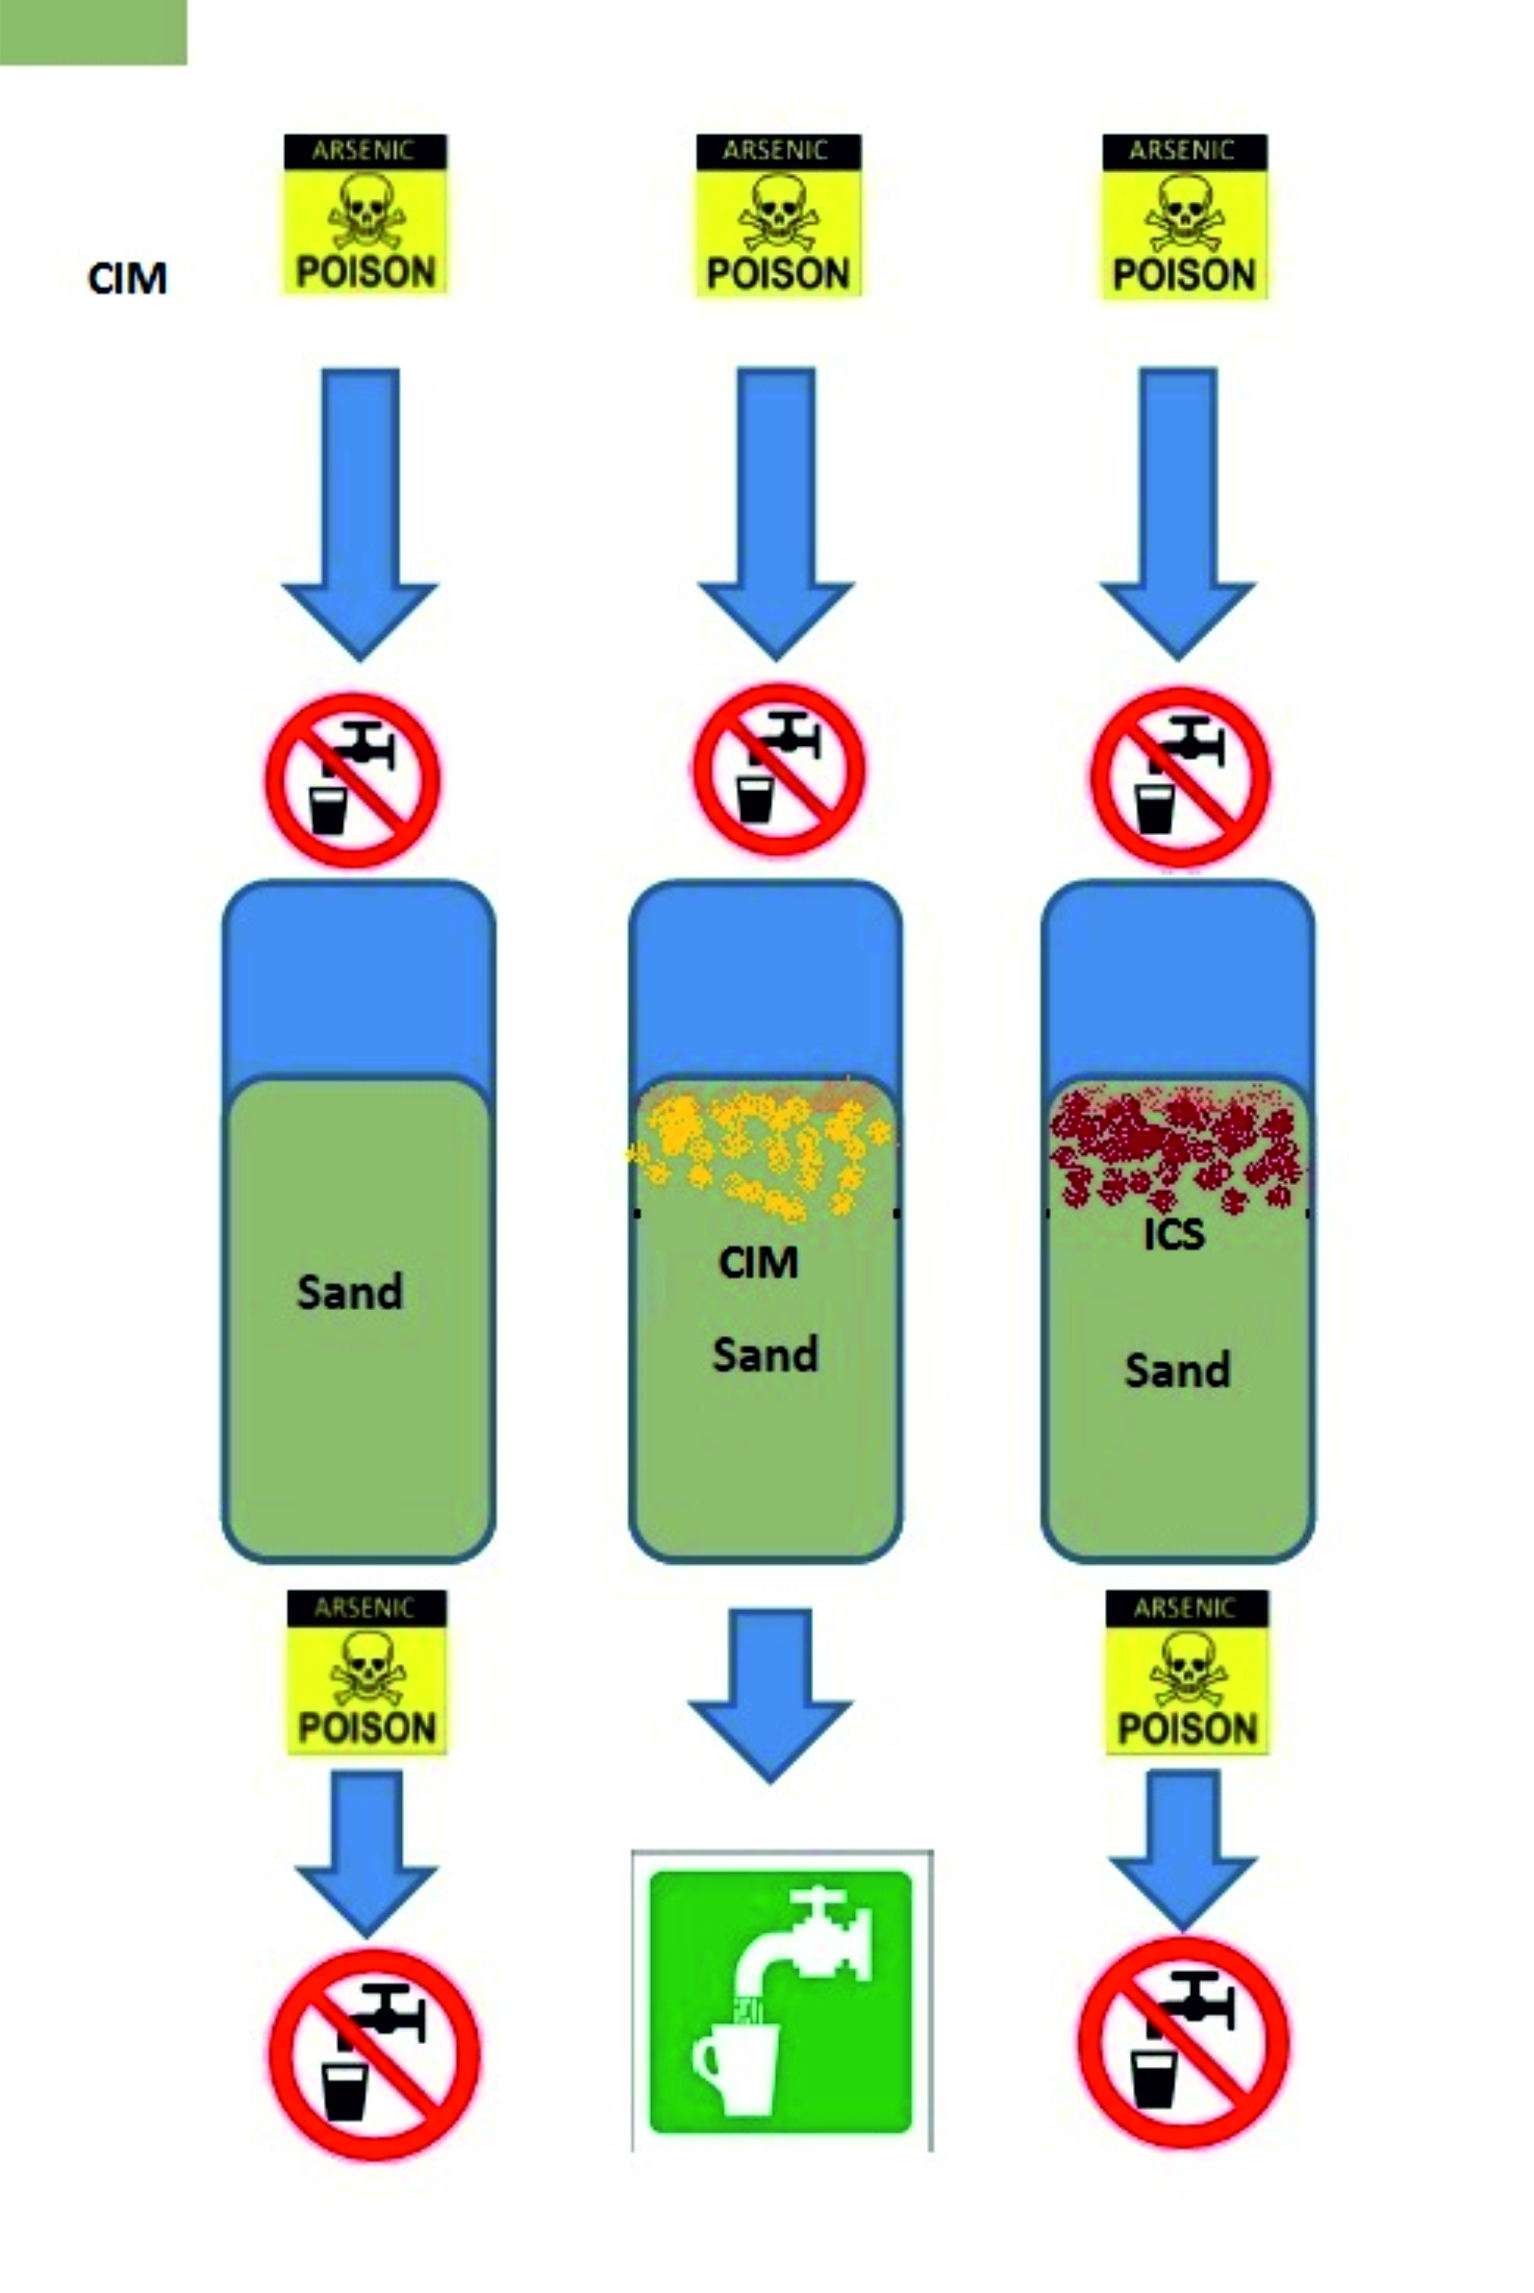
3.2. Biological Arsenic Removal
4. Conclusions
Acknowledgments
Author Contributions
Conflicts of Interest
References
- Chakraborti, D.; Rahman, M.M.; Das, B.; Murrill, M.; Dey, S.; Chandra Mukherjee, S.; Dhar, R.K.; Biswas, B.K.; Chowdhury, U.K.; Roy, S.; et al. Status of groundwater arsenic contamination in Bangladesh: A 14-year study report. Water Res. 2010, 44, 5789–5802. [Google Scholar] [CrossRef] [PubMed]
- Chakraborti, D.; Rahman, M.M.; Mukherjee, A.; Alauddin, M.; Hassan, M.; Dutta, R.N.; Pati, S.; Mukherjee, S.C.; Roy, S.; Quamruzzman, Q.; et al. Groundwater arsenic contamination in Bangladesh—21 Years of research. J. Trace Elem. Med. Biol. 2015, 31, 237–248. [Google Scholar] [CrossRef] [PubMed]
- Shakoor, M.B.; Niazi, N.K.; Bibi, I.; Rahman, M.M.; Naidu, R.; Dong, Z.; Shahid, M.; Arshad, M. Unravelling health risk and speciation of arsenic from groundwater in rural areas of Punjab, Pakistan. Int. J. Environ. Res. Public Health 2015, 12, 12371–12390. [Google Scholar] [CrossRef] [PubMed]
- Shahid, M.; Khalid, M.; Dumat, C.; Khalid, S.; Niazi, N.K.; Imran, M.; Bibi, I.; Ahmad, I.; Hammad, H.M.; Tabassum, R.A. Arsenic level and risk assessment of groundwater in vehari, Punjab Province, Pakistan. Expo. Health 2017. [Google Scholar] [CrossRef]
- World Health Organization (WHO). Guidelines for Drinking Water Quality, 4th ed.; WHO Press: Geneva, Switzerland, 2011; ISBN 9789241548151. [Google Scholar]
- Shakoor, M.B.; Niazi, N.K.; Bibi, I.; Murtaza, G.; Kunhikrishnan, A.; Seshadri, B.; Shahid, M.; Ali, S.; Bolan, N.S.; Ok, Y.S.; et al. Remediation of arsenic-contaminated water using agricultural wastes as biosorbents. Crit. Rev. Environ. Sci. Technol. 2016, 46, 467–499. [Google Scholar] [CrossRef]
- Dhar, R.K.; Biswas, B.K.; Samanta, G.; Mandal, B.K.; Chakraborti, D.; Roy, S.; Jafar, A.; Islam, A.; Ara, G.; Kabir, S.; et al. Groundwater arsenic calamity in Bangladesh. Curr. Sci. 1997, 73, 48–59. [Google Scholar]
- Smith, A.H.; Lingas, E.O.; Rahman, M. Contamination of drinking-water by arsenic in Bangladesh: A public health emergency. Bull. World Health Organ. 2000, 78, 1093–1103. [Google Scholar] [PubMed]
- EPA-Washington, DC, US. Office of Water. Technologies and Costs for Removal of Arsenic from Drinking Water; US Environmental Protection Agency: Washington, DC, USA, 2000.
- Ng, K.-S.; Ujang, Z.; Le-Clech, P. Arsenic removal technologies for drinking water treatment. Rev. Environ. Sci. Biol. 2004, 3, 43–53. [Google Scholar] [CrossRef]
- Delowar, H.K.M.; Uddin, I.; Hassan, W.H.A.; Perveen, M.F.; Irshad, M.; Islam, A.F.M.S.; Yoshida, I. A compararive study of household groundwater arsenic removal technologies and their water quality parameters. J Appl. Sci. 2006, 6, 2193–2200. [Google Scholar]
- Sutter, A.; Hug, S. Simple Filters for Arsenic Removal in Developing Countries; ETH Zurich: Zürich, Switzerland, 2009. [Google Scholar]
- Neumann, A.; Kaegi, R.; Voegelin, A.; Hussam, A.; Munir, A.K.M.; Hug, S.J. Arsenic removal with composite iron matrix filters in Bangladesh: A field and laboratory study. Environ. Sci. Technol. 2013, 47, 4544–4554. [Google Scholar] [CrossRef] [PubMed]
- Ngai, T.K.K.; Murcott, S.; Shrestha, R.R.; Dangol, B.E.; Maharjan, M. Development and dissemination of KanchanTM Arsenic Filter in rural Nepal. Water Supply 2006, 6, 137–146. [Google Scholar] [CrossRef]
- Tabbal, G. Technical and Social Evaluation of Three Arsenic Removal Technologies in Nepal. Master’s Thesis, Massachussets Institute of Technology, Cambridge, MA, USA, 2003. [Google Scholar]
- Munir, A.K.M.; Rasul, S.B.; Habibuddowla, M.; Alauddin, M.; Hussam, A.; Khan, A.H. Evaluation of performance of Sono 3-kolshi filter for arsenic removal from groundwater using zero valent iron through laboratory and field studies. In Proceedings of the International Workshop on Technologies for Arsenic Removal From Drinking Water, Tokyo, Japan, 5–7 May 2001; pp. 171–189. [Google Scholar]
- Pokhrel, D.; Viraraghavan, T. Biological filtration for removal of arsenic from drinking water. J. Environ. Manag. 2009, 90, 1956–1961. [Google Scholar] [CrossRef] [PubMed]
- Manning, B.A.; Hunt, M.L.; Amrhein, C.; Yarmoff, J.A. Arsenic(III) and arsenic(V) reactions with zerovalent iron corrosion products. Environ. Sci. Technol. 2002, 36, 5455–5461. [Google Scholar] [CrossRef] [PubMed]
- Kingma, K.J.; Hemley, R.J. Raman spectroscopic study of microcrystalline silica. Am. Miner. 1994, 79, 269–273. [Google Scholar]
- De Faria, D.L.A.; Venancio Silva, S.; de Oliveira, M.T. Raman microspectroscopy of some iron oxides and oxyhydroxides. J. Raman Spectrosc. 1997, 28, 873–878. [Google Scholar] [CrossRef]
- Larroumet, D.; Greenfield, D.; Akid, R.; Yarwood, J. Raman spectrosopic studies of the corrosoin of model iron electrodes in sodium chloride solution. J. Raman Spectrosc. 2007, 38, 1577–1585. [Google Scholar] [CrossRef]
- Schwertmann, U. Solubility and dissolution of iron oxides. Plant Soil 1991, 130, 1–25. [Google Scholar] [CrossRef]
- Cornell, R.M.; Schwertmann, U. The Iron Oxides, Structure, Properties, Reactions and Uses, 2nd ed.; Wiley-VCH: Weinheim, Germany, 2003; pp. 221–236. [Google Scholar]
- Jain, A.; Raven, K.P.; Loeppert, R.H. Arsenite and arsenate adsorption on ferrihydrite: Surface charge reduction and net OH- release stochiometry. Environ. Sci. Technol. 1999, 13, 1179–1184. [Google Scholar] [CrossRef]
- Jessen, S.; Larsen, F.; Koch, C.B.; Arvin, E. Sorption and desorption of arsenic to ferrihydrite in a sand filter. Environ. Sci. Technol. 2005, 39, 8045–8051. [Google Scholar] [CrossRef] [PubMed]
- Ona-Nguema, G.; Morin, G.; Juillot, F.; Calas, G.; Brown, G.E., Jr. EXAFS analysis of arsenite adsorption onto two-line ferrihydrite, hematite, geothite, and lepidocrocite. Environ. Sci. Technol. 2005, 39, 9147–9155. [Google Scholar] [CrossRef] [PubMed]
- Appelo, A.J.; Van der Weijden, J.J.; Tournassat, C.; Charlet, L. Surface complexation of ferrous iron and carbonate on ferrrihydrite and the mobilization of arsenic. Environ. Sci. Technol. 2002, 36, 3096–3103. [Google Scholar] [CrossRef] [PubMed]
- Su, C.; Puls, R.W. Arsenate and arsenite removal by zerovalent iron: Silicate, carbonate, borate, sulfate, chromate, molybdate and nitrate relative to chloride. Environ. Sci. Technol. 2001, 35, 4562–4568. [Google Scholar] [CrossRef] [PubMed]
- Jain, A.; Loeppert, R.H. Effect of competing anions on the adsorption of arsenite and arsenate by ferrihydrite. J. Environ. Qual. 1999, 29, 1179–1184. [Google Scholar] [CrossRef]
- Lehimas, G.F.D.; Chapman, J.I.; Bourgine, F.P. Arsenic removal from groundwater in conjunction with biological-iron removal. Water Environ. J. 2001, 15, 190–192. [Google Scholar] [CrossRef]


| Parameter | Measured Value | WHO Guideline for Drinking Water |
|---|---|---|
| Color | 50 mg Pt-Co∙L−1 | No guideline, desirable: 15 mg Pt-Co∙L−1 |
| Turbidity | 0.144 NTU | No guideline, desirable: <5 NTU |
| Conductivity | 4.39 mS∙cm-1 | 250 mS∙cm−1 |
| Redox potential | 345 mV | No guideline |
| pH | 7.31 | No guideline, desirable: 6.5–8.5 |
| Temperature | 14.3 °C | No guideline |
| Dissolved oxygen | 5.6 mg∙L−1 | No guideline |
| Sodium | 461 mg∙L−1 | 200 mg∙L−1 |
| Iron | 0.09 mg∙L−1 | No guideline, desirable: 0.3 mg∙L−1 |
| Manganese | 0.19 mg∙L−1 | 0.5 mg∙L−1 |
| Ammonium | 0.014 mg∙L−1 | No guideline |
| Nitrate | 1.8 mg∙L−1 | 50 mg∙L−1 |
| Phosphorus | 0.25 mg∙L−1 | No guideline |
| Microorganism Type | Unit | Detection Limit | Analysis Results |
|---|---|---|---|
| Sphaerotilus (group 1 and group 2) | N/sample | 4.0 × 10³ | 6.6 × 10³ |
| Gallionella ferruginea | N/sample | 4.0 × 10³ | n.d. |
| Leptothrix ochracea | N/sample | 4.0 × 10³ | n.d. |
| Leptothrix sp. Strain B2 | N/sample | 4.0 × 10³ | n.d. |
© 2018 by the authors. Licensee MDPI, Basel, Switzerland. This article is an open access article distributed under the terms and conditions of the Creative Commons Attribution (CC BY) license (http://creativecommons.org/licenses/by/4.0/).
Share and Cite
Śmiech, K.M.; Tolsma, A.; Kovács, T.; Dalbosco, V.; Yasadi, K.; Groendijk, L.; Agostinho, L.L.F. Comparing Mixed-Media and Conventional Slow-Sand Filters for Arsenic Removal from Groundwater. Water 2018, 10, 119. https://doi.org/10.3390/w10020119
Śmiech KM, Tolsma A, Kovács T, Dalbosco V, Yasadi K, Groendijk L, Agostinho LLF. Comparing Mixed-Media and Conventional Slow-Sand Filters for Arsenic Removal from Groundwater. Water. 2018; 10(2):119. https://doi.org/10.3390/w10020119
Chicago/Turabian StyleŚmiech, Karolina M., Aize Tolsma, Tímea Kovács, Vlade Dalbosco, Kamuran Yasadi, Leo Groendijk, and Luewton L. F. Agostinho. 2018. "Comparing Mixed-Media and Conventional Slow-Sand Filters for Arsenic Removal from Groundwater" Water 10, no. 2: 119. https://doi.org/10.3390/w10020119