Determining Surface Infiltration Rate of Permeable Pavements with Digital Imaging


1
Mechanical Engineering, University of Victoria, Victoria, BC V8W 2Y2, Canada
2
Civil Engineering, University of Victoria, Victoria, BC V8W 2Y2, Canada
*
Author to whom correspondence should be addressed.
Water 2018, 10(2), 133; https://doi.org/10.3390/w10020133
Submission received: 22 December 2017
/
Revised: 23 January 2018
/
Accepted: 29 January 2018
/
Published: 31 January 2018
(This article belongs to the Special Issue Permeable Pavements and Their Role in Sustainable Urban Development)
Abstract
:Cell phone images of pervious pavement surfaces were used to explore relationships between surface infiltration rates (SIR) measured using the ASTM C1701 standard test and using a simple falling head test. A fiber-reinforced porous asphalt surface and a highly permeable material comprised of stone, rubber and a polymer binder (Porous Pave) were tested. Images taken with a high-resolution cellphone camera were acquired as JPEG files and converted to gray scale images in Matlab® for analysis. The distribution of gray levels was compared to the surface infiltration rates obtained for both pavements with attention given to the mean of the distribution. Investigation into the relationships between mean SIR and parameters determined from the gray level distribution produced in the image analysis revealed that mean SIR measured in both pavements were proportional to the inverse of the mean of the distribution. The relationships produced a coefficient of determination over 85% using both the ASTM and the falling head test in the porous asphalt surface. SIR measurements determined with the ASTM method were highly correlated with the inverse mean of the distribution of gray levels in the Porous Pave material as well, producing coefficients of determination of over 90% and Kendall’s tau-b of roughly 70% for nonparametric data.
1. Introduction
Permeable pavement systems (PPS) have seen increasing adoption as a low impact development technology (LID) for use in low-traffic areas. PPS has been shown to not only mitigate stormwater water quantities [1,2,3,4,5,6,7] but water quality as well [1,8,9,10]. Various types of PPS have seen increasing use in recent years including porous asphalt, porous concrete, and permeable interlocking concrete pavers [11,12]. Runoff reduction rate resulting from the very high surface infiltration rates (SIR) in PPS is one of the many benefits for using these systems [4,13,14,15]. Consequently, the maintenance of this hydraulic performance is critical to sustainable implementation of these systems in the long term. Once implemented, the SIR will immediately begin to degrade from clogging and degradation of the porosity [16]. Maintaining the lifespan of PPS requires knowing when, and what type of maintenance should be conducted. Accurate methods for determining SIR in the field are key to understanding when maintenance should be performed.
SIR, which is inversely proportional to the clogging rate, is a largely surface phenomenon, which results from qualities within the top 0.25 m of the pavement [17]. Several methods have been used over the years to determine SIR. Winston et al. [18] succinctly summarizes the variety of methods used for measuring SIR. They range from single ring infiltrometers, or double ring infiltrometers (both are loosely based on conventional methods used in soil systems); simple and quick methods involving exposing the pavement to some volume of water; involve large-scale inundation of the pavement; or specially designed infiltrometers that employ a constant head or falling head [18]. Several studies have attempted to determine, which of these methods is optimal given the variety of surfaces available and the conditions for testing [19,20].
The variety of methods and variability in results between methods points to the need for some kind of standard test method that could be used over time on a wide-scale. This lead the ASTM to develop two standards for performing infiltration tests on two types of permeable pavement systems: ASTM C1701 and C1781, developed for porous concrete and interlocking concrete pavers, respectively [21,22]. Both tests use single ring infiltrometers under a constant head and pre-wetting with 3.60 kg of water. If the pre-wetting time is less than 30 s, then 18.0 kg of water is used in the actual infiltration tests, but if the time is greater than 30 s, then 3.60 kg of water is used. The infiltration rate is calculated using the following equation:
where I is the surface infiltration rate (mm/min), K = 76,394,433.33 (mm3∙s/(kg·min)), M is the mass of infiltrated water (kg), D is the ring’s inside diameter (mm), and t is time required for the amount of water used in the test to infiltrate the surface (s). A larger diameter single ring infiltrometer is used as opposed to a double ring infiltrometer because of the large infiltration rates provided by these types of surfaces, and to reduce variability and repeatability between operators [23]. The method is intended to give some measure of “surface clogging potential” in the PPS. The developers recognized several issues with the C1701 test when it was introduced and suggested that the value obtained should be considered a starting point for infiltration leading to “early” evaluation of pavement permeability performance and the need for remediation [23].
Since the introduction of this standard, a number of studies evaluating the accuracy of the ASTM standard tests, or comparing them to other methods for determining SIR, can be found in the literature [16,24,25,26,27,28,29]. These comparisons are useful not only in judging the general use of such a method, but the precision by which it can provide a measure of SIR because of modeling needs and maintenance requirements [30]. It should be noted that while there is currently no standard to test porous asphalt or PPS in general, numerous studies have been conducted using the ASTM C1701 test on both porous concrete and porous asphalt, or used modified versions to test infiltration rates of PPS on other types of systems [6,31,32]. Brown and Borst [16] recognized the need to select locations strategically on the surface as opposed to randomly. Li et al.’s [25] comparison of the ASTM C1701 with the National Centre for Asphalt Technology (NCAT) permeameter (which uses a falling head) showed the latter to produce higher SIR magnitudes and greater variability because of the higher hydraulic head. This was confirmed by Qin et al. [33]. Li et al. [25] suggested using larger ring sizes to produce greater similarity in results. Winston et al. [8] used a simple method based on the ASTM test for interlocking pavers that uses a falling head but over a larger surface area. They found their method provided comparable results to the ASTM test method. Other similar methods have been demonstrated to provide reasonable estimates of clogging levels in interlocking pavers [24,29]. Alternative instruments that simulate rainfall have produced SIR values comparable to double ring infiltrometers on interlocking pavers [27]. Rainfall simulators and surface inundation methods [26,28] arguably provide as close a measure of clogging during a high rain event than most other tests. How this can be related to the ASTM standard used pervasively is difficult to say.
SIR is a measure of the degree of clogging, or decrease in porosity of the media at the surface within a very small depth [17]. Recent studies in the laboratory setting have used some form of imaging to obtain estimates of porosity [17,34,35]. Obaidat et al. [35] used image analysis on cell phone images to successfully determine volumetric parameters such as the amount of voids in an asphalt material. These studies suggest that capturing and analyzing imagery may produce useful surrogates for surface infiltration rates of permeable surfaces.
Given the continued diversity in SIR estimation methods and comparisons to the ASTM standards, the objectives of this work are to explore and demonstrate the possibilities provided by image analysis for providing comparable estimates of surface infiltration rate. Image analysis is a non-contact method that may help to alleviate problems with SIR estimation methods seen in the literature thus far. However, exploring such a method requires a comparison to an already established method such as the ASTM C1701 method. In addition, this study focuses on two permeable pavement surfaces that are not investigated in the literature as greatly as porous concrete and interlocking pavers. A fiber-reinforced porous asphalt and a new material called Porous Pave are tested in this research. Because ASTM C1701 is designed for porous concrete, and ASTM C1781 for interlocking pavers, the authors will draw on recommendations arising from the literature for determining SIR on the fiber-reinforced porous asphalt and Porous Pave surface (as no standard for determining SIR on these two types of surfaces as yet exists). Thus, this investigation will use the ASTM C1701 method and variations based on ring size, as well a falling head test, to explore the use of image analysis for estimating SIR. Image analysis of cell-phone photographs is used to develop relationships with SIR determined with these contact methods.
2. Materials and Methods
2.1. Test Site
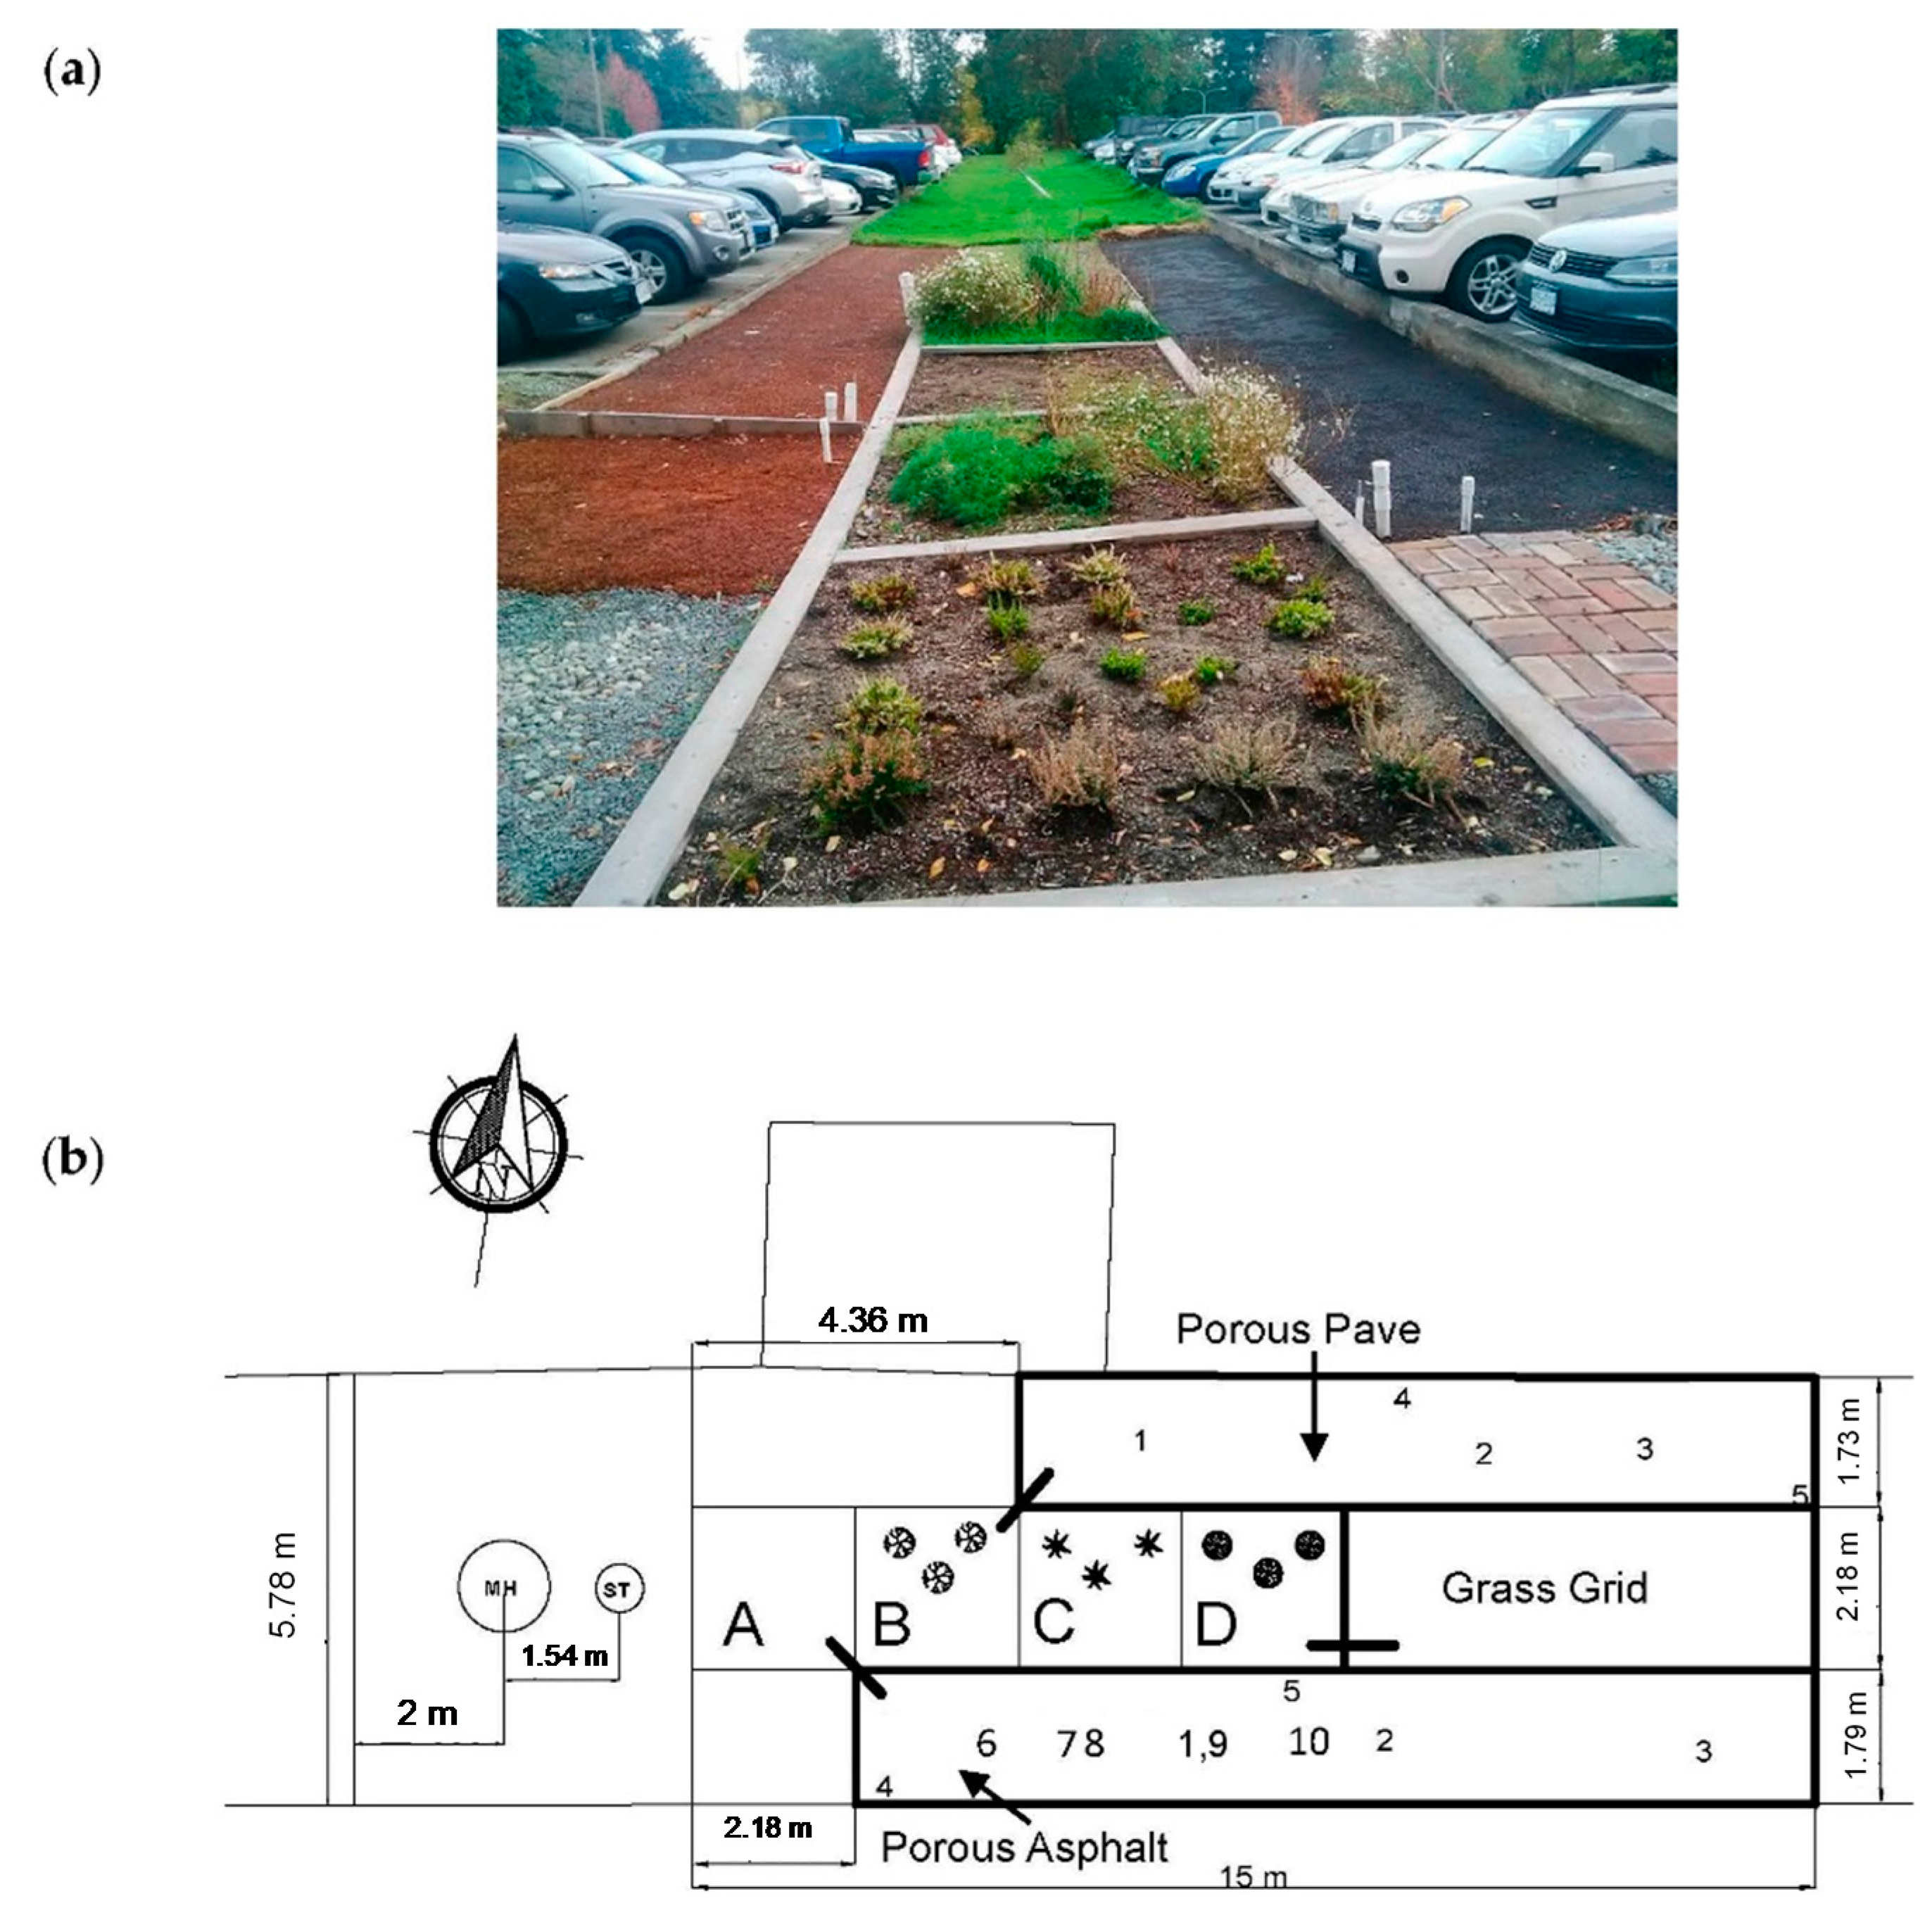
The Hybrid Absorbable Landscape (HAL) facility was designed for testing the performance of permeable pavements as part of treatment trains with bioretention cells. Located in Victoria, British Columbia at the University of Victoria, the site shown in Figure 1 was designed so that the pavements flow into the bioretention cells, which are roughly 2 m × 2 m vegetated plots, marked A through D in Figure 1a. The thick dashed lines shown between the pavement surfaces and the bioretention cells mark the location of a unique valve mechanism that directs drainage from the pavement surfaces into specific bioretention cells. Currently, two innovative permeable pavement surfaces are installed at the site. The porous asphalt shown on the right in Figure 1a and at the bottom in Figure 1b is 80 mm thick on top of a 50 mm layer of washed 20 mm fine aggregate. The fine aggregate sits on top of a 250 mm sub-base of washed, 38 mm course aggregate. It contains hydrophilic fibers as part of a separate experiment on the resiliency and integrity of porous asphalt with fibers. The Porous Pave surface shown in Figure 1 is 38 mm in thickness and laid over the same thickness of fine and course aggregate as the porous asphalt pavement. The Porous Pave product is a highly permeable pavement material developed by Porous Pave Incorporated® intended for use in low and light-traffic areas. It is made from recycled tires, stone aggregate and a proprietary urethane binder and claims to allow over 23,000 L/h of water to pass through the product [36]. To date no studies have been performed on this product outside of a laboratory environment and its potential use as an LID technology is unclear. Both pavement systems are lined with impermeable liners on a bed of roughly 2% slope between the highest corner and the final drainage point.
While neither surface is porous concrete, infiltration tests were performed on the two surfaces according to ASTM standard C1701 since installation in 2015. Five locations were strategically chosen for testing on each surface and marked in Figure 1b numerically. The ASTM C1701 standard suggests selecting three test locations for every 2500 m2 and at least one meter apart. The porous asphalt site is only 23 m2 and the Porous Pave site is only 18 m2. Thus, five locations on each strip roughly 1 m apart were chosen to span each strip where one or two were chosen near the corners where pores were visibly clogged, and one near the edge where soil and debris were likely to be transported to the surface (due to a crack in the curb). Sites 1–5 on both the porous asphalt and the Porous Pave site were chosen in this way. In addition, a small sample of porous asphalt was poured onto a layer of course, washed aggregate, in a wooden box of 0.75 m length, 0.5 m width and 0.3 m depth. This sample was kept covered the entire time since it was poured as it is intended for control purposes in comparison to the field site.
2.2. SIR Test Methodologies
The ASTM C1701 tests were conducted in accordance with the instructions in the test with the one exception, instead of plumber’s putty, silicone was used to adhere the ring to the surface as experience in other research [7] indicated it provided better restriction to lateral flow. The Porous Pave material has incredibly high infiltration rates and the Li et al. [25] study indicated that larger ring sizes reduced the impact of lateral water flow occurring in surfaces with very high infiltration rates. Because the Porous Pave surface has higher infiltration rates than any other type of surface seen in the literature thus far, the authors decided to draw on methods discussed in the literature and apply the ASTM C1701 test with three different ring sizes: a 203 mm ring and a 406 mm ring were used in addition to the 305 mm diameter ring size indicated in the ASTM C1701 test.
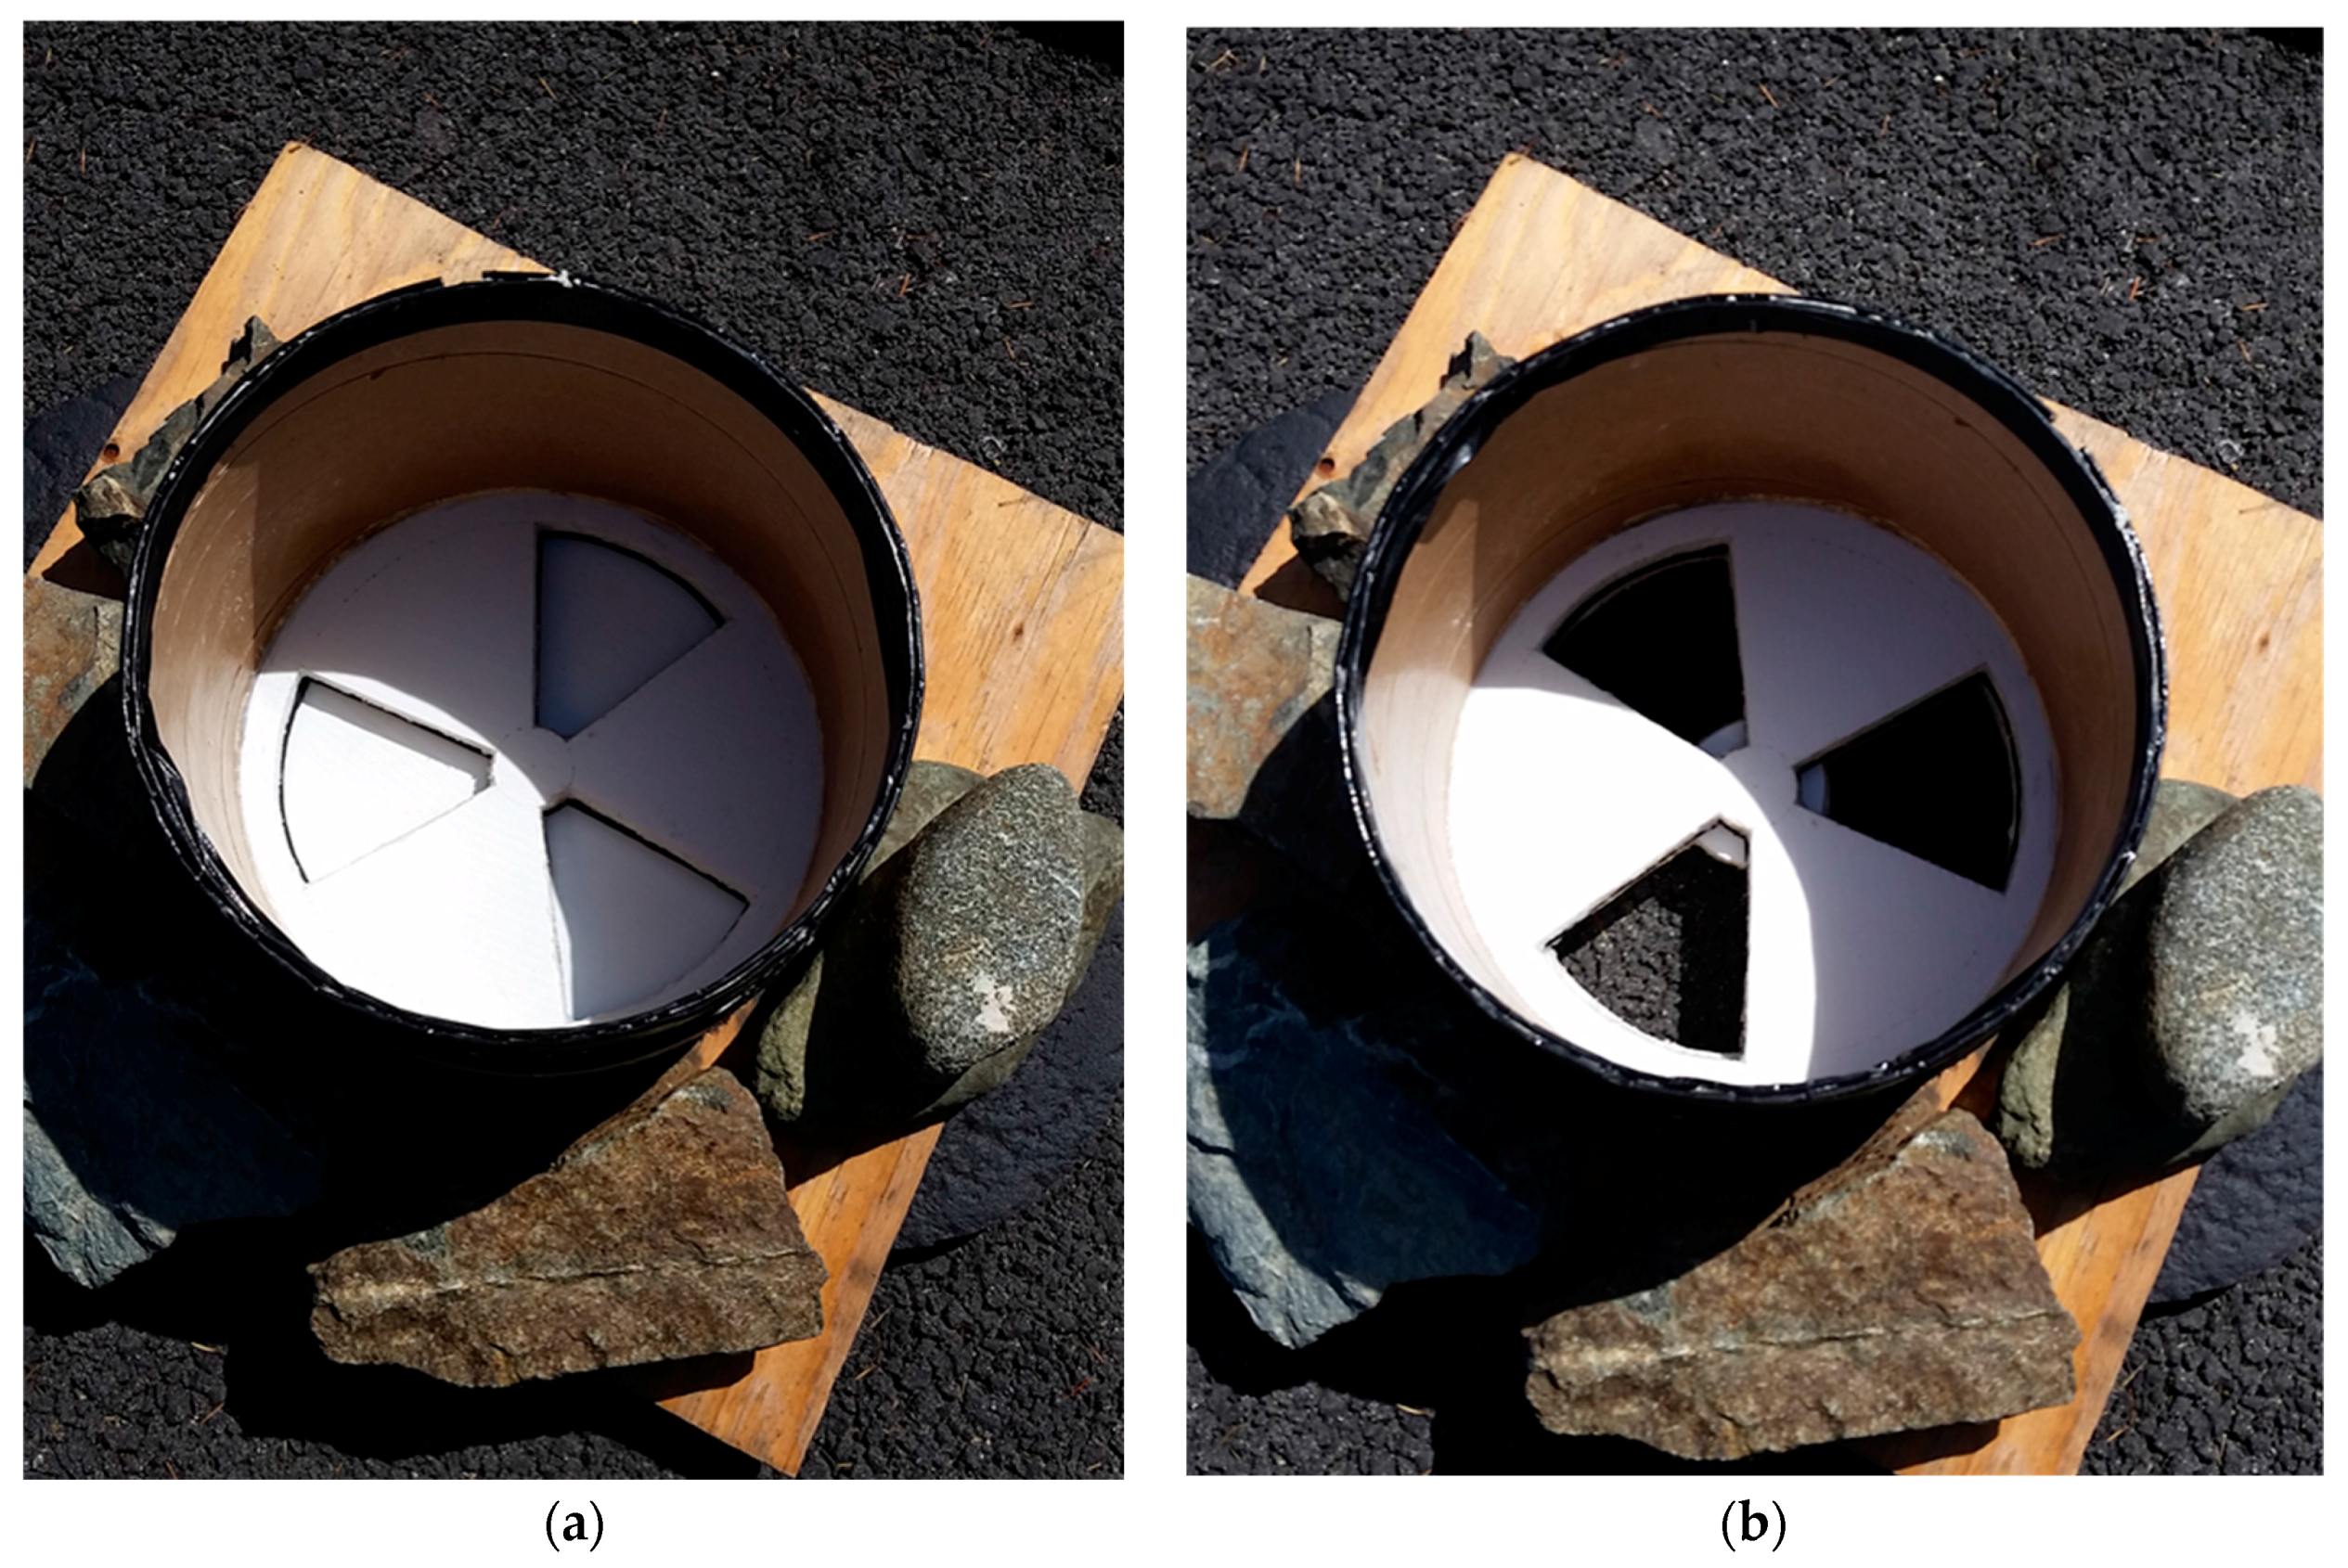
Working on recommendations in the literature favoring a falling head over a constant head test [18,25,33], a simple falling head test device was developed using a 300 mm diameter concrete form tube reinforced with plastic and affixed atop a base with three openings. The base was 1 cm thick and sized so that the tube would be placed atop the base and when rotated, three openings would release water onto the surface. This device is shown in Figure 2a,b. Every other aspect of the ASTM C1701 test was observed (including pre-wetting) except that modeling plasticine was used to secure this device to the surface. Previous testing on the site using silicone left a residue that was difficult to remove. The plasticine could be pushed into the surface to prevent leakage and is easier to remove. The plasticine was attached to the ring, placed on the surface and the device surrounded by foam, which was weighed down with wood and rocks to keep pressure on the plasticine. This helped to inhibit lateral movement of water under the device. Because this is a falling head test, a smaller head of 2.7 kg of water was used in both the pre-wetting and the actual infiltration test as recommended by Qin et al. [33]. The falling head test was performed at each location marked 1 through 10 on the porous asphalt surface and on the sample, on separate days taking care to observe the rule of 24 h of antecedent dry weather. This was problematic for collecting large amounts of data because the field site is located in Victoria, Canada, which receives frequent rainfall.
2.3. Image Acquisition and Analysis
Photographs using a high-resolution cell phone camera were taken of each location before each test. The camera was positioned approximately 0.5 m above each spot with the camera aimed directly above and in parallel with the surface. The high-resolution files were stored as JPEG files for processing and cropped to avoid shadows created by the photographer so that each image was roughly the same size (with the same number of pixels). A simple Matlab® program was written to convert the image to a gray-scaled image (with 256 gray levels) using Matlab®’s “rgb2gray” function and a simple histogram of each image was produced. The methodology for the imagery was kept as simple as possible in order to reproduce what a homeowner might need to do in order to use imagery to determine surface infiltration of their permeable pavement systems.
2.4. Statistical Methods
Two statistical software packages, SPSS® and StatDirect®, were used to conduct a variety of tests on the data to determine the appropriate analysis. The Shapiro-Wilk test was conducted on the pooled data where all the infiltration tests conducted on the surface, regardless of location, were lumped into one data set as done in similar studies [18,25,29]. Pooled data sets were created for each ring size, for each surface and for each type of test method (either ASTM or falling head). The Shapiro-Wilk test determines whether or not the data deviate from a normal distribution significantly and is intended for data sets with less than 2000 data points.
If at least one data set proves to deviate from the normal distribution, a Sample Sign test for related samples (related by location) is conducted to test the degree of difference in any pairwise comparison. The Sample Sign test is a non-parametric test that determines any significant difference between the median of differences between data pairs. If data sets prove to be normal, SPSS® can provide linear regression analysis using the assumption of normality in the data.
If datasets proved to be non-normal, than a nonparametric linear regression method provided by StatDirect® is used to determine a linear relationship based on medians. The slope of the non-parametric regression is calculated as the median of the gradients from all possible pairwise contrasts of the data. Assumptions inherent in this analysis are that the sample data are random, and that the relationship between the dependent and independent variables is linear. Kendall’s tau-b procedure, another nonparametric procedure, was used to determine the correlation between data sets whenever a nonparametric linear regression was conducted.
3. Results
3.1. Application of the ASTM C1701 Standard Test and Impact of Ring Size
The results of testing the three ring sizes with the ASTM C1701 test on the porous asphalt surface in the spring of 2016 are shown in Table 1. The mean SIR and the range for each location are shown for each ring size along with the number of samples (N) collected at that location and the dates these data were acquired. Results from location 4 on the porous asphalt were omitted for the smaller and largest ring sizes because the tests took longer than an hour to complete and insufficient data was collected to allow for meaningful analysis. Because of frequent rainfall during the spring, the data collection period spanned 10 weeks. Changes to surface permeability due to runoff within this period are likely very small as continued rainfall prevented significant build-up of clogging material.
The Shapiro-Wilk test was conducted on the pooled data and the results showed that for porous asphalt, the data collected for the 203 mm (N = 12, p = 0.08); and 305 mm (N = 14, p = 0.285) ring sizes are normally distributed. The data set collected with the 406 mm ring size is not normally distributed at the 0.05 significance level (N = 13, p = 0.023).
Because the 406 mm ring size data set for the porous asphalt surface was not normally distributed, the Sample Sign test for related samples (related by location) was used to determine if any significant differences existed between data sets. The pooled data set for each ring size was used (but related by location and pairs were compared based on the location) but because ring size 203 mm had only 12 points, only the first two infiltration test results collected at a specific location in the other two ring sizes, were used (thus, N = 12 for all sets for the pairwise comparison). Results for the porous asphalt showed no significant difference between the median of differences for the 203 mm and 305 mm ring sizes (p = 0.227), or between the 203 mm and the 406 mm ring sizes (p = 1.0), or between the 305 mm and 406 mm ring sizes (p = 0.227).
The results of testing the three ring sizes on the Porous Pave surface with the ASTM C1701 test in the spring of 2016 are shown in Table 2. When the Shapiro-Wilk test was applied to the pooled data, none of the pooled data sets were found to be normally distributed: 203 mm ring size (N = 15, p = 0.031), 305 mm ring size (N = 18, p = 0.026), and 406 mm ring size (N = 15, p = 0.017). Using the Sample Sign test on the pooled data created in the manner done for the porous asphalt, (thus, N = 15), there is a significant difference in the median of differences between the 203 mm ring size and the 305 mm ring size (p = 0.007) and between the 203 mm and 406 mm ring sizes (p < 0.000). However, there is no significant difference between the 305 mm and the 406 mm ring sizes for the Porous Pave (p = 1.00) surface.
For both surfaces, the Sample Sign test did not seem to suggest that a 305 mm ring size should produce anything significantly different than a larger ring size. The results on the Porous Pave surface however, do suggest that a 203 mm ring size is likely too small (since the two larger ring sizes produce no significant difference) to capture a scalable infiltration rate. The tests suggest that the ASTM C1701 standard size of 300 m ± 10 mm is appropriate for porous asphalt and possibly for Porous Pave.
3.2. Application of the Falling Head Device in Comparison to the ASTM C1701 Test
In the spring of 2017, both the ASTM C1701 test and the falling head device were applied to locations 1 to 5 on the porous asphalt surface, and on the porous asphalt sample. These results are shown in Table 3. The Shapiro-Wilk test showed that the pooled (N = 12) ASTM data for these data were normally distributed (p = 0.407) but the falling head data set rejected the null hypothesis (N = 16, p = 0.032) and is not considered to be normally distributed. The Sample Sign Test showed a significant difference (N = 12 with the third value taken at any one location being thrown out in the falling head test) in the median of differences between the falling head test and the ASTM test (p = 0.001).
While the data are insufficient to decide whether the falling head test is preferable to the ASTM test, the former produces a higher infiltration rate because of the higher hydraulic head involved but the variability (seen in the range of the three values at each location) is smaller than the range for the ASTM tests. This is a desirable characteristic to have in such a test and suggests at least, that the falling head test is worth exploring if such a permeability test is needed. For these reasons, both the ASTM test data and the falling head test data are used in the image analysis exploration.
3.3. Image Analysis
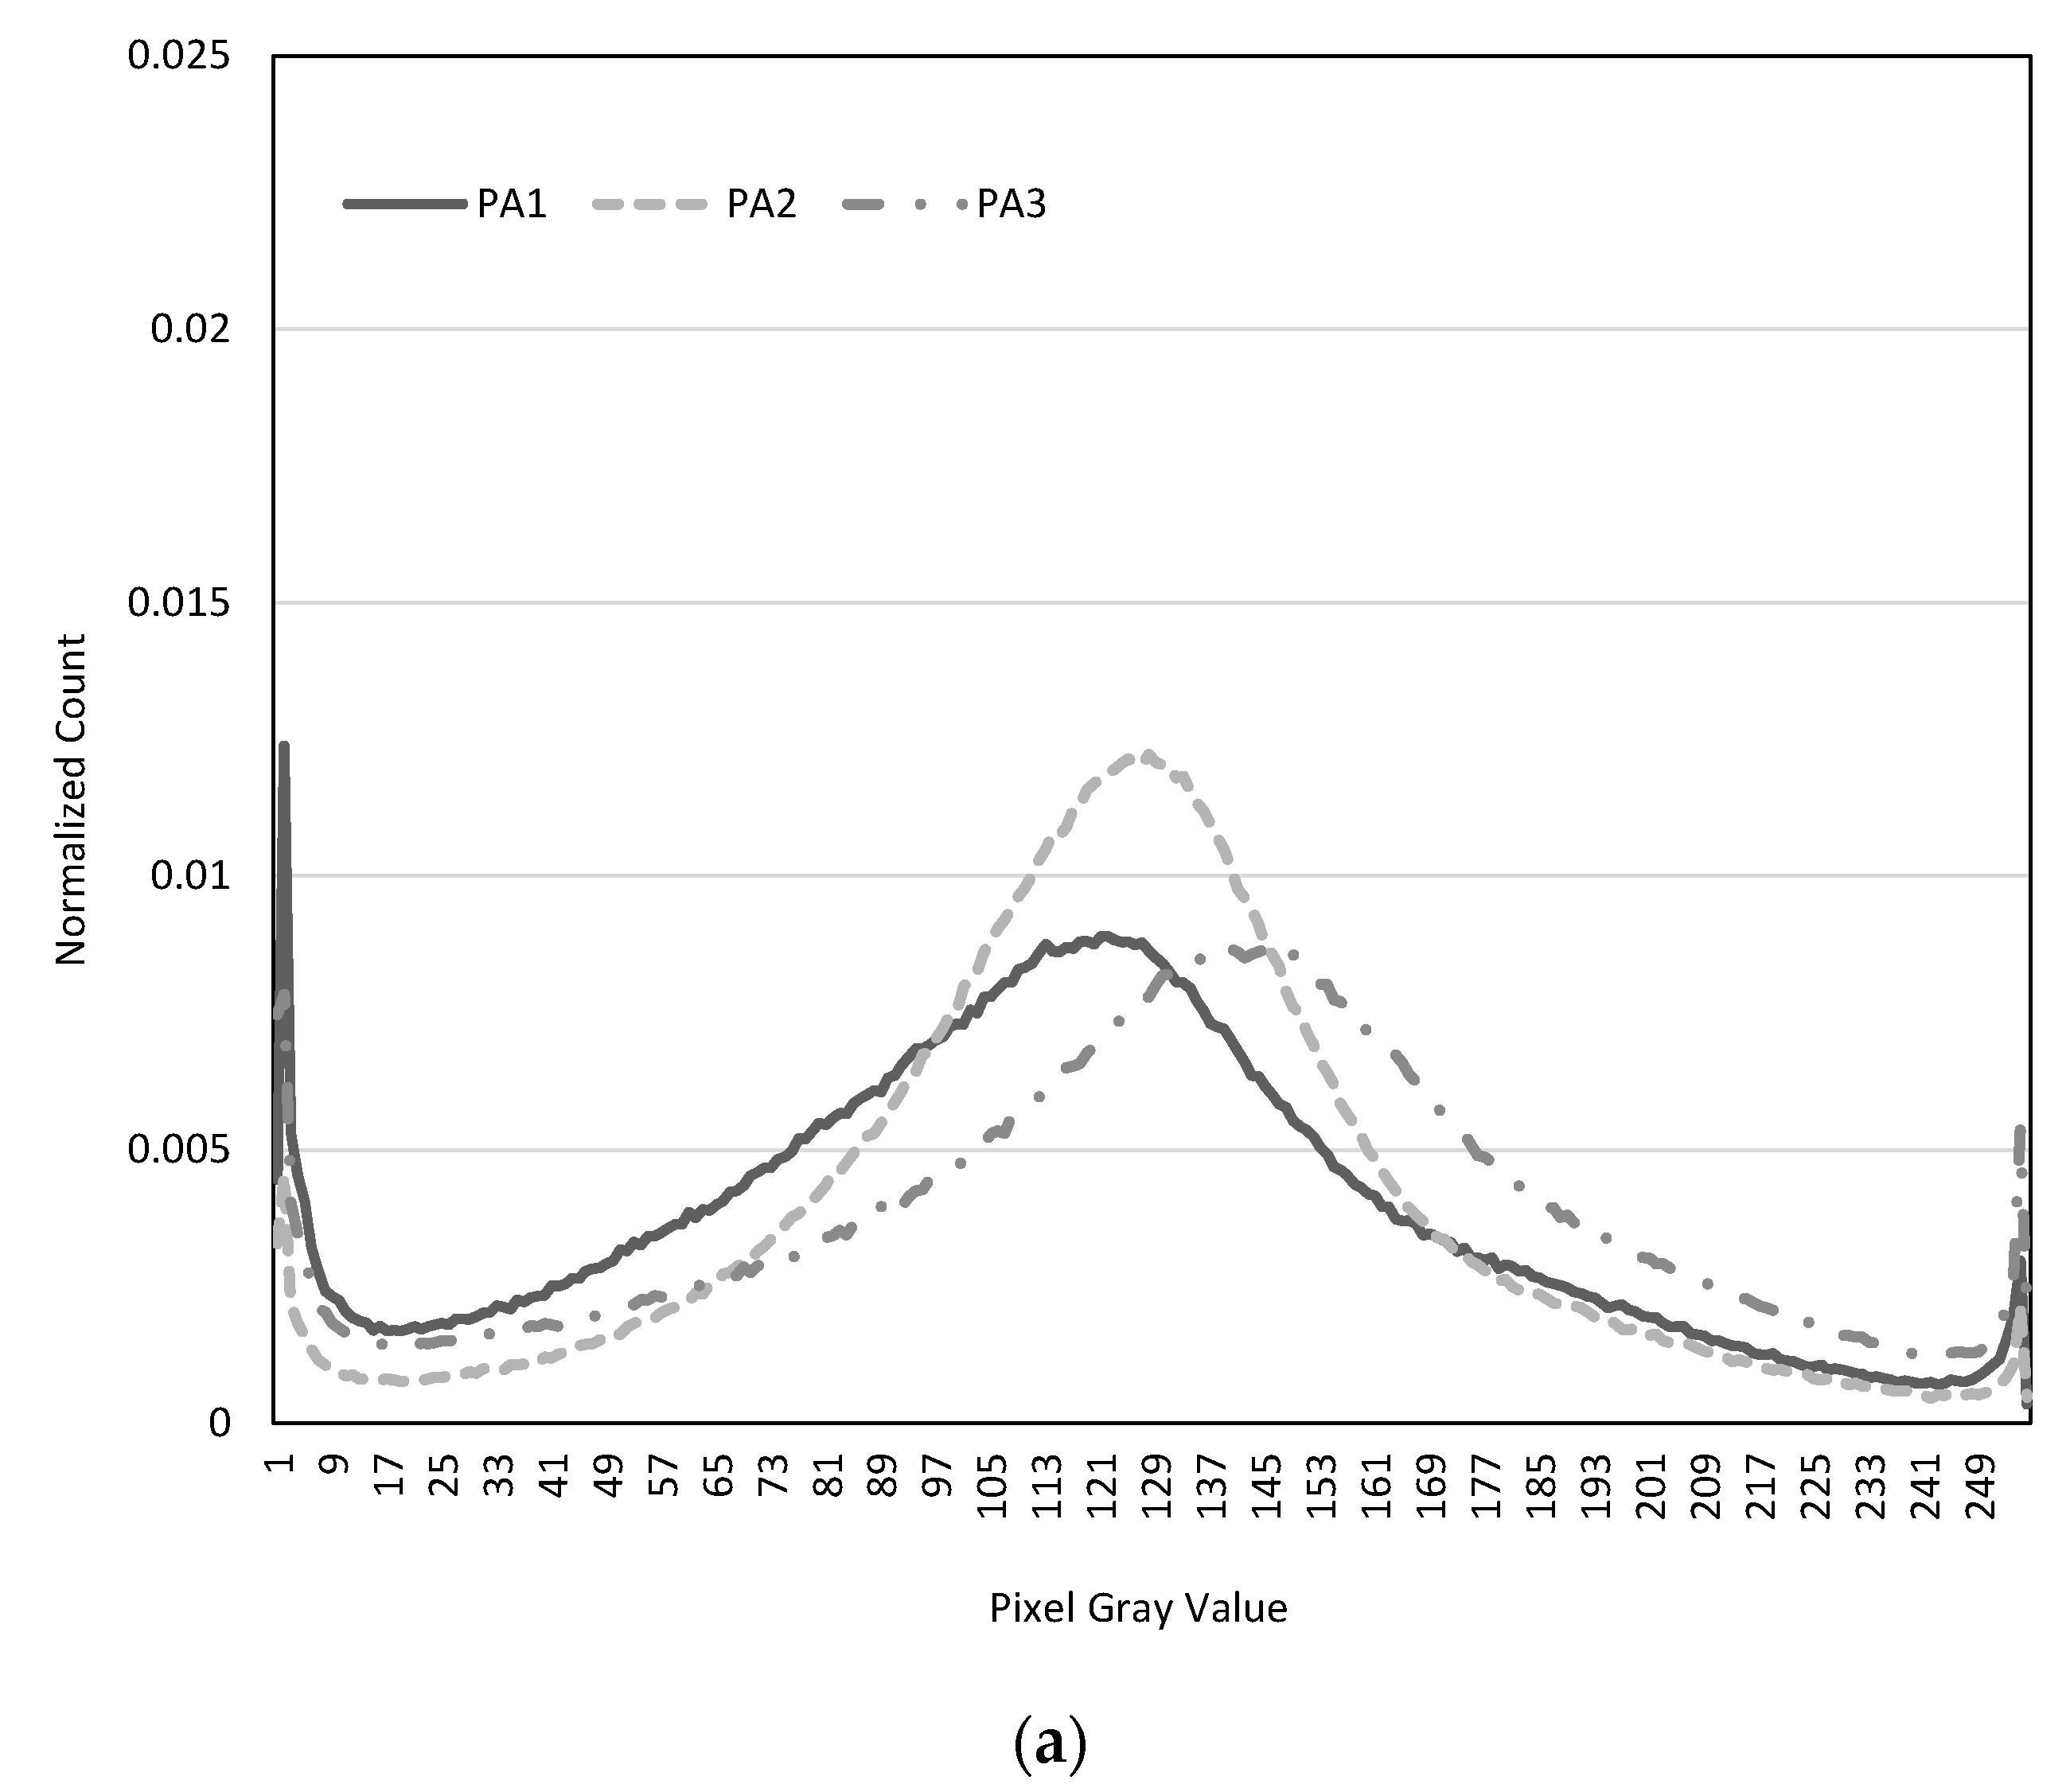
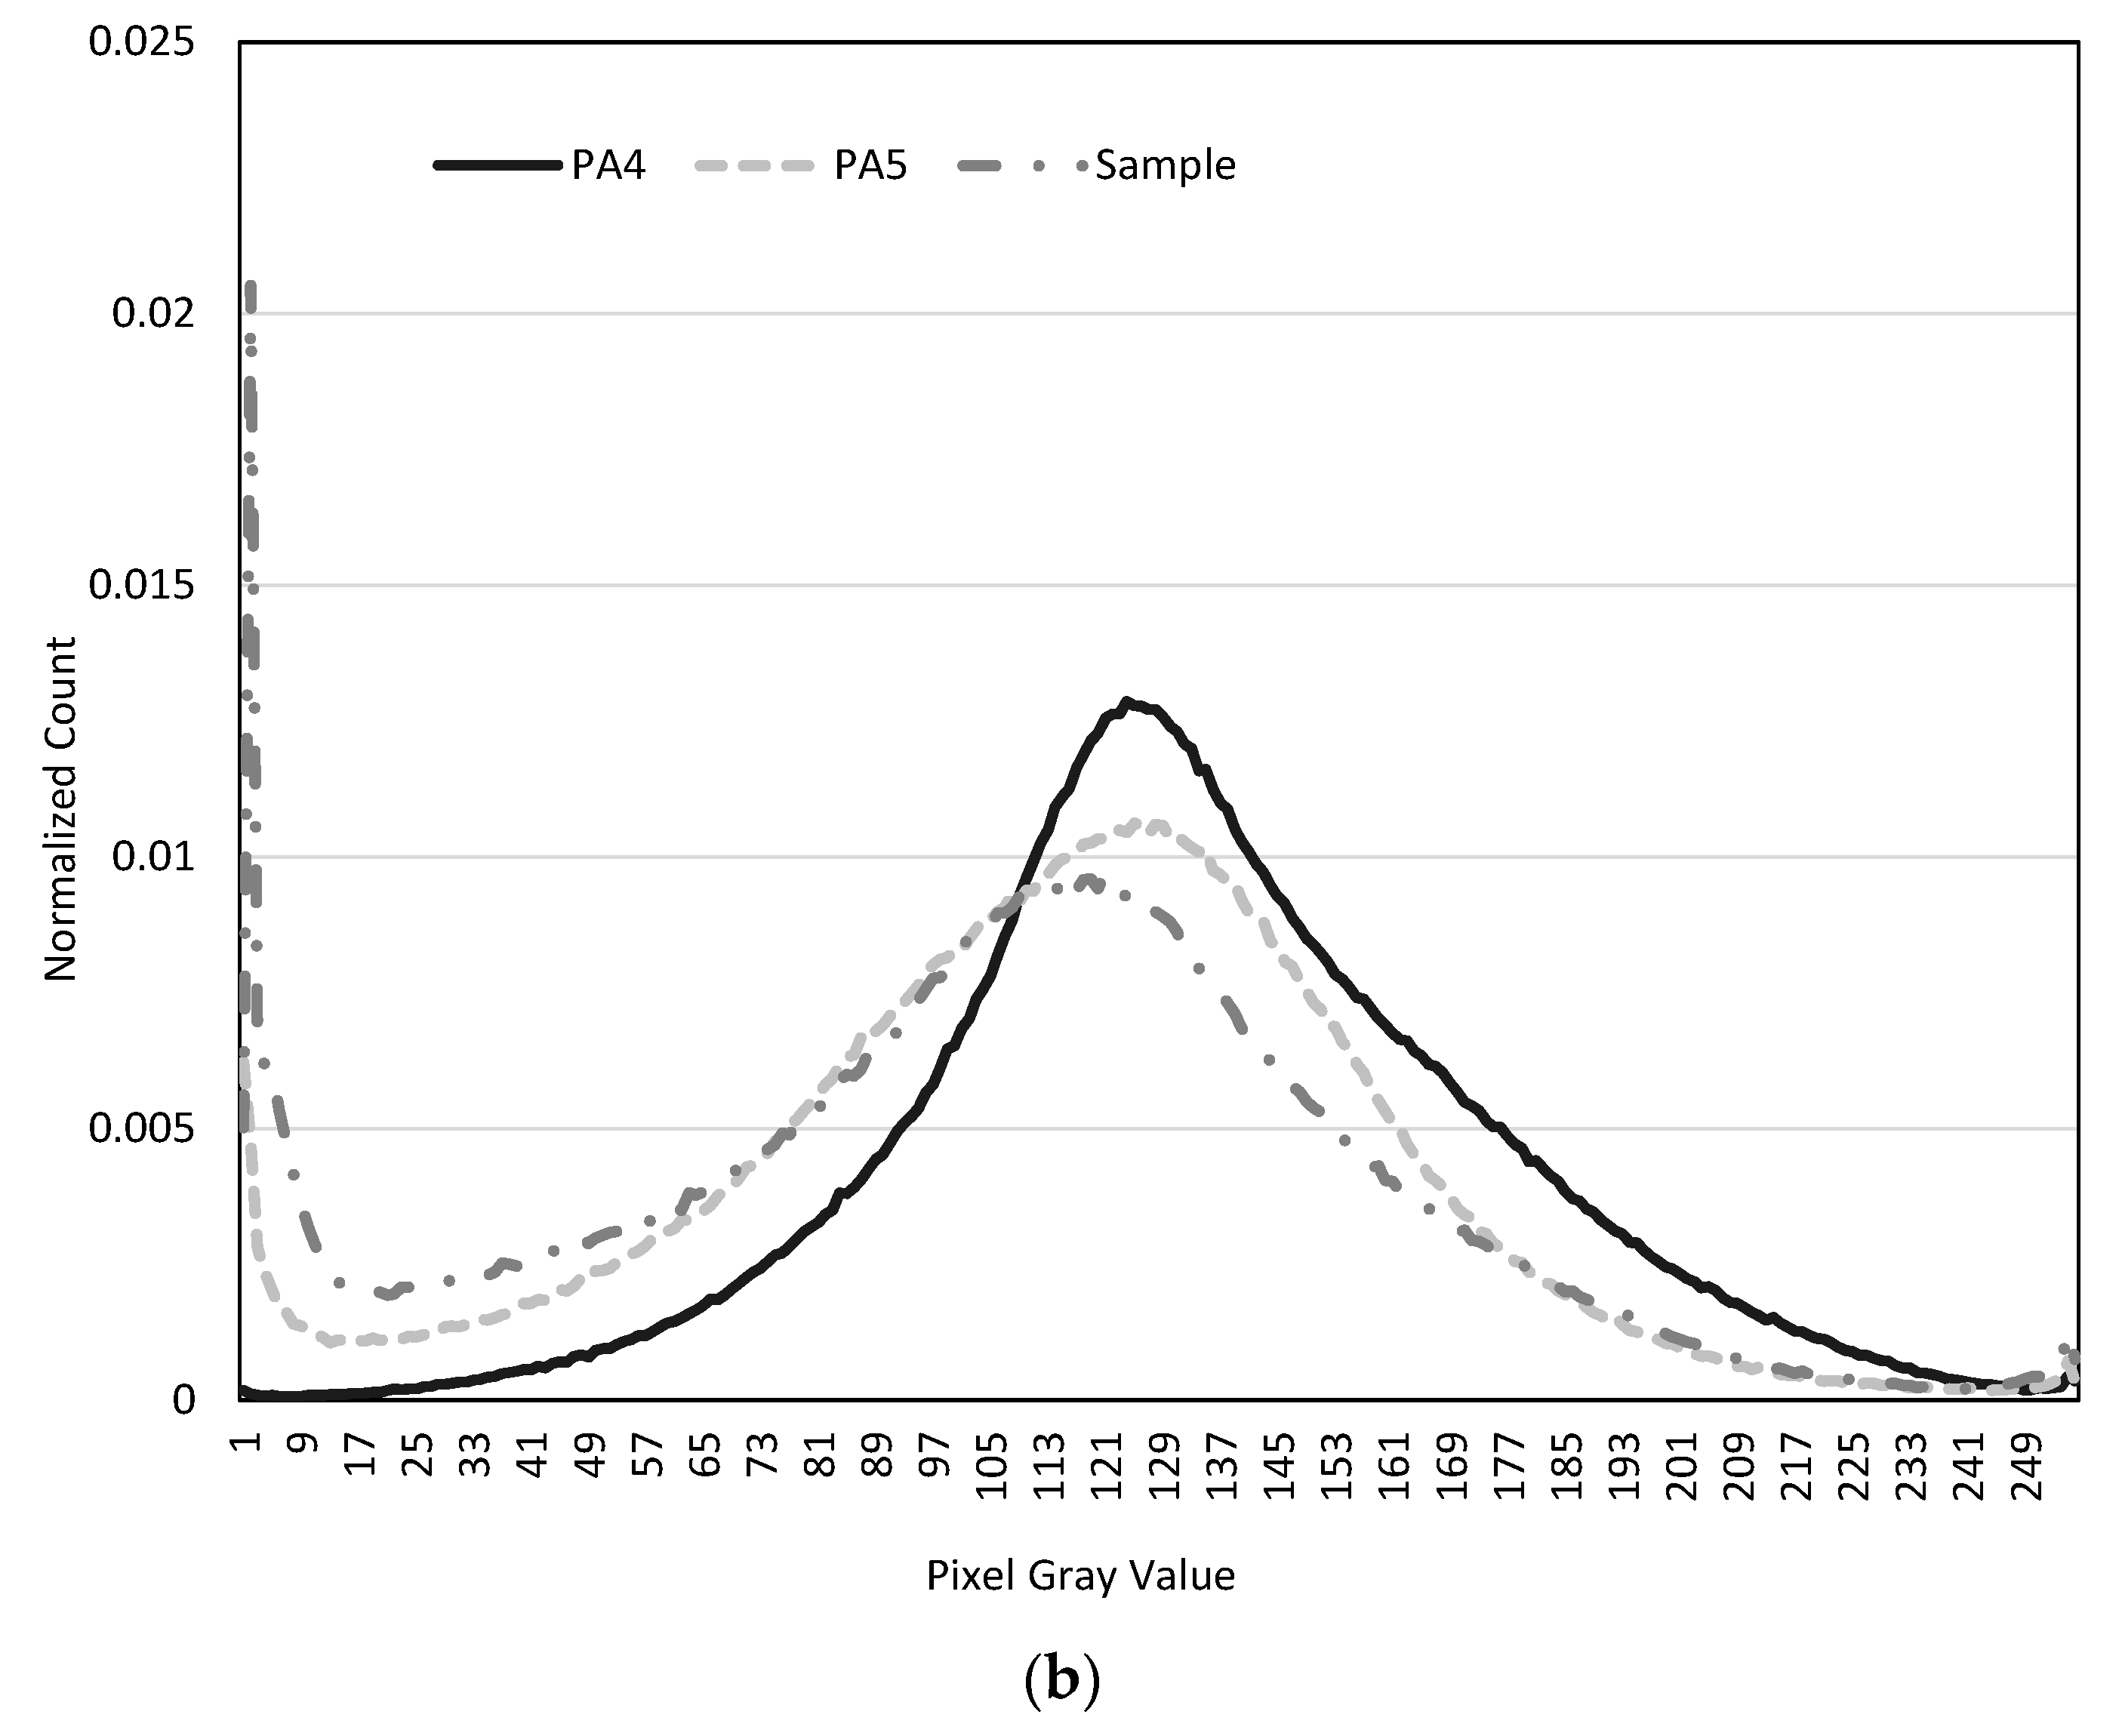
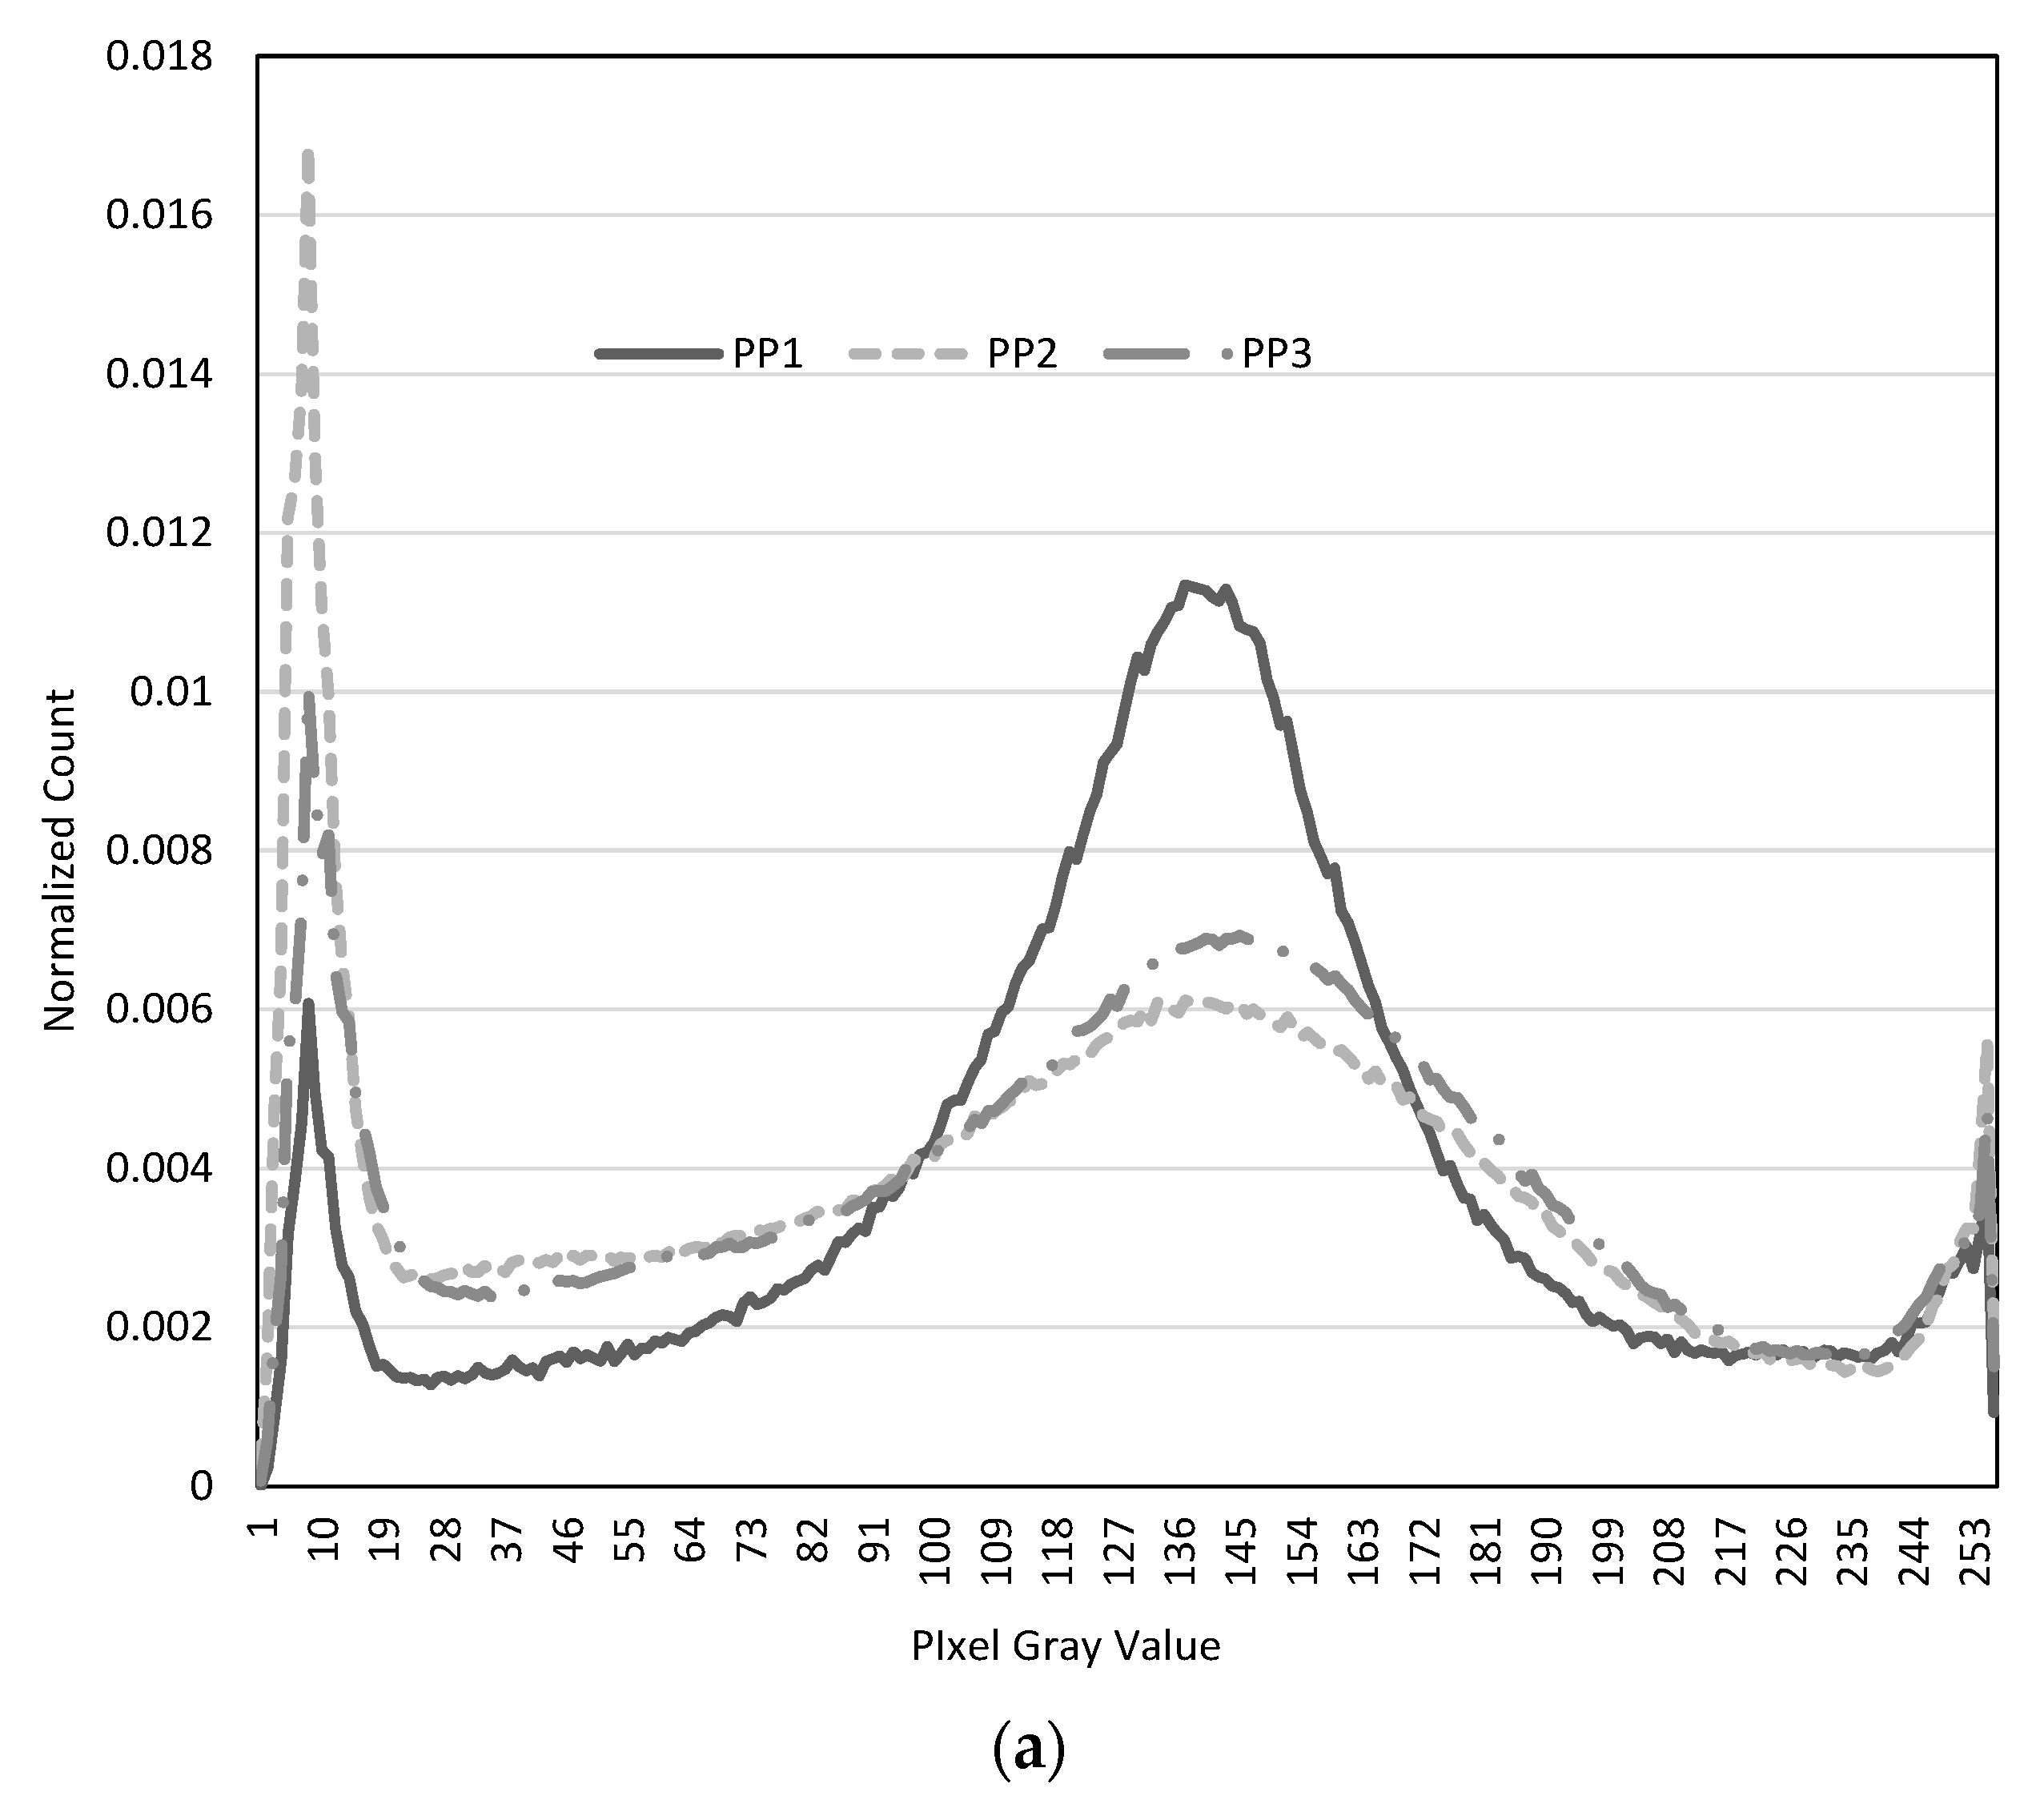
Figure 3 shows the images that were captured with a cellphone in the spring of 2017 of the dry porous asphalt before taking the SIR measurements at locations 1 to 5. Figure 4 shows the distributions (histograms) produced by Matlab® in the image processing of the gray level image.
The falling head test was conducted on locations 6–10 in the summer of 2017. Those images are shown in the Appendix A with their respective gray level histograms. For locations 6–10, only one falling head test at each location was conducted. A Shapiro-Wilk test was conducted on the falling head data set that was used to create Figure 5b. This data set was comprised of the single tests conducted on sites 6–10 in 2017 pooled with the average of the falling head tests conducted on locations 1 to 5 in 2016, and the average of the falling head results of the sample asphalt). In this data set, N = 11 and p = 0.841 showing that the data are normally distributed. Likewise the ASTM data set was tested and it too is normally distributed according to the Shapiro-Wilk test (N = 6, p = 0.197). Because the falling head data set of Table 3 was shown to deviate from a normal distribution, one could argue that the median of the falling head test instead of the mean should have been tested. The authors tested this data set (that is, the same data set tested above but now for locations 1 to 5, the median of the 3 points taken in the falling head test is used in the pooled data set instead of the mean). This data set was also normally distributed (N = 11, p = 0.780).
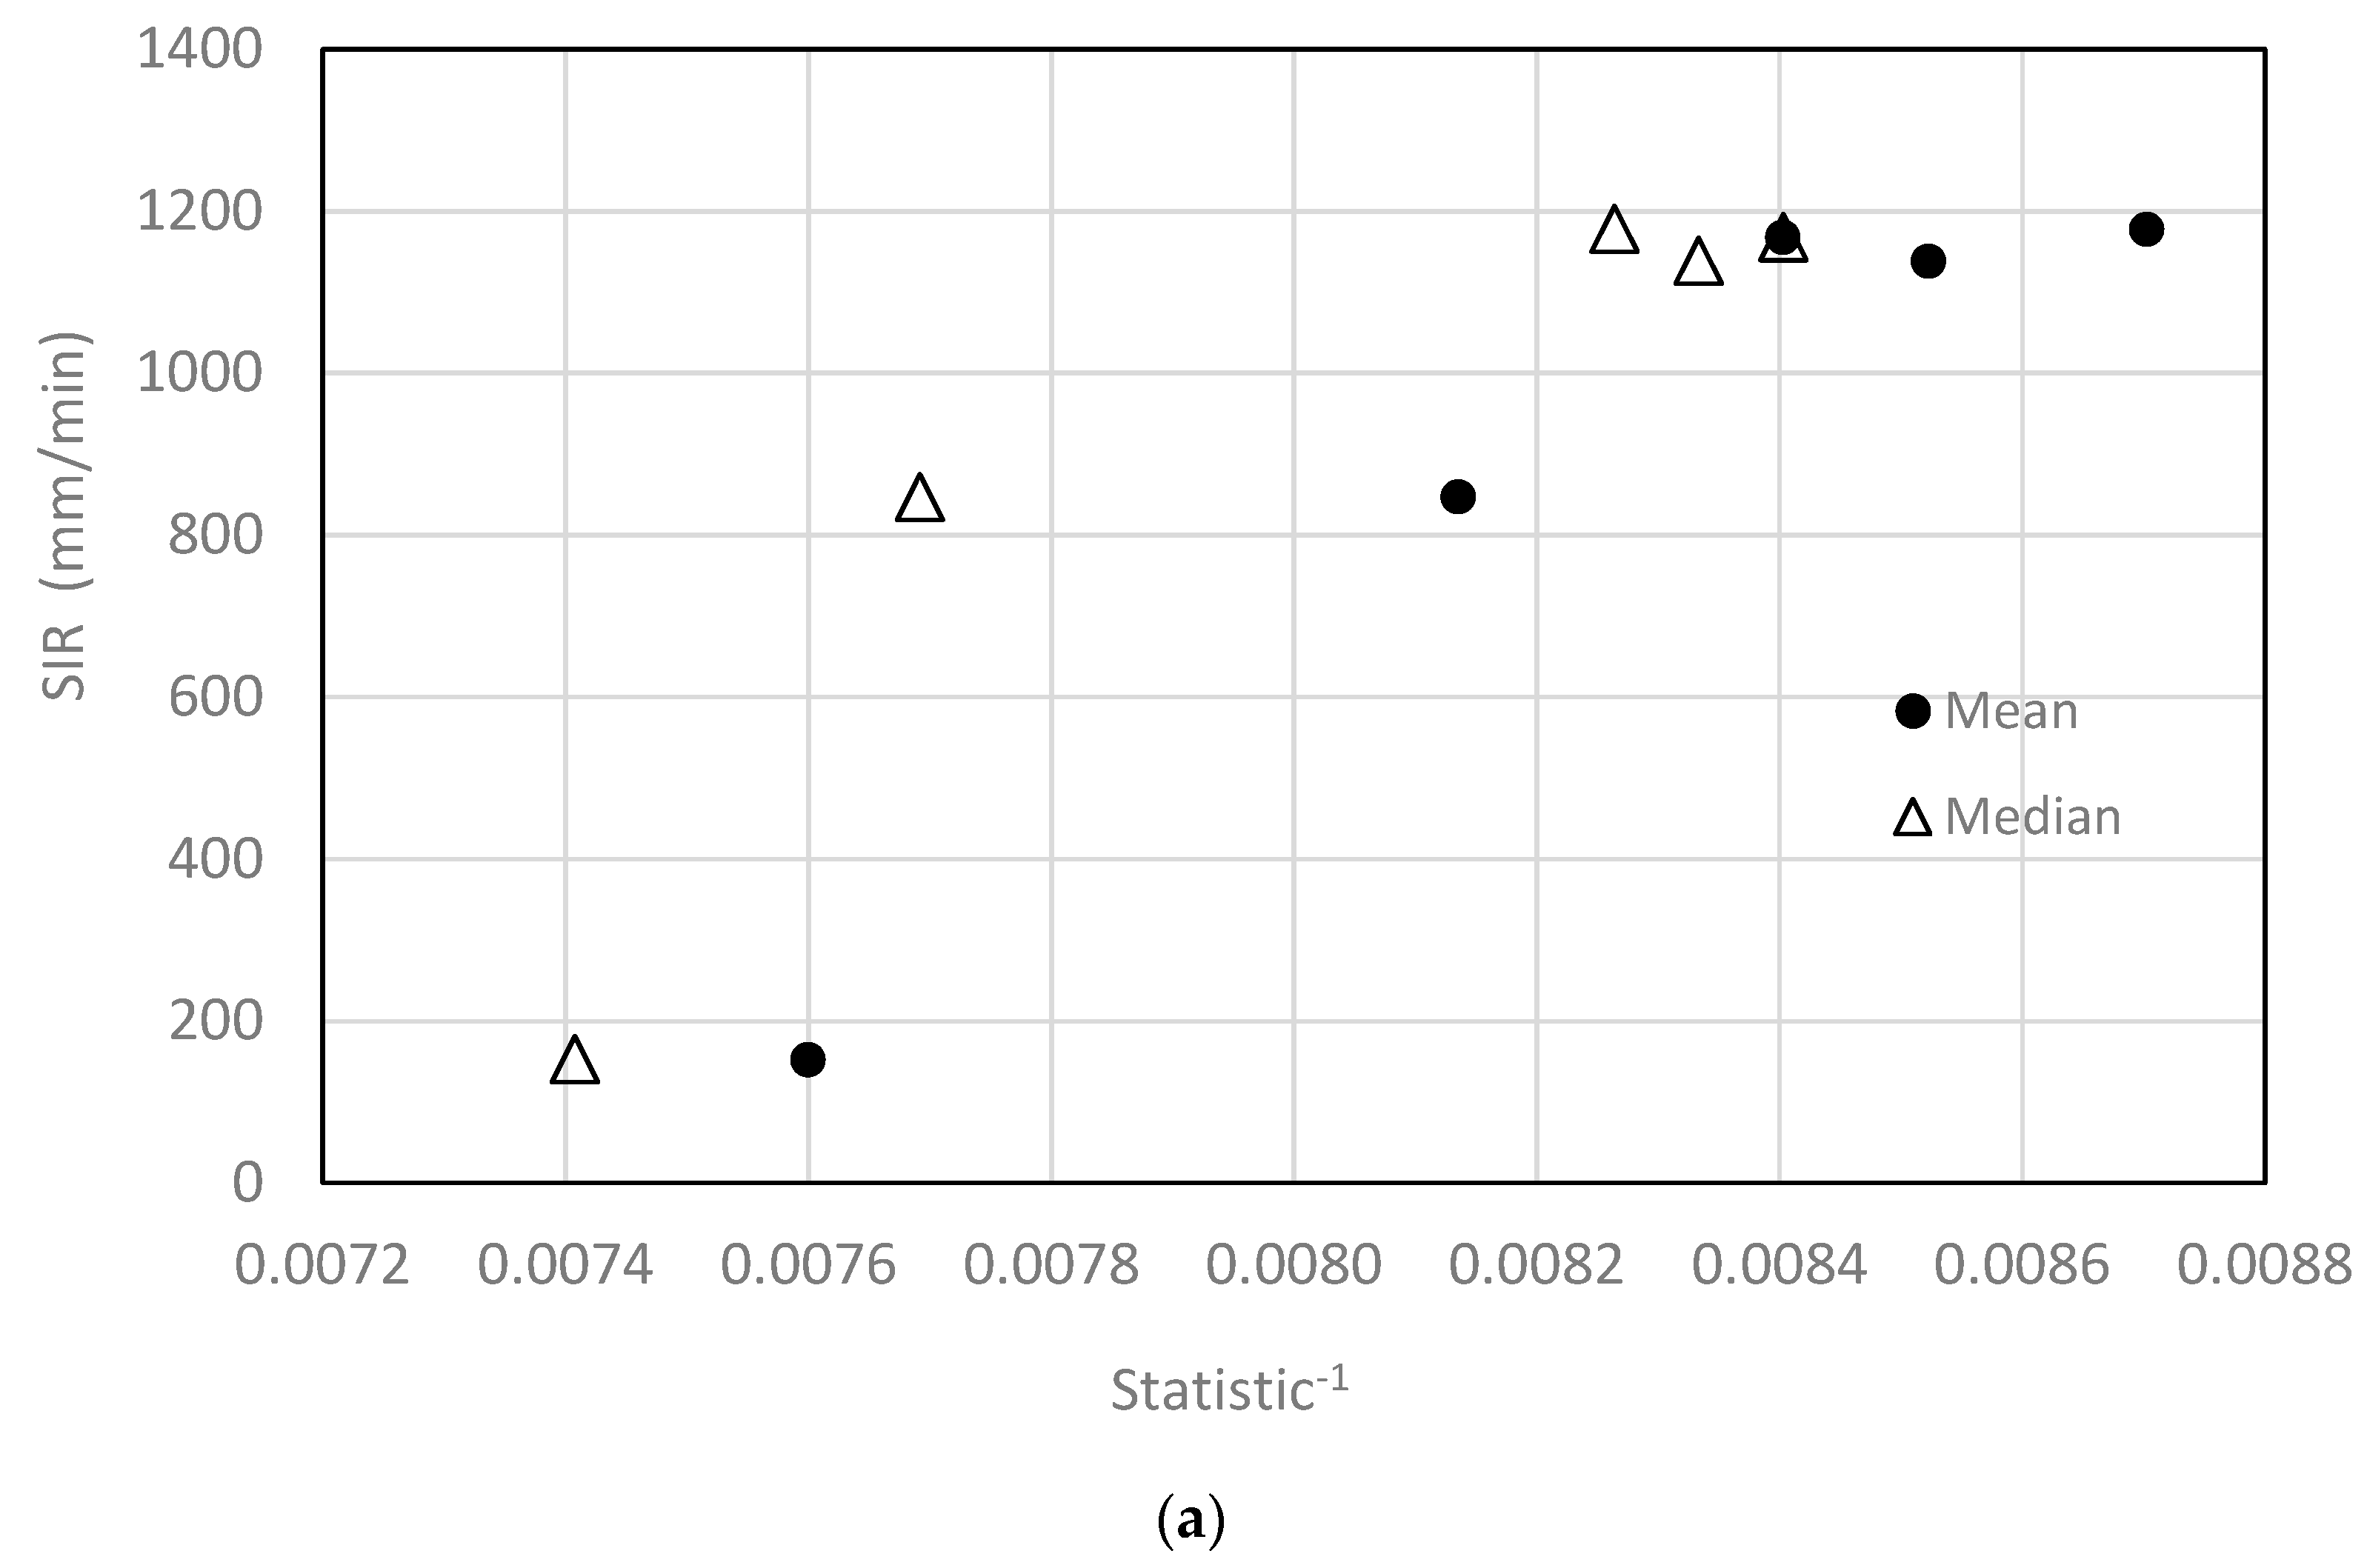
Figure 5a shows a simple linear regression between the inverse of the mean of each histogram and the mean surface infiltration rate measured by the ASTM C1701 method (Table 3 data). A simple linear regression was conducted between the inverse of the mean of each histogram and the mean surface infiltration rate measured by the falling head method (Table 3 data) in Figure 5b. For simplicity, the mean is used as opposed to using the median of the falling head test. If the median were used, the regression coefficients are different but the adjusted coefficient of determination is nearly identical.
The following relationships were achieved for the dashed lines shown in Figure 5a,b (as Equations (2) and (3), respectively). Note SIRfh (the SIR determined using the falling head method) and SIRastm (the SIR determined using the ASTM method) are in mm/minute and is the mean gray level of the image.
The adjusted R2 for SIRastm is 0.84 and the standard error of the estimate is 8.74 mm/min. The ANOVA analysis indicates the regression is significant (p = 0.007) as are the slope (p = 0.007) and constant (p = 0.012). The adjusted R2 on SIRfh in Equation (3) is 0.85 and the standard error of the estimate is 27.3 mm/min. The regression is significant according to ANOVA with p < 0.000 as are the slope and constant (p < 0.000 for both). The residual statistics for both regressions are shown in Table 4. The key values to examine in Table 4 are the standardized residuals. If the data are normal, and the relationship between the dependent and independent variable is truly linear, then all the standardized residuals values should be between +2 and −2. The table shows that this is true for both linear regressions equations.
3.4. Application of the ASTM C1701 Test and Image Analysis on the Porous Pave Site
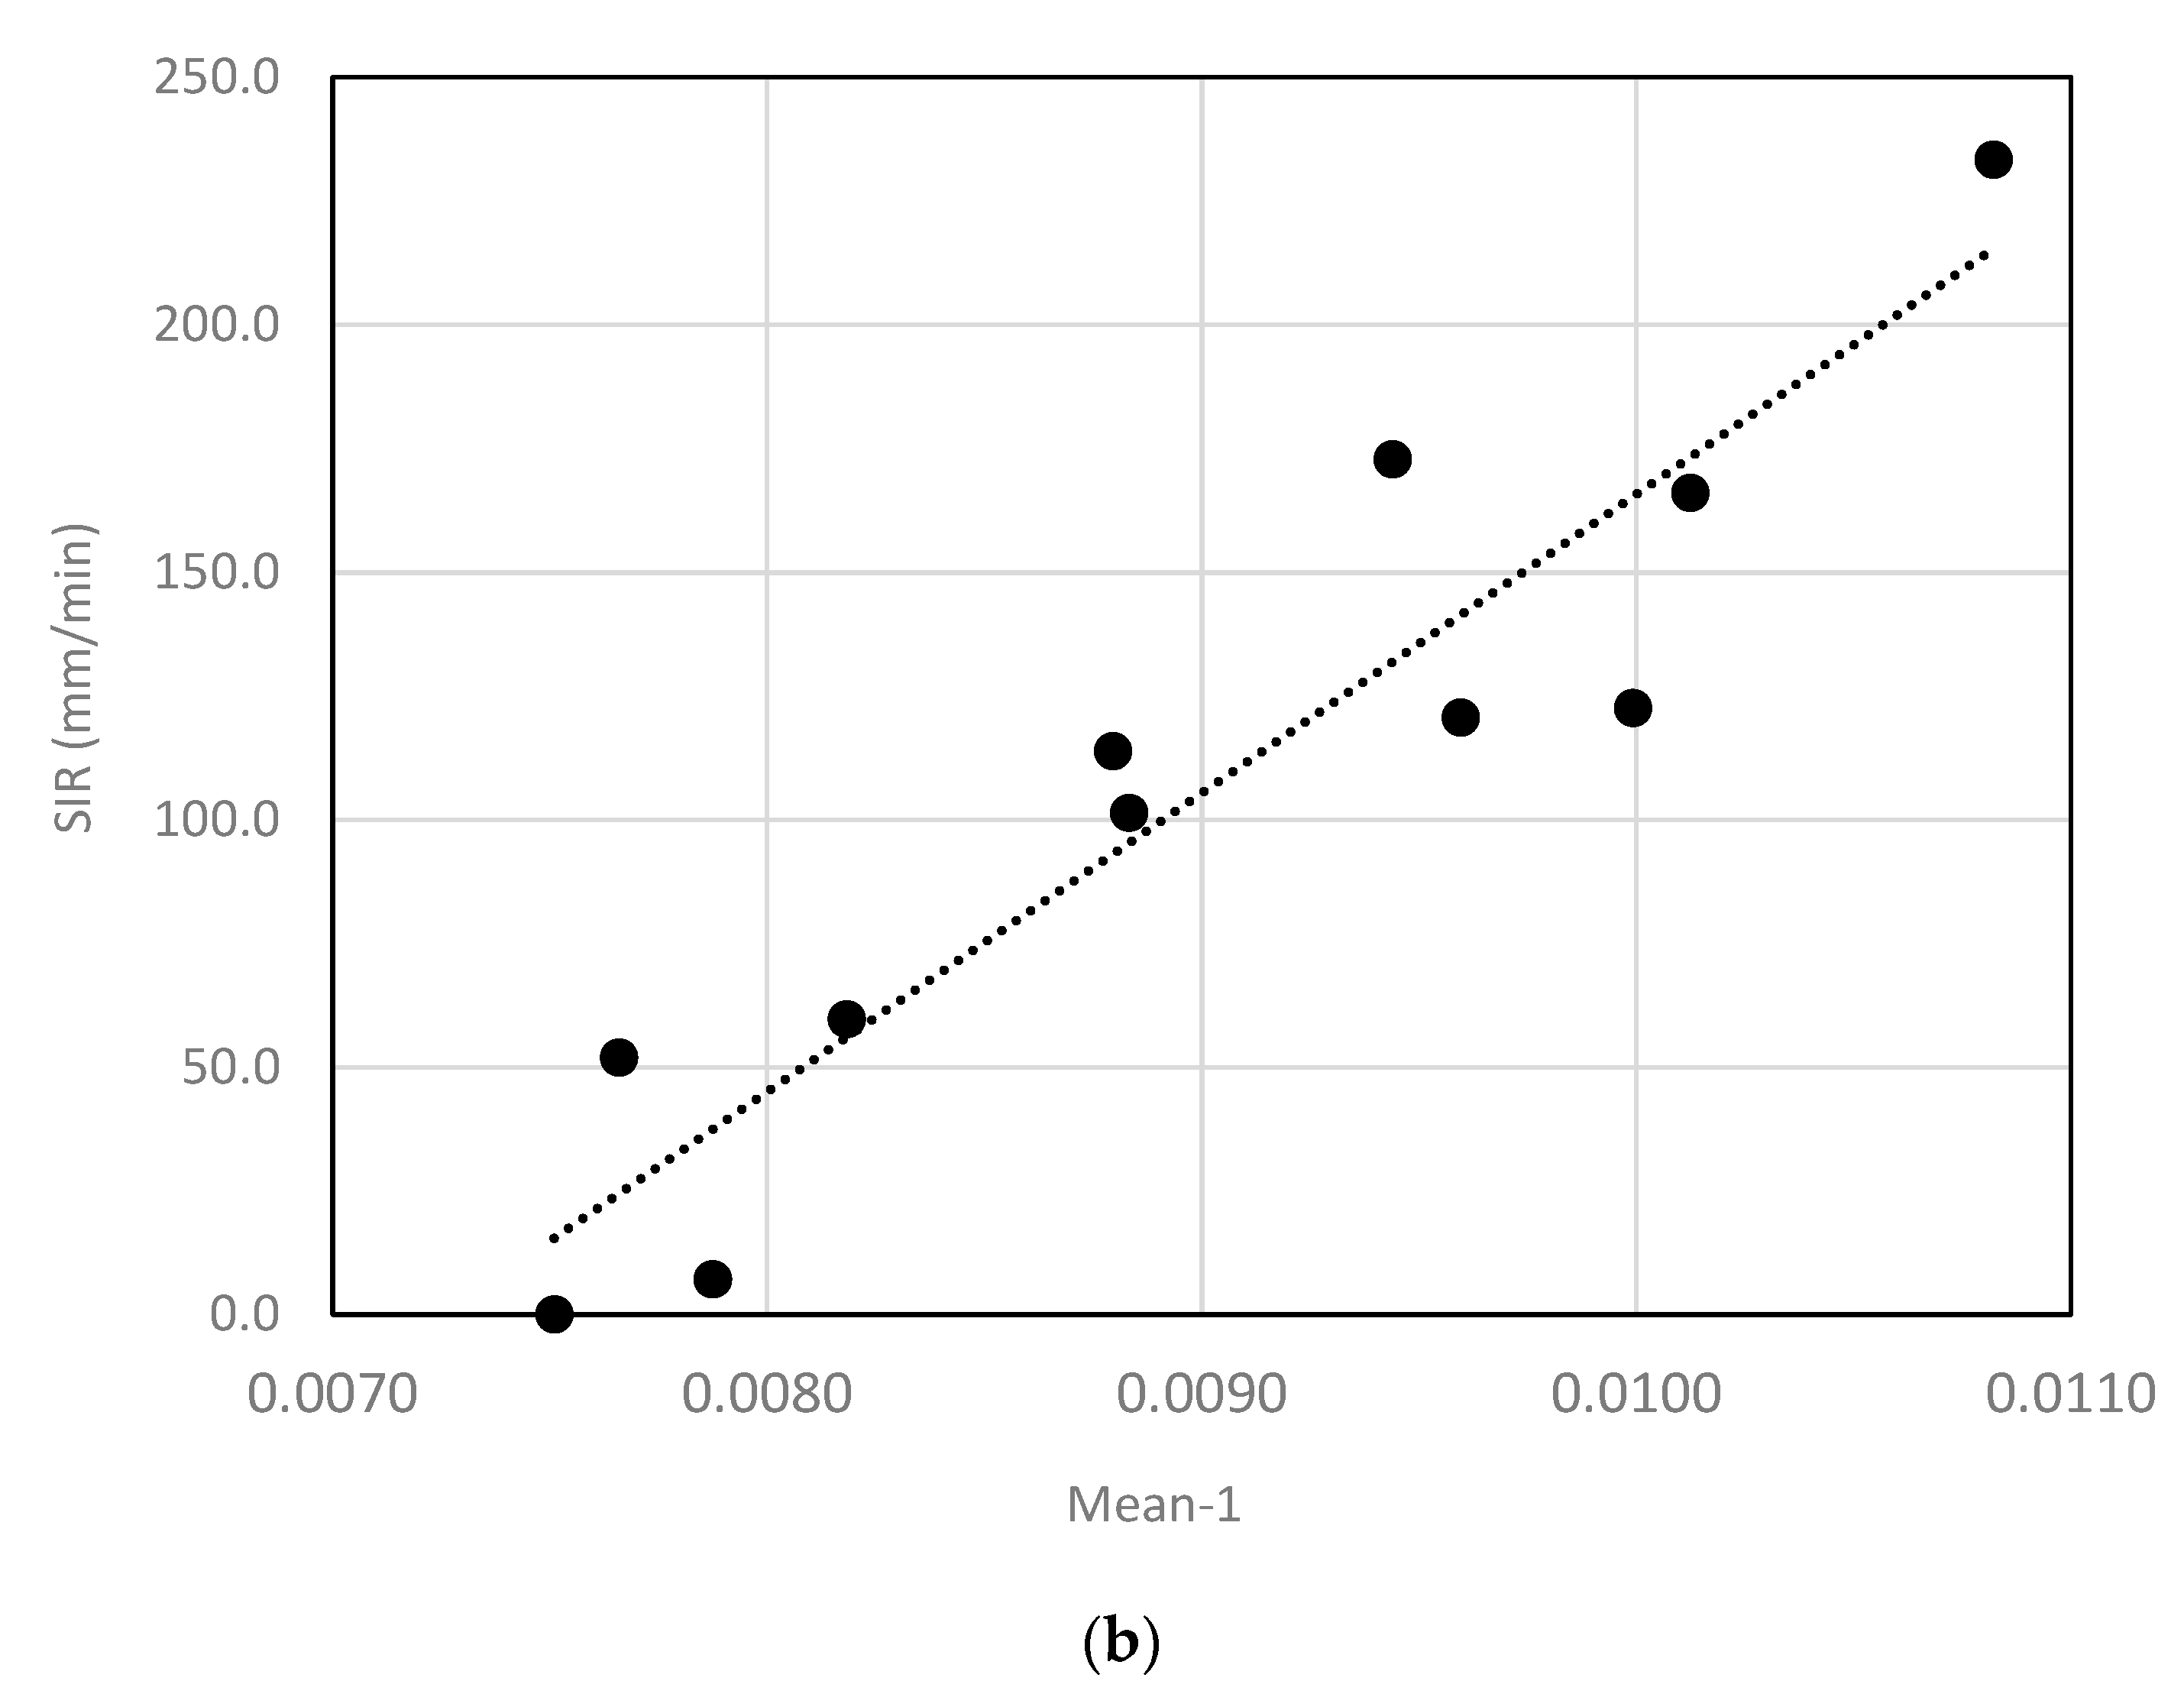
No falling head testing was conducted on the Porous Pave site because of the high infiltration rate. Thus, all image analysis relies on the ASTM C1701 testing conducted in the spring of 2016. Images of the test locations 1–5 on the Porous Pave surface shown in Figure 1b were taken on a dry day in the spring of 2017 and are shown in Figure 6. Figure 7 shows the histograms obtained for these images and Figure 8a shows the SIR measured with the ASTM C1701 test in the Spring of 2016 (a year before the images were taken) plotted against the inverse of the mean and the inverse of the median, of each image’s gray level. A plot using the median gray level is considered because the surface has a great deal of red color and red values tend to convert to lower gray values, thus, creating a distribution skewed to lower values. The median is not as affected by skewness as the mean.
The data sets used to create Figure 8 (the mean SIR data shown in Table 2) were tested with the Shapiro-Wilk test. The data for the 305 mm ring significantly deviated from a normal distribution (N = 5, p = 0.03) while the five data points for each of ring 203 mm and 406 mm ring sizes were normally distributed according to the test (p = 0.55 and p = 0.38, respectively). Figure 8b shows the same image analysis data but now related to the SIR values in Table 2 for the smaller and larger rings sizes. Thus, Figure 8b shows linear regression lines for the 203 mm and 406 mm ring sizes, but no line is shown for the 305 mm ring size in either Figure 8a,b.
Because the 305 mm ring size SIR measurements observed on the Porous Pave surface are not normally distributed, StadDirect® was used to conduct nonparametric linear regression on the medians of all gradients of the data to produce the following expressions:
where refers to the median and again SIR is in mm/min. Note that the slope coefficient seen in these two equations are medians. According to Kendall’s tau-b correlation procedure, the inverse mean gray level is significantly correlated with SIR305 (τb = 0.8, p = 0.05 for Equation (4)) but not for the inverse median gray level median (τb = 0.6, p = 0.142 for Equation (5)).
Equation (6) is the expression for the best-fit linear regression line in Figure 8b for the 203 mm ring (using data from Table 2) and Equation 7 corresponds to the 406 mm ring. Equations (8) and (9) are the nonparametric linear formulae.
The adjusted R2 for SIR203 in Equation (6) is 0.92 and the standard error of the estimate is 225 mm/min. The ANOVA analysis indicates the regression is significant (p = 0.007) as are the slope (p = 0.007) and constant (p = 0.009). The adjusted R2 on SIR406 in Equation (7) is 0.90 and the standard error of the estimate is 152 mm/min. This regression is also significant according to ANOVA with p = 0.01 as are the slope and constant (p = 0.013 and p = 0.01, respectively). The standardized residual statistics for Equations (6) and (7) are all within ±2 (results not shown here). Kendall’s tau-b correlation procedure showed that the inverse mean gray level is significantly correlated with SIR203 and SIR406 (τb = 0.8, p = 0.05 for both Equations (8) and (9)).
4. Discussion
4.1. Application of ASTM C1701 on the Porous Asphalt and Porous Pave Surfaces
The use of three different ring sizes on the porous asphalt produced data sets that were not significantly different for any of the three pair-wise comparisons using the Sample Sign test. The only significant difference in pairwise comparison was for the Porous Pave with the smaller ring size producing significantly different (generally higher SIR) values than the 305 mm or 406 mm ring sizes. This is consistent with Li et al. [25] but they tested rings of 300 mm or smaller. Winston et al. [18] demonstrated the benefits of covering a larger surface area in a test but that study was conducted with a falling head device on interlocking pavers. The result in this investigation suggest that for highly infiltrating surfaces such Porous Pave, using a 300 mm ring may be sufficient but it is important to note, that the 305 mm ring size produced higher ranges than those from the 406 mm ring data as seen in Table 2. Greater precision and lower variability is a desirable characteristic in SIR measurements particularly when dealing with such highly permeable surfaces such as provided by Porous Pave. Thus, a larger ring size is recommended for surfaces with such high infiltration rates.
4.2. ASTM vs. the Falling Head Test on Porous Pavement
The falling head test is seen repeatedly in the literature as a preferred method for testing SIR in permeable surfaces because the need to maintain a constant head can be difficult when infiltration rates are so high. The simple falling head device employed here produced significantly higher infiltration rates than the ASTM test, which is consistent with the literature [25,33]. The expected benefit of lower variability however, was not realized as the falling head test produced ranges lower than those seen in the ASTM test in only two cases in Table 3—Location 1 and the sample (and counter-intuitively, both had very high infiltration rates). This suggests that the ASTM test using a constant head is sufficient for a surface such as porous asphalt. Because the Porous Pave surface has even higher infiltration rates, the results suggest that a falling head test would be not be appropriate on such a surface.
The ASTM C1701 test was developed as a simple-to-use tool to get a starting point for surface infiltration in order to determine when maintenance would be required. Li et al. [25] notes that the NCAT permeameter is based on well-established falling head theory derived from Darcy’s law, but no specific theory or explanation is presented for the equation used in the ASTM C1701 method (Equation (1)). Equation (1) is simply the mass of water converted to a depth divided by the time it took for that water to infiltrate into the surface. Equation (1) is not intended to mimic Darcy’s Law, so while some may consider I in Equation (1) to be akin to the surface’s hydraulic conductivity measured under a constant head, the hydraulic gradient would have to be considered unity for the two equations to be equivalent. In addition, if a falling head test based on Darcy’s Law is to be used, then the appropriate equation should be used and laminar flow should be the predominant mode of flow. This is not the case for permeable pavements [24] and the high heads produced in a falling head test have the potential to lead to greater variability.
4.3. Use of Imagery to Estimate SIR in Porous Asphalt
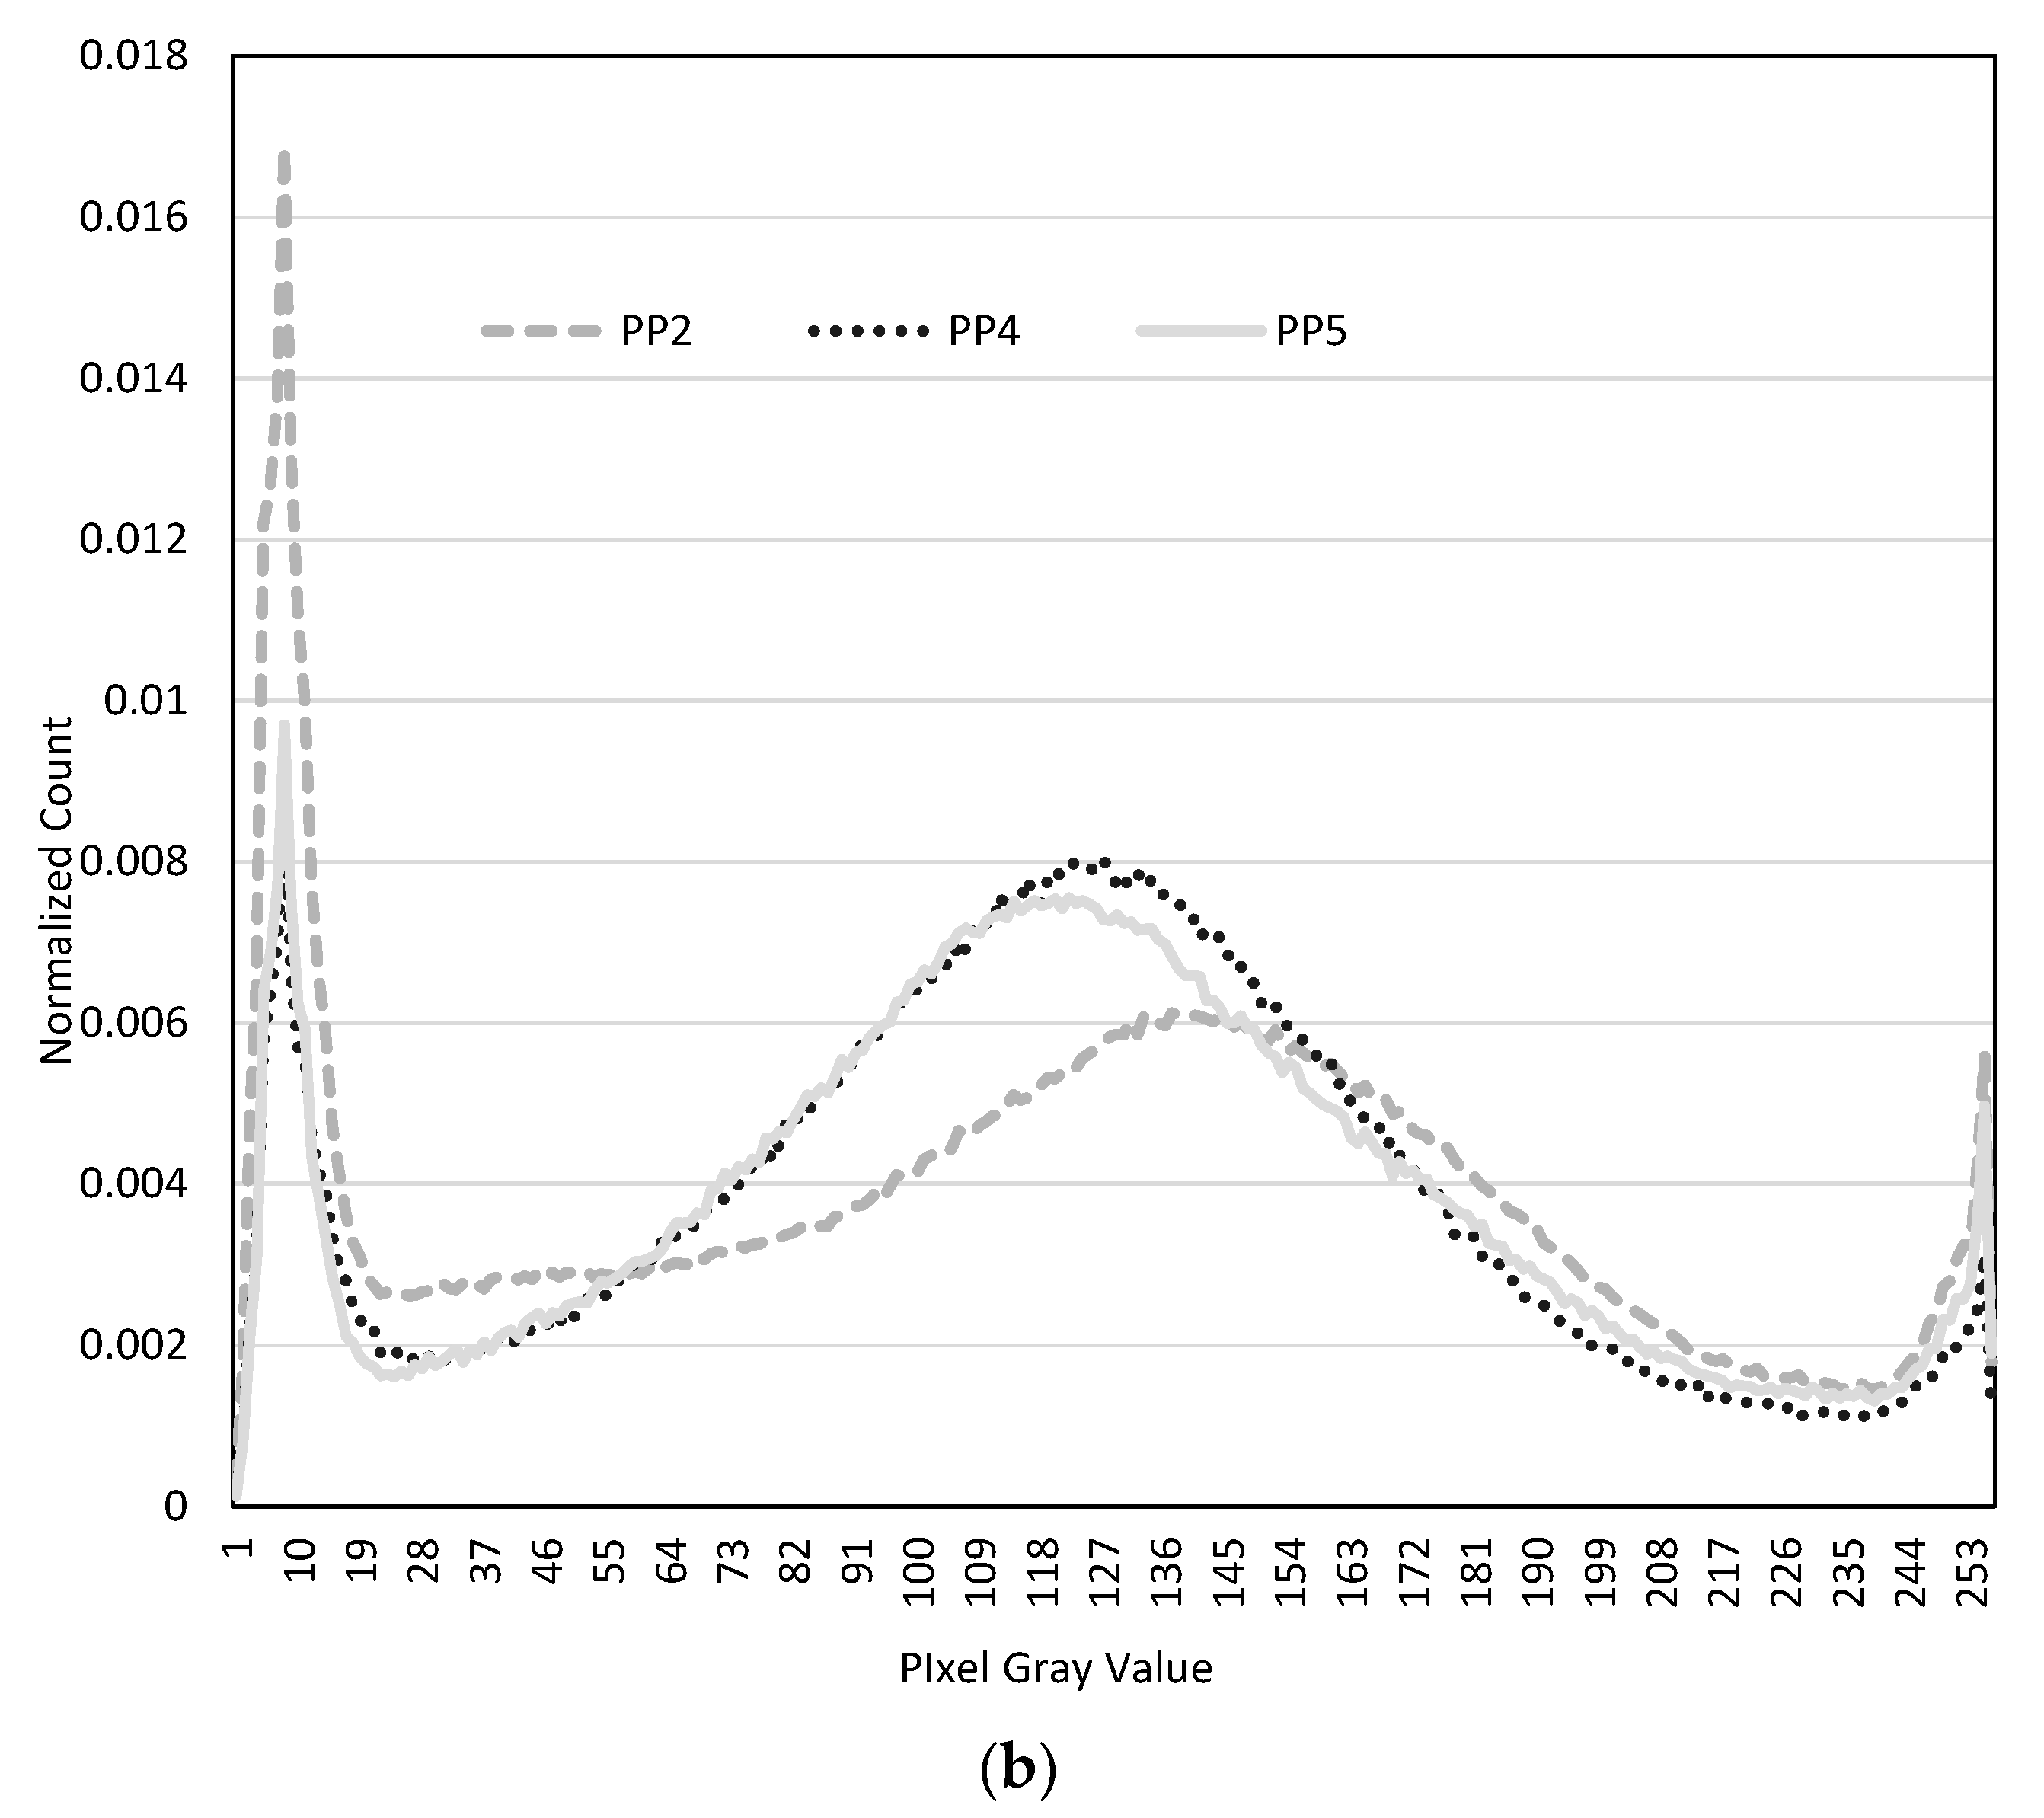
When viewing the imagery for test locations 1–5 of the porous asphalt in Figure 3, one can clearly see how location 4 is completely clogged (Figure 3d) and resulted in a zero measured infiltration rate (in the test, no water was observed to leave the device). The control sample, (Figure 3f) gives the highest SIR and is relatively dark all over and with the darkest pores. This is demonstrated in the histograms in Figure 4, where Figure 4b for PA4 has the highest mean gray level of 133 in comparison to the asphalt control sample that had one of the lowest mean gray levels of 113.7. The histogram for PA3 shown in 4a has a very high average gray level and lowest SIR next to PA4.
Figure 5 was created using the inverse of the mean gray level and not the actual mean gray level. The reason for this was because the SIR is inversely proportional to the number of seconds required to drain the mass of water under a constant head. The drainage is produced by the voids, i.e., the surface porosity, which are the darkest portions of the image. This drainage time is directly proportional to the porosity and inversely proportional to the mean gray level, which becomes higher as porosity decreases due to clogging [17]. The presumption here is that the image captures a representative area, and that the sediment leading to clogging creates enough of a change in pore reflectance to significantly change the histogram parameters. In this investigation, for the porous asphalt surface, the pores are darker than the clean porous asphalt surface particles and also darker than the sediment clogging the pores. If the sediment is actually darker than the surface material, this would likely lead to a decrease in mean gray level, and thus, any implementation of such a method would need to recognize the visual characteristics of the sediment locally and the change visually to a photograph that results from clogging by the sediment. Another issue to note is that the images seen in Figure 3 show silicone residue from previous testing that could not be removed. The net effect of this silicone would be to increase the mean gray level, which would translate into a decrease in SIR. This is not unreasonable as the silicone would in fact inhibit infiltration of water. However, the amount of silicone in terms of number of pixels (over 6 million for each image) constitutes a small percentage of the image, and consequently, the impact to the mean gray level would be insignificant.
Linear regressions were attempted using both the ASTM data and the falling head data (creating Equations (2) and (3)). Both relationships produced the same coefficient of determination. This suggests that while the falling head test and the ASTM test produced significantly different values, the change in SIR measured within different locations was consistent within each method and this change, is consistently captured by the image parameters. That is to say, that the sensitivity of this imaging method, is comparable with the sensitivity in both the ASTM test method and the falling head method. The fact that both tests produced excellent relationships with the same images seems to indicate that this non-contact method can provide as reasonable an estimate of SIR as either contact method.
One might argue that the images, which are taken before the pre-wetting, should actually be compared to the times recorded during the pre-wetting phase. When regression relationships were developed for both the ASTM and the falling head test pre-wetting times, both produced poorer coefficients of determination (results not shown) confirming Brown and Sparkman’s [23] assertion that pre-wetting is essential to repeatability.
4.4. Use of Imagery from Porous Pave Surface as a Measure of SIR
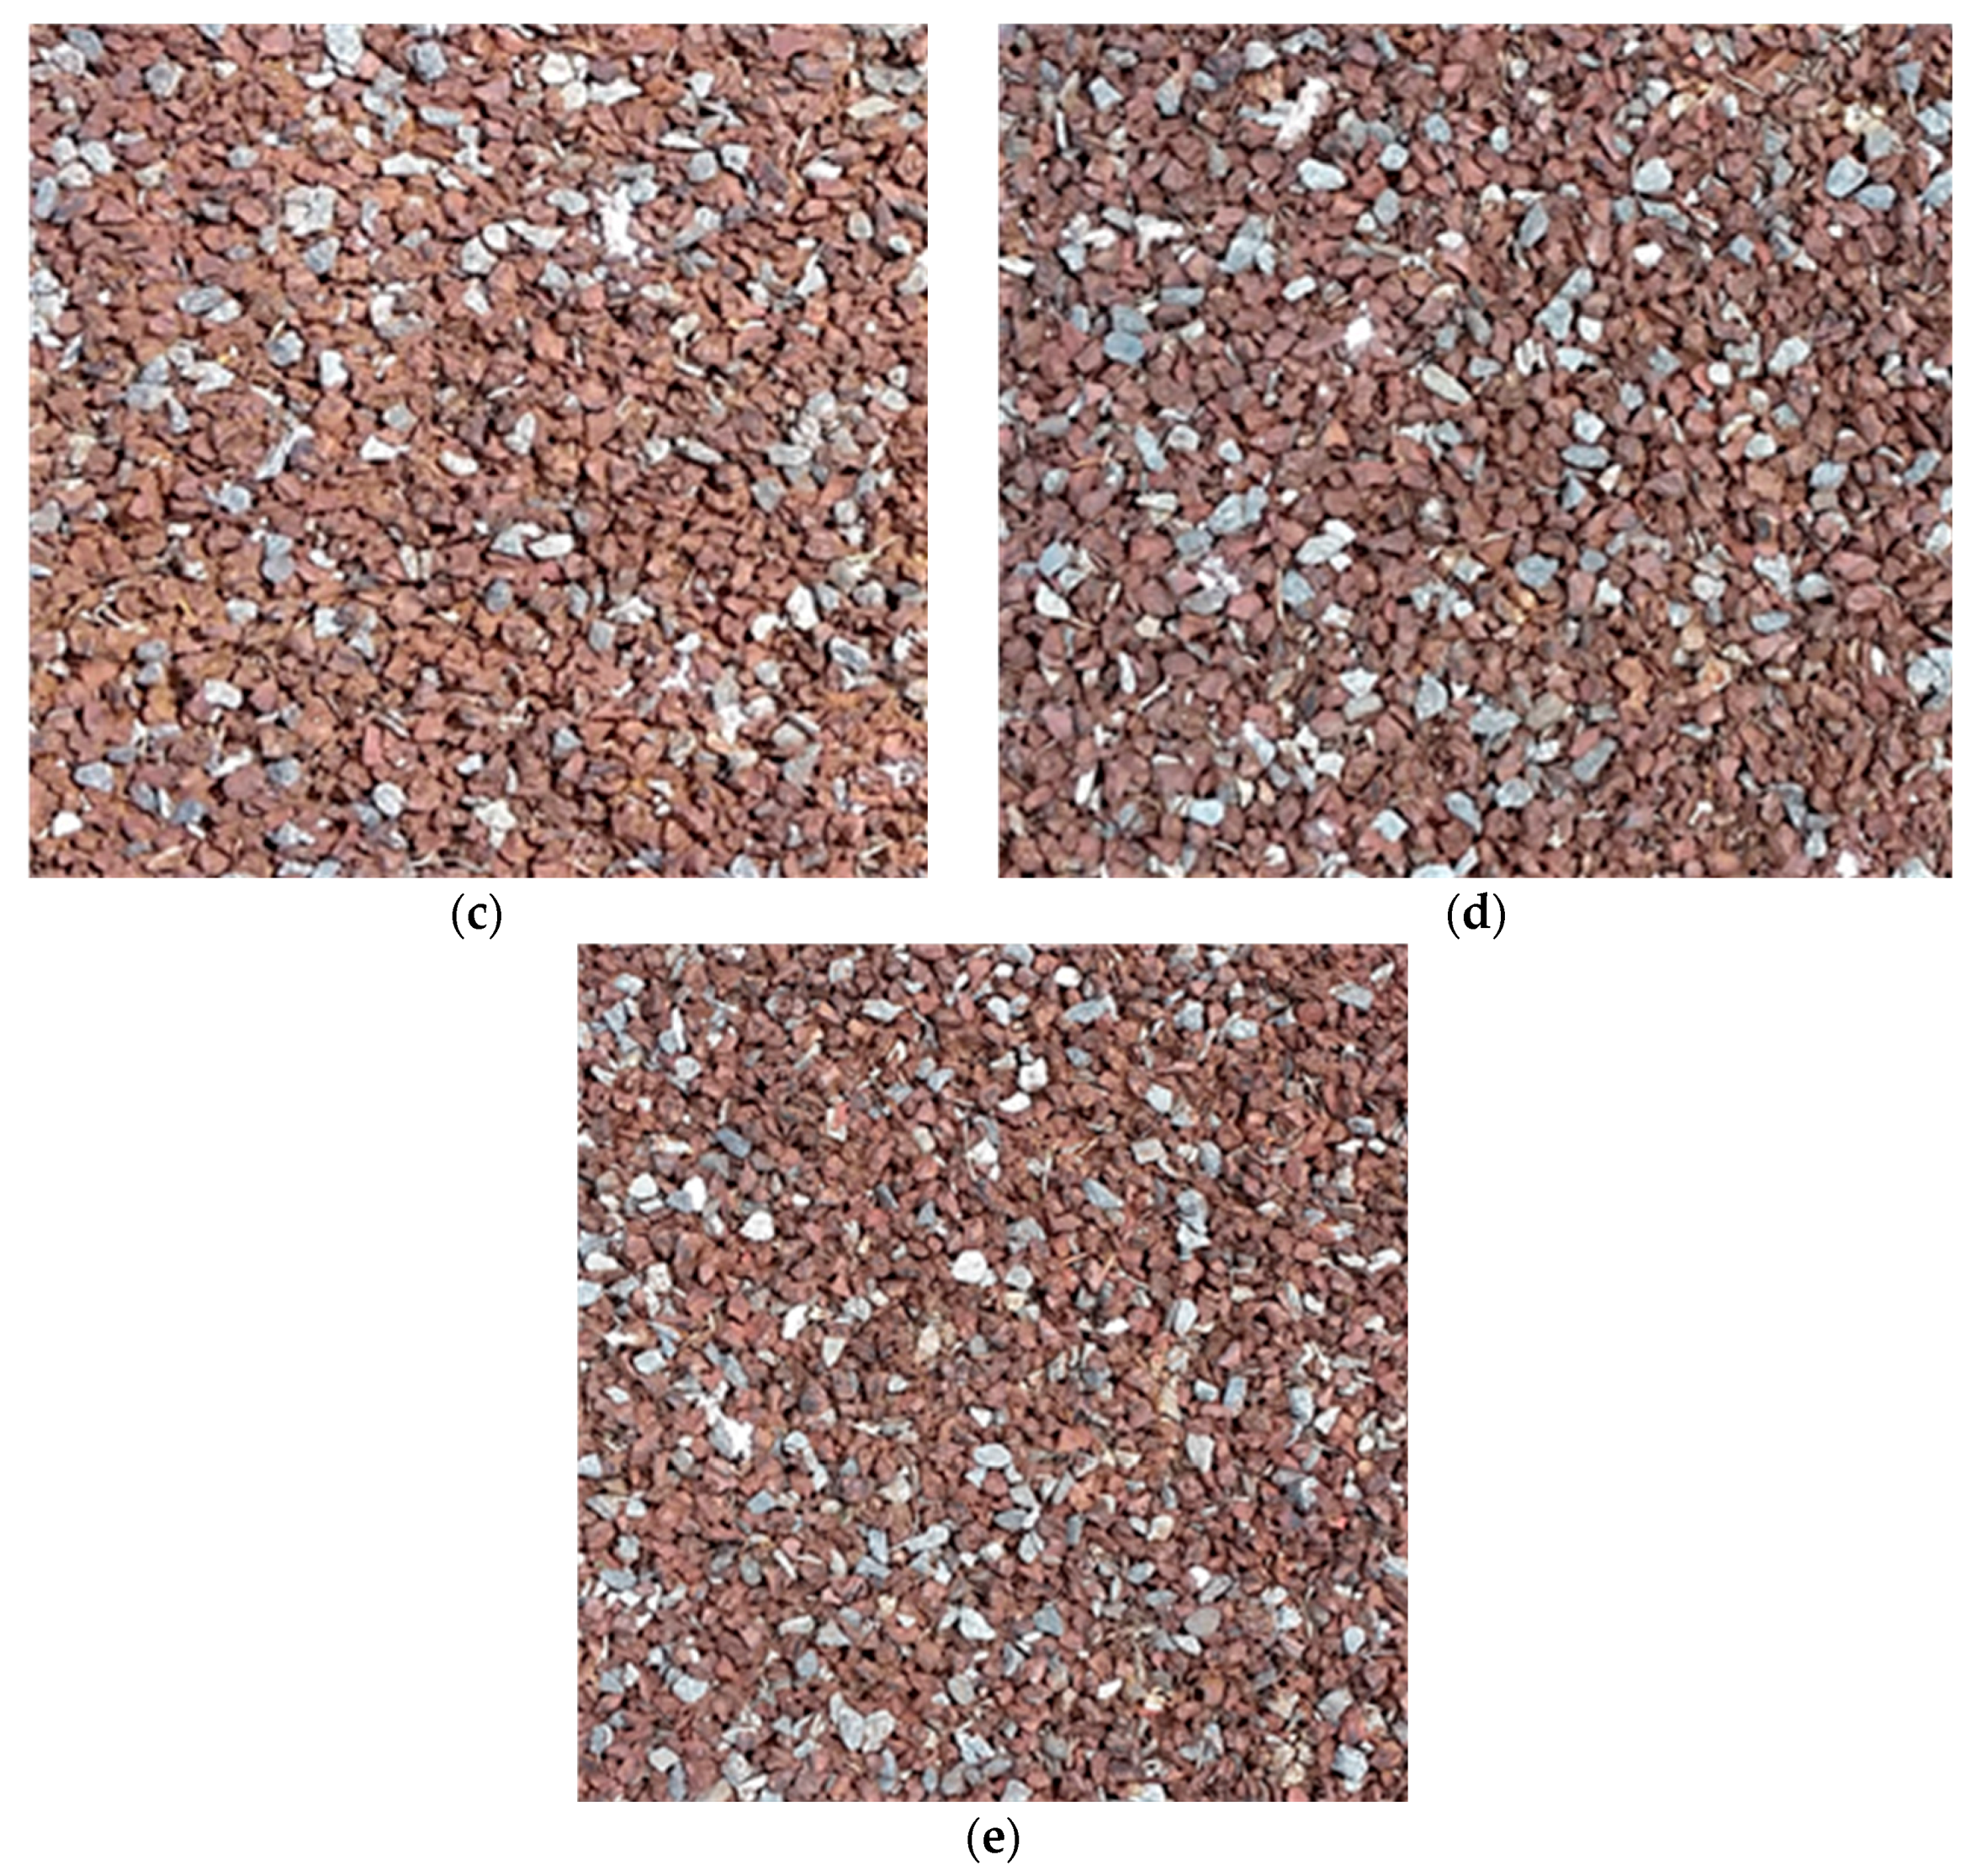
The interesting part of this analysis is that the photographs of the Porous Pave locations were taken one whole year after the ASTM tests were conducted (the results shown in Table 2 were used in comparison to the images in Figure 6). Note that the images in Figure 6 are cropped quite close to the center of the test location to exclude portions of silicone that remain on this surface, but some silicone still remains from tests conducted for the 203 mm ring. The Porous Pave material must be installed in dry weather. If at any point during the installation, rainfall or water contacts the surface before the installation has completely cured (which is done in a very short amount of time), the binder reacts with the water and immediately solidifies to a hard, yellow mass creating a near impenetrable surface. This is evident in the image for location 3, which contains much more yellow than red as in the other images. Porous Pave locations 1 and 3 are two of the yellowest locations and consequently have two of the lowest infiltration rates.
Because of the lack of normality in the distribution of most of the Porous Pave SIR data, nonparametric regression was created for the inverse median gray level (Equation (5)) and the inverse of the mean gray level (Equation (4)) obtained using the 305 mm ring. The data are plotted in Figure 8a. Even though the histograms in Figure 7 show heavy tails on the low side of the gray value, there is no evidence to suggest that the median gray level instead of the mean will produce a better relationship. The Kendall’s tau-b procedure showed that the correlation between the inverse mean gray level and mean SIR is significant for the 305 mm ring size, but the relationship to the median was not significant.
Because the mean data seen in Table 2 for the 406 and 203 mm ring sizes were shown to be normally distributed, these data were plotted in Figure 8b and both parametric and nonparametric linear regressions were computed. Equations (6) and (7) produced surprisingly high coefficients of determination, suggesting that imagery may provide a useful surrogate for relative surface infiltration in this type of surface. The nonparametric equations shown in Equations (8) and (9) were produced as a contrast to Equations (6) and (7). The data set is very small but both the parametric linear regression and the nonparametric linear regression produced similar values of slope and constant for each ring size with the correlation for the nonparametric regression being significant.
The Porous Pave surface has a very specific, and somewhat unique appearance in comparison to other conventional permeable surfaces, which tend to be white, gray or black in color. While the data set is very small, the variation in SIR measured with the ASTM is comparable to the variation in the mean gray level as seen in the histograms of Figure 7. This suggests that for this surface color and sediment color for the region, image analysis is sensitive enough to pick up changes in SIR in this type of pavement.
4.5. Using the ASTM Test with Image Analysis
The results of this research seem to confirm the utility of the ASTM C1701 standard as an indication of surface infiltration in porous asphalt, and innovative materials such as Porous Pave, in addition to pervious concrete for which it was designed. Neither the falling head test, nor other ring sizes provide any indication of being better alternatives for porous asphalt but a larger ring size may be a good suggestion for Porous Pave and other high infiltration areas (as found in Winston et al. [18]).
The parameters determined in the image analysis, a very simple analysis of cellphone pictures, seems to produce a reasonable agreement to the data collected using the ASTM method. To that end, the image analysis when used in conjunction with ASTM C1701 would be a good method to provide home owners a tool to determine the degradation in surface infiltration from an initial starting point. The results of the image analysis though are limited by several factors. Each image should be taken with the similar levels of lighting in order to provide the same contrast across the surface as in previous images. Each image should be similar in size in order to avoid over- or under-sampling. Likely the user can calibrate their initial image with a single ASTM C1701 test on various locations. This would then be followed by images taken at the same locations and analyzed for their inverse mean values to determine the relative rate of degradation. The equations produced would likely be pavement and region specific but would likely hold over time once the initial image was calibrated. This would avoid the need to bring water out to the site, use silicone or plasticine, and conduct a series of tests over dry weather to be averaged.
5. Conclusions
This research investigated the impact of in situ, contact test methods for measuring SIR on two highly permeable pavement surfaces—a fiber-reinforced porous asphalt and a highly permeable surface material known as Porous Pave. The methods tested were the ASTM C1701 with a 305 mm ring size, a 203 mm ring size and a 406 mm ring size. In addition, a simple falling head test device was created but only tested on the porous asphalt. All the results indicate that the ASTM C1701 standard test that was originally devised for porous concrete can produce reasonable estimates of SIR for both these two types of surfaces, which corroborates with results from the literature [25].
The ASTM C1701 method is still a contact method that is cumbersome to use, and thus, acquiring numerous estimates of SIR over large surface areas is often impractical. Because surface infiltration is largely the result of surface clogging, visual inspection should be a suitable method for providing information on the degree of clogging in certain contexts (pavement color and sediment color). Cell-phone photographs were taken of both surfaces investigated in this work and the inverse of the mean gray level was shown to be highly correlated with mean SIR determined using the ASTM method and the falling head test in the porous asphalt surface. The falling head test and the ASTM method proved to be significantly different but the fact that both methods produced very good linear relationships with image parameters over a number of locations on the surface, indicates that a visual, non-contact method can reproduce the sensitivity of both methods. In both linear regressions, the coefficient of determination was quite high thus suggesting that the mean gray level is a suitable image analysis parameter to indicate level of surface clogging. However, it should be recognized that the inverse of the mean was used because SIR was calculated. An easier approach would be to simply correlate the mean itself with the time in seconds to drain, which in turn is directly proportional to porosity (if this measure can be obtained in the field). This would avoid the large regression coefficients that result when using the inverse of a mean of the distribution with so many pixels and the mean SIR in mm/minute.
The ASTM C1701 test method was used on the Porous Pave material, which is a different type of material with one of the highest infiltration rates available for permeable pavements. The image analysis using photos taken a year after the tests were conducted, also produced a high coefficient of determination of 0.95 when using a ring size of 406 mm. This could lead to the development of a cellphone application by which a homeowner interested in implementing permeable pavements in their homestead can simply use their cellphone camera to monitor the degradation in surface infiltration over time. This can potentially lead to a simple cell phone application that allows any user to determine the maintenance requirements of their low impact development.
The limitations of the investigation arise from the low numbers of data collected and the fact that testing was conducting on only one surface in the field of each type. Therefore, it is highly recommended that future work collect further image analysis data in conjunction with in situ SIR measurements with the ASTMC1701 method over numerous locations, a variety of pavement surfaces and over long periods of time in order to monitor the impact on degradation of SIR and change in image parameters. Other image analysis parameters should be investigated to determine if a more sensitive parameter is more appropriate depending on the surface type, color and clogging sediment characteristics.
Acknowledgments
The authors would like to thank the anonymous Reviewers for their insightful suggestions. This research was supported by the University of Victoria, the Canadian Foundation for Innovation, and the National Science and Engineering Research Council of Canada. The authors would also like to thank the generous in-kind donation of Porous Pave Incorporated, Island Asphalt, Brico Services, Butler Brothers, The Grounds Department within Facilities Management at the University of Victoria, graduate students Zhiying Xu and Fahad Shazad for assistance in collecting data as well as undergraduate students Mitch Jernslet, Brendan Kumar, Adrian Hou, Erin Janzen, Scott Jensen, and Laura Smandel. Thanks to Civil Engineering Laboratory Manager Armando Tura.
Author Contributions
C.V. and R.G. conceived, designed and supervised the experiments, C.V. analyzed the data and both authors wrote the paper.
Conflicts of Interest
The authors declare no conflict of interest.
Appendix A
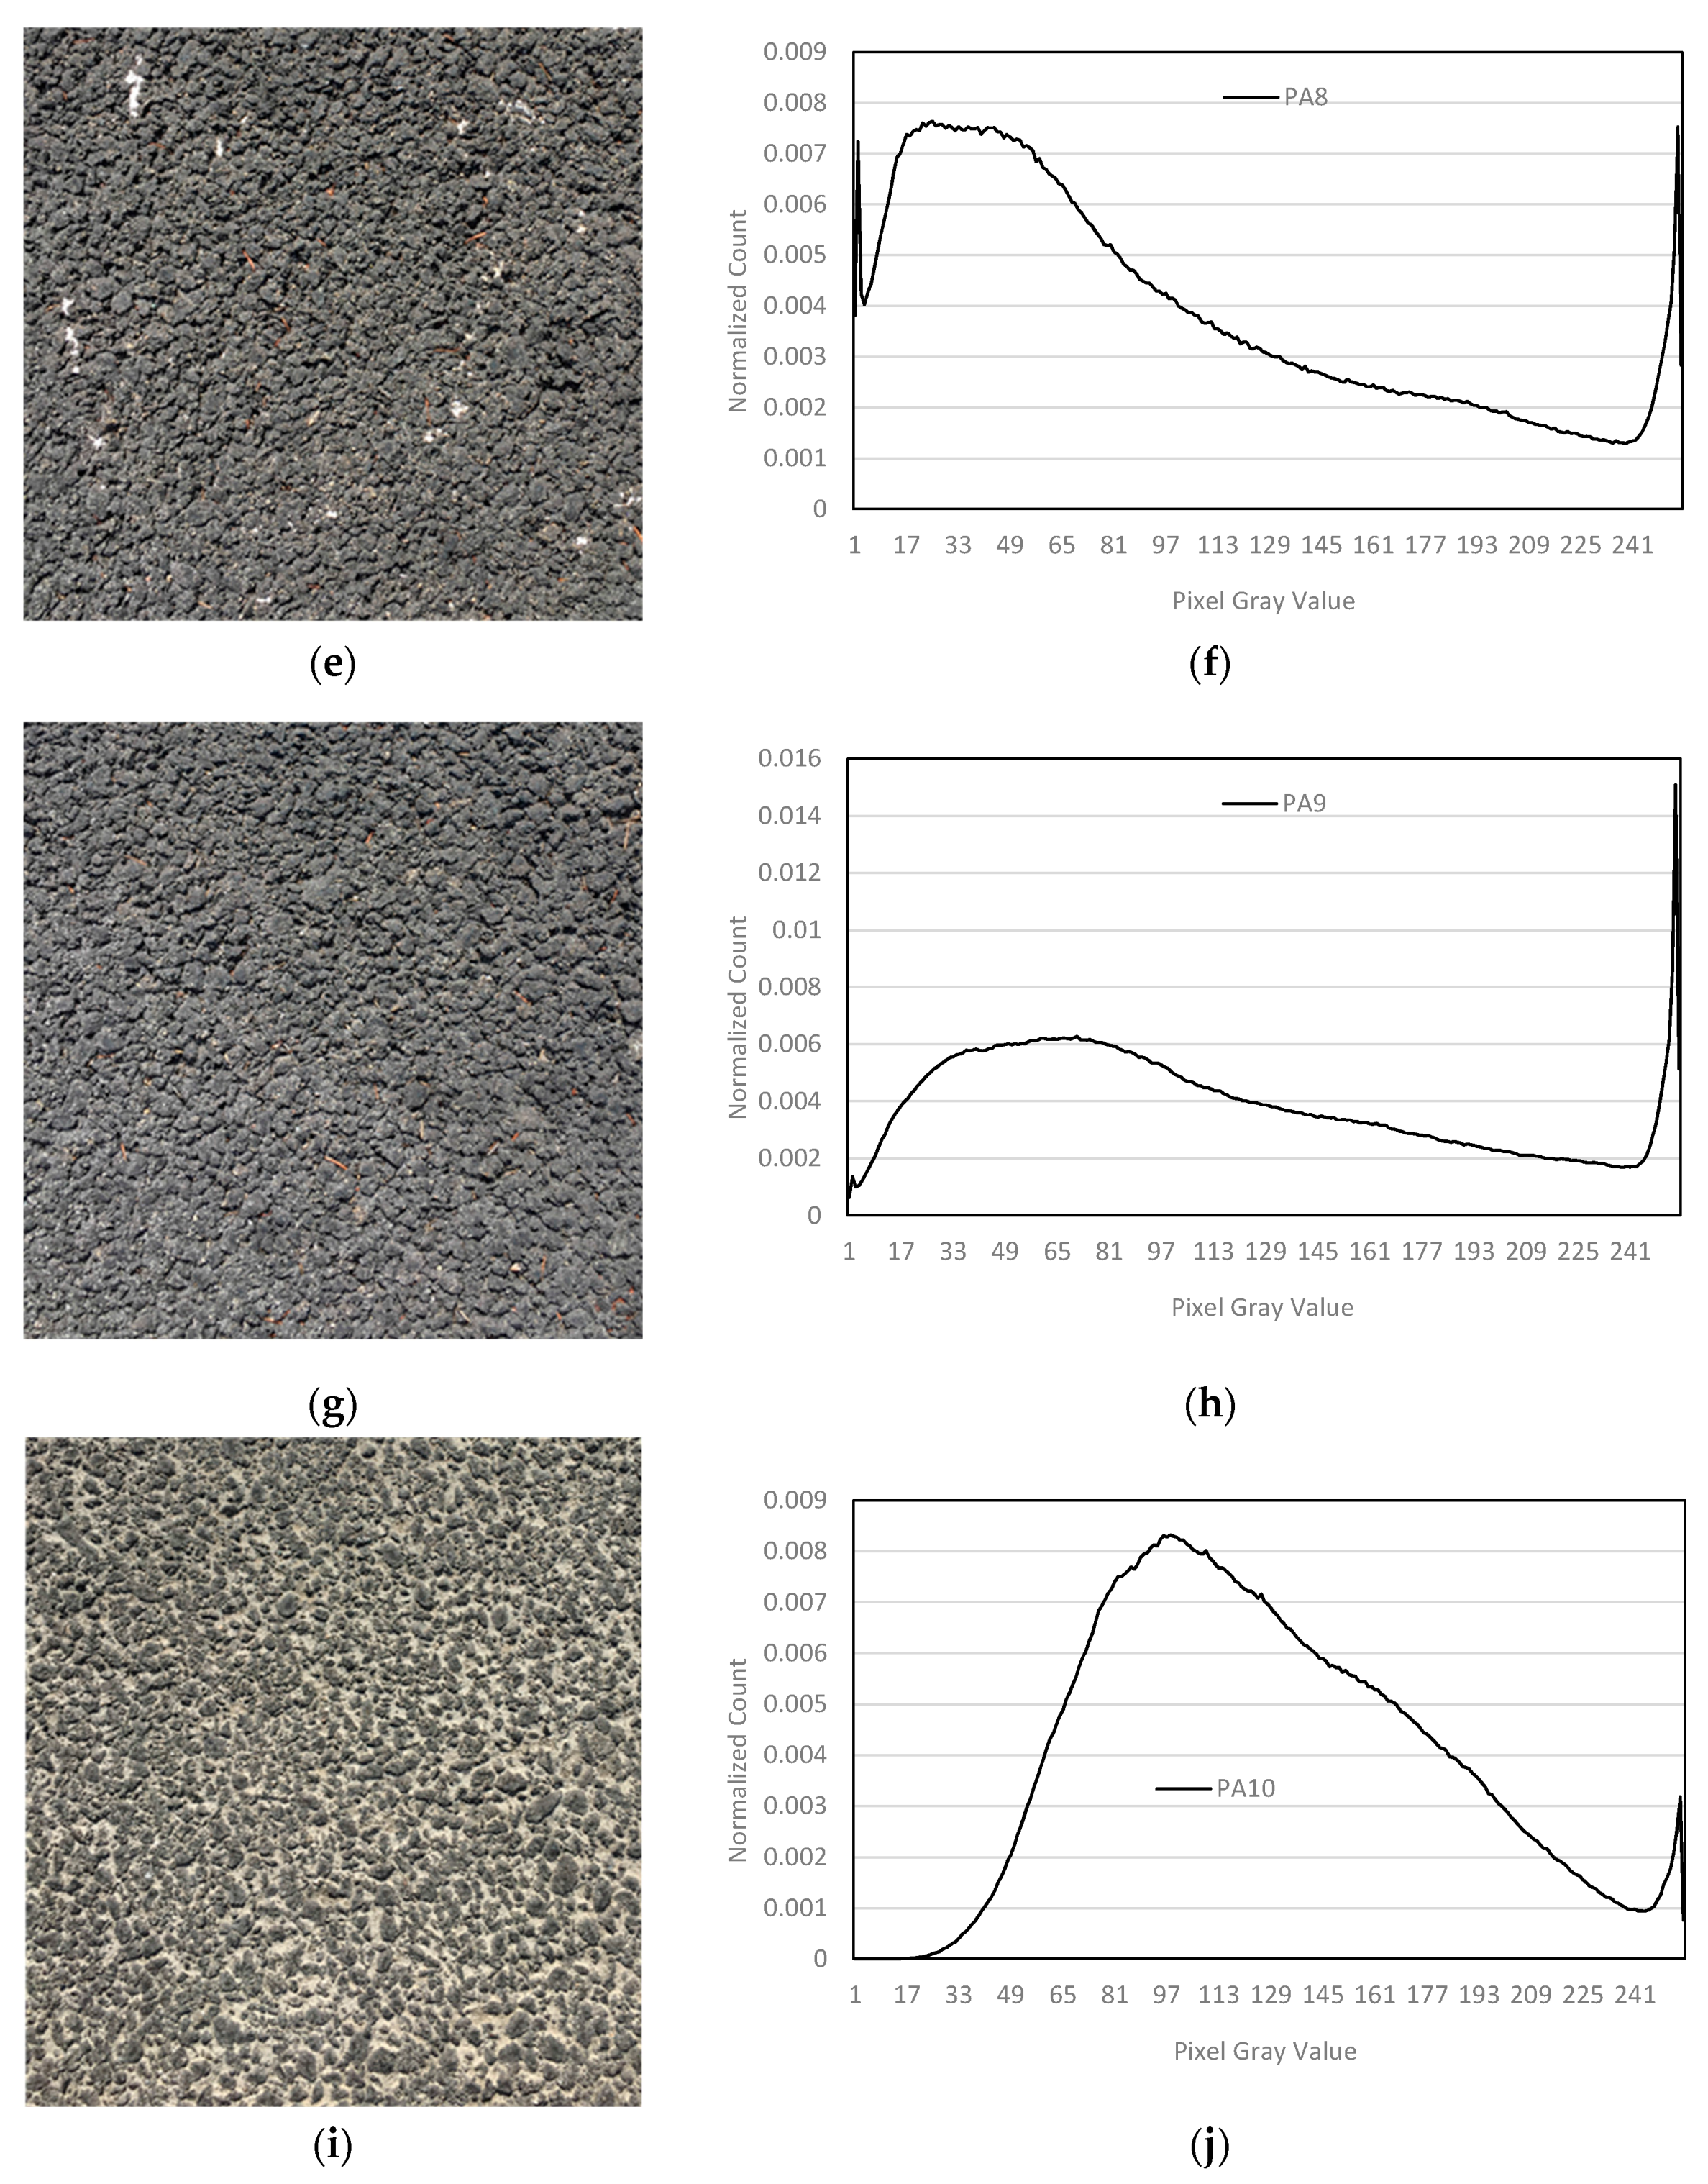
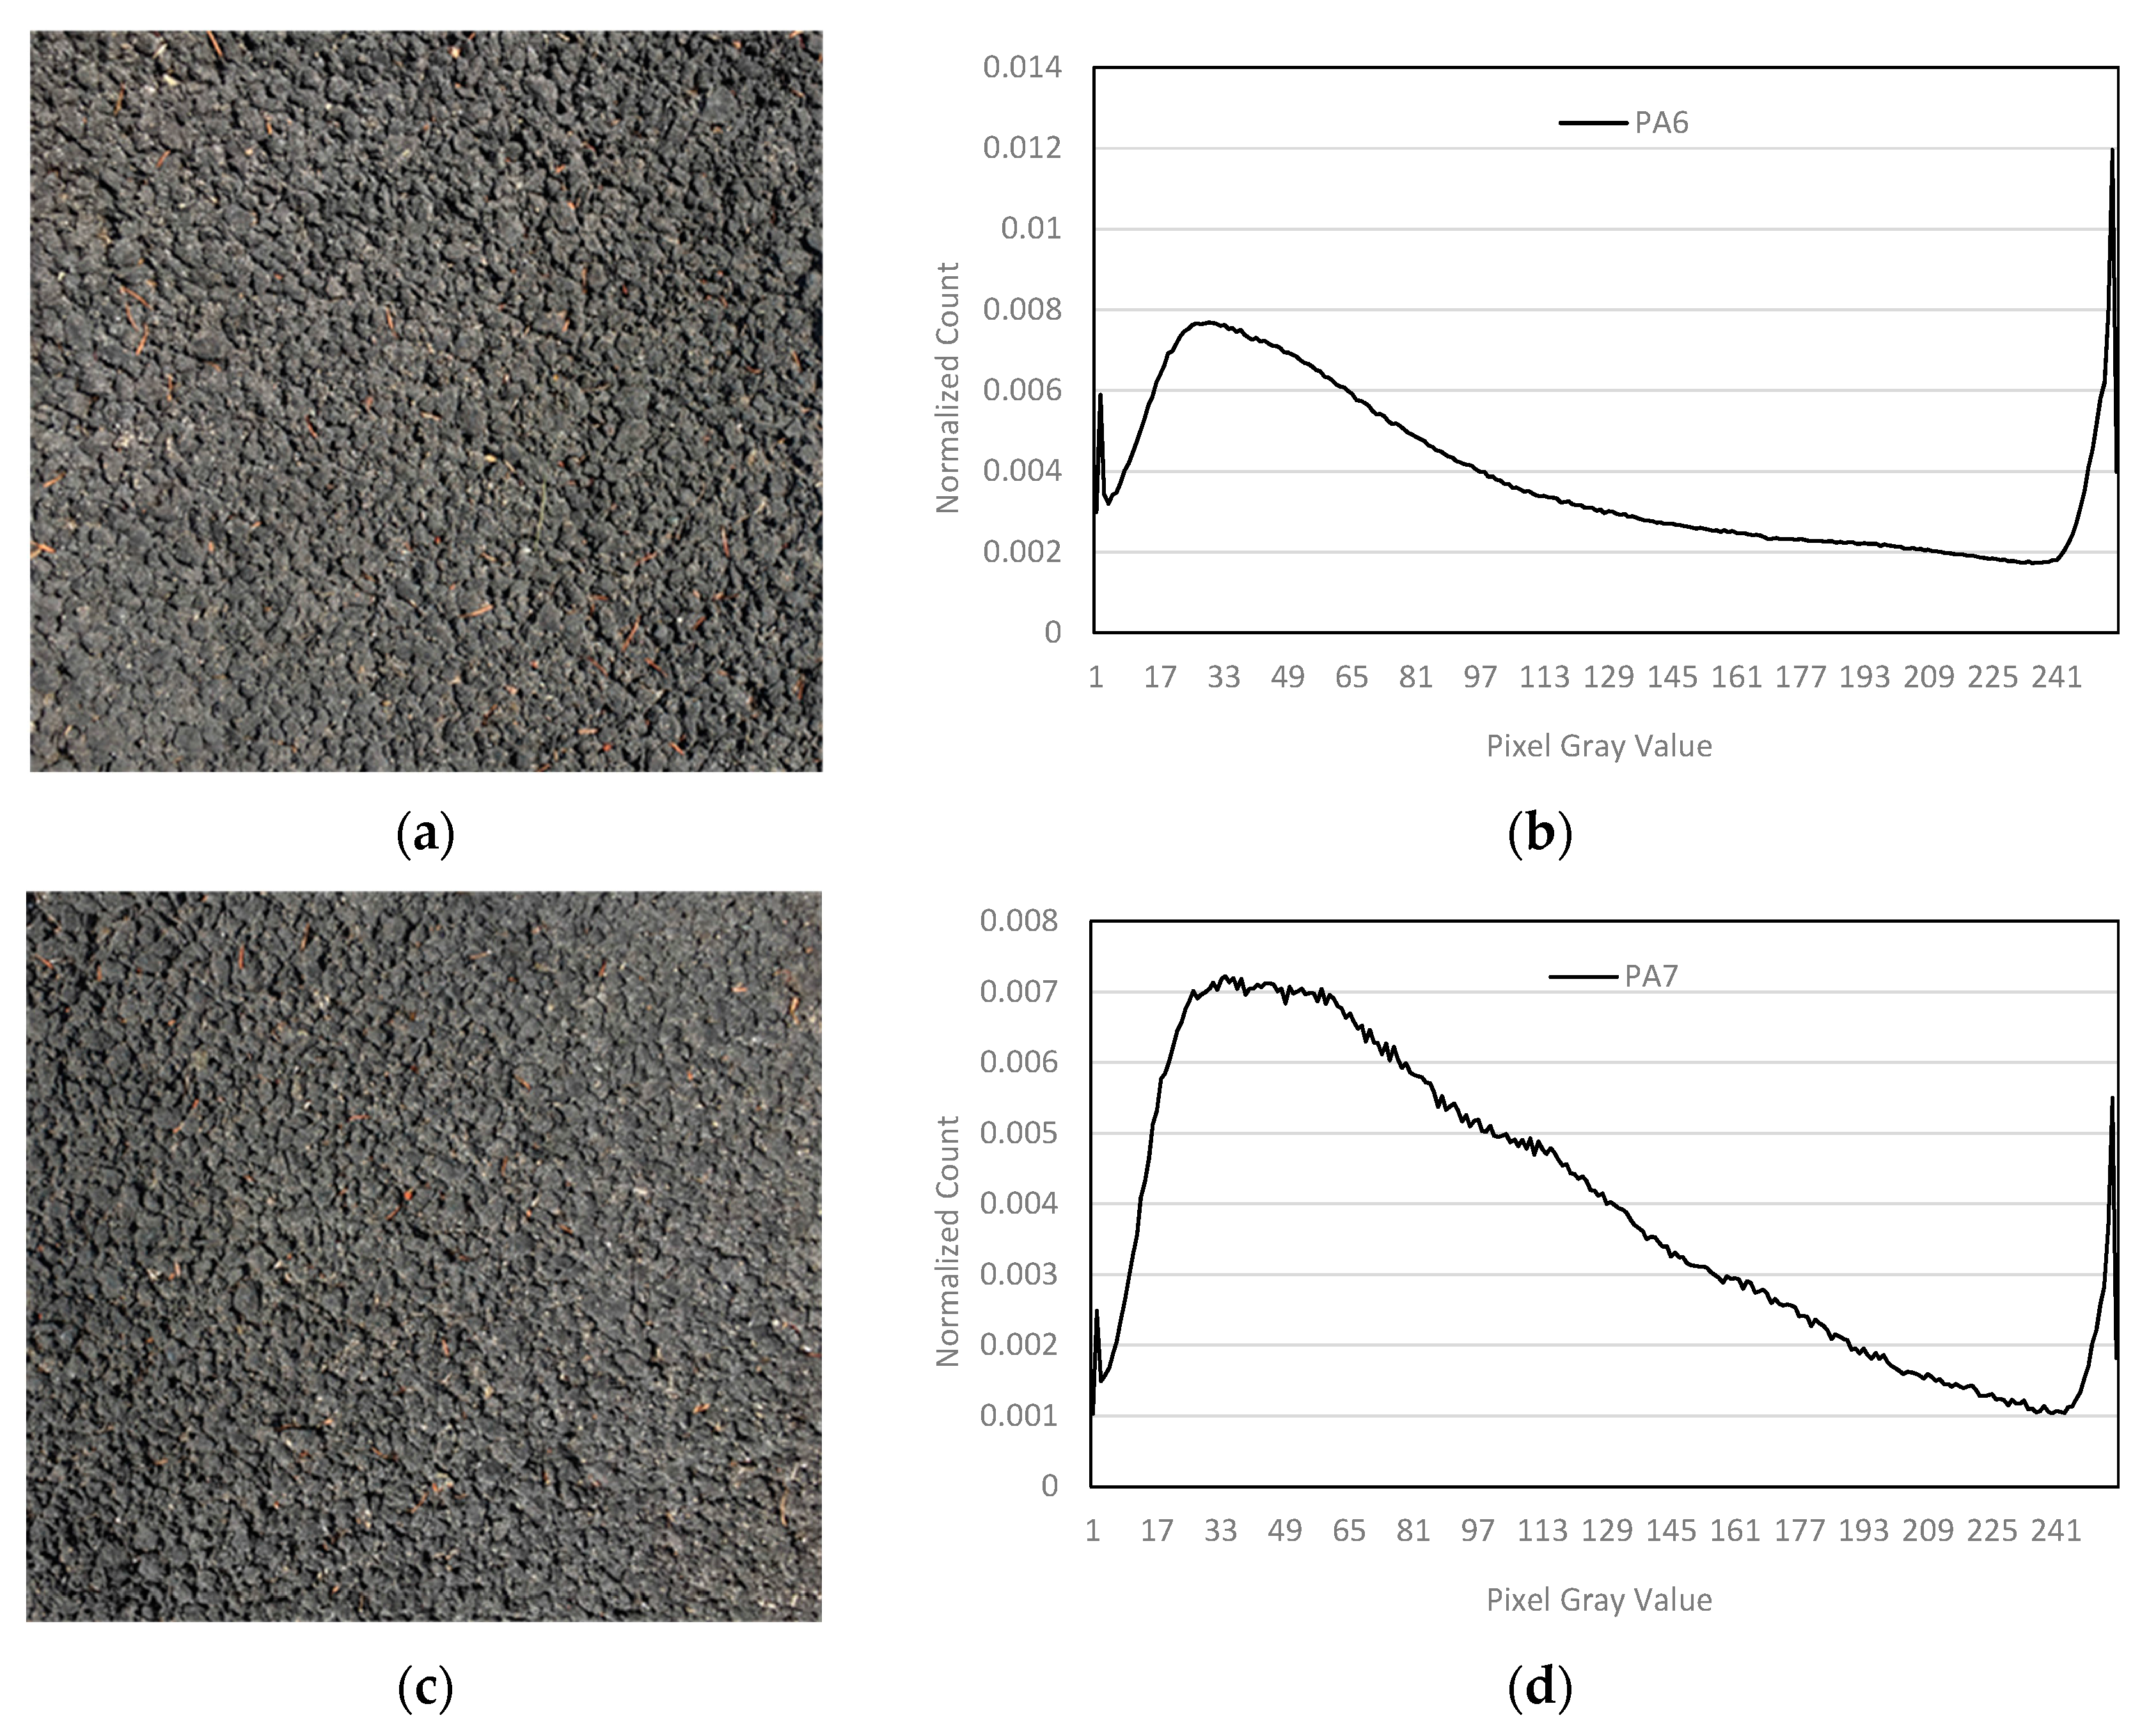
Figure A1.
Images acquired with a cell phone camera on the porous asphalt site and corresponding gray level image histogram for: location 6 in (a,b), respectively; location 7 in (c,d), respectively; location 8 in (e,f), respectively; location 9 in (g,h), respectively; and on location 10 in (i,j), respectively.

References
- Brattebo, B.O.; Booth, D.B. Long-Term Stormwater Quantity and Quality Performance of Permeable Pavement Systems. Water Res. 2003, 37, 4369–4376. [Google Scholar] [CrossRef]
- Sansalone, J.; Kuang, X.; Ranieri, V. Permeable Pavement as a Hydraulic and Filtration Interface for Urban Drainage. J. Irrig. Drain. Eng. 2008, 134, 666–674. [Google Scholar] [CrossRef]
- LeFevre, N.J.; Watkins, D.W.; Gierke, J.S.; Brophy-Price, J. Hydrologic Performance Monitoring of an Underdrained Low-Impact Development Storm-Water Management System. J. Irrig. Drain. Eng. 2009, 136, 333–339. [Google Scholar] [CrossRef]
- Pezzaniti, D.; Beecham, S.; Kandasamy, J. Influence of Clogging on the Effective Life of Permeable Pavements. Water Manag. 2009, 162, 211–220. [Google Scholar] [CrossRef]
- Roseen, R.M.; Ballestero, T.P.; Houle, J.J.; Briggs, J.F.; Houle, K.M. Water Quality and Hydrologic Performance of a Porous Asphalt Pavement as a Storm-Water Treatment Strategy in a Cold Climate. J. Environ. Eng. 2011, 138, 81–89. [Google Scholar] [CrossRef]
- Huang, J.; Valeo, C.; He, J.; Chu, A. Winter Performance of Interlocking Pavers—Stormwater Quantity and Quality. Water 2012, 4, 995–1008. [Google Scholar] [CrossRef]
- Huang, J.; Valeo, C.; He, J.; Chu, A. Three Types of Permeable Pavements in Cold Climates: Hydraulic and Environmental Performance. J. Environ. Eng. 2016, 142. [Google Scholar] [CrossRef]
- Winston, R.J.; Davidson-Bennett, K.M.; Buccier, K.M.; Hunt, W.F. Seasonal variability in stormwater quality treatment of permeable pavements situated over heavy clay and in a cold climate. Water Air Soil Pollut. 2016, 227, 140. [Google Scholar] [CrossRef]
- Bean, E.Z.; Hunt, W.F.; Bidelspach, D.A. Evaluation of four permeable pavement sites in eastern North Carolina for runoff reduction and water quality impacts. J. Irrig. Drain. Eng. 2007, 133, 583–592. [Google Scholar] [CrossRef]
- Drake, J.; Bradford, A.; Van Seters, T. Stormwater quality of spring-summer-fall effluent from three partial-infiltration permeable pavement systems and conventional asphalt pavement. J. Environ. Manag. 2014, 139, 69–79. [Google Scholar] [CrossRef] [PubMed]
- Brown, R.A.; Line, D.E.; Hunt, W.F. LID Treatment Train: Pervious Concrete with Subsurface Storage in Series with Bioretention and Care with Seasonal High Water Tables. J. Environ. Eng. 2011, 138, 689–697. [Google Scholar] [CrossRef]
- Brown, C.; Chu, A.; Van Duin, B.; Valeo, C. Characteristics of Sediment Removal in Two Types of Permeable Pavement. Water Qual. Res. J. Can. 2009, 44, 59–70. [Google Scholar]
- Tan, S.; Fwa, T.; Han, C. Clogging Evaluation of Permeable Bases. J. Transp. Eng. 2003, 130, 1008–1020. [Google Scholar] [CrossRef]
- Yong, C.; McCarthy, D.; Deletic, A. Predicting Physical Clogging of Porous and Permeable Pavements. J. Hydrol. 2013, 481, 48–55. [Google Scholar] [CrossRef]
- Scholz, M.; Grabowiecki, P. Review of permeable pavement systems. Build. Environ. 2007, 42, 3830–3836. [Google Scholar] [CrossRef]
- Brown, R.A.; Borst, M. Evaluation of Surface Infiltration Testing Procedures in Permeable Pavement Systems. J. Environ. Eng. 2014, 140, 4014001. [Google Scholar] [CrossRef]
- Kayhanian, M.; Anderson, D.; Harvey, J.T.; Hones, D.; Muhunthan, B. Permeability measurement and scan imaging to asses clogging of pervious concrete pavements in parking lots. J. Environ. Manag. 2012, 95, 114–123. [Google Scholar] [CrossRef] [PubMed]
- Winston, R.J.; Al-Rubaei, A.M.; Blekcken, G.T.; Hunt, W.F. A simple infiltration test for determination of permeable pavement maintenance needs. J. Environ. Eng. 2016, 142, 06016005. [Google Scholar] [CrossRef]
- Fwa, T.F.; Tan, S.A.; Chuai, C.T.; Guwe, Y.K. Expedient Permeability Measurement for Porous Pavement Surface. Int. J. Pavement Eng. 2001, 2, 259–270. [Google Scholar] [CrossRef]
- Cooley, L.A.; Brown, E.R. Selection and evaluation of field permeability device for asphalt pavements. Transp. Res. Rec. 2000, 1723, 73–81. [Google Scholar] [CrossRef]
- ASTM International. Standard Test Method for Infiltration Rate of in Place Pervious Concrete; C1701/C 1701M-09; ASTM International: West Conshohocken, PA, USA, 2009. [Google Scholar]
- ASTM International. Standard Test Method for Surface Infiltration Rate of Permeable Unit Pavement Systems; C1781/C1781M-14a; ASTM International: West Conshohocken, PA, USA, 2014. [Google Scholar]
- Brown, H.J.; Sparkman, A. The Development, Implementation and Use of ASTM C1701 Field Infiltration of in Place Pervious Concrete. In Pervious Concrete; Brown, H.J., Offenberg, M., Eds.; ASTM International: West Conshohocken, PA, USA, 2012; pp. 69–79. [Google Scholar] [CrossRef]
- Dougherty, M.; Hein, M.; Martina, B.; Ferguson, B. Quick Surface Infiltration Test to Assess Maintenance Needs on Small Pervious Concrete Sites. J. Irrig. Drain. Eng. 2011, 137, 553–563. [Google Scholar] [CrossRef]
- Li, H.; Kayhanian, M.; Harvey, J.T. Comparative field permeability measurement of permeable pavements using ASTM C1701 and NCAT permeameter methods. J. Environ. Manag. 2013, 118, 144–152. [Google Scholar] [CrossRef] [PubMed]
- Boogaard, F.; Lucke, T.; van de Giesen, N.; van de Ven, F. Evaluating the infiltration performance of eight dutch permeable pavements using a new full-scale infiltration testing method. Water 2014, 6, 2070–2083. [Google Scholar] [CrossRef]
- Nichols, P.W.; Lucke, T.; Dierkes, C. Comparing Two Methods of Determining Infiltration Rates of Permeable Interlocking Concrete Pavers. Water 2014, 6, 2353–2366. [Google Scholar] [CrossRef]
- Lucke, T.; Boogaard, F.; van de Ven, F. Evaluation of a new experimental test procedure to more accurately determine the surface infiltration rate of permeable pavement systems. Urban Plan. Transp. Res. 2014, 2, 22–35. [Google Scholar] [CrossRef]
- Lucke, T.; White, R.; Nichols, P.; Borgwardt, S. A simple field test to evaluate the maintenance requirements of permeable interlocking concrete pavements. Water 2015, 7, 2542–2554. [Google Scholar] [CrossRef]
- Huang, J.; He, J.; Valeo, C.; Chu, A. Temporal Evolution Modeling of Hydraulic and Water Quality Performance of Permeable Pavements. J. Hydrol. 2016, 533, 15–27. [Google Scholar] [CrossRef]
- Bean, E.Z.; Hunt, W.F.; Bidelspach, D.A. Field Survey of Permeable Pavement Surface Infiltration Rates. J. Irrig. Drain. Eng. 2007, 133, 249–255. [Google Scholar] [CrossRef]
- Kumar, K.; Kozak, J.; Hundal, L.; Cox, A.; Zhang, H.; Granato, T. In-situ infiltration performance of different permeable pavements in an employee used parking lot—A four-year study. J. Environ. Manag. 2016, 67, 8–14. [Google Scholar] [CrossRef] [PubMed]
- Qin, Y.; Yang, H.; Deng, Z.; He, J. Water permeability of pervious concrete is dependent on the applied pressure and testing methods. In Advances in Materials Science and Engineering; Hindawi Publishing Corporation: Cairo, Egypt, 2015; Volume 6. [Google Scholar] [CrossRef]
- Mishra, K.; Zhuge, Y.; Karunasena, W. Clogging mechanism of permeable concrete: A review. In Proceedings of the Conference paper in Understanding Concrete Conference, Gold Coast, Australia, 16–18 October 2013; Volume 10. Available online: http://eprints.usq.edu.au/24554 (accessed on 5 November 2017).
- Obaidat, M.T.; Ghuzlan, K.A.; Alawneh, M.M. Analysis of volumetric properties of bituminous mixtures using cellular phones and image processing techniques. Can. J. Civ. Eng. 2017, 44, 715–726. [Google Scholar] [CrossRef]
- Porous Pave Inc. General Specifications. Available online: http://www.porouspaveinc.com/wp-content/uploads/General-Specifications.pdf (accessed on 22 February 2016).
Figure 1.
(a) The HAL field site for testing permeable surfaces in treatment trains with bioretention cells. The Porous Pave® surface is red in color and shown in the left. The porous asphalt is the black surface shown on the right; (b) Plan view of the site with test locations shown numerated at the indicated locations of the test. The comma at 1,9 indicates the location of both 1 and 9.

Figure 2.
The falling head test device developed for comparison to the ASTM test when (a) closed and (b) open.
Figure 2.
The falling head test device developed for comparison to the ASTM test when (a) closed and (b) open.

Figure 3.
Images acquired with a cell phone camera of on the porous asphalt site at location 1 in (a), location 2 in (b), location 3 in (c), location 4 in (d) location 5 in (e) and on the porous asphalt sample shown in (f). Some of the images still show the silicone present from ASTM testing.
Figure 3.
Images acquired with a cell phone camera of on the porous asphalt site at location 1 in (a), location 2 in (b), location 3 in (c), location 4 in (d) location 5 in (e) and on the porous asphalt sample shown in (f). Some of the images still show the silicone present from ASTM testing.
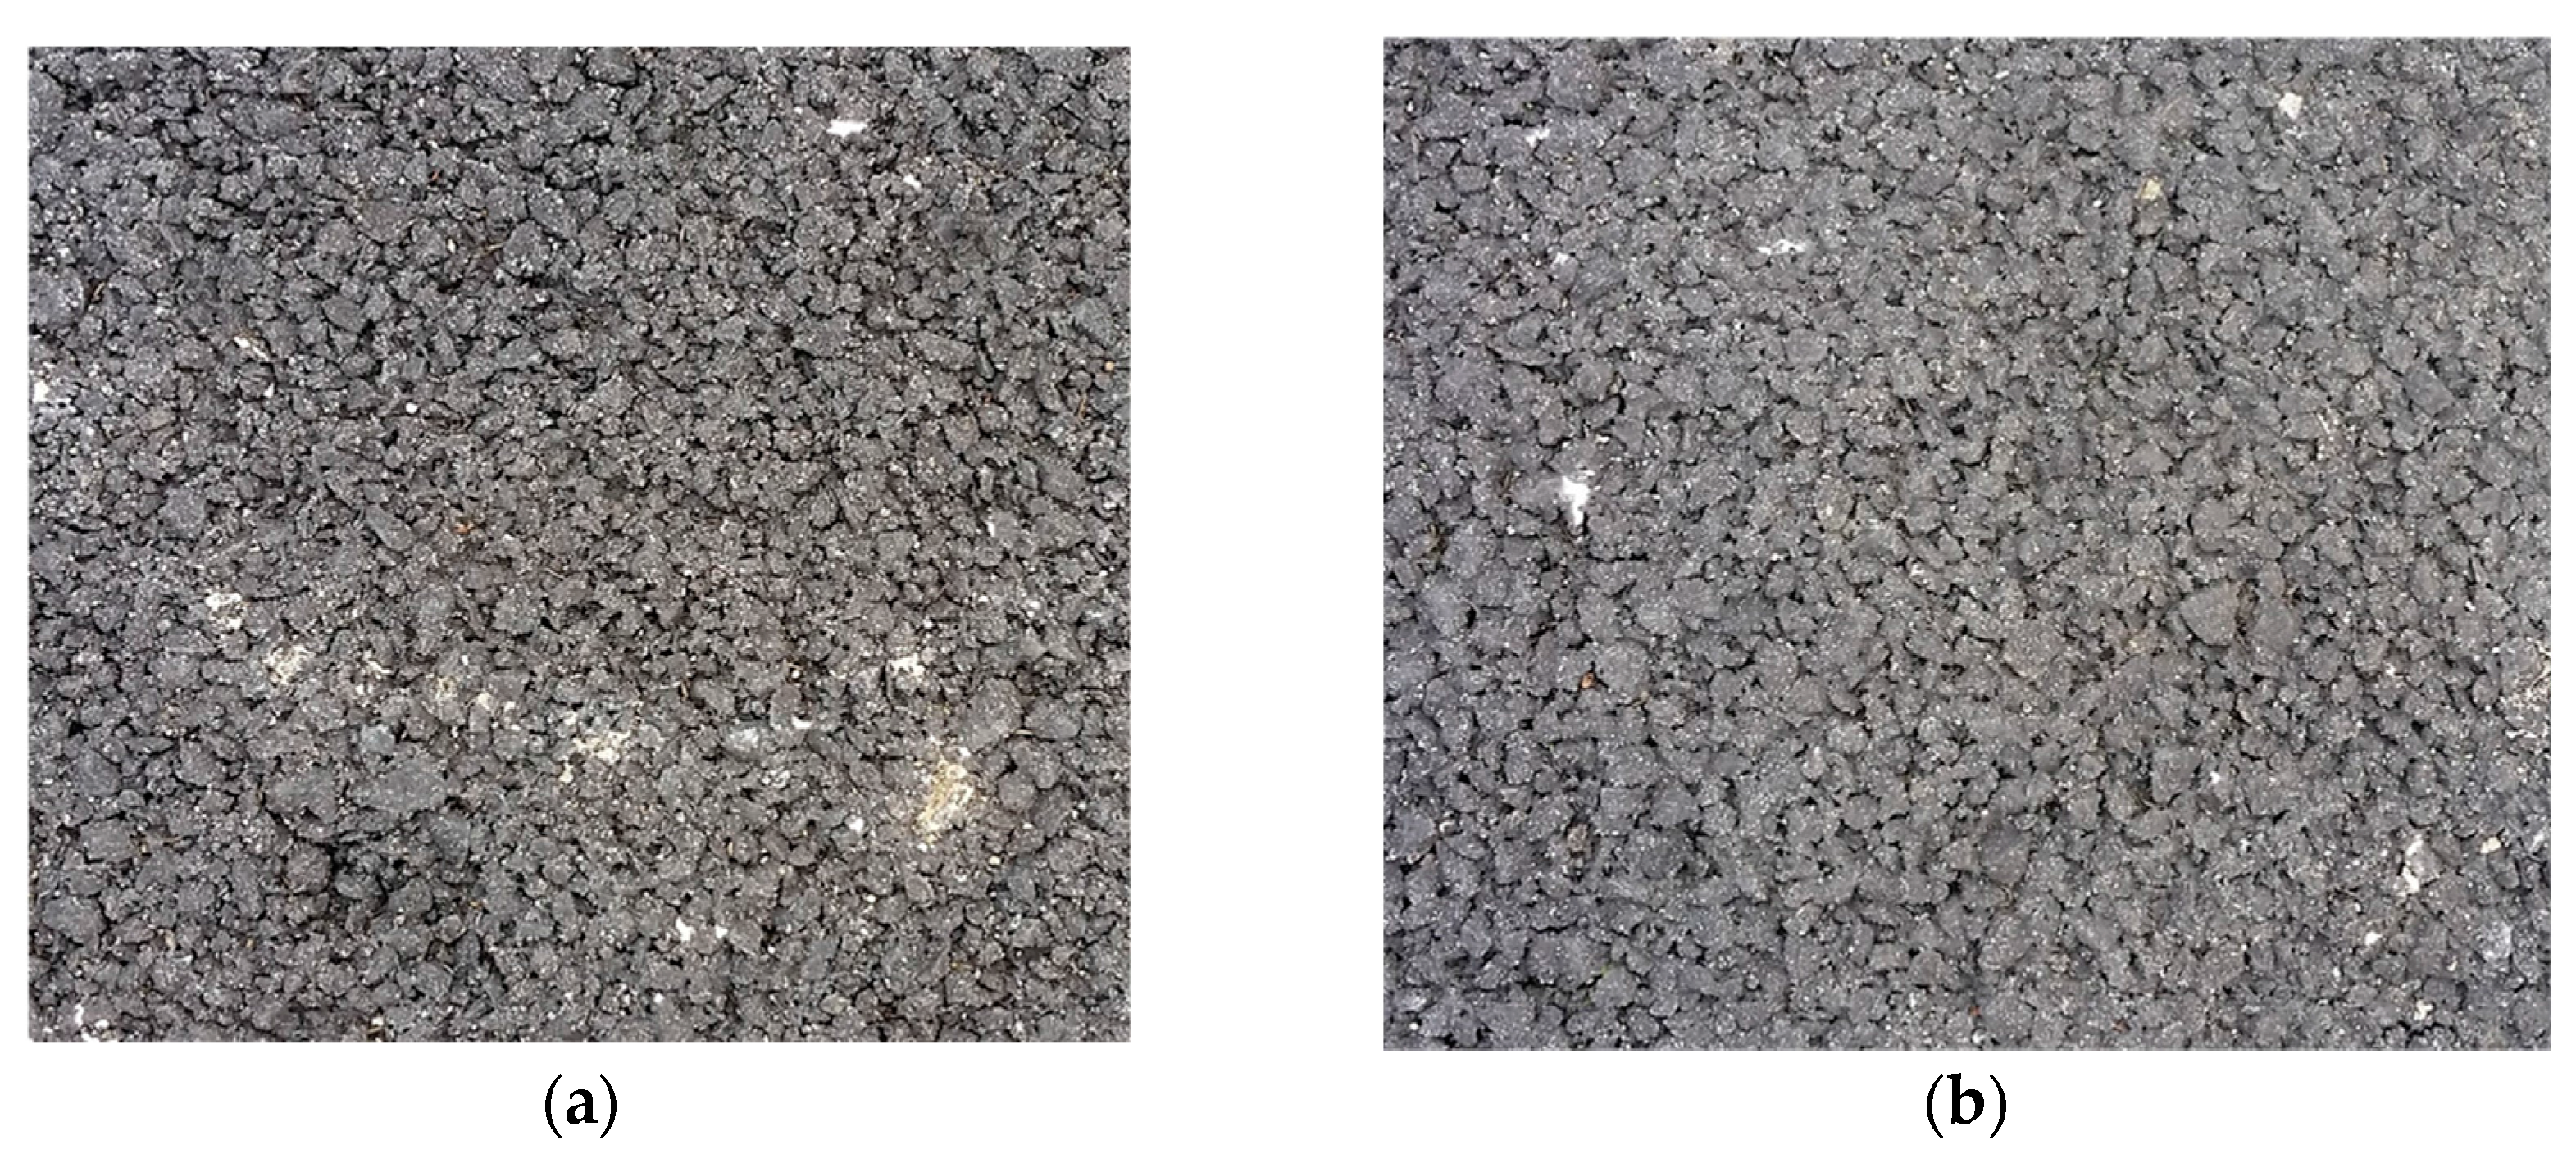
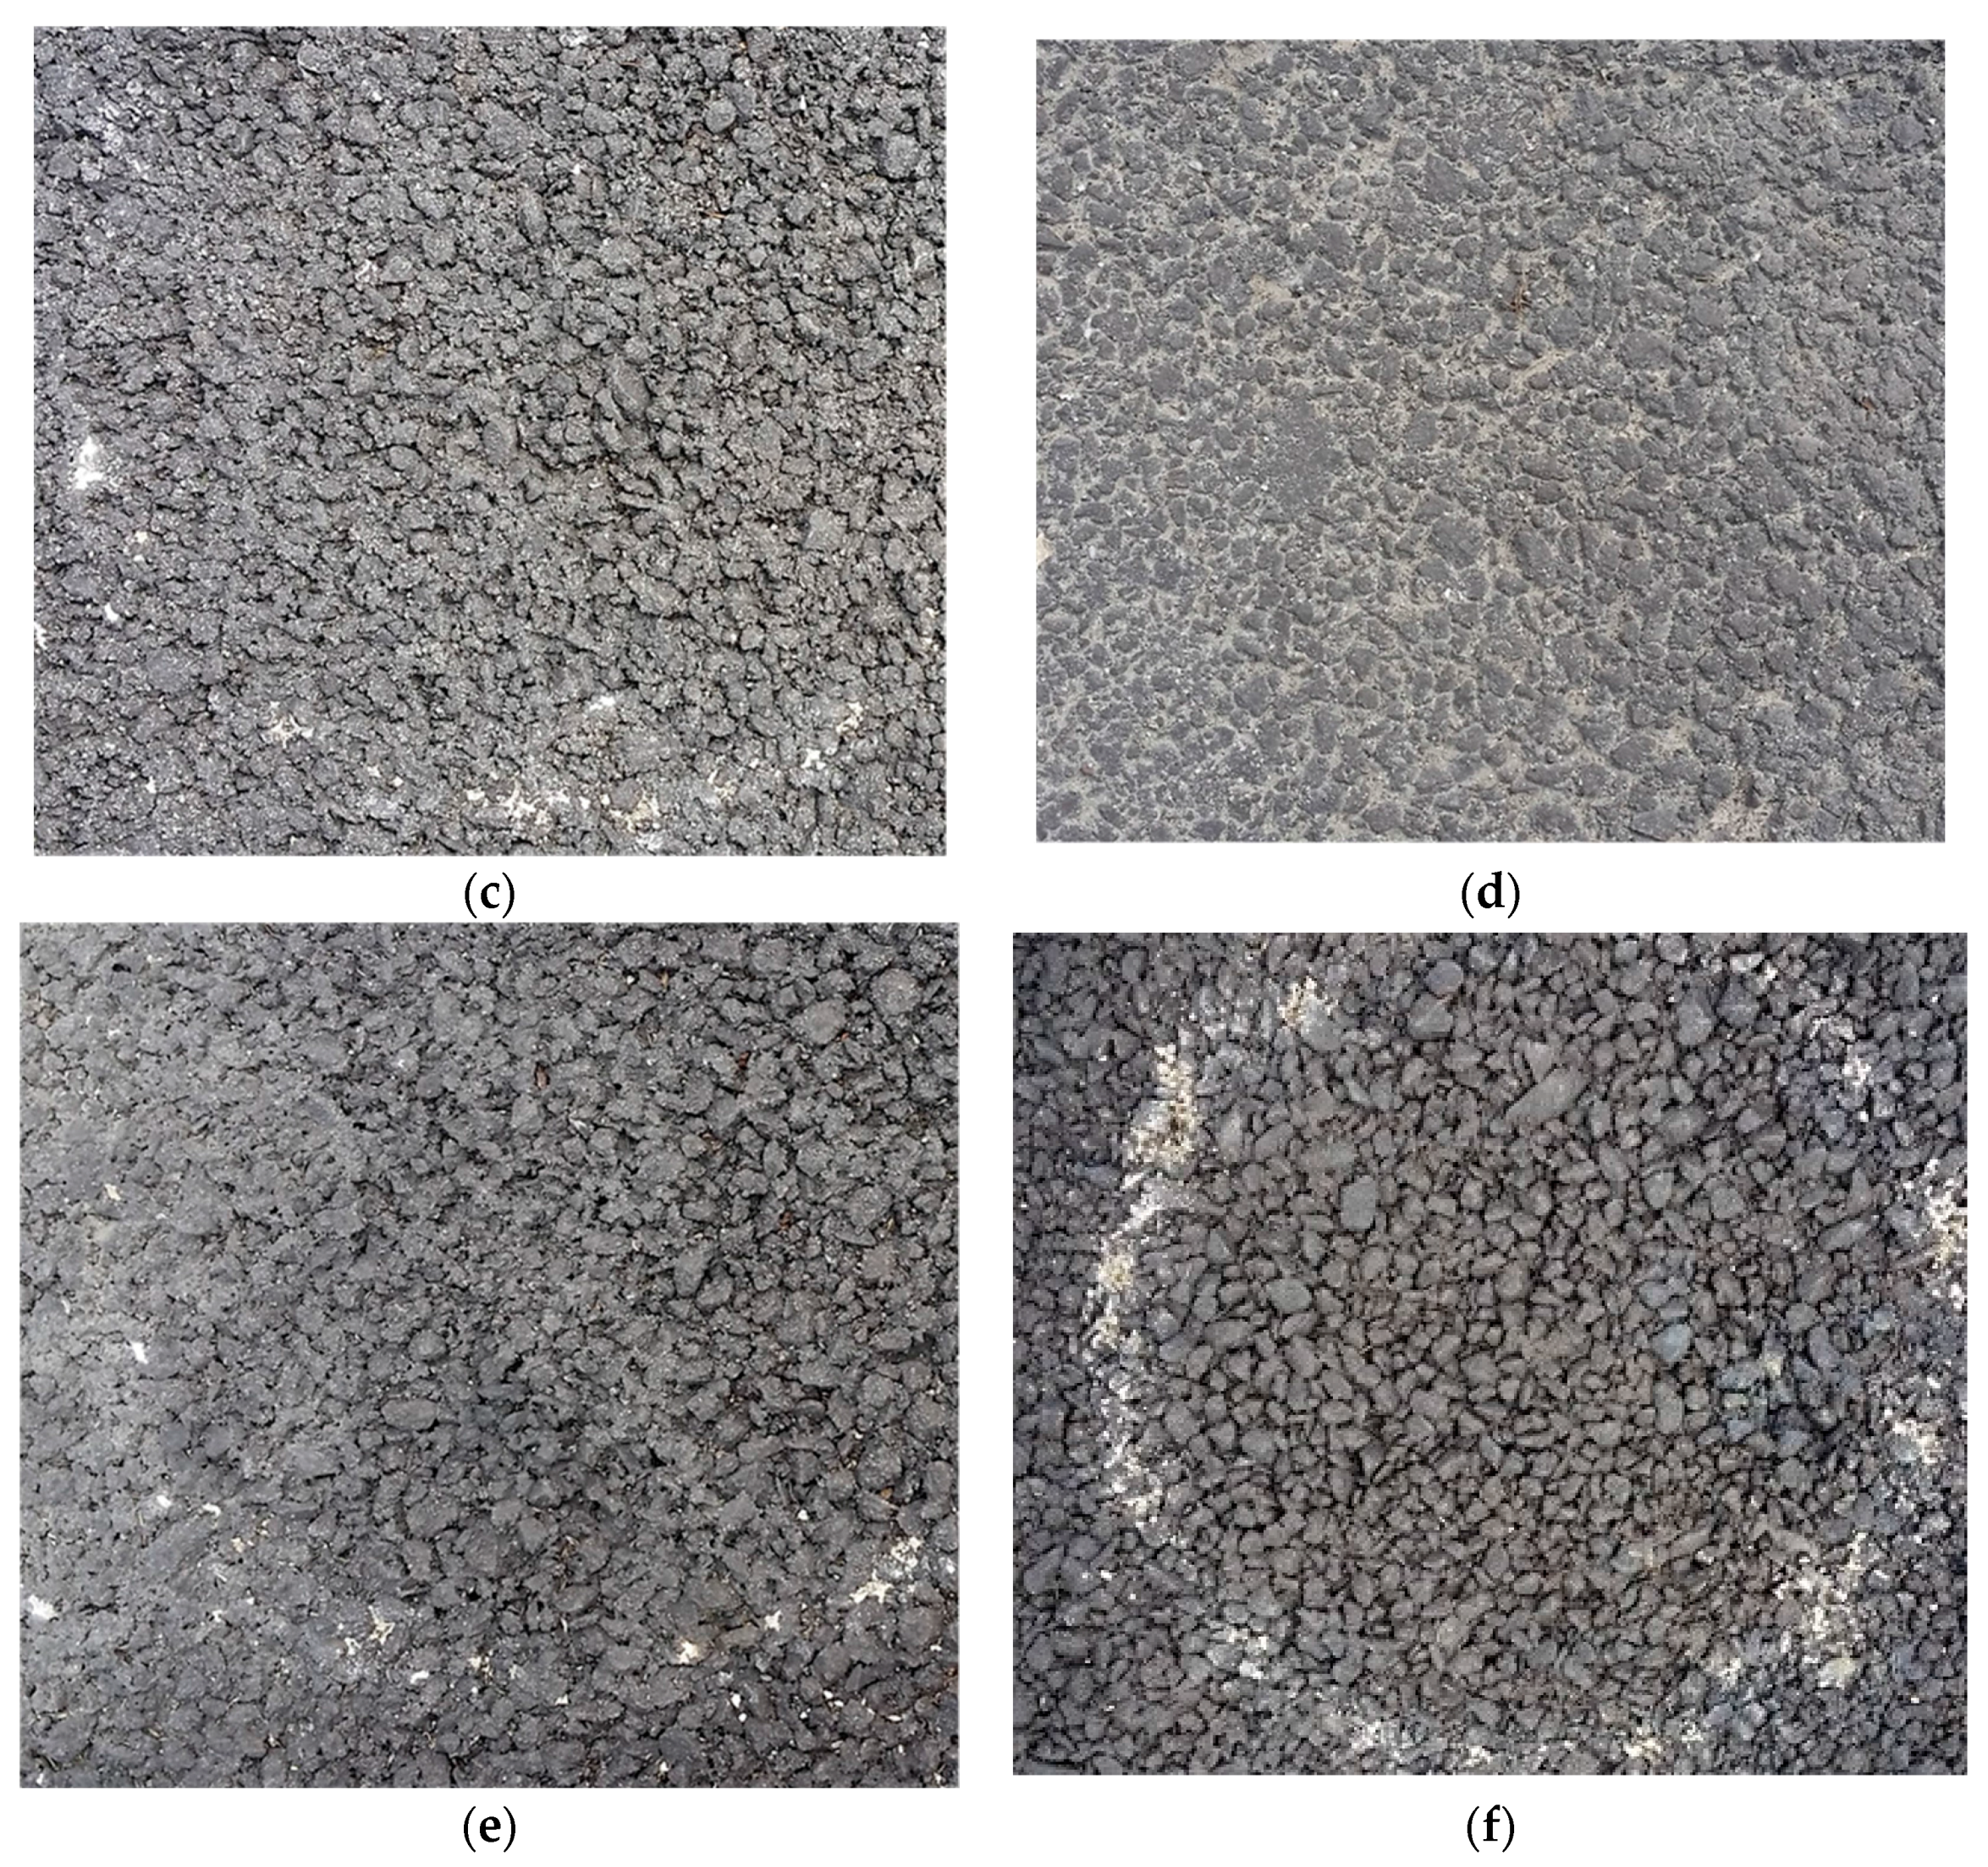
Figure 4.
Histogram of the gray levels produced for each image for (a) locations 1 to 3, and (b) locations 4 and 5 and the Sample, of porous asphalt as a normalized pixel count for each gray level. The number beside PA refers to the location on the porous strip.
Figure 4.
Histogram of the gray levels produced for each image for (a) locations 1 to 3, and (b) locations 4 and 5 and the Sample, of porous asphalt as a normalized pixel count for each gray level. The number beside PA refers to the location on the porous strip.


Figure 5.
Relationship between inverse of the histogram mean image intensity and the measured surface infiltration rate on the porous asphalt surface using (a) the ASTM method (on locations 1–5) and the sample of porous asphalt, and (b) the falling head test on locations 1–10 and on the control sample. The dashed lines are the best-fit linear regression lines.
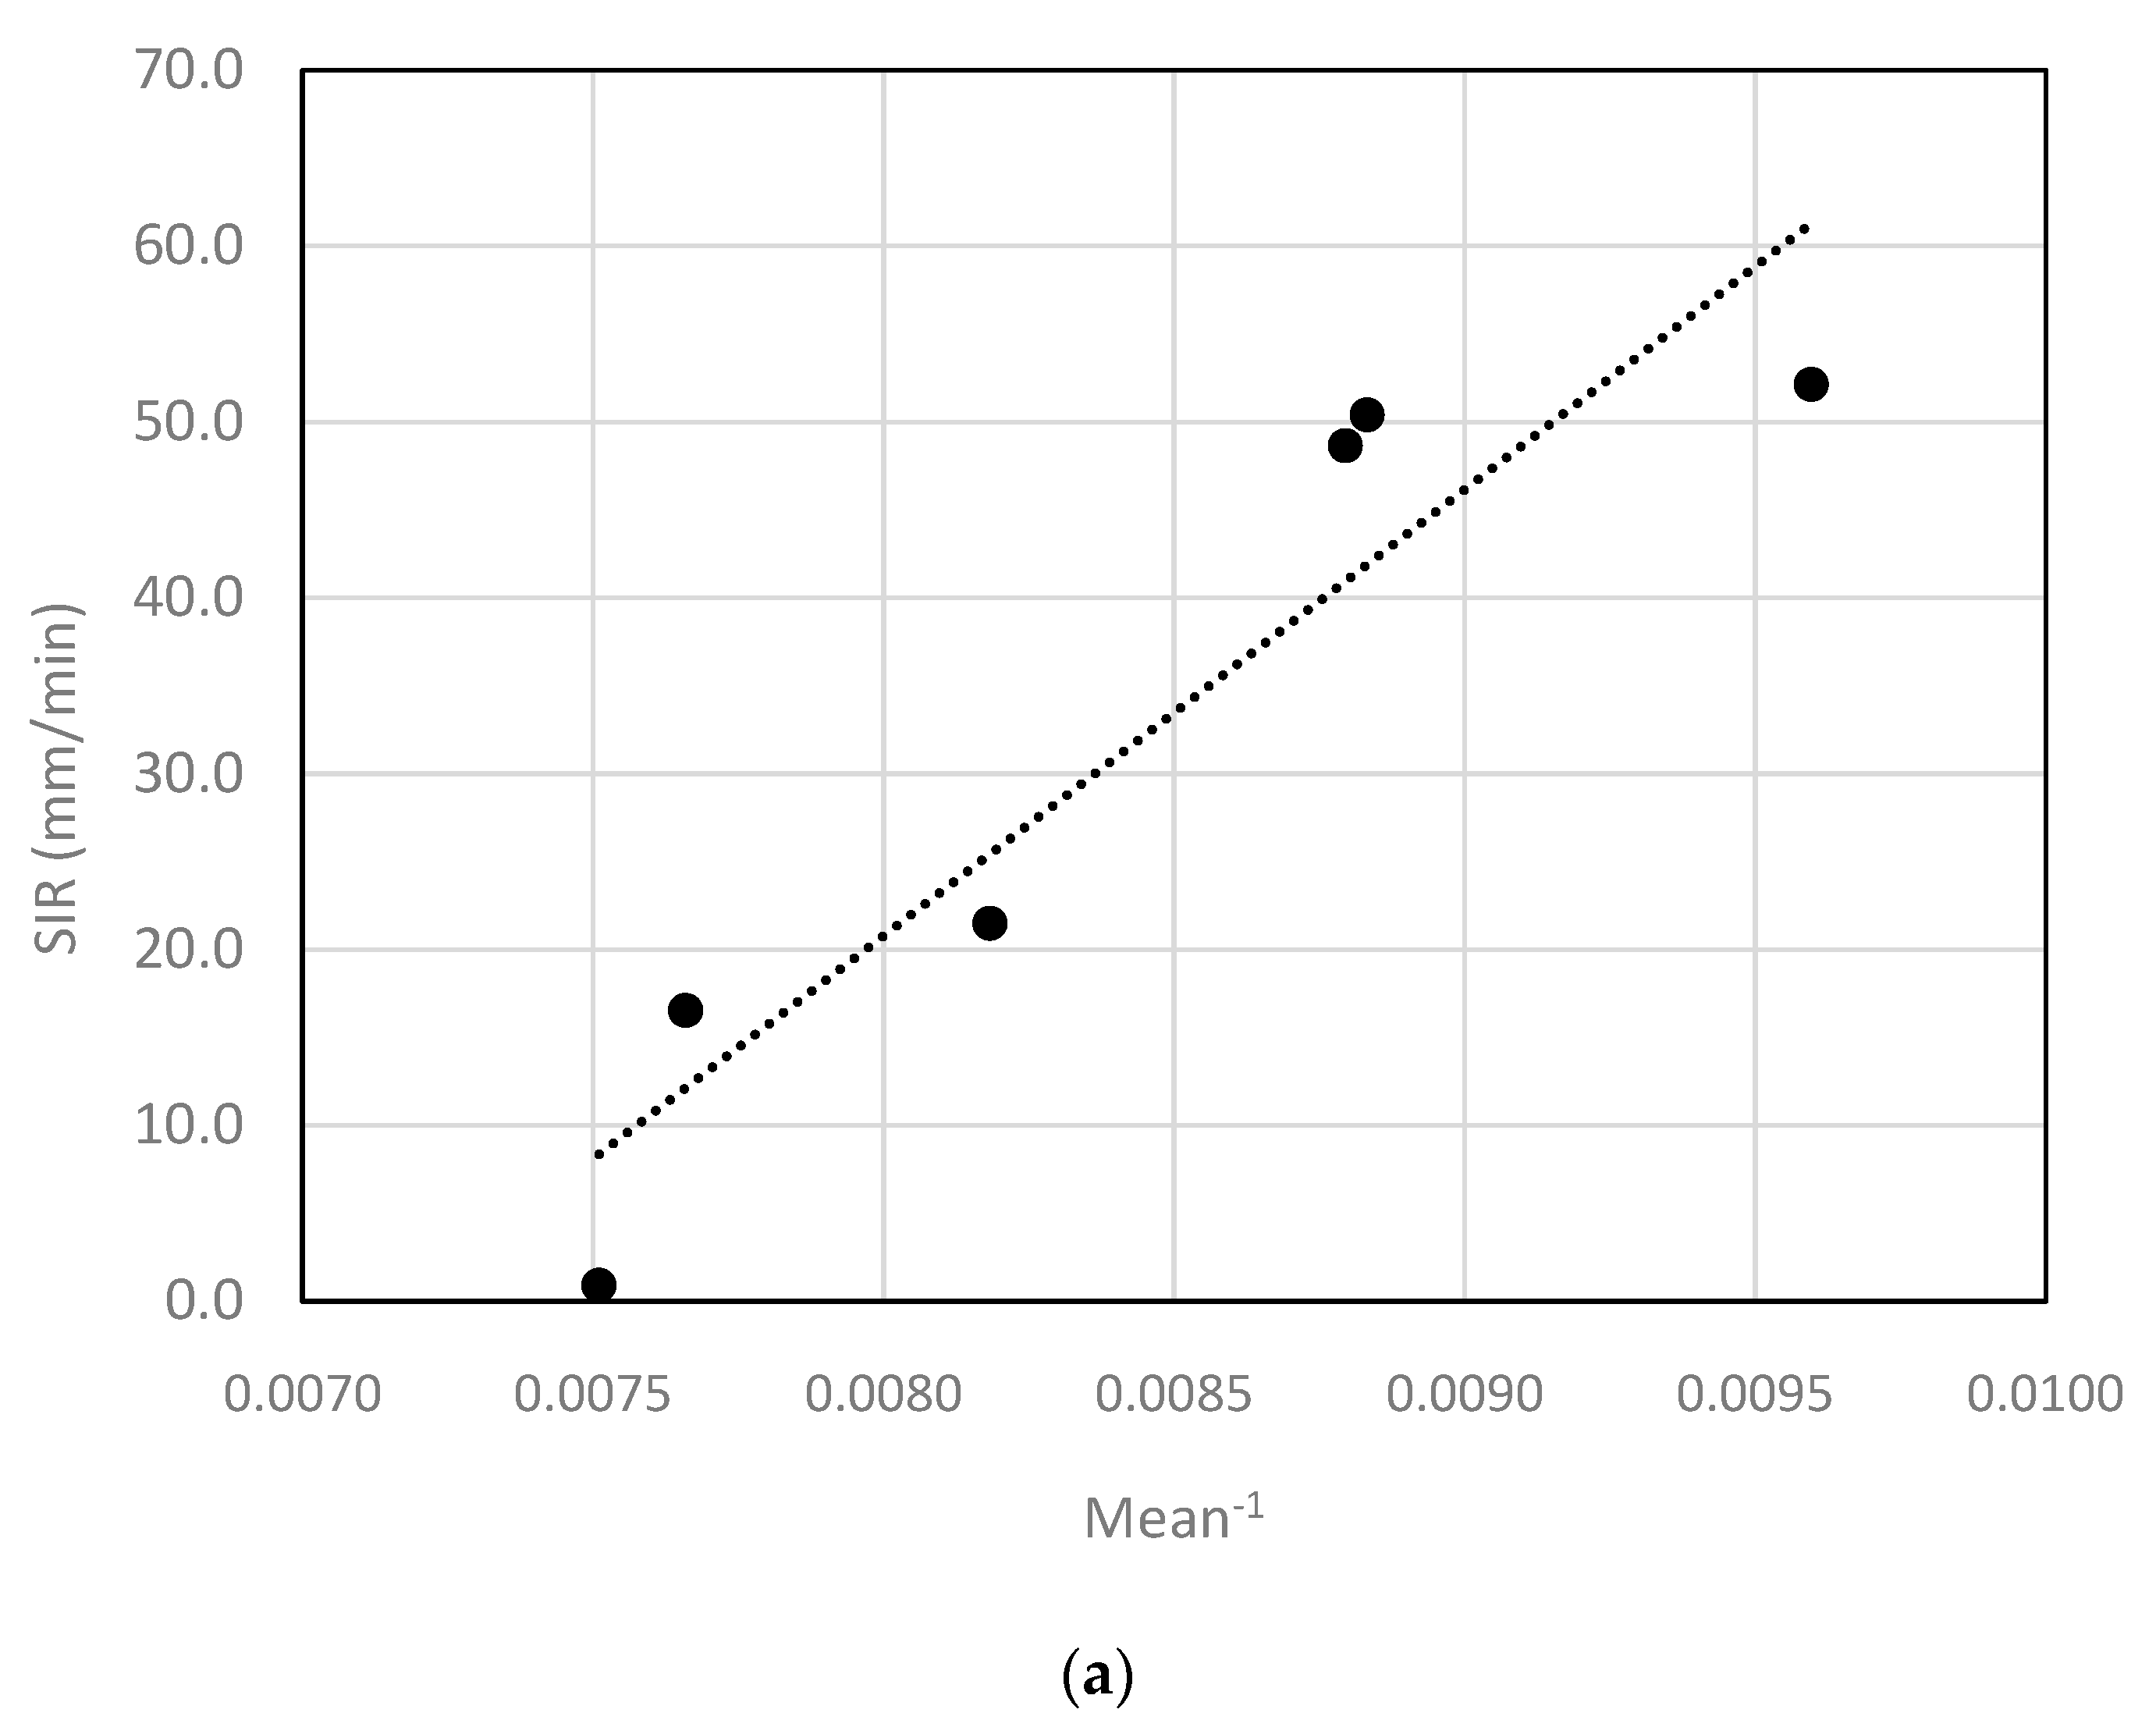

Figure 6.
Images acquired with a cell phone camera of on the Porous Pave site at location 1 in (a), location 2 in (b), location 3 in (c), location 4 in (d), and on location 5 in (e).
Figure 6.
Images acquired with a cell phone camera of on the Porous Pave site at location 1 in (a), location 2 in (b), location 3 in (c), location 4 in (d), and on location 5 in (e).


Figure 7.
Relationship between inverse of the histogram mean image intensity and the measured surface infiltration rate for (a) locations 1 to 3, and (b) locations 2, 4 and 5 on the Porous Pave site as a normalized pixel count for each gray level when the statistic is the mean or the median. The number after the symbol PP in the legend corresponds to the location on the Porous Pave site.


Figure 8.
(a) Relationship between inverse of the histogram mean image intensity and the measured surface infiltration rate on the Porous Pave surface when the statistic is the mean or the median for the 305 mm ring size using the ASTM standard test; and (b) for 203 mm, 305 mm and 406 mm ring sizes.


Table 1.
SIR data collected on the porous asphalt surface in the spring of 2016 using the ASTM C1701 standard test with varying ring sizes. Sample size N (of the data leading to the mean SIR and range given) is provided for each location tested on the surface. The dates encompassing the period of collection are shown as day/month. Means are given instead of the median as the latter cannot be computed with less than 3 points.
| Dates Acquired | 203 mm | 305 mm | 406 mm | ||||||
|---|---|---|---|---|---|---|---|---|---|
| 16/March–30/March | 2/February–25/February | 2/April–8/April | |||||||
| Location | N | Mean SIR (mm/min) | Range (mm/min) | N | Mean SIR (mm/min) | Range (mm/min) | N | Mean SIR (mm/min) | Range (mm/min) |
| 1 | 3 | 76.2 | 10.9 | 4 | 113.0 | 113.8 | 3 | 94.0 | 33.4 |
| 2 | 3 | 31.6 | 9.2 | 3 | 63.8 | 61.2 | 3 | 22.2 | 3.1 |
| 3 | 3 | 26.7 | 6.8 | 3 | 24.4 | 10.7 | 3 | 23.2 | 6.9 |
| 4 | 1 | 0.0 | 1 | 0.0 | 1 | 0.0 | |||
| 5 | 2 | 89.9 | 1.3 | 3 | 117.0 | 32.8 | 3 | 104.8 | 22.4 |
Table 2.
SIR data collected on the Porous Pave surface in the spring of 2016 using the ASTM C1701 standard test with the three ring sizes. Sample size N (of the data leading to the mean SIR and range given) is provided for each location tested on the surface. The dates encompassing the period of collection are shown as day/month. Means are given instead of the median as the latter cannot be computed with less than 3 points.
| Dates Acquired | 203 mm | 305 mm | 406 mm | ||||||
|---|---|---|---|---|---|---|---|---|---|
| 16/March–30/March | 2/February–25/February | 2/April–8/April | |||||||
| Location | N | Mean SIR (mm/min) | Range (mm/min) | N | Mean SIR (mm/min) | Range (mm/min) | N | SIR (mm/min) | Range (mm/min) |
| 1 | 3 | 185.1 | 19.7 | 4 | 152.3 | 160.63 | 3 | 131.8 | 2.4 |
| 2 | 3 | 1882.5 | 262.8 | 4 | 1178.2 | 371.8 | 3 | 1155.8 | 98.4 |
| 3 | 3 | 1013.1 | 158.4 | 4 | 847.2 | 393.0 | 3 | 778.0 | 229.6 |
| 4 | 3 | 2095.5 | 113.1 | 3 | 1138.7 | 470.3 | 3 | 1326.8 | 156.7 |
| 5 | 3 | 1598.1 | 233.5 | 3 | 1167.9 | 285.5 | 3 | 1057.9 | 195.6 |
Table 3.
Comparison of ASTM and falling head test in porous asphalt field site and the control sample. Data set size N (of the data leading to the mean SIR and range given) are provided for each location tested on the surface. The collection dates for locations 1–5 are 20 March to 31 March for the ASTM method and 27 April to 30 April for the falling head test. The data collected on the sample were taken 4 August to 9 August. Means are given instead of the median as the latter cannot be computed with less than 3 points.
| Location | ASTM | Falling Head | ||||
|---|---|---|---|---|---|---|
| N | Mean SIR (mm/min) | Range (mm/min) | N | Mean SIR (mm/min) | Range (mm/min) | |
| 1 | 2 | 50.4 | 18.9 | 3 | 101.3 | 8.3 |
| 2 | 2 | 21.5 | 1.5 | 3 | 59.6 | 15.7 |
| 3 | 2 | 16.5 | 2.8 | 3 | 52.0 | 5.2 |
| 4 | 1 | 0.0 | 1 | 0.0 | ||
| 5 | 2 | 48.6 | 10.6 | 3 | 113.8 | 17.5 |
| Sample | 3 | 52.1 | 18.0 | 3 | 121.0 | 5.0 |
Table 4.
Residual statistics for ASTM and falling head regressions given in Equations (2) and (3), respectively.
Table 4.
Residual statistics for ASTM and falling head regressions given in Equations (2) and (3), respectively.
| Minimum | Maximum | Mean | s | ||
|---|---|---|---|---|---|
| ASTM (N = 6) | Predicted Value | 8.36 | 61.28 | 31.68 | 20.13 |
| Residual | −9.15 | 8.50 | 0.00 | 7.82 | |
| Std. Predicted Value | −1.16 | 1.47 | 0.00 | 1.00 | |
| Std. Residual | −1.05 | 0.97 | 0.00 | 0.89 | |
| Falling Head (N = 11) | Predicted Value | 15.48 | 215.37 | 104.46 | 66.49 |
| Residual | −42.83 | 40.90 | 0.00 | 25.91 | |
| Std. Predicted Value | −1.34 | 1.67 | 0.00 | 1.00 | |
| Std. Residual | −1.57 | 1.50 | 0.00 | 0.95 | |
© 2018 by the authors. Licensee MDPI, Basel, Switzerland. This article is an open access article distributed under the terms and conditions of the Creative Commons Attribution (CC BY) license (http://creativecommons.org/licenses/by/4.0/).
Share and Cite
MDPI and ACS Style
Valeo, C.; Gupta, R. Determining Surface Infiltration Rate of Permeable Pavements with Digital Imaging. Water 2018, 10, 133. https://doi.org/10.3390/w10020133
AMA Style
Valeo C, Gupta R. Determining Surface Infiltration Rate of Permeable Pavements with Digital Imaging. Water. 2018; 10(2):133. https://doi.org/10.3390/w10020133
Chicago/Turabian StyleValeo, Caterina, and Rishi Gupta. 2018. "Determining Surface Infiltration Rate of Permeable Pavements with Digital Imaging" Water 10, no. 2: 133. https://doi.org/10.3390/w10020133
Note that from the first issue of 2016, this journal uses article numbers instead of page numbers. See further details here.