Article

Responses of Water Level in China’s Largest Freshwater Lake to the Meteorological Drought Index (SPEI) in the Past Five Decades

1
State Key Laboratory of Simulation and Regulation of Water Cycle in River Basin, China Institute of Water Resources and Hydropower Research (IWHR), Beijing 100038, China
2
College of Hydrology and Water Resources, Hohai University, Nanjing 210098, China
*
Author to whom correspondence should be addressed.
Water 2018, 10(2), 137; https://doi.org/10.3390/w10020137
Submission received: 22 December 2017 / Revised: 20 January 2018 / Accepted: 25 January 2018 / Published: 1 February 2018

Abstract

:
Poyang Lake, which is the largest freshwater lake in China, is an important regional water resource and iconic ecosystem that has experienced a period of continuous low water level in recent years. In this paper, the Standardized Precipitation Evapotranspiration Index (SPEI) was applied to analyze the temporal variability and spatial distribution characteristics of meteorological drought over the Poyang Lake Basin during 1961–2015. In addition, correlation analysis was used to investigate the response relationship between lake level and meteorological drought in the basin. The main results showed that: (1) The decline of water level in Poyang Lake since 2000 has been dramatic, especially in autumn, when the downward speed reached 11.26 cm/day. (2) The meteorological drought in the Poyang Lake Basin has obvious seasonal characteristics, and drying tendencies in spring and autumn were relatively obvious. Following the 1960s, this basin entered a new drought period in the 2000s. (3) The results of correlation analysis showed that three- and six-month timescales were the optimum times for the lake level to respond to the SPEI in the Poyang Lake Basin. Seasonally, the correlation was best in winter and worst in autumn. Furthermore, the spatial distribution of correlations was: Hukou < Xingzi < Duchang < Wucheng < Tangyin < Kangshan. Overall, the results of this study quantified the response of lake level to meteorological drought in the context of climate change, and they provide a reliable scientific basis for water resource management in similar basins.

1. Introduction

Drought is one of the most common natural disasters in the world [1,2,3]. Statistics from the World Meteorological Organization show that meteorological disasters account for approximately 70% of all natural disasters and that half of them resulted from drought [4]. The annual global economic loss caused by drought is estimated to be as high as 6–8 billion dollars, which is far more than that caused by other meteorological disasters [2]. Because of the complex nature and widespread impacts of drought, the American Meteorological Society divided drought into four categories: (1) meteorological drought; (2) agricultural drought; (3) hydrological drought; and (4) socioeconomic drought [5]. Because climatic factors are the cause of drought disasters around the world, meteorological drought is considered to be the basis of the three other types of droughts [6]. With increasing global changes, the climate continues to become warmer, all kinds of extreme weather events have been frequent, and the impacts of drought on economic development and agricultural production have also been aggravated. These factors have drawn the extensive attention of scholars at home and abroad [7]. China is located in the East Asian monsoon region. Due to its complex geographical conditions and climate change, China is one of the most climatically fragile areas in the world, and meteorological disasters occur there frequently [8,9]. Statistics indicate that drought disaster accounts for 50% of the affected area of China’s meteorological disasters, whereas flood disaster only accounts for 27.8% [10].
The effects of droughts are complex and difficult to grasp and forecast [11]. However, the proposal and development of drought indexes [12] has addressed this problem, thus facilitating the qualitative and quantitative measurement of drought events. Due to their advantages of easy access to information, flexible time scales and sensitive responses to drought monitoring, drought indexes based on ground climatic data are widely used around the world. Among the drought indexes, the Palmer Drought Severity Index (PDSI) and the Standardized Precipitation Index (SPI) are the most widely and profoundly used indexes [13,14,15,16]. The PDSI, which is one of the earliest drought indexes, was developed by Palmer in 1965; however, it has some shortcomings, such as a fixed time scale and complicated calculations [17]. The superior aspect of the SPI is its multi-time scale feature, which can be used to characterize different types of droughts [18]. However, the SPI only considers the influence of precipitation. In the context of global change, rising temperature has become one of the important factors aggravating drought processes [19]. Therefore, the objective characterization of drought conditions requires us to consider the joint effects of precipitation and temperature changes. For this purpose, Vicente-Serrano et al. (2010) [7] proposed a new meteorological drought index, the Standardized Precipitation Evapotranspiration Index (SPEI), which was based on the SPI. Because it takes into account both precipitation and temperature and integrates the advantages of the PDSI (i.e., its sensitivity to temperature changes) and the SPI (i.e., its simple calculation process and property of multiple timescales), the SPEI has become one of the most useful tools for monitoring drought processes [20,21,22].
The Poyang Lake Basin is one of the key areas of global water security and biodiversity conservation [23], and it is an important production base of grain, oil, cotton and aquatic products in China, feeding a population of up to 44 million [24,25]. The annual discharge from the Poyang Lake Basin is approximately 1457 × 108 m3, accounting for 5.3% of the national water resources and 15.7% of the discharge in the Yangtze River Basin [26]. However, due to the uneven distribution of seasonal precipitation, the Poyang Lake Basin has become one of the most flood- and drought-prone regions in China. Over the past several decades, both droughts and floods have occurred frequently in this basin, causing enormous damage to the environment and the agricultural development [19,27,28,29]. Poyang Lake, which is located in this basin, is the largest freshwater lake in China, and it is one of the first lakes in China to be included in the Ramsar Convention’s List of International Wetlands [30]. As the world’s largest bird conservation area and winter habitat for migratory birds, Poyang Lake wetland accommodates over 98% of the endangered Siberian Cranes (Grus leucogeranus) in the world, and the Carex cinerascens grown here provide unique feeding grounds and spawning beds for local fish [31]. However, this region is facing a series of problems, including enhanced recession in the lake’s water level, the deterioration of water quality and the degradation of wetland vegetation [25,32,33,34,35], which have greatly imperiled the lake’s wetland areas and their function as a winter habitat for migratory birds. The submerged “thousand-eye bridge”, which is located in the main navigation channel of Poyang Lake, is known as “the longest stone bridge inside a lake in China” (Figure 1). Nevertheless, its frequent reveal in recent years also means that the water level recession in Poyang Lake has become more serious, which has raised widespread concerns about the ecological problems of Poyang Lake [36]. In addition, the enhanced recession in Poyang Lake has led to water supply and agricultural irrigation problems for the 12.4 million inhabitants of the surrounding region. Because this lake is a typical open water-carrying lake that naturally connects to the Yangtze River, the occurrence of droughts and floods in the lake is not only controlled by the discharge in the Yangtze River but also highly affected by the catchment inflow [37,38].
Although previous studies have indicated that the changes in the lake level of Poyang Lake are mainly affected by the comprehensive influences of the five rivers (Ganjiang, Fuhe, Xinjiang, Raohe, and Xiushui) and the Yangtze River, no direct research has been conducted to investigate how the lake level responds to meteorological drought in the basin. Therefore, the main objectives of this study are: (1) to document the major lake level changes of Poyang Lake over the last five decades; (2) to analyze the spatial-temporal evolution of meteorological drought over the Poyang Lake Basin; and (3) to explore the response relationship between the lake level and meteorological drought index in this basin.

2. Study Area and Data

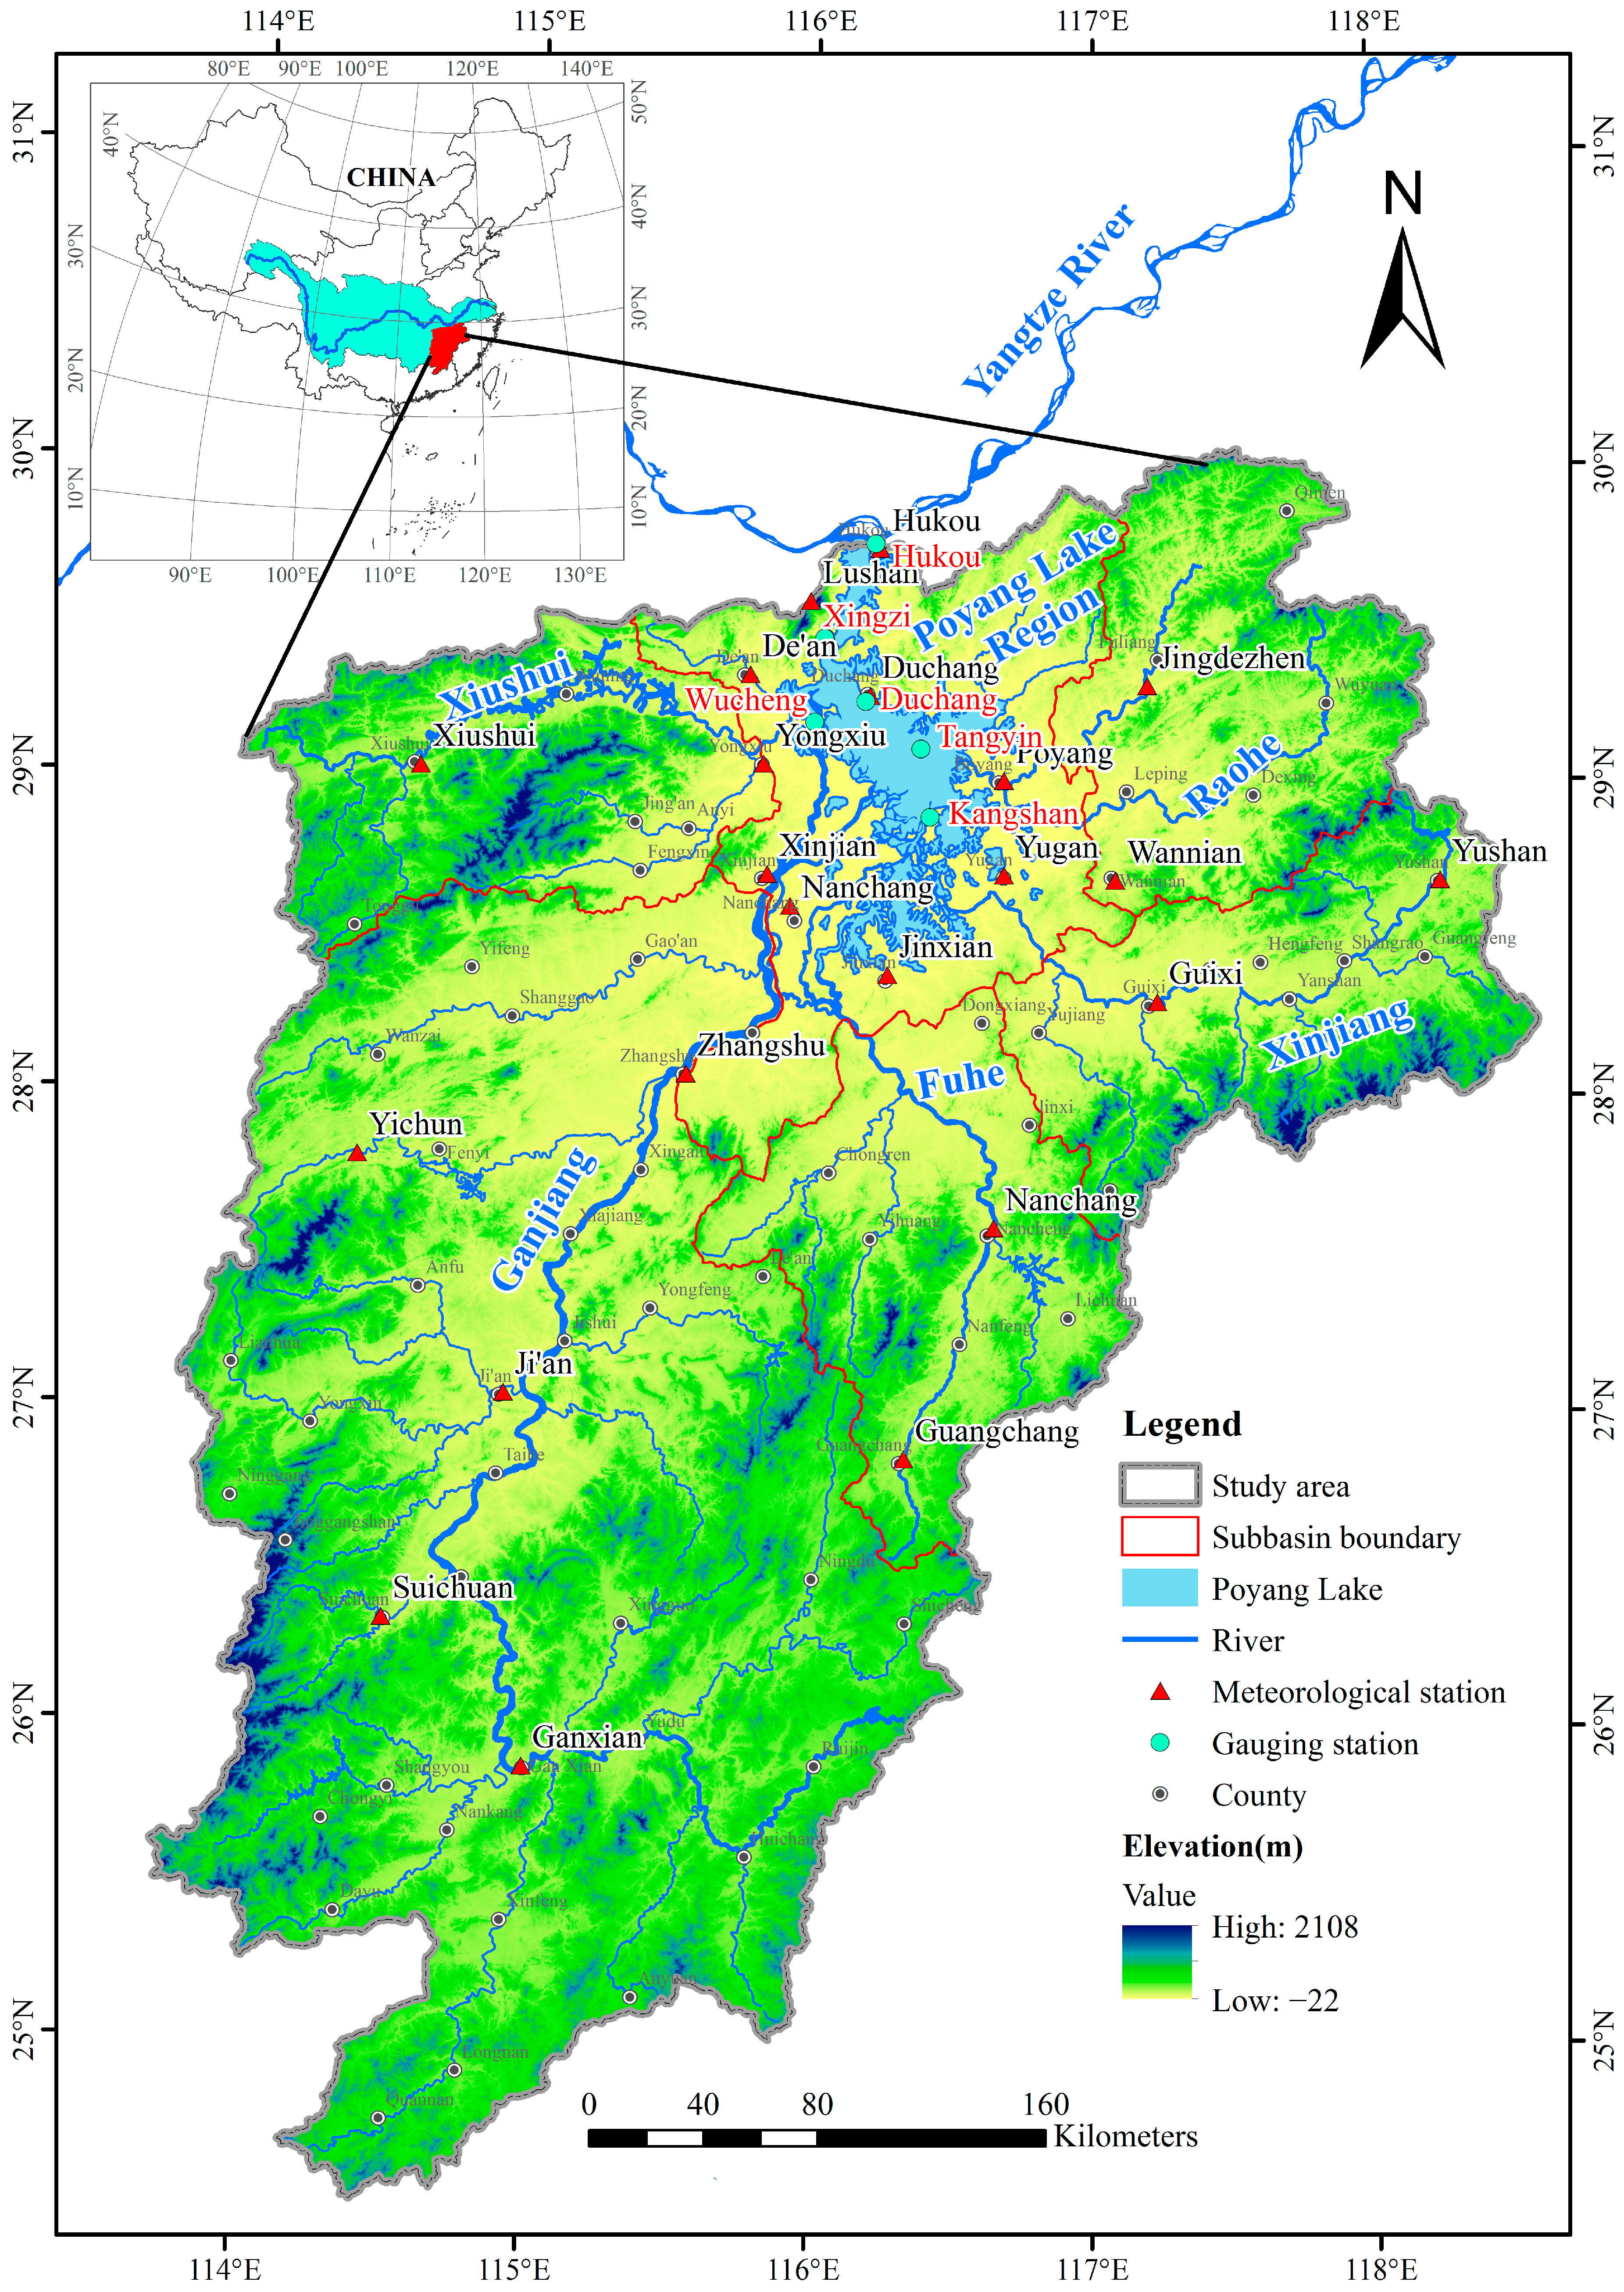
2.1. Overview of the Study Area

The Poyang Lake Basin (113°35′–118°29′ E, 24°29′–30°05′ N) is located in the middle and lower regions of the Yangtze River and has a drainage area of 16.22 × 10⁴ km2, accounting for 8.9% of the Yangtze River Basin and 97.3% of Jiangxi Province [39]. The basin contains five main subbasins: the Ganjiang, Fuhe, Xinjiang, Raohe, and Xiushui River Basins (Figure 2). Poyang Lake (115°49′–116°46′ E, 28°24′–29°46′ N), which is China’s largest freshwater lake, mainly receives water from these five rivers before discharging into the Yangtze River at Hukou [19]. The topography in the Poyang Lake Basin is quite complex, which consists of mountainous areas, subordinate hills, and alluvial plains. The land use across the basin is dominated by forest, farmland, grassland and water bodies, among which forest area accounts for 63%, cropland for 26%, and grassland and water bodies each for 4%; the remaining areas represent construction land and bare land [33]. The Poyang Lake Basin is located in a subtropical humid monsoon climate zone. The annual precipitation is 1620 mm, of which 42–53% occurs from April to June. The annual average temperature is 17.6 °C, and the coldest and hottest months are January and July, respectively. The annual potential evapotranspiration is 1049 mm/year, with the highest rates occurring from May to September.

2.2. Data

The meteorological data used in this study include daily precipitation and temperature data at 23 meteorological stations in the Poyang Lake Basin collected from 1961 to 2015 by the China Meteorological Data Sharing Service System. Daily lake level data obtained from actual measurements at six gauging stations, i.e., Hukou, Xingzi, Duchang, Wucheng, Tangyin, and Kangshan, covering the period from 1961 to 2015 (daily lake level data at Tangyin are from 1962 to 2015), were provided by the Jiangxi Hydrological Bureau, China. The lake level data were measured using Huanghai’s reference elevation system. The spatial distributions of the meteorological stations and gauging stations in the study area are shown in Figure 2.
In this study, areal monthly precipitation and temperature data from 1961 to 2015 were computed using the Thiessen polygon method [40,41] to obtain the SPEI series in the Poyang Lake Basin.

3. Methods

3.1. Standardized Precipitation Evapotranspiration Index (SPEI)

The Standardized Precipitation Evapotranspiration Index (SPEI) was proposed based on the Standardized Precipitation Index (SPI) by Vicente-Serrano et al. [7]. This drought index has been widely used in many studies [20,42,43,44] because of its superior use of multiscale characteristics and consideration of temperature variations. The documentation and executable files are freely available at http://digital.csic.es/, and the specific calculation steps of the SPEI are described as follows:
(1)
Calculate potential evapotranspiration (PET) using the Tornthwaite method [45].
(2)
Compute the monthly climatic water balance:
D i = P i P E T i
where Di is the difference between the monthly precipitation Pi and the monthly potential evapotranspiration PETi.
The water profit or deficit series at different time scales can be constructed using the following formula:
D n k = i = 0 k 1 ( P n i P E T n i ) , n k
where k is the time scale (month) and n is the length of the data series.
(3)
Normalize the water balance. As there may be negative values in D series, the log-logistic distribution is selected by Vicente-Serrano et al. for standardizing the D series. The probability density function of a three-parameter log-logistic distributed variable is as:
f ( x ) = β α ( x γ α ) β 1 [ 1 + ( x γ α ) β ] 2
where α, β, and γ are the scale, shape, and origin parameters, respectively, which can be obtained using the L-moment method.
(4)
Standardize the Log-Logistic distribution function, and then calculate the SPEI as follows:
F ( x ) = 0 x f ( x ) d t = [ 1 + ( α x γ ) β ] 1
SPEI = W c 0 + c 1 W + c 2 W 2 1 + d 1 W + d 2 W 2 + d 3 W 3 ( W = 2 ln ( 1 P ) ) , P 0.5
SPEI = c 0 + c 1 W + c 2 W 2 1 + d 1 W + d 2 W 2 + d 3 W 3 W ( W = 2 ln ( 1 P ) ) , P > 0.5
where P is the probability of exceeding a determined D and P = 1 − F(x), and the constants in the Equations (5) and (6) are c0 = 2.515517, c1 = 0.802853, c2 = 0.010328, d1 = 1.432788, d2 = 0.189269, and d3 = 0.001308. The five classifications of meteorological drought based on the SPEI values are given in Table 1 [7].
In this study, different time-scale (1, 3, 6, and 12 months) SPEI values (i.e., SPEI-1, SPEI-3, SPEI-6, and SPEI-12, respectively) were calculated to quantify the monthly, seasonal, dry/wet seasonal, and annual variation characteristics of the meteorological drought in the Poyang Lake Basin and the responses of lake level to the meteorological index.

3.2. Mann–Kendall Trend Test

The Mann–Kendall test is a rank-based non-parametric test [46,47] recommended by the World Meteorological Organization [48]. This method can test a linear or nonlinear trend [49,50], and has been widely used to assess the significance of monotonic trends in meteorological and hydrological data time series [11,51,52,53]. In this study, this method was applied to detect the variation trend of the SPEI series.
In the Mann–Kendall test, the Z value is calculated as the critical value used to denote an increasing or decreasing trend. In this study, the significance level of the trend is set as 0.05, which has a corresponding Z value of 1.96. Accordingly, a value of Z > 0 denotes an increasing or upward trend, and a value of Z > 1.96 indicates that the increasing or upward trend is significant, and vice versa.

3.3. Accumulative Anomaly

The accumulative anomaly is commonly used to identify the changing tendency of meteorological and hydrological data, such as sequential precipitation, evaporation, and runoff [54]. In this study, the accumulative anomaly method is used for analyzing the seasonal variation trend of lake level. For a discrete series xi, the accumulative anomaly (St) for data point xi can be expressed as:
S t = i = 1 t ( x i x ¯ ) , t = 1 , 2 , , n , x ¯ = 1 n i = 1 n
where x ¯ is the mean value of the series xi, and n is the number of discrete points.
It should be noted that, to fully and reasonably analyze the changing characteristics of lake level in the Poyang Lake, some methods have been used in this study, such as accumulative anomaly, five-year moving average, linear regression, and so on.

4. Results

4.1. Dryness Phenomenon in the Poyang Lake

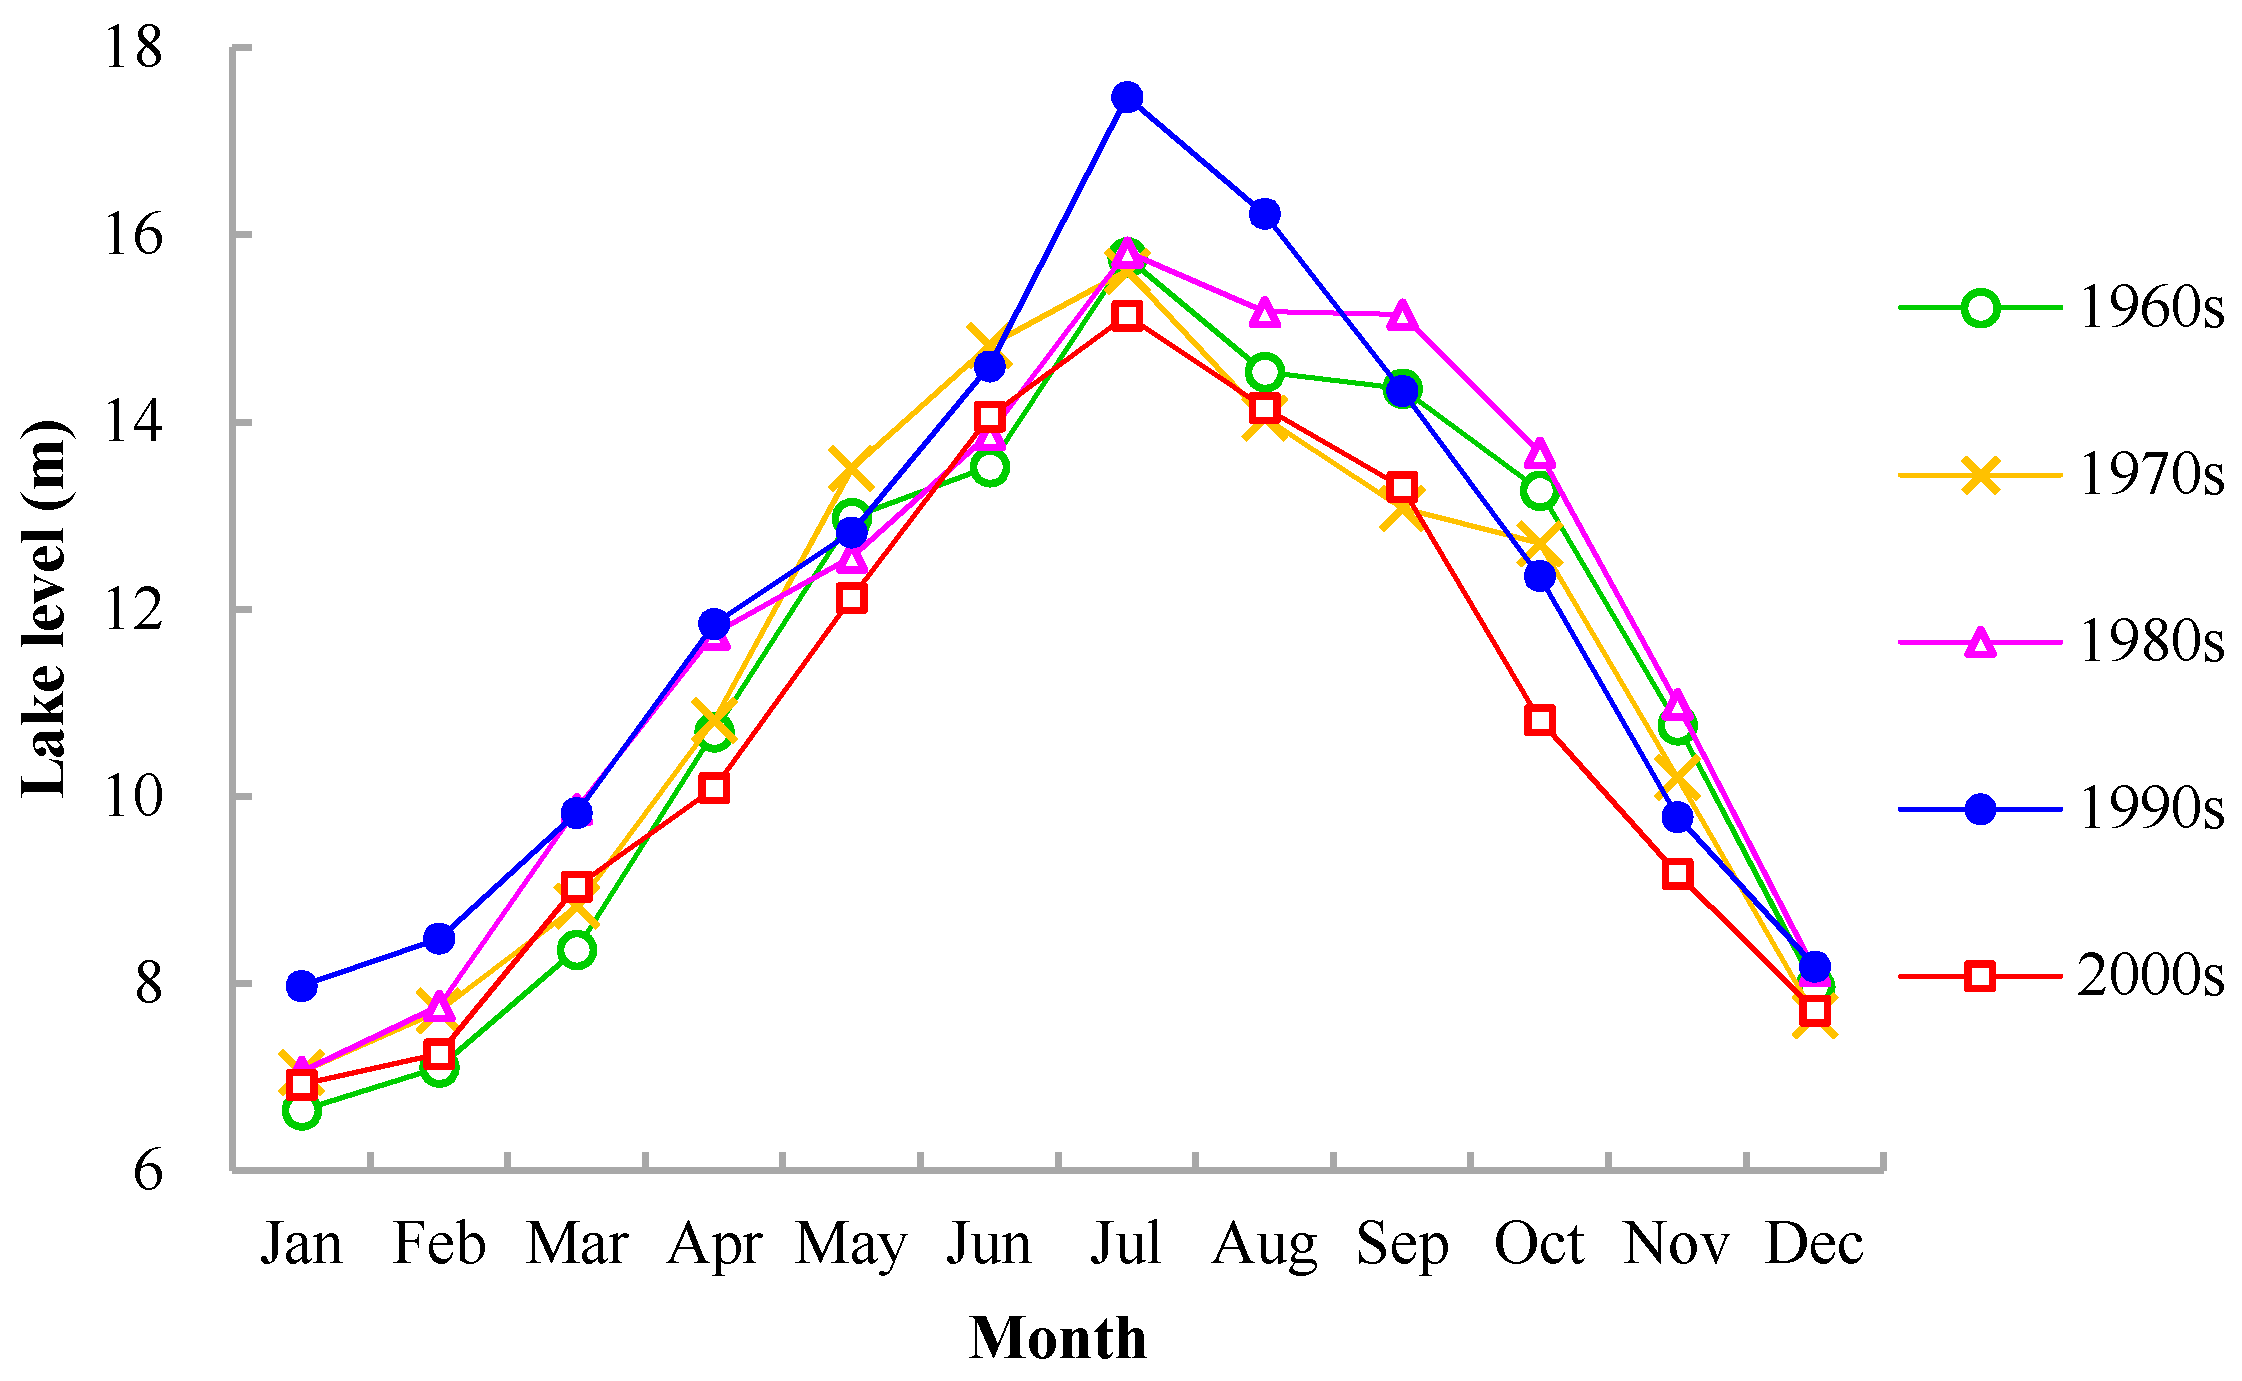
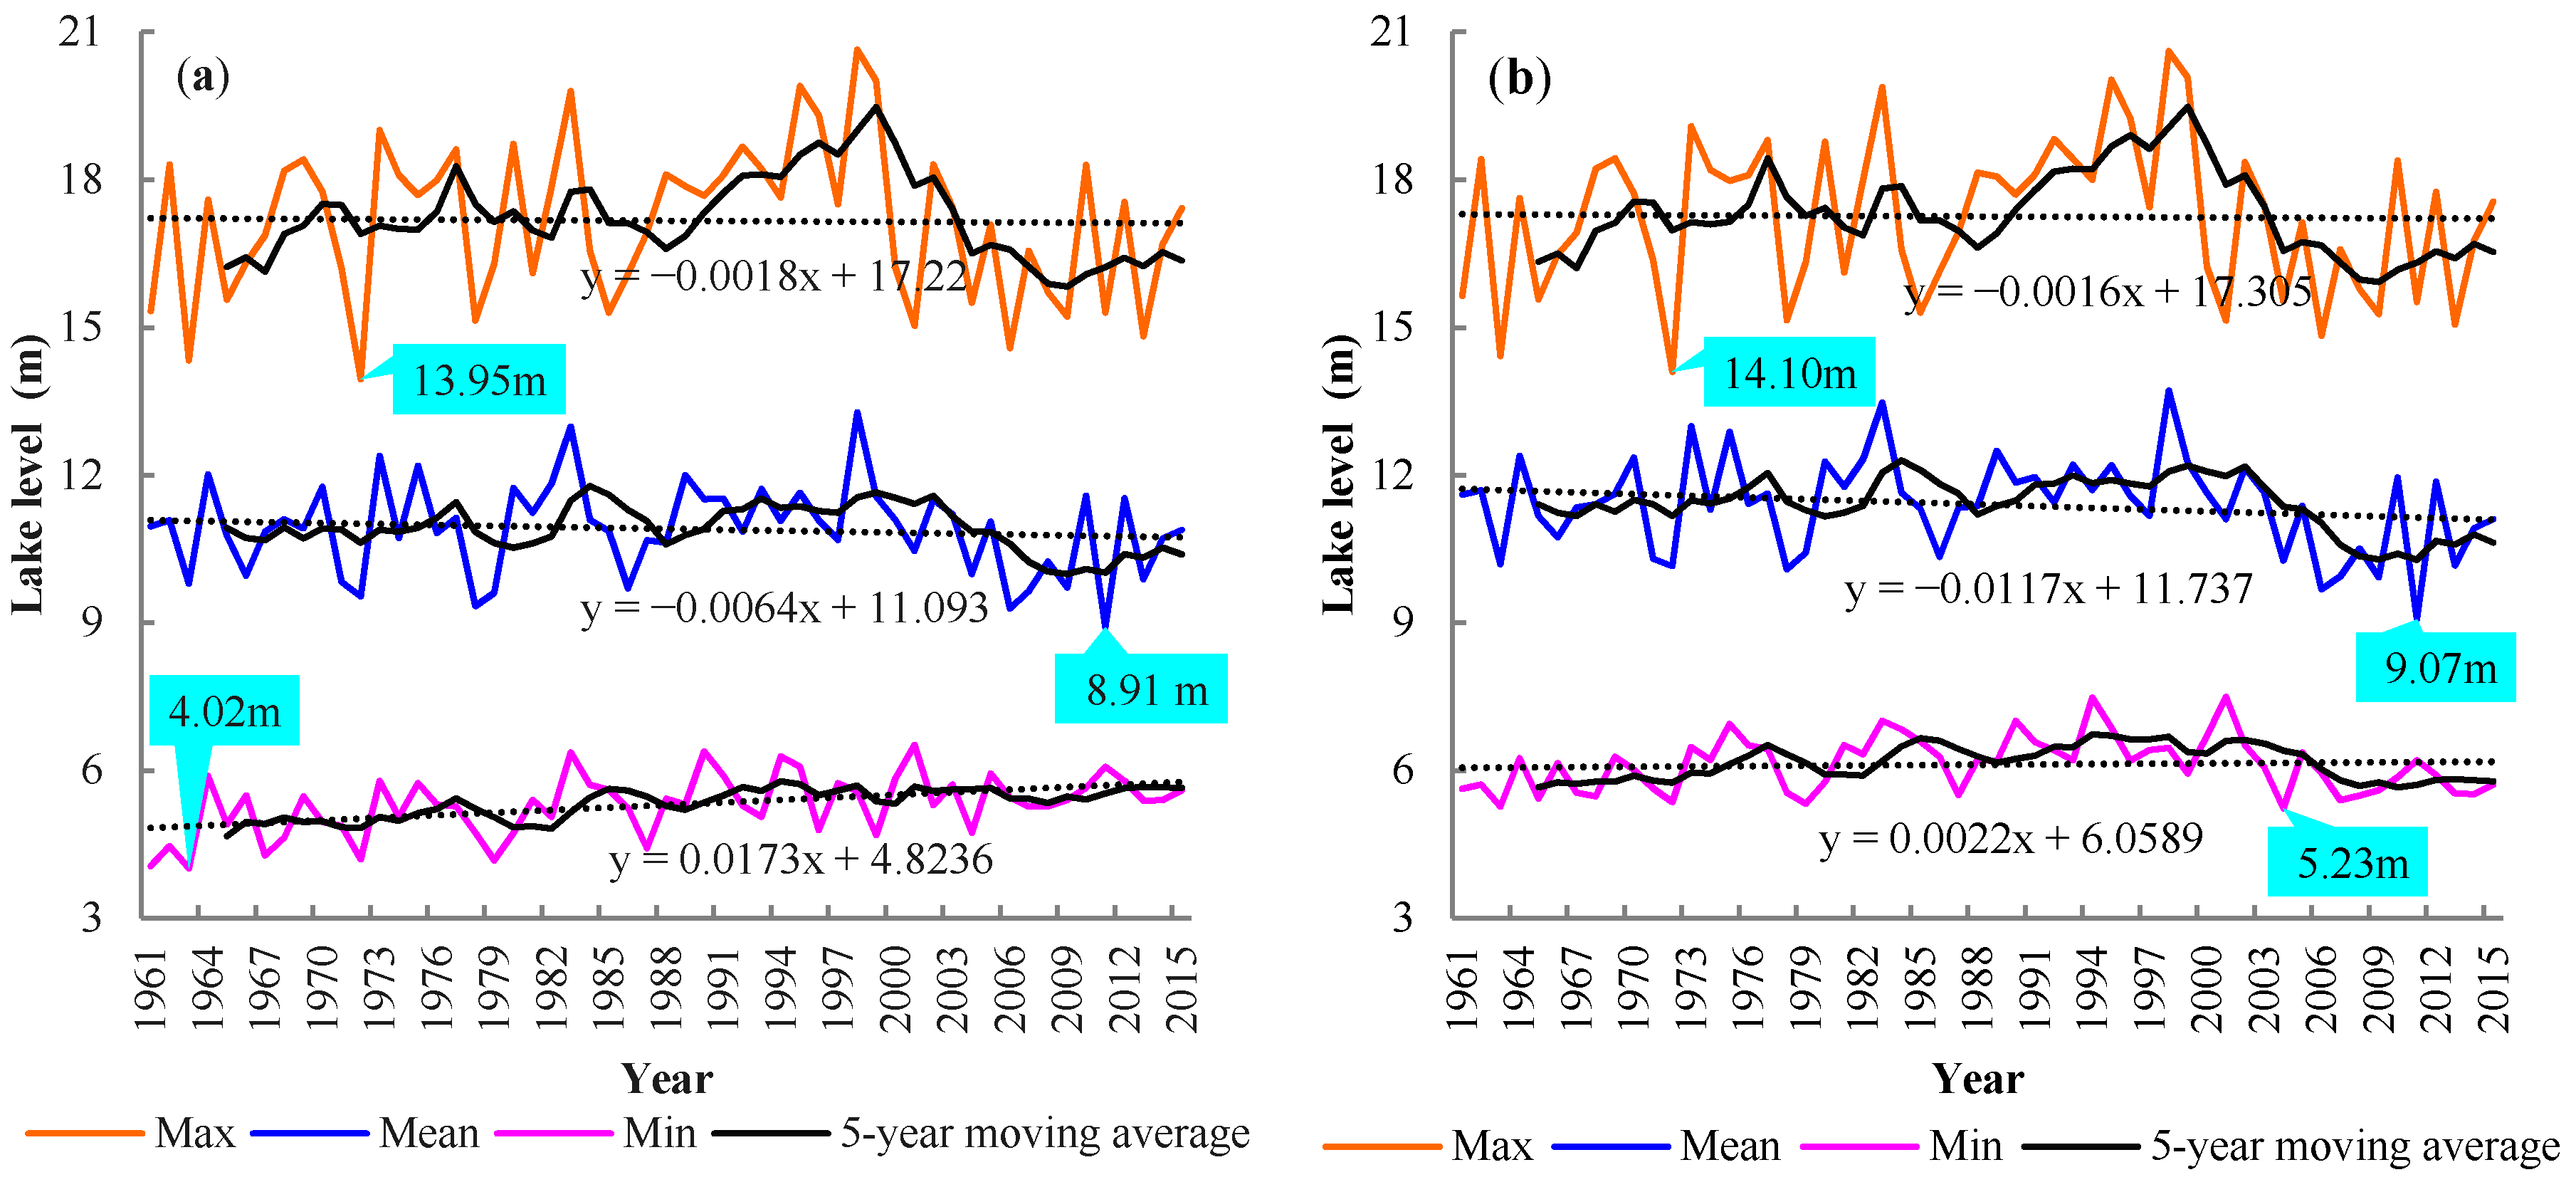
4.1.1. Inner-Annual Variation Characteristics of Lake Level

The Statistical results of the average lake level for each month in different decades at Xingzi station can be seen in Figure 3. These data indicate that, over the past five decades, the minimum monthly average lake level generally appeared in January, with an average value of 7.12 m, whereas the maximum value appeared in July, with an average level of 15.87 m. As shown in Figure 3, the monthly average lake level in all decades had a similar single-peak characteristic, showing a gradual increase from January to July and a decrease from July to December. Comparing the situations during different decades revealed that the average lake level of each month was relatively high during the 1990s, especially in July, when the monthly average level was 17.47 m. Additionally, the average lake levels in different months during the 2000s were lower than those during other periods, which was particularly noticeable from September to November.
The seasonal variation trend of the monthly average lake level at Xingzi station was obtained by using the accumulative anomaly method. As shown in Figure 4, the accumulative anomalies in spring (Figure 4a), especially in March and April, experienced declines in the 1960s and 1970s, while they showed an upward trend from the 1980s to the 1990s and then decreased in the 2000s. The overall characteristics of the accumulative anomaly curves in summer and winter were similar (Figure 4b,d), as both of them decreased slowly in the 1960s and 1970s, fluctuated in the 1980s, increased in the 1990s, and then decreased significantly in the 2000s. In autumn (Figure 4c), the accumulative anomalies generally presented an upward trend before the 2000s. However, the downward trend during 2000–2015 was more obvious compared with those of other seasons, and the rate of decline accelerated dramatically, especially in October. The calculated rate of change of the water level at Xingzi station revealed that the velocity of water level drawdown in October during the 2000s was 11.26 cm/day, which was much faster than the multiyear average value of 7.72 cm/day.

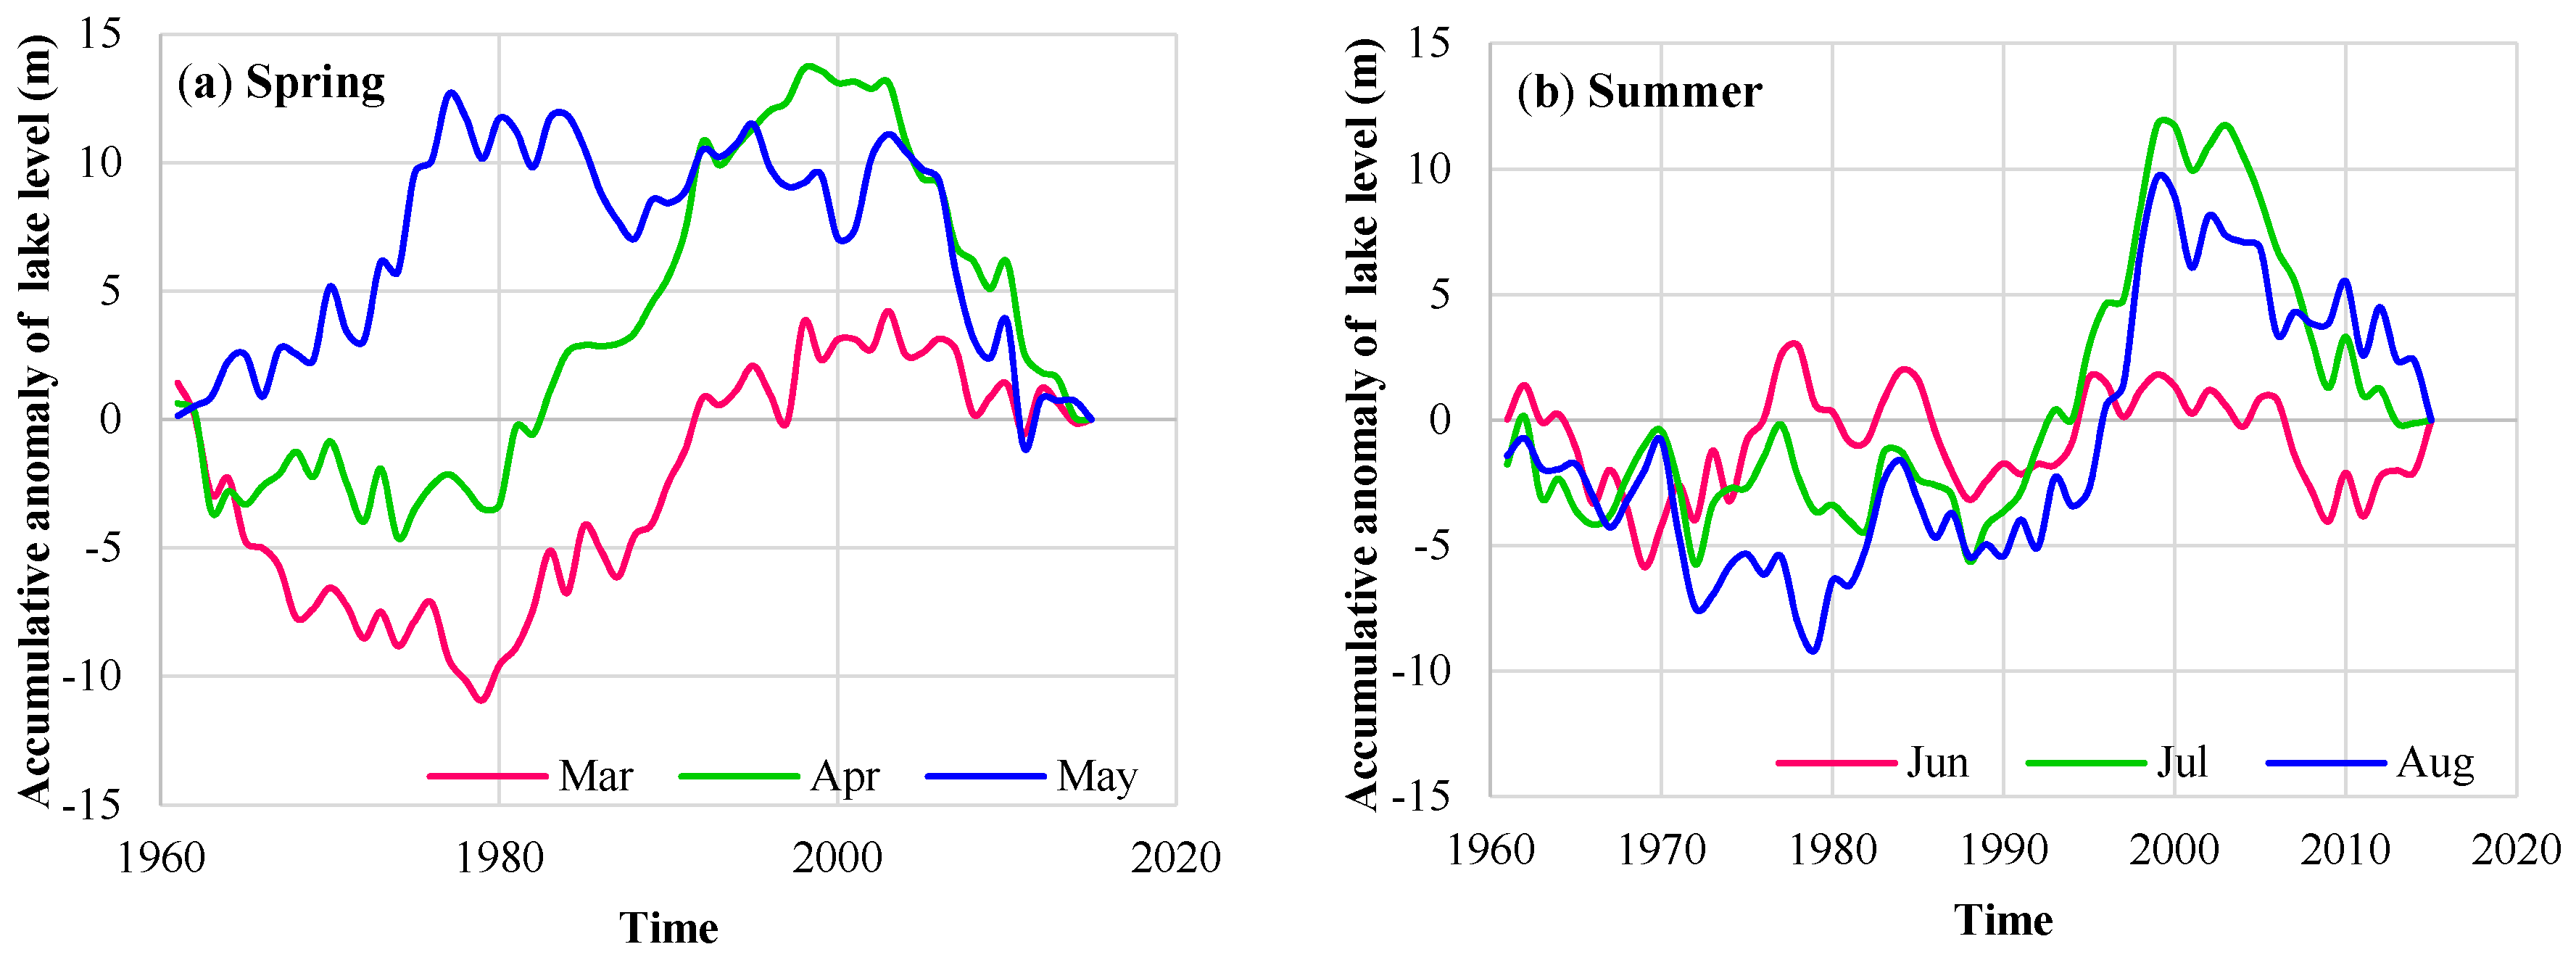
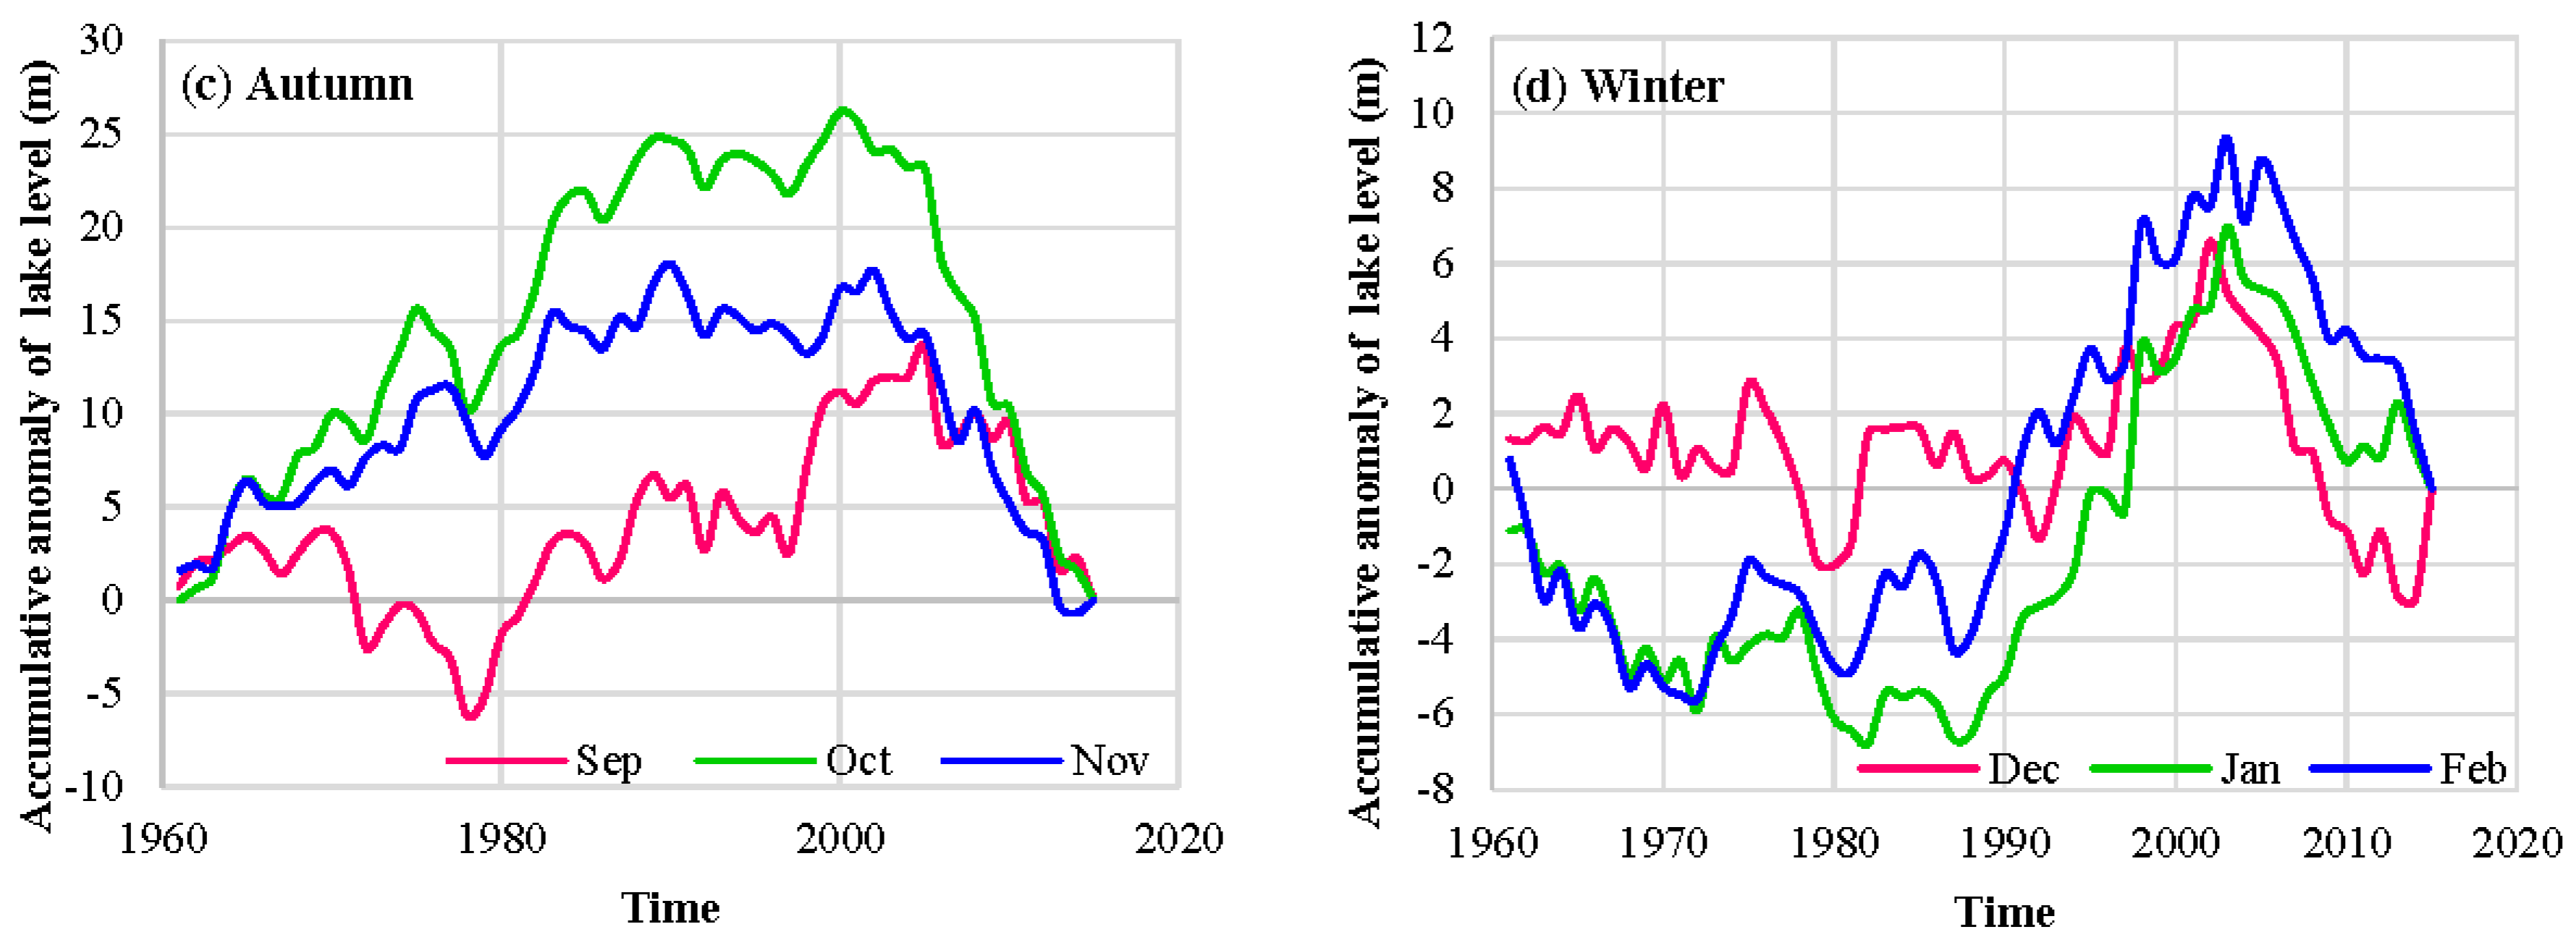
4.1.2. Inter-Annual Variation Characteristics of Lake Level

Figure 5 shows the fluctuating changes, and linear and five-year moving average trends of the annual average, maximum, and minimum water levels at the six gauging stations in Poyang Lake, i.e., Hukou, Xingzi, Duchang, Wucheng, Tangyin and Kangshan.
The analysis of linear trends reveals that the inter-annual variations of both the maximum and average water levels at each gauging station presented declining trends. Meanwhile, although the linear trends of the minimum water levels at Hukou and Xingzi stations increased slightly, the inter-annual variations in the minimum water levels of the other four stations showed different degrees of decline. In terms of the five-year moving values, the annual average water levels at all stations decreased obviously after 2003; the annual maximum water level at each gauging station exhibited an obvious upward trend before 2000, but dropped distinctly from 2000 to 2015; the upward trend of annual minimum water level at Hukou was obvious from 1961 to 2002, before stabilizing after 2003, however, the trends at Xingzi, Duchang, Wucheng, Tangyin and Kangshan all declined after 2003.
By analyzing the average, maximum, and minimum water levels of each gauging station for every year, we can see that the lowest historical maximum water level value at all stations occurred in 1972. However, the lowest annual average water levels all appeared in 2011. In addition, the extremely low water levels at Xingzi, Duchang, Wucheng, Tanyin, and Kangshan occurred in 2004 (5.23 m), 2014 (5.71 m), 2015 (6.38 m), 2007 (7.82 m), and 2004 (10.11 m), respectively, which indicate that the appearance times of extremely low water level at each station all occurred after 2000.

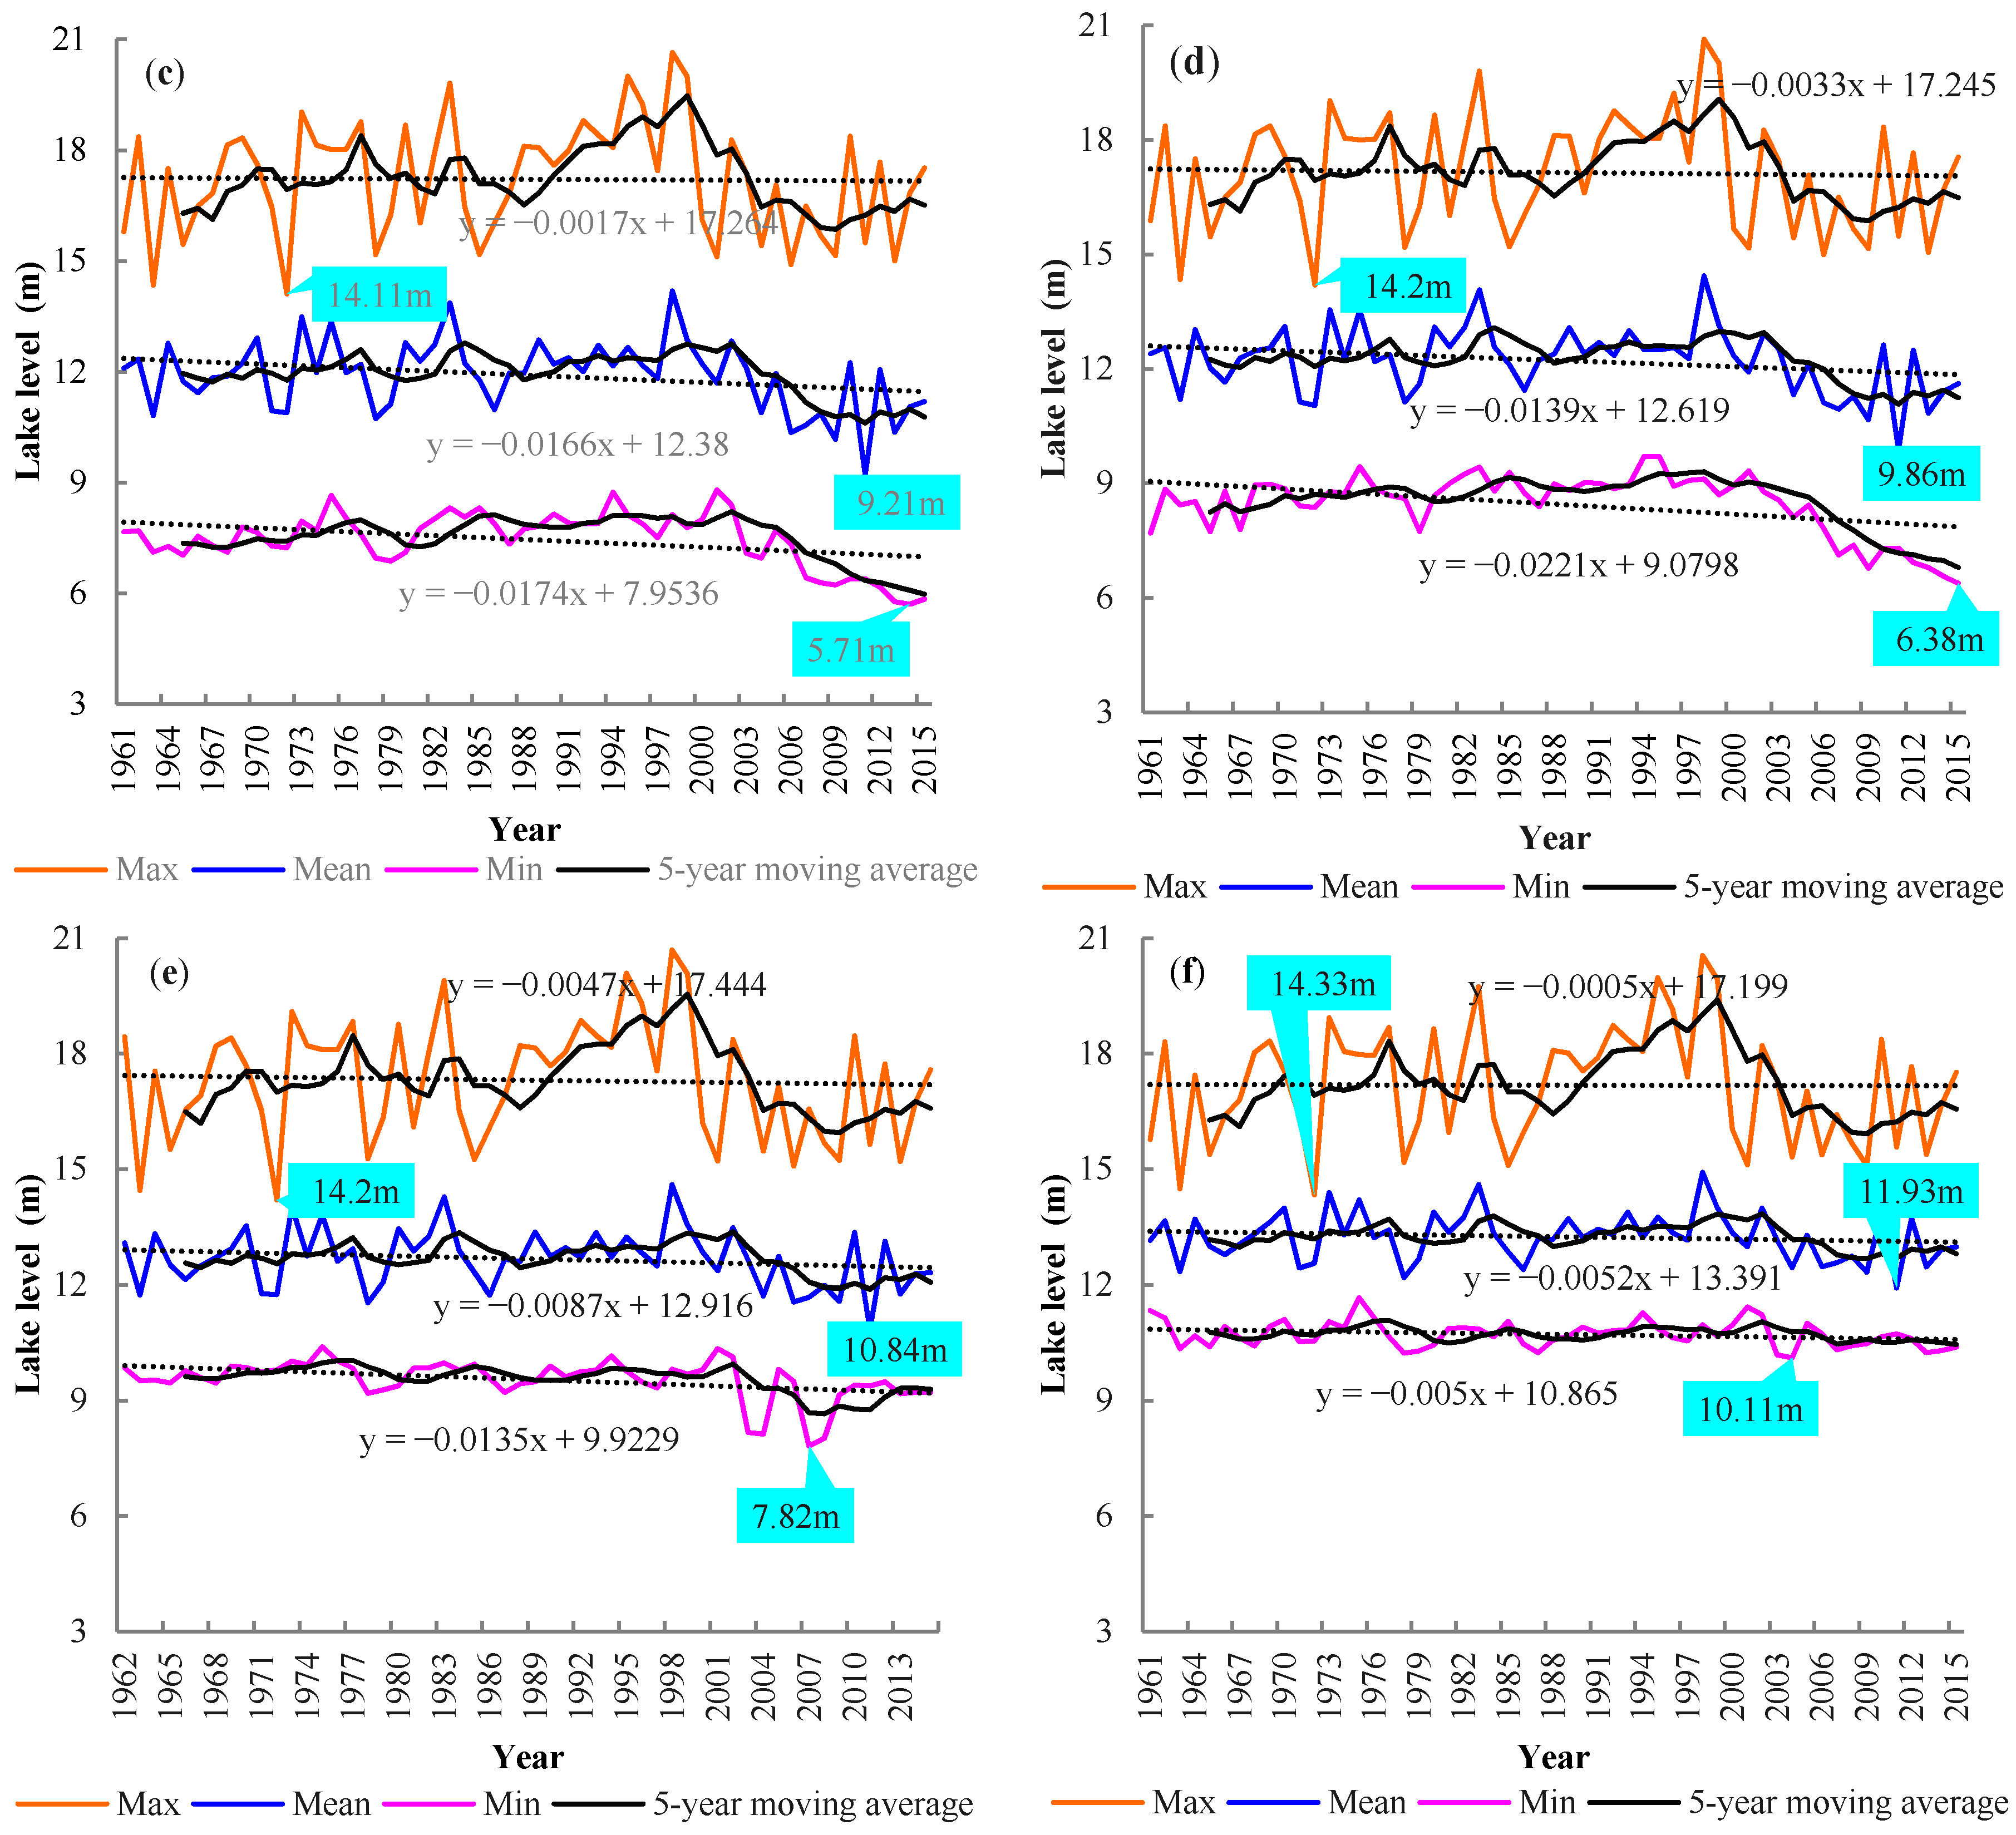
4.1.3. Temporal Statistics of Low Lake Level

The dry episode of Poyang Lake generally begins in August or September and ends in February or March of the following year [55]. According to the statistics for many years, once the water level at Xingzi dropped below 10 m during the water-receding period, Poyang Lake entered a dry state, and once it fell below 8 m, the dry state became more severe [56]. Therefore, the onset times and durations of periods when the lake level was below 10 m and 8 m at Xingzi during 1961–2015 were counted in this study (Table 2, Figure 6). The results indicated that the onset times of different grades of low lake level, i.e., 10 m and 8 m, in Poyang Lake were both in advance, and their durations became longer after the year 2000.
First, the statistics of the earliest appearance date when the water level first below 10 m in different periods indicated that the dates were concentrated from September to November during the 1960s–1990s; however, during the 2000s, the earliest date was 22 August, which was 77 days, 10 days, 55 days, and 28 days earlier than those in the previous decades, respectively. Comparing the average appearance date of the water level below 10 m reveals that it always appeared in November during different periods without much fluctuation. However, the duration when the water level was below 10 m was longest in the 2000s, i.e., 142 days, which was longer than those in previous decades by 22 days, 14 days, 35 days, and 28 days, respectively (Table 2, Figure 6a).
Then, we examined the more severe dry condition in Poyang Lake, when the water level at Xingzi fell below 8 m. As shown in Table 2 and Figure 6b, except for the period of the 1970s, when the water level below 8 m appeared earliest on 24 October, the earliest appearances during the periods of the 1960s, 1980s and 1990s all occurred in November. However, this time moved forward to 28 September during the 2000s. Similarly, not only the earliest date of this appearance but also the average date moved forward during 2000–2015. In addition, the duration lasted for 84 days, which was longer than before.

4.2. Meteorological Drought in the Basin

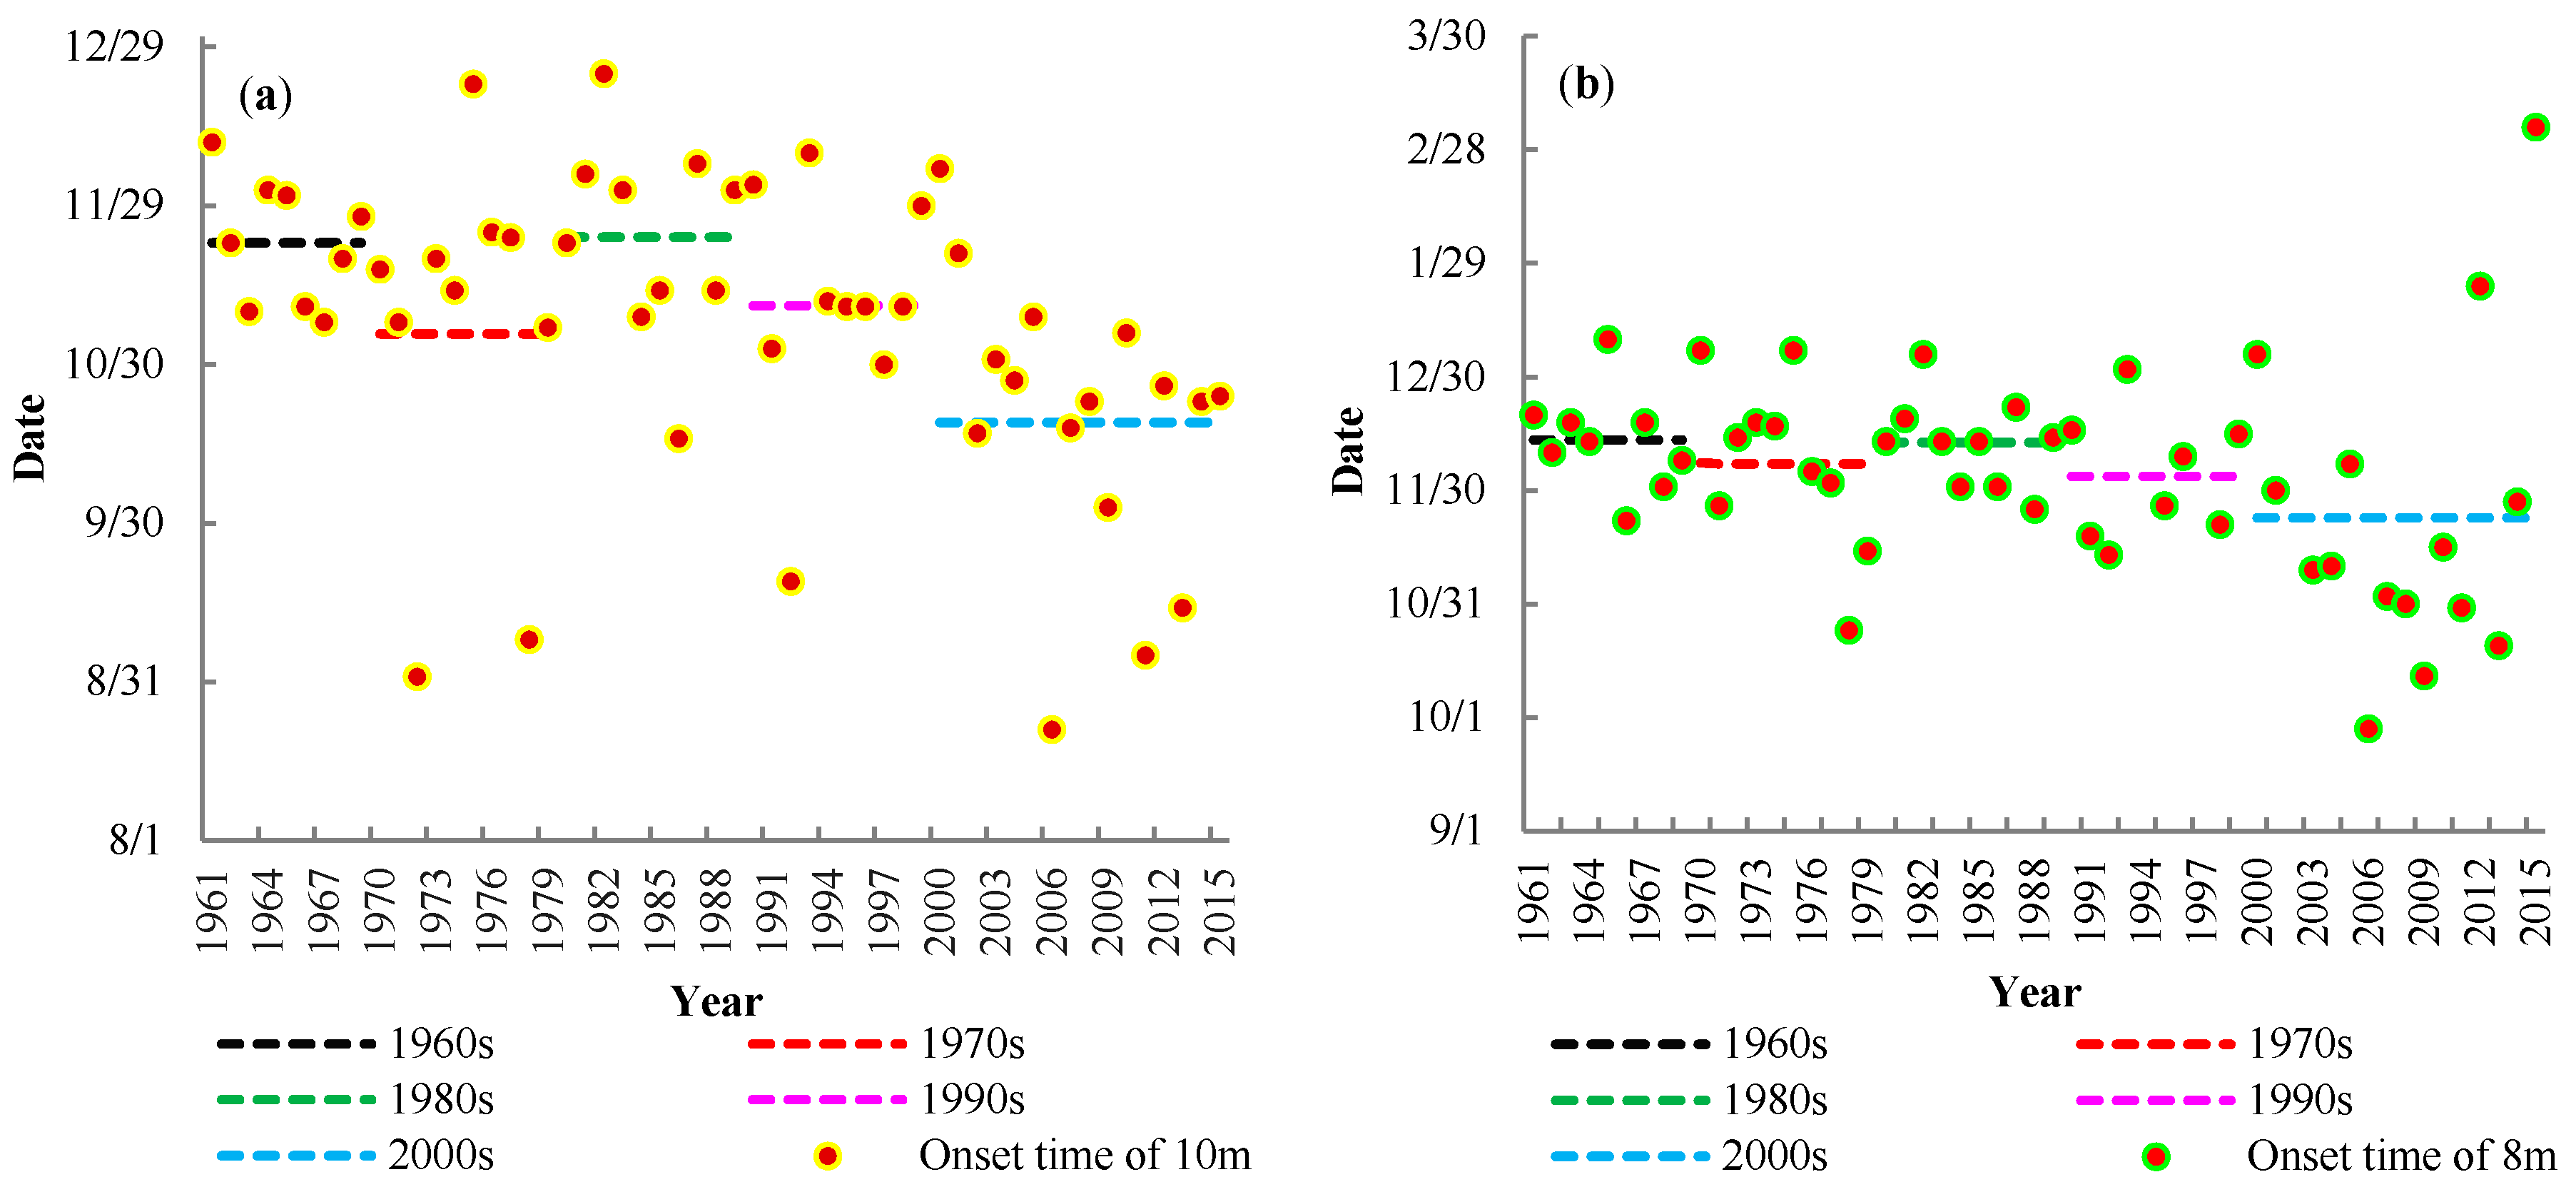
4.2.1. Spatial-Temporal Trends of the SPEI

In this study, the Mann–Kendall trend test was used to study the spatial and temporal trend changes of the SPEI series in the Poyang Lake Basin. Here, we show the spatial variation trends of the annual and seasonal SPEI values in Figure 7, where the red “+” and black “−” denote the upward and downward trends representing wetter and drier meteorological conditions, respectively. For the annual SPEI values (Figure 7a), 19 out of 23 stations exhibited non-significant upward trends; only Poyang station in the north, and Suichuan, Ganxian, and Guangchang stations in the south showed non-significant downward trends, which illustrated that the Poyang Lake Basin showed a general wetter condition over the past 55 years. As shown in Figure 7b–e, on a seasonal basis, the Poyang Lake Basin was generally characterized by non-significant downward trends in spring and autumn (Figure 7b,d), which indicated that drying tendencies dominated the entire basin in these two seasons. It should be noted that there were partial stations showing upward trends in autumn because of the uneven distributions of precipitation and temperature. Figure 7c,e shows that the whole basin was generally characterized by upward trends in summer and winter. Thus, the wet tendency prevailed over the Poyang Lake Basin in these two seasons. Additionally, two stations, i.e., Jingdezhen and Jinxian, showed significant upward trends at the α = 0.05 level in summer.

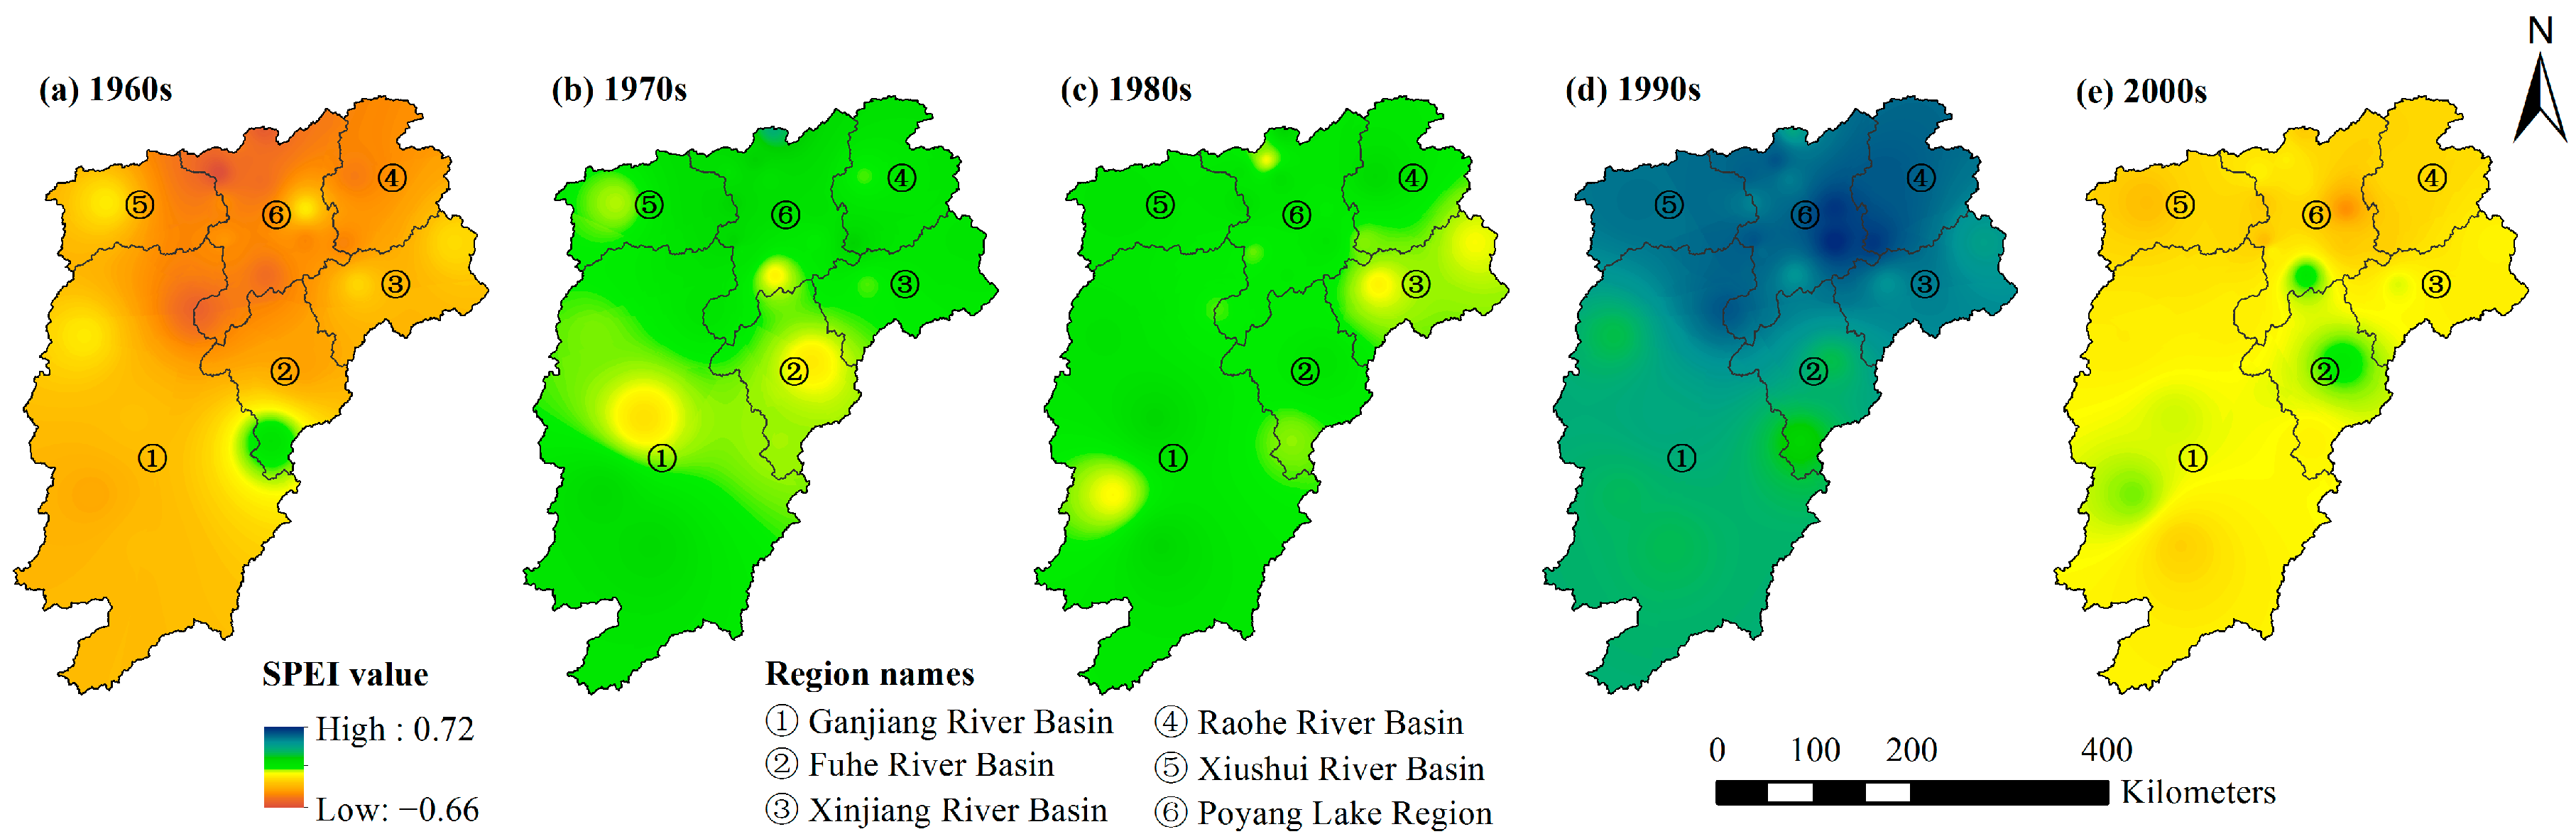
4.2.2. Spatial-Temporal Distribution Characteristics of the SPEI

Considering that the spatial distribution of meteorological drought will change over time, the authors divided the study period into five periods (i.e., the 1960s, 1970s, 1980s, 1990s, and 2000s) and calculated the SPEI values on a 12-month timescale for each meteorological station in this paper. By using the Inverse-distance weighting (IDW) method [57], the spatial distributions of the annual average SPEI values in different periods over the basin, as obtained using the ArcGIS (version 10.2.2, Environmental Systems Research Institute, Redlands, CA, USA) software platform, are presented in Figure 8.
Figure 8a shows that the SPEI values of the entire basin were generally low during the 1960s and that the meteorological drought condition in the Poyang Lake region was relatively severe compared to those in other subbasins. In the 1970s, the overall SPEI values of the whole basin increased; the Poyang Lake region and the southern part of the Ganjiang River Basin exhibited the most obvious increases (Figure 8b). In the 1980s, the watershed SPEI values decreased slightly, with the lowest level occurring in the Xinjiang River Basin in the northeastern part in the study area (Figure 8c). In the 1990s, the whole basin existed in a wet state (Figure 8d), the drought phenomenon was not obvious, and the SPEI values decreased from north to south. In addition, the SPEI values were relatively low in the Ganjiang and Fuhe River Basins. During the 2000s, the SPEI in Poyang Lake Basin dropped again (Figure 8e), and its spatial distribution was similar to that during the 1960s. In general, the SPEI values in the basin decreased from south to north. In particular, the Poyang Lake region again became the region with the lowest SPEI values, and the SPEI values in the Xiushui and Raohe River Basins were also relatively low.
In short, the SPEI values of the Poyang Lake Basin were relatively low during the 1960s, representative of a wet state in the 1990s, and indicative of a second relative drought period during the 2000s.

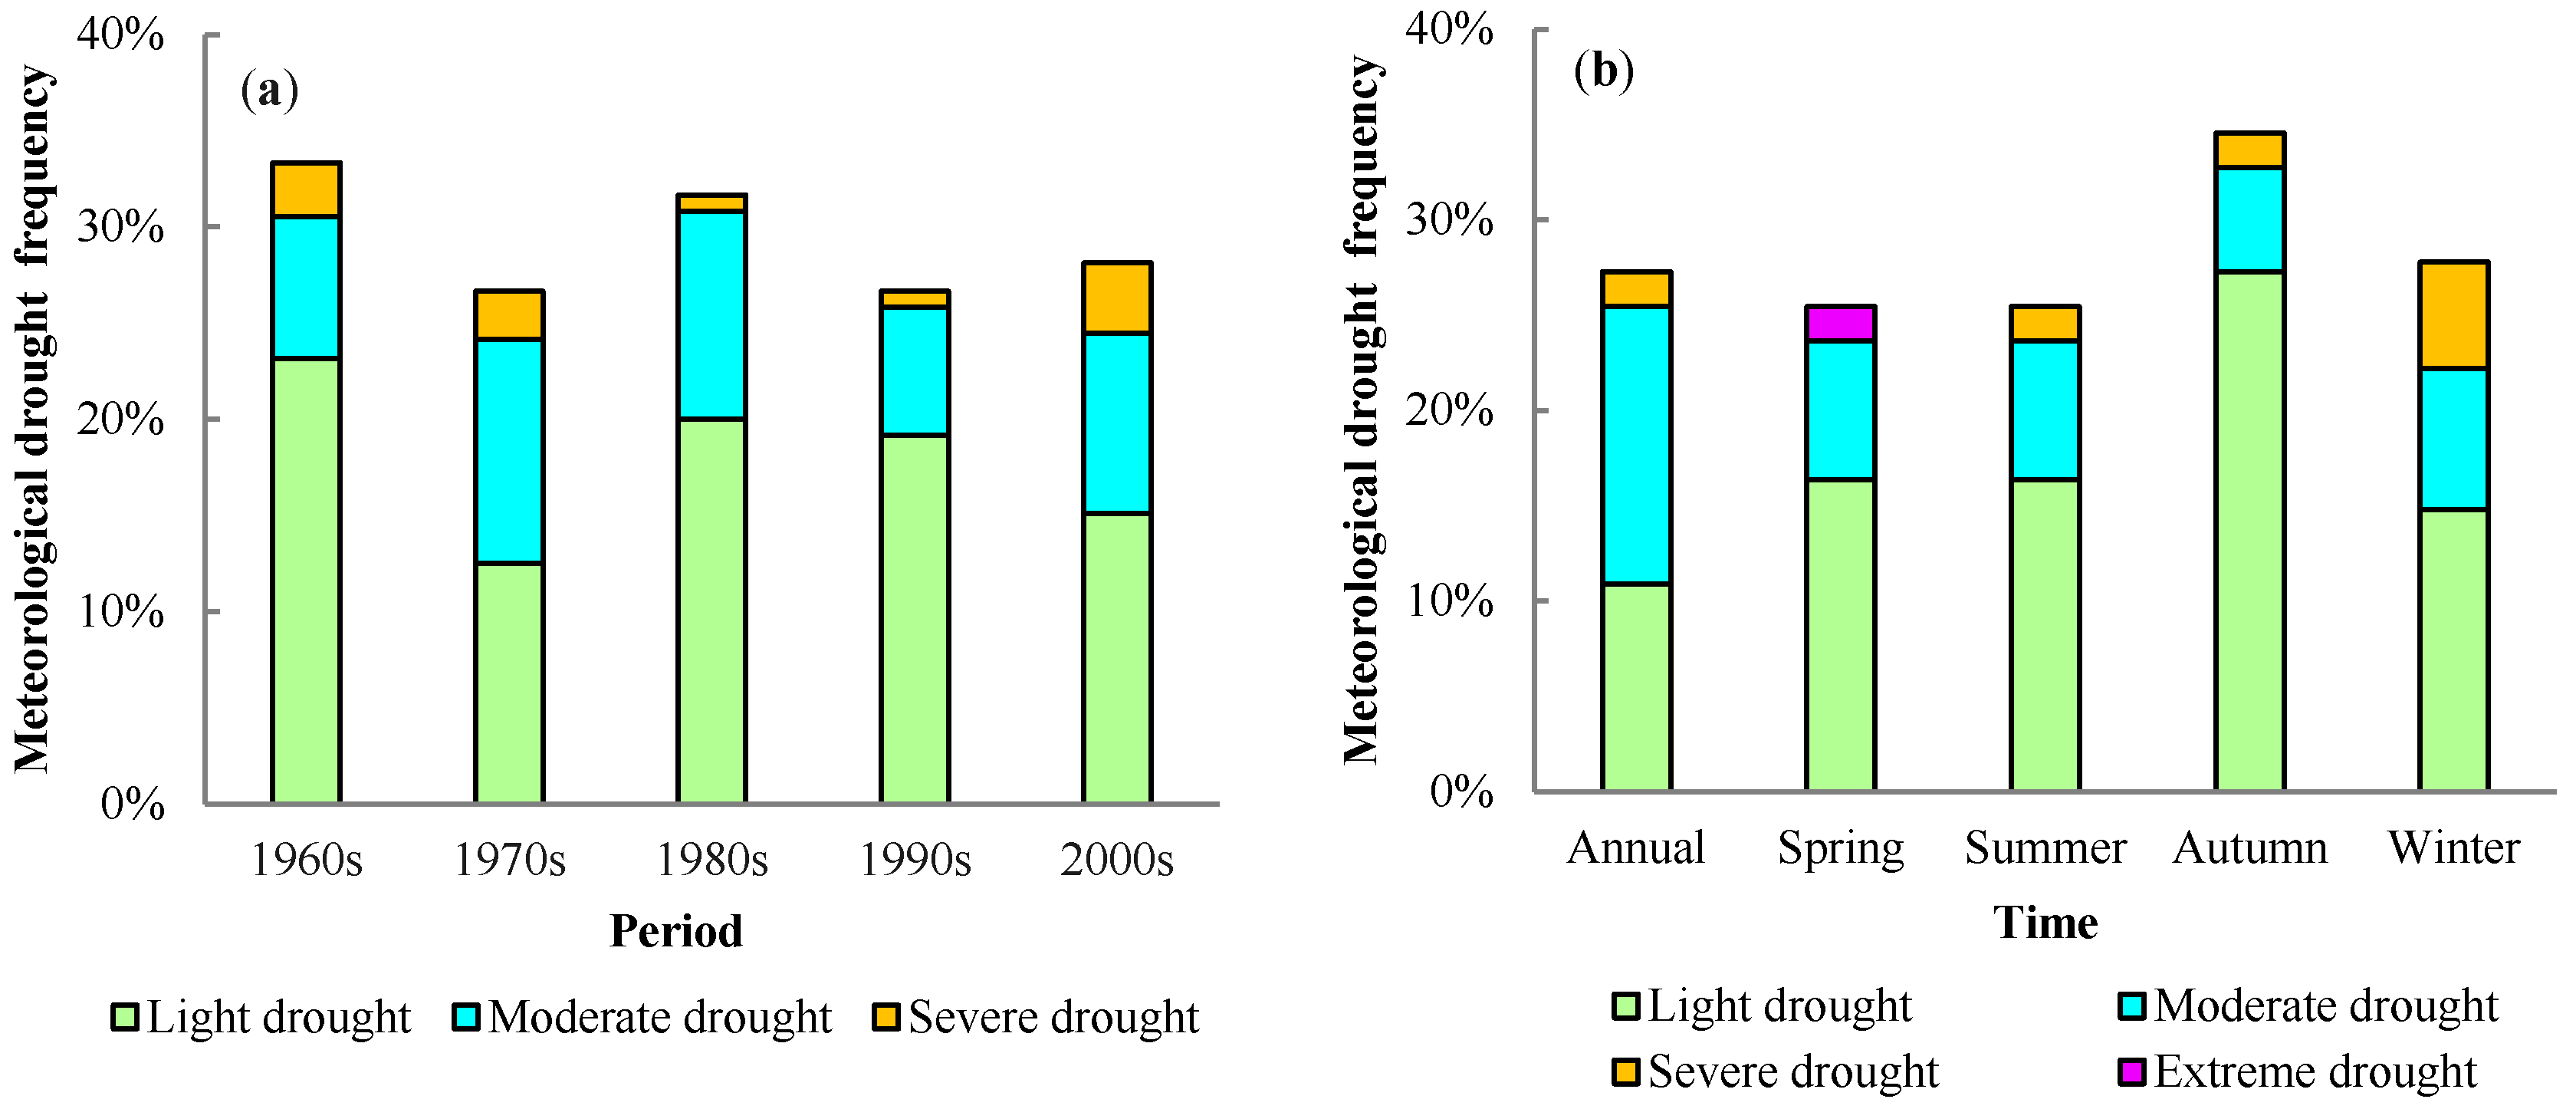
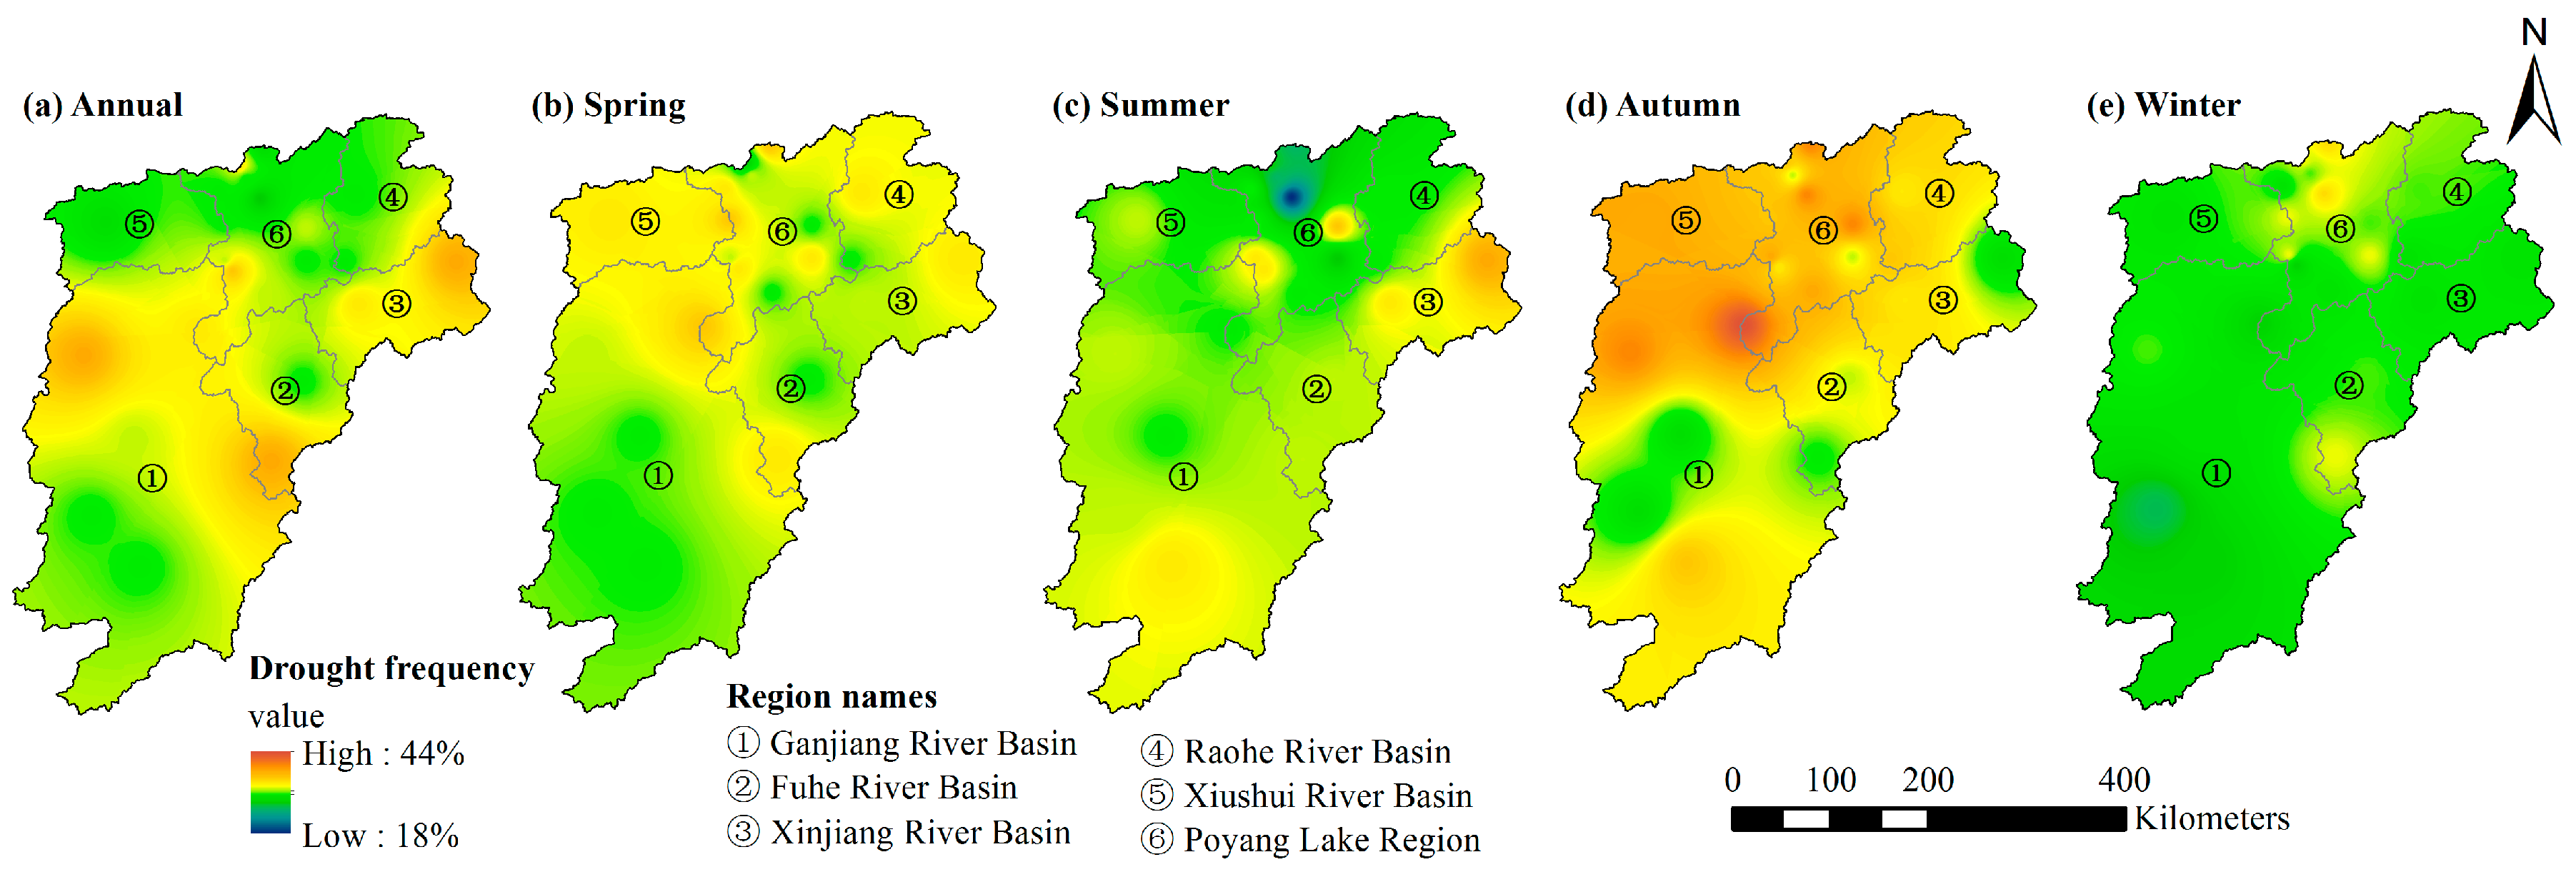
4.2.3. Drought Frequency

The statistical results indicate that there were 192 months during the period of 1961–2015 in which meteorological drought (SPEI ≤ −0.5) occurred in the Poyang Lake Basin. Among these drought months, light drought occurred in 116 months, moderate drought occurred in 61 months, and severe drought occurred in 15 months. Moreover, from a decadal point of view, the total occurrence frequency of meteorological drought in the past 55 years has experienced a repeated “down-up-down-up” process (Figure 9a). By the 2000s, the frequency reached 28.1%, of which the occurrence frequency of severe drought reached the maximum value of all decades, i.e., 3.6%. As shown in Figure 9b, based on the annual SPEI, the frequency of meteorological drought in the entire basin was 27.3%, of which moderate drought was dominant, accounting for 14.5%. On a seasonal basis, the highest frequency was 34.5%, which occurred in autumn, followed by 27.8% in winter. Although the frequencies of spring and summer droughts were both 25.5%, there was one year in which extreme drought occurred in spring, with a frequency of 1.8%.
To further analyze the spatial distribution variations of meteorological drought occurrence frequency, the Inversed Distance Weight (IDW) method was applied to interpolate the drought characteristics of 23 meteorological stations to the Poyang Lake Basin using ArcGIS. Figure 10 illustrates the different spatial patterns of drought occurrence frequency. From an annual perspective, the drought frequency ranged from 27.3 to 38.2%, with the highest frequency occurring in Yichun, Guangchang (which is located in the central part of the entire basin), and Yushan (which is located in the northeast). Comparing the meteorological drought conditions of the subbasins revealed that the drought frequency in the Xinjiang River Basin reached 34.6%, which was higher than those of other subbasins; the Fuhe River Basin had the second-highest frequency of 33.6%, and the Xiushui River Basin had the lowest frequency of 31.1% (Figure 10a). On a seasonal basis (Figure 10b–e), over the years, autumn drought has most frequently occurred in the Poyang Lake Basin (29.1–43.6%) and has had the largest coverage, mainly in the northeastern region of the whole basin, namely, the northern part of the Ganjiang River Basin, the Poyang Lake region and the Xiushui River Basin (Figure 10d). Spring drought had the second-highest frequency of 27.3–36.1%; although its coverage decreased, the northeastern region of the entire basin remained the main area of occurrence (Figure 10b). Finally, the meteorological drought frequencies of the entire basin in summer and winter were relatively low (Figure 10c,e).

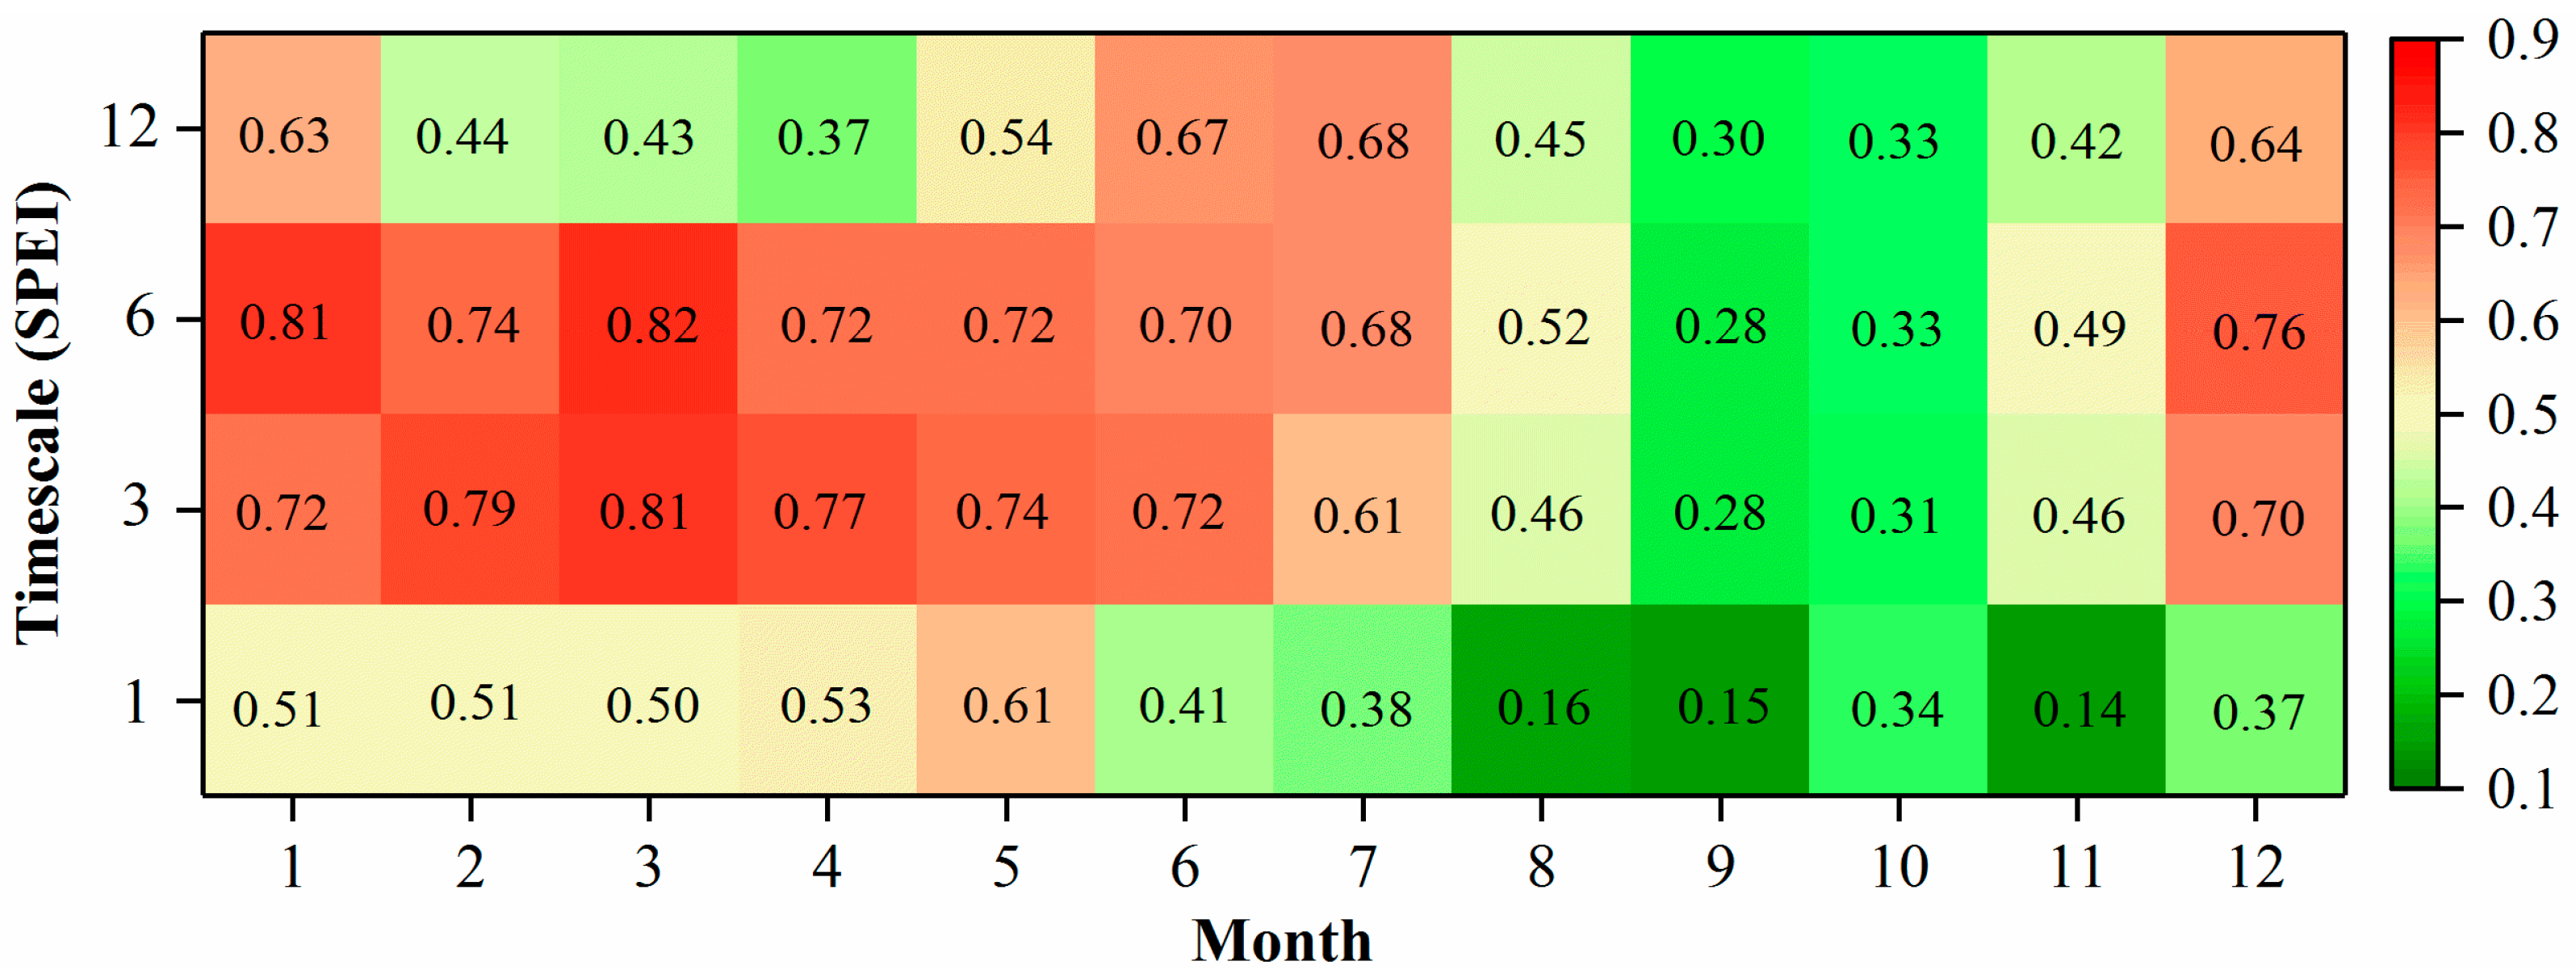
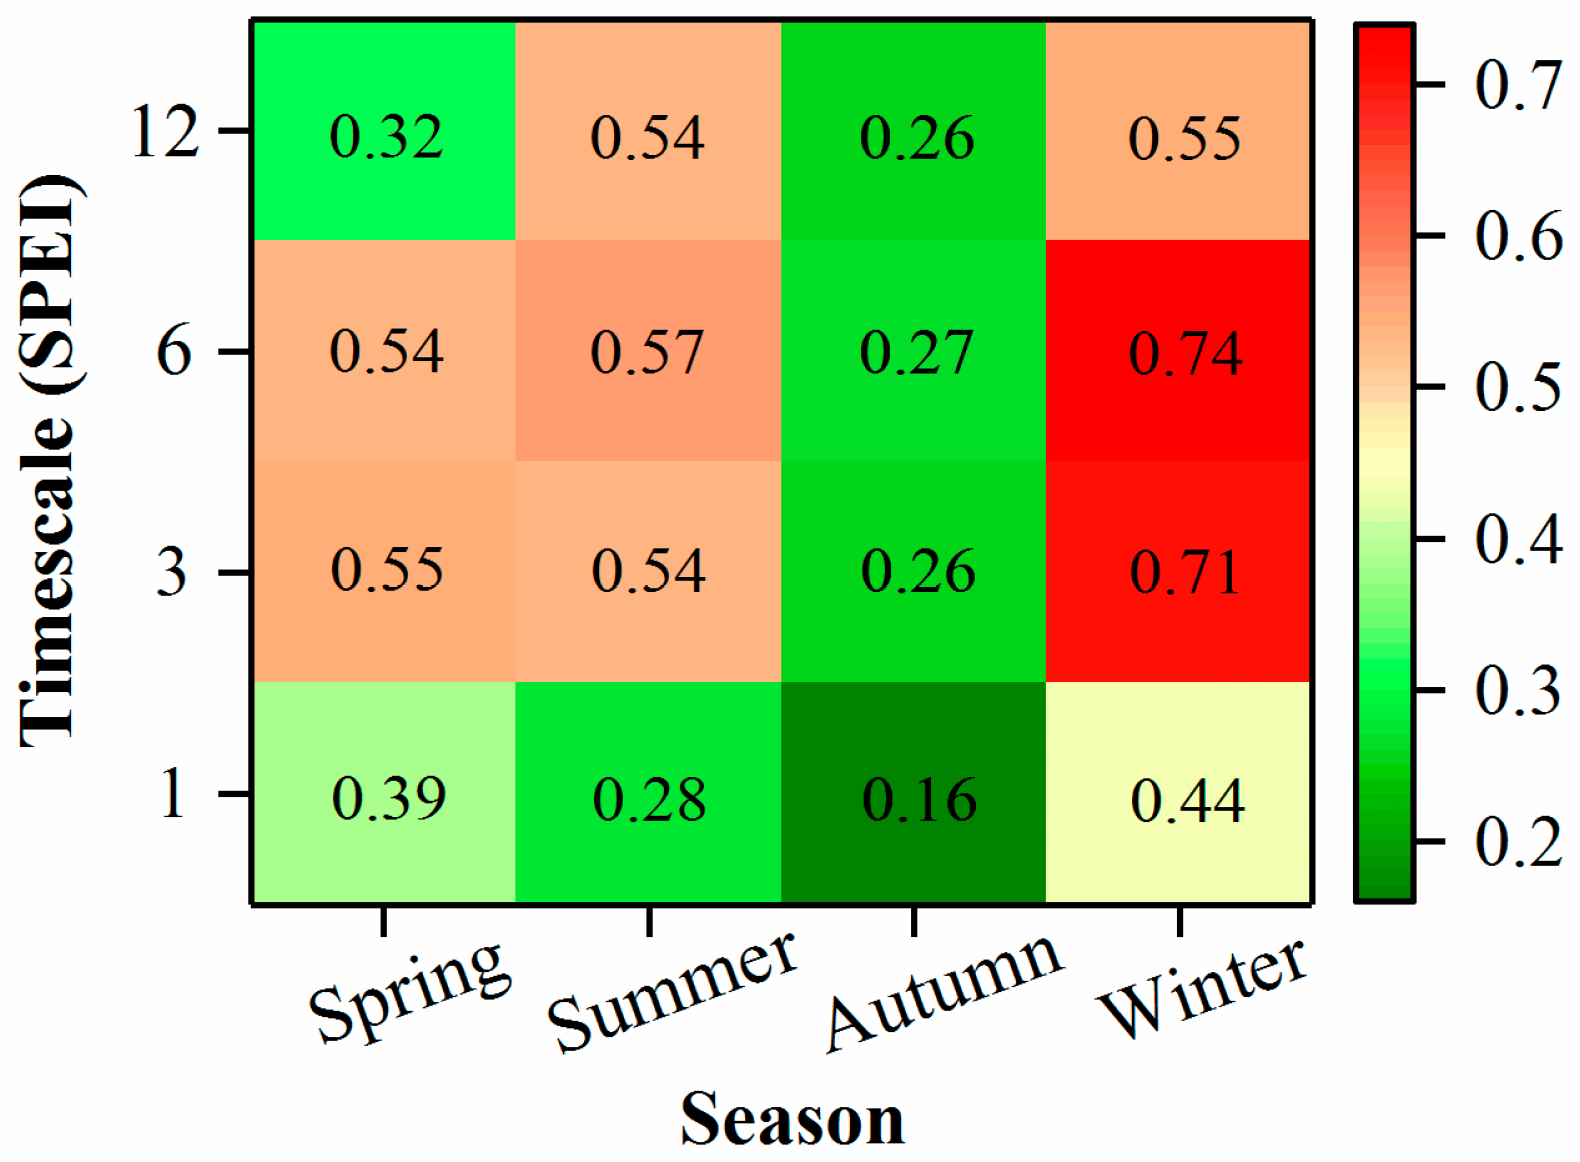
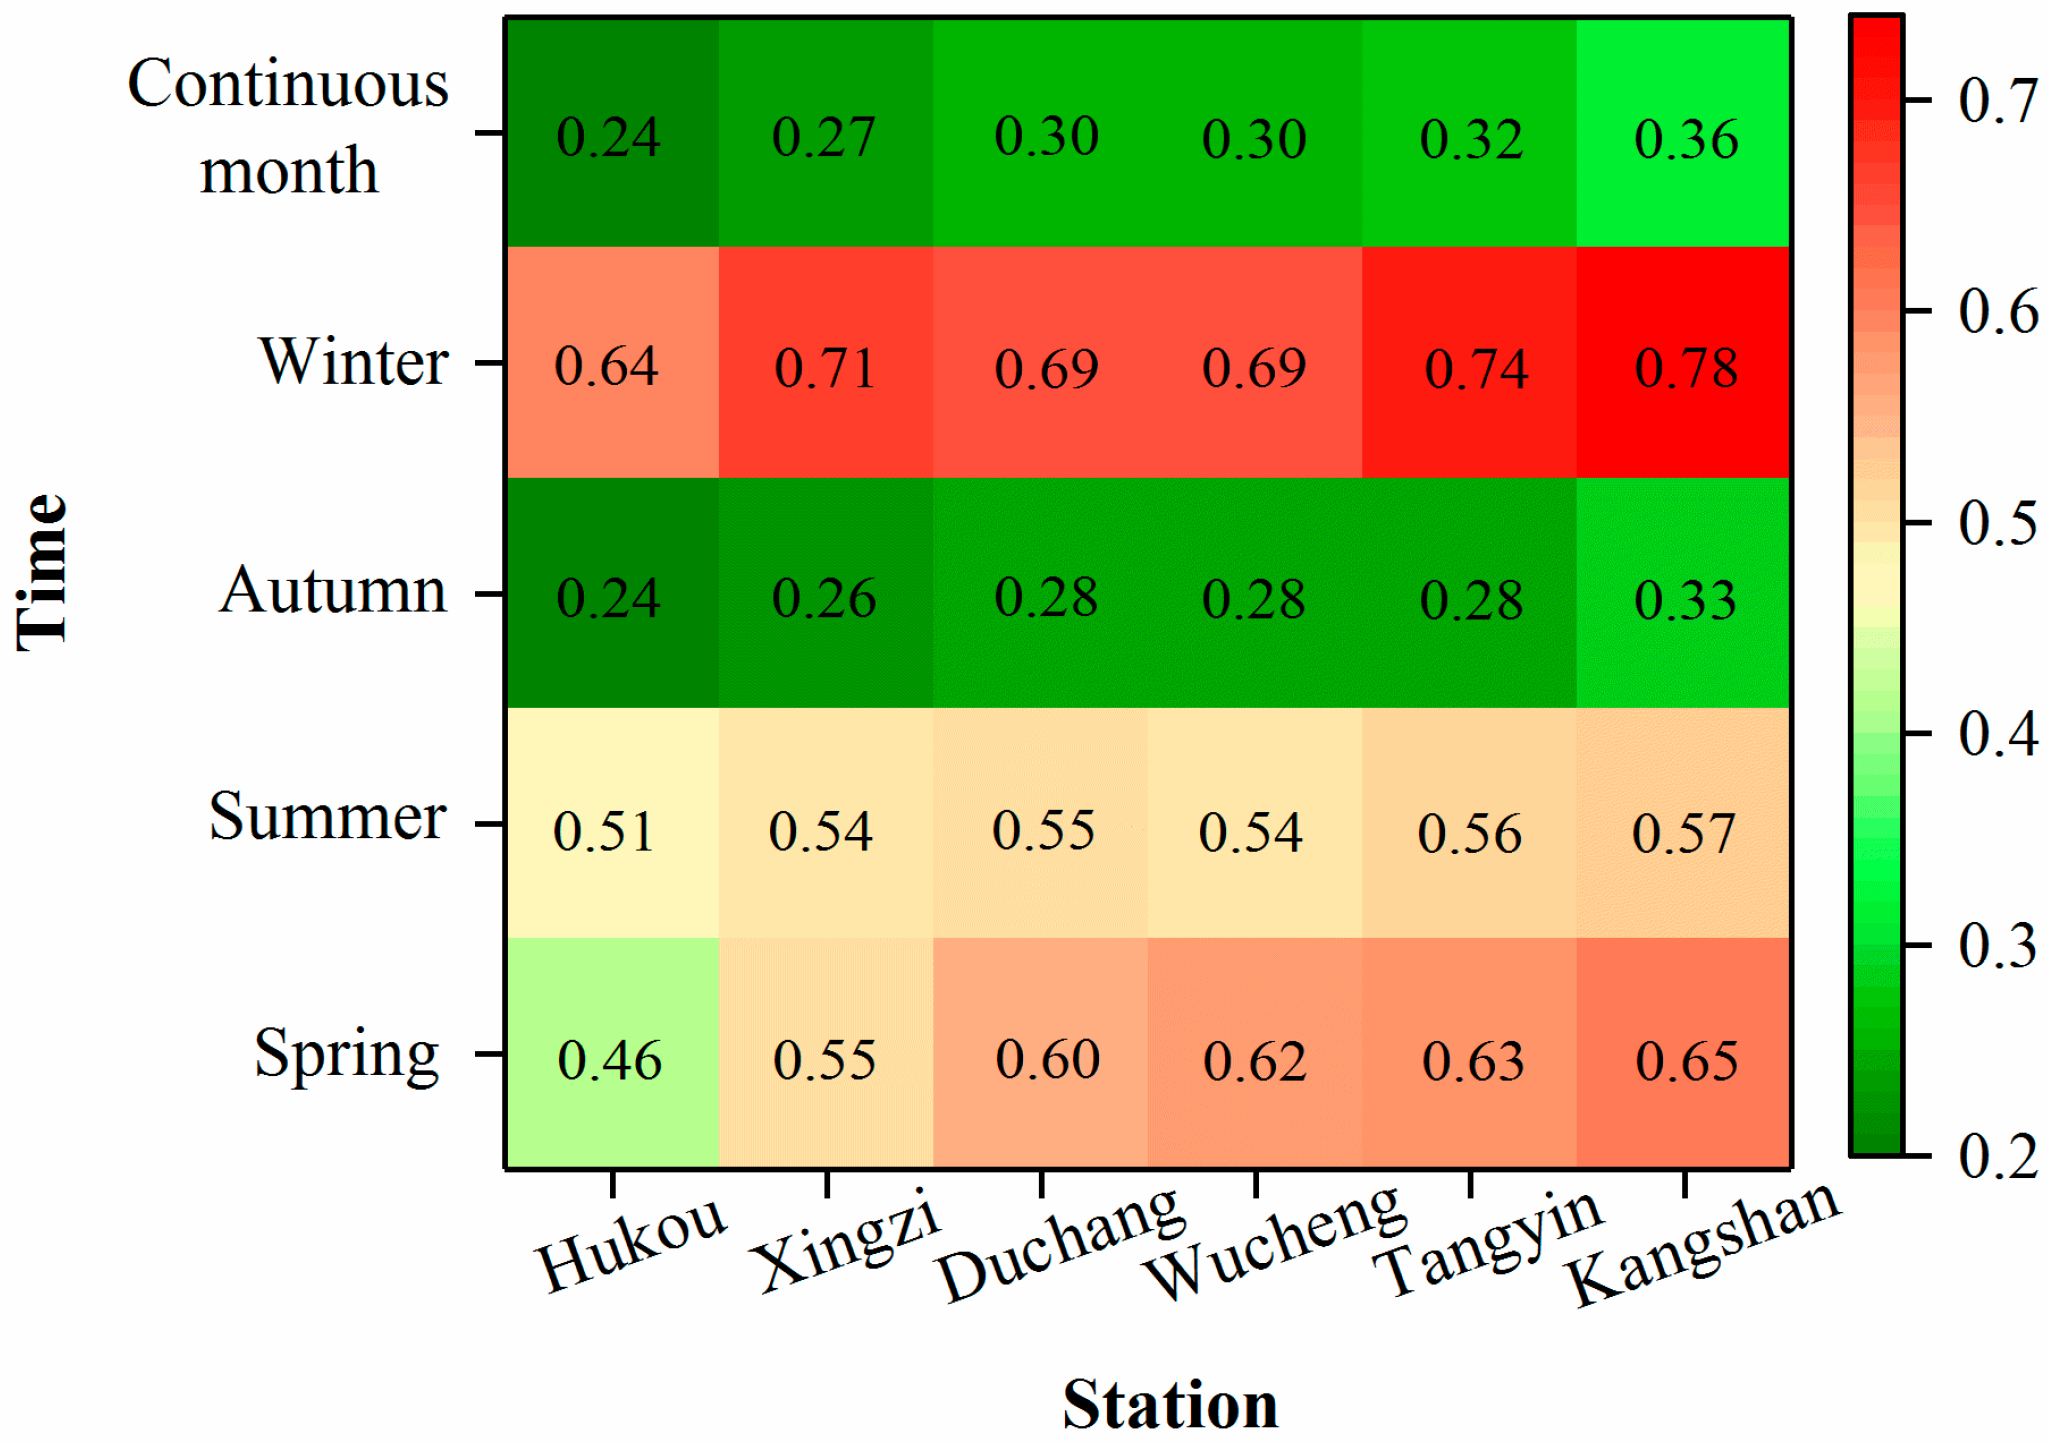
4.3. Correlation Analysis between Meteorological Drought and Lake Level

To explore how the water level of Poyang Lake has responded to the meteorological drought index (SPEI) over the past five decades, this study analyzed the correlations between the monthly average water level at each gauging station and the SPEI values at different (1-, 3-, 6-, and 12-month) timescales during 1961–2015. Almost all of the correlation coefficients passed the significant correlation test of 0.01, that is, the water level of Poyang Lake exhibited significant correlations with the variations in the SPEI series.
The temporal distribution characteristics of the influence of meteorological drought on the water level in Poyang Lake were analyzed in this study by calculating the correlation coefficients between the monthly average water level of Xingzi station and the SPEI values at 1-, 3-, 6-, and 12-month timescales. As Figure 11 shows, from a temporal perspective, the lake level was closely related to the SPEI at three- and six-month timescales. The maximum correlation coefficients at three- and six-month timescales were 0.81 and 0.82, respectively, and the minimum correlation coefficients were both 0.28. However, the correlations between the lake level and the SPEI values at 1- and 12- month timescales were relatively poor. The maximum correlation coefficients at 1- and 12-month timescales were 0.61 and 0.68, respectively, and the minimum correlation coefficients were only 0.14 and 0.37, respectively. Additionally, the correlations varied greatly in different months, as higher correlations were mainly concentrated from January to March.
On a seasonal basis, the correlation between lake level and the SPEI was best in winter, with a maximum of 0.74 and a minimum of 0.44, which was followed by summer. The correlation in autumn was the worst, with a maximum of 0.27 and a minimum of 0.16 (Figure 12).
To further analyze the spatial distribution characteristics of the response between the water level in Poyang Lake and the meteorological drought in the entire basin, using the SPEI data series at a three-month timescale as an example, the authors calculated the correlation coefficient between the SPEI values and the monthly average water level at each gauging station in Poyang Lake. Figure 13 demonstrates that the correlation coefficients increased from north to south, as the correlation at Hukou was the worst at 0.24–0.64. However, Kangshan station, which was far from the lake outlet, showed the best correlation, with a maximum of 0.78 and a minimum of 0.33. Thus, the spatial distribution regularity of the correlation between the SPEI and the monthly average lake level was basically as follows: Hukou < Xingzi < Duchang < Wucheng < Tangyin < Kangshan. Comparing the correlation coefficients of different seasons clearly shows that this correlation was still best in winter (0.64–0.78), while it remained the worst in autumn (0.24–0.33).

5. Discussion

This study demonstrates the water level in Poyang Lake has experienced a dramatic and prolonged reduction after the year 2000 by analyzing the long-term records of water level data; the results of this study are consistent with those of recent studies [58,59,60]. Moreover, compared with previous research, this paper not only used more complete lake level data covering six gauging stations and extended the study time series, but also put forward some new findings. For example, the decline of the lake’s water level since the year 2000 has been dramatic, especially in autumn; the appearance times of extremely low water level at the six gauging stations all occurred after 2000. In addition, the main innovation of this paper is combining the lake level in Poyang Lake with the meteorological drought index (SPEI), exploring the spatial-temporal response relationships between them by correlation analysis.

5.1. Analysis of the Driving Forces of the Poyang Lake Dryness

It is well-known that the dryness problem in Poyang Lake has had a great impact on the water supply and ecosystem health in this region. To date, many scholars have attempted to explore the causes of the water level reduction in the Poyang Lake since 2000. Zhao et al. [61] argued that the intra- and inter-annual variations in water level in Poyang Lake exhibit significant correlations with the inflows from the five rivers. Min et al. [62] argued that the main reasons for the reduction of the lake’s water level were the changes in precipitation in the basin and inflows from the five rivers. Liu et al. [63] analyzed the phenomenon and causes of the frequent extreme drought events in the Poyang Lake region during 2000–2010 on the basis of water balance in the basin. Their results also showed that the precipitation deficit in the basin was the basic factor leading to drought in the Poyang Lake region and that the increase in evapotranspiration in the basin enhanced the degree of drought; however, the contribution of outflow discharge to the Poyang Lake droughts was less than that of precipitation in the basin. Moreover, Guo et al. [64] predicted, based on climate change in the Poyang Lake Basin, that the precipitation and runoff in the Poyang Lake Basin will continue to decrease in the second half of the year over the next decade or so. Coupled with the combined effect of the Three Gorges Dam, the dryness problem of Poyang Lake may continue to intensify in the next ten years. This conclusion should attract increased attention from all sectors of the community. In contrast, some other scholars have obtained different conclusions. Ye et al. [65] indicated that the Yangtze River discharge has a greater impact on the annual lake level variation than the lake’s catchment inflow and that the advance of the Poyang Lake dry season has been primarily driven by climate change in the Yangtze River Basin since the 1990s and was further aggravated by the Three Gorges Dam in the 2000s. Mei et al. [66] quantified the average contributions of the regulation of the Three Gorges Dam, precipitation changes, and human activities in the Poyang Lake Basin to the water level reduction in Poyang Lake as 56.3%, 39.1%, and 4.6%, respectively. In addition to the comprehensive effects of the five rivers, the Yangtze River, and water conservancy projects, there are some other factors that affect the lake’s water level. For instance, Jiangxi Province implemented the water-control strategies of returning farmland to the lake and transmigrating and establishing towns after an extreme flood disaster in 1998, which resulted in an increase in the lake area and a consequent drop in water level [67]. In addition, large amounts of sand extraction in Poyang Lake since 2003 have resulted in variations in the lake terrain and caused the outflow channel of the lake to become wider and deeper, thus allowing the lake to drain quickly and reach a lower water level [68]. However, Mei et al. [66] argued that the contribution of sand extraction to the reduction of the lake’s water level since 2000 may be overestimated. In addition, Ye et al. [65] also argued that the specific effects of changes in lake terrain conditions on the lake’s water level require further study. In summary, the abovementioned data demonstrate that the factors affecting the water level of Poyang Lake are numerous and complicated, and further research is needed in the future.
In this study, relationships between the Poyang Lake dryness and climate change in the entire basin has been analyzed from a new research perspective based on the meteorological drought index (SPEI). From the results of this paper, it can be seen that there were some similar characteristics between water level in the Poyang Lake and the SPEI series, especially on seasonal and decadal bases. The authors further discussed the specific response relationship between them in this paper.

5.2. Responses of the Lake Level to the SPEI

The response relationship between lake level and the meteorological drought index (SPEI) was analyzed in this paper. From a temporal perspective, the lake level was closely related to the SPEI at three- and six-month timescales, with maximum correlations of 0.81 and 0.82, respectively. This may indicate that the response of water level in Poyang Lake to meteorological drought requires a certain amount of time and that three or six months are precisely the optimum time for the lake level to respond to a decrease in precipitation and an increase in temperature. It is not true that, when precipitation begins to decrease or temperature increases on a short timescale, such as one month, the water level in Poyang Lake will drop. In addition, if the timescale is too long (12 months), the response of the water level to climate change in some months will be attenuated, which does not favor the ability of the lake level to capture the meteorological drought.
From a seasonal perspective, this research indicated that the correlation between lake level and SPEI was best in winter and worst in autumn. This could indicate that, in winter, the inflows from the five rivers, which is affected by the dry-wet condition in the basin, is the main influence factor of the lake level. However, in autumn, the influence of inflows from the five rivers is weakened, and the river–lake relationship between the Yangtze River and the Poyang Lake is more closely related to the changes in lake level, especially when the impoundment of the Three Gorges Dam from September to October during the 2000s.
Moreover, the correlation between lake level and the SPEI followed a pattern of spatial distribution: Hukou < Xingzi < Duchang < Wucheng < Tangyin < Kangshan. This is not particularly surprising, given the relationships between Poyang Lake, the Yangtze River, and the five rivers (Ganjiang, Fuhe, Xinjiang, Raohe, and Xiushui) in the Poyang Lake Basin. Hukou station is located at the junction of the Yangtze River and Poyang Lake. The water level at this station is strongly affected by the interactions between the Yangtze River and the lake; therefore, its correlation with climate change in the Poyang Lake Basin is relatively worse. In addition, some previous studies [69,70] have argued that the closer distance to the lake outlet, the more vulnerable to the river–lake relationship. However, the other stations are located relatively far from the lake outlet and closer to the estuaries where the lake receives water from the five rivers in the basin, which results in their better correlation with the meteorological drought index of the basin.

6. Conclusions

This study used the Poyang Lake Basin as a research area and analyzed the enhanced reduction of water level after the year 2000 in the Poyang Lake and the spatial and temporal characteristics of meteorological drought over the entire basin using multiple methods, including the SPEI, Mann–Kendall trend test, accumulative anomaly, and moving average. The main conclusions are as follows:
  • Compared to past decades, the dryness in Poyang Lake has become more dramatic since 2000. In addition, during the 2000s, the lake level clearly decreased in autumn, with a speed of 11.26 cm/day. The annual average, maximum, and minimum lake levels showed decreasing trends during the past decade. Moreover, the occurrences of the different grades of low lake level (10 m, 8 m) in the Poyang Lake both moved forward, and their durations were also prolonged.
  • The meteorological drought in the Poyang Lake Basin showed obviously seasonal characteristics over time; drying tendencies were apparent in spring and autumn, which will undoubtedly make it more difficult for the region to achieve drought resistance. In addition, the worsening meteorological drought in autumn and spring may lead to severe agricultural drought in the Poyang Lake Basin. Furthermore, the spatial distribution of SPEI values in the 2000s showed that the Poyang Lake Basin has entered a second relative drought period. Moreover, seasonal meteorological droughts have also occurred frequently in previous decades, especially in autumn (34.5%).
  • There was a significant correlation between the water level of Poyang Lake and the meteorological drought index (SPEI), and the three- and six-month timescales were the optimum times for the lake level to respond to climate changes in the basin. Seasonally, the correlation between lake level and SPEI was best in winter, with a maximum correlation of 0.74, and worst in autumn. Furthermore, the correlation coefficients increased from north to south, namely, the spatial distribution of correlations between the SPEI and lake level was: Hukou < Xingzi < Duchang < Wucheng < Tangyin < Kangshan.
In summary, the results of this study could provide a scientific basis and support for future drought relief work and could facilitate the implementation of reasonable and effective water resource management in river basins. In addition, given that many factors affect the changes in water level in Poyang Lake, the variation tendency of the lake level under the influence of single or multiple factors and its mechanism of action will be the focus of future research.

Acknowledgments

This work is supported by the National Natural Science Foundation of China (51479219 and 51439007), National Basic Research Program of China (2016YFC0401701), Program for Innovative Research Team of IWHR (WE0145B592017), and Special Project for Basic Research of IWHR (WE0145B532017 and WE0145C032017).

Author Contributions

This research was carried out in collaboration among all authors. Xiaobo Liu provided the writing ideas for the study; Ruonan Wang completed the statistical analysis and wrote the paper; Xiaobo Liu and Wenqi Peng provided overall guidance; and Wenqiang Wu, Xuekai Chen, and Shijie Zhang supervised the study and provided scientific advice on the manuscript.

Conflicts of Interest

The authors declare no conflict of interest.

References

  1. Dai, A. Drought under global warming: A review. Wiley Interdiscip. Rev. Clim. Chang. 2011, 2, 45–65. [Google Scholar] [CrossRef]
  2. Wilhite, D.A. Drought as a natural hazard: Concepts and definitions. Drought Glob. Assess. 2000, 1, 3–18. [Google Scholar]
  3. Mishra, A.K.; Singh, V.P. A review of drought concepts. J. Hydrol. 2010, 391, 202–216. [Google Scholar] [CrossRef]
  4. Yao, Y.B.; Zhang, Q.; Li, Y.H.; Wang, Y.; Wang, J.S. Drought risk assessment technological processes and problems. Resour. Sci. 2013, 35, 1884–1897. (In Chinese) [Google Scholar]
  5. Glantz, M.H. Understanding: The drought phenomenon: The role of definitions. Water Int. 1985, 10, 111–120. [Google Scholar]
  6. Liu, M.; Xu, X.; Xu, C.; Sun, A.Y.; Wang, K.; Scanlon, B.R.; Zhang, L. A new drought index that considers the joint effects of climate and land surface change. Water Resour. Res. 2017, 53, 3262–3278. [Google Scholar] [CrossRef]
  7. Vicenteserrano, S.M.; Beguería, S.; Lópezmoreno, J.I. A multiscalar drought index sensitive to global warming: The standardized precipitation evapotranspiration index. J. Clim. 2010, 23, 1696–1718. [Google Scholar] [CrossRef]
  8. Zhou, L.; Wu, J.J.; L, A.F.; Zhang, J.; Zhao, L. Drought evolution of different land cover regions in North China. Geogr. Res. 2012, 31, 597–607. (In Chinese) [Google Scholar]
  9. Shi, B.L.; Zhu, X.Y.; Hu, Y.C.; Yang, Y.Y. Spatial and temporal variations of drought in Henan province over a 53-year period based on standardized precipitation evapotranspiration index. Geogr. Res. 2015, 34, 1547–1558. (In Chinese) [Google Scholar]
  10. Zhang, S.Y. Arid Meteorology; China Meteorological Press: Beijing, China, 2008.
  11. Wang, Z.L.; Huang, Z.Q.; Li, J.; Zhong, R.D.; Huang, W.W. Assessing impacts of meteorological drought on vegetation at catchment scale in China based on SPEI and NDVI. Trans. Chin. Soc. Agric. Eng. 2016, 32, 177–186. (In Chinese) [Google Scholar]
  12. Hao, Z.; Singh, V.P. Drought characterization from a multivariate perspective: A review. J. Hydrol. 2015, 527, 668–678. [Google Scholar] [CrossRef]
  13. Li, X.N.; Xie, P.; Li, B.B.; Zhang, B. A probability calculation method for different grade drought event under changing environment-Taking Wuding River basin as an example. ShuiLi Xuebao 2014, 45, 585–594. (In Chinese) [Google Scholar]
  14. Zhao, H.; Gao, G.; An, W.; Zou, X.; Li, H.; Hou, M. Timescale differences between SC-PDSI and SPEI for drought monitoring in China. Phys. Chem. Earth 2015, 102, 48–58. [Google Scholar] [CrossRef]
  15. Liu, L.; Hong, Y.; Bednarczyk, C.N.; Yong, B.; Shafer, M.A.; Riley, R.; Hocker, J.E. Hydro-climatological drought analyses and projections using meteorological and hydrological drought indices: A case study in Blue River Basin, Oklahoma. Water Resour. Manag. 2012, 26, 2761–2779. [Google Scholar] [CrossRef]
  16. Dabanli, I.; Mishra, A.K.; Şen, Z. Long-term spatio-temporal drought variability in Turkey. J. Hydrol. 2017, 552, 779–792. [Google Scholar] [CrossRef]
  17. Vicente-Serrano, S.M.; Beguería, S.; López-Moreno, J.I. Comment on “Characteristics and trends in various forms of the palmer drought severity index (PDSI) during 1900–2008” by Aiguo Dai. J. Geophys. Res. Atmos. 2011, 116, 484–491. [Google Scholar] [CrossRef]
  18. Wang, L.; Chen, W. Applicability analysis of standardized precipitation evapotranspiration index in drought monitoring in China. Plateau Meteorol. 2014, 33, 423–431. (In Chinese) [Google Scholar]
  19. Ye, X.C.; Li, Y.L.; Li, X.H.; Xu, C.Y.; Zhang, Q. Investigation of the variability and implications of meteorological dry/wet conditions in the Poyang Lake Catchment, China, during the period 1960–2010. Adv. Meteorol. 2015, 72, 928534. [Google Scholar] [CrossRef]
  20. Yang, M.; Yan, D.; Yu, Y.; Yang, Z. SPEI-based spatiotemporal analysis of drought in Haihe River Basin from 1961 to 2010. Adv. Meteorol. 2016, 2016, 7658015. [Google Scholar] [CrossRef]
  21. Dan, Z.; Bo, Z.; Jing, L.; Zhang, C.; Meiling, A.N.; Dong, W. SPEI-based intensity characteristics and cause analysis of drought in north China during recent 50 years. J. Nat. Disasters 2014, 23, 192–202. [Google Scholar]
  22. Sun, B.; Zhao, H.; Wang, X. Spatiotemporal characteristics of drought in northeast China based on SPEI. Ecol. Environ. Sci. 2015, 24, 22–28. [Google Scholar]
  23. Vörösmarty, C.J.; Mcintyre, P.B.; Gessner, M.O.; Dudgeon, D.; Prusevich, A.; Green, P.; Glidden, S.; Bunn, S.E.; Sullivan, C.A.; Liermann, C.R. Global threats to human water security and river biodiversity. Nature 2010, 467, 555–561. [Google Scholar] [CrossRef] [PubMed]
  24. Zhang, D.; Liao, Q.; Zhang, L.; Wang, D.; Luo, L.; Chen, Y.; Zhong, J.; Liu, J. Occurrence and spatial distributions of microcystins in Poyang Lake, the largest freshwater lake in China. Ecotoxicology 2015, 24, 19–28. [Google Scholar] [CrossRef] [PubMed]
  25. Jin, B.S.; Nie, M.; Li, Q.; Chen, J.K.; Zhou, W.B. Basic characteristics, challenges and key scientific questions of the Poyang Lake Basin. Resour. Environ. Yangtze Basin 2012, 21, 268–275. (In Chinese) [Google Scholar]
  26. Editorial Board of Study on Poyang Lake. Study on Poyang Lake; Shanghai Scientific and Technical Publishers: Shanghai, China, 1988. (In Chinese) [Google Scholar]
  27. Luo, W.; Zhang, X.; Deng, Z.M.; Xiao, Y. Variation of the total runoff into Poyang Lake and drought-flood abrupt alternation during the past 50 years. J. Basic Sci. Eng. 2013, 21, 845–856. (In Chinese) [Google Scholar]
  28. Zhang, Y.; You, Q.; Lin, H.; Chen, C. Analysis of dry/wet conditions in the Gan River Basin, China, and their association with large-scale atmospheric circulation. Glob. Planet. Chang. 2015, 133, 309–317. [Google Scholar] [CrossRef]
  29. Li, X.; Zhang, Q.; Ye, X. Dry/wet conditions monitoring based on trmm rainfall data and its reliability validation over Poyang Lake Basin, China. Water 2013, 5, 1848–1864. [Google Scholar] [CrossRef]
  30. Xia, S.X.; Yu, X.B.; Liu, Y.; Jia, Y.F.; Zhang, G.S. Current issues and future trends of Poyang Lake wetland. Resour. Environ. Yangtze Basin 2016, 25, 1103–1111. (In Chinese) [Google Scholar]
  31. Huang, Y.; Li, Y.K.; Ji, W.T.; Xu, P.; Wang, Z.G. Bird diversity and conservation status in Poyang Lake Area. Wetl. Sci. 2016, 14, 311–327. (In Chinese) [Google Scholar]
  32. Zhang, L.; Yao, X.; Tang, C.; Xu, H.; Jiang, X.; Zhang, Y. Influence of long-term inundation and nutrient addition on denitrification in sandy wetland sediments from Poyang Lake, a large shallow subtropical lake in China. Environ. Pollut. 2016, 219, 440–449. [Google Scholar] [CrossRef] [PubMed]
  33. Ye, X.; Zhang, Q.; Bai, L.; Hu, Q. A modeling study of catchment discharge to Poyang Lake under future climate in China. Quat. Int. 2011, 244, 221–229. [Google Scholar] [CrossRef]
  34. Zhang, Q.; Li, L.; Wang, Y.G.; Werner, A.D.; Xin, P.; Jiang, T.; Barry, D.A. Has the Three-Gorges Dam made the Poyang Lake wetlands wetter and drier? Geophys. Res. Lett. 2012, 39. [Google Scholar] [CrossRef]
  35. Feng, L.; Hu, C.; Chen, X.; Zhao, X. Dramatic inundation changes of China’s two largest freshwater lakes linked to the Three Gorges Dam. Environ. Sci. Technol. 2013, 47, 9628–9634. [Google Scholar] [CrossRef] [PubMed]
  36. China Broadcasting Network. Poyang Lake Entered Dry Season Earlier than Normal, as a Result, the “Thousand-Eye Bridge” Built in the Ming Dynasty Revealed. Available online: http://jx.cnr.cn/2011jxfw/shxw/201310/t20131023_513909110.shtml (accessed on 23 October 2013).
  37. Xu, L.; Zhu, M.; He, B.; Wang, X.; Zhang, Q.; Jiang, J.; Razafindrabe, B.H.N. Analysis of water balance in Poyang Lake Basin and subsequent response to climate change. J. Coast. Res. 2014, 68, 136–143. [Google Scholar] [CrossRef]
  38. Zhang, Z.; Huang, Y.; Xu, C.Y.; Chen, X.; Moss, E.M.; Jin, Q.; Bailey, A.M. Analysis of Poyang Lake water balance and its indication of river–lake interaction. Springerplus 2016, 5, 1555. [Google Scholar] [CrossRef] [PubMed]
  39. Dai, X.Z.; Fang, Y.; Chen, K.; Lin, L.S.; Liao, G.Z.; Tane, H. Integrated technology approach for Poyang Lake watershed planning and managenment. Jiangxi Sci. 2003, 21, 217–221. (In Chinese) [Google Scholar]
  40. Thiessen, A.H. Precipitation averages for large areas. Mon. Weather Rev. 1911, 39, 1082–1084. [Google Scholar] [CrossRef]
  41. Fetter, C.W. Applied Hydrogeology; Pearson: London, UK, 2001; pp. 278–289. [Google Scholar]
  42. Oloruntade, A.J.; Mohammad, T.A.; Ghazali, A.H.; Wayayok, A. Analysis of meteorological and hydrological droughts in the Niger-South Basin, Nigeria. Glob. Planet. Chang. 2017, 155, 225–233. [Google Scholar] [CrossRef]
  43. Ayantobo, O.O.; Li, Y.; Song, S.; Yao, N. Spatial comparability of drought characteristics and related return periods in mainland China over 1961–2013. J. Hydrol. 2017, 550, 549–567. [Google Scholar] [CrossRef]
  44. Gao, X.; Qi, Z.; Zhao, X.; Wu, P.; Pan, W.; Gao, X.; Miao, S. Temporal and spatial evolution of the standardized precipitation evapotranspiration index (SPEI) in the Loess Plateau under climate change from 2001 to 2050. Sci. Total Environ. 2017, 595, 191–200. [Google Scholar] [CrossRef] [PubMed]
  45. Thornthwaite, C.W. An approach toward a rational classification of climate. Geogr. Rev. 1948, 38, 55–94. [Google Scholar] [CrossRef]
  46. Mann, H.B. Nonparametric tests against trend. Econometrica 1945, 13, 245–259. [Google Scholar] [CrossRef]
  47. Kendall, M.G. Rank Correlation Methods; Charles Griffin: London, UK, 1975. [Google Scholar]
  48. Zeng, X.; Zhao, N.; Sun, H.; Ye, L.; Zhai, J. Changes and relationships of climatic and hydrological droughts in the Jialing River Basin, China. PLoS ONE. 2015, 10, e0141648. [Google Scholar] [CrossRef] [PubMed]
  49. Hisdal, H.; Stahl, K.; Tallaksen, L.M.; Demuth, S. Have streamflow droughts in Europe become more severe or frequent? Int. J. Climatol. 2001, 21, 317–333. [Google Scholar] [CrossRef]
  50. Wu, H.; Soh, L.K.; Samal, A.; Chen, X.H. Trend analysis of streamflow drought events in Nebraska. Water Resour. Manag. 2008, 22, 145–164. [Google Scholar] [CrossRef]
  51. Mei, X.; Dai, Z.; Fagherazzi, S.; Chen, J. Dramatic variations in emergent wetland area in China’s largest freshwater lake, Poyang Lake. Adv. Water Resour. 2016, 96, 1–10. [Google Scholar] [CrossRef]
  52. Wen, X.; Wu, X.; Gao, M. Spatiotemporal variability of temperature and precipitation in Gansu Province (Northwest China) during 1951–2015. Atmos. Res. 2017, 197, 132–149. [Google Scholar] [CrossRef]
  53. Zhao, Y.; Zou, X.; Liu, Q.; Yao, Y.; Li, Y.; Wu, X.; Wang, C.; Yu, W.; Teng, W. Assessing natural and anthropogenic influences on water discharge and sediment load in the Yangtze River, China. Sci. Total Environ. 2017, 607–608, 920–932. [Google Scholar] [CrossRef] [PubMed]
  54. Ran, L.; Wang, S.; Fan, X. Channel change at Toudaoguai Station and its responses to the operation of upstream reservoirs in the upper Yellow River. J. Geogr. Sci. 2010, 20, 231–247. [Google Scholar] [CrossRef]
  55. Yu, Z.W.; Hu, K.D. Analysis on hydraulic gradient at the bottom of the concrete cutoff walls in strengthening earthrock dams. Jiang Hydraul. Sci. Technol. 2014, 40, 253–257. (In Chinese) [Google Scholar]
  56. Tan, G.L.; Guo, S.L.; Wang, J. Study on the Evolution of Hydrology and Water Resources in Poyang Lake Ecological Economic Zone; China Water and Power Press: Beijing, China, 2013. [Google Scholar]
  57. Lu, G.Y.; Wong, D.W. An adaptive inverse-distance weighting spatial interpolation technique. Comput. Geosci. 2008, 34, 1044–1055. [Google Scholar] [CrossRef]
  58. Zhang, Q.; Ye, X.C.; Werner, A.D.; Li, Y.L.; Yao, J.; Li, X.H.; Xu, C.Y. An investigation of enhanced recessions in Poyang Lake: Comparison of Yangtze River and local catchment impacts. J. Hydrol. 2014, 517, 425–434. [Google Scholar] [CrossRef]
  59. Wu, H.; Zeng, G.; Liang, J.; Chen, J.; Xu, J.; Dai, J.; Sang, L.; Li, X.; Ye, S. Responses of landscape pattern of China’s two largest freshwater lakes to early dry season after the impoundment of Three-Gorges Dam. Int. J. Appl. Earth Obs. Geoinf. 2017, 56, 36–43. [Google Scholar] [CrossRef]
  60. Ouyang, Q.L.; Liu, W.L. Variation characteristics of water level in Poyang Lake over 50 year. Resour. Environ. Yangtze Basin 2014, 23, 1545–1550. (In Chinese) [Google Scholar]
  61. Zhao, J.K.; Li, J.F.; Jiang, C.J.; Li, L.X.; Zhao, Z.; Zhang, A.S.; Cao, M. Water exchange between river and lake in the middle and lower reach of Changjiang River. Adv. Water Sci. 2013, 24, 759–770. (In Chinese) [Google Scholar]
  62. Min, Q.; Zhang, L.S. Characteristics of low-water level changes in Lake Poyang during 1952–2011. J. Lake Sci. 2012, 24, 675–678. (In Chinese) [Google Scholar]
  63. Liu, Y.B.; Zhao, X.S.; Wu, G.P. A primary investigation on the formation of frequent droughts in the Poyang Lake Basin in recent decade. Resour. Environ. Yangtze Basin 2014, 23, 131–138. (In Chinese) [Google Scholar]
  64. Guo, H.; Yin, G.Q.; Jiang, T. Prediction on the possible climate change of Poyang Lake Basin in the future 50 year. Resour. Environ. Yangtze Basin 2008, 17, 73–78. (In Chinese) [Google Scholar]
  65. Ye, X.; Li, Y.; Li, X.; Zhang, Q. Factors influencing water level changes in China’s largest freshwater lake, Poyang Lake, in the past 50 years. Water Int. 2014, 39, 983–999. [Google Scholar] [CrossRef]
  66. Mei, X.; Dai, Z.; Du, J.; Chen, J. Linkage between Three Gorges Dam impacts and the dramatic recessions in China’s largest freshwater lake, Poyang Lake. Sci. Rep. 2015, 5, 18197. [Google Scholar] [CrossRef] [PubMed]
  67. Gan, X.Y.; Liu, C.L.; Huang, X.M. Study on the drought in Poyang Lake. J. Anhui Agric. Sci. 2011, 39, 14676–14678. (In Chinese) [Google Scholar]
  68. Lai, X.; Shankman, D.; Huber, C.; Yesou, H.; Huang, Q.; Jiang, J. Sand mining and increasing Poyang Lake’s discharge ability: A reassessment of causes for lake decline in China. J. Hydrol. 2014, 519, 1698–1706. [Google Scholar] [CrossRef]
  69. Zhang, F.P.; Fang, S.W.; Zhou, Z.H.; Wen, T.F.; Zhang, M.H. Research on multi-time-scale dynamic characteristics of water-level fluctuation of the Poyang Lake in China. Resour. Environ. Yangtze Basin 2017, 26, 126–133. (In Chinese) [Google Scholar]
  70. Wan, R.R.; Yang, G.S.; Wang, X.L.; Qin, N.X.; Dai, X. Progress of research on the relationship between the Yangtze River and its connected lakes in the middle reaches. J. Lake Sci. 2014, 26, 1–8. (In Chinese) [Google Scholar]
Figure 1. The “thousand-eye bridge” built in the Ming Dynasty in the main navigation channel of Poyang Lake (source: http://dcx.jxnews.com.cn).
Water 10 00137 g001
Figure 2. Locations of the Poyang Lake Basin, meteorological and gauging stations.
Water 10 00137 g002
Figure 3. Inner-annual variations in lake level at Xingzi station.
Water 10 00137 g003
Figure 4. Accumulative anomaly curves of seasonal lake levels during 1961–2015. (a) Spring; (b) Summer; (c) Autumn; (d) Winter.
Water 10 00137 g004aWater 10 00137 g004b
Figure 5. Hydrographs of maximum, minimum, and mean lake level at six gauging stations in the Poyang Lake: (a) Hukou; (b) Xingzi; (c) Duchang; (d) Wucheng; (e) Tangyin; and (f) Kangshan.
Water 10 00137 g005aWater 10 00137 g005b
Figure 6. Onset times of 10 m and 8 m during 1961–2015 at Xingzi station. (a) 10 m; (b) 8 m.
Water 10 00137 g006
Figure 7. Spatial variation trends of the annual and seasonal SPEI values in the Poyang Lake Basin. (a) Annual; (b) Spring; (c) Summer; (d) Autumn; (e) Winter.
Water 10 00137 g007
Figure 8. Spatial-temporal distribution of the SPEI on a 12-month timescale in the Poyang Lake Basin. (a) 1960s; (b) 1970s; (c) 1980s; (d) 1990s; (e) 2000s.
Water 10 00137 g008
Figure 9. Cumulative frequencies of the meteorological drought in the Poyang Lake Basin over the period of 1961–2015. (a) Based on the Decadal SPEI; (b) Based on the annual and seasonal SPEI.
Water 10 00137 g009
Figure 10. Spatial distribution of meteorological drought frequency. (a) Annual; (b) Spring; (c) Summer; (d) Autumn; (e) Winter.
Water 10 00137 g010
Figure 11. Correlation coefficients between the monthly lake level at Xingzi station and the SPEI values at different timescales.
Water 10 00137 g011
Figure 12. Seasonal characteristics of the correlations between the lake level at Xingzi station and the SPEI values at different timescales.
Water 10 00137 g012
Figure 13. Spatial distribution of the correlations between the lake level at each gauging station and the SPEI values at a 3-month timescale.
Water 10 00137 g013
Table 1. Drought classification defined for the Standardized Precipitation Evapotranspiration Index (SPEI).
CategorySPEI Value
No drought−0.5 < SPEI
Light drought−1 < SPEI ≤ −0.5
Moderate drought−1.5 < SPEI ≤ −1
Severe drought−2 < SPEI ≤ −1.5
Extreme droughtSPEI ≤ −2
Table 2. Date statistics of the water level below 10 m and 8 m at Xingzi during different periods.
Period≤10 m≤8 m
Earliest DateMean DateDuration (Day)Earliest DateMean DateDuration (Day)
1960s7 November22 November12022 November13 December79
1970s1 September4 November12824 October7 December78
1980s16 October23 November10725 November12 December65
1990s19 September10 November11413 November3 December62
2000s22 August19 November14228 September22 November84

