Well Salinization Risk and Effects of Baltic Sea Level Rise on the Groundwater-Dependent Island of Öland, Sweden


1
Department of Physical Geography, Stockholm University, SE-106 91 Stockholm, Sweden
2
Natural Sciences, Technology and Environmental Studies, Södertörn University, SE-141 89 Huddinge, Sweden
3
The Bolin Centre for Climate Research, Stockholm University, SE-106 91 Stockholm, Sweden
*
Author to whom correspondence should be addressed.
Water 2018, 10(2), 141; https://doi.org/10.3390/w10020141
Submission received: 16 December 2017
/
Revised: 22 January 2018
/
Accepted: 25 January 2018
/
Published: 1 February 2018
(This article belongs to the Special Issue Seawater Intrusion: Simulation and Control)
Abstract
:In this study, we estimate baseline conditions in terms of the current risk of well salinization on the Baltic Sea island of Öland, Sweden, and assess the effects of future sea level rise on the land area, infrastructure and cultural values. We use a multicriterion geographical information systems (GIS) approach. Geomorphological and physical parameters affect the risk of saltwater intrusion into freshwater aquifers, including their hydrology, geomorphology, and climatology; the spatial distribution of the current risk of salinization is mapped in this study. In the event of a future 2 m sea level rise, a total land area of 67 km2 will be inundated on Öland, corresponding to approximately 5% of the island’s land surface. Inundation includes urban areas, nature reserves, and animal protection areas, implying the loss of environmental and socioeconomic values. A future 2 m sea level rise will also cause direct inundation of 3% of all wells on the island. Currently, 17.5% of all wells are at a high risk of becoming saltwater contaminated. More generally, the present results add evidence showing a relatively high vulnerability of major Baltic Sea islands and their infrastructure to future sea level rise. The approach used here and related results, including salinization risk maps, may prove useful for decision-makers in the planning of infrastructure. Drilling of new wells could for instance preferably be done in areas with identified lower risk-index values, which would facilitate an overall higher freshwater withdrawal in the interest of the entire island.
1. Introduction
1.1. Background and Aim
Although freshwater is a fundamental resource in society, it is vulnerable to climate change and human activities—particularly on islands surrounded by saltwater, where aquifers may be relatively small [1]. Saltwater intrusion frequently occurs naturally as heavier saline waters tend to partly displace freshwaters in coastal areas [2]. However, this intrusion and the associated salinization risk can be greatly aggravated by water extraction in coastal wells that provide the society with freshwater, irrigation water or water for industries [3]. This may ultimately result in the wells becoming unusable as a source of freshwater.
Sea level rise is a result of the thermal expansion of water caused by global warming and the addition of liquid water that comes with melting glaciers and ice sheets on land [4]. According to the Intergovernmental Panel on Climate Change (IPCC, 2013), sea levels are rising at an increasing pace, and 95% of the world’s ocean areas will be considerably affected by a sea level rise by 2100, hence increasing the risk of inundation and the intrusion of saltwater in coastal aquifers. To what extent local sea levels will differ from the global sea level rise is, for example, dependent on the local glacioisostatic uplift of land [5]. Wave actions, tides and other sea level fluctuations around the mean level, for example, in response to weather and wind conditions, are other factors that may impact saltwater intrusion (e.g., [6]). Many municipalities in Sweden do not have a strategy for a future sea level rise beyond the year 2100, as the projections of the pace and extent of a future sea level rise are uncertain [7], thus complicating decision-making. More recently, many scientific publications predict a global mean sea level rise of around 1–2 m until 2100, for the (present) worst-case-scenario climate projections [7]. The sea level rise will continue after this point with virtual certainty [7]. Predictions for higher sea level rise are therefore of importance for long-term planning. In the southern parts of Sweden, the glacioisostatic uplift is less profound than in the north, which means that a sea level rise will clearly outpace the glacioisostatic land uplift [7], particularly on the Baltic Sea island of Öland, located just outside of the southern part of the Swedish east coast. This study projects a 2 m relative sea level rise as the future scenario when visualizing the inundation and losses on Öland.
A key issue in advancing knowledge of land inundation and the intrusion of saltwater into coastal aquifers despite process complexity is to disentangle the contribution and importance of individual drivers. Here we focus on the direct (first-order) effect of the mean sea level rise itself. This provides a necessary basis for comparison with assessments of other effects (which may or may not be considerable), including potentially major effects such as impacts of groundwater over-extraction, and tidal and other sea level fluctuations (e.g., [6,8]). We particularly aim at addressing two aspects affecting Öland. Firstly, we investigate if and to what extent a 2 m sea level rise will cause inundation of land area, urban areas, nature protection areas and infrastructure, including wells. Secondly, we use an empirical approach that considers physical and geomorphological factors to assess the current risk of well salinization as a result of seawater intrusion into the groundwater system.
1.2. Study Area
Öland is the second largest island in Sweden and is located in the Baltic Sea on the east coast of the country (Figure 1). The island is connected to the mainland by a bridge from the city of Kalmar. The island is ~135 km long and ~6–15 km wide, with a total area of 1350 km2. Although the population is relatively small, with 24,987 (2014) permanent residents, the number of overnight stays by tourists well exceeds 1,000,000 per year. Furthermore, the island supports large populations of migratory birds, with a diversity of different birds on the south headland of Ottenby that is one of the greatest in Europe [9]. Tourists are attracted by such unique places, and more generally by the nature and cultural heritage of the island, making tourism an important source of income. Another major source of income is the quarrying and processing of limestone [10]. The geology of Öland is unique, with a rugged and rather flat landscape, dipping slightly towards the northeast, with its highest point at 57 m above sea level (m.a.s.l.) [11]. The surface has been shaped and polished by the last ice age, resulting in a generally thin layer of soil on the island with characteristic flora and fauna [10]. The landscape, where vegetation grows directly on the limestone, is called Alvar; it is uniquely found on Öland and at only a few other places in the world [10]. Thin layers of soil can result in smaller groundwater storage capacities, limited capacities for the retention of contaminants during aquifer recharge [12,13], and hence an increased vulnerability when it comes to the quality and sufficiency of freshwater. The thickness of the unsaturated zone is small in these areas, a zone that contributes to the filtering of water before it reaches the groundwater table as it percolates down through the soil [14]. The island receives among the lowest yearly precipitation in Sweden, 500–650 mm/year [15], while it has the highest hours of sunshine per year in the country. The low precipitation contributes to the low surface-water availability (the region is one of the most lake- and river-scarce in Sweden) and occasional, large-scale problems with freshwater availability. The problems arise particularly in the summer months when the population increases drastically as a result of tourism—resulting in an increased demand for freshwater.
2. Materials and Methods
The study is based on a GIS analysis and was conducted in two steps, using ArcGIS 4.1 (Esri Sverige AB, Gävle, Sweden).
- Firstly, a sea level rise was simulated and analyzed with a focus on the direct sea water inundation of wells and land areas. The first part simulated a future sea level rise of 2 m, using ArcGIS, in order to visualize which areas would be directly inundated by seawater as a way to understand and estimate the number of wells that would be covered in saline water—a tipping point for where a freshwater source becomes unusable.
- Secondly, the current baseline risk for the salinization of wells as a result of seawater intrusion into the groundwater system was estimated, considering combined effects of different influential factors. A risk map was created with an index of the risk of saltwater intrusion into wells on the island.
The well salinization risk was estimated using an overlay analysis in ArcGIS, using available data (Table 1). Although the approach was not process-based, the empirical risk-index type of relations [16,17] applied here, which considered combined effects of different influential factors, have previously been found [18,19] to show relatively good agreement with data on well salinization caused by seawater intrusion. We used parameters affecting seawater intrusion into wells and freshwater aquifers in coastal areas corresponding to previous work [16]: elevation above sea level, distance to the ocean, distance to lakes, mean annual precipitation and soil type. All these parameters provided the foundation of the final multicriterion risk assessment analysis, in which different parameters affected the risk of saltwater intrusion differently; hence they were assigned different weight factors. The following steps summarize how the risk assessment was conducted:
- Parameters were identified and data was collected and assigned specific weight factors.
- Data for each parameter was processed, using specific tools in ArcGIS.
- Each parameter was divided into three subgroups, each with a relative risk value [16].
- Calculations were run and visualized by weighted risk values in maps.
- A final risk map was created, combining all weighted risk values.
2.1. Wells
2.1.1. Spatial Distribution and Well Density
The digital elevation model (DEM) data from the Swedish National Land Survey was combined with the vector layer from the Swedish Geological Survey (SGU), containing coordinates for registered wells on Öland, to show the spatial distribution, elevation and density of wells on the island.
2.1.2. Direct Inundation
The field calculator in ArcGIS was used to extract elevation data from the DEM file and joined with the vector layer of wells, adding information about elevation for all wells. Simulating a direct inundation of wells in the event of a 2 m sea level rise was done by dividing the DEM file into two classes.
2.2. Loss of Land Area
2.2.1. Visualization
The total loss of land due to a 2 m sea level rise was calculated and visualized using the spatial analyst raster calculator in ArcGIS. The loss of urban areas, nature reserves and animal conservation areas were all embodied within the GSD-General Map layer and thus in the visualization.
2.2.2. Calculation
The possible total loss of land was calculated by multiplying the total number of pixels in the sea level rise raster layer with the resolution of the specific raster file (2 × 2 m). The loss of area was divided with the total area of the island, which provided a fraction—a valuable number for interpreting future changes to the spatial area.
2.3. Risk Parameters of Saltwater Intrusion
Specific risk values and weighting factors are shown in Table 2. The foundation of the multicriterion risk assessment analysis consisted of five identified parameters, visualized in five different raster layers as separate maps. These layers were combined in a final risk map. All parameters affected the risk of saltwater intrusion in different ways, therefore they were given a weight factor (W) of 1, 2, or 3 before merging the layers together [16]. Each layer was created using relevant tools and processes, because of the difference in the types of data being used. The resolution was changed from 2 to 20 m, and the data was resampled through the nearest-neighbor technique, in order to optimize the processing time. An exception was made for the precipitation layer, for which the original resolution was already much lower (4000 m); hence it was given a lower assigned weight factor. Each cell of the five raster layers was given a risk value (R) of 0, 1, or 2 at that specific point of the raster. The specific risk value was based on a relative classification of each parameter and its risk of saltwater intrusion. Three subdivisions of each parameter were created. As an example, closer proximity to the ocean led to a higher risk of saltwater intrusion, resulting in a higher risk value. More precipitation led to a lower risk of saltwater intrusion and thus a lower risk value.
2.3.1. Elevation above Sea Level
A higher elevation a.s.l. is equivalent to a lower risk of saltwater intrusion, as the height of the water column increases with elevation [20]. The distance to the salt–freshwater transition zone is thus greater in these areas, lowering the risk of intrusion.
The DEM data was used to classify the elevation data into three subdivision groups: <5, 5–10, and >10 m.a.s.l. The classification was done using the unique values in symbology (the same tool was used for all following parameters). Each group was given a risk value of 0, 1, or 2 and a weight factor of 3.
2.3.2. Distance to the Baltic Sea
An increased distance from the coast decreases the risk of saltwater intrusion into wells, as the transition zone between freshwater and saltwater is pushed deeper into the ground further inland [20]. In an idealized model of groundwater flow patterns, freshwater is pushed towards the coast, preventing saltwater from migrating inland [20].
The Euclidean distance tool was used to calculate the distance to the ocean for every cell of the map. A polygon was first extracted from the GSD-General layer to distinguish the location of the coastline. The result of the calculation of the Euclidean distance was thus the distance from all cells to the polygon surrounding the island (i.e., the coastline). These values were classified into three groups: <300, 300–500, and >500 m from the coast. Every group was given a risk value of 0, 1, or 2 and a weight factor of 3.
2.3.3. Distance to Lakes
The distances between cells and lakes were calculated in the same way as for the ocean. Instead of using the coastline polygon, polygon data of lakes from the GSD-General Map was used. The classification of the risk values was done in the same way as for other parameters, by categorizing into three groups with risk values ranging from 0 to 2. This parameter was given a weight factor of 2, as it affects the risk of saltwater intrusion less, relative the parameters of elevation and distance to the coast.
2.3.4. Precipitation
A lower precipitation reduces the recharge of aquifers and thus increases the risk of saltwater intrusion [21]. The hydraulic gradient is reduced and less freshwater flows towards the ocean [22]. This increases the risk of saltwater migrating inland, along with a decreased height of the water table.
The input data of the mean annual precipitation from the Swedish Meteorological and Hydrological Institute (SMHI) over Öland had a very low resolution compared to the other data used (4000 vs. 2 m). The precipitation data were estimated averages—hence the low resolution—and were not as precise as the DEM data. When classifying the low-resolution data into three groups, <550, 550–600, and >600 mm/year, the large cells were smoothed, rounded, and generalized by drawing new polygons in order to make the map easier to decipher. The pixel size of the raster file was resampled from 4000 to 20 m, equivalent to previous parameter layers. Risk values (0–2) were then assigned to each subdivision group, and a weight factor of 1 was given, because of the lower precision of the data compared to other parameters in the study.
2.3.5. Soil Type
The soil type determines how fast water can penetrate through the ground, both horizontally and vertically, and reach the groundwater—the saturated zone. Coarse sediments (i.e., sand particles and larger) have a greater permeability and allow for faster infiltration than fine sediments [23]; hence they have a greater risk of saltwater intrusion into aquifers.
The vector data from the SGU contained detailed information about the soil types around the island. All soil types were divided into more generalized groups according to the particle size in the soil: coarse sediments, fine sediments, bare bedrock and no data (e.g., lakes). The featured tool used was the Grouping Analysis. The European standard scale for particle size [24] was used when dividing the soil types into subdivision groups. Each group was given a specific risk value (0–2) and a weight factor of 2.
2.4. Weighted Risk Value
2.4.1. Calculations and Mapping
The risk assessment methods applied here for salinization in freshwater wells were based on a study of the neighboring island Gotland [16], including their widely used value-weighing factor method. This method, and similar methods, have been used in topics regarding groundwater security and ecological conservation, thus influencing decision-making [16]. Another method, the foundation and inspiration of the calculations in this study, is called DRASTIC, a method developed by the U.S. Environmental Protection Agency (EPA). These kinds of methods use overlaying layers, which show the differing vulnerability of saltwater intrusion into wells, where geomorphological and physical processes affect the risk [25]. The final risk assessment in this study was the sum of five geomorphological and physical processes using the following equation:
- Di = Weighted risk value index for mapping unit.
- Wj = Weight factor for parameter j.
- Rj = Risk value for parameter j.
All parameters have been divided into three respective categories, each with a specific risk value (R) of 0, 1, or 2 (Table 2); 0 represents a low risk of saltwater intrusion, 1 represents a medium risk and 2 represents a high risk, relative to the groups within the same parameter. Additionally, the parameters affect the risk of saltwater intrusion to different extents. Therefore, the weighted risk values from each parameter weighed differently when summed up. To calculate the weighted risk value, the risk values (R) were multiplied by the weight factor (W) of 1, 2, or 3 to enhance and balance the significance of each parameter [25]. All weighted risk values were added together (Equation (1)), resulting in a weighted risk value index (D) for each individual cell, ranging from 0 to 22, for which the risk of saltwater intrusion increased with higher numbers. Finally, the risk value index was mapped and visualized using the Sum Cell Statistics tool—adding the risk of all parameters into one single map.
2.4.2. Risk Classes and Number of Wells
Lastly, all wells were assigned specific risk values for each well’s particular location. The data is presented in a chart to make it easier to comprehend the number of wells that are at a low, medium or high risk of saltwater intrusion. This step was done by extracting the added weighted risk values from the final risk map into the well point vector layer. The risk index values for each well were exported into Excel, sorted into groups according to the specific risk index values and counted. A chart was made to show the number of wells in each risk-index-value class.
3. Results
3.1. Well Density and Inundation of Wells
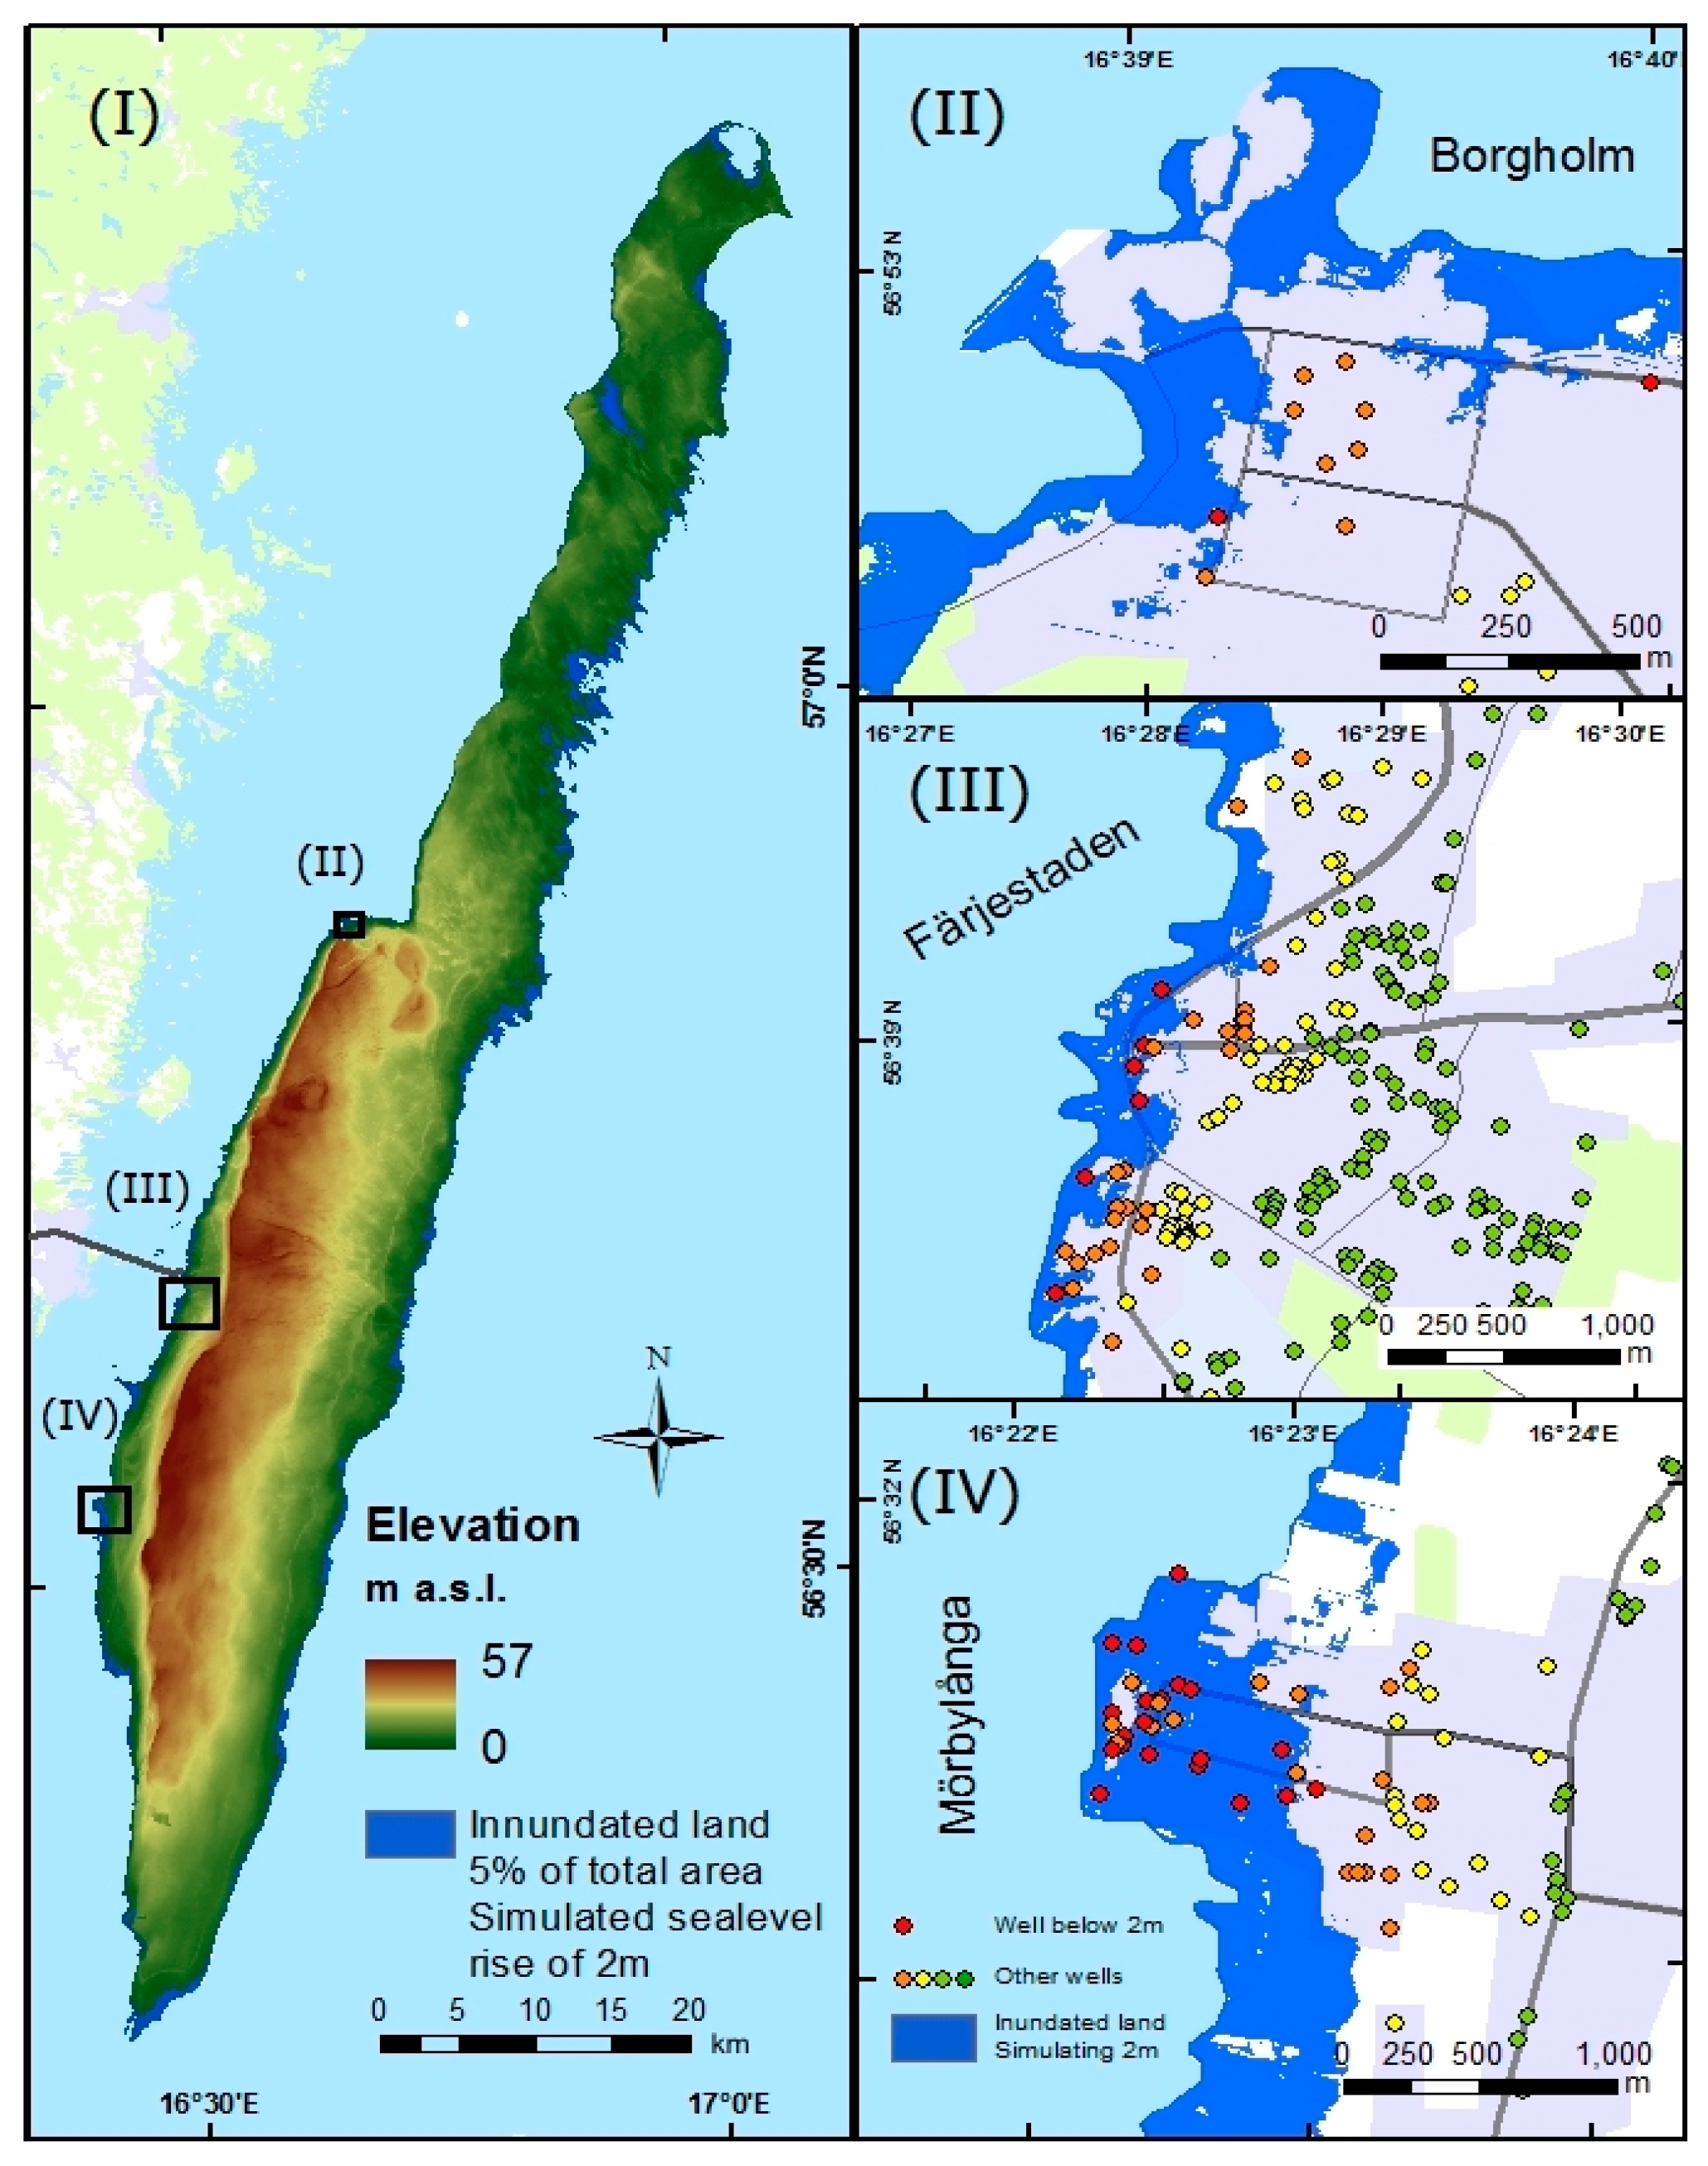
The well density is the highest on the west coast of Öland (Figure 2(I)), where the number of inhabitants is relatively high. Most of the island’s larger towns are located here. Many wells are also located near the coast and at low elevations (Figure 2(II)). With a future sea level rise of 2 m, 99 wells will be directly inundated, corresponding to approximately 3% of all wells. In the north half of the island, in the municipal of Borgholm, the majority of the wells are located at elevations below 10 m.a.s.l. This rather flat part of the island will be affected the most in the case of a sea level rise greater than 2 m, compared to the steeper and higher elevated parts of the central island.
3.2. Inundated Land
3.2.1. Total Loss
In the event of a future 2 m sea level rise, a total area of 67 km2 will be inundated, corresponding to approximately 5% of Öland’s surface (Figure 3(I)). The inundated areas include coastal towns and other urban areas, but also infrastructure, farmland, cultural features, nature reserves, animal protected areas, and land important for the tourism industry. The west coast is more densely populated, and all major towns are located here. This part of the island is steeper compared to the flatter east and north parts, which slightly slope towards the Baltic Sea. The water will for this reason not reach as far inland on the west coast compared to other parts of the island. The water may reach a few hundred meters inland in the southwestern parts of the island and up to a few kilometers in the northern parts. The total loss of land will hence be greater in the north and on the east coast.
3.2.2. Example Areas
Low-lying towns on the west coast (e.g., Färjestaden, Borgholm, and Mörbylånga) will be affected by the sea level rise, as these are all located in close proximity to the coast (Figure 3). Many houses, beaches and wells will be affected, not only because of the submerged low-lying parts, but also because freshwater security will be affected when wells become contaminated with saltwater.
Because most animal protection areas and nature reserves are located along the coast, they will be affected by a sea level rise (Figure 4). Some important bird protection areas and nature reserves will be almost entirely inundated, and others will drastically change spatially. Within these coastal areas, some new small islands will be formed.
3.3. Well Salinization Risk Due to Seawater Intrusion into the Groundwater System
A visualization of the individual parameters used in the risk assessment analysis shows that the related geomorphological and physical factors impacting the intrusion risk have different spatial patterns; some will be more homogenous than others (Figure 5). For instance, the “distance to lakes” parameter yields high weighted risk values throughout most parts of Öland (red areas in Figure 5; numerically, the weighted risk values range from 0 to 6 depending on the risk value and the weight factor for each parameter). The risks related to the “soil type” parameter show a spatially heterogeneous pattern, with however, a concentration of high-risk conditions in the north part of the island. The north part additionally has high risk values as a result of (low values of) the “yearly mean precipitation” parameter.
3.4. Risk Map
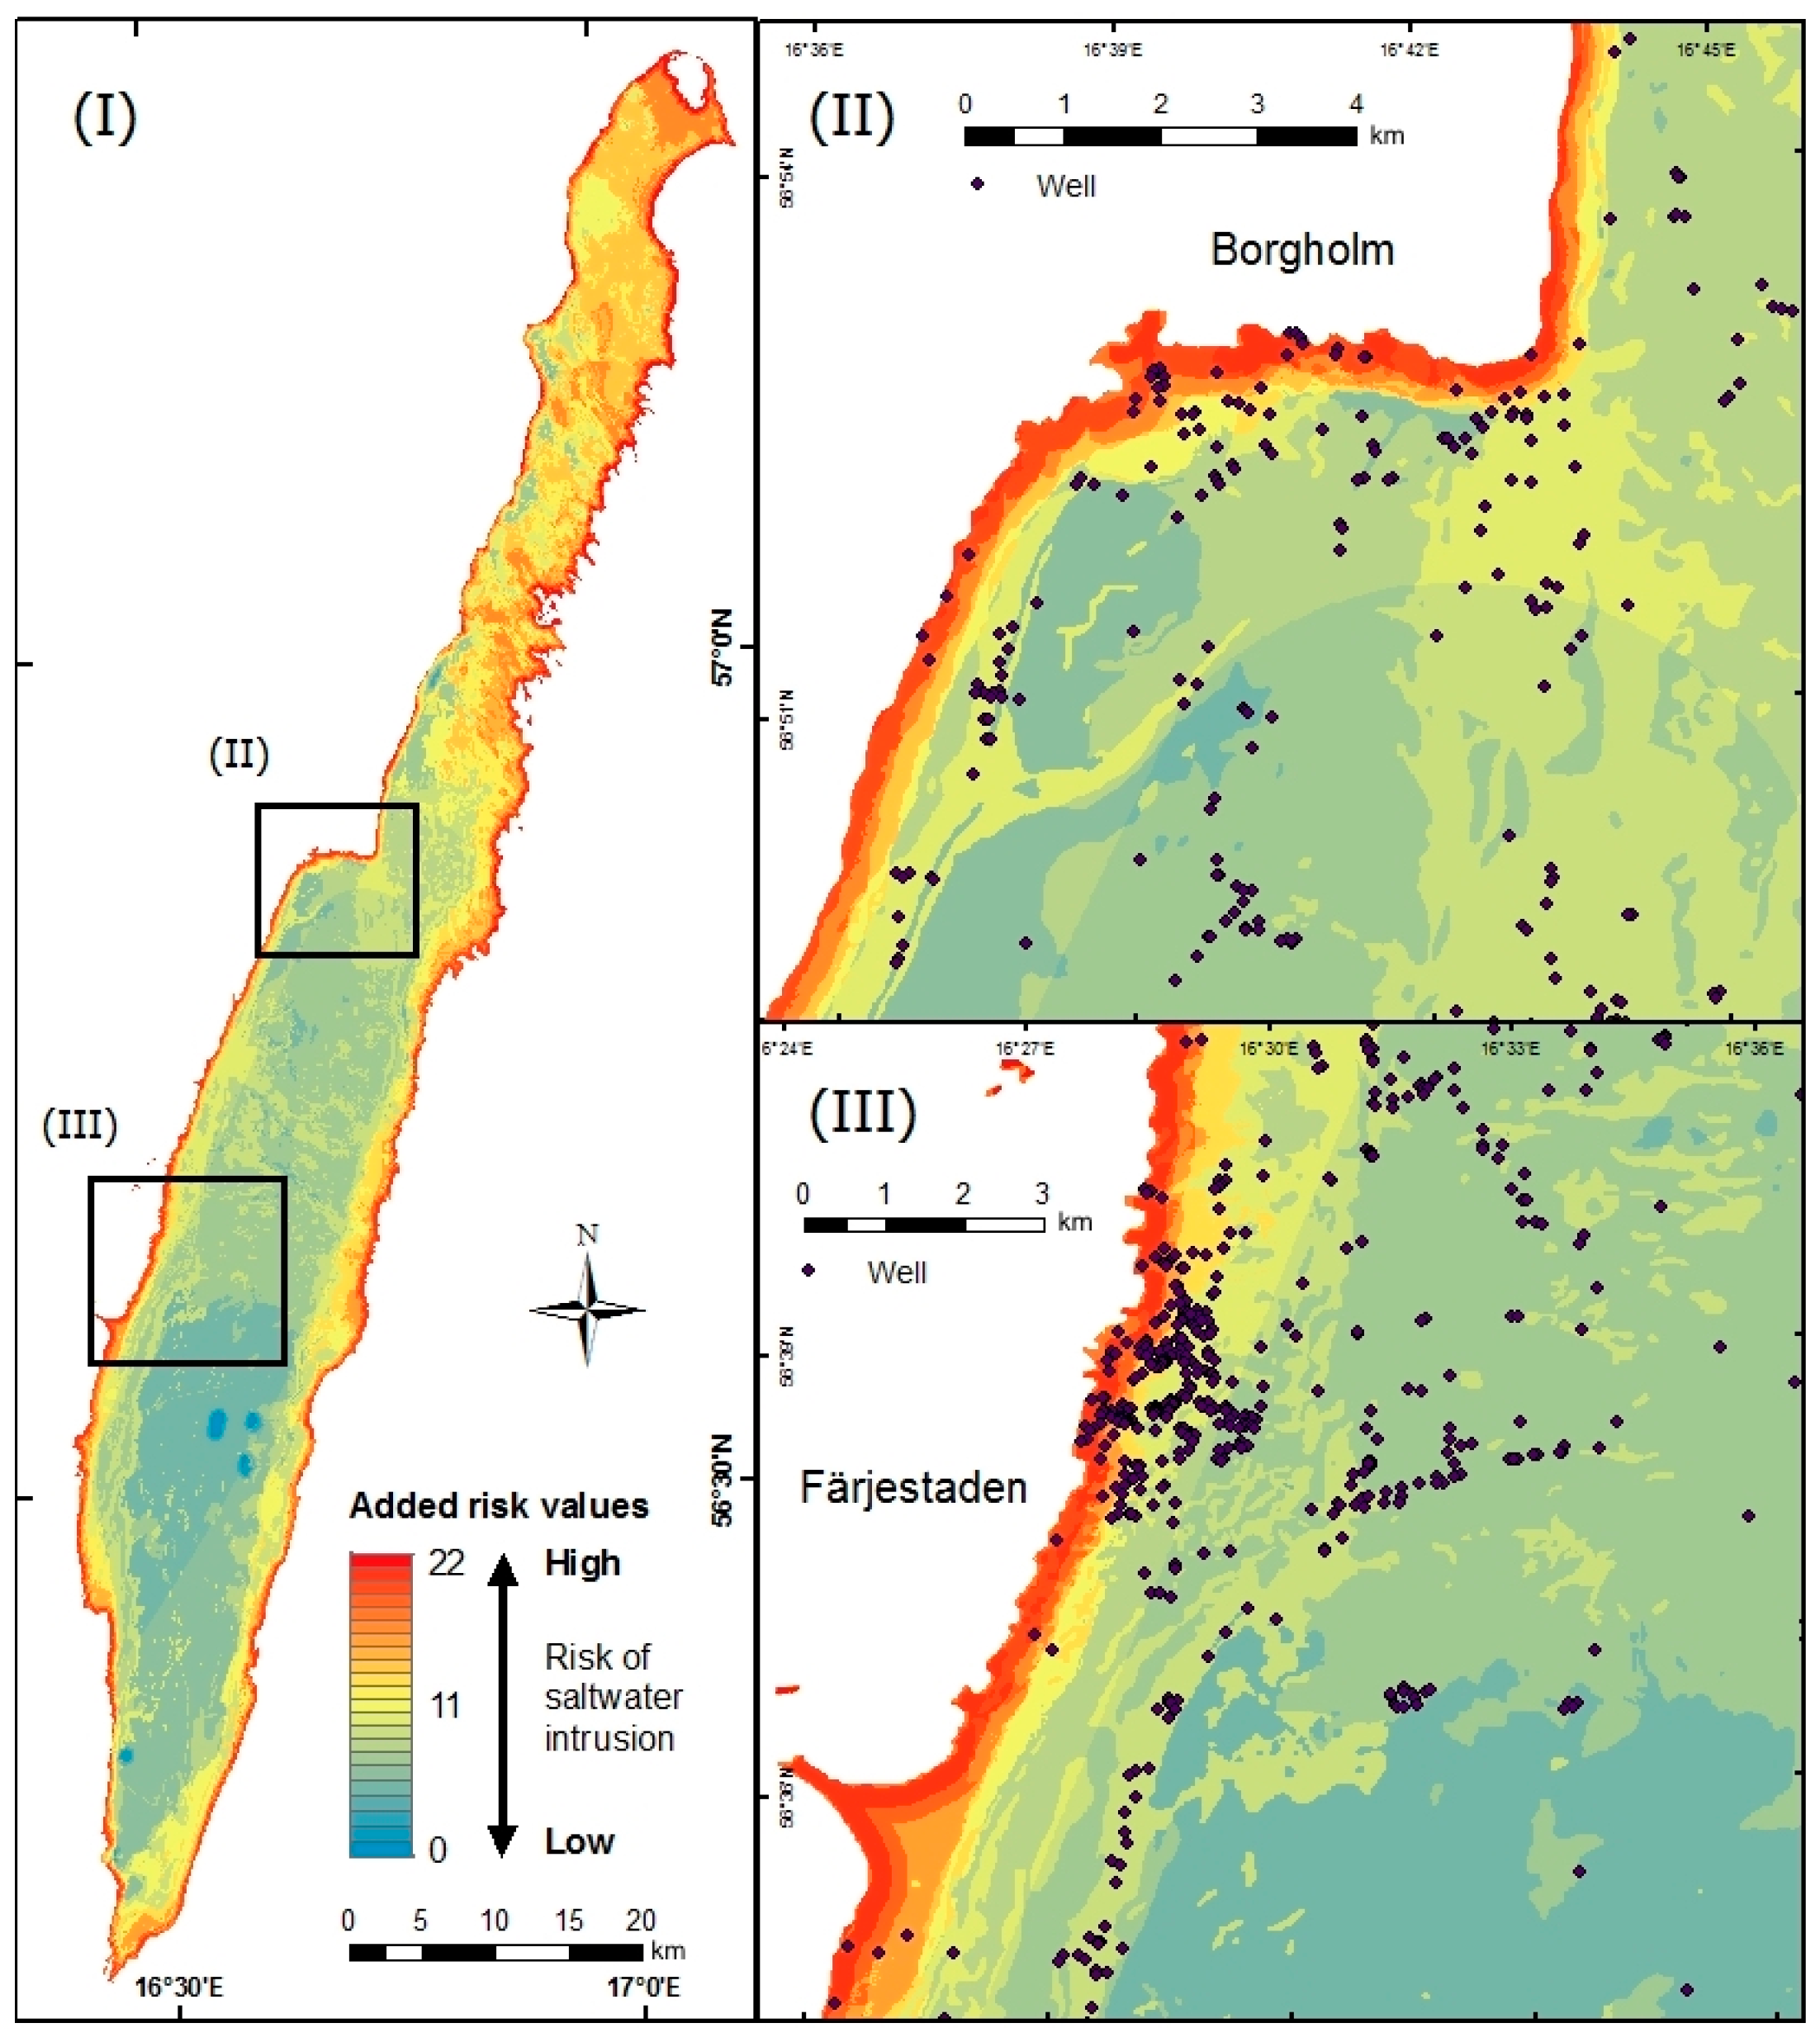
Figure 6, which shows a map of the estimated overall risk of salinization, is the result of the addition of all weighted risk parameters of Figure 5. The addition of the weighted risk values from each parameter results in a risk index ranging from 0 to 22 (0–6: low risk; 7–14: medium risk; 15–22: high risk). A higher risk value index (red) indicates a higher risk of saltwater intrusion into wells, and the contrary applies for low values (blue). Higher values are generally found along the coast, greatly influenced by two parameters: the distance to the coast and the elevation a.s.l. In the magnified maps (Figure 6(II,III)), wells are highlighted in order to facilitate the interpretation of individual risks for each well. In the north half of the island, the risk values reach higher numbers even further inland—this is as a consequence of it being a low-elevation area with low annual precipitation.
3.5. Wells at Risk
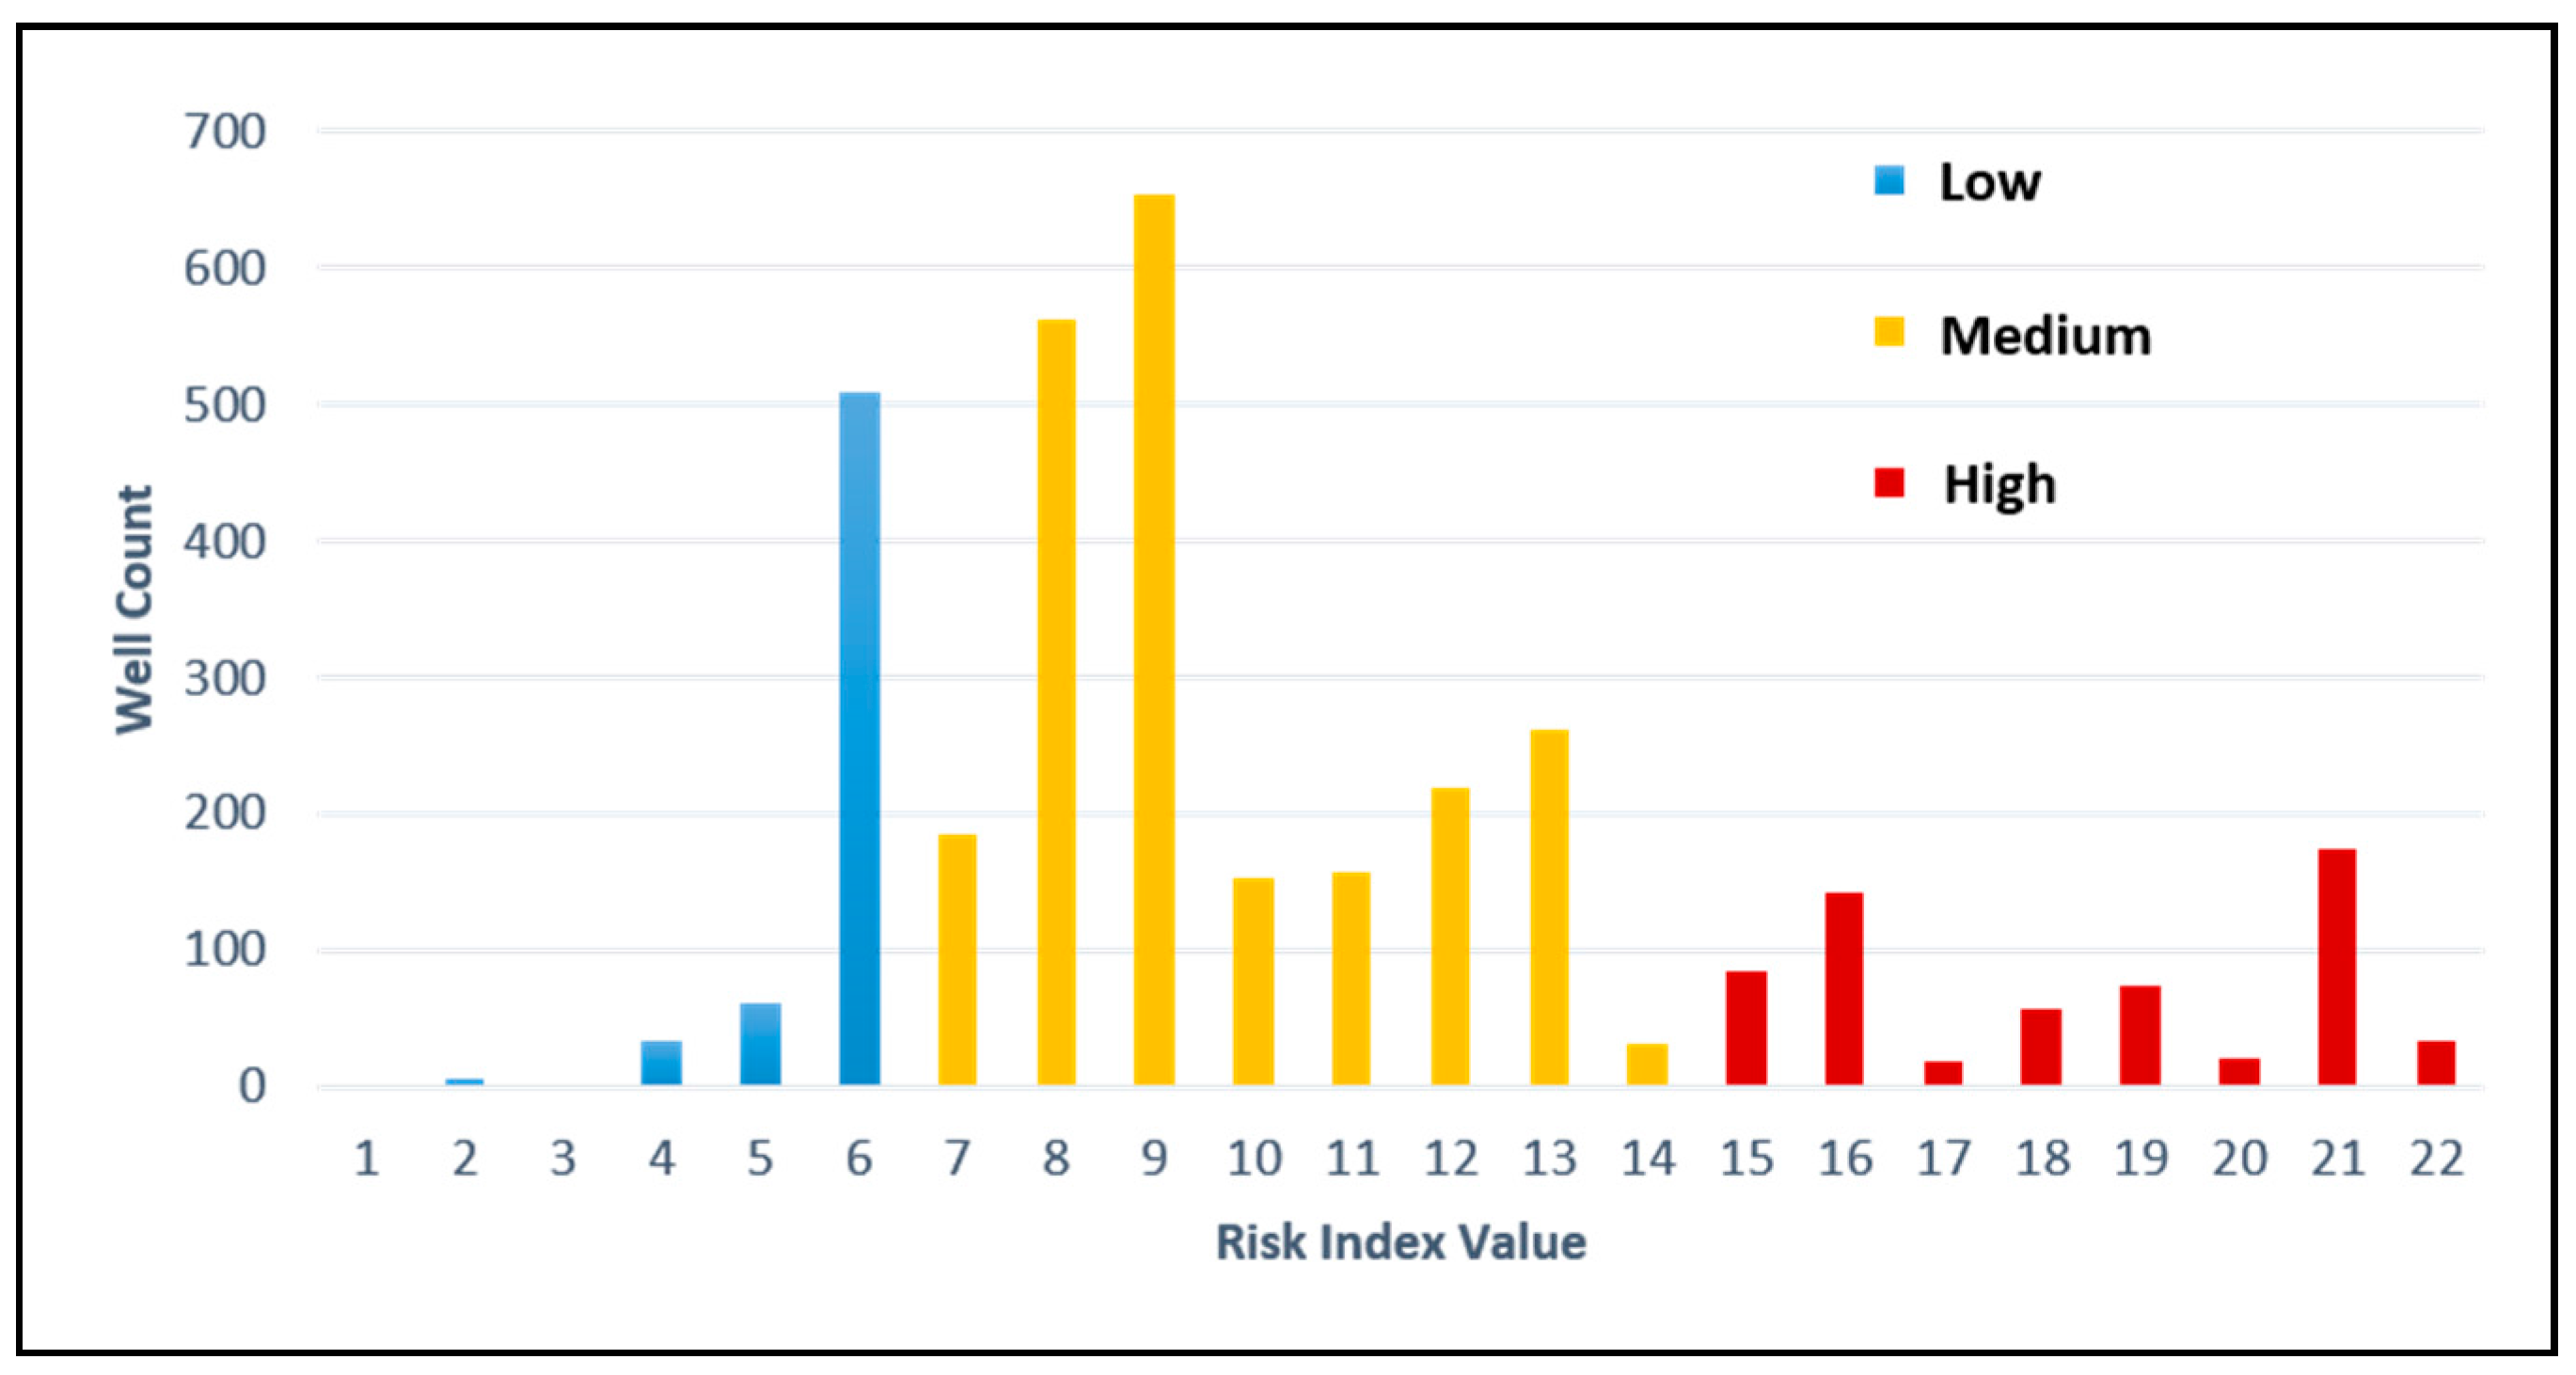
Whereas Figure 6 illustrates the risk index value for specific wells, the wells are grouped according to their particular risk value in Figure 7. This shows that most wells (64% of all wells) are located in areas with a medium risk of saltwater intrusion (bars 7–14 in Figure 7). Numerous wells reside within the highest-risk-value-index groups (bars 15–22) and in the lowest risk groups (bars 0–6). In the high-risk groups, 604 wells can be found, which account for 17.5% of all wells on the island. None of the wells in this study had a risk index value of 0. Furthermore, whereas the results shown in Figure 7 regard the current baseline risk of well salinization (with the present sea level), a parallel study of the neighboring island of Gotland [16] shows that although the remaining land area will be smaller in the future as a result of the sea water inundation, the number of wells at a high risk for salinization as a result of saltwater intrusion into the groundwater will increase considerably (by approximately 150%) because of the inland movement of the coastline, which is a result that is likely also true for Öland.
4. Discussion
4.1. A Rising Sea
As presented in this study, 5% of Öland’s area and 3% of its wells will be inundated in the case of a 2 m sea level rise. Today, many of the potentially inundated wells are being used in summer houses, smaller farms, and as energy wells [26] (e.g., for household heat pumps). Even without sea level rise, the present results show that the risk of saltwater intrusion into freshwater aquifers is already high on Öland, as in many other parts of the world [3,27], as the groundwater table is shallow in low-lying coastal areas. The sea level rise will move the transition zone of freshwater and saltwater further inland [2], which results in an increased risk of saltwater intrusion also for inland wells, as shown for the neighboring island of Gotland [16]. In a longer time perspective, sea levels will continue to rise beyond 2 m, producing increasing losses and complications that come with this. Furthermore, for simplicity, we have used today’s annual average precipitation as the input to our risk quantifications. It should be acknowledged that this value is likely to change in the future as a result of ongoing climatic changes; however projections of the magnitude and even the direction of future changes in the region are subject to large uncertainties. Should precipitation and groundwater recharge decrease in the future, the current estimates constitute low-end bounds for the true risks.
Inundation will not only affect the human population in coastal areas, but also wildlife. Habitats for migratory birds could disappear or change at a rapid pace as sea levels rise, threatening the existence of bird populations [28]. When the coastline migrates inland, new islands may form, changing the geographical character of the landscape, which could result in the loss of wildlife. As the sea migrates inland, habitats from inundated areas may relocate to areas in closer proximity to other populations of wildlife or even humans—increasing the competition of land. This, in turn, will result in a greater risk of interaction between species, which could result in the loss of endangered wildlife. If populations of wildlife adapt to the rising sea level, migrating inland, the boundaries of the protected areas must be adjusted in order to secure the habitats. If no other replacement habitat types are available, the existence of some species might be threatened [28].
4.2. Freshwater Security
Saltwater intrusion into wells implies that the wells cannot be used as a freshwater source for an extended period of time, as the recovery period is generally long (in the order of decades). Presently, 17.5% of all wells on Öland are already located in high-risk areas, according to the results presented in this study. Furthermore, all wells considered in this study had some non-negligible risk of salinization, as reflected by their risk index values being larger than zero. Over-extraction and other external influences on high-risk wells could result in salinization. Particularly in recent times, Öland has experienced periods of freshwater shortage from groundwater wells running dry, particularly in the summer months. The problems surrounding this topic could increase in the future, with a growing population and increasing tourism. The salinization would be expected to initially occur in wells located in areas with higher risk index values identified here.
4.3. Costs and Actions
Because many wells on Öland are in high-risk areas of salinization, the cost of ensuring freshwater supplies could be large—if not planned and executed in a sustainable manner. Sea level rise will also induce direct costs to society, particularly in densely populated areas, where the loss of property could be extensive. In a longer time perspective, the regional economy could suffer from a decrease of tourism as a result of the loss of land (e.g., beaches, camping grounds, and hiking trails). In this context, the results of this study may prove useful for decision-makers for the planning of infrastructure. New wells could be drilled in areas with lower risk index values, to mitigate potential complications of intrusion by saltwater and allow for an overall higher freshwater withdrawal in the interest of the entire island. Although the index should be used as a relative evaluation tool rather than providing absolute answers [25], it allows for a quantitative analysis of risk parameters.
In order to reduce the pressure on the freshwater system in certain risk areas, a range of measures could be implemented. For example, freshwater could be transported from areas with lower risk index values, enabling high-risk wells to slowly recover from overpumping [29]. The possibility to import water from the mainland through pipes should be considered, as other regions in Sweden have sufficient supplies, and in some areas an excess, of freshwater. The desalination of seawater could be another possible solution to ensure a sustainable water supply. Building sea walls to hinder the sea level rise is also possible—protecting the most important areas. In densely populated areas, this might be more cost effective, although likely not elsewhere.
4.4. A Precautionary Approach
Islands are cut off from the mainland, not only geographically but also in terms of their physical bounds on the groundwater resources. Overall, the present study together with previous first assessments, for example, [16], suggest a relatively high vulnerability of the major Baltic Sea islands and their infrastructure to future sea level rise. While this study has also addressed the present risk of salinization of wells by assessing multiple geomorphological and physical parameters, there are other factors that additionally can affect the risk, including the overpumping of groundwater, withdrawal from deep drill holes [26], the quality of the well construction, climate change, drought, storm surges [22], or cracks in the limestone formations [10]. In particular, the withdrawal of freshwater and the depth of the well affect the flow pattern of the groundwater through aquifers—causing saltwater to migrate to the artificially created low-pressure area underground [21,30]. Furthermore, although tides are negligible (in the order of a centimeter), in the studied part of the semiclosed basin of the Baltic Sea, well salinization may be impacted by sea level variations in the order of decimeters that occur in response to weather and wind conditions [31]. In addition, extreme sea level deviations of 1.0 m currently occur with a 10 year recurrence interval in response to severe storms [32]. External factors such as this have not been taken into account in this study and may add to (i.e., further increase) the risks presented here, as the considered mean sea level would be temporarily exceeded, as indicated above. More generally, inundation-focused studies such as ours (including also the previously published study of Ebert et al., 2016) should hence be seen as relatively robust estimates of minimum effects that may be exceeded as a result of the influence of parallel processes and secondary effects (e.g., [33]). Such processes certainly deserve further attention in future studies.
5. Conclusions
With a future sea level rise of 2 m, 5% (67 km2) of the land area of Öland will be inundated, along with 3% of all of the island’s wells, including wells used in summer houses, smaller farms, and as energy wells. The inundated areas include coastal towns and other urban areas, but also infrastructure, farmland, cultural features, nature reserves, animal protected areas, and land important for the tourism industry. Consequently, sea level rise will induce direct costs to society, particularly in densely populated areas, where the loss of property could be extensive. In a longer perspective, the regional economy could suffer from a decrease of tourism as a result of the loss of land (e.g., beaches, camping grounds, and hiking trails). In addition, many wells on the island are already at risk of saltwater intrusion today. This is particularly the case for the north part of the island, because of the generally low land surface elevation, impacts of the prevailing soil type, and the relatively low annual precipitation. Notably, 17.5% of all wells were shown to belong to high-risk classes with respect to saltwater intrusion, and 64% belonged to medium-risk classes. More generally, the approach and related results used here, including the salinization risk map, may prove useful for decision-makers in the planning of infrastructure. The drilling of new wells could for instance preferably be done in areas with identified lower risk index values, which would facilitate an overall higher freshwater withdrawal in the interest of the entire island.
Acknowledgments
We thank three anonymous reviewers for constructive comments that led to improvements in our paper.
Author Contributions
M.E. led the work and did the main part of the writing and the analyses, with contributions from K.E. and J.J.
Conflicts of Interest
The authors declare no conflicts of interest.
References
- White, I.; Falkland, T. Management of freshwater lenses on small Pacific islands. Hydrogeology 2010, 18, 227–246. [Google Scholar] [CrossRef]
- Werner, A.D.; Simmons, C.T. Impact of Sea-Level Rise on Sea Water Intrusion in Coastal Aquifers. Natl. Ground Water Assoc. 2009, 47, 197–204. [Google Scholar] [CrossRef] [PubMed]
- Cozzolino, D.; Greggio, N.; Antonellini, M.; Giambastiani, B. Natural and anthropogenic factors affecting freshwater lenses in coastal dunes of the Adriatic coast. J. Hydrol. 2017. [Google Scholar] [CrossRef]
- Gregory, J. Projections of Sea Level Rise. Climate Change 2013: The Physical Science Basis. IPCC AR5 Working Group, 2013. Available online: https://www.ipcc.ch/pdf/unfccc/cop19/3_gregory13sbsta.pdf (accessed on 23 May 2017).
- Ågren, J.; Svensson, R. Postglacial Land Uplift Model and System Definition for the New Swedish Height System RG 2000; Lantmäteriet: Gävle, Sweden, 2007; Available online: https://www.lantmateriet.se/globalassets/kartor-och-geografisk-information/gps-och-matning/geodesi/rapporter_publikationer/rapporter/lmv-rapport_2007_4.pdf (accessed on 31 May 2017).
- Huizer, S.; Karaoulis, M.C.; Oude Essink, G.H.P.; Bierkens, M.F.P. Monitoring and simulation of salinity changes in response to tide and storm surges in a sandy coastal aquifer system. Water Resour. Res. 2017, 53, 6487–6509. [Google Scholar] [CrossRef]
- Von Oelreich, J.; Svenfelt, Å.; Wikman-Svahn, P.; Carlsson-Kanyama, A. Future Sea Level Rise in Municipal Planning. FOI & KTH, Försvarsanalys. 2012. Available online: http://kth.diva-portal.org/smash/get/diva2:563705/FULLTEXT01.pdf (accessed on 23 May 2017).
- Prieto, C.; Destouni, G. Quantifying hydrological and tidal influences on groundwater discharges into coastal waters. Water Resour. Res. 2005, 41, W12427. [Google Scholar] [CrossRef]
- Hellström, M.; Ottvall, R.; Andersson, A.; Lilja Nordin, T.; Waldenström, J.; Lindström, Å. Fågelräkning och Ringmärkning vid Ottenby 2016 [Bird Ringing at Ottenby 2016]; Report; Ottenby Bird Observatory–Swedish Ornithological Society: Degerhamn, Sweden, 2017. [Google Scholar]
- GeoPark Öland. En Liten Geologisk Guide Till Upplevelser På Öland. 2012. Available online: http://www.olandsguiderna.se/images/Geopark-guide.pdf (accessed on 9 May 2017).
- Ölands Turistbyrå. Turistbroschyr 2017. Available online: https://issuu.com/olandsturistbyra/docs/turistbroschyr_2017 (accessed on 9 May 2017).
- Kohl, R.; Carlson, C.; Wangemann, S. Herbicide Leaching Potential through Road Ditches in Thin Soils over an Outwash Aquifer. Appl. Eng. Agric. 1994, 10, 497–503. [Google Scholar] [CrossRef]
- Augustsson, A.; Uddh Söderberg, T.; Jarsjö, J.; Åström, M.E.; Olofsson, B.; Balfors, B.; Destouni, G. The risk of overestimating the risk—Metals in groundwater near contaminated glass waste deposits and exposure via drinking water. Sci. Total Environ. 2016, 566–567, 1420–1431. [Google Scholar] [CrossRef] [PubMed]
- Larrson, M.; Rosander, M. Översvämningsrisker på Öland—Vattenplanering i ett Förändrat Klimat; Länsstyrelsen: Kalmar, Sweden, 2015. [Google Scholar]
- Länsanalyser, SMHI 1991–2013. Available online: http://www.smhi.se/klimat/framtidens-klimat/lansanalyser/#00_Sverige,t2m_meanAnnual,ANN (accessed on 8 May 2017).
- Ebert, K.; Ekstedt, K.; Jarsjö, J. GIS analysis of effects of future Baltic Sea level rise. Nat. Hazards Earth Syst. Sci. 2016, 16, 1571–1582. [Google Scholar] [CrossRef]
- Ströberg, A.; Ebert, K.; Jarsjö, J.; Frampton, A. Contaminated area instability along Ångermanälven River, Northern Sweden. Environ. Monit. Assess. 2017, 189, 118. [Google Scholar] [CrossRef] [PubMed]
- Gutierrez, B.T.; Plant, N.G.; Thieler, E.R. A Bayesian network to predict coastal vulnerability to sea level rise. J. Geophys. Res. Earth Surf. 2011, 116. [Google Scholar] [CrossRef]
- Hossam, H.E.; Ragaa, E.S.; Atef, A.Q.; Ahmad, M.N. Determining groundwater protection zones for the Quaternary aquifer of northeastern Nile Delta using GIS-based vulnerability mapping. Environ. Earth Sci. 2013, 68, 313–331. [Google Scholar]
- Barlow, P. Ground Water in Freshwater-Saltwater Environments of the Atlantic Coast; U.S. Geological Survey: Reston, VA, USA, 2003. Available online: http://purl.access.gpo.gov/GPO/LPS54260 (accessed on 9 May 2017).
- Rushton, K. Groundwater Hydrology: Conceptual and Computational Models; John Wiley & Sons, Ltd.: Chichester, UK, 2003. [Google Scholar] [CrossRef]
- Klassen, J.; Allen, D. Research papers: Assessing the risk of saltwater intrusion in coastal aquifers. J. Hydrol. 2017. [Google Scholar] [CrossRef]
- Karlsson, R.; Hansbo, S. Jordarters Indelning Och Benämning. Svenska Geotekniska Föreningen. 1992. Available online: http://docplayer.se/11017438-Jordarternas-indelning-och-benamning.html (accessed on 10 May 2017).
- Sveriges Nationalatlas (SNA). Berg Och Jord, 2nd ed.; Sveriges Nationalatlas: Stockholm, Sweden, 2009; Volume 3, ISBN 9789187760563. [Google Scholar]
- Gogu, R.; Dassargues, A. Current trends and future challenges in groundwater vulnerability assessment using overlay and index methods. Environ. Geol. 2000, 39, 549–559. [Google Scholar] [CrossRef]
- Brunnsarkivet, SGU. Available online: https://apps.sgu.se/kartvisare/kartvisare-brunnar.html?zoom=348313.6192553048,6150814.150664143,870234.6630973928,6410934.670905184 (accessed on 1 May 2017).
- Tularam, G.; Keeler, H. The study of coastal groundwater depth and salinity variation using time-series analysis. Environ. Impact Assess. Rev. 2006, 26, 633–642. [Google Scholar] [CrossRef]
- Nuse, B.; Cooper, R.; Hunter, E. Prospects for predicting changes to coastal wetland bird populations due to accelerated sea level rise. Ecosphere 2015, 6, 1–23. [Google Scholar] [CrossRef]
- Mossmark, F.; Hultberg, H.; Ericsson, L. Recovery from groundwater extraction in a small catchment area with crystalline bedrock and thin soil cover in Sweden. Sci. Total Environ. 2008, 404, 253–261. [Google Scholar] [CrossRef] [PubMed]
- Eissa, M.; Thomas, J.; Pohll, G.; Shouakar-Stash, O.; Hershey, R.; Dawoud, M. Groundwater recharge and salinization in the arid coastal plain aquifer of the Wadi Watir delta, Sinai, Egypt. Appl. Geochem. 2016, 71, 48–62. [Google Scholar] [CrossRef]
- Leppäranta, M.; Myrberg, K. Physical Oceanography of the Baltic Sea; Springer Science & Business Media: Berlin/Heidelberg, Germany, 2009; p. 278. ISBN 978-3-540-79702-9. [Google Scholar]
- Nerheim, S.; Södling, J. Havsnivåer i Kalmar Län (Sea Levels in Kalmar Municipality); Report 66; Swedish Hydrological and Meteorological Institute (SMHI): Norrköping, Sweden, 2014. (In Swedish) [Google Scholar]
- Torresan, S.; Critto, A.; Rizzi, J.; Marcomini, A. Assessment of coastal vulnerability to climate change hazards at the regional scale: The case study of the North Adriatic Sea. Nat. Hazards Earth Syst. Sci. 2012, 12, 2347–2368. [Google Scholar] [CrossRef] [Green Version]
Figure 1.
Study area, location in Scandinavia, topography, hydrology, urban areas, and main roads.

Figure 2.
(I) Density of wells shown as point density; (II) elevation of all 3438 wells; 99 wells (3% of total) are located at or below 2 m.a.s.l. These will be directly inundated in a 2 m sea level rise scenario.
Figure 2.
(I) Density of wells shown as point density; (II) elevation of all 3438 wells; 99 wells (3% of total) are located at or below 2 m.a.s.l. These will be directly inundated in a 2 m sea level rise scenario.

Figure 3.
(I) Topography and illustration of a future sea level rise of 2 m accounting for a total loss of 67 km2, approximately 5% of the total land area. (II) A future scenario showing the inundation of the biggest town of Öland, Borgholm, in the case of a sea level rise. (III) Illustrating the inundation of Öland’s second biggest town, Färjestaden. (IV) Illustrating the inundation of the third biggest town, Mörbylånga.

Figure 4.
(I) Topography and inundated land area by a projected 2 m future sea level rise. (II) The bird protection area of Sandviken will be completely inundated and submerged. (III) The bird protection area of Själgrund will be lost, and the nature reserves around it will be almost entirely inundated. The new coastline will reach up to 1 km inland. (IV) The southern headland of Ottenby is an important area for migratory bird populations and other natural and cultural values. A large part of this region will be submerged. Some new islands will be cut off from the mainland.
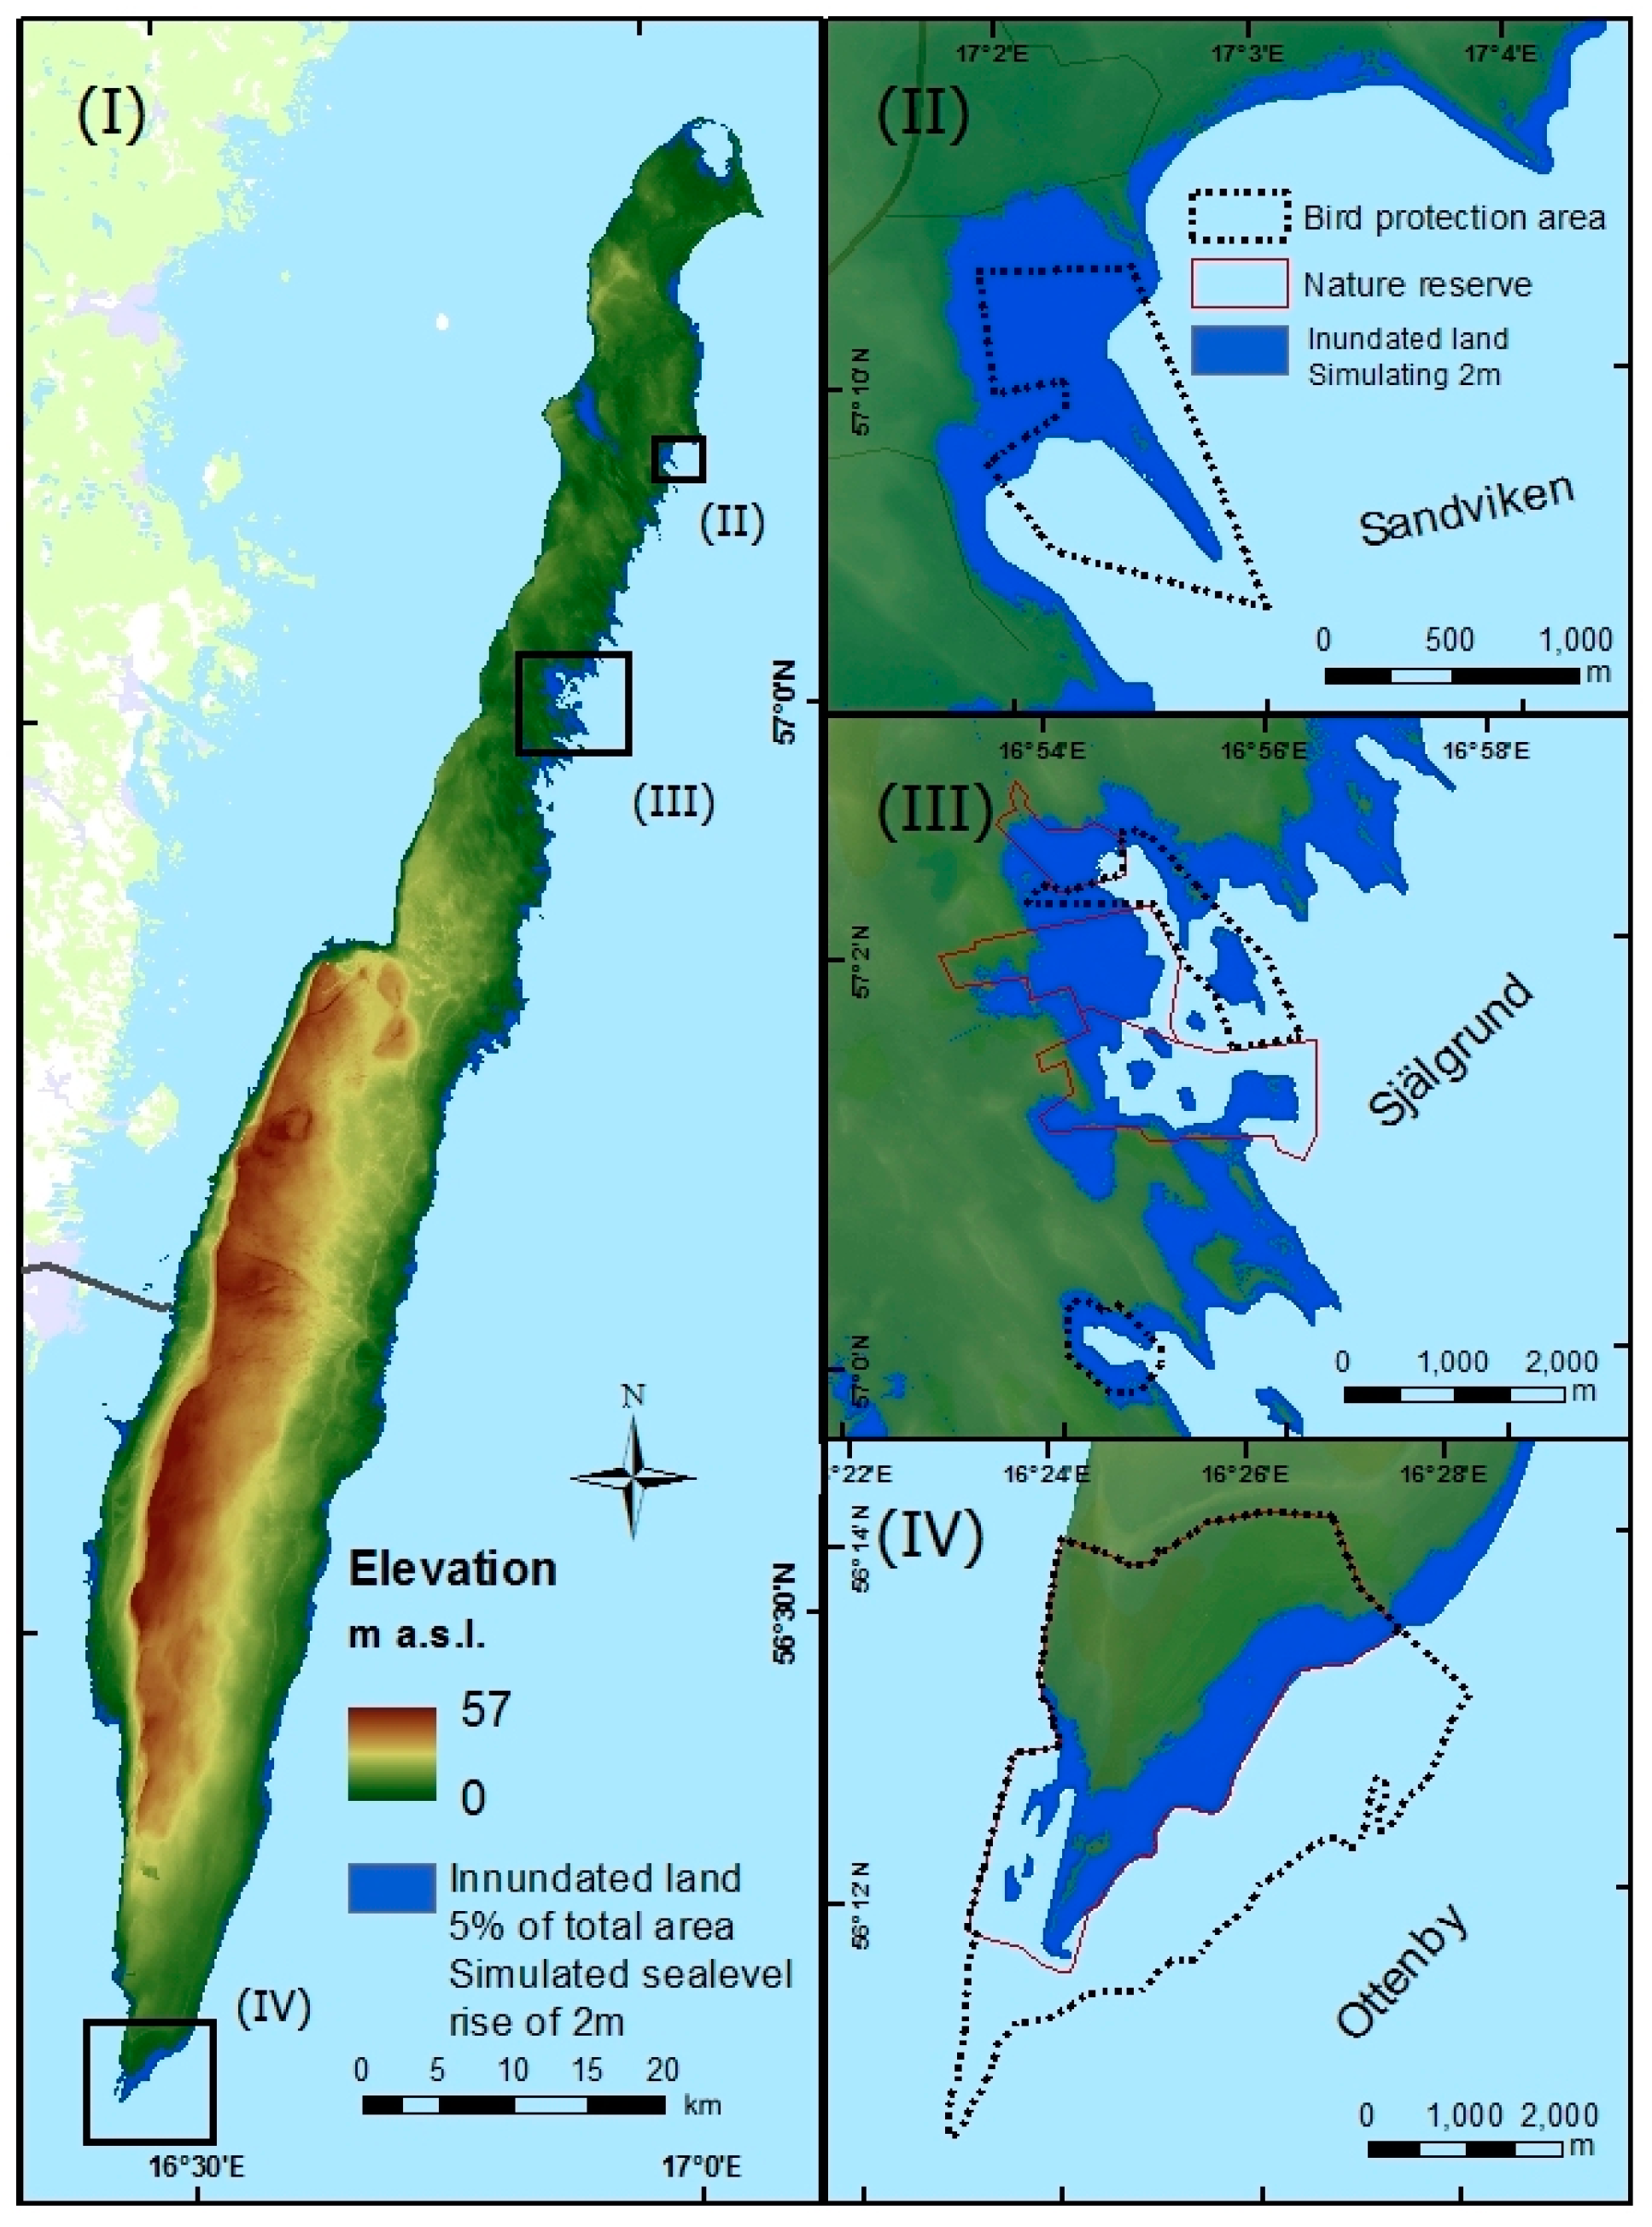
Figure 5.
The spatial distribution of the weighted risk value for each parameter used in the risk analysis of saltwater intrusion. These five visualizations are used as a foundation for the final risk map (Figure 6). The weighted risk values and other values are presented in Table 2.
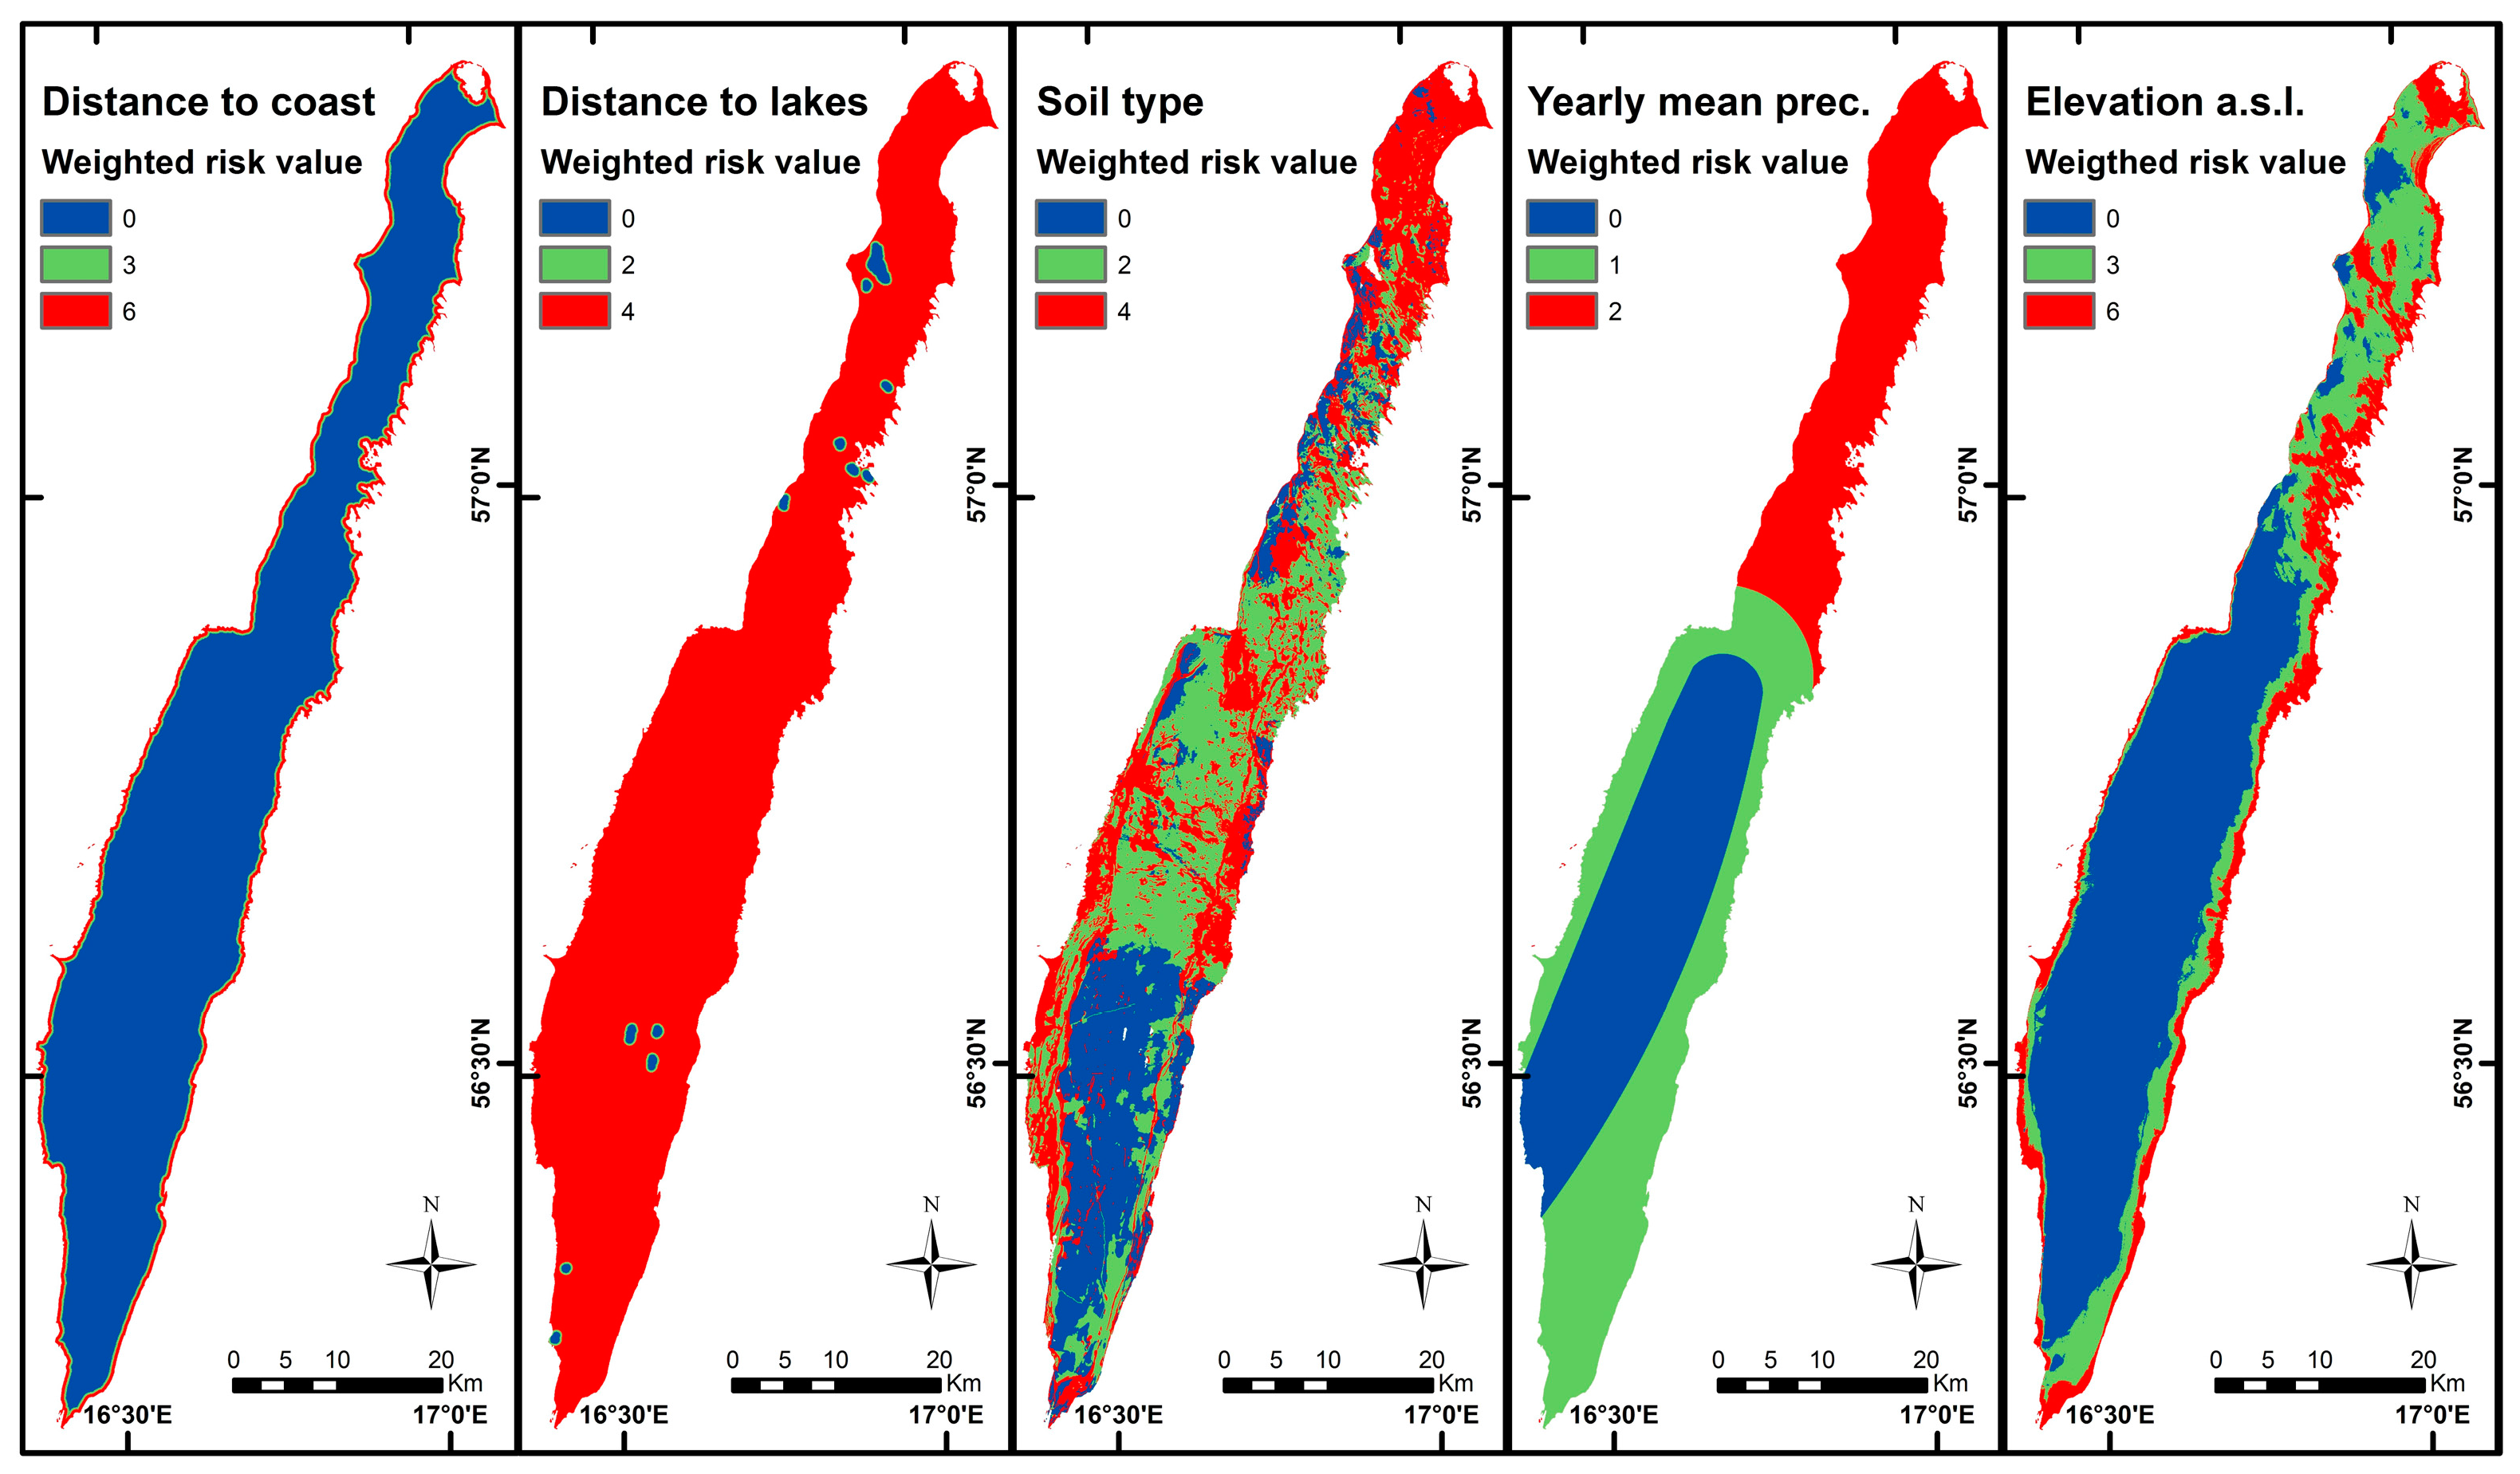
Figure 6.
(I) Estimated overall risk of saltwater intrusion into wells. Higher index number implies a higher risk of intrusion on the basis of the added weighted risk values from Table 2. (II) The locations of wells in and around the town of Borgholm and the risk of saltwater intrusion. (III) Magnification of the area around the second biggest town, Färjestaden, including the locations of wells and the risk index.

Figure 7.
Number of wells for each risk index value. Higher risk index values imply higher risk and susceptibility for saltwater intrusion into the number of wells in each specific class. Low-risk classes are color-coded in blue, medium-risk classes in yellow and high-risk classes in red.
Figure 7.
Number of wells for each risk index value. Higher risk index values imply higher risk and susceptibility for saltwater intrusion into the number of wells in each specific class. Low-risk classes are color-coded in blue, medium-risk classes in yellow and high-risk classes in red.


Table 1.
Data used in this study.
| Data | Format | Reference | Production Date | Resolution |
|---|---|---|---|---|
| Digital elevation model (DEM) | Raster | Swedish National Land Survey | 2009 | 2 m |
| Soil type | Vector (polygon) | Swedish Geological Survey | 2014 | - |
| Wells | Vector (point) | Swedish Geological Survey | 2010 | - |
| GSD-General Map | Vector (polygon) | Swedish National Land Survey | 2017 | - |
| Mean annual precipitation | Raster | Swedish Meteorological and Hydrological Institute | 1991–2013 | 4000 m |
Table 2.
Risk parameters of saltwater intrusion used in the risk analysis, including subdivisions, risk values, and weight factors; see [16] for further details.
Table 2.
Risk parameters of saltwater intrusion used in the risk analysis, including subdivisions, risk values, and weight factors; see [16] for further details.
| Parameter (j) | Subdivision Value | Risk Value (R) | Weight Factor (W) | Weighted Risk Value |
|---|---|---|---|---|
| Distance to coast (m) | <300 300–500 >500 | 2 1 0 | 3 | 6 3 0 |
| Distance to lakes (m) | <300 300–500 >500 | 0 1 2 | 2 | 0 2 4 |
| Soil type | Coarse sediments Fine sediments Bare bedrock No data | 2 1 0 No data | 2 | 4 2 0 No data |
| Prec. yearly average (mm) | <550 550–600 >600 | 2 1 0 | 1 | 2 1 0 |
| Elevation meters above sea level (m.a.s.l.) | <5 5–10 >10 | 2 1 0 | 3 | 6 3 0 |
© 2018 by the authors. Licensee MDPI, Basel, Switzerland. This article is an open access article distributed under the terms and conditions of the Creative Commons Attribution (CC BY) license (http://creativecommons.org/licenses/by/4.0/).
Share and Cite
MDPI and ACS Style
Eriksson, M.; Ebert, K.; Jarsjö, J. Well Salinization Risk and Effects of Baltic Sea Level Rise on the Groundwater-Dependent Island of Öland, Sweden. Water 2018, 10, 141. https://doi.org/10.3390/w10020141
AMA Style
Eriksson M, Ebert K, Jarsjö J. Well Salinization Risk and Effects of Baltic Sea Level Rise on the Groundwater-Dependent Island of Öland, Sweden. Water. 2018; 10(2):141. https://doi.org/10.3390/w10020141
Chicago/Turabian StyleEriksson, Marcus, Karin Ebert, and Jerker Jarsjö. 2018. "Well Salinization Risk and Effects of Baltic Sea Level Rise on the Groundwater-Dependent Island of Öland, Sweden" Water 10, no. 2: 141. https://doi.org/10.3390/w10020141
Note that from the first issue of 2016, this journal uses article numbers instead of page numbers. See further details here.