Article

Impacts of Environmental Variables on a Phytoplankton Community: A Case Study of the Tributaries of a Subtropical River, Southern China

1
Beijing Key Laboratory of Traditional Chinese Medicine Protection and Utilization, Faculty of Geography Science, Beijing Normal University, Beijing 100875, China
2
College of Resources Science and Technology, Faculty of Geographical Science, Beijing Normal University, Beijing 100875, China
3
College of Resource and Environment, Yunnan University, Kunming 650091, China
4
Shenzhen Academy of Environmental Sciences, Shenzhen 518001, China
*
Author to whom correspondence should be addressed.
Water 2018, 10(2), 152; https://doi.org/10.3390/w10020152
Submission received: 15 December 2017 / Revised: 2 February 2018 / Accepted: 2 February 2018 / Published: 4 February 2018

Abstract

:
The phytoplankton community in the river is closely related to the location of the river and the impact of human activities. To summarize the patterns of phytoplankton community changes in rivers and to analyze the reasons for these patterns and differences, we sampled the three tributaries of the Dongjiang River at different latitudes in the dry and rainy season for three years. The results showed that the three rivers were mesotrophic, lightly eutrophic and moderately eutrophic respectively. From the south to the north, the water temperature and nutrition showed an increasing trend. In two different seasons, the differences in the water temperature and dissolved oxygen were clear. In the dry season, results of the multidimensional scaling (MDS) analysis indicated that the phytoplankton community structures in the Li River and Qiuxiang River were similar. Regardless of the number of species, the cell abundance or the dominance index, Bacillariophyta were found to be dominant. Chlorophyta was dominant in the Danshui River. In the rainy season, Bacillariophyta, Bacillariophyta-Chlorophyta and Chlorophyta-Cyanophyta became the dominant types in the Li River, Qiuxiang River and Danshui River, respectively. These different patterns in phytoplankton community variation were affected by both the water quality and temperature.

1. Introduction

Phytoplankton, as the main primary producers of the aquatic environment and the foundation of the food web, play an important role in nutrient cycling and the energy conversion process [1]. Studying the succession of a phytoplankton community has important theoretical and practical significance. Numerous research studies in different rivers have showed that temperature, light and nutrients are important factors impacting the succession of the phytoplankton community [2,3,4]. In natural water bodies, these factors often simultaneously determine the succession of the phytoplankton community. Sommer with her colleagues summed up the famous PEG (Plankton Ecology Group) model for the seasonal variation of phytoplankton biomass in a temperate mesotrophic lake [5]. Since then, this model has been applied to many comparative studies of different types of lakes and rivers [6,7]. However, at different geographical positions and nutrient levels, the degree of influence of each factor varies [8]. Different types of rivers may have different phytoplankton community successions [9,10].
The Dongjiang River is a subtropical river located in southeastern China, and its basin has experienced rapid development of the economy and population in the past 25 years [11]. More importantly, the Dongjiang River is responsible for supplying drinking water to the Pearl River Delta region and Hong Kong. In recent years, the degradation of the water quality of the Dongjiang River caused widespread concern [12,13,14,15]. Nitrogen and phosphorus concentrations were found at high levels in the many tributaries, giving rise to the possibility of a harmful algae bloom [16]. Thus, many scholars have performed many studies on the water quality and its influencing factors in the Dongjiang River [17,18]. Some research has discussed the aquatic ecosystem of the Dongjiang River from a biological viewpoint, assessing macroinvertebrates and phytoplankton [19,20,21]. The above research shows that a river has different hydrological conditions, pollution pressures and nutritional status in different seasons, and this difference also exists in every tributary. However, phytoplankton research has used limited sampling locations and could not assess each type of river or demonstrate the contrast between the seasons. Therefore, this study chose three tributaries of Dongjiang River, the Li River, the Qiuxiang River and the Danshui River, as research subjects. These three tributaries are located at different latitudes and have different nutritional status. A comparison of the phytoplankton community structures in different tributaries and their influencing factors can help us better understand the different river ecosystem types. In addition, analyzing the seasonal differences in the phytoplankton community can aid in understanding the mechanism of variation.
The aims of our research were (1) to verify differences in the trophic states and phytoplankton community structures in three tributaries of the Dongjiang River; (2) to examine how the phytoplankton community variation is influenced by environmental factors; and (3) to summarize the seasonal variation in the phytoplankton communities of the three rivers.

2. Materials and Methods
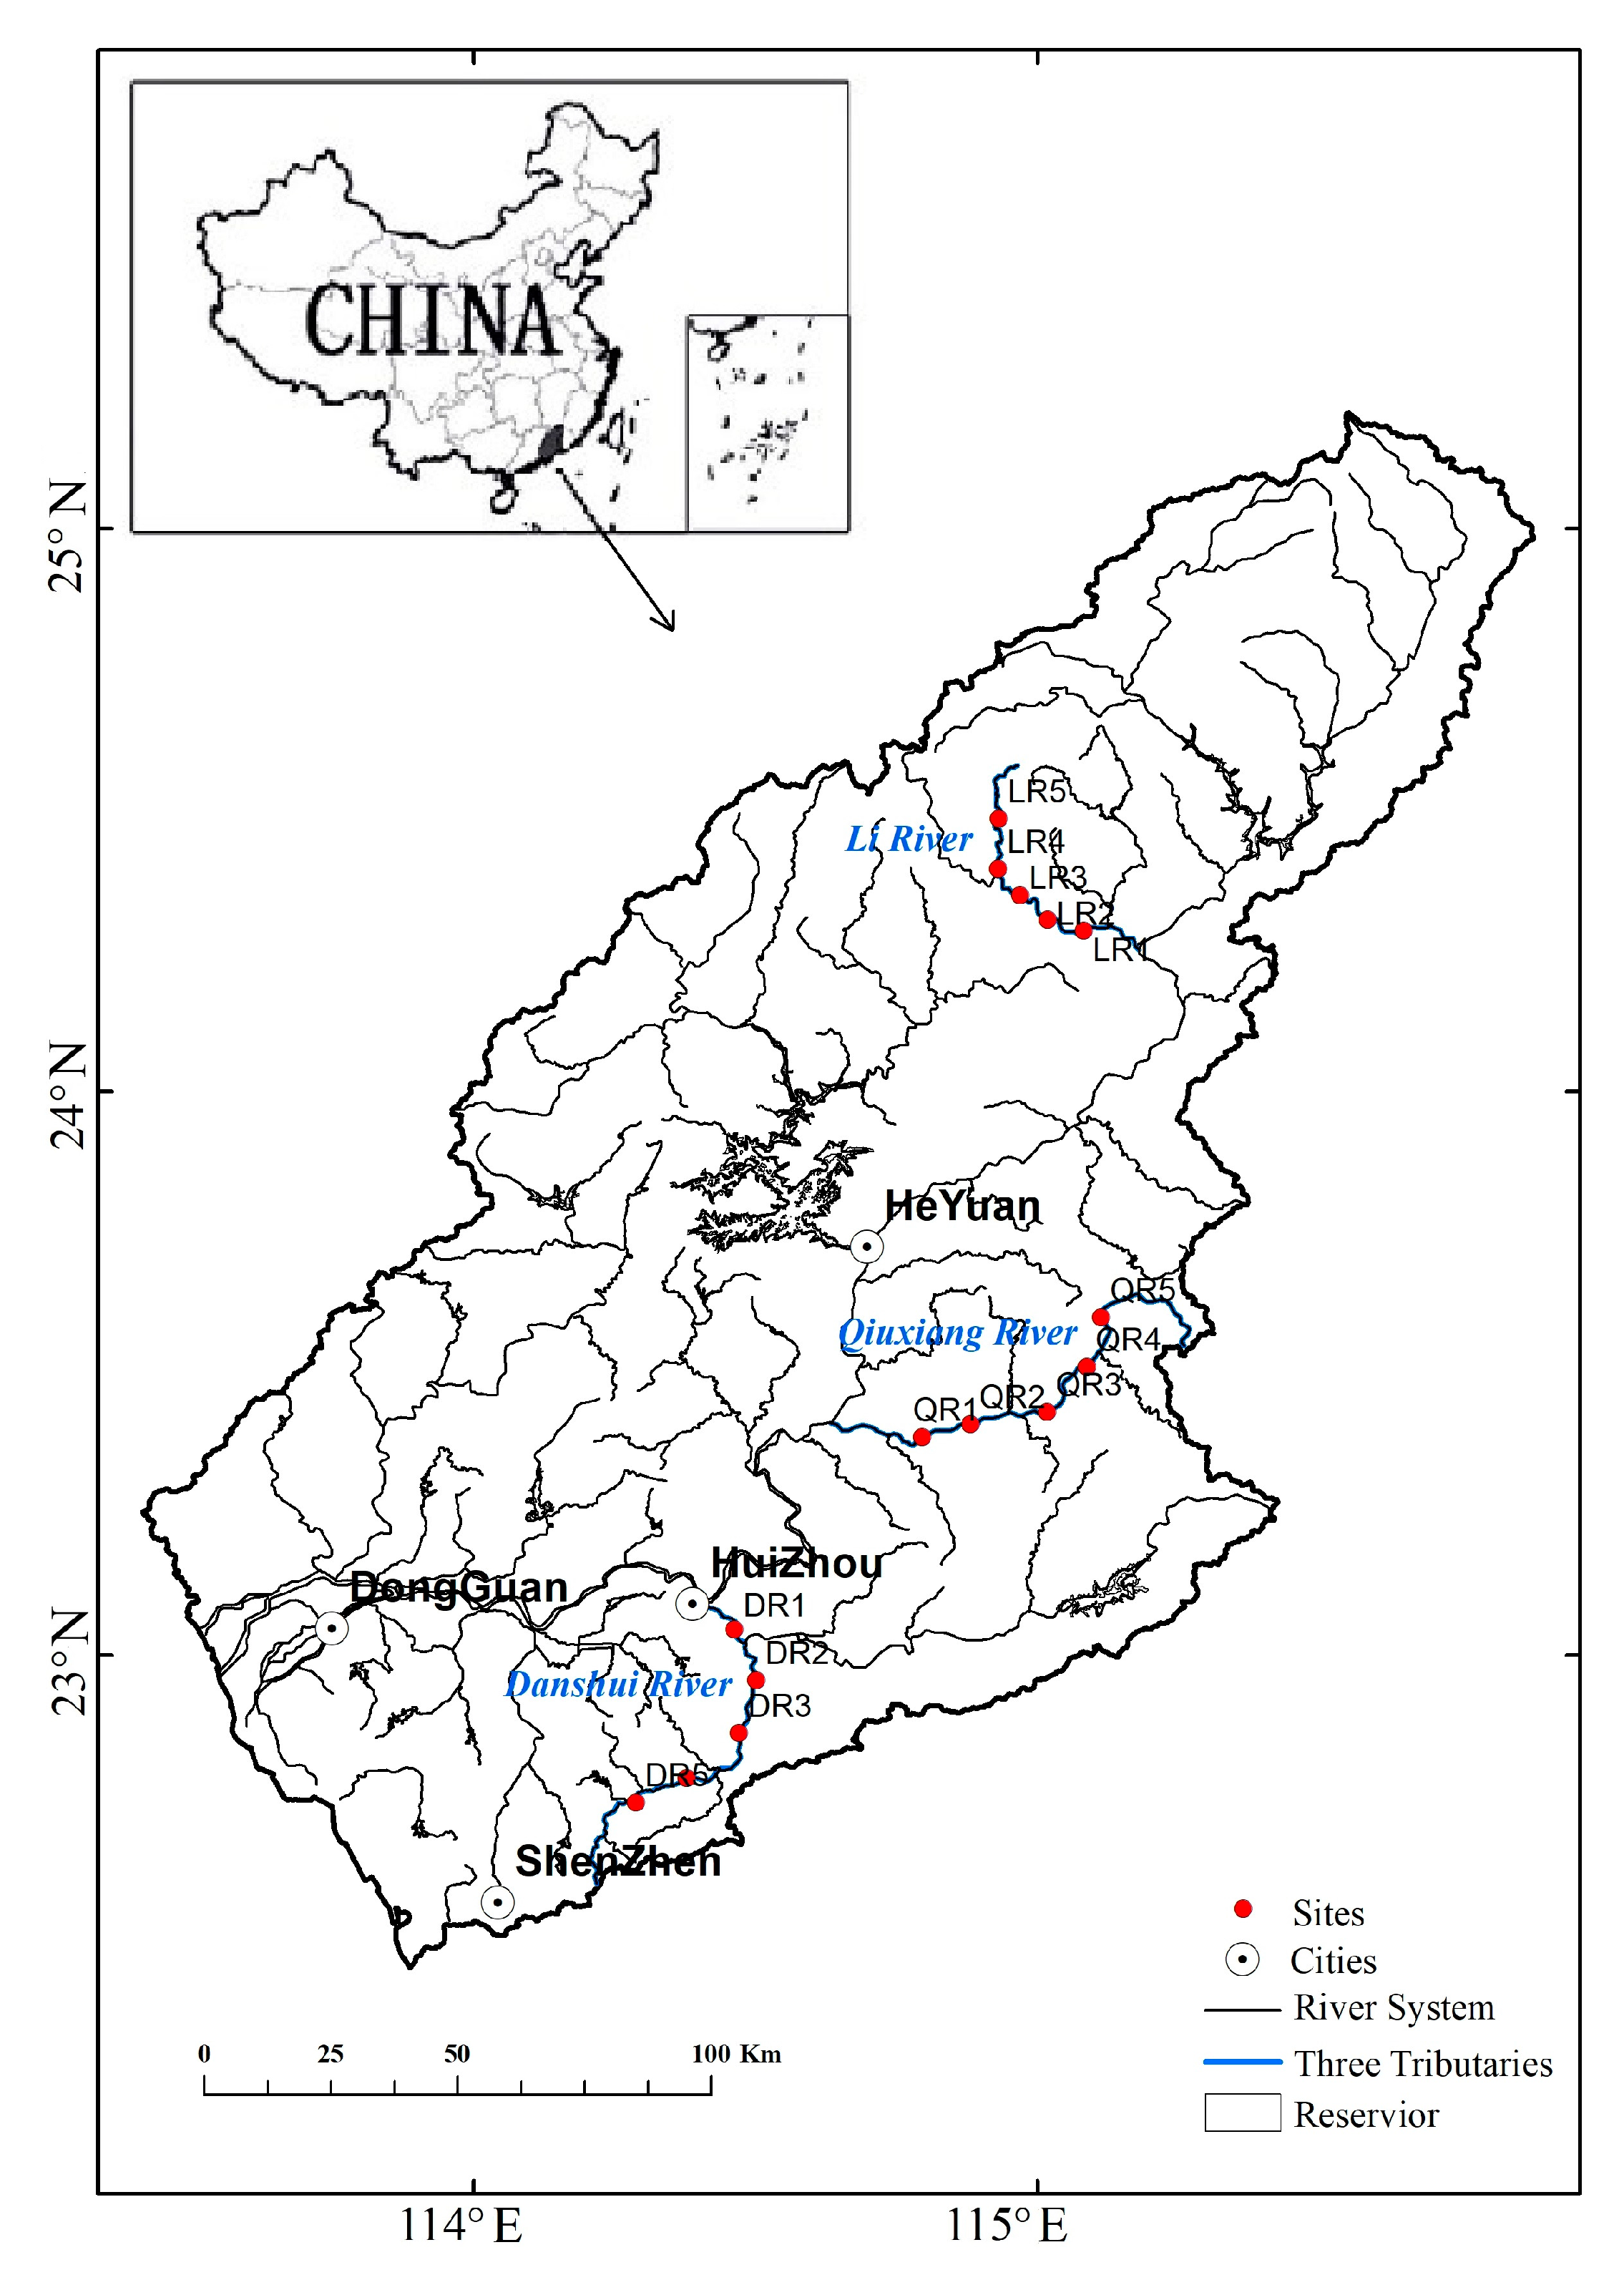
2.1. Study Area

The Dongjiang River (22°21′–25°12′ N, 113°04′–115°50′ E) is one of the main tributaries of the Pearl River in southeastern China (Figure 1). It originates from the Xunwu country in Jiangxi Province and flows into the Pearl River at Humen Town in Guangdong Province. The Dongjiang River basin has a subtropical monsoon climate, with an annual average temperature of 21 °C and a mean annual precipitation of approximately 1800 mm [22]. Although there are several large reservoirs in the basin, the hydrology and water availability of the basin still demonstrate strong seasonal variations [23]. The Li River, Qiuxiang River and Danshui River are three tributaries of the Dongjiang River and are respectively located upstream, midstream and downstream of the Dongjiang River [24]. The Li River originates from Liyuan Town and is approximately 100 km long. The basin of this river is 1677 km2. This river flows through Heping Country of Heyuan City, and agriculture and mining are the pillar industries of this county. The Li River is at a higher elevation and flows through several mountains. The lower levels of nutrients in the water may be due to the mountainous and barren land on both sides of this river [17]. The Qiuxiang River originates from Liudun Hill, and its length is approximately 144 km. The basin of this river is 1669 km2 and all in Zijin Country. Agriculture and aquaculture are the pillar industries of this country. Furthermore, industrial parks are also sporadically distributed in this basin. Therefore, the point source pollution caused by industrial wastewater is gradually increasing. The Danshui River originates from Wutong Mountain in Shenzhen, and the length is approximately 95 km. The basin of this river is 1308 km2. This river flows through Shenzhen City and Huizhou City, and both cities are based on the manufacturing and processing of electronic products and clothing. The water pollution is serious due to the greater population density and the large amount of sewage [25].

2.2. Phytoplankton Sampling and Laboratory Procedures

A total of 15 sites were sampled along the main stem of the three tributaries. Five sites were sampled for each river during stable flow conditions (Figure 1). To avoid phytoplankton community differences in the upstream and downstream of a tributary of, we selected sampling sites in the middle reaches of the river. More importantly, we did not sample around the outfall. In the pre-test, we also removed the abnormal sites with large fluctuations in environmental factors. The distance between each two sites was approximately 10 km. The sampling sites located in the middle of the stream or at least 5 m from the riverbank. We worked in the field once during the dry season (February) and once during the rainy season (July) in 2012, 2014 and 2015. Climatic conditions for the sampling year were generally consistent with the long-term averages for the region. Water and phytoplankton samples in total were collected 0.5 m below the water surface using a 2.5-L organic glass hydrophore. Phytoplankton samples were preserved in Lugol’s iodine solution and stored in 1 L polyethylene bottles and transported to the laboratory. In the laboratory, phytoplankton samples were left undisturbed for more than 24 h to mature, and were concentrated to approximately 30 mL. The concentrated phytoplankton samples were counted in a S-R Plankton Counting Chamber plankton counting chamber (0.1 mL) using a Nikon ECLIPSE 90i (Nikon Corporation, Tokyo, Japan) optical digital upright microscope at an eyepiece magnification of 10× and an objective magnification of 40×.The cell numbers of different phytoplankton species were counted in 100 random fields. Phytoplankton species were identified according to Freshwater Algae in China and the Atlas of Common Freshwater Algae in China [26,27].

2.3. Environmental Factors

The value of transparency (SD, m) was determined with the use of a white Secchi disc 30 cm in diameter. The water temperature (TEM, °C), electrical conductivity (EC, μs·cm−1), dissolved oxygen (DO, mg·L−1), and pH were measured using a portable probe (YSI6600, YSI Incorporated Company, Yellow Spring, OH, USA) at the sites. For trophic parameter, water samples were transported to the laboratory at 4 °C and analyzed according to the standard methods issued by the Chinese State Environmental Protection [28]. The permanganate index (CODMn, mg·L−1) was analyzed by the permanganate titration. The total nitrogen (TN, mg·L−1) and nitrate nitrogen (NO3-N, mg·L−1) were determined by spectrophotometry. The ammonia nitrogen (NH3-N, mg·L−1) was determined by the Nessler’s reagent spectrophotometry. The total phosphorus (TP, mg·L−1) was analyzed using the ascorbic acid method. The chlorophyll-a (Chl-a, μg·L−1) was determined by acetone extraction spectrophotometry. The values of the nine parameters that are presented in this paper are the means of triplicate analyses.

2.4. Data Analysis

The dominant taxa of phytoplankton were determined based on the Berger-Parker dominance index formula, as shown in Equation (1):
d = n i N
where ni is the number of individuals of genus i within a given area in one season, and N is the total number of individuals of all taxa within the given area in one season. Then, the taxon with a dominance index over 0.02 were determined for the dominant taxon [29].
The river eutrophication levels were determined based on the four types of water quality measurements, which can be reference Wang et al. [30] and Liu et al. [31]. Nutrient content (TN and TP), water clarity (SD), organic matter content (COD) and chl a concentration were used to calculated the comprehensive trophic level index (TLI(Σ)), as shown in Equation (2):
TLI ( Σ ) = j = 1 m w j × TLI ( j )
where TLI(Σ) is the comprehensive trophic level index, TLI(j) is the trophic level index of j, and wj is the correlated weighted score for the TLI(j).
w j = R i j 2 j = 1 m R i j 2
where m is the number of parameters, and Rij is the correlation coefficient.
TLI(TN) = 10 × (5.453 + 1.694 ln TN)
TLI(TP) = 10 × (9.436 + 1.624 ln TN)
TLI(SD) = 10 × (5.118 − 1.94 ln TN)
TLI(CODMn) = 10 × (0.109 + 2.661 ln TN)
TLI(Chla) = 10 × (2.5 + 1.086 ln Chla)
The water nutrition conditions of the water systems were scored using whole integers on a scale of 0–100, with mesotrophic conditions at 30 < TLI(Σ) ≤ 50, lightly mesotrophic conditions at 50 < TLI(Σ) ≤ 60, moderately eutrophic conditions at 60 < TLI(Σ) ≤ 70. The difference of the trophic level index among the three tributaries were found by the ANOVA test. Because the water quality parameters were not normally distributed when assessed by the Kolmogorov–Smirnov test [32], nonparametric Kruskal–Wallis tests were adopted to test the differences of environmental factors between dry and rainy season [33]. These analyses were carried out by SPSS 20.0 (IBM Company, Armonk, NY, USA).
To identify the spatial differences in the phytoplankton assemblages, multidimensional scaling (MDS) was performed with log(x + 1) check transformed abundance data. We used the Bray–Curtis similarity coefficient as the distance measure and computed the data. The significances of the degree of separation among the MDS groups were tested by applying one-way similarities analysis (ANOSIM) based on permutation procedures using the Bray–Curtis distance measure. The test results show an overall R statistic and significance level, and provide a pairwise comparison between different groups. The number of permutations was set to 999. MDS and ANOSIM analyses were conducted using PRIMER 5.0 (PRIMER-E Ltd, Roborough, Plymouth, UK).
To assess the relationships between environmental factors and the phytoplankton cell abundance, canonical correspondence analysis (CCA), a constrained ordination, was used. Prior to the analysis, the phytoplankton taxon that occurred at less than three sites and the relative abundance was less than 1% in a site were removed from the analysis to reduce the influence of rare taxa. Environmental variables were transformed with log(x + 1) (except pH). For more details on the test, see Braak and Smilauer [34]. This analysis was conducted using the CANOCO 5.0 (Microcomputer Power Company, Ithaca, NY, USA).

3. Results

3.1. Variations in Water Quality and Environmental Factors

The environmental factors of three tributaries in the dry and rainy season are shown in Table 1. The water temperature in the dry season was clearly lower than that in the rainy season. Conversely, the DO in the dry season was higher than in the rainy season. In the Danshui River, the EC and TN in the dry season were higher than in the rainy season.

3.2. Difference of Trophic State Index

To better see the nutrition level of the three tributaries, we calculated the trophic level index (TLI) for these three respectively. As shown in Table 2, the difference of the TLI among the three tributaries was obvious. According to the evaluation standard of the TLI index, the trophic state of Li River was mesotrophic (30 < TLI ≤ 50). Qiuxiang River and Danshui River were lightly eutrophic (50 < TLI ≤ 60) and moderately eutrophic (60 < TLI ≤ 70).

3.3. Variations in the Phytoplankton Communities

3.3.1. Number of Taxa

A total of 178 taxa (including the varieties and forms) of phytoplankton belonging to seven phyla and 74 genera were identified in the three tributaries of the Dongjiang River. These were represented mainly by Bacillariophyta (73 taxa) and Chlorophyta (72). Other phyla included Cyanophyta (15), Euglenophyta (10), Cryptophyta (4), Chrysophyta (1) and Pyrrophyta (1). In the dry season, a total of 32 taxa belonging to six phyla and 18 genera were identified in Li River, and 78.1% of taxa belong to the Bacillariophyta. A total of 65 taxa belonging to six phyla and 31 genera were identified in Qiuxiang River, and a total of 62 taxon belonging to five phyla and 28 genera were identified in Danshui River. Most taxa belong to Bacillariophyta and Chlorophyta in these two rivers. In the rainy season, a total of 76 taxa belonging to six phyla and 49 genera were identified in Li River. A total of 93 taxa belonging to six phyla and 53 genera were identified in Qiuxiang River, and a total of 94 taxa belonging to six phyla and 56 genera were identified in Danshui River. Most taxa belong to Bacillariophyta and Chlorophyta in these three rivers.

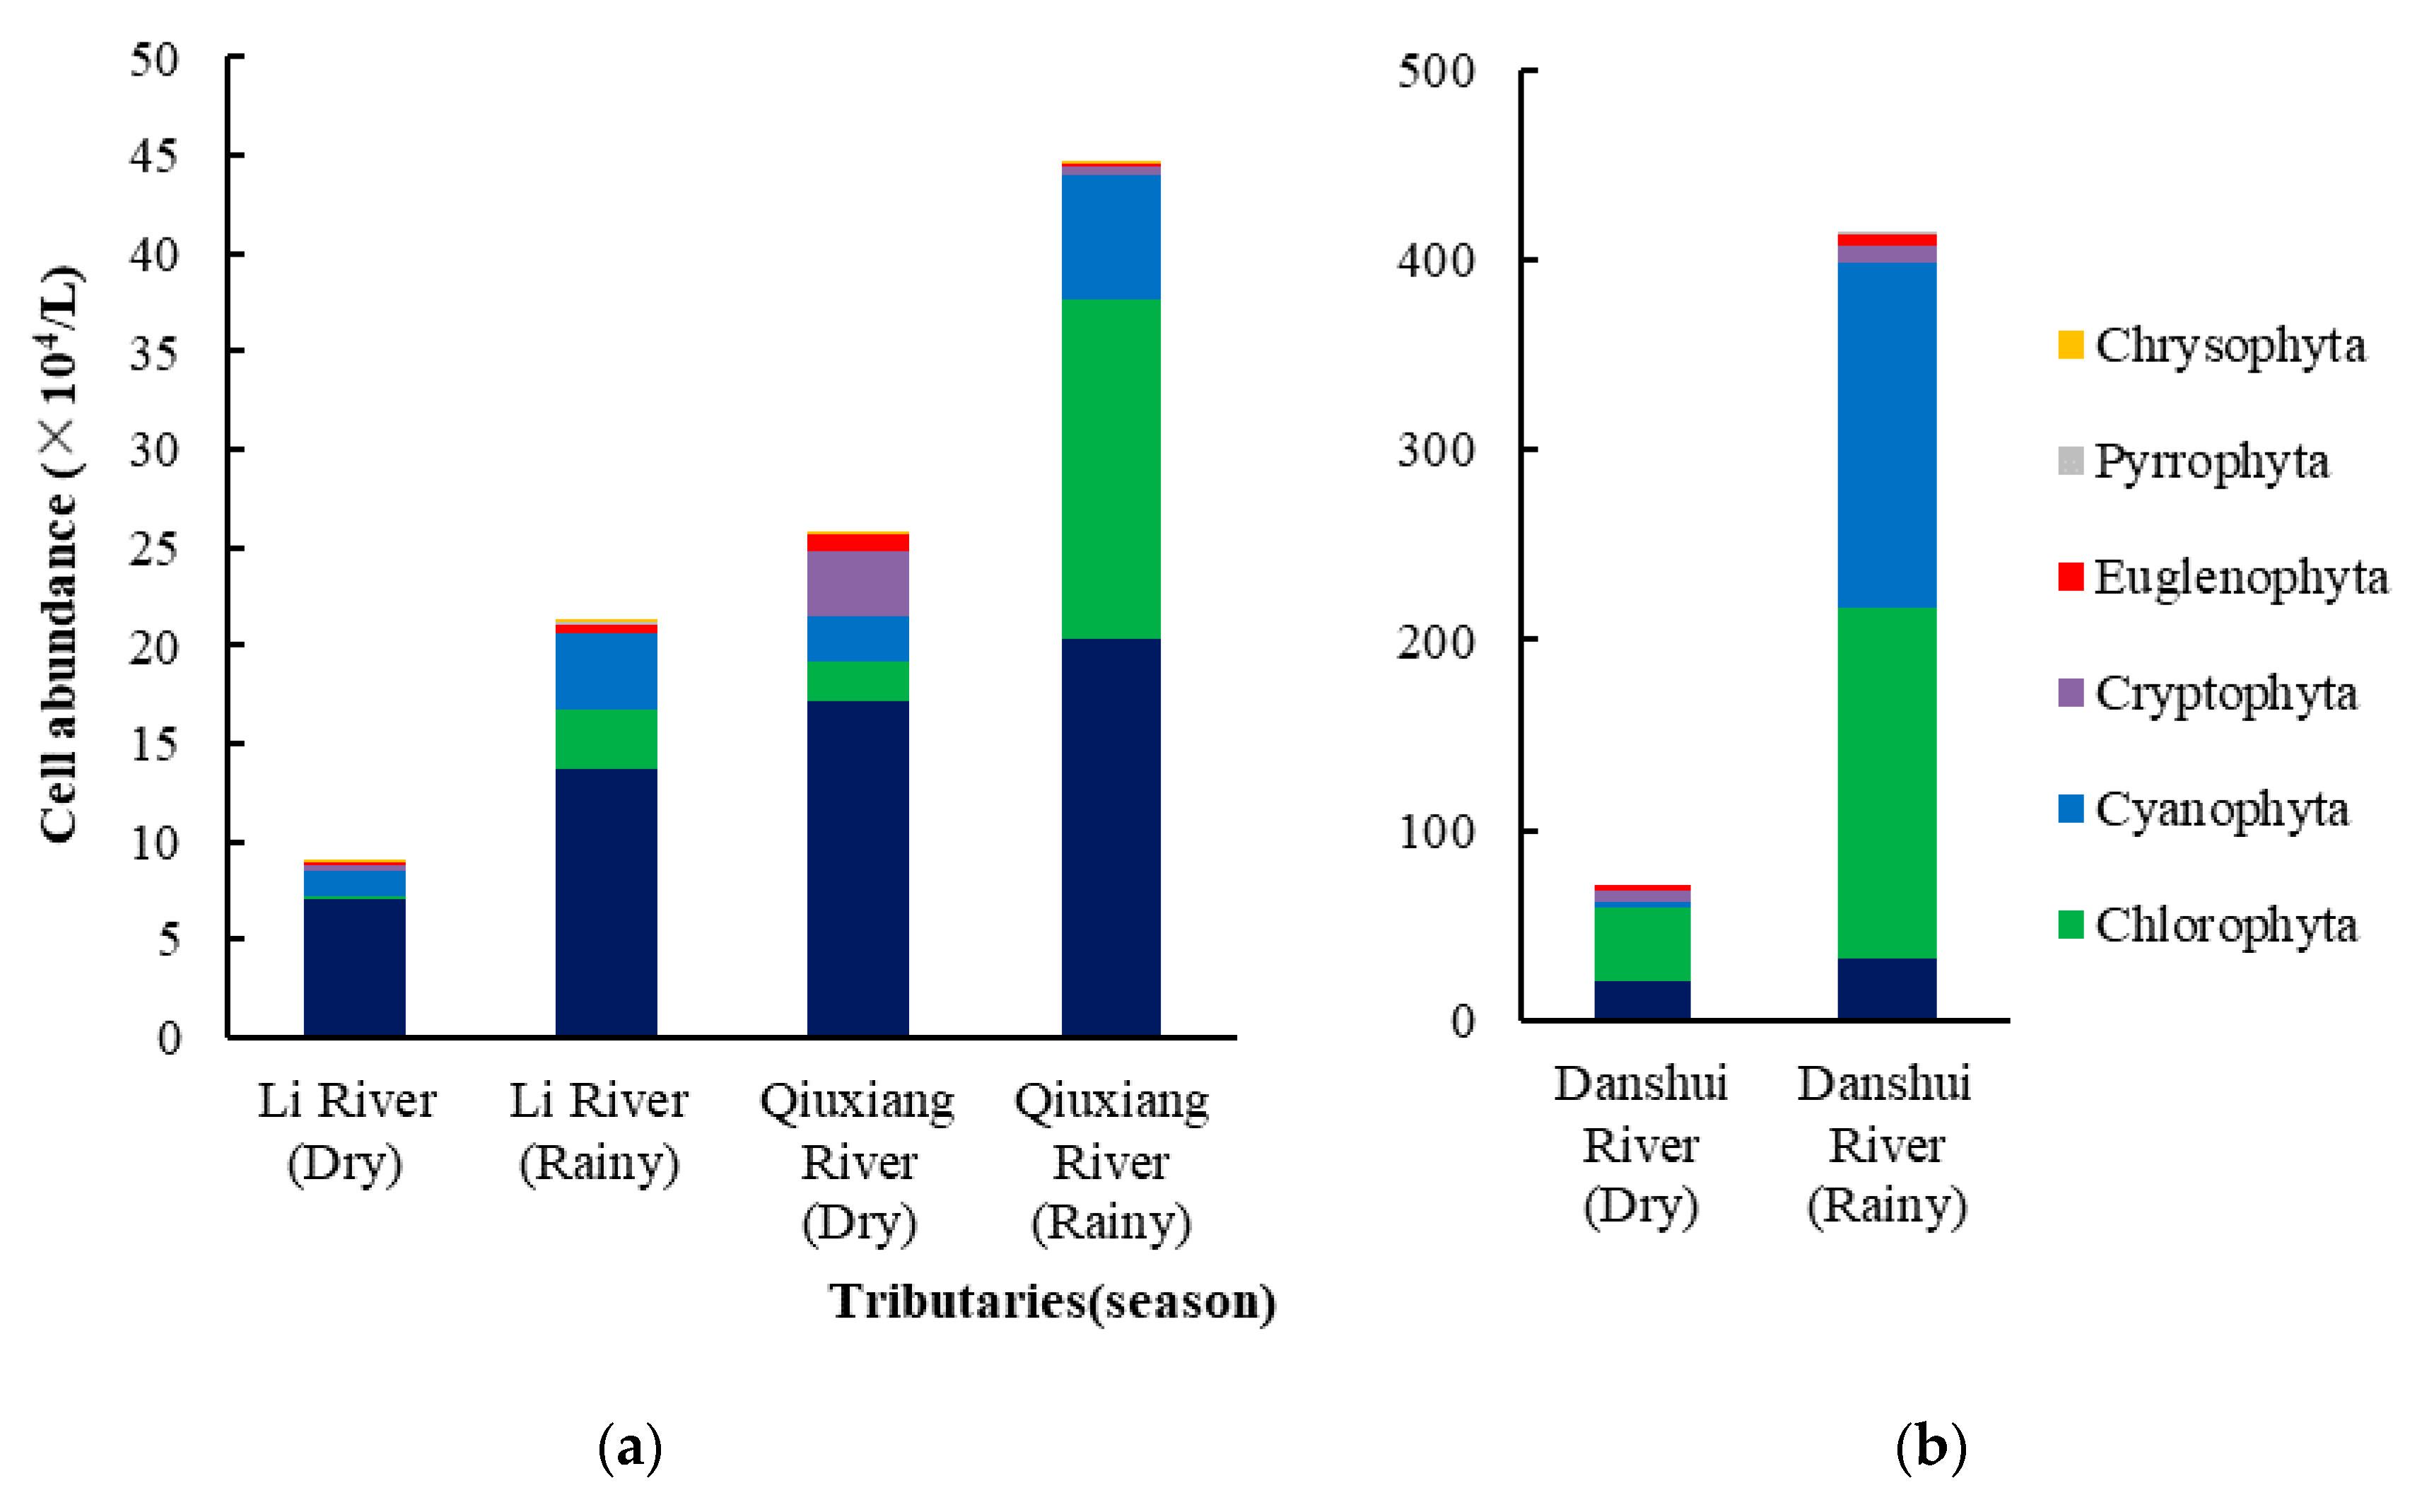
3.3.2. Cell Abundance

As shown in Figure 2, generally, the cell abundance of the phytoplankton in Li River was the lowest and in Danshui River was the highest. In different seasons, the phytoplankton cell abundances in dry season were higher than those in the rainy season. In the Li River, Bacillariophyta was the dominant phylum in both the dry and the rainy season, and Chlorophyta also was a common phylum in the rainy season. In the Qiuxiang River, Bacillariophyta was the dominant phylum in the dry season, followed by Cryptophyta, Chlorophyta, Cyanophyta and Euglenophyta. However, in the same river, Bacillariophyta and Chlorophyta were the dominant phylum in the rainy season, followed by Cyanophyta. In the Danshui River, Chlorophyta was the dominant phyla in both the dry and the rainy season. Bacillariophyta also accounted for a certain proportion in the dry season, and Cyanophyta accounted for a higher percentage in the rainy season. In addition, Chrysophyta appeared only in the Li River and the Qiuxiang River in the dry season.

3.3.3. Dominant Taxa

As shown in Table 3, Bacillariophyta were dominant in the Li River in both the dry and the rainy season. Melosira varians, Nitzschia sp., and Navicula sp. always accounted for a larger percentage. However, in the rainy season, Scenedesmus quadricanda (Chlorophyta) and Dolichospermum sp. (Cyanophyta) appeared to be the dominant taxa of this river. In the Qiuxiang River, the obvious seasonal differences in the dominant taxa were mainly seen in the Cryptophyta. In the dry season, Cryptomonas ovata became the dominant taxon. In addition, Bacillariophyta, Chlorophyta and Cyanophyta were widespread, and Nitzschia sp., Navicula sp., and Scenedesmus quadricanda were the dominant taxa in this river in both the dry and the rainy season. In comparison, the dominance indexes of these Chlorophyta and Cyanophyta taxa were greater in the rainy season than in the dry. In the Danshui River, Cyanophyta and Chlorophyta always accounted for a larger percentage. Especially in the rainy season, all the dominant taxa were Cyanophyta and Chlorophyta.

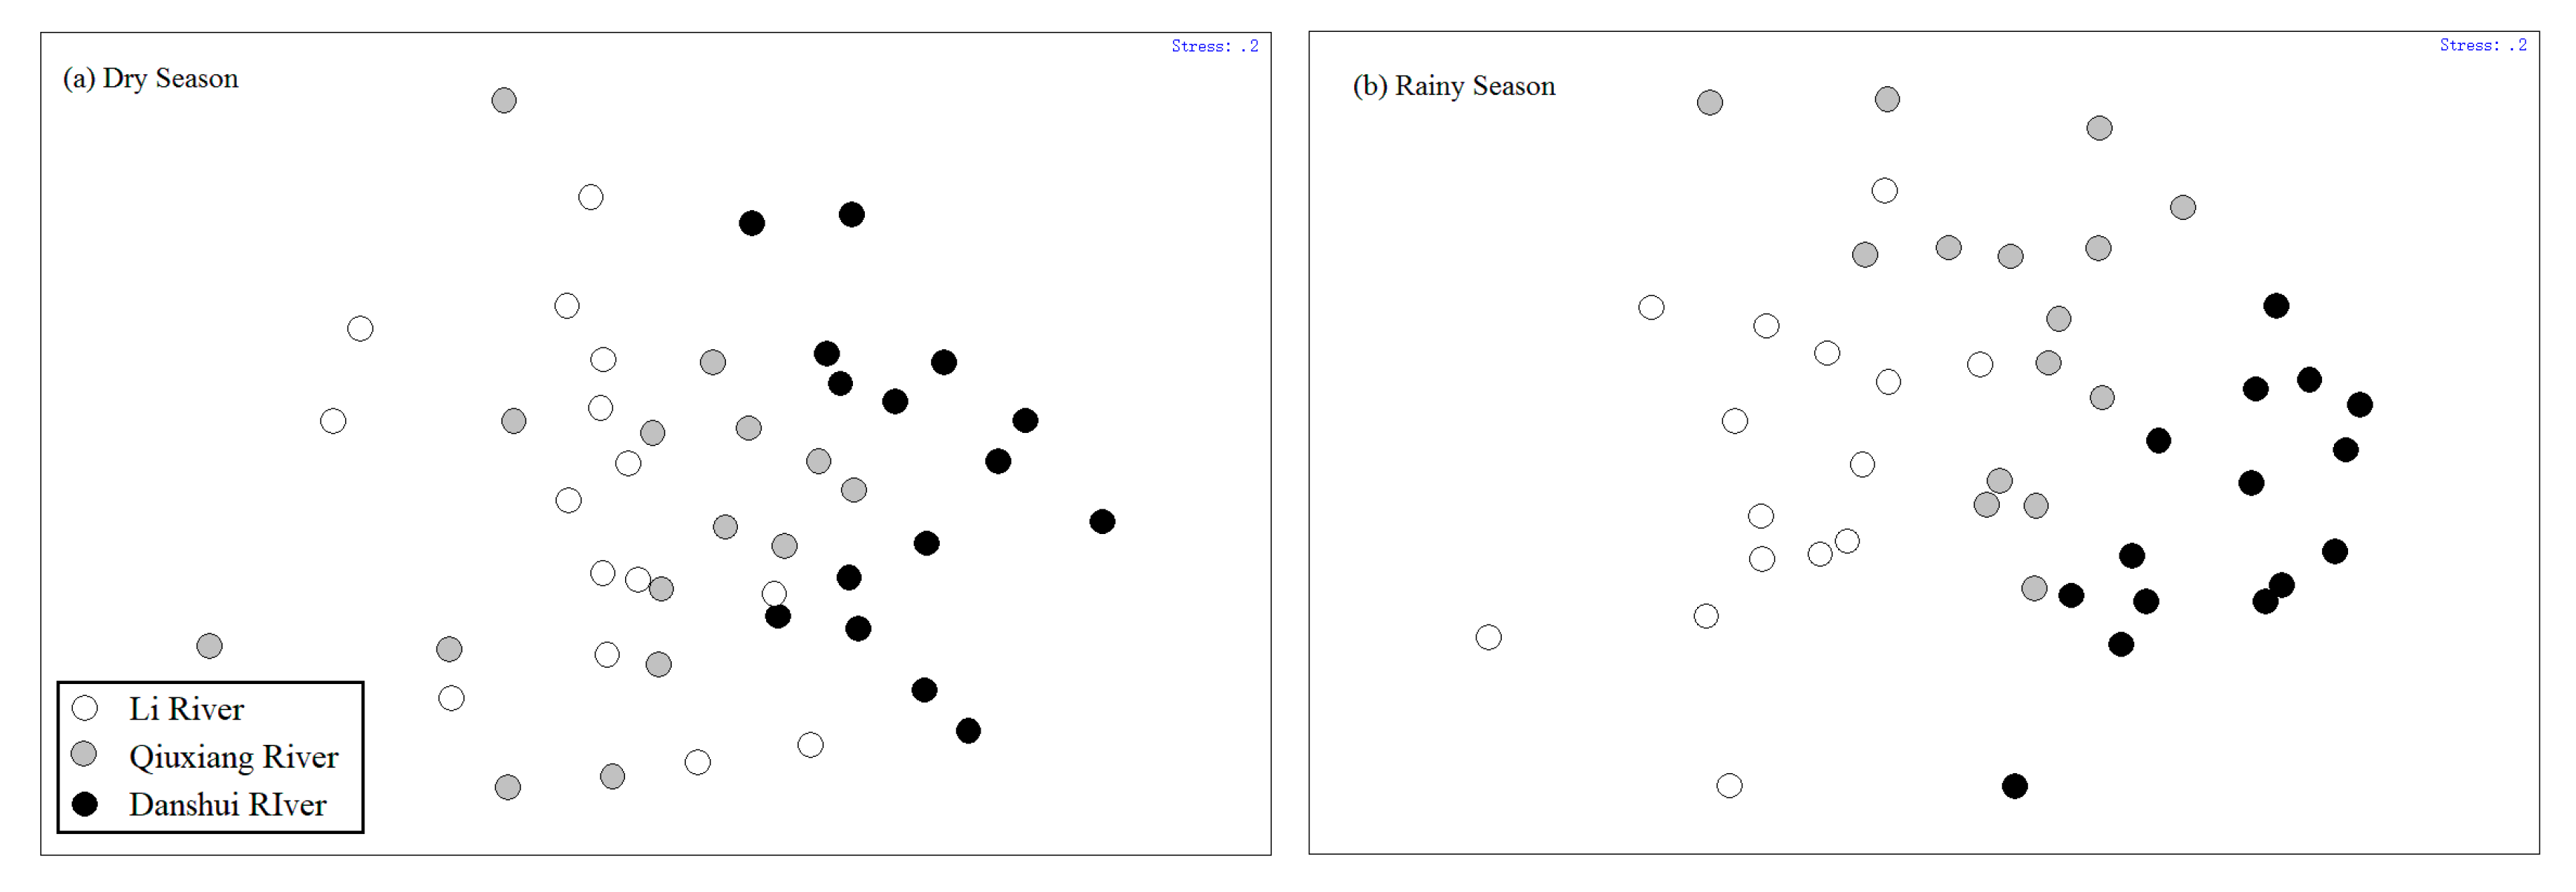
3.3.4. Community Structure Similarity

MDS analysis revealed that in the dry season, phytoplankton communities in the Danshui River were rather special, but those from the Li River and the Qiuxiang River were similar (Figure 3a). On the other hand, in the rainy season, it could be clearly seen that all phytoplankton of three tributaries were not similar (Figure 3b). The stress values of the two MDS plots were the same (0.2), which is considered to adequately represent similarity or dissimilarity between the samples in MDS plots. These differences were confirmed by one-way ANOSIM analyses, which showed that, for the phytoplankton cell abundance, the data for the three tributaries were significantly different in rainy season (p < 0.01 for all comparisons) (Table 4). In dry season, the observed differences between the Li River and the Qiuxiang River were not significant (p > 0.01), but the other two comparisons were significantly different (p < 0.01).

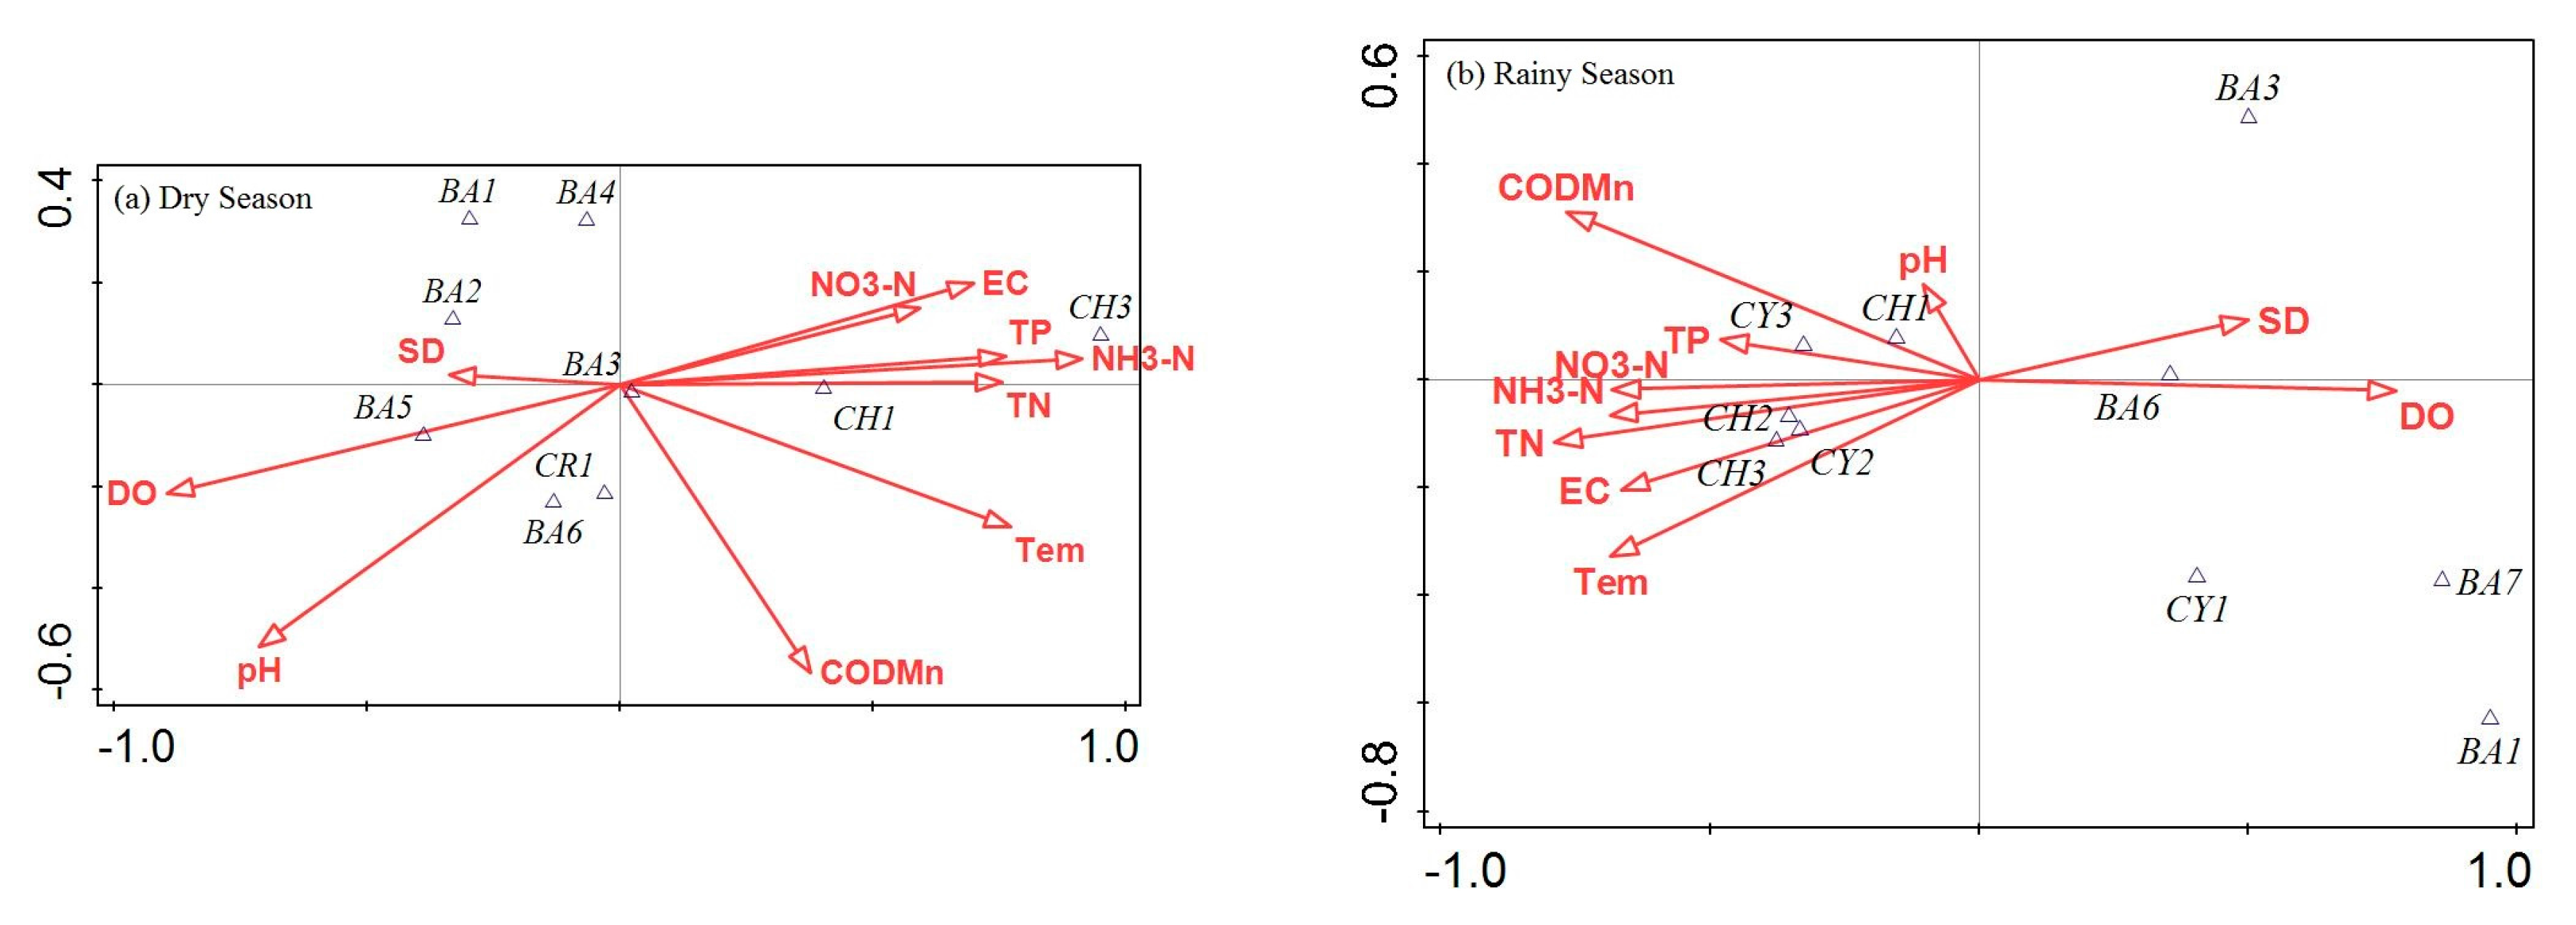
3.4. The Relationship between Environmental Factors and the Dominant Phytoplankton Taxa

In this study, CCA was conducted between the 14 dominant phytoplankton taxa (Table 3) and 10 environmental factors. The statistical relationships between cell abundance of phytoplankton taxa and environment in three tributaries are shown in Figure 4 and Table 5. All the canonical axes significantly accounted for 51.2% (pseudo-F = 1.4, p < 0.05) of the phytoplankton cell abundance in the dry season and 46% (pseudo-F = 2.3, p < 0.01) in the rainy season. The first axis significantly explained 23.65% (pseudo-F = 4.0, p < 0.01) of the variation in the dry season and 25.42% (pseudo-F = 9.2, p < 0.01) in the rainy season, which was correlated with DO, SD, TN, NH3-N, NO3-N and TP. It was indicated that the first axis consistently displayed a gradient of nutrition. The second axis explained 8.35% (pseudo-F = 1.6, p > 0.05) of the variation in the dry season and 9.38% in the rainy season (pseudo-F = 3.9, p < 0.05), which was correlated with CODMn and pH. It was indicated that the second axis to some extent may characterized the pH and organic pollution.
The relationship between the phytoplankton dominant taxa and environmental factors were apparent in the CCA analysis. Whether in the rainy season or the dry season, Bacillariophyta dominant taxa (Melosira varians, Aulacoseira granulate, Gomphonema sp., Navicula sp. and Synedra amphicephala) were positively correlated with DO and SD. On the other hand, Cyanophyta (Merismopedia sp. and Oscillatoriales sp.) and Chlorophyta (Scenedesmus quadricanda, Scenedesmus dimorphus and Crucigenia quadrata) dominant taxa were positively correlated with nutrients.

4. Discussion

4.1. The Spatiotemporal Differences in Environmental Factors and Phytoplankton Community Structure

From the general situation of the study area and Table 2, we can see that these three rivers had a clear trophic state gradient in both of the two seasons. From the Li River in the north to Danshui River in the south, the trophic level had an upward trend. In this nutrient gradient, the phytoplankton community also had a regular variation. This trend could be summarized by saying that the cell abundance proportion of Bacillariophyta showed a decreasing trend, and, conversely, Cyanophyta, Chlorophyta and Cryptophyta showed an increasing trend. Chrysophyta only appeared in the Li River and Qiuxiang River, which indicated more oligotrophic water [35].
Furthermore, environmental factors also showed differences in different seasons. Subtropical monsoon climates produce seasonal changes in the water quality of the Dongjiang River [22]. The DO value of the water in dry season was higher than that in rainy season in each of the tributaries. This is partly because oxygen in the water at higher temperatures is more easily saturated [36] and partly because a large algae population in the water needs to consume more oxygen in order to breathe and decompose in summer. Another seasonal environmental factor was the water temperature, which is affected by the air temperature. Because the Dongjiang River Basin is in the subtropical region, the spring and winter temperatures are significantly different between the north and south regions. However, in the rainy season, this difference becomes smaller. Thus, the phytoplankton cell abundance had a greater impact on the water temperature in the dry season than in the rainy. The seasonal variation in the phytoplankton community is closely related to the aquatic environment, and the water temperature, nutrients and disturbance will all affect community change [37]. Specifically, these three rivers had their own phytoplankton community variation patterns, such that each river requires a separate analysis.

4.2. The Patterns of Variation of the Phytoplankton Communities in Rivers with Different Trophic States

A phytoplankton community can adapt to changes in environmental factors through succession. Sommer summed up the famous PEG model based on extensive analysis of phytoplankton and physical–chemical factors in a temperate mesotrophic lake [5]. In this model, the seasonal variation of the phytoplankton community is as follows: From winter and spring to summer, the dominant Cryptophyta and Bacillariophyta are replaced by Chlorophyta. When late summer comes, Cyanophyta begin to dominate. In our research, the variation in the phytoplankton community of the Qiuxiang River was similar to that predicted by the PEG model due to its mesotrophic type. Compared to the other two rivers, the nutrients of the Qiuxiang River are at a medium level. In the dry season, Bacillariophyta was the dominant phytoplankton, with Cryptophyta as the second most common taxa. In addition to Scenedesmus quadricanda, all the dominant taxa were Bacillariophyta and Cryptomonas (Table 3). This is because some Bacillariophyta are cold water taxa [35]. The trophic state also suited the growth of these taxa at this time. When the rainy season comes, the water temperature rises by approximately 12 °C. The warming temperature was suitable for thermophilic Cyanophyta and Chlorophyta growth and reproduction [29]. Therefore, the proportion of Cyanophyta and Chlorophyta abundance were on the rise and much taxa became dominant, such as Scenedesmus dimorphus, Merismopedia sp. and Oscillatoriales sp.
In the dry season, the Li River and the Qiuxiang River had similar phytoplankton communities, as shown in the MDS analyses. However, in the rainy season, this condition changed. The reason is that the two rivers have different geographical locations and human activity. The Li River basin has a higher elevation and a relatively northern location, lower water temperature and slower flow velocity. In addition, the village population density is low, so the human activity is relatively lower. These reasons would lead to Bacillariophyta dominance in the dry season. It was worth noting that Chrysophyta algae appeared in this time, which was similar to the Qiuxiang River and may indicate cleaner water [38]. In the rainy season, the nutrient level in the Li River remained low. Although the water temperature rose from 12.2 °C to 28.2 °C, Bacillariophyta were still dominant in the community.
The variation of the Danshui River phytoplankton community showed a great difference. A more southern position caused the water temperature to be 20.5 °C in the dry season. In addition, all the nutrient parameters in this river were much higher than those of the others. This was closely connected with the high intensity of human activities [24]. Large amounts of incompletely treated sewage (e.g., municipal wastewater and industrial effluent) are discharged into the rivers, which is a problem in tropical Asian watersheds with dense populations and industries [39]. In these high-nutrient conditions, Chlorophyta begins to occupy the dominant position in the community in the dry season. Among the dominant specie Scenedesmus quadricanda and Crucigenia quadrata were positively correlated with the nutrient levels. These taxa included common small algae taxa with faster metabolisms and the ability to rapidly absorb nutrients, grow and reproduce [40]. In the rainy season, the eutrophication of the water further reduced the proportion of Bacillariophyta in the community, allowing Cyanophyta and Chlorophyta to occupy the major positions. Moreover, Euglenophyta also accounted for a high proportion of the taxa. Most of the Danshui River basin is in the plains, so the water flow velocity is comparatively slow. This relatively stable water body is more suitable for the growth of Cyanobacteria [41] because Cyanobacterial cells have the advantage of being able to adjust to changes in depth using gas vesicles [42]. Another advantage is that Cyanobacteria, especially Oscillatoriales sp. and Merismopedia sp., can worsen the light conditions and adapt to low-light conditions [43]. Previous research has shown that in water experiencing ultra-eutrophication, Euglenophyta could replace Cyanobacterial dominance [44]. Thus, Euglenophyta is an indicator of serious organic pollution [45].

5. Conclusions

The water ecosystem of Dongjiang River has obvious seasonal difference caused by subtropical climate. The different geographical locations of tributaries make the phytoplankton community show various characteristics. Among the three tributaries, in the dry season, the Li River had lower water temperatures, and the Danshui River had higher temperatures. In terms of nutrients, the Li River and Qiuxiang River had lower nitrogen levels, while the Danshui River had higher levels. Affected by the condition of climate and nutritional levels, the phytoplankton community variation of the three tributaries showed different patterns of variation. In the lightly eutrophic river, the community transformed from the Bacillariophyta-Cryptophyta type to the Chlorophyta-Cyanophyta type, similar to the PEG model. In the mesotrophic river, Bacillariophyta always was dominant. On the contrary, in the moderately eutrophic river, the blooming of Chlorophyta and Cyanophyta will come very early, which provides a good tip to the monitoring and management of water quality.
Our results have attempted to summarize the regular phytoplankton community variation at the level of different tropical rivers. Although we analyzed only two seasons, there are clear differences in the three patterns of variation. Further research with an improved design over more seasons may better and more completely summarize the patterns of variation.

Acknowledgments

This work was supported by the National Science and Technology Major Project: Water Pollution Control and Management Technology of China (No. 2017ZX07301-0013).

Author Contributions

Yuan Jiang had the original idea for the study. Zhaojiang Hou and Yuan Jiang contributed to the experiment design, manuscript preparation and editing. Qi Liu contributed to measurement of water quality parameters. Yulu Tian, Kejian He and Lan Fu participated in sampling and laboratory experiments. All authors read and approved the final manuscript.

Conflicts of Interest

The authors declare no conflict of interest.

References

  1. Suikkanen, S.; Laamanen, M.; Huttunen, M. Long-term changes in summer phytoplankton communities of the open northern Baltic Sea. Estuar. Coast. Shelf Sci. 2007, 71, 580–592. [Google Scholar] [CrossRef]
  2. Murkin, E.J.; Murkin, H.R.; Titman, R.D. Nektonic invertebrate abundance and distribution at the emergent vegetation-open water interface in the Delta Marsh, Manitoba, Canada. Wetlands 1992, 12, 45–52. [Google Scholar] [CrossRef]
  3. Fleming-Lehtinen, V.; Laamanen, M. Long-term changes in Secchi depth and the role of phytoplankton in explaining light attenuation in the Baltic Sea. Estuar. Coast. Shelf Sci. 2012, 102–103, 1–10. [Google Scholar] [CrossRef]
  4. Lundy, M.E.; Spencer, D.F.; Van Kessel, C.; Hill, J.E.; Linquist, B.A. Managing phosphorus fertilizer to reduce algae, maintain water quality, and sustain yields in water-seeded rice. Field Crop. Res. 2012, 131, 81–87. [Google Scholar] [CrossRef]
  5. Sommer, U.; Gliwicz, Z.M.; Lampert, W.; Duncan, A. The PEG-model of seasonal succession of plankton in fresh waters. Arch. Hydrobiol. 1986, 106, 433–471. [Google Scholar]
  6. García de Emiliani, M.O. Seasonal succession of phytoplankton in a lake of the Paran River floodplain, Argentina. Hydrobiologia 1993, 264, 101–114. [Google Scholar] [CrossRef]
  7. De Senerpont Domis, L.N.; Elser, J.J.; Gsell, A.S.; Huszar, V.L.M.; Ibelings, B.W.; Jeppesen, E.; Kosten, S.; Mooij, W.M.; Roland, F.; Sommer, U.; et al. Plankton dynamics under different climate conditions in tropical freshwater systems (a reply to the comment by Sarmento, Amado & Descy, 2013). Freshw. Biol. 2013, 10, 2211–2213. [Google Scholar]
  8. Rosemond, A.D.; Mulholland, P.J.; Brawley, S.H. Seasonally shifting limitation of stream periphyton: Response of algal populations and assemblage biomass and productivity to variation in light, nutrients, and herbivores. Can. J. Fish. Aquat. Sci. 2000, 1, 66–75. [Google Scholar] [CrossRef]
  9. Badylak, S.; Phlips, E.J. Spatial and temporal patterns of phytoplankton composition in subtropical coastal lagoon, the Indian River Lagoon, Florida, USA. J. Plankton Res. 2004, 26, 1229–1247. [Google Scholar] [CrossRef]
  10. Xu, Y.; Li, A.J.; Qin, J.; Li, Q.; Ho, J.G.; Li, H. Seasonal patterns of water quality and phytoplankton dynamics in surface waters in Guangzhou and Foshan, China. Sci. Total Environ. 2017, 15, 361–369. [Google Scholar] [CrossRef] [PubMed]
  11. Ren, F.P.; Jiang, Y.; Xiong, X.; Dong, M.Y.; Wang, B. Characteristics of the spatial-temporal differences of land use changes in the Dongjiang River Basin from 1990 to 2009. Resour. Sci. 2011, 33, 143–152. (In Chinese) [Google Scholar]
  12. Ho, K.C.; Hui, K.C.C. Chemical contamination of the East River (Dongjiang) and its implication on sustainable development in the Pearl River Delta. Environ. Int. 2001, 5–6, 303–308. [Google Scholar] [CrossRef]
  13. Hong, H.C.; Liang, Y.; Han, B.P.; Mazumder, A.; Wong, M.H. Modeling of trihalomethane (THM) formation via chlorination of the water from Dongjiang River (source water for Hong Kong’s drinking water). Sci. Total Environ. 2007, 385, 48–53. [Google Scholar] [CrossRef] [PubMed]
  14. Ding, J.; Jiang, Y.; Liu, Q.; Hou, Z.J.; Liao, J.Y.; Fu, L.; Peng, Q.Z. Influences of the land use pattern on water quality in low-order streams of the Dongjiang River basin, China: A multi-scale analysis. Sci. Total Environ. 2016, 551–552, 205–216. [Google Scholar] [CrossRef] [PubMed]
  15. Sun, W.; Xia, C.Y.; Xu, M.Y.; Guo, J.; Sun, G.P. Application of modified water quality indices as indicators to assess the spatial and temporal trends of water quality in the Dongjiang River. Ecol. Indic. 2016, 66, 306–312. [Google Scholar] [CrossRef]
  16. Tang, T.J.; Yang, S.; Yin, K.H.; Zou, R. Simulation of eutrophication in Shenzhen Reservoir based on EFDC model. J. Lake Sci. 2014, 26, 393–400. (In Chinese) [Google Scholar]
  17. Zhang, Y.; Dudgeon, D.; Cheng, D.; Thoe, W.; Fok, L.; Wang, Z.; Lee, J.H.W. Impacts of land use and water quality on macroinvertebrate communities in the Pearl River drainage basin, China. Hydrobiologia 2010, 652, 71–88. [Google Scholar] [CrossRef]
  18. Zhou, T.; Wu, J.; Peng, S. Assessing the effects of landscape pattern on river water quality at multiple scales: A case study of the Dongjiang River watershed, China. Ecol. Indic. 2012, 23, 166–175. [Google Scholar] [CrossRef]
  19. Fu, L.; Jiang, Y.; Ding, J.; Liu, Q.; Peng, Q.Z.; Kang, M.Y. Impacts of land use and environmental factors on macroinvertebrate functional feeding groups in the Dongjiang River basin, southeast China. J. Freshw. Ecol. 2016, 31, 21–35. [Google Scholar] [CrossRef]
  20. Jiang, Y; Wang, B.; Yang, H.C.; Liu, Q.R.; Zou, Y.L. Community structure of phytoplankton and its relation with water quality in Dongjiang River. Ecol. Environ. Sci. 2011, 20, 1700–1705. (In Chinese) [Google Scholar]
  21. Tian, S.M.; Yang, Y.; Qiao, Y.M.; He, W.X.; Lin, J.H.; Wang, D.Y. Temporal and spatial distribution of phytoplankton chlorophyll-a and its relationships with environmental factors in Dongjiang River, Pearl River basin. J. Lake Sci. 2015, 27, 31–37. (In Chinese) [Google Scholar]
  22. Wang, M.L.; Xia, J. Influences of land use changes and climatic vibration on water circulation in the East River Valley. Pearl River 2004, 25, 4–6. (In Chinese) [Google Scholar]
  23. Lv, L.T.; Peng, Q.Z.; Liao, J.Y.; Jiang, Y.; Kang, M.Y. Fluctuation and trends in precipitation and runoff in the Dongjiang River Basin over 50 years. Resour. Sci. 2013, 35, 514–520. (In Chinese) [Google Scholar]
  24. Ding, J.; Jiang, Y.; Fu, L.; Liu, Q.; Peng, Q.Z.; Kang, M.Y. Impacts of land use on surface water quality in a subtropical River Basin: A case study of the Dongjiang River Basin, Southeastern China. Water 2015, 8, 4427–4445. [Google Scholar] [CrossRef]
  25. Van Herpe, Y.; Troch, P.A. Spatial and temporal variations in surface water nitrate concentrations in a mixed land use catchment under humid temperate climatic conditions. Hydrol. Process. 2000, 14, 2439–2455. [Google Scholar] [CrossRef]
  26. Hu, H.J.; Wei, Y.X. The Freshwater Algae of China: Systematics, Taxonomy and Ecology; Science Press: Beijing, China, 2006. (In Chinese) [Google Scholar]
  27. Weng, J.Z.; Xu, H.X. Atlas of Common Freshwater Algae in China; Shanghai Scientific and Technical Publishers: Shanghai, China, 2010. (In Chinese) [Google Scholar]
  28. National Environmental Protection Bureau. Standard Methods for the Examination of Water and Wastewater (Version 4); China Environmental Science Publish Press: Beijing, China, 2002. [Google Scholar]
  29. Lampitt, R.S.; Wishner, K.F.; Turley, C.M.; Angel, M.V. Marine snow studies in the Northeast Atlantic Ocean: Distribution, composition and role as a food source for migrating plankton. Mar. Biol. 1993, 116, 689–702. [Google Scholar] [CrossRef]
  30. Wang, M.C.; Liu, X.Q.; Zhang, J.H. Evaluate method and classification standard on lake eutrophication. Environ. Monit. China 2002, 18, 47–49. (In Chinese) [Google Scholar]
  31. Liu, X.; Qian, K.; Chen, Y.; Gao, J. A comparison of factors influencing the summer phytoplankton biomass in China’s three largest freshwater lakes: Poyang, Dongting, and Taihu. Hydrobiologia 2017, 792, 283–302. [Google Scholar] [CrossRef]
  32. Pratt, B.; Chang, H. Effects of land cover, topography, and built structure on seasonal water quality at multiple spatial scales. J. Hazard. Mater. 2012, 209, 48–58. [Google Scholar] [CrossRef] [PubMed]
  33. Hively, W.D.; Hapeman, C.J.; McConnell, L.L.; Fisher, T.R.; Rice, C.P.; McCarty, G.W.; Sadeghi, A.M.; Whitall, D.R.; Downey, P.; Nino de Guzman, G.T.; et al. Relating nutrient and herbicide fate with landscape features and characteristics of 15 subwatersheds in the Choptank River watershed. Sci. Total Environ. 2011, 409, 3866–3878. [Google Scholar] [CrossRef] [PubMed]
  34. Braak, T.C.J.F.; Smilauer, P. Canoco Reference Manual and User’s Guide: Software for Ordination, Version 5.0; Microcomputer Power: Ithaca, NY, USA, 2012. [Google Scholar]
  35. Tilman, G.D. Plant dominance along an experimental nutrient gradient. Ecology 1984, 65, 1445–1453. [Google Scholar] [CrossRef]
  36. Varol, M.; Şen, B. Assessment of surface water quality using multivariate statistical techniques: A case study of Behrimaz Stream, Turkey. Environ. Monit. Assess. 2009, 159, 543–553. [Google Scholar] [CrossRef] [PubMed]
  37. Tilman, G.D.; Kilham, S.S. Phosphate and silicate growth and uptake kinetics of the diatoms Asterionella formosa and Cyclotella meneghiniana in batch and semicontinuous culture. J. Phycol. 1976, 12, 375–383. [Google Scholar] [CrossRef]
  38. Washington, H.G. Diversity, biotic and similarity indices: A review with special relevance to aquatic ecosystems. Water Res. 1984, 18, 653–694. [Google Scholar] [CrossRef]
  39. Dudgeon, D. Endangered ecosystems: A review of the conservation status of tropical Asian rivers. Hydrobiologia 1992, 3, 167–191. [Google Scholar] [CrossRef]
  40. Sandgren, C.D. Growth and Reproductive Strategies of Freshwater Phytoplankton; Cambridge University Press: Cambridge, UK, 1992. [Google Scholar]
  41. Negro, A.I.; Dehoyos, C.; Vega, J.C. Phytoplankton structure and dynamics in Lake Sanabria and Valpaiso Reservoir (NW Spain). Hydrobiologia 2000, 424, 25–37. [Google Scholar] [CrossRef]
  42. Reynolds, C.S.; Oliver, R.L.; Walsby, A.E. Cyanobacterial dominance: The role of buoyancy regulation in dynamic lake environments. N. Z. J. Mar. Freshw. Res. 1987, 21, 379–390. [Google Scholar] [CrossRef]
  43. Song, X.L.; Liu, Z.W.; Pan, H.K.; Yang, G.J.; Chen, Y.W. Phytoplankton community structure in Meiliang Bay and Lake Wuli of Lake Taihu. J. Lake Sci. 2007, 19, 643–651. (In Chinese) [Google Scholar]
  44. Jensen, J.P.; Jeppesenk, E.; Olrik, K.; Kristensen, P. Impact of nutrients and physical factors on the shift Cyanobacteria to in shallow Danish lakes. J. Fish. Aquat. Sci. 1994, 51, 1692–1699. [Google Scholar] [CrossRef]
  45. Shen, Y.F.; Zhang, Z.S.; Gong, J.X. New Technology of Micro Biological Monitoring; China Architecture & Building Press: Beijing, China, 1991. (In Chinese) [Google Scholar]
Figure 1. Map of the Dongjiang River Basin and its three tributaries, showing the location of the sampling sites.
Water 10 00152 g001
Figure 2. Cell abundance and phyla percentage of the phytoplankton community in three tributaries in the dry and rainy season. The cell abundance shown in the figure is the average of five samples. (a) lower cell abundance; (b) higher cell abundance.
Water 10 00152 g002
Figure 3. Multidimensional scaling (MDS) plots using Bray–Curtis distance and showing phytoplankton communities in the (a) dry and (b) rainy season. Points represent samples collected from the different tributaries and those closer together represent assemblages that are more similar.
Water 10 00152 g003
Figure 4. Plot results of canonical correspondence analysis: the dominant phytoplankton taxa and environmental factors in the (a) dry and (b) rainy season. The points represent the individual phytoplankton specie and the arrows represent each environmental variable pointing in the direction of its maximum change across the diagram during the study. The taxa are denoted with codes referring Table 2.
Water 10 00152 g004
Table 1. Environmental factors in the three tributaries in the dry and rainy season.
Environmental FactorsLi RiverQiuxiang RiverDanshui River
Dry SeasonRainy SeasonDry SeasonRainy SeasonDry SeasonRainy Season
pH7.11 ± 0.14 a7.20 ± 0.33 a7.26 ± 0.25 a7.26 ± 0.47 a6.88 ± 0.23 a7.20 ± 0.64 a
TEM (°C)15.27 ± 2.58 b29.70 ± 1.82 a18.08 ± 1.38 b30.26 ± 1.81 a20.54 ± 2.53 b31.40 ± 1.46 a
DO (mg·L−1)8.32 ± 0.98 a6.51 ± 0.31 b7.49 ± 0.99 a5.49 ± 0.45 b4.95 ± 0.82 a3.17 ± 0.66 a
EC (μg·cm−1)93.12 ± 21.08 a88.27 ± 16.03 a81.65 ± 20.50 a87.87 ± 33.48 a572.6 ± 133.65 a372.07 ± 46.65 b
CODMn (mg·L−1)2.13 ± 0.91 a2.22 ± 0.72 a3.45 ± 0.36 a3.01 ± 0.96 a4.54 ± 0.62 a4.38 ± 1.18 a
TP (mg·L−1)0.08 ± 0.04 a0.12 ± 0.02 a0.11 ± 0.06 a0.11 ± 0.08 a0.65 ± 0.03 a0.33 ± 0.10 a
TN (mg·L−1)3.01 ± 1.13 a1.28 ± 0.88 a1.24 ± 0.67 a1.84 ± 0.18 a10.41 ± 1.18 a8.46 ± 1.68 b
NH3-N (mg·L−1)0.65 ± 0.47 a0.75 ± 0.66 a0.38 ± 0.19 a0.27 ± 0.10 a5.00 ± 1.95 a3.68 ± 1.53 a
NO3-N (mg·L−1)1.95 ± 0.41 a0.64 ± 0.16 a0.70 ± 0.39 a1.06 ± 0.12 a5.11 ± 1.55 a3.80 ± 1.38 a
SD (m)0.37 ± 0.26 a0.31 ± 0.25 a0.30 ± 0.22 a 0.44 ± 0.28 a0.37 ± 0.33 a0.32 ± 0.12 a
Note: a and b represent the variation between seasons.
Table 2. The trophic level index and trophic level of the three tributaries.
Li RiverQiuxiang RiverDanshui River
Dry Season (TLI)44.99 ± 3.75 c53.83 ± 1.61 b66.72 ± 2.43 a
Rainy Season (TLI)46.68 ± 2.30 c53.73 ± 1.87 b64.54 ± 1.98 a
Trophic LevelMesotrophicLightly eutrophicModerately eutrophic
Note: a, b and c represent the variation among tributaries.
Table 3. The dominant phytoplankton taxa in the three tributaries in the dry and rainy season.
RenumberDominant TaxaLi River (Dry)Li River (Rainy)Qiuxiang River (Dry)Qiuxiang River (Rainy)Danshui River (Dry)Danshui River (Rainy)
BA1Melosira varians0.0740.0720.026
BA2Aulacoseira granulata0.039
BA3Nitzschia spp.0.0650.0330.0490.1010.057
BA4Cyclotella sp.0.021
BA5Gomphonema spp.0.0300.031
BA6Navicula spp.0.0380.0870.1140.0810.053
BA7Synedra amphicephala0.044
CH1Scenedesmus quadricanda0.0250.0240.0880.0360.076
CH2Scenedesmus dimorphus0.0260.063
CH3Crucigenia quadrata0.0580.064
CY1Dolichospermum sp.0.083
CY2Merismopedia sp.0.0780.199
CY3Oscillatoriales sp.0.0600.048
CR1Cryptomonas ovata0.097
Note: “BA”, Bacillariophyta; “CH”, Chrysophyta; “CY”, Cyanophyta; “CR”, Cryptophyta; The numbers shown in the table are dominance index; “—“, not dominant.
Table 4. Results of the similarities analysis global and pair-wise comparisons among the three tributaries.
Among TributariesDry SeasonRainy Season
R StatisticpR Statisticp
(Global R = 0.202, p = 0.001)(Global R = 0.478, p = 0.001)
Li River vs. Qiuxiang River0.0190.3020.2630.001
Li River vs. Danshui River0.3920.0010.7490.001
Qiuxiang River vs. Danshui River0.2080.0010.3920.001
Table 5. CCA results showing the explained variance (%) of the dominant phytoplankton taxa by canonical axes
AxesDry SeasonRainy Season
Explained Variation (%)pseudo-Fp ValueExplained Variation (%)pseudo-Fp Value
First axis23.654.00.008 **25.429.20.002 **
Second axis8.351.60.9349.383.90.208
All axes51.21.40.040 *46.02.30.002 **
Notes: The pseudo-F and p values were derived from Monte Carlo permutation tests. * p < 0.05; ** p < 0.01.

