Effect of Saturated Zone on Nitrogen Removal Processes in Stormwater Bioretention Systems


1
Key Laboratory for Urban Habitat Environmental Science and Technology, School of Environment and Energy, Peking University Shenzhen Graduate School, Shenzhen 518055, China
2
Department of Civil and Environmental Engineering, School of Engineering and Applied Science, University of Virginia, Charlottesville, VA 22904, USA
*
Author to whom correspondence should be addressed.
Water 2018, 10(2), 162; https://doi.org/10.3390/w10020162
Submission received: 9 December 2017
/
Revised: 23 January 2018
/
Accepted: 2 February 2018
/
Published: 7 February 2018
(This article belongs to the Special Issue Sponge Cities: Emerging Approaches, Challenges and Opportunities)
Abstract
:The introduction of a saturated zone (SZ) has been recommended to address the issue of nitrogen removal fluctuation in the bioretention system, which is one of the most versatile low-impact development facilities for urban stormwater management. Nine experimental columns were used to characterize the nitrogen concentration variations over the outflow during wetting periods and in SZ during the antecedent drying periods (ADPs), as well as compare removal efficiencies of various nitrogen species in systems with different SZ depths under alternate drying and wetting conditions. Results indicated that NO3−-N concentrations in the outflow showed quasi-logistic curve-shaped variations over time: being low (<0.5 mg/L) in the early process, sharply increasing thereafter, and finally flattening around 3.0 mg/L with NO3− leaching; NH4+-N and organic nitrogen (ON) concentrations were consistently low around 0.5 mg/L and 1.8 mg/L, respectively during the wetting periods. NH4+ removal efficiency in bioretention systems was consistently high around 80%, not varying with the increasing SZ depth; ON removal efficiency had a slight rise from 57% to 84% and NO3− removal efficiency was significantly enhanced from −23% to 62% with the SZ depth increasing from 0 to 600 mm. Deeper SZ could store more runoff and promote more denitrification of NO3− and mineralization of ON during the ADPs, providing more “old” water with low NO3− and ON concentrations for water exchange with “new” inflow of higher NO3− and ON concentrations during the wetting periods. The total nitrogen (TN) removal, a combined result of the instantaneous removal through adsorption and retention in the upper soil layer during the wetting periods and the gradual removal via denitrification and mineralization in SZ during the ADPs, was also improved by increasing the SZ depth; TN removal efficiency was elevated from 35% to 73% when the SZ depth increased from zero to 600 mm.
1. Introduction
With the rapid development of urbanization, nitrogen pollution in storm runoff has aroused widespread public concerns [1]. It is well known that excessive nitrogen, some from urban or agricultural runoff, is one of the main contaminants contributing to eutrophication in many water bodies [1,2,3,4]. Managing stormwater runoff has therefore become an important task in water quality protection. In recent years, low-impact development (LID) has been proposed as an ecologically and economically sustainable approach to stormwater management around the world [5]. Bioretention (also referred to as rain garden or biofiltration), consisting essentially of vegetation, mulch, soil media, sand layer and gravel sump, is a widespread LID technology that has proved to be effective in removing phosphorus, suspended solids, chemical oxygen demand and heavy metals [6,7,8,9,10,11,12]. However, previous research indicated that the removal efficiencies of nitrogenous pollutants varied dramatically in bioretention systems [13,14,15,16]. While ammonium (NH4+) and organic nitrogen (ON) removal were normally effective due to the retention and adsorption processes in media layer of bioretention systems, total nitrogen (TN) removal fluctuated because of nitrate (NO3−) leaching in bioretention systems [6,14,17,18].
In recent times, the introduction of a saturated zone (SZ) into bioretention systems has been widely recommended to promote nitrogen removal and address the issue of nitrate removal fluctuation [10,19,20,21,22,23]. This is because SZs can create an anaerobic environment to promote permanent NO3− removal via denitrification. Despite the growing interests in bioretention systems with SZs, reported nitrogen removal efficiencies were still not consistent in different studies. For example, some researchers found SZ combined with carbon source could remove NO3− from roof runoff by up to 67% [24], others reported that SZ could effectively remove more than 90% of NO3− from stormwater runoff [25,26]. However, a few studies revealed that nitrogen removal was even less than 20% and NO3− leaching even occurred occasionally in bioretention systems with SZ design [13,18,27]. Therefore, in view of the controversy over the effectiveness of SZs, there is a need to understand the nitrogen removal processes that in essence account for the variabilities of various nitrogen removal efficiencies in different bioretention systems with SZs.
Given that depth is one of the most critical parameters for SZ design, various nitrogen removal efficiencies of bioretention systems with SZ depths of 0, 150, 450, 600 mm were compared by Zinger et al [19]. Their results showed that NO3− and TN removal efficiencies increased with the increase of the SZ depth and were up to 99% in systems with 450 and 600 mm deep SZs. However, they mainly focused on the nitrogen removal efficiencies during storm events (wetting periods) and did not investigate the removal processes under alternate drying and wetting conditions that could help probe into the influence mechanism of SZ on nitrogen removal.
This study is a further in-depth investigation of the effect of saturated zone on the nitrogen removal with the objectives to depict the major nitrogen removal processes in bioretention systems and provide implications into SZ design for bioretention systems under alternate drying and wetting conditions. In detail, we have characterized the nitrogen concentration variations over the outflow course during the wetting periods and in SZ during the antecedent drying periods (ADPs); the removal performance of NH4+, ON, NO3− and TN between systems with different SZ depths were also compared; finally, different removal pathways for different nitrogen species were proposed in bioretention systems with SZs.
2. Methods
2.1. Experimental Set-up
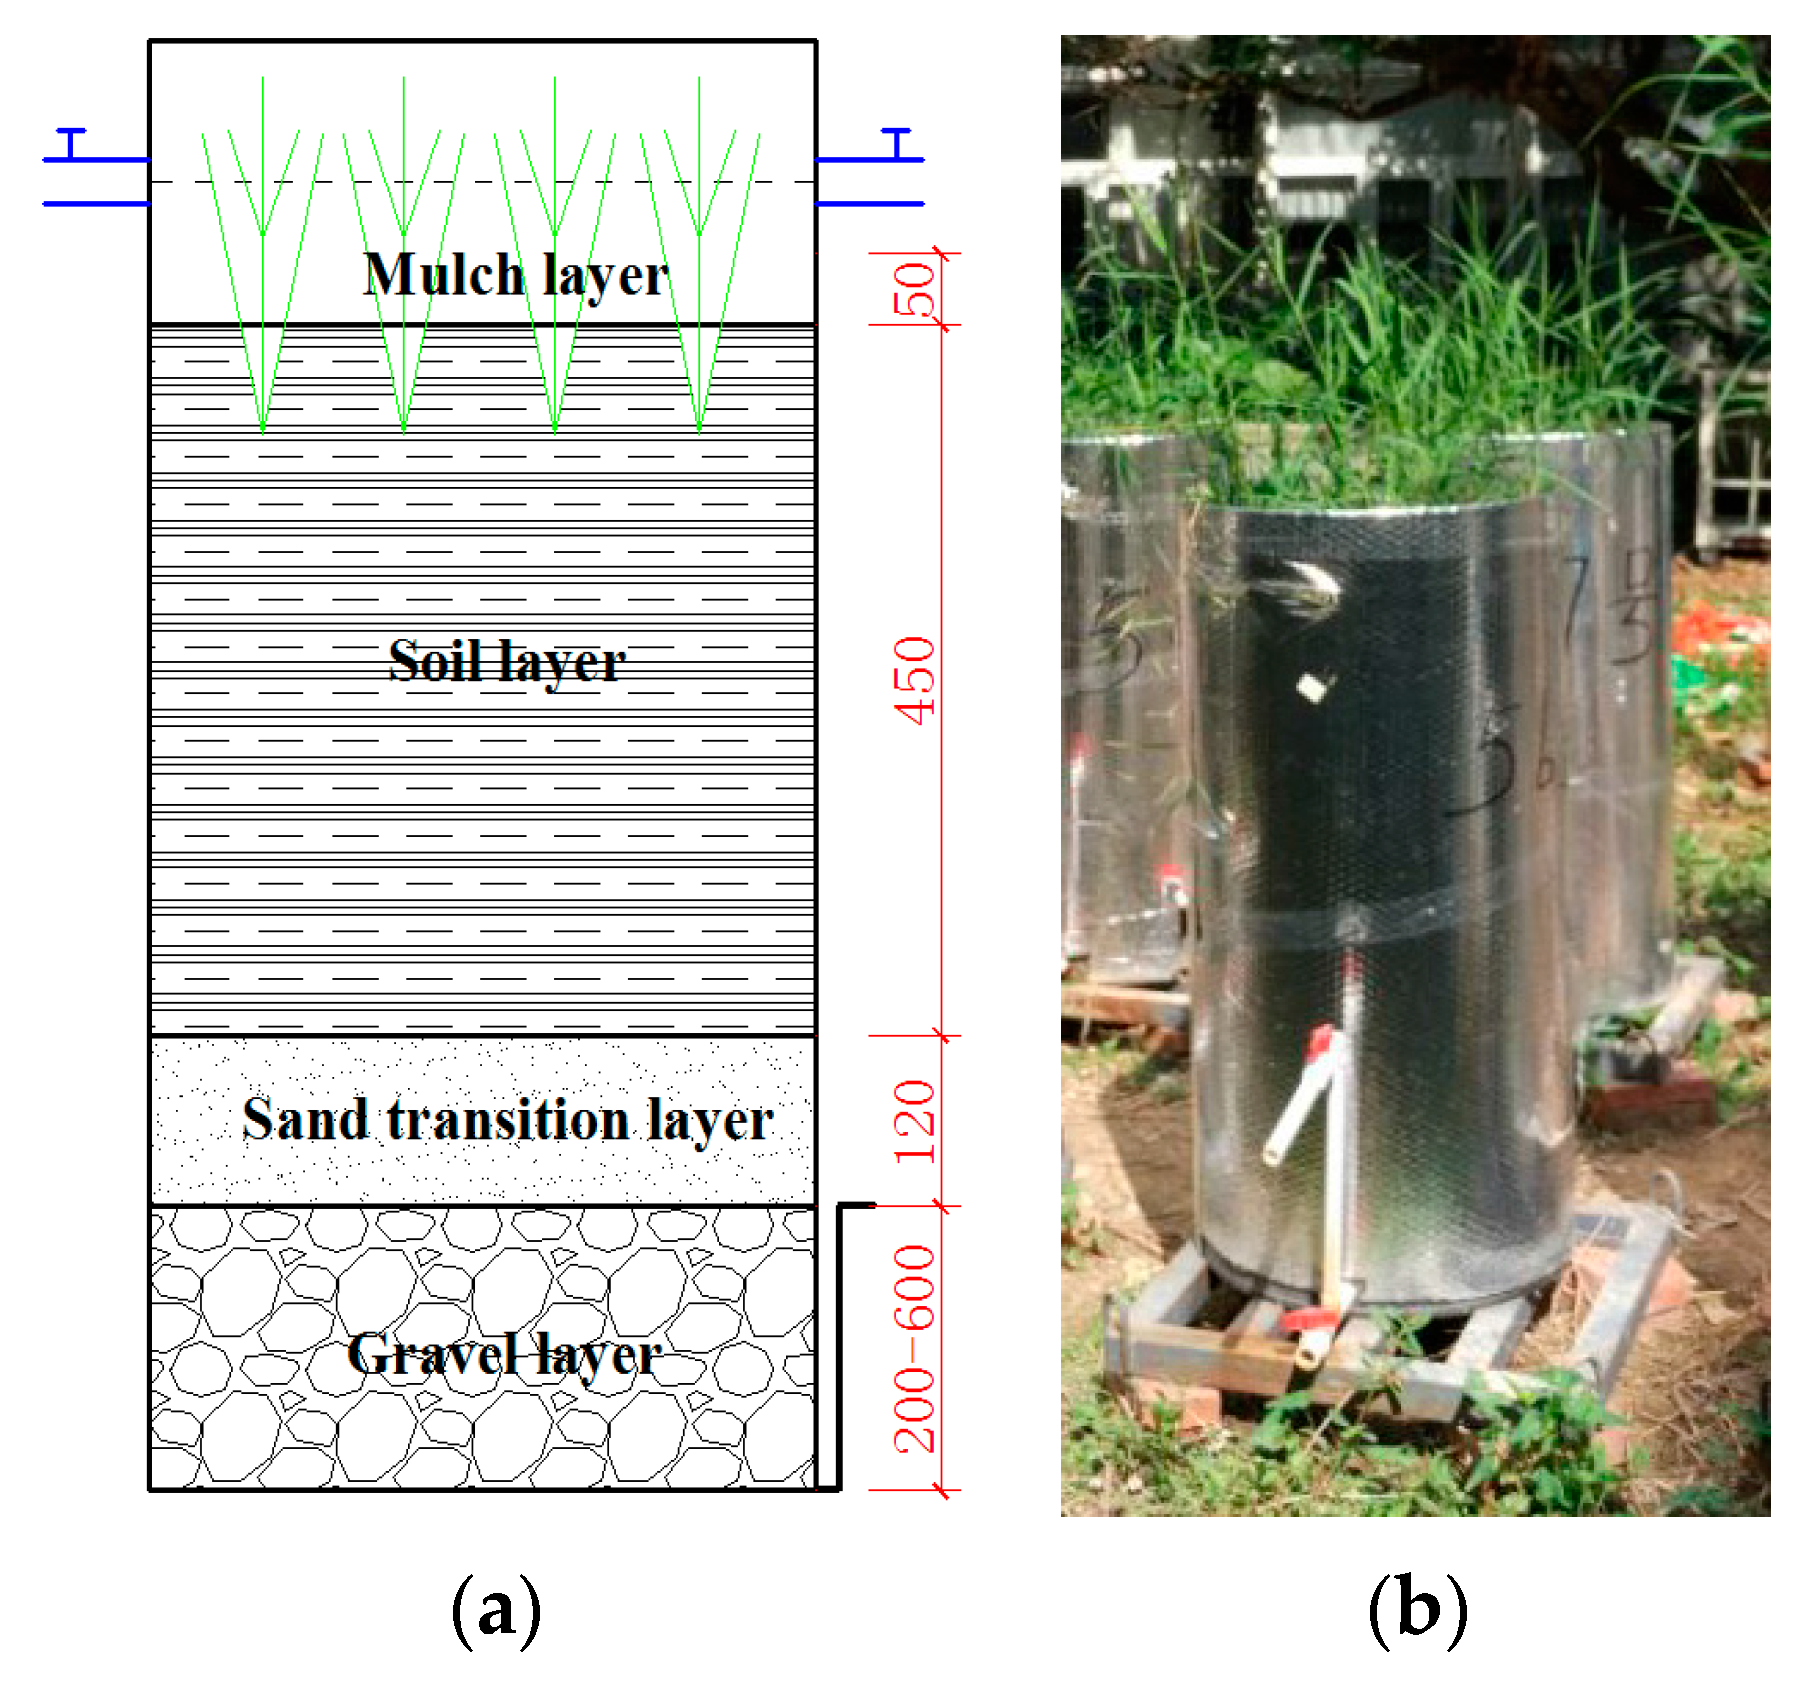
Nine bioretention columns were built at the campus of Peking University Shenzhen Graduate School (PKUSZ), China in 2016. Each of them consisted of five layers from top to bottom: experimental vegetation, mulch layer, mixed soil media, sand bed, and gravel sump, which were all placed in the Polymeric Methyl Methacrylate (PMMA, with good rigidity and durability) cylinder containers (Figure 1a and Table 1). The first set of bioretention systems included three mesocosm bioretention columns 500 mm in diameter (two with 300 mm SZ and one without SZ). The second set included six columns 250 mm in diameter (referred to as “small-scale bioretention systems” thereinafter) with 0–600 mm SZ (Table 1 and Figure 1). Bulrushes (Phragmites australis, forty per mesocosm column, ten in each smaller one) were planted as experimental vegetation in the clear top section of each column, while the next four layers were wrapped up in tinfoil to be isolated from outside heat (Figure 1b). The first 50 mm deep mulch layer was comprised of wood chips (from local pine trees), and the next 450 mm deep mixed soil layer was composed of 50% (by weight) sandy loam soil from the campus of PKUSZ, 40% sand (d50 of approximately 0.5 mm in size), 10% peat moss (Pindstrup Sphagnum). An additional amount of lime (calcium carbonate) was added into this mixed soil layer to achieve a pH of 6.5–7.5 as recommended by several construction manuals [28,29,30]. Below it, the 120-mm deep transition layer was composed of river sand (d50 of 1–2 mm in size). At the bottom, 300 mm high gravel sump combined with carbon source (newspaper, 5% by volume) was installed in the three mesocosm bioretention columns. In six small-scale columns, embedded elbow pipes (diameter 25 mm) at the draining ports were raised to the heights of 0, 200–600 mm to create anaerobic saturated conditions in the gravel sumps.
The experimental bulrushes were carefully cultivated from root to seedlings under controlled laboratory conditions for two months from December 2015 to February 2016. Then all bioretention columns were placed into a transparent canopy, which ensured enough natural sunlight but avoided rainfall entering the columns.
Based on typical subtropical coastal climate conditions in Shenzhen, a twice-weekly dosing scheme with synthetic runoff (intensity: ~20 mm/h, duration: one hour) was adopted. Each bioretention system was sized at 5% of the catchment area. This dosing method was similar to that used in previous studies [18,28,31]. Synthetic runoff in this study was prepared to mimic local highly polluted runoff characteristics of chemical oxygen demand (COD), organic nitrogen (ON), ammonium-nitrogen (NH4+-N), nitrate-nitrogen (NO3−-N) and pH 6.5–7.5 (Table 2), according to Huang et al [32]. Each column was watered with experimental synthetic runoff (Table 2) to allow plant growth for four weeks until March 2016 to achieve stability.
2.2. Experimental Procedure
2.2.1. Mesocosm Bioretention Systems
The three mesocosm bioretention systems were dosed with 70 L synthetic runoff for one hour at three-day intervals for five storm events (also called five wetting periods) during March to April, 2016 (at 23 °C~30 °C). The outflow was monitored over the 1-h wetting period with nine sub-samples taken after draining about 0, 1%, 10%, 16.7%, 33.3%, 50%, 66.7%, 83.3% and 100% of integrated outflow volume. In addition, the entire outflow was thoroughly mixed to form one final composite sample for each column.
After one wetting period, the stored water in SZ was monitored every hour within the first ten-hour drying period and then every 12 h in the remaining ADPs. Various nitrogen removal efficiencies of NH4+, NO3−, ON and TN between systems with and without SZs were compared. DO in SZ was also detected by sensor online monitor meter (NUL-205, Neuron Logger Sensors, USA) every two hours during the ADPs.
2.2.2. Small-Scale Bioretention Systems
The six small-scale systems with 0–600 mm deep SZ were dosed with 20 L per hour at three-day intervals during April to May, 2016 (at 25 °C~31 °C), and five wetting periods were monitored as well. The outflow was monitored over the 1-h wetting period with five sub-samples taken after draining about 0, 25%, 50%, 75% and 100% of integrated outflow volume. In addition, the entire outflow was mixed thoroughly to form one final composite sample for each column.
2.3. Sample Analysis
The inflow volume and flow rate were controlled by the metering pump to maintain consistence during the wetting periods. According to Standard Methods for the Examination of Water and Wastewater (2012), after collection, the samples were immediately filtered through 0.22-μm membrane filter and then kept frozen at −20 °C to prevent microbial activities before further analysis. NH4+, NO3− and NO2− concentrations were measured using the CleverChem 200+ automatic discontinuous analyzer based on the monitoring methods of Nessler’s reagent spectrophotometry, the Hydrazine Sulfate-NEDD spectrophotometry, sulfanilamide and N-(1-naphthalene) ethylenediamine hydrochloride spectrophotometry, respectively. TN was completely converted to NO3− by the alkaline potassium persulfate digestion method for measurements, while ON was determined by the formula: ON = TN − NO3− − NO2− − NH4+. In addition, the pH of each sample was monitored by laboratory pH meter (IE438, Mettler, Greifensee, Switzerland).
In this study, the event mean concentration (EMC) removal method, recommended by the American Society of Civil Engineers and the Environmental Protection Agency (ASCE-EPA) [33], was used to calculate the removal efficiency:
where EMCi and EMC0 were the EMCs of various nitrogen species (NH4+, ON, NO3− and TN) in the inflow and outflow during the wetting period, respectively.
All figures, including scatter plots and the box-and-whisker plots, were made using OriginPro 2015 (OriginLab Corp., Northampton, MA, USA). Statistical significant difference analyses were performed by the statistical software package PASW Statistics 19.0 (SPSS Inc., Chicago, IL, USA). Two-way ANOVA was used to test the significant difference in the removal efficiencies of various nitrogen species between systems with different SZs, the existence of SZ (i.e., with SZ and without SZ) was selected as the fixed factor and the nitrogen removal efficiencies as the dependents. The p < 0.05 was accepted as the threshold of significance.
3. Results
The retention rate about 12% was nearly the same between replicate systems: In the three mesocosm bioretention systems, when the inflow of each event was exactly 70 L in volume, the outflow volume was consistently similar around 61.7 L; In the six small-scale bioretention systems, when the inflow of each event was exactly 20 L in volume, the outflow volume of each column ranged from 17.5 to 17.7 L. The pH of each sample was stable at 7.0 ± 0.5. NO2− concentrations in all samples were below detection limit (<0.1 mg/L−1), and this study would focus on the removal efficiencies and time-based concentrations of NH4+, NO3−, ON and TN.
3.1. Variations in Nitrogen Concentrations over the Outflow Process
Variations in the average NH4+, NO3−, ON and TN concentrations (for five wetting periods) over the outflow course in the mesocosm bioretention columns in the presence and absence of SZ were presented in Figure 2. NO3− concentrations varied over time: being low in the early outflow process, rapidly increasing thereafter, and finally flattening, displaying quasi-logistic curve-shaped variations. NO3− leaching with the ultimate concentrations exceeding the inflow NO3− concentration of 2.5 mg/L often occurred in the final outflow process during wetting periods. Meanwhile, in the absence of SZ, NO3− leaching began earlier over the outflow course. Instead, during each wetting period, NH4+ and ON concentrations were consistently low, around 0.5 mg/L and 1.8 mg/L, respectively in bioretention systems with or without the SZ. TN concentrations showed the similar characteristic variations of NO3− over the whole outflow process (Figure 2).
3.2. Variations in Nitrogen Concentrations in SZ during Drying Periods
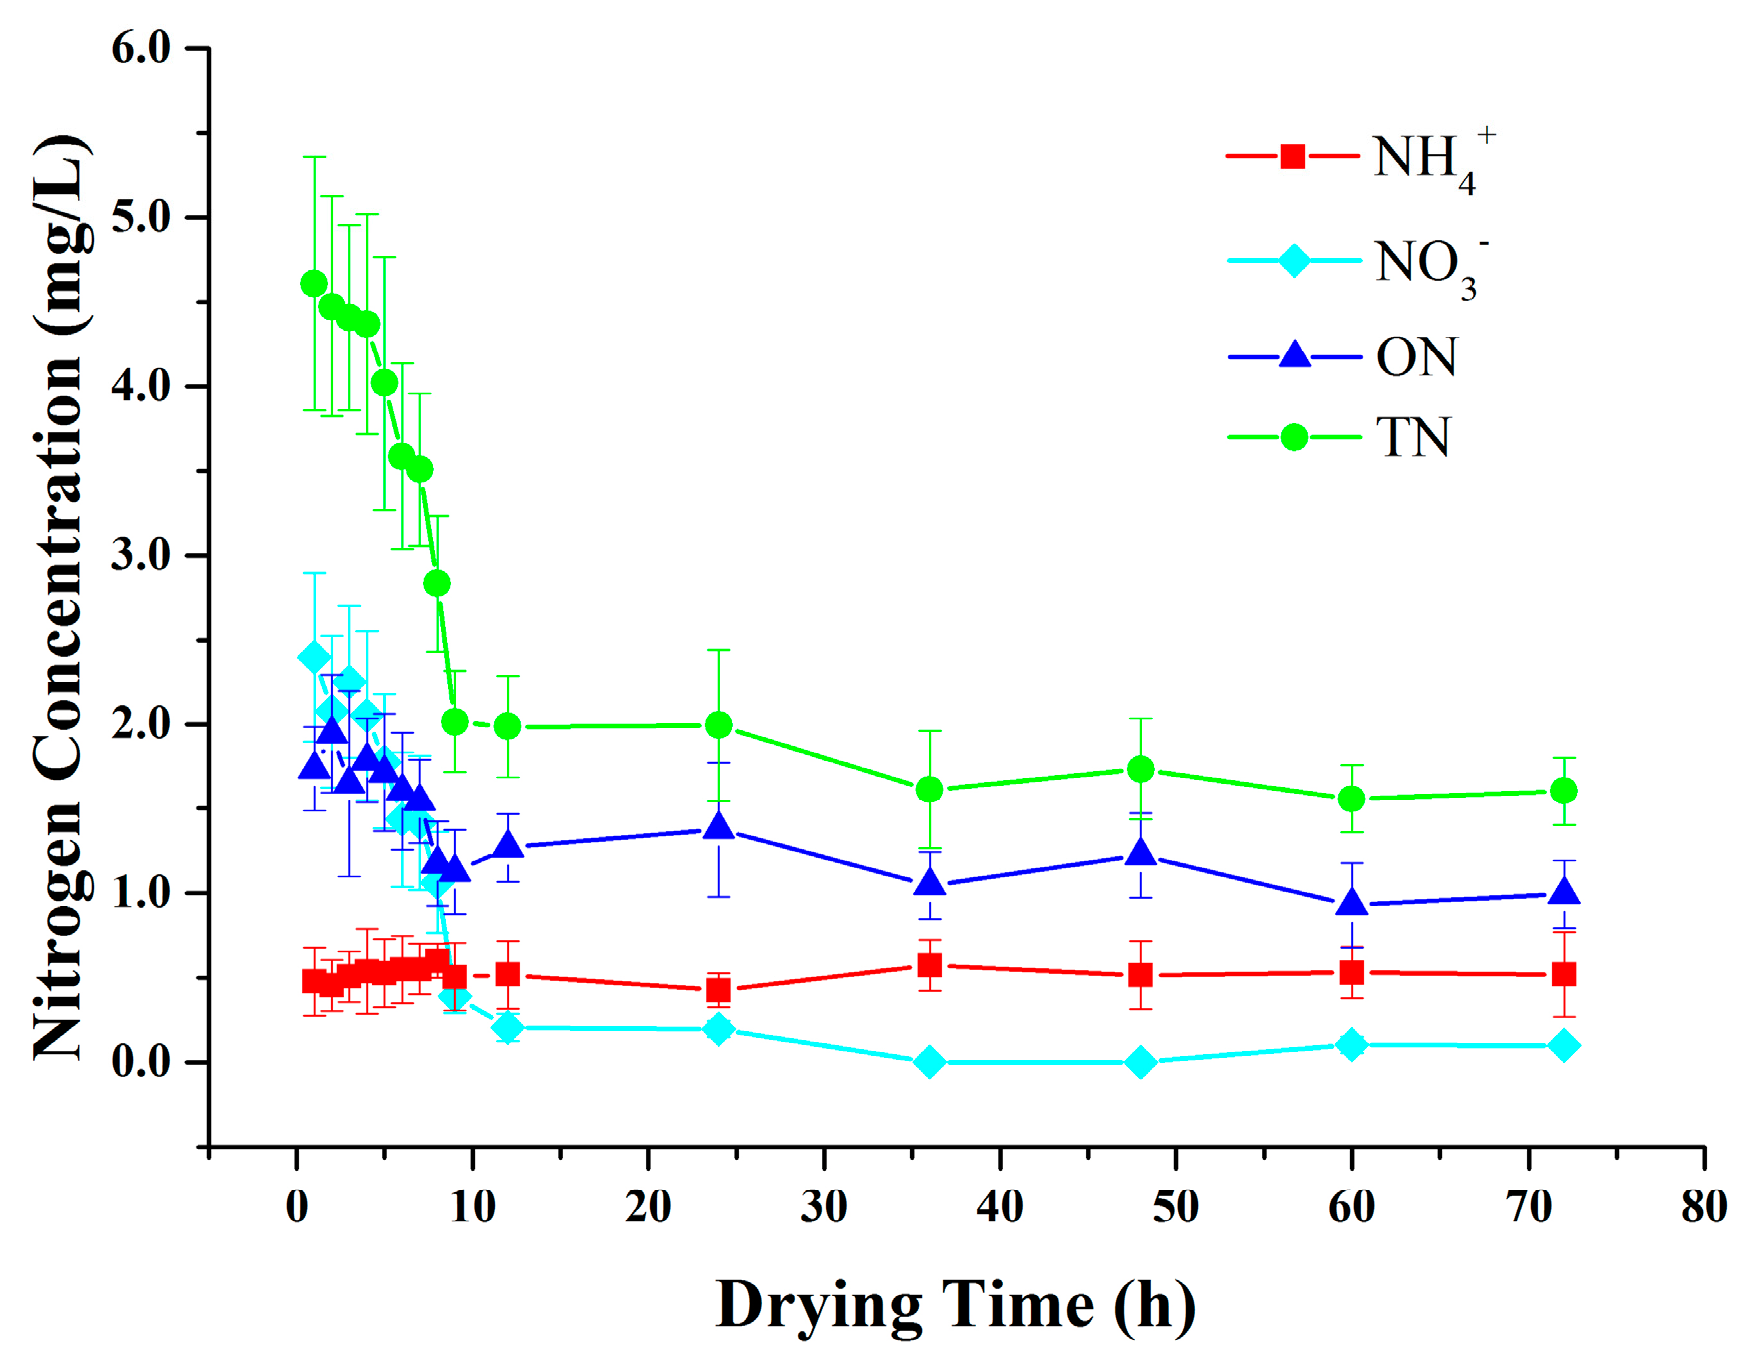
During the 3-day antecedent drying periods (ADPs), DO was consistently low, generally less than 0.5 mg/L in SZ. Variations in the average NH4+, NO3−, ON and TN concentrations in SZ during ADPs were displayed in Figure 3. Significant removal was observed in SZ with NO3− concentrations decreasing from around the inflow concentration of 2.5 mg/L to almost zero within 12 h, while ON removal also mainly occurred within 12 h but the final ON concentrations were around 1.0 mg/L. NH4+ concentrations were relatively consistent in SZ without change. TN concentrations revealed similar removal patterns of NO3− during the ADPs (Figure 3).
3.3. Effect of the Presence of SZ on Nitrogen Removal
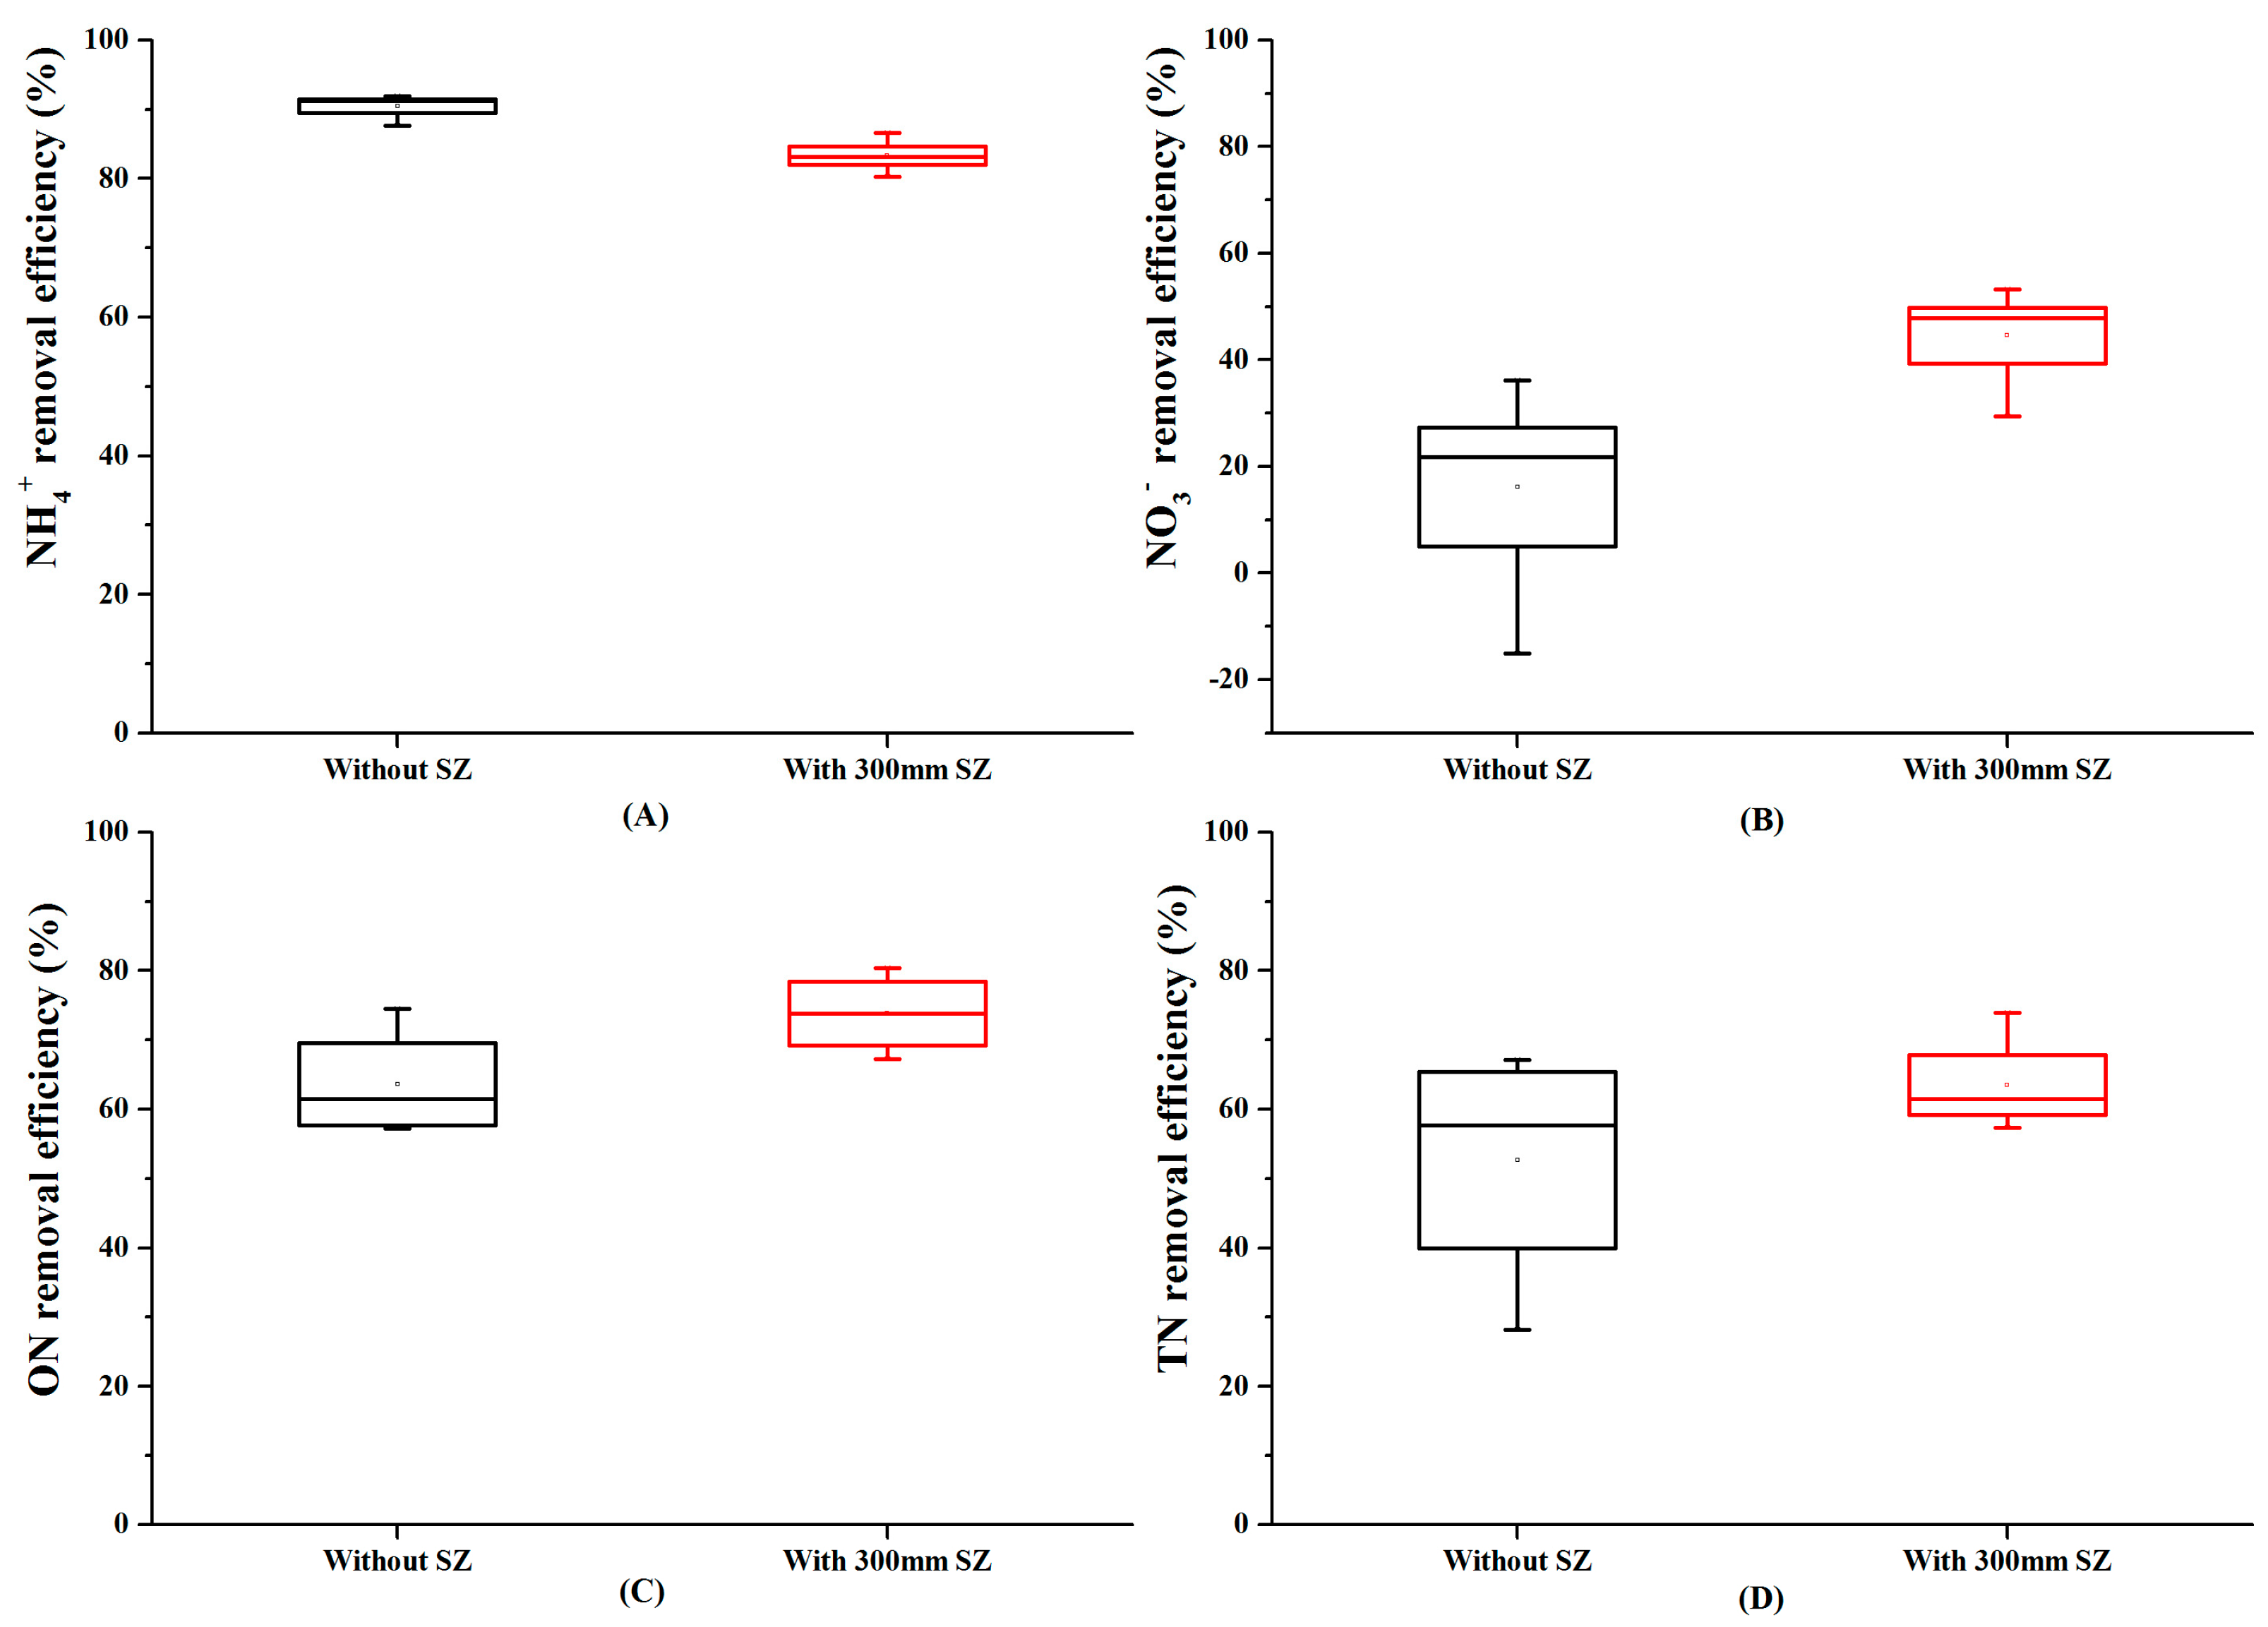
Nitrogen removal efficiencies in bioretention systems with and without SZs were presented in Figure 4. The deviations from averages of various nitrogen species removal efficiencies in bioretention with 300 mm SZ were obviously less than the bioretention without SZ. The ANOVA analysis revealed that there were significant differences in the nitrogen removal efficiencies between the systems with and without the SZ (p < 0.01 for NH4+, p < 0.05 for NO3−, p < 0.05 for ON). In the presence of SZ in bioretention systems, NO3− removal was significantly promoted, ON removal was slightly enhanced, while NH4+ removal efficiency was somewhat lowered. TN removal efficiency reflected the combination of NH4+, NO3− and ON.
3.4. Effect of SZ Depths on Nitrogen Removal
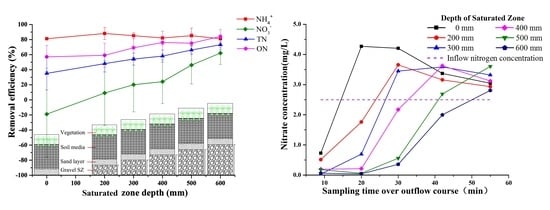
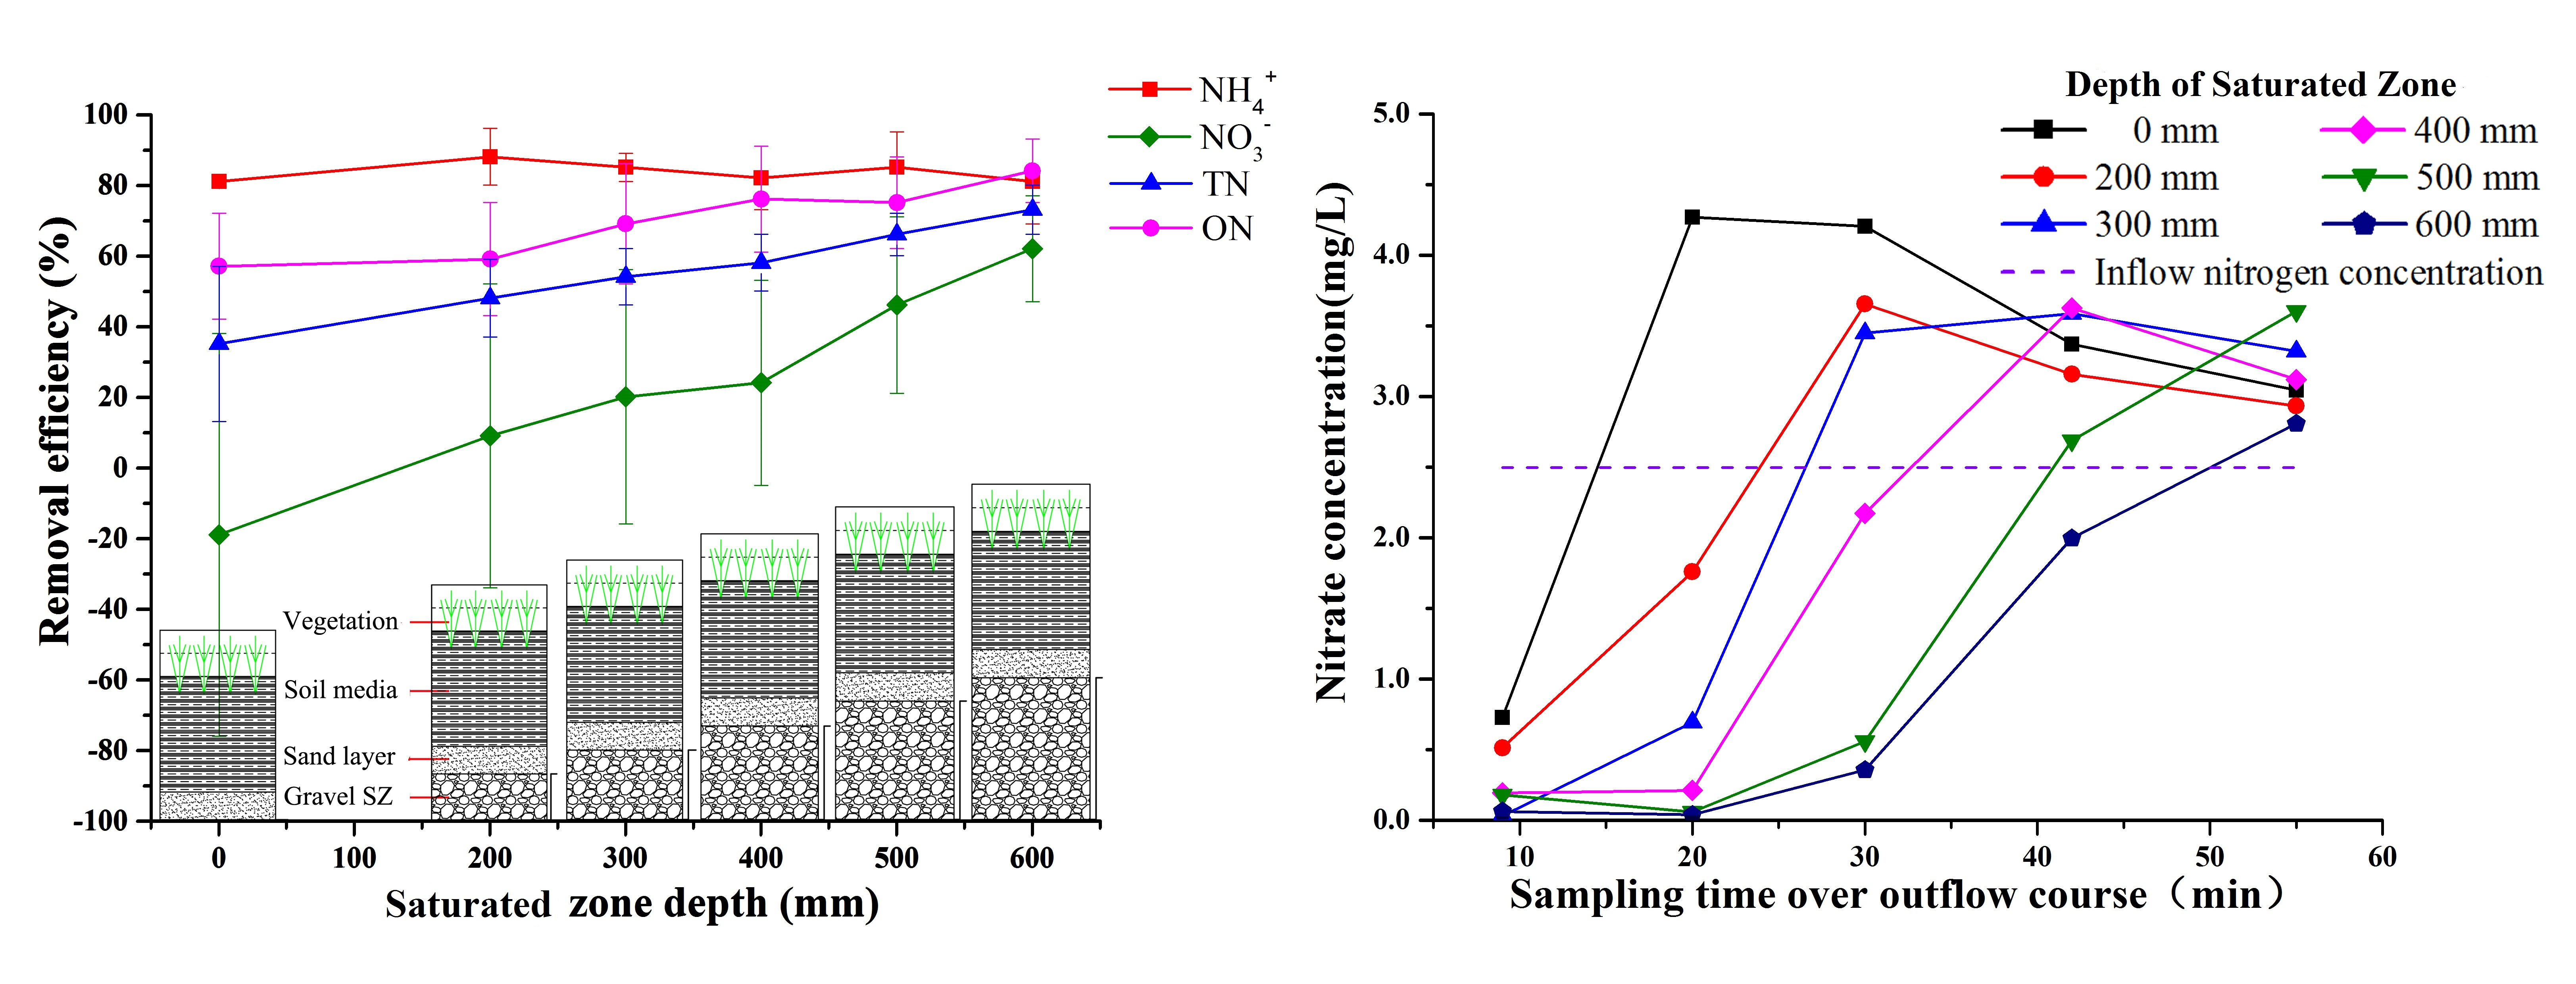
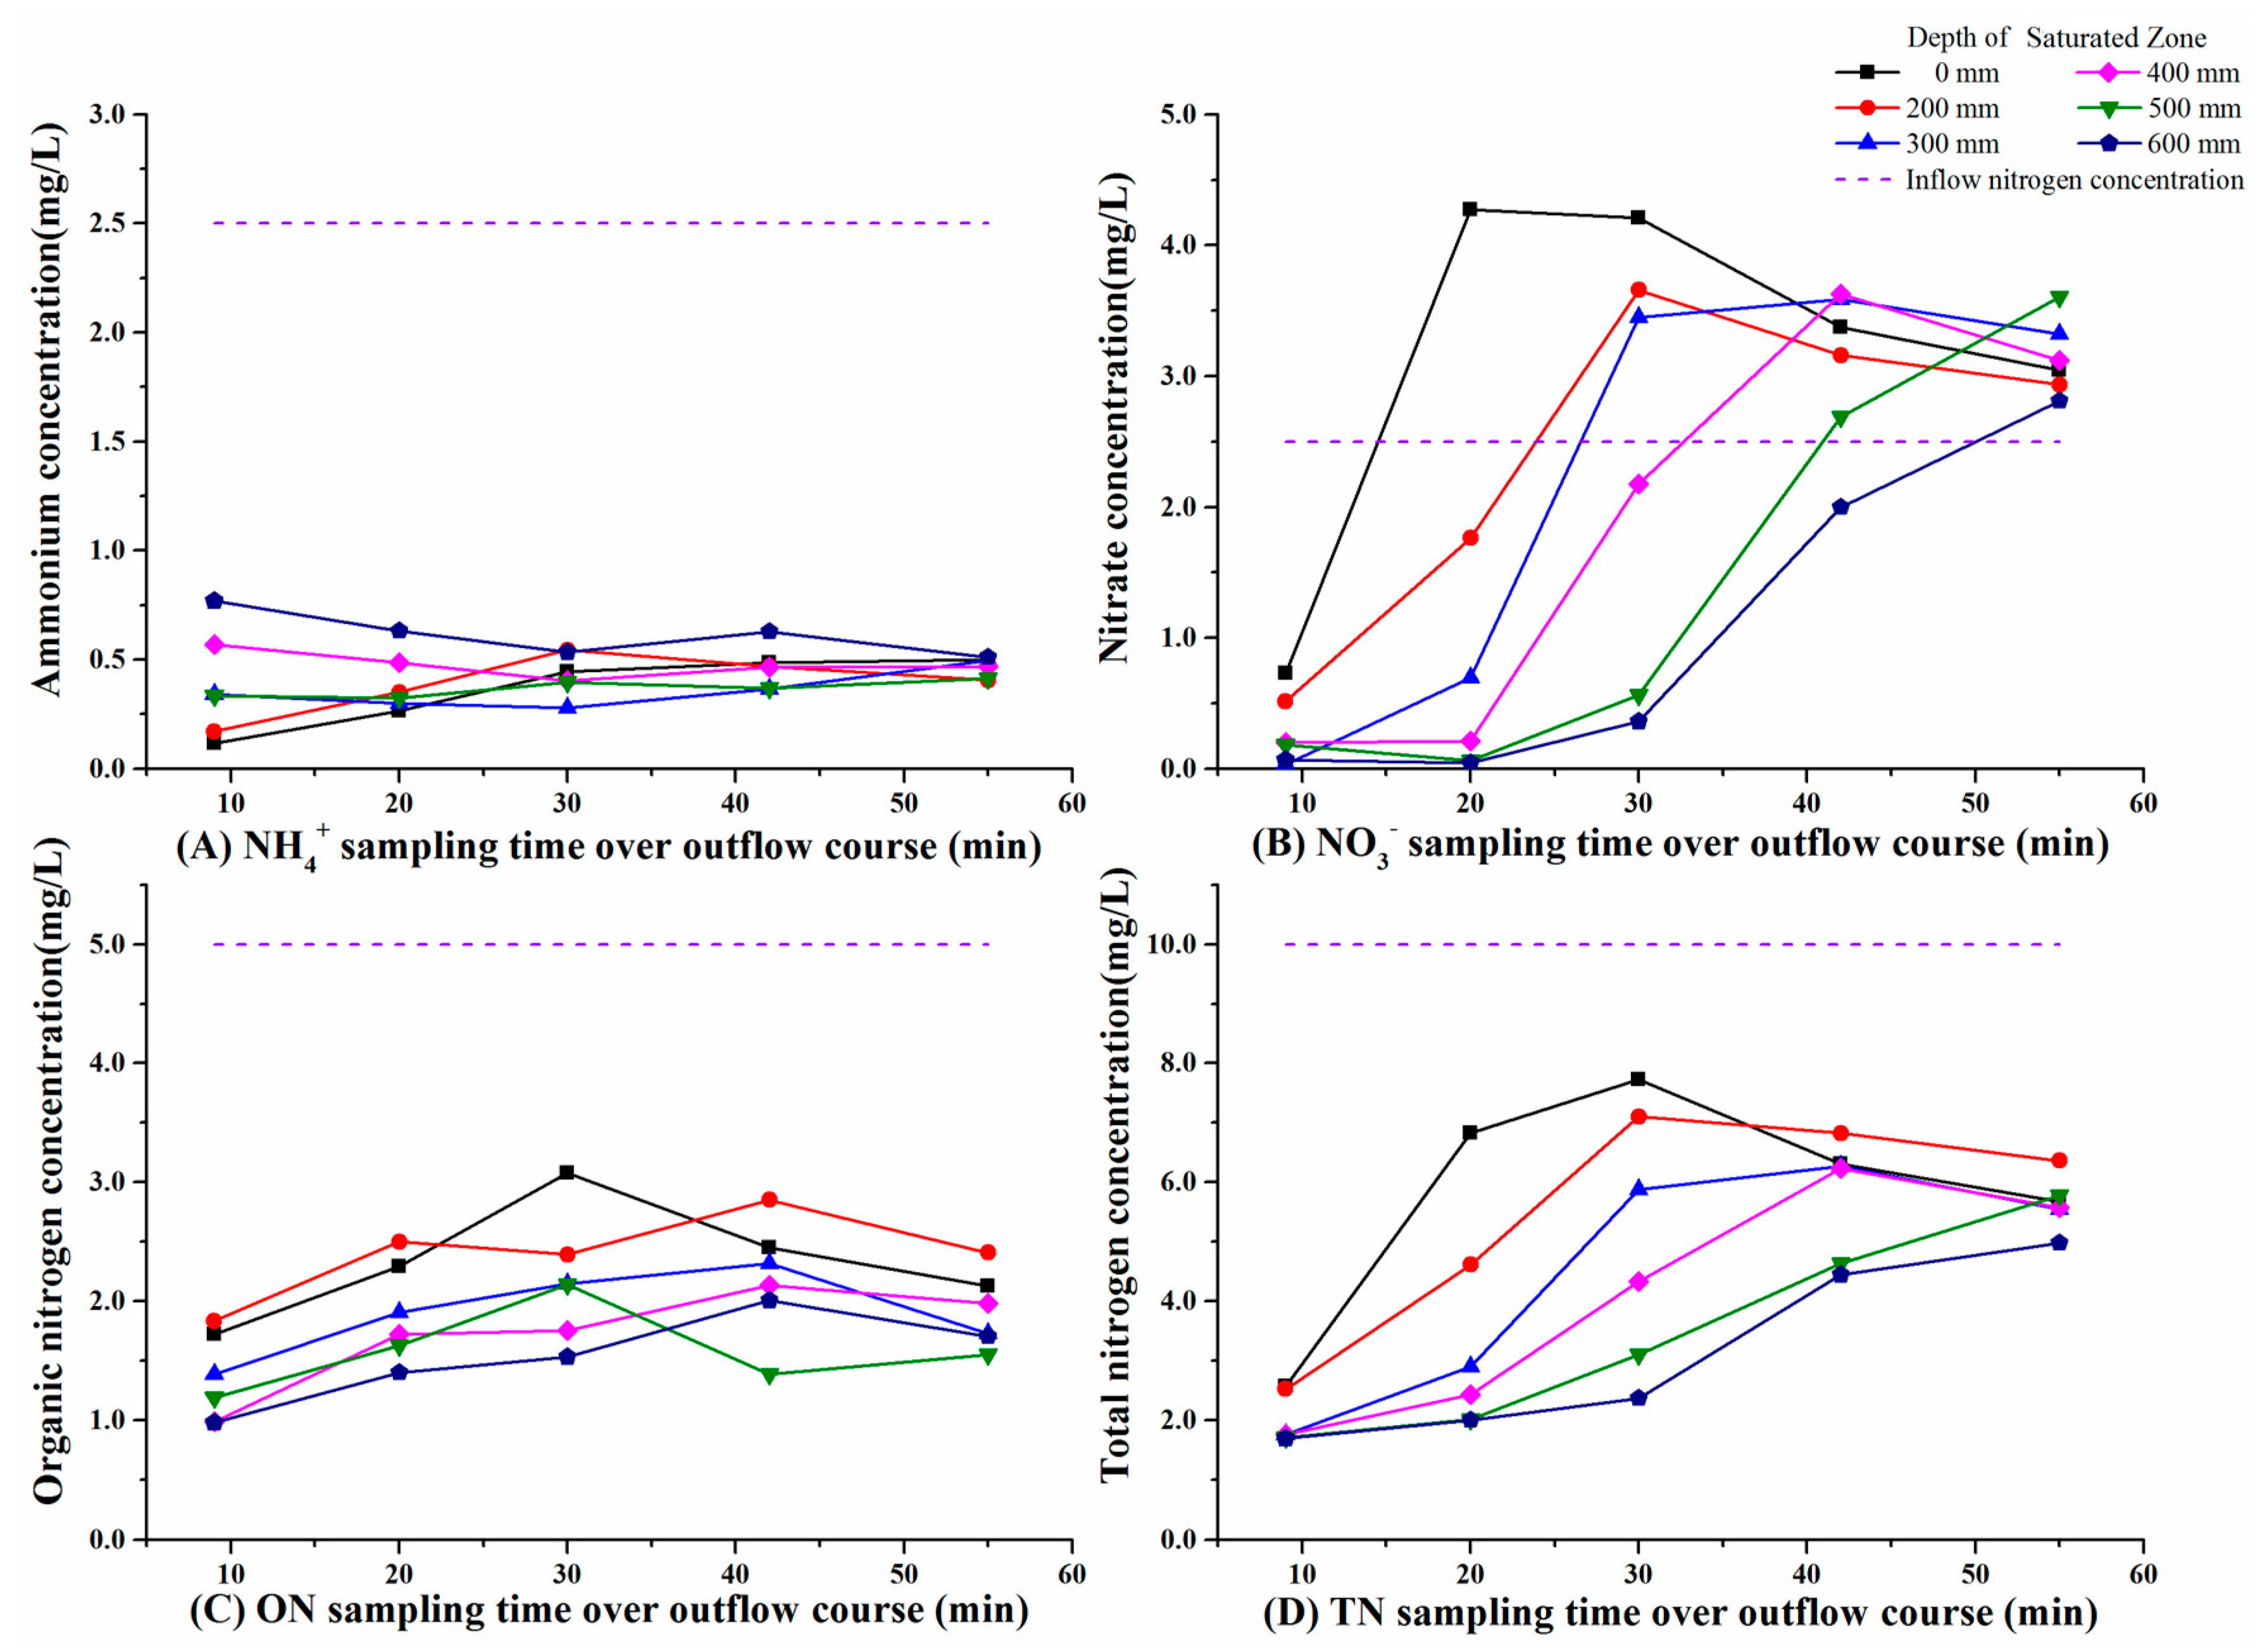
In six small-scale bioretention columns with different SZ depths, the average NO3− concentrations for five wetting periods showed similar quasi-logistic curve-shaped variations over time (Figure 4 and Figure 5). Likewise, NO3− leaching occurred in the latter outflow process without regard to the SZ depth. Furthermore, in bioretention systems with deeper SZ, the early outflow process with low NO3− concentrations was extended and NO3− leaching was delayed to occur in the final outflow process with lower peak concentrations (Figure 5B). Instead, with the increase of SZ depth, NH4+ and ON concentrations did not significantly fluctuate over the outflow course and remained consistent between systems with different SZ depths (Figure 5A,C). TN concentrations showed quasi-logistic curve-shaped variations over the whole outflow process. With the increase of SZ depth, the outflow process with low nitrogen concentrations was extended and the peak of nitrogen concentrations was lowered (Figure 5D).
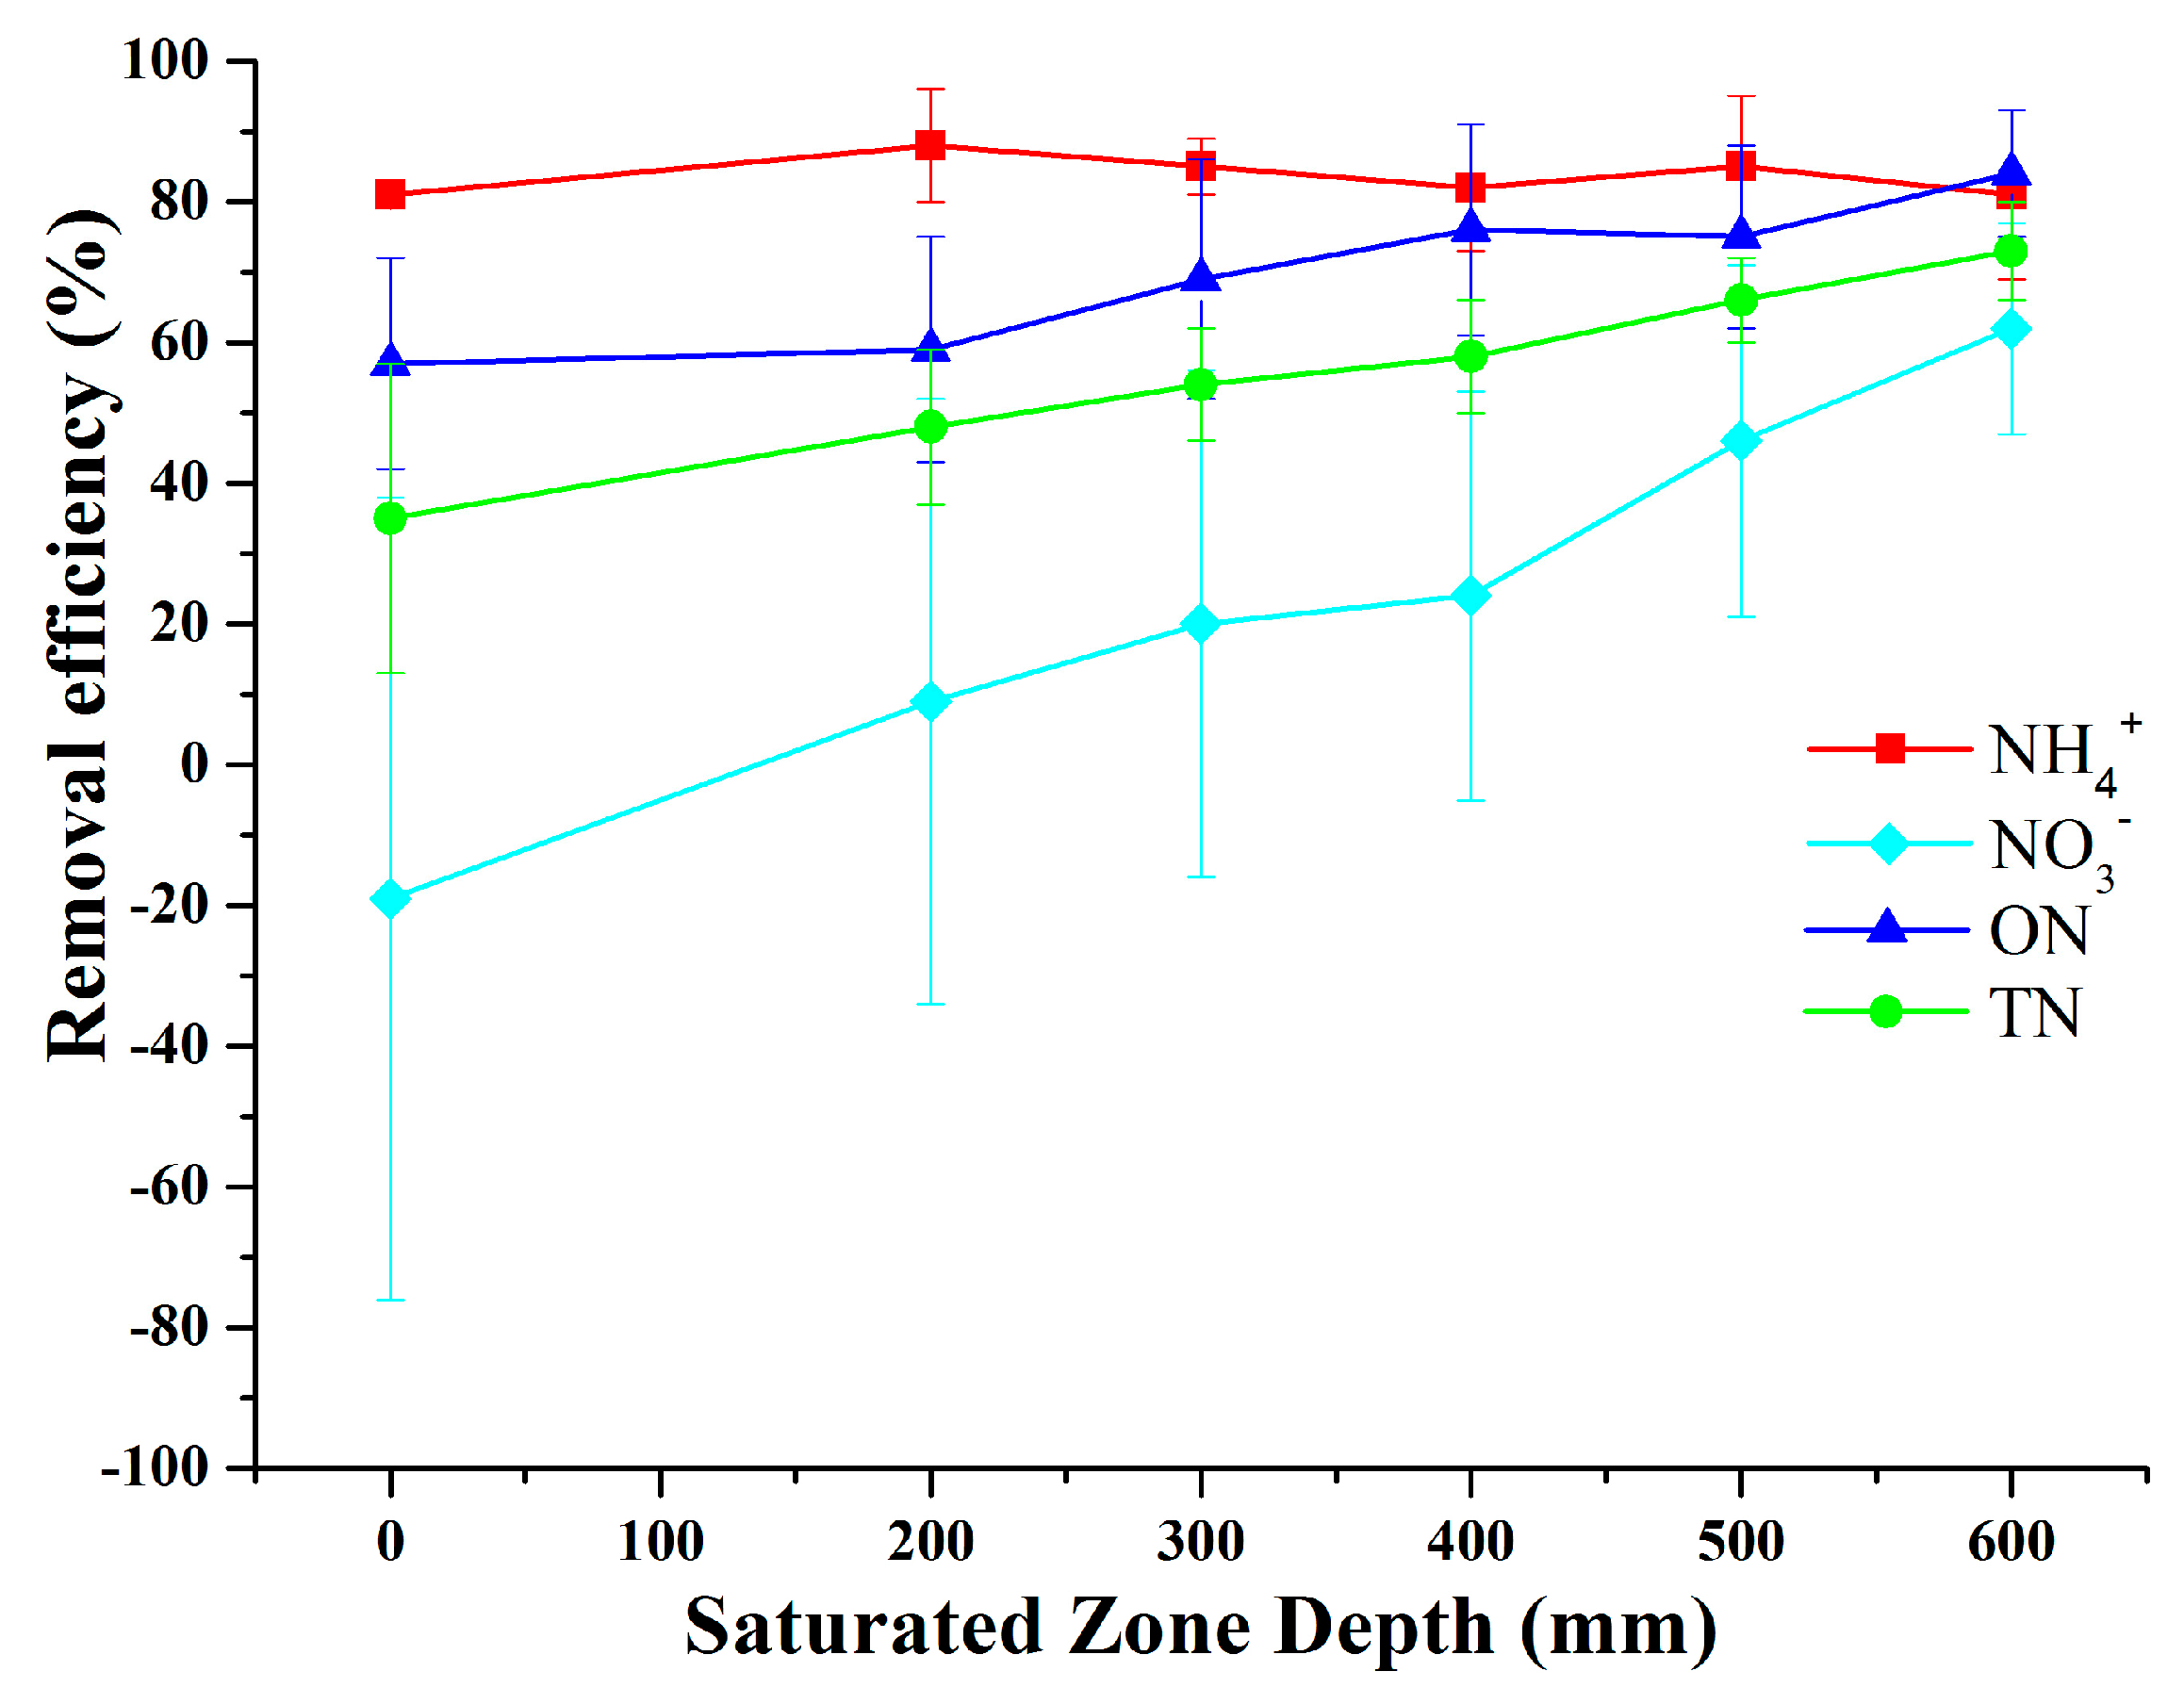
Removal efficiencies of NH4+ were hardly affected by SZ depth, whereas NO3−, ON and TN removal was significantly affected by the SZ depth. Particularly, significant difference of nitrogen removal efficiencies existed between the systems with large-depth difference (p < 0.05). All bioretention systems were highly effective in NH4+ removal with the EMC removal efficiencies ranging from 79% ± 5% to 87% ± 5% and their performance was relatively stable in systems with different SZ depths (Figure 6). However, NO3− removal efficiency increased significantly with the SZ depth, which varied from −23% ± 50% (net leaching and high variations) without SZ to 62% ± 15% with 600 mm deep SZ (Figure 6). Also, ON removal efficiency rose from 57% ± 10% to 84% ± 8% when the SZ depth increased from zero to 600 mm (Figure 6). Accordingly, the removal efficiency of TN (the sum of NH4+, NO3− and ON) increased from 35% ± 18% without SZ to 73% ± 5% with the SZ depth of 600 mm (Figure 6).
4. Discussion
4.1. Ammonium Removal
NH4+ could be removed by volatilization, media adsorption, plant assimilation and microbial nitrification in bioretention systems [34]. In this study, NH4+ volatilization should be generally minimal since the pH of mixed soil or sand was around 7.0 ± 0.5. Adsorption could occur instantaneously after the inflow of synthetic runoff, but mainly in the upper section of bioretention systems with its capacity depending on the physical properties of soil media such as cation exchange capacity [34]. Plant assimilation could also be quickly initiated by the nutrient-laden inflow [35], which mainly occurs in the rhizosphere (approximately the upper 0–30 cm of the soil layer for Phragmites australis). Microbial nitrification was not significant during the wetting periods due to the short duration of one hour [17,34], but may mainly account for the NH4+ losses from the soil during antecedent drying periods (ADPs) by converting NH4+ to NO3− (Figure 7). Microbial nitrification is typically an aerobic process that should also be limited to occur in the upper aerobic section. Therefore, NH4+ removal should mainly occur in the upper section of bioretention systems, and the introduction of an anaerobic SZ in the bottom had little effect on NH4+ removal so that different SZ depths in each bioretention exerted a negligible influence on NH4+ removal. This is in line with similarly high NH4+ removal efficiencies in bioretention systems with different SZ depths (Figure 6), as reported by the previous studies [6,7,8,9,11]. The significant difference (p < 0.01 for NH4+) between the system with 300 mm SZ and the non-SZ system revealed that the slight decrease of NH4+ removal may be due to the effective mineralization of ON in SZ, this is in line with the minor decrease of ON during the ADPs (Figure 3).
4.2. Nitrate Removal
NO3− could possibly be removed by several physical and microbial processes [17,34]. During wetting periods, due to its negative charge, NO3− is unlikely to be retained effectively by soil media in that most of the soil particles are negatively charged [34]. Besides, NO3− is soluble, and hydrological downward washing of NO3− from the soil media could lead to significant leaching of NO3−. Microbial denitrification is a permanent nitrogen removal pathway by transforming NO3− to gaseous nitrogen forms (NO, N2O and N2) via denitrifiers [34] and promoting denitrification becomes a major solution to improving nitrogen removal performance for bioretention systems. Meanwhile, NO3− can be produced by nitrifiers that convert NH4+ to NO3− via nitrification. However, denitrification or nitrification is not likely to occur significantly within the short-time (around 1 h) wetting period [36], but should mainly occur during the ADPs. The introduction of an SZ with stored runoff could pose little effect on nitrification (mostly aerobic process) but significantly affect denitrification by facilitating the growth of anaerobic denitrifiers to promote the removal of NO3− during the ADPs [20,34,36,37,38]. This can explain the growing NO3− removal efficiencies with the increasing SZ depths (Figure 6), which can be strongly supported by the significant difference of ANOVA analysis (p < 0.05 for NO3−).
The occurrence of denitrification in SZ during the ADPs was evident by the quick decrease of NO3 in Section 3.2 (Figure 3). This could be best illustrated with the additional results in this study with low DO (less than 0.5 mg/L), during the three-day interval, NO3− in SZ can be fully removed by improved denitrification [7,8,10]. The low NO3− concentrations in the early outflow process (Figure 5B) could reflect the NO3− level in the “old” water stored in SZ after ADPs, and during wetting periods, the gradual increase in the outflow of NO3− concentrations in the latter process could be a result of the mixing of the “old” water stored in SZ with low NO3− concentrations and the “new” inflow transported downward from the upper soil media layer with relatively high NO3− concentrations (Figure 5B). With the diminishing effect of “old” stored runoff, the outflow NO3− concentrations increased and even exceeded the inflow concentrations with NO3− leaching, and the net leaching of NO3− in the final outflow process likely originated from the nitrification with significant amounts of NO3− retained in the upper soil media layer during the ADPs.
The deeper SZ in this study was able to store more water to enable more denitrification during ADPs and provides more “old” water of low NO3− concentrations for water exchange with “new” inflow of high NO3− concentrations. Therefore, during wetting periods, systems with deeper SZ had more outflow of low NO3− concentrations and smaller amounts of outflow NO3− integrated over the whole outflow course, thus corresponding to higher NO3− removal performance (Figure 5B). The effectiveness of elevating NO3− removal by elevating SZ depths, is consistent with the results of Zinger et al [19] that showed a steady increase in NO3− removal efficiency ranging from 66% to 99% with the SZ depth from 450 mm to 600 mm. However, their up to 99% NO3− removal efficiencies in bioretention systems with SZ depths of 450 to 600 mm were consistently higher, probably owing to their low pollutant concentrations with TN concentration of 2.13 mg/L (NH4+ conc. of 0.29 mg/L, NO3− conc. of 0.74 mg/L, ON conc. of 1.1 mg/L, Melbourne, Australia) compared to that of 10 mg/L (NH4+ conc. of 2.5, NO3− conc. of 2.5 mg/L, ON conc. of 5.0 mg/L, Shenzhen, China) in this study (Table 2). Also, the SZ in this study was the gravel sump layer and the increase of SZ depth implied increasing the gravel sump thickness and thus, increasing the quantity of stored runoff in this study, which could be used to indicate the functionality of SZ; whereas Zinger et al. [19] simply elevated the elbow pipes of the bioretention systems of fixed structure (the system consists of 400 mm sandy loam with vegetation, 400 mm fine sand, 30 mm transition river sand and 70 mm gravel layers) to different heights to create SZs of different depths and their SZs might encompass the soil and sand layers as well as the same 70 mm deep gravel sumps. Therefore, the advanced SZ design in our study can verify the effectiveness of SZ, and better optimize the design ratio of upper soil layer and bottom SZ for removing nitrogen.
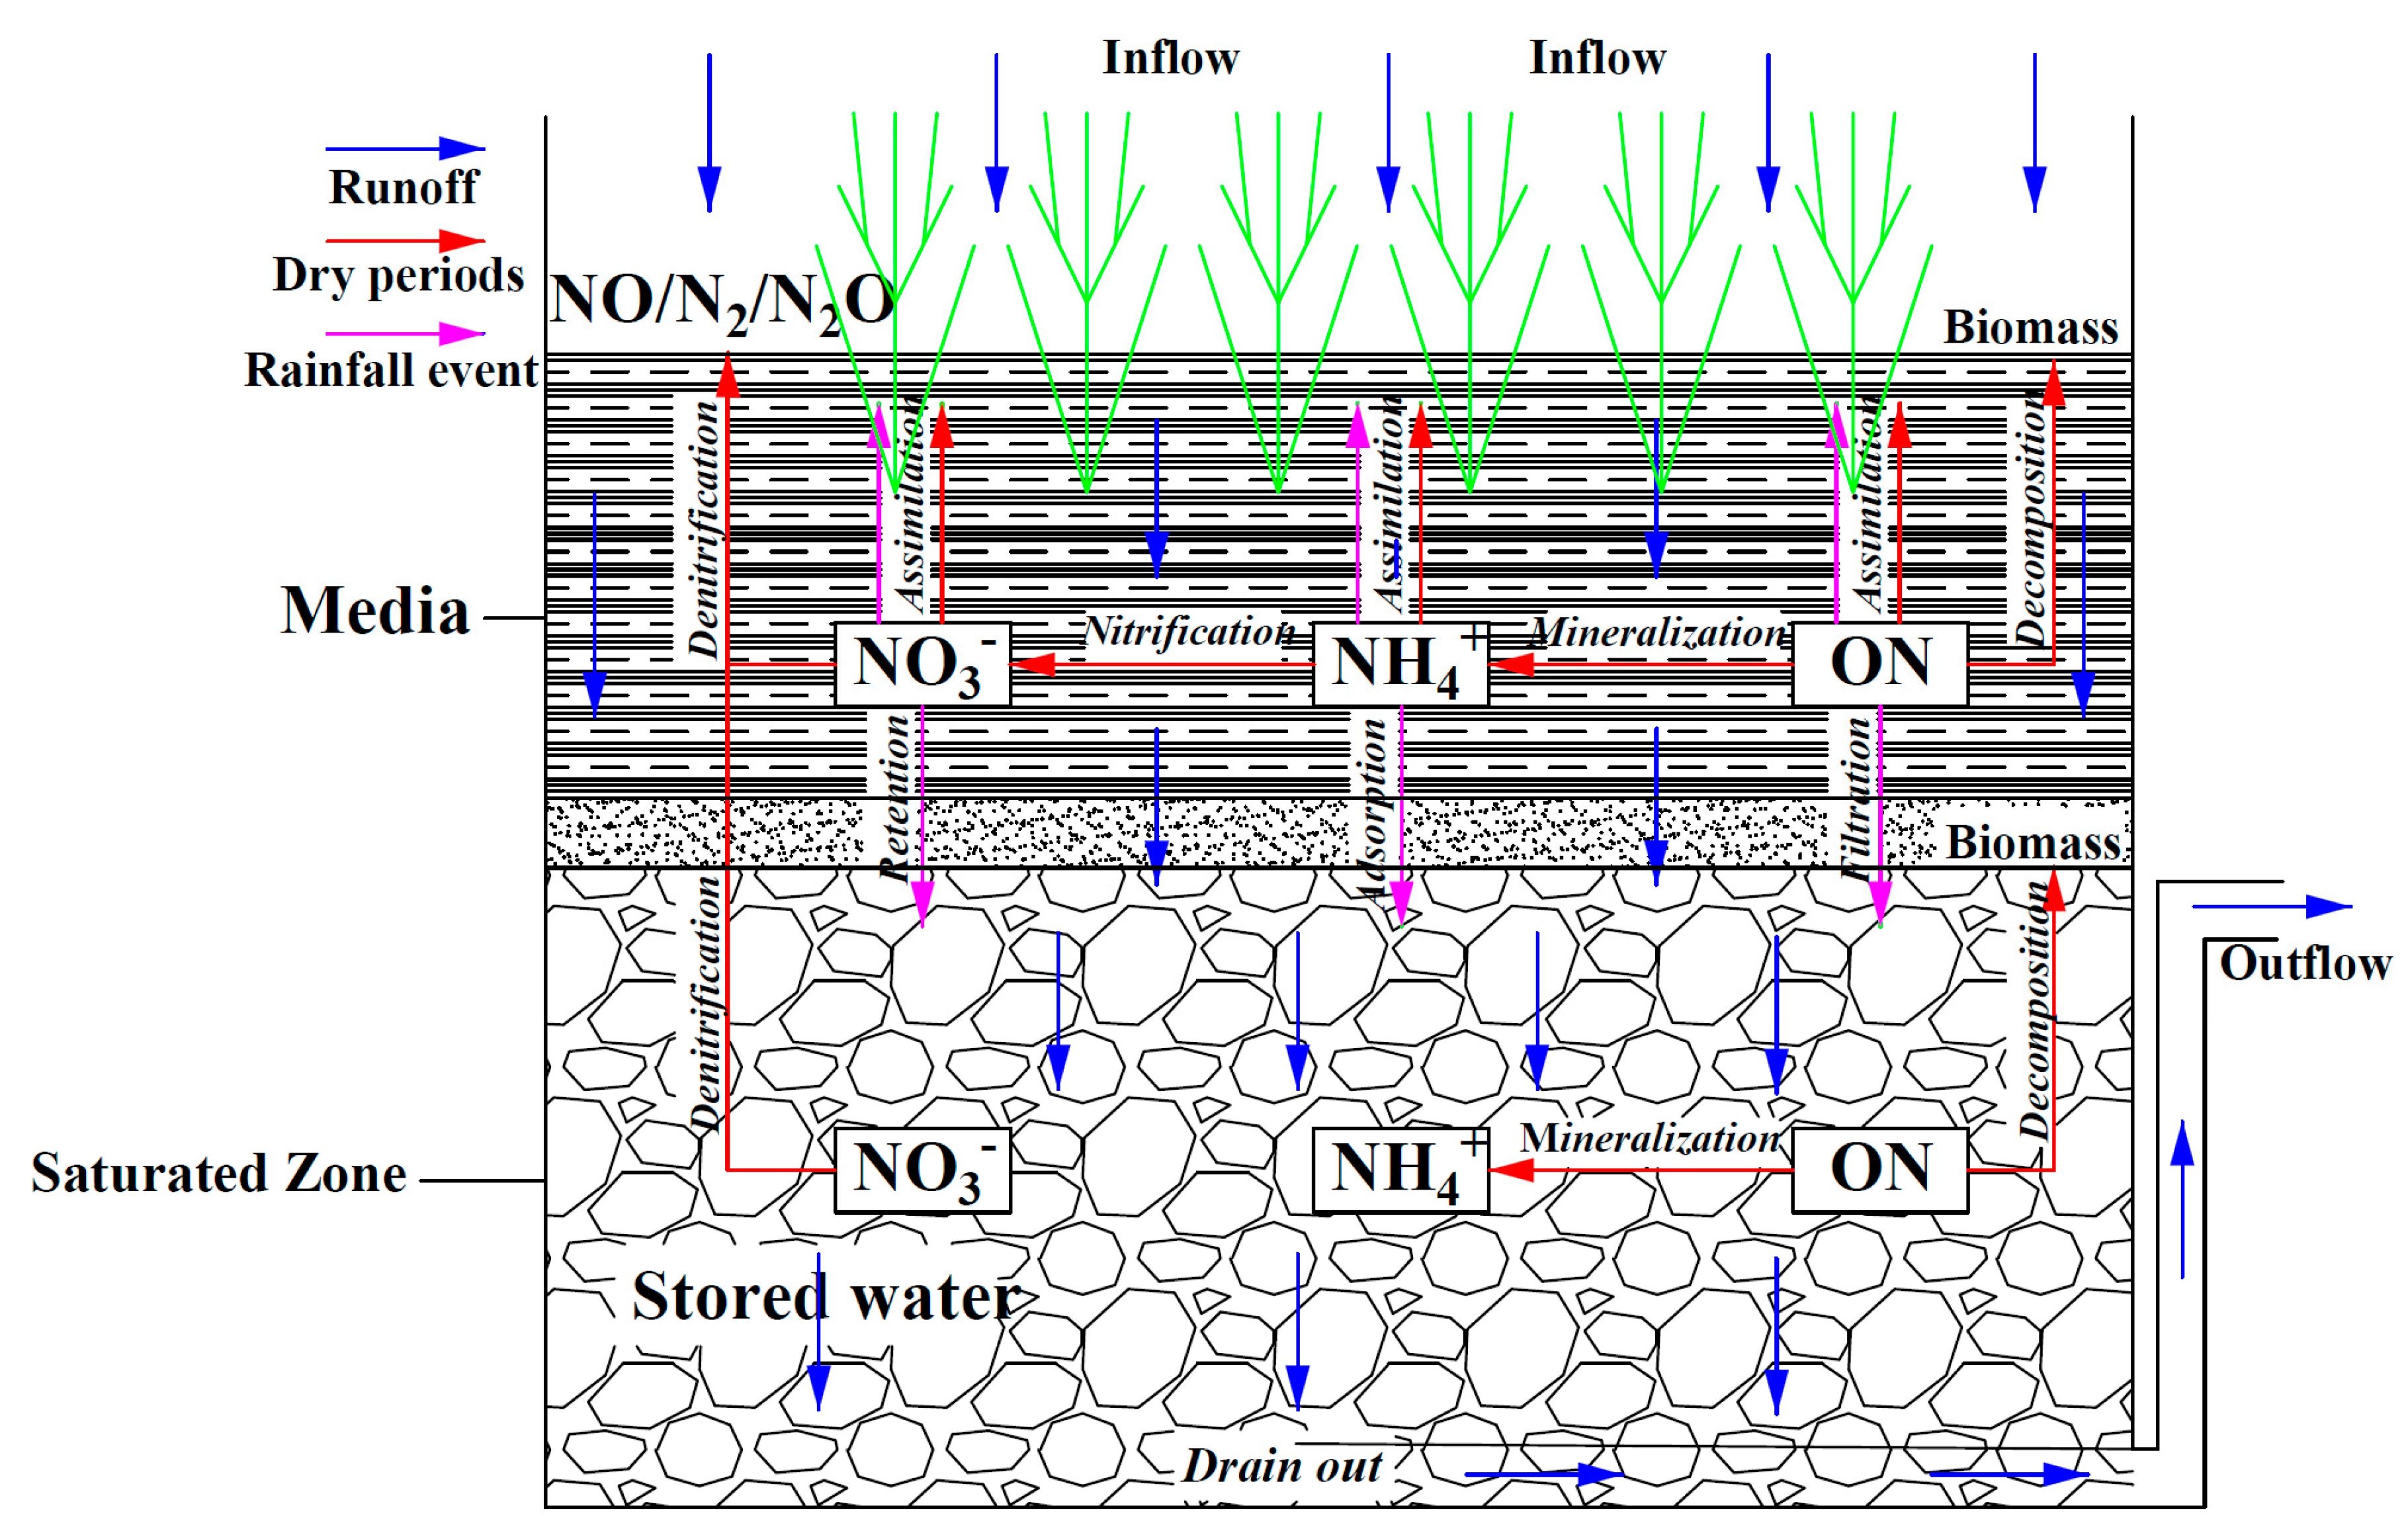
However, though we have acknowledged the importance of a deep SZ, the increase of SZ gravel sump depth may incur additional excavation costs. Therefore, we suggest optimizing the nitrate removal by setting an appropriate depth-ratio of the upper media layer and SZ to promote the complete nitrogen cycle from NH4+ to NO3− through nitrification and the permanent nitrogen removal of NO3− by converting NO3− to gaseous nitrogen (NO/N2O/N2) through denitrification (Figure 7), which also should be compromised with the cost.
4.3. Organic Nitrogen Removal
Likewise, ON removal could be attributed to many complex physical, chemical and microbial processes [7]. During wetting periods, ON could be removed substantially by retention and filtration in media layer and water exchange of stored runoff in SZ (Figure 7). Apart from that, during the 3-day ADPs, the upper soil media layer was mostly aerobic, mineralization (ammonification) can be promoted [34] to convert ON to NH4+. The bottom SZ added into bioretention systems formed an anaerobic condition under which mineralization might still occur, which was evident by the decrease of ON within 12-h drying periods (Figure 3). Therefore, ON removal could occur in both these layers and the introduction of SZ could be helpful to remove ON. The effectiveness of SZ on ON removal can be reflected by the significant difference of removal efficiencies between systems (p < 0.05 for ON).
The consistently low ON concentrations of each column during a wetting period indicated effective ON removal of bioretention systems (Figure 5C). Moreover, Figure 5C showed that the deeper the SZ was, the lower the ON concentration in the early outflow was. The reason might be that a deeper SZ provided more space for microbial mineralization to transform organic matter, leading to higher removal efficiency during the three-day drying periods (Figure 3). The results attested that ON removal could be slightly improved with the increase of SZ depths of bioretention systems.
4.4. Total Nitrogen Removal
TN removal in bioretention systems is a combined result of NH4+, NO3−, and ON removal which can be influenced by the hydrological and biotic processes in both the upper media layer and SZ under alternate drying and wetting conditions. As shown in Figure 7, NH4+ and ON could be effectively removed instantaneously due to retention and adsorption during wetting periods, while NH4+, ON and NO3− could mainly be removed via gradual nitrification, mineralization and denitrification processes during the ADPs (Figure 7). Therefore, TN removal in bioretention systems was determined by coupling the instantaneous hydrological water-exchange and chemical absorption during wetting periods with the gradual biotic removal, the former happened very quickly within one-hour wetting period, while the latter mainly occurred in the antecedent drying periods (Figure 3). The quasi-logistic curve-shaped variations of outflow TN concentrations similar to those of outflow NO3− concentrations showed that the fluctuations of TN removal were mainly controlled by NO3− (Figure 5B,D). Instead, higher NH4+ and ON removal with deeper SZ mainly accounted for significantly increased TN removal (p < 0.05) owing to their high removal efficiencies (Figure 6).
The deeper SZ contained more “old” stored runoff, which could improve plants’ growth with more moisture during the ADPs. Especially, it could form an anaerobic area for biotic removal pathways during the ADPs, and store a lager quantity of water for hydrological water-exchange removal pathways during wetting periods, which are important to NO3− and ON removal. As a result, SZ could help solve the fluctuations of nitrogen removal, the extent of which was dependent on the stored runoff quantity during the ADPs. However, in reality, the selection of suitable SZ depths of bioretention systems for nitrogen removal should be compromised with the construction costs according to local pollution and meteorological condition.
5. Conclusions
NH4+ removal efficiency in bioretention systems was consistently high through effective adsorption in soil layer, not varying with the increasing SZ depth, whereas ON and NO3− removal efficiency significantly increased with the SZ depth increasing from 0 to 600 mm due to increased mineralization and denitrification. NO3− concentrations over the outflow process presented quasi-logistic curve-shaped variations over time: being low in the early outflow process, sharply increasing thereafter, and in the final process flattening with the ultimate concentrations exceeding the inflow concentrations. NO3− leaching often occurred in the final outflow process without regard to the SZ depth. With the increase of SZ depth, quasi-logistic curve-shaped variations were observed with the longer duration of low NO3− concentrations in the early outflow process and less NO3− leaching in the latter outflow process. The incorporation of a deeper SZ proved beneficial to nitrogen removal and maintenance of bioretention functionality. The effectiveness of increasing SZ depths to promote TN removal was attributed to larger amounts of stored runoff where denitrification of NO3− and mineralization of ON occurred during the ADPs.
One possible direction for future nitrogen removal improvement is to transport the products of nitrification—NO3−—from the upper soil media to the SZ occasionally during ADPs to further increase the NO3− removal, which, however, requires additional care in the field. Also, more detailed studies and in-depth analyses are needed to quantify the effect of SZ in this “black box”—a bioretention system under alternate drying and wetting conditions.
Acknowledgments
This research was supported by The National Natural Science Foundation of China (41603073), Shenzhen Science and Technology Development Fund Project (JCYJ20150518092928547), National Water Pollution Control and Management Technology Major Projects (No. 2013ZX07501005), and the project of Shenzhen Municipal Development and Reform Commission (Discipline construction of watershed ecological engineering). The authors are deeply grateful to Ming Cheng, Kangmao He, Yanyan Zheng for helping with laboratory work and analysis. Finally, the authors would like to thank, in particular, the invaluable support received from Meiyue Ding over the years.
Author Contributions
Chuansheng Wang, Huapeng Qin and Fan Wang conceived and designed the experiments; Chuansheng Wang, Xueran Li and Xiangfei Zeng performed the experiments; Chuansheng Wang and Fan Wang analyzed the data; Fan Wang and Shaw-Lei Yu contributed experimental analysis tools; Chuansheng Wang and Fan Wang wrote the paper; Huapeng Qin and Shaw-Lei Yu helped review and edit the paper.
Conflicts of Interest
The authors declare no conflict of interest.
References
- United States Environmental Protection Agency (US EPA). Renewed Call to Action to Reduce Nutrient Pollution and Support for Incremental Actions to Protect Water Quality and Public Health; United States Environmental Protection Agency: Washington, DC, USA, 2016. Available online: https://www.epa.gov/sites/production/files/2016-09/documents/renewed-call-nutrient-memo-2016.pdf (accessed on 22 September 2016).
- Driscoll, C.T.; Whitall, D.R.; Aber, J.D.; Boyer, E.W.; Castro, M.S.; Cronan, C.S.; Groffman, P.; Hopkinson, C.; Lambert, K.; Lambert, K.; et al. Nitrogen Pollution in the Northeastern United States: Sources, Effects, and Management Options. BioScience 2003, 53, 357–374. [Google Scholar] [CrossRef]
- Taylor, G.D.; Fletcher, T.D.; Wong, T.H.F.; Breen, P.F.; Duncan, H.P. Nitrogen composition in urban runoff: Implications for stormwater management. Water Res. 2005, 39, 1982–1989. [Google Scholar] [CrossRef] [PubMed]
- Liu, J.; Sample, D.J.; Bell, C.; Guan, Y. Review and Research Needs of Bioretention Used for the Treatment of Urban Stormwater. Water 2014, 6, 1069–1099. [Google Scholar] [CrossRef]
- Jia, H.; Yao, H.; Shaw, L.Y. Advances in LID BMPs research and practice for urban runoff control in China. Front. Environ. Sci. Eng. 2013, 7, 709–720. [Google Scholar] [CrossRef]
- Davis, A.P.; Shokouhian, M.; Sharma, H.; Minami, C.; Winogradoff, D.A. Water quality improvement through bioretention: Lead, copper, and zinc removal. Water Environ. Res. 2003, 75, 73–82. [Google Scholar] [CrossRef] [PubMed]
- Davis, A.P.; Shokouhian, M.; Sharma, H.; Minami, C. Water quality improvement through bioretention media: Nitrogen and phosphorus removal. Water Environ. Res. 2006, 78, 284–293. [Google Scholar] [CrossRef] [PubMed]
- Hatt, B.E.; Fletcher, T.; Deletic, A. Hydraulic and Pollutant Removal Performance of Fine Media Stormwater Filtration Systems. Environ. Sci. Technol. 2008, 42, 2535–2541. [Google Scholar] [CrossRef] [PubMed]
- Hunt, W.F.; Davis, A.P.; Traver, R.G. Meeting Hydrologic and Water Quality Goals through Targeted Bioretention Design. J. Environ. Eng. 2012, 138, 698–707. [Google Scholar] [CrossRef]
- Lynn, T.J.; Yeh, D.H.; Ergas, S.J. Performance and longevity of denitrifying wood-chip biofilters for stormwater treatment: A microcosm study. Environ. Eng. Sci. 2015, 32, 321–330. [Google Scholar] [CrossRef]
- Palmer, E.T.; Poor, C.J.; Hinman, C.; Stark, J.D. Nitrate and phosphate removal through enhanced bioretention media: Mesocosm study. Water Environ. Res. 2013, 85, 823–832. [Google Scholar] [CrossRef] [PubMed]
- Rycewicz-Borecki, M.; Mclean, J.E.; Dupont, R.R. Nitrogen and phosphorus mass balance, retention and uptake in six plant species grown in stormwater bioretention microcosms. Ecol. Eng. 2017, 99, 409–416. [Google Scholar] [CrossRef]
- Hunt, W.; Jarrett, A.; Smith, J.; Sharkey, L. Evaluating Bioretention Hydrology and Nutrient Removal at Three Field Sites in North Carolina. J. Irrig. Drain. Eng. 2006, 132, 600–608. [Google Scholar] [CrossRef]
- Bratieres, K.; Fletcher, T.D.; Deletic, A.; Zinger, Y.A. Nutrient and sediment removal by stormwater biofilters: A large-scale design optimisation study. Water Res. 2008, 42, 3930–3940. [Google Scholar] [CrossRef] [PubMed]
- Davis, A.P.; Hunt, W.F.; Traver, R.G.; Clar, M. Bioretention technology: Overview of current practice and future needs. J. Environ. Eng. 2009, 135, 109–117. [Google Scholar] [CrossRef]
- Collins, K.A.; Lawrence, T.J.; Stander, E.K.; Jontos, R.J.; Kaushale, S.S.; Newcomer, T.A.; Grimmg, N.B.; Ekberg, M.C. Opportunities and challenges for managing nitrogen in urban stormwater: A review and synthesis. Ecol. Eng. 2010, 36, 1507–1519. [Google Scholar] [CrossRef]
- Sharkey, L.J.; Hunt, W.F. Hydrologic and water quality performance of four bioretention cells in central North Carolina. In Proceedings of the Watershed Management Conference—Managing Watersheds for Human and Natural Impacts: Engineering, Ecological, and Economic Challenges, Williamsburg, VA, USA, 19–22 July 2005; pp. 833–842. [Google Scholar]
- Blecken, G.; Zinger, Y.; Deletic, A.; Fletcher, T.; Hedstrom, A.; Viklander, M. Laboratory study on stormwater biofiltration: Nutrient and sediment removal in cold temperatures. J. Hydrol. 2010, 394, 507–514. [Google Scholar] [CrossRef]
- Zinger, T.; Fletcher, T.D.; Deletic, A.; Blecken, G.T.; Viklander, M. Optimisation of the nitrogen retention capacity of stormwater biofiltration systems. Presented at the 6th International Conference on Sustainable Techniques and Strategies in Urban Water Management, Lyon, France, 24–28 June 2007. [Google Scholar]
- Zinger, Y.; Deletic, A.; Fletcher, T.D. The effect of various intermittent wet-dry cycles on nitrogen removal capacity in biofilters systems. Presented at the 13th International Rainwater Catchment Systems Conference and 5th International Water Sensitive Urban Design Conference, Sydney, Australia, 21–23 August 2007. [Google Scholar]
- Zinger, Y.; Blecken, G.; Fletcher, T.D.; Viklander, M.; Deletic, A. Optimising nitrogen removal in existing stormwater biofilters: Benefits and tradeoffs of a retrofitted saturated zone. Ecol. Eng. 2013, 51, 75–82. [Google Scholar] [CrossRef]
- Soberg, L.C.; Viklander, M.; Blecken, G. Do salt and low temperature impair metal treatment in stormwater bioretention cells with or without a submerged zone. Sci. Total Environ. 2016, 579, 1588–1599. [Google Scholar] [CrossRef] [PubMed]
- Amir, A.; Asher, B. Use of Cotton as a Carbon Source for Denitrification in Biofilters for Groundwater Remediation. Water 2017, 9, 714. [Google Scholar] [CrossRef]
- Dietz, M.E.; Clausen, J.C. Saturation to Improve Pollutant Retention in a Rain Garden. Environ. Sci. Technol. 2006, 40, 1335–1340. [Google Scholar] [CrossRef] [PubMed]
- Zhang, Z.; Rengel, Z.; Liaghati, T.; Antoniette, T.; Meney, K. Influence of plant species and submerged zone with carbon addition on nutrient removal in stormwater biofilter. Ecol. Eng. 2011, 37, 1833–1841. [Google Scholar] [CrossRef]
- Zhang, Z.; Rengel, Z.; Meney, K. Interactive effects of nitrogen and phosphorus loadings on nutrient removal from simulated wastewater using Schoenoplectus validus in wetland microcosms. Chemosphere 2008, 72, 1823–1828. [Google Scholar] [CrossRef] [PubMed]
- Passeport, E.; Hunt, W.F.; Line, D.E. Field study of the ability of two grassed bioretention cells to reduce storm-water runoff pollution. J. Irrig. Drain. Eng. 2009, 135, 505–510. [Google Scholar] [CrossRef]
- Monash University. Adoption Guidelines for Stormwater Biofiltration Systems: Facility for Advancing Water Biofiltration; Monash University: Melbourne, Australia, 2009. [Google Scholar]
- Melbourne Water. WSUD Engineering Procedures: Stromwater; CSIRO Publishing: Melbourne, Australia, 2005. [Google Scholar]
- Department of Environmental Resources. Bioretention Manual. Environmental Services Division; Department of Environmental Resources: The Prince George’s County, MD, USA, 2007. [Google Scholar]
- Blecken, G.; Zinger, Y.; Deletic, A.; Fletcher, T.; Viklander, M. Impact of a submerged zone and a carbon source on heavy metal removal in stormwater biofilters. Ecol. Eng. 2009, 35, 769–778. [Google Scholar] [CrossRef]
- Huang, J.; Du, P.; Ao, C.T.; Lei, M.H.; Zhao, D.Q.; Ho, M.; Wang, Z. Characterization of surface runoff from a subtropics urban catchment. J. Environ. Sci. 2007, 19, 148–152. [Google Scholar] [CrossRef]
- American Public Health Association; American Water Works Association; Water Environment Federation. Standard Methods for the Examination of Water and Wastewater, 22nd ed.; American Public Health Association, American Water Works Association, Water Environment Federation: Washington, DC, USA, 2012. [Google Scholar]
- Payne, E.G.; Fletcher, T.D.; Cook, P.L.; Deletic, A.; Hatt, B.E. Processes and drivers of nitrogen removal in stormwater biofiltration. Crit. Rev. Environ. Sci. Technol. 2014, 44, 796–846. [Google Scholar] [CrossRef]
- Geronimo, F.K.F.; Maniquiz-Redillas, M.C.; Kim, L.H. Fate and removal of nutrients in bioretention systems. Desalin. Water Treat. 2015, 53, 3072–3079. [Google Scholar] [CrossRef]
- Peterson, I.J.; Igielski, S.; Davis, A.P. Enhanced denitrification in bioretention using woodchips as an organic carbon source. J. Sustain. Water Built Environ. 2015, 1. [Google Scholar] [CrossRef]
- Brown, R.A.; Hunt, W.F. Underdrain configuration to enhance bioretention exfiltration to reduce pollutant loads. J. Environ. Eng. 2011, 137, 1082–1091. [Google Scholar] [CrossRef]
- Subramaniam, D.; Mather, P.B.; Russell, S.; Rajapakse, J. Dynamics of Nitrate-Nitrogen Removal in Experimental Stormwater Biofilters under Intermittent Wetting and Drying. J. Environ. Eng. 2016, 142. [Google Scholar] [CrossRef]
Figure 1.
Bioretention Columns: Structure details (a) and experiment site pictures (b). Unit: mm.

Figure 2.
The variations in the average outflow ammonium (NH4+), nitrate (NO3−), organic nitrogen (ON) and total nitrogen (TN) concentrations for five simulated wetting periods with time. The bars indicate the standard deviations of nitrogen concentration. (A) variations of nitrogen concentrations in bioretention columns with 300 mm SZ; (B) variations of nitrogen concentrations in bioretention columns without SZ.
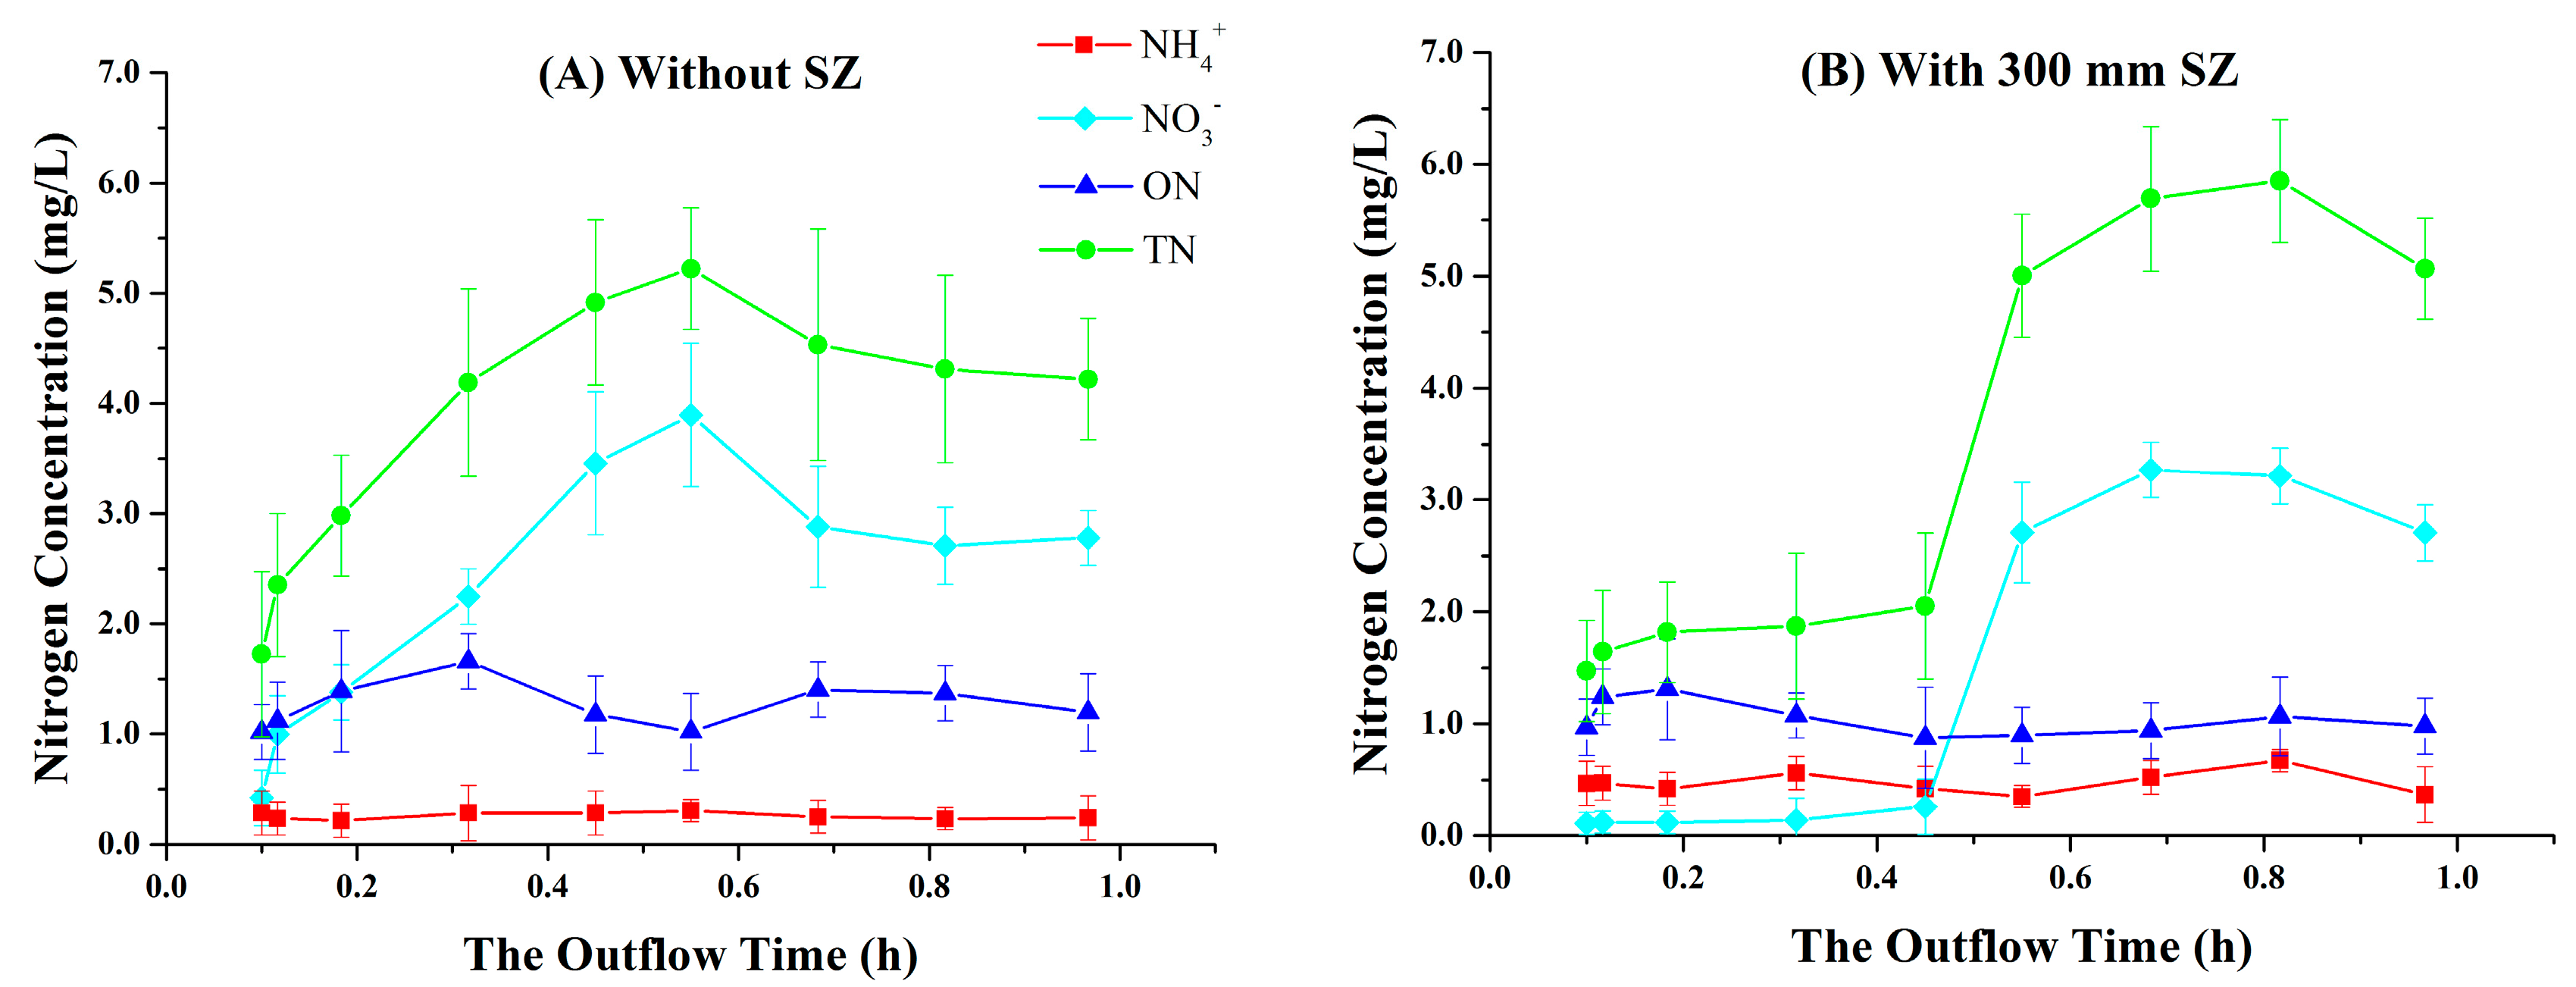
Figure 3.
The variations in the average ammonium (NH4+), nitrate (NO3−), organic nitrogen (ON) and total nitrogen (TN) concentrations in the saturated zone of bioretention systems during antecedent drying periods (ADPs). The bars indicate the standard deviations of nitrogen concentration.
Figure 3.
The variations in the average ammonium (NH4+), nitrate (NO3−), organic nitrogen (ON) and total nitrogen (TN) concentrations in the saturated zone of bioretention systems during antecedent drying periods (ADPs). The bars indicate the standard deviations of nitrogen concentration.

Figure 4.
The removal efficiency of ammonium (A), nitrate (B), organic nitrogen (C) and total nitrogen (D) between the system with SZ and non-SZ system. The description of the above box- and whisker- plots: the bottom and top of the box are the first and third quartiles, and the band inside the box is the median. The ends of the whiskers represent the minimum and maximum of all of the data.

Figure 5.
The variations in the average ammonium (A), nitrate (B), organic nitrogen (C) and total nitrogen (D) concentrations in the outflow over time during simulated wetting periods with different saturated zone depths.
Figure 5.
The variations in the average ammonium (A), nitrate (B), organic nitrogen (C) and total nitrogen (D) concentrations in the outflow over time during simulated wetting periods with different saturated zone depths.

Figure 6.
Variations in the average ammonium (NH4+), nitrate (NO3−), organic nitrogen (ON) and total nitrogen (TN) removal efficiencies for five simulated wetting periods with SZ depths. The bars indicate the standard deviations of nitrogen concentration.
Figure 6.
Variations in the average ammonium (NH4+), nitrate (NO3−), organic nitrogen (ON) and total nitrogen (TN) removal efficiencies for five simulated wetting periods with SZ depths. The bars indicate the standard deviations of nitrogen concentration.

Figure 7.
The diagram showing nitrogen processes that mainly occur in SZ and media layer of a bioretention system under alternate drying and wetting periods.
Figure 7.
The diagram showing nitrogen processes that mainly occur in SZ and media layer of a bioretention system under alternate drying and wetting periods.

Table 1.
The media in the bioretention columns.
| Media Layer | Depth (mm) | Material |
|---|---|---|
| Mulch | 50 | Wood chips |
| Soil layer | 450 | Sandy loam |
| Transition layer | 120 | River sand (1–2 mm) |
| Saturated zone | 0, 200, 300, 400, 500, 600 | Gravel and Carbon source |
Table 2.
The mean inflow concentrations of pollutants in the synthetic runoff.
| Pollutant | Mean Inflow Concentration | Source |
|---|---|---|
| Chemical Oxygen Demand | 200 mg/L | Glucose (C6H12O6) |
| NO3−-N | 2.5 mg/L | Potassium Nitrate (KNO3) |
| NH4+-N | 2.5 mg/L | Ammonium Chloride (NH4Cl) |
| ON | 5.0 mg/L | 3-Aminopropanoic (C3H7NO2) |
© 2018 by the authors. Licensee MDPI, Basel, Switzerland. This article is an open access article distributed under the terms and conditions of the Creative Commons Attribution (CC BY) license (http://creativecommons.org/licenses/by/4.0/).
Share and Cite
MDPI and ACS Style
Wang, C.; Wang, F.; Qin, H.; Zeng, X.; Li, X.; Yu, S.-L. Effect of Saturated Zone on Nitrogen Removal Processes in Stormwater Bioretention Systems. Water 2018, 10, 162. https://doi.org/10.3390/w10020162
AMA Style
Wang C, Wang F, Qin H, Zeng X, Li X, Yu S-L. Effect of Saturated Zone on Nitrogen Removal Processes in Stormwater Bioretention Systems. Water. 2018; 10(2):162. https://doi.org/10.3390/w10020162
Chicago/Turabian StyleWang, Chuansheng, Fan Wang, Huapeng Qin, Xiangfei Zeng, Xueran Li, and Shaw-Lei Yu. 2018. "Effect of Saturated Zone on Nitrogen Removal Processes in Stormwater Bioretention Systems" Water 10, no. 2: 162. https://doi.org/10.3390/w10020162
Note that from the first issue of 2016, this journal uses article numbers instead of page numbers. See further details here.