A Risk-Based Model for Real-Time Flood Control Operation of a Cascade Reservoir System under Emergency Conditions

1
School of Earth Sciences and Engineering, Hohai University, No.1 Xikang Road, Nanjing 210098, China
2
College of Hydrology and Water Resources, Hohai University, No.1 Xikang Road, Nanjing 210098, China
3
Geological Survey of Jiangsu Province, Nanjing 210018, China
*
Author to whom correspondence should be addressed.
Water 2018, 10(2), 167; https://doi.org/10.3390/w10020167
Submission received: 13 December 2017
/
Revised: 5 February 2018
/
Accepted: 5 February 2018
/
Published: 8 February 2018
Abstract
:Real-time flood control operations of a cascade reservoir system under emergency conditions can reduce the social and economic loss caused by natural disasters. This paper proposes a risk-based model for real-time flood control operation of reservoirs under emergency conditions and uncertainties. The proposed model consists of three modules: emergency scenarios establishing, Monte Carlo simulations, and risk analysis. The emergency scenarios considered are earthquakes, extreme floods and failure of the spillways of a reservoir. The uncertainty factor considered is the forecast error of reservoir inflows, arising from model structural uncertainty and parameter estimating. The Monte Carlo simulations conduct the real-time flood control operation of reservoirs considering the proposed emergency events and uncertainties. The module of risk analysis performs the assessment of the operation schedules and calculates the risk of dam overtopping, based on the results from Monte Carlo simulations. The proposed model is applied to a cascade reservoir system in the upper reaches of Daduhe river basin in China. The results show that the maximum initial water level of the Shuangjiangkou reservoir is 2447 m a.s.l. (meters above sea level) using the release capacity model and is 2444.5 m a.s.l. using the command model under the scenario of upstream dam break. The integrated risk of the reservoir increases with the initial water level and the uncertainty degree of the reservoir inflows. The decision-makers can choose the operation models according to the actual initial water level of the reservoir under different emergency scenarios.
1. Introduction
With the social and economic development of China, many river basins have built flood control systems that consist of cascade reservoirs. The joint operation of these cascade reservoirs can greatly improve the efficiency of water utilization, the stability of hydropower generation and the benefits of flood control projects. The cascade reservoirs not only bring these benefits, but also add complexity to the real-time flood control operation under emergency conditions. Emergency events can include earthquakes, extreme floods, upstream reservoir overtopping, failure of several spillways of a reservoir, terrorist events, etc. The emergency conditions may cause the subsequent dam breaks of the cascade reservoirs and result in enormous life loss and economic loss [1]. For example, the dam overtopping of the Foziling and Mozitan reservoirs in 1969 in Anhui province of China was caused by the delayed opening of the spillways and the power outage during the opening of the spillways during the extreme flood. The dam breaks of the Banqiao and Shimantan reservoirs in 1975 in Henan province of China resulted from the poor joint operation of the cascade reservoirs and the upstream dam break of the Yuanmen reservoir. The subsequent dam breaks of the cascade reservoirs caused 26,000 deaths, 17,000,000 acres of flooded farmlands and a 50-day interruption of the railways between Beijing and Guangzhou [2,3]. In light of this, it is important to research flood control operation plans of the cascade reservoirs under emergency conditions.
It is required in the United States, Canada, Europe, Australia, and other developed countries that the management department of a reservoir propose practical emergency plans for potential emergency conditions and include them in the dam safety management [4,5]. The Chinese government also pays attention to the safety management of reservoirs and conducts the research on the emergency plans for potential emergency conditions and the assessment of economic and life loss result from dam breaks. The flood control operation of reservoirs under emergency conditions is one of the most important parts of the emergency plans for potential emergency conditions, and many researchers have done research on emergency events and corresponding responses. Wang and Feng proposed flood control operation rules and a risk assessment method for cascade reservoirs under the emergency condition of potential dam failures [6]. The results show that the flood control operation of the cascade reservoirs under emergency conditions is an efficient non-engineering measure to reduce economic and life loss. Zhou et al. presented a response of constructing a division channel to event of the barrier lake created by an earthquake in 2014 in Niulan River of Yunnan Province, which is located in Southwest China [7]. Armada et al. proposed a dam-break flood emergency management system to model the flood wave induced by a dam break and, eventually, to manage the response to flood-induced catastrophes [8].
However, many uncertainties are associated with the real-time flood control operation of reservoirs under emergency conditions [9,10,11]. The uncertainties include the magnitude and time of occurrence of the disasters, the communication of information between different management departments, and the response uncertainty of the evacuated people, and so on. These uncertainties make the operation results random and bring risks to flood control decisions [12,13]. The traditional deterministic flood control operations for the reservoirs cannot provide the risks arising from the uncertainties. Many scholars have conducted research on risk analysis for flood control operations of reservoirs and other flood control structures [14,15,16]. Tosun et al. calculated the risk of the seismic hazards of thirty-two large reservoirs in the Euphrates basin, based on seismic activities and physical properties [17]. Wu et al. formulated a risk analysis model to calculate the overtopping probability of a levee system using the advanced first-order and second-moment (AFOSM) method [18]. Yan et al. proposed a method to assess the impact of inflow forecasting errors on reservoir flood control operations, based on stochastic differential equations and the forward Euler method [19]. The authors also performed some work on risk analysis of reservoir operations. We proposed a risk analysis method for real-time flood control operation of a reservoir by solving a stochastic differential equation of reservoir flood routing [20]. We developed a model for supporting optimal flood control decision-making under uncertainty and evaluates the risk propagation process [21]. However, the above published papers are about the risk analysis and decision making for flood control operation of reservoirs under normal conditions. The literature on specific emergency measures for the real-time flood control operation of cascade reservoirs under the combination of emergency events and uncertainties is limited, especially for the impact of the uncertainties on the emergency operations of reservoirs. Therefore, the main purpose of this study is to propose a risk-based model for real-time flood control operation of reservoirs under the combination of emergency events and uncertainties. The proposed model is to have a reliability assessment of the real-time flood control operation process of reservoirs under the combination of emergency events and uncertainties, from its observation to its operation. It also provides the integrated risk of the whole emergency event, while most of the published papers calculate the risk of the whole event by the maximum risk during the period. The developed method also evaluates the impact of the uncertainty degree on the integrated risk of the whole emergency event and provides some characteristic values for the decision makers to carry out emergency responses according to the emergency scenarios. The following three major modules are included: (1) emergency scenarios establishing, which considers earthquakes, extreme floods, and failure of several spillways of a reservoir; (2) the Monte Carlo simulations, which carry out the real-time flood control operation of reservoirs considering the proposed emergency events and uncertainties; (3) risk analysis model, which performs the assessment of the operation schedules and calculates the risk of reservoir overtopping, based on the results from Monte Carlo simulations.
The rest of this paper is organized as follows: Section 2 proposes the methodology including emergency scenarios establishing, Monte Carlo simulations, and risk analysis; Section 3 presents the case study; Section 4 shows the results of the proposed model; Section 5 presents the discussions of the results; and, finally, we provide the conclusions of this work in Section 6.
2. Methodology
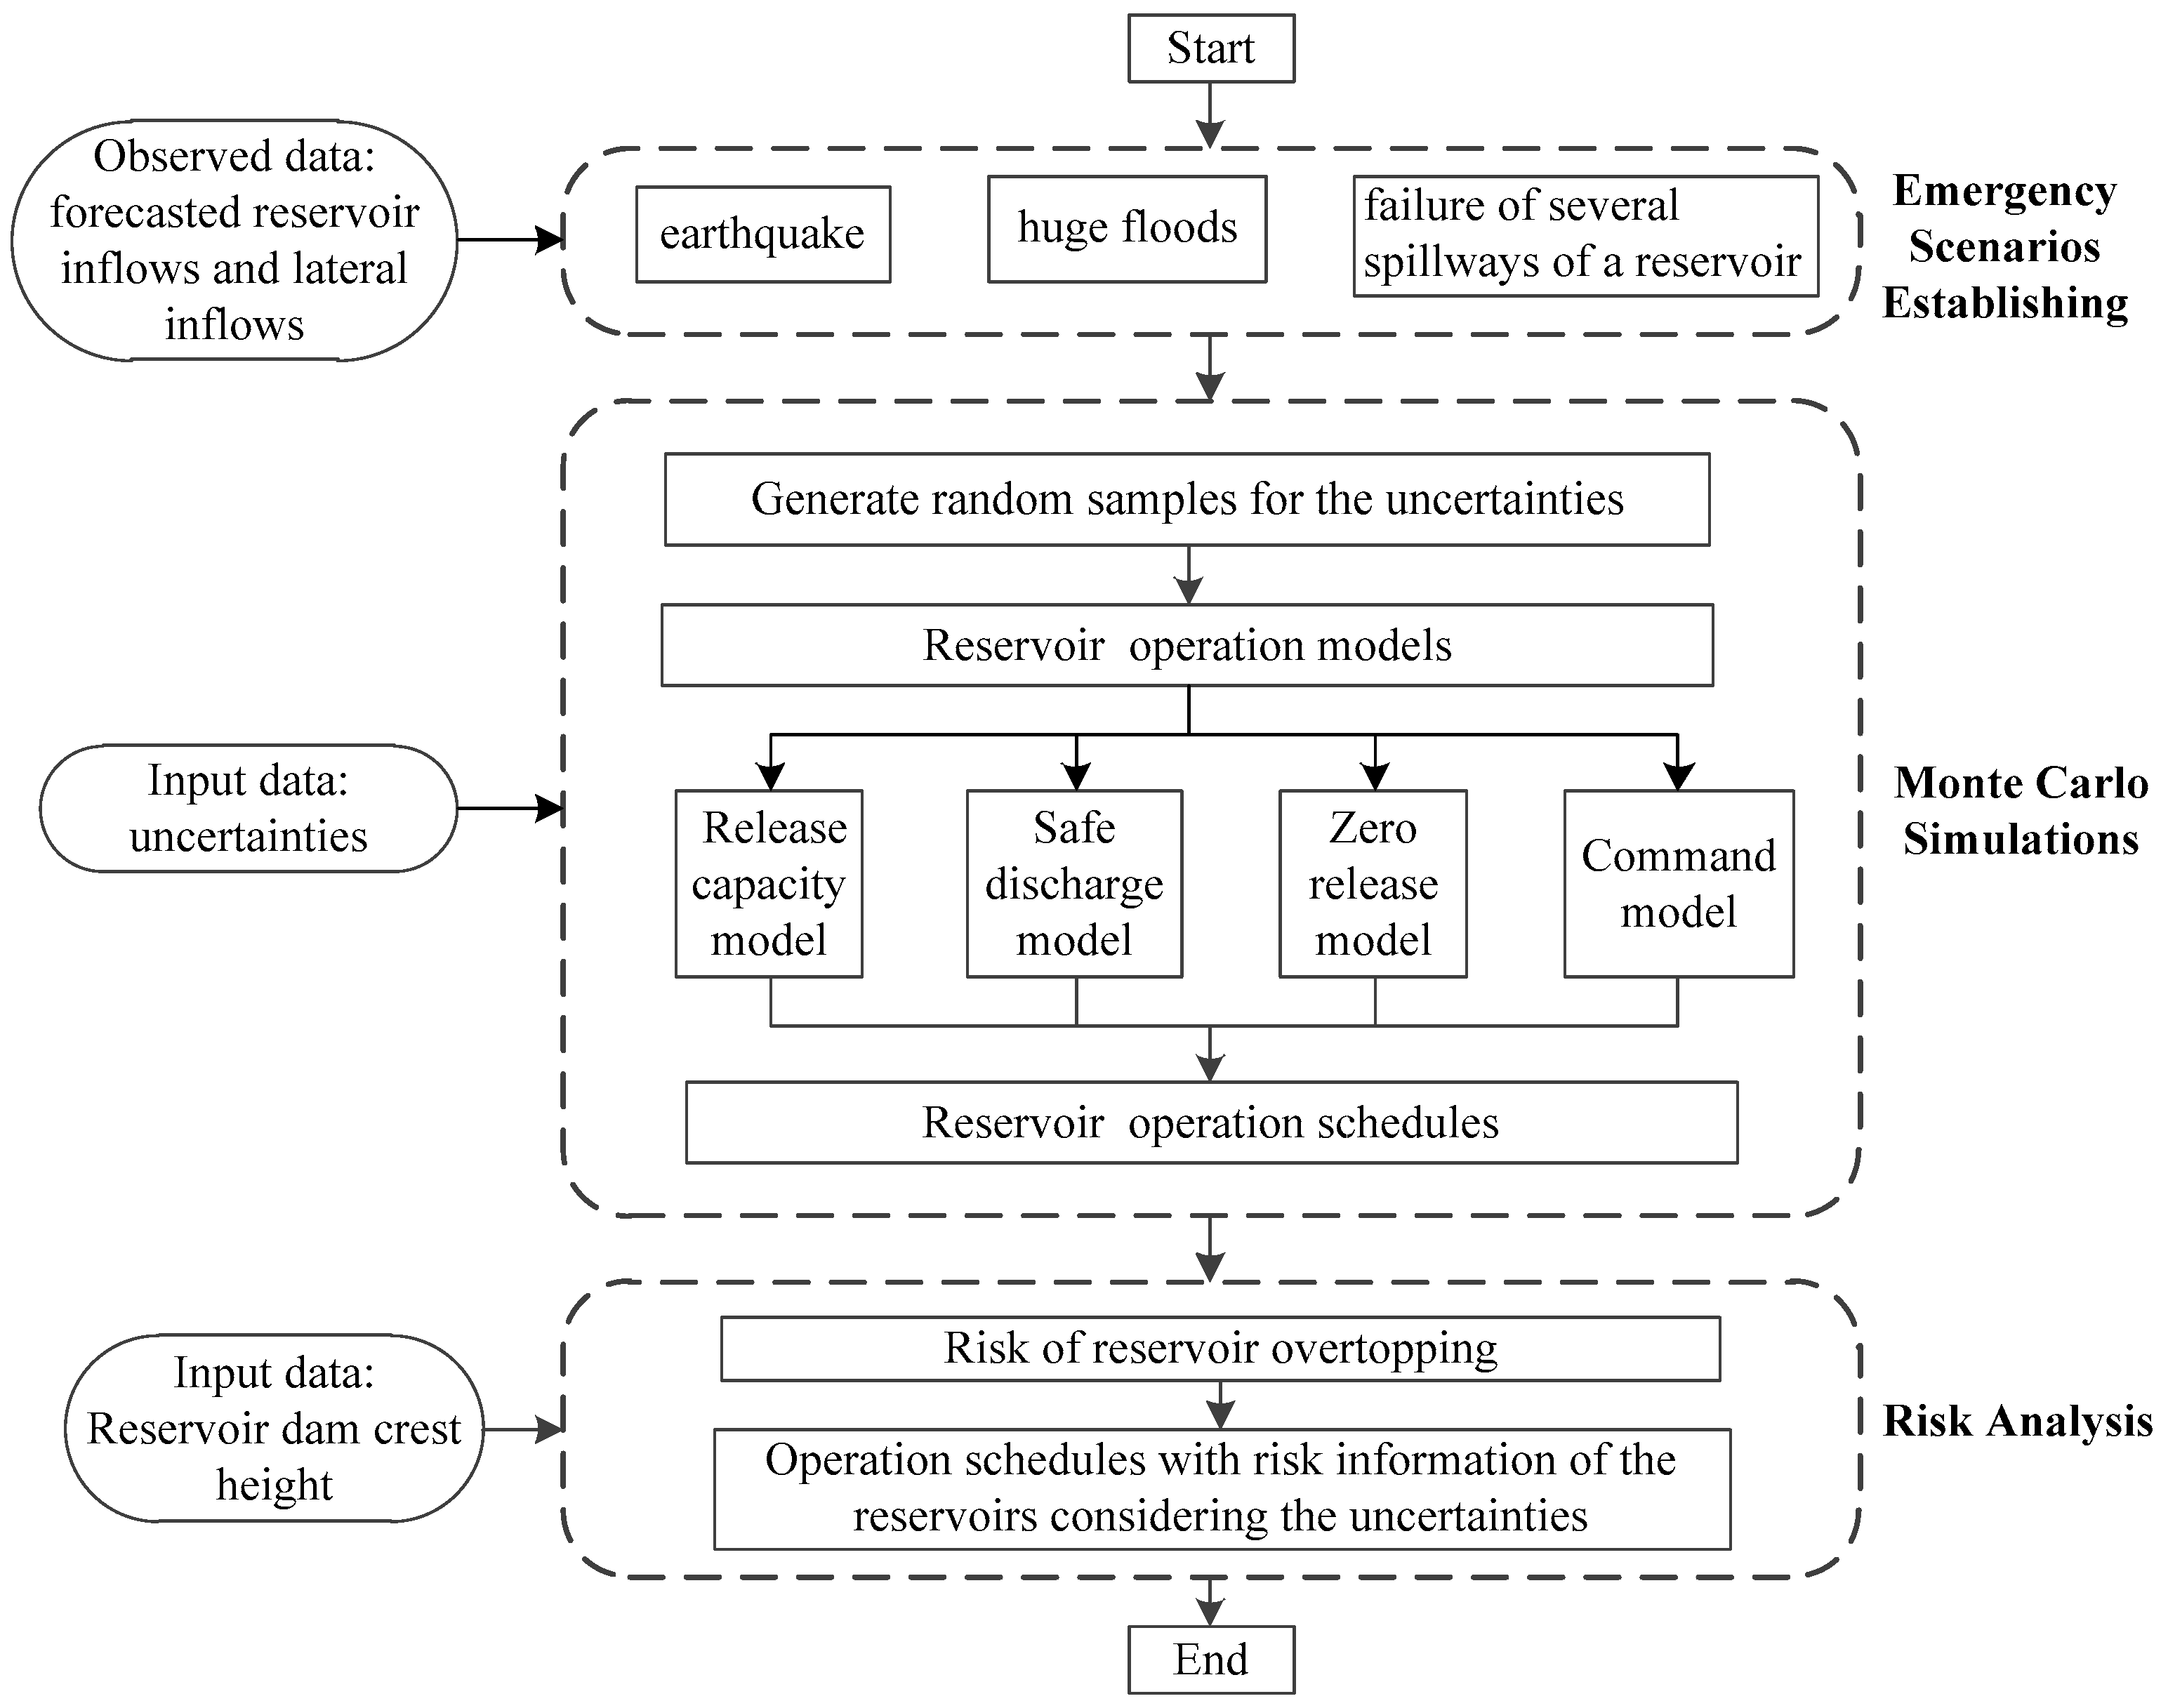
Figure 1 shows the framework of the proposed risk-based model for real-time flood control operation of reservoirs under emergency conditions. As presented in Figure 1, the proposed methodology includes three components: emergency scenarios establishing, Monte Carlo simulations, and risk analysis. The emergency scenarios include earthquakes, extreme floods and failure of spillways of a reservoir. Based on emergency scenarios, the Monte Carlo simulations conduct the real-time flood control operation of reservoirs, considering the uncertainty of reservoir inflows. Then the risk analysis of the operation schedules is carried out and the risk of dam overtopping is calculated. The details of the proposed modules are shown in the following sections.
2.1. Emergency Scenarios Establishing
There are many possible emergency events during the real-time flood control operation of cascade reservoirs, causing serious consequences in social security and economic loss. The paper considers three kinds of emergency events: an earthquake, extreme floods, and failure of spillways of a reservoir. According to these three kinds of emergency events, we have established three following emergency scenarios:
- (1)
- An earthquake triggers the upstream dam break. The upstream dam break causes a dam break flood for the downstream reservoir. The dam break flood is calculated using the Dam Breach Analysis model (DB-IWHR) proposed by Chen et al. [22]. The DB-IWHR can produce reservoir outflow hydrograph by conducting dam breach analysis. DB-IWHR improves the traditional dam breach model in the aspects of broad-crested weir flow analysis, incipient velocity, and shear stress of erosion, soil erosion and breach lateral enlargement model. Chen et al. also developed a transparent spreadsheet (DB-IWHR 2014) for the model, which is coded in Microsoft Excel and VBA (Visual Basic for Applications) programming. The spreadsheet and the user manual for detailed information can be downloaded from the website [23].
- (2)
- Extreme floods include 100-year return period design flood, 1000-year return period design flood and 10,000-year return period design flood.
- (3)
- Some spillways of a dam do not work. As a consequence, the release capacity of the reservoir is reduced.
The mathematical description of the emergency scenarios is expressed as:
where represents an emergency scenario of the reservoir , is the number of reservoirs in the cascade system ( in this paper), is the index of an emergency scenario, and is the number of considered emergency scenarios ( in this paper).
2.2. Monte Carlo Simulations
2.2.1. Uncertainties
The uncertainties considered in this paper are the forecast errors of reservoir inflows, which arise from the model structure and parameter estimation of hydrological forecast models. The stochastic reservoir inflow is expressed as:
where is the stochastic inflow of reservoir i at time t, is the mean of the stochastic inflow of reservoir i at time t, and is the forecast error of reservoir i at time t.
2.2.2. Reservoir Flood Control Operation Models under Emergency Scenarios
The emergency scenarios proposed in Section 2.1 have the characteristics of happening quickly and unexpectedly, causing serious hazards and a high degree of uncertainty. Therefore, we have to establish fast and easy emergency operations to minimize the hazards caused by the emergency events.
The emergency operations should meet the following three principles:
- (1)
- They should ensure the safety of the dam: The reservoir water level cannot exceed the dam crest elevation in the real-time flood control operation of the cascade reservoirs; the emergency responses should maximize the safety of the reservoirs and reduce the risk of sequent dam failures in cascade reservoirs.
- (2)
- The emergency responses should ensure the safety of the downstream city. The maximum flood discharge should not exceed the safety discharge at the downstream control point. If this requirement cannot be guaranteed, then the time duration that the flood discharge exceeds the safety discharge should be minimized in order to reduce the social and economic loss of the downstream city.
- (3)
- If the sequent failures of the dams in the cascade system are inevitable, then the main purpose of the emergency response should be postponing the time that the reservoir overtopping occur as much as possible. In doing so, the decision-makers and the government can have more time to evacuate people and property to reduce the social and economic loss.
According to the above principles, we have proposed the following four operation models, which are fast and easy to implement:
- (1)
- Release capacity model
The reservoir releases water as much as possible using its discharge capacity. This operation model can reduce the risk of the dam overtopping in a very fast and easy way.
- (2)
- Safety discharge model
The maximum release of the reservoir does not exceed the safe discharge of the downstream control point. This operation model is usually used in the situation that the safety of the reservoir is guaranteed. The reservoir can ensure the safety of the downstream city and reduce the social and economic loss of the cascade system and it is not at the expense of the dam safety.
- (3)
- Zero release model
The reservoir does not release any water. This operation model is usually used by the upstream reservoir in the situation that the downstream reservoir has a high risk of dam overtopping. Thus, the upstream reservoir does not release any water to help the downstream reservoir mitigate the emergency situation.
- (4)
- Command model
The reservoir releases water according to the command of the government or experts. This operation model is usually used in the situation that the government issues some discharge limits.
The mathematical description of the emergency operation models is expressed as:
where represents an emergency operation model of the reservoir , is the index of an emergency operation model, and is the number of considered emergency operation models ( in this paper).
According to the above emergency operation models, we calculate the reservoir water levels and releases through reservoir flood routing. The main constraints used in the reservoir flood routing are as follows:
(1) Water balance equation:
where is the inflow of reservoir i at time , is the storage of reservoir i at time , is the release of reservoir i at time , and is the time interval.
(2) Reservoir water level limits:
where is the water level of reservoir i at time , is the lower bound of reservoir i, and is the upper bound of reservoir i.
(3) Reservoir discharge limits:
where is the minimum release of reservoir i, and is the maximum release of reservoir i.
(4) Reservoir release variation constraint:
where is the acceptable maximum variation in two consecutive time periods of reservoir i.
(5) Reservoir release capacity constraint:
where is the release capacity of reservoir i.
2.2.3. Monte Carlo Simulation Considering the Combination of Emergency Scenarios and Uncertainties
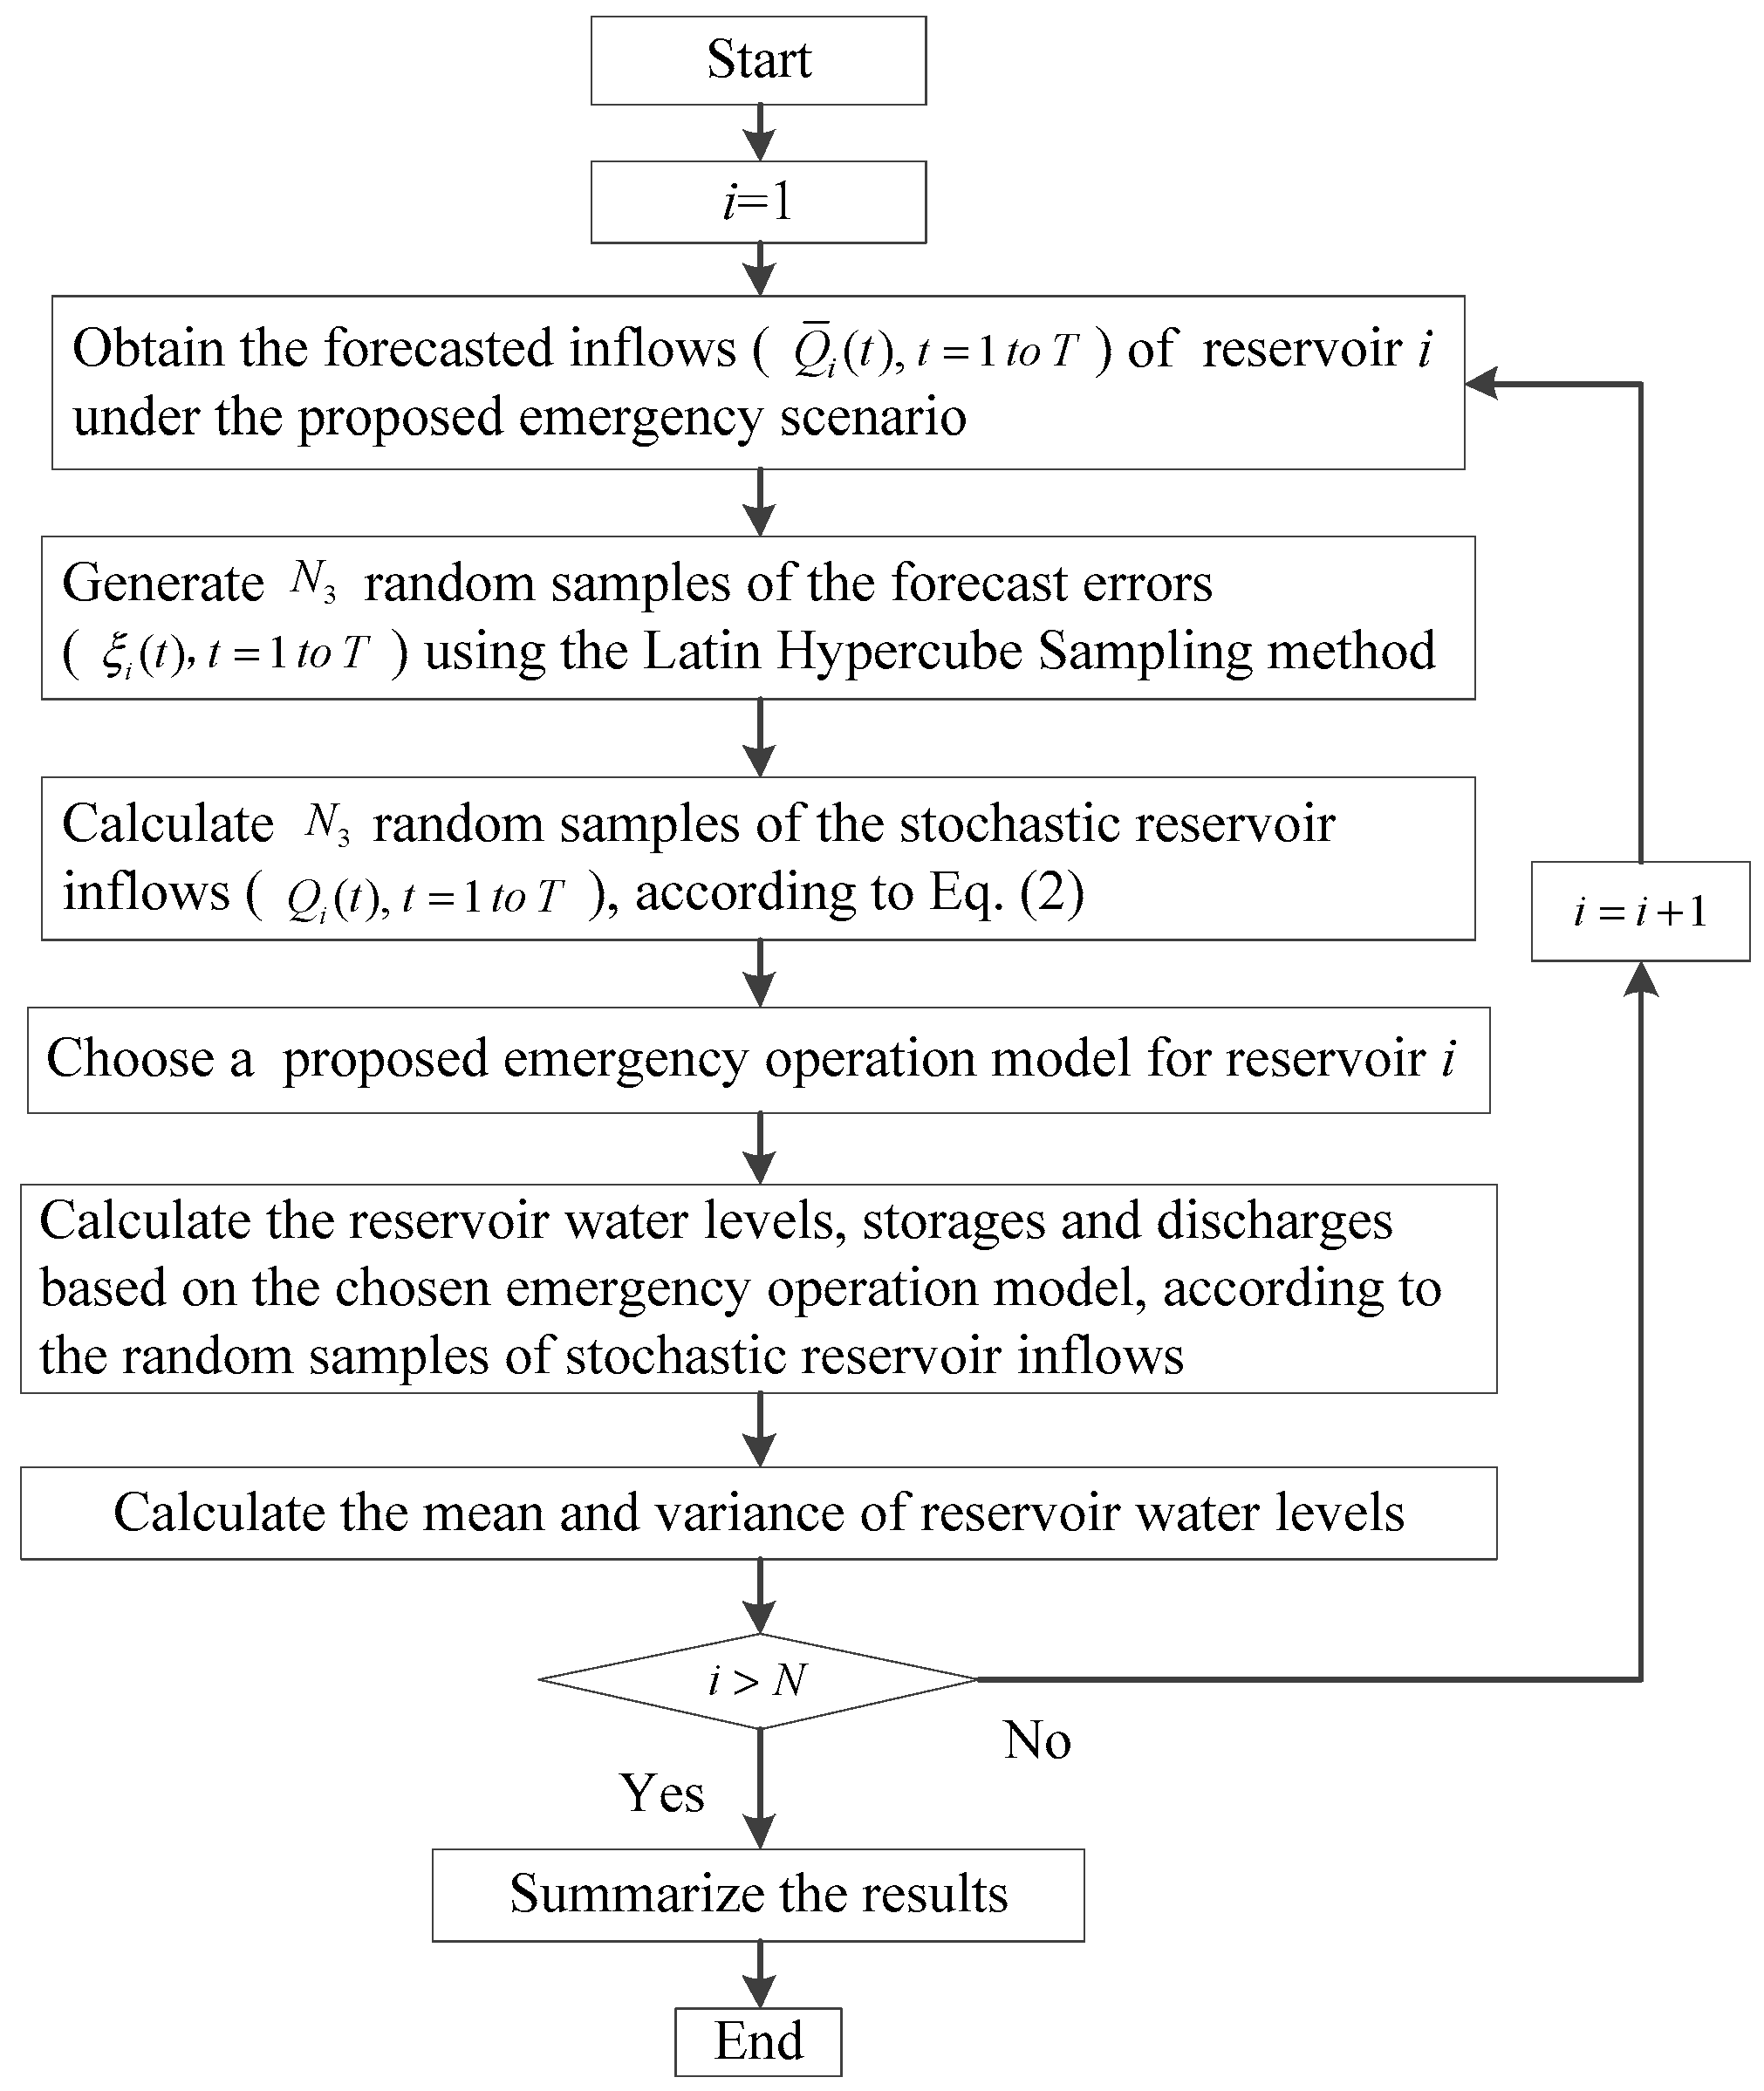
The Monte Carlo simulations calculate specific emergency operation schedules for the reservoirs under the combination of emergency events and uncertainties. The steps are as follows:
- (1)
- Obtain the forecasted inflows () of the reservoirs under the proposed emergency scenarios;
- (2)
- Obtain the probability distributions of the forecast errors ();
- (3)
- Generate the random samples of the forecast errors () using the Latin Hypercube Sampling method;
- (4)
- Calculate the random samples of the stochastic reservoir inflows (), according to Equation (2); and
- (5)
- Calculate the random samples of the reservoir water levels, storages and discharges through reservoir flood routing. The reservoir flood routing is conducted using the proposed emergency operation models.
The flowchart of the Monte Carlo simulations is shown in Figure 2.
2.3. Risk Analysis
The risk of the reservoir is defined as the overtopping probability, which is the probability that the loading L exceeds the resistance R, i.e., the probability of failure [24]. In this paper, the loading of a reservoir is considered as the reservoir water level. The resistance is the selected safe water level, such as the reservoir dam crest height. The risk of reservoir i at time t is defined as:
where is the risk of reservoir i at time t, is the selected safe water level of reservoir i, refers to the random samples () of the water levels of reservoir i, is the number counted as .
As the stochastic reservoir water level during each time period can exceed the selected safe water level, the integrated risk of the whole emergency event is defined as the sum of the individual risk events during the flood event, expressed as:
where is the integrated risk of reservoir i, is the time duration of the emergency event, refers to the individual risk event of at time t.
Therefore, we can calculate the risk of the reservoirs at time period and the integrated risk of the whole emergency event according to Equations (9) and (10), with the results from Monte Carlo simulations.
3. Case Study
3.1. Study Area
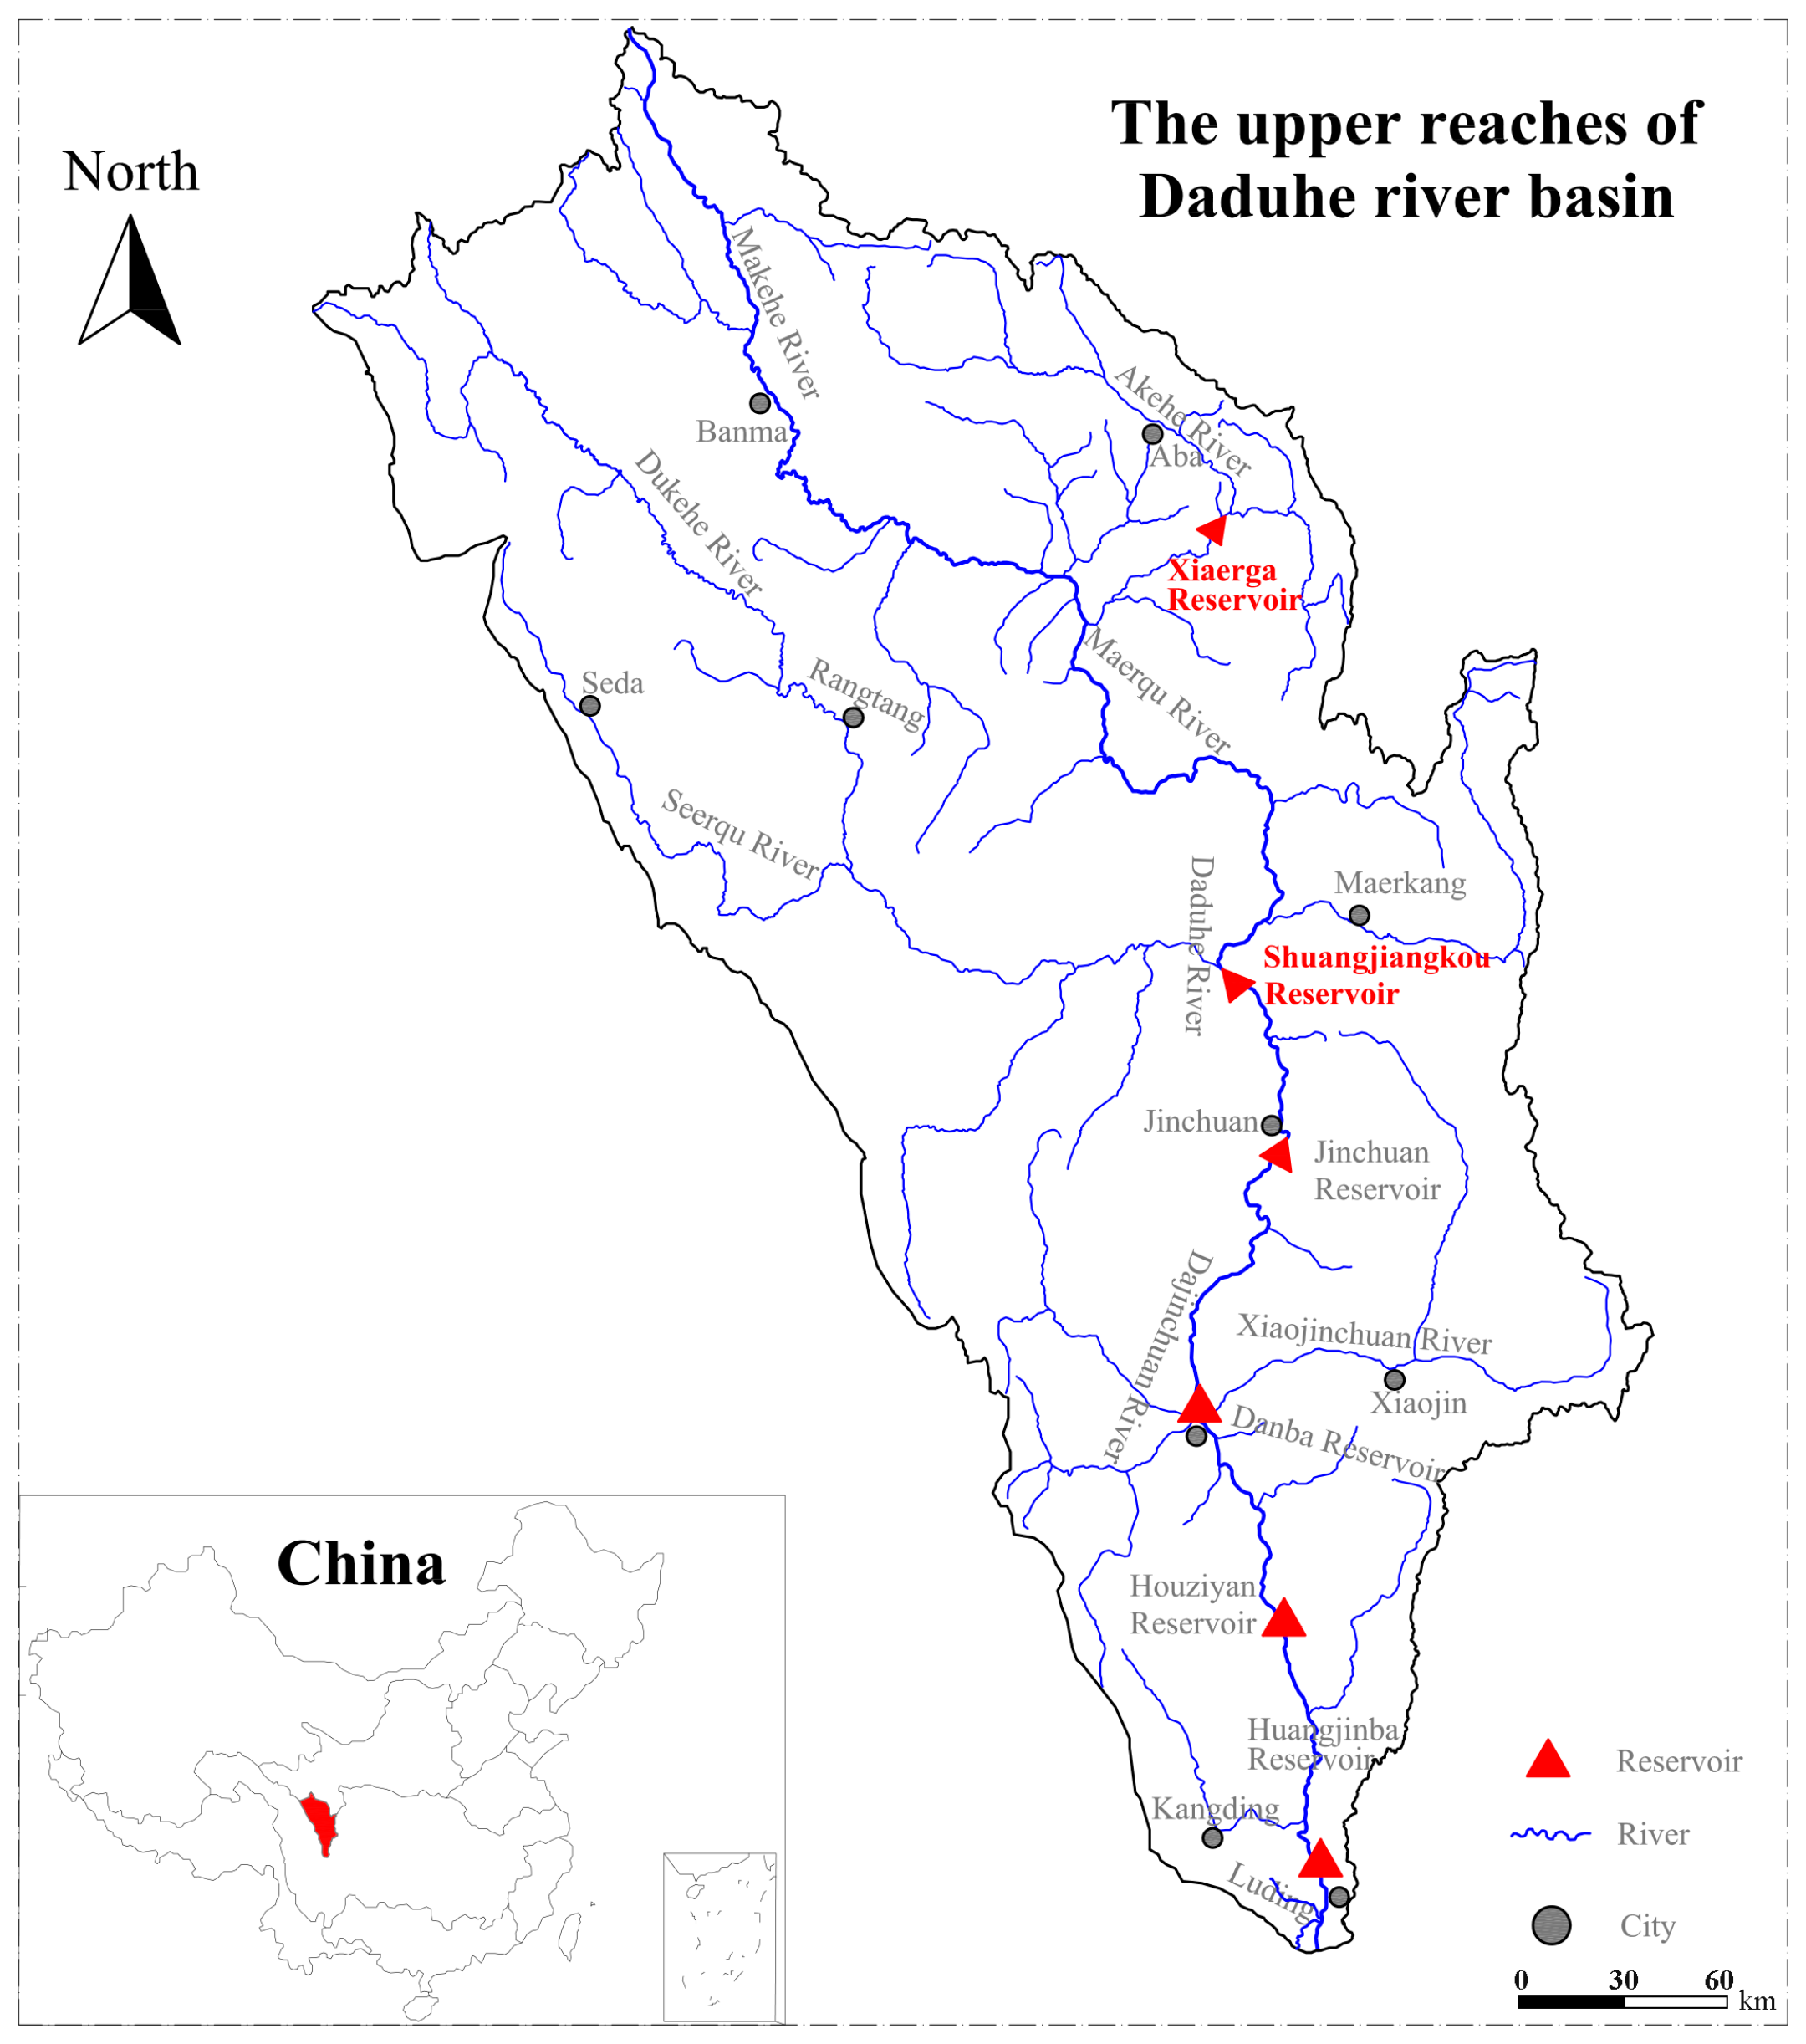
We perform a case study in the Daduhe River Basin, which is an important part of Yangtze River Basin of China, as shown in Figure 3. The upper reaches of the Daduhe River Basin are characterized by a plateau climate while the middle and lower reaches are characterized by a subtropical humid climate. The average annual precipitation in the upper reaches of the basin is around 600–700 mm.
We concentrate on the cascade system that consists of two reservoirs: Xiaerga reservoir and Shuangjiangkou reservoir, as shown in Figure 3. The Xiaerga reservoir is a large scale hydropower station, which is located in the lower reaches of the Ake River and the Maerqu River. It is an earth and rockfill dam. The permanent structures of the Xiaerga reservoir include a dam, power generation buildings, a fixed-crest spillway and gated spillway tunnels. There are strong geological tectonic movements in the bank area of Xiaerga reservoir, which might cause landslide, collapse, and debris flow. The Shuangjiangkou reservoir is also a large scale hydropower station, which is located in the Daduhe River. The controlled river basin area of the Shuangjiangkou reservoir is 39,330 km2, accounting for 50.8% of the entire area of Daduhe River Basin. The permanent structures of the Shuangjiangkou reservoir include an earth and rockfill dam, power generation buildings, gated cave spillways and spillway tunnels.
The main characteristics of the cascade reservoirs are shown in Table 1.
3.2. Data and Parameters
3.2.1. Data and Parameters for the Scenario of Upstream Dam Break
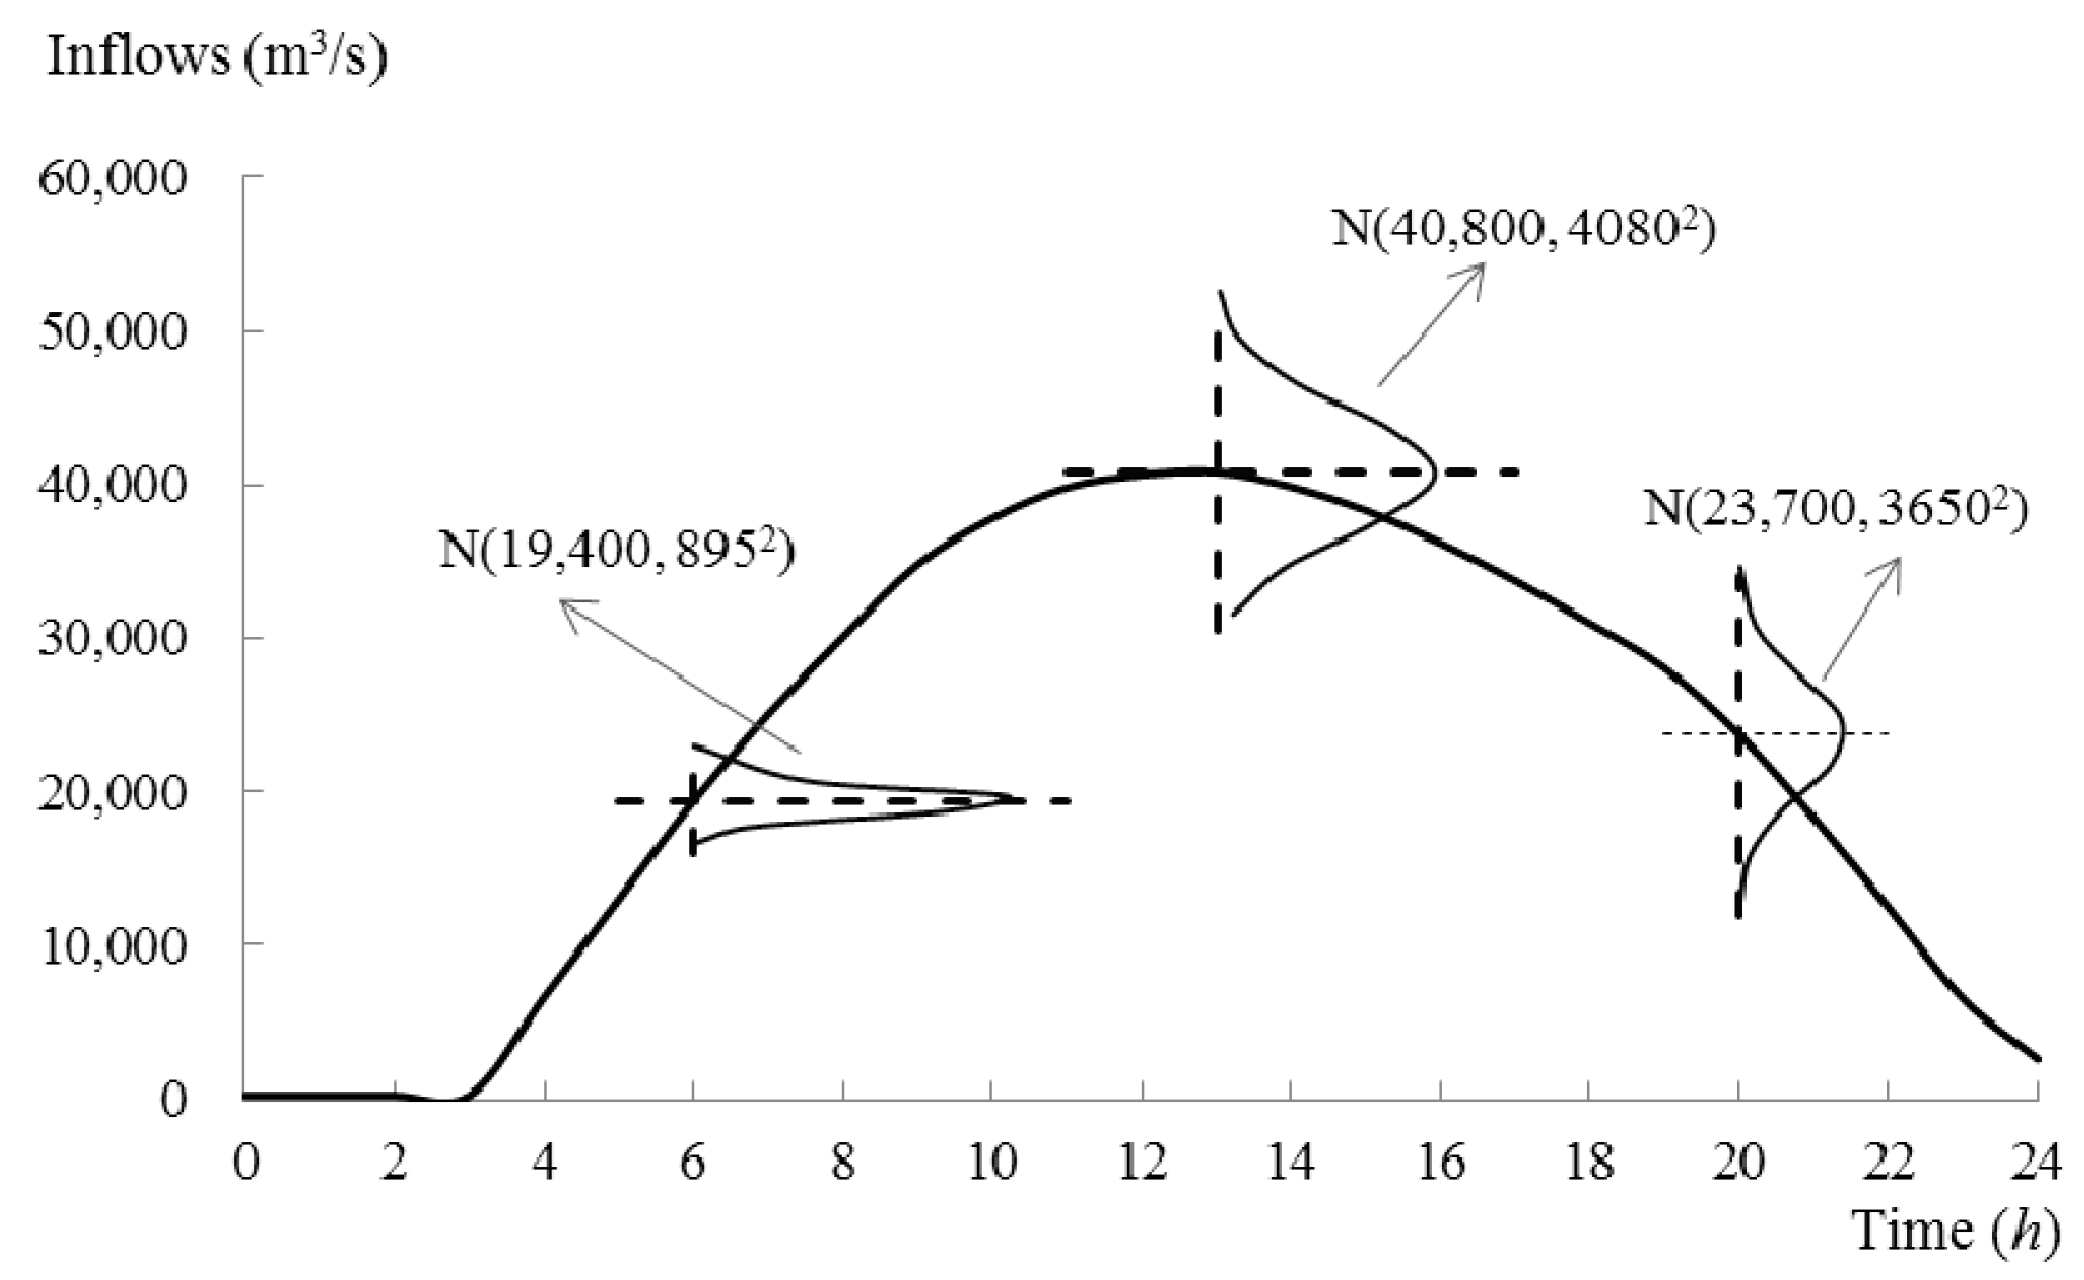
The Xiaerga reservoir is assumed to have a breach lateral enlargement due to the collapse of the channel wall. The dam break flood of the Xiaerga reservoir is calculated using the DB-IWHR 2014 spreadsheet [22]. In this paper, the forecast errors () of the reservoir inflows are assumed to follow normal distributions, recommended by the Ministry of Water Resources (MWR) of China in 2000 [9,25,26]. If sufficient historical flood data are available, the distribution parameters of the inflow forecast errors can be calculated through goodness-of-fit tests [19]. Due to the lack of sufficient historical data, we express the uncertainty of inflow forecast error as . The term is the time at which the forecasted flood peak of the inflows occurs. The distributions of inflow forecast errors at other moments are calculated through Equation (11), assuming that the relative errors of the forecasted inflows increase linearly with time [20]:
where is the standard deviation of the relative errors of the forecasted inflows of the Shuangjiangkou reservoir at time , () is the time at which the forecasted flood peak of the inflows occurs, and () is the time duration.
According to the DB-IWHR 2014 spreadsheet and Equation (11), the inflows and their distribution parameters of the Shuangjiangkou reservoir are obtained as shown in Figure 4. The flood peak discharge is 40,800 m3/s and the time interval is 1 h.
As Figure 4 shows, the forecast precision is higher and the variance of the inflow forecast errors is larger as the forecast lead time moves forward. Thus, the stochastic inflows change in a much larger range around their average.
We selected two operation models for the Shuangjiangkou reservoir: the release capacity model and the command model. We compared the flood control operation results and risk analysis results of the two models. The initial water levels are both 2440 m a.s.l. for the two models. The description of the command model is as follows: if the water levels are below 2504 m a.s.l., then the reservoir releases are equal to 7000 m3/s in order to protect the downstream city; if the water levels are above 2504 m a.s.l., then the reservoir releases water using its discharge capacity.
3.2.2. Data and Parameters for the Scenario of Extreme Flooding
The extreme flooding scenarios considered in this paper are 100-year return period design flood, 1000-year return period design flood and 10,000-year return period design flood. It is noted that the above design floods are obtained from the typical flood hydrograph of the reservoir according to an improved homogeneous frequency enlargement method [27]. The forecasted error distributions of the floods at each moment are also obtained through Equation (11). The initial water levels for the three extreme floods are all 2480 m a.s.l.
3.2.3. Data and Parameters for the Scenario of Spillway Failure
The scenario of spillway failure includes the reduction by 50% of the reservoir release capacity, the reduction by 25% of the reservoir release capacity, compared with the scenario of no spillway failure. The adjusted release capacity curves of the Shuangjiangkou reservoir are shown in Figure 5. The 100-year return period design flood is used as the inflows of the Shuangjiangkou reservoir under the scenario of spillway failure, and the initial water level is 2480 m a.s.l.
4. Results
4.1. The Results for the Scenario of Upstream Dam Break
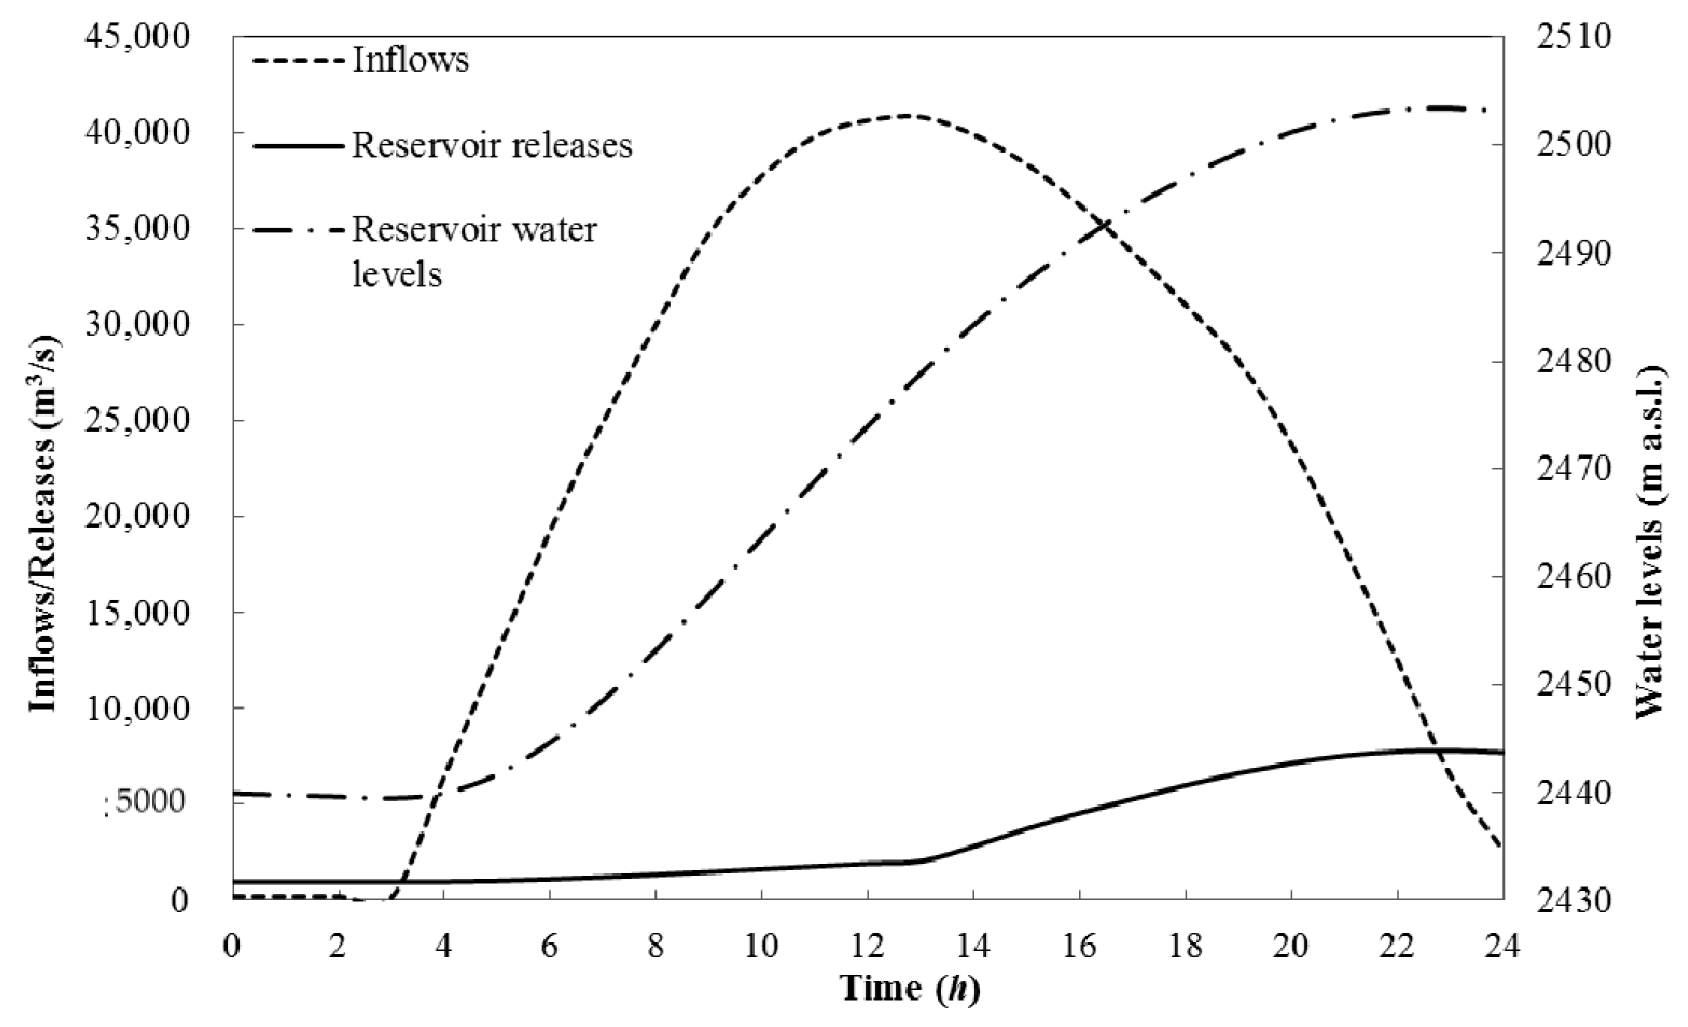
4.1.1. The Results Using the Release Capacity Model
According to the data and parameters in Section 3.2.1 and the Monte Carlo Simulation steps in Figure 2, the reservoir flood routing of the Shuangjiangkou reservoir is carried out using the release capacity model. The random samples of the forecast errors are generated using the Latin Hypercube Sampling method whose accuracy has been demonstrated by many scholars [28,29]. The number of the random samples is 10,000 which is selected by converge of the risk values.
Figure 6 shows the mean processes of reservoir releases and water levels.
The distribution parameters of the stochastic water levels of Shuangjiangkou reservoir are also calculated according to the method proposed, as shown in Table 2.
As Table 2 shows, the mean of the reservoir water level at the time () of flood peak discharge is 2478.95 m a.s.l., and the mean of the maximum reservoir water level is 2503.44 m a.s.l. with the time index of .
The reservoir water level errors are assumed to follow normal distributions, and then the K-S test is carried out for the goodness-of-fit. The reservoir water level errors follow normal distributions at the significance level of 0.05. We set different safe water levels for the reservoir and calculate the corresponding risks according to Equations (9) and (10). The relationship curve between the integrated risk of the entire flood and the selected safe water levels is drawn in Figure 7.
As Figure 7 shows, the integrated risk of the Shuangjiangkou reservoir decreases when the selected safe water level increases. This means that the probability that the stochastic reservoir water levels exceed the selected safe water level decreases when the selected safe water level increases.
In order to evaluate the impacts of the reservoir initial water levels on the integrated risk of reservoir overtopping, we set four initial water levels (2440, 2444.5, 2442, and 2443 m a.s.l.) for the Shuangjiangkou reservoir. Then the relationship curves between the integrated risks of the entire flood and the selected safe water levels are calculated and drawn with the four initial water levels, as shown in Figure 7. By trial-and-error, the maximum initial water level of the Shuangjiangkou reservoir is 2447 m a.s.l. using the release capacity model. This means that using the release capacity model, if the initial water level of the Shuangjiangkou reservoir exceeds 2447 m a.s.l. then it will have a risk of reservoir overtopping under the emergency condition that an earthquake triggers the dam break of the Xiaerga reservoir.
In order to assess the impacts of the uncertainties on the integrated risk of reservoir overtopping, we set five standard deviations of the relative errors of the forecasted inflows (0.08, 0.09, 0.10, 0.11, and 0.12) for the Shuangjiangkou reservoir. Then the relationship curves between the integrated risks of the entire flood and the selected safe water levels are calculated and drawn with the five standard deviations, as shown in Figure 8.
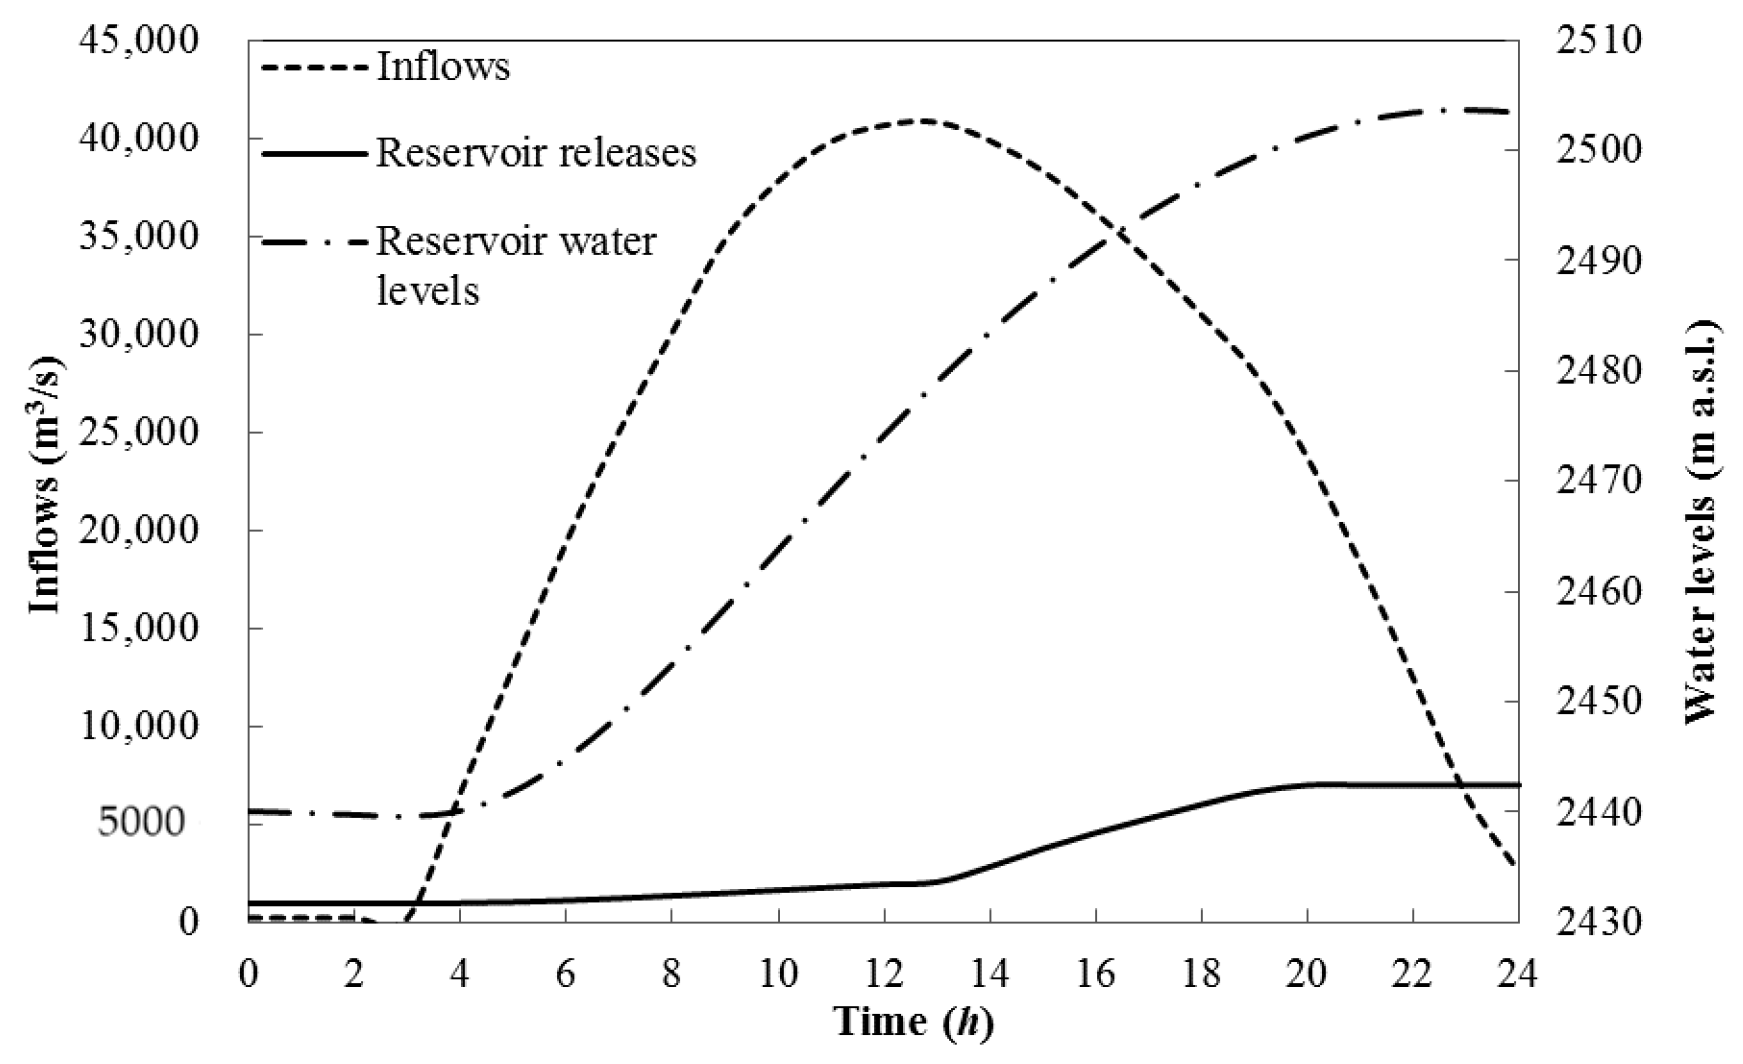
4.1.2. The Results Using the Command Option
The flood control operation results using the command model are shown in Figure 9.
The distribution parameters of the stochastic water levels of Shuangjiangkou reservoir are also calculated according to the method proposed, as shown in Table 3.
As Table 3 shows, the mean of the reservoir water level at the time () of flood peak discharge is 2478.95 m a.s.l., and the mean of the maximum reservoir water level is 2503.62 m a.s.l. with the time index of .
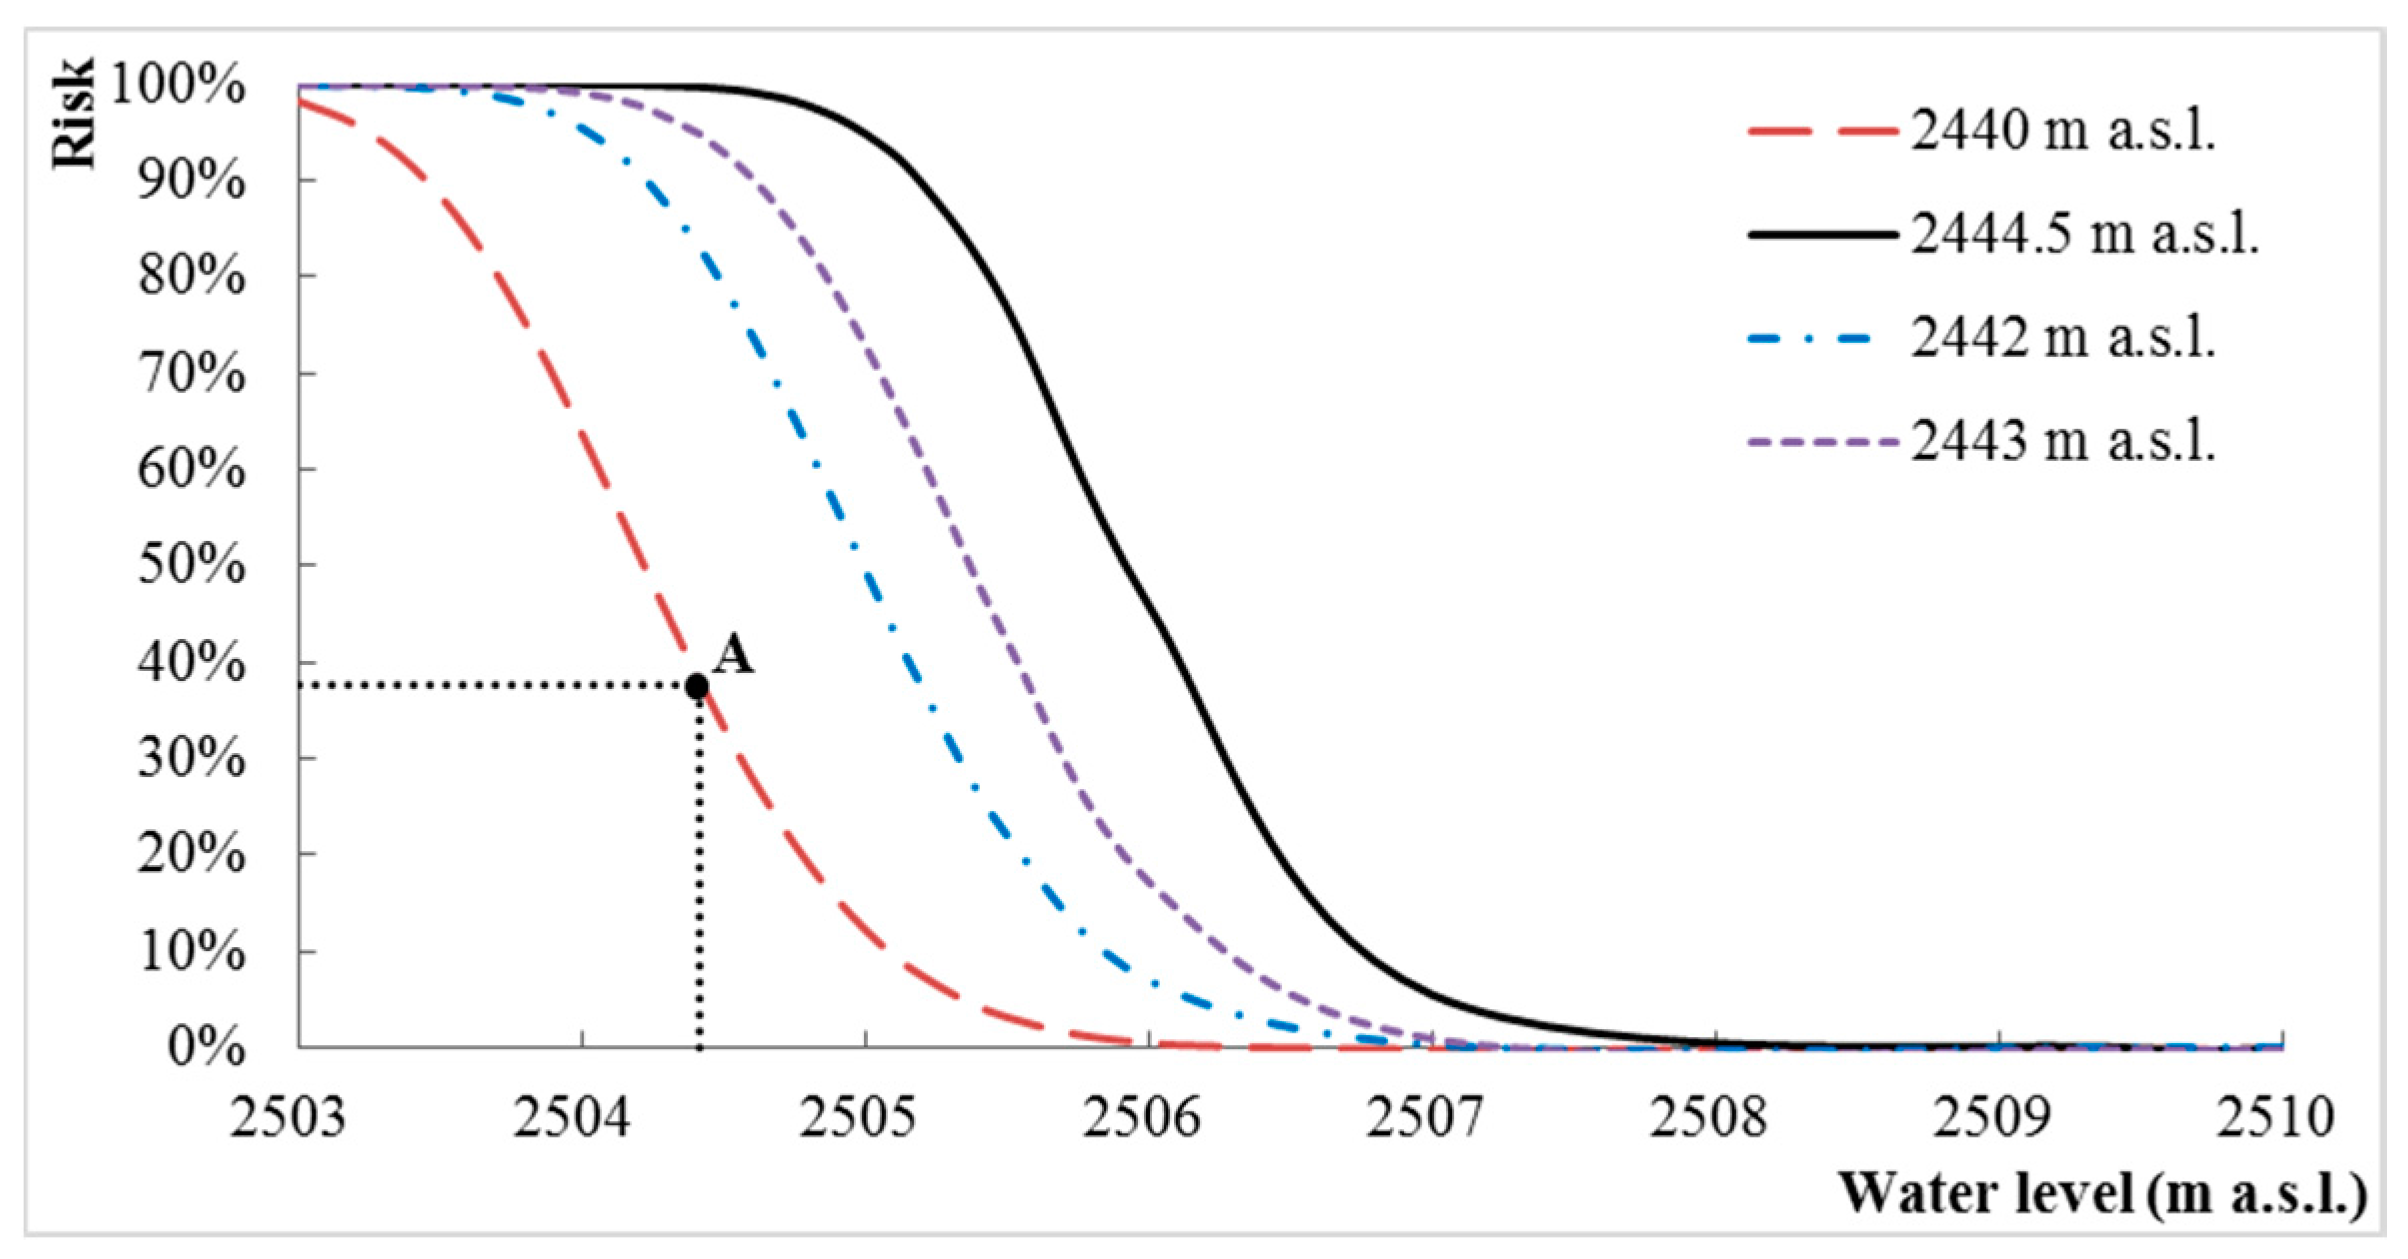
We set different safe water levels for the reservoir and calculate the corresponding risks according to Equations (9) and (10). The relationship curves between the integrated risk of the entire flood and the selected safe water levels is drawn in Figure 10.
In order to evaluate the impacts of the reservoir initial water levels on the integrated risk of reservoir overtopping, we also set four initial water levels (2440, 2444.5, 2442, and 2443 m a.s.l.) for the Shuangjiangkou reservoir using the command model. Then the relationship curve between the integrated risk of the entire flood and the selected safe water levels are drawn with the four initial water levels, as shown in Figure 10. By trial-and-error, the maximum initial water level of the Shuangjiangkou reservoir is and is 2444.5 m a.s.l. using the command model. This means that using the command model, if the initial water level of the Shuangjiangkou reservoir exceeds 2444.5 m a.s.l. then it will have a risk of reservoir overtopping under the emergency condition that an earthquake triggers the dam break of the Xiaerga reservoir.
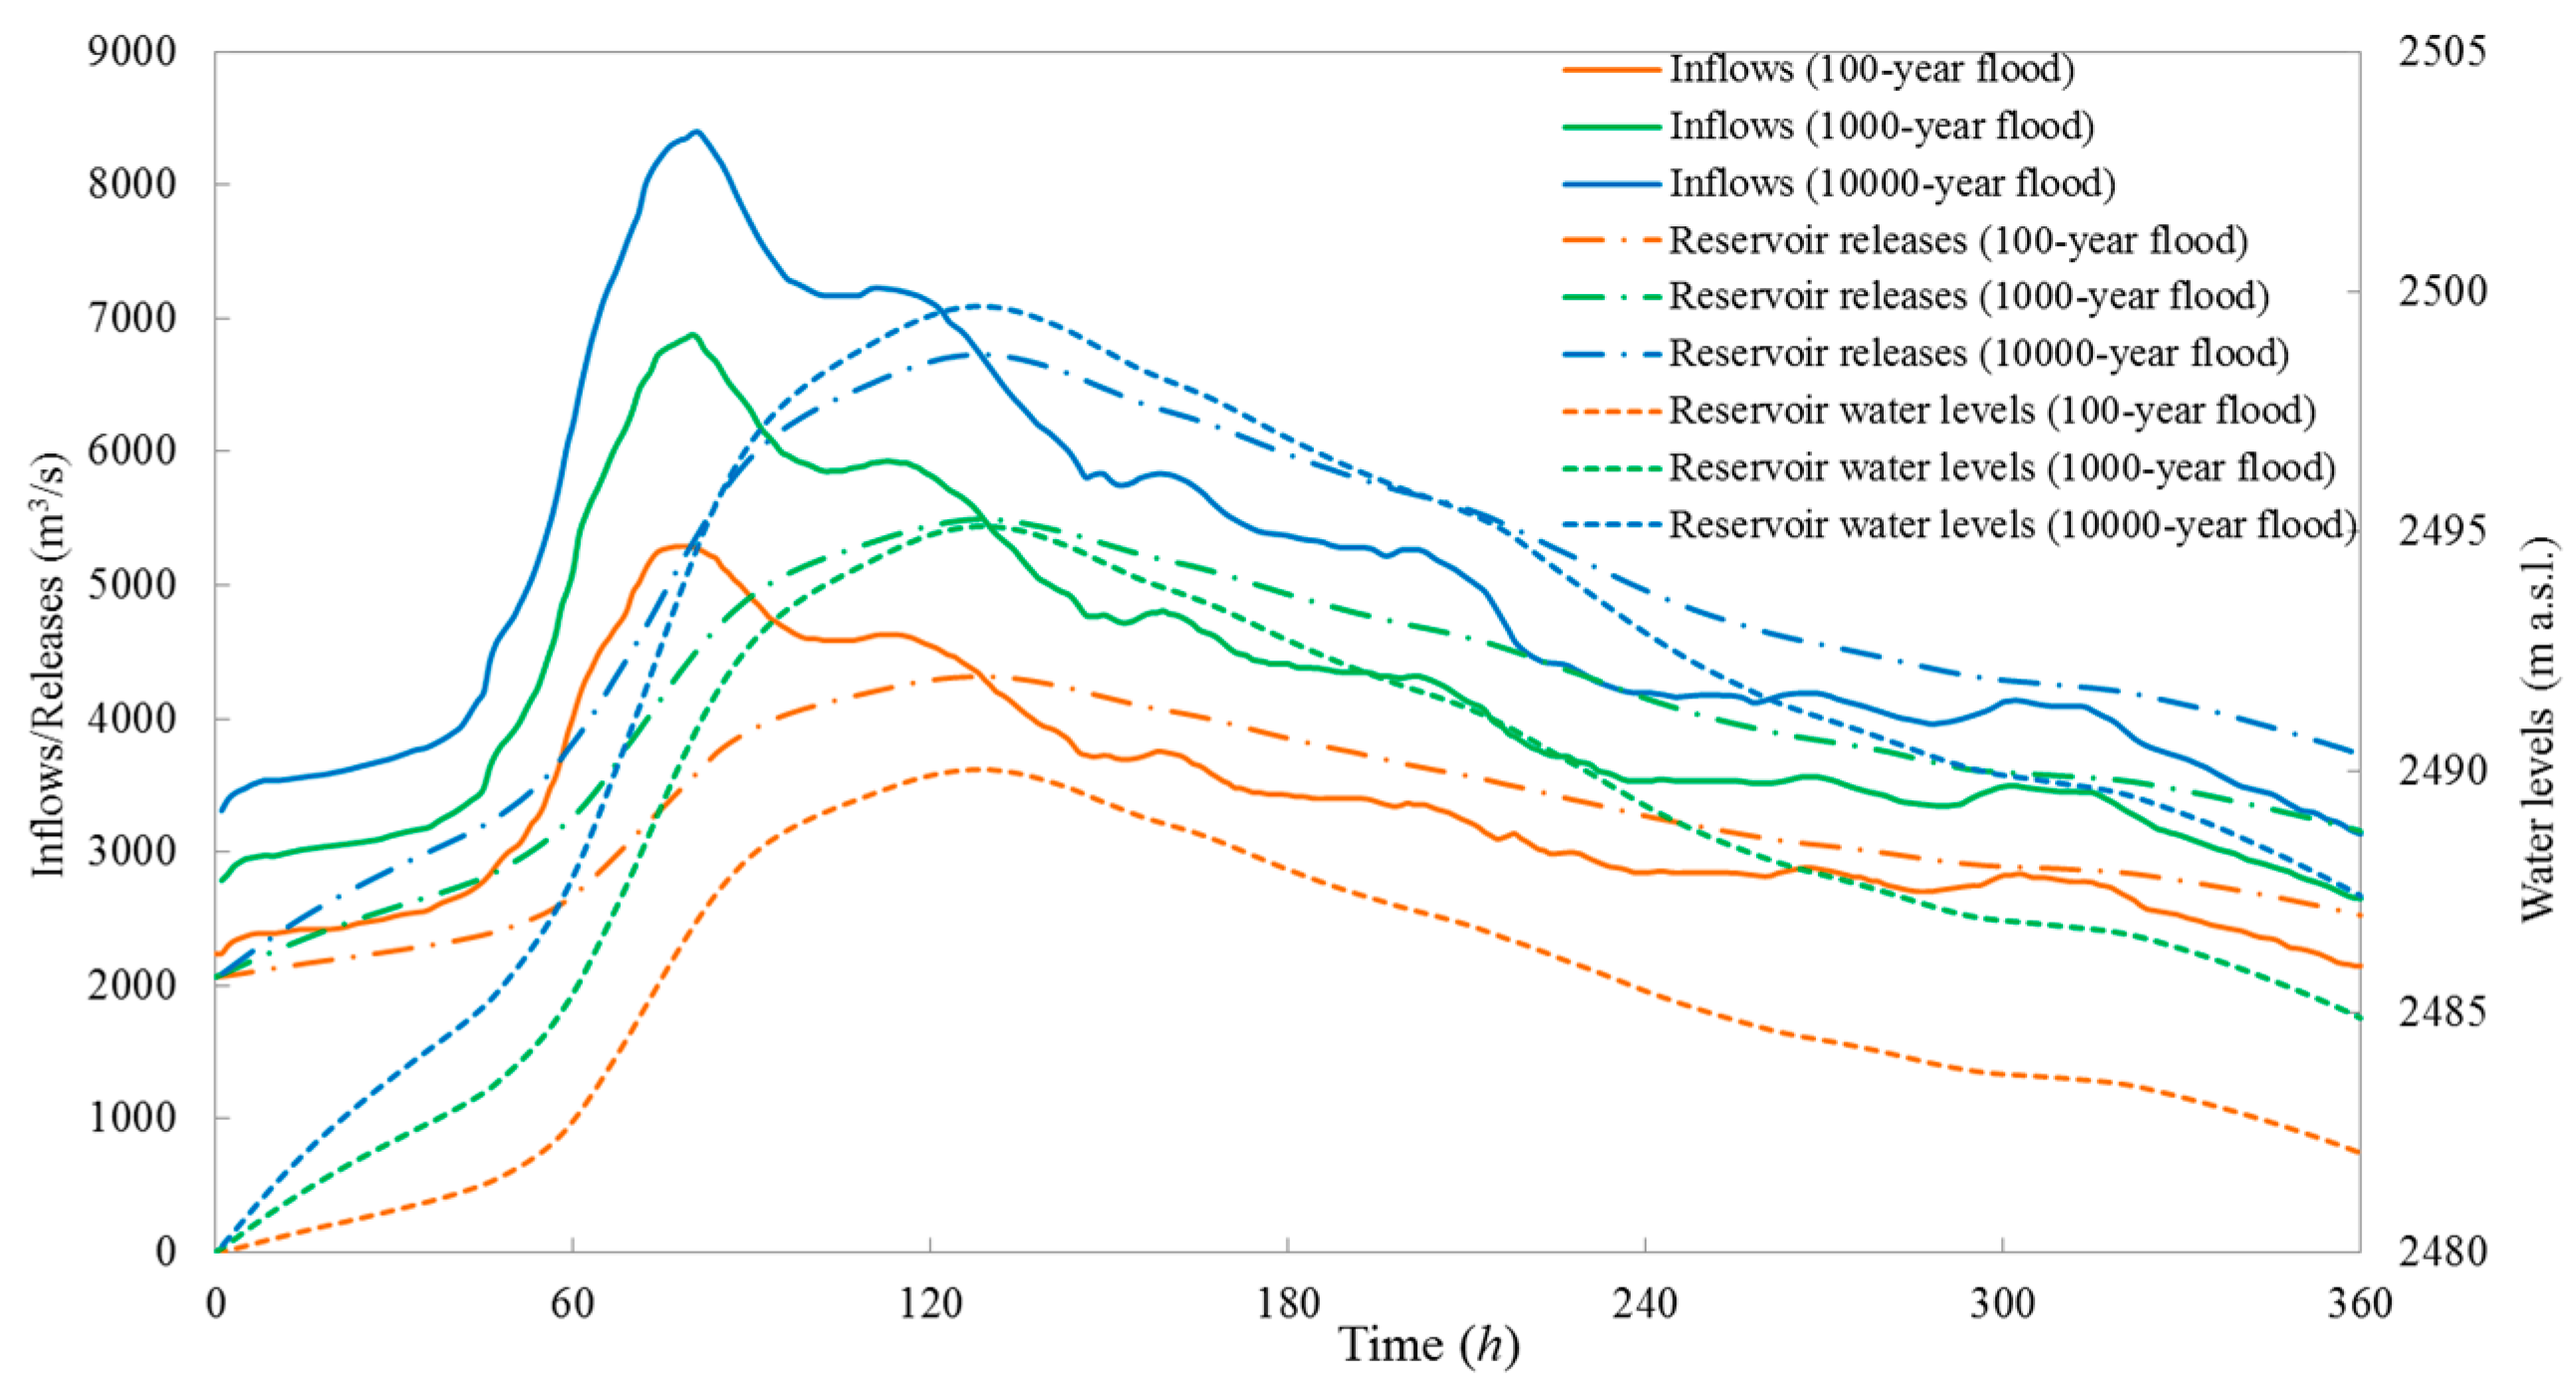
4.2. The Results for the Scenario of Extreme Flooding
According to the data and parameters in Section 3.2.2 and the Monte Carlo Simulation steps in Figure 2, the reservoir flood routing of the Shuangjiangkou reservoir is carried out using the release capacity model. Figure 11 shows the mean processes of reservoir releases and water levels of the designed floods.
The distribution parameters of the stochastic water levels of Shuangjiangkou reservoir are also calculated according to the method proposed, and then we set different safe water levels for the reservoir and calculate the corresponding risks according to Equations (9) and (10). The relationship curves between the integrated risk of the entire flood and the selected safe water levels under the scenario of extreme flooding are drawn in Figure 12.
4.3. The Results for the Scenario of Spillway Failure
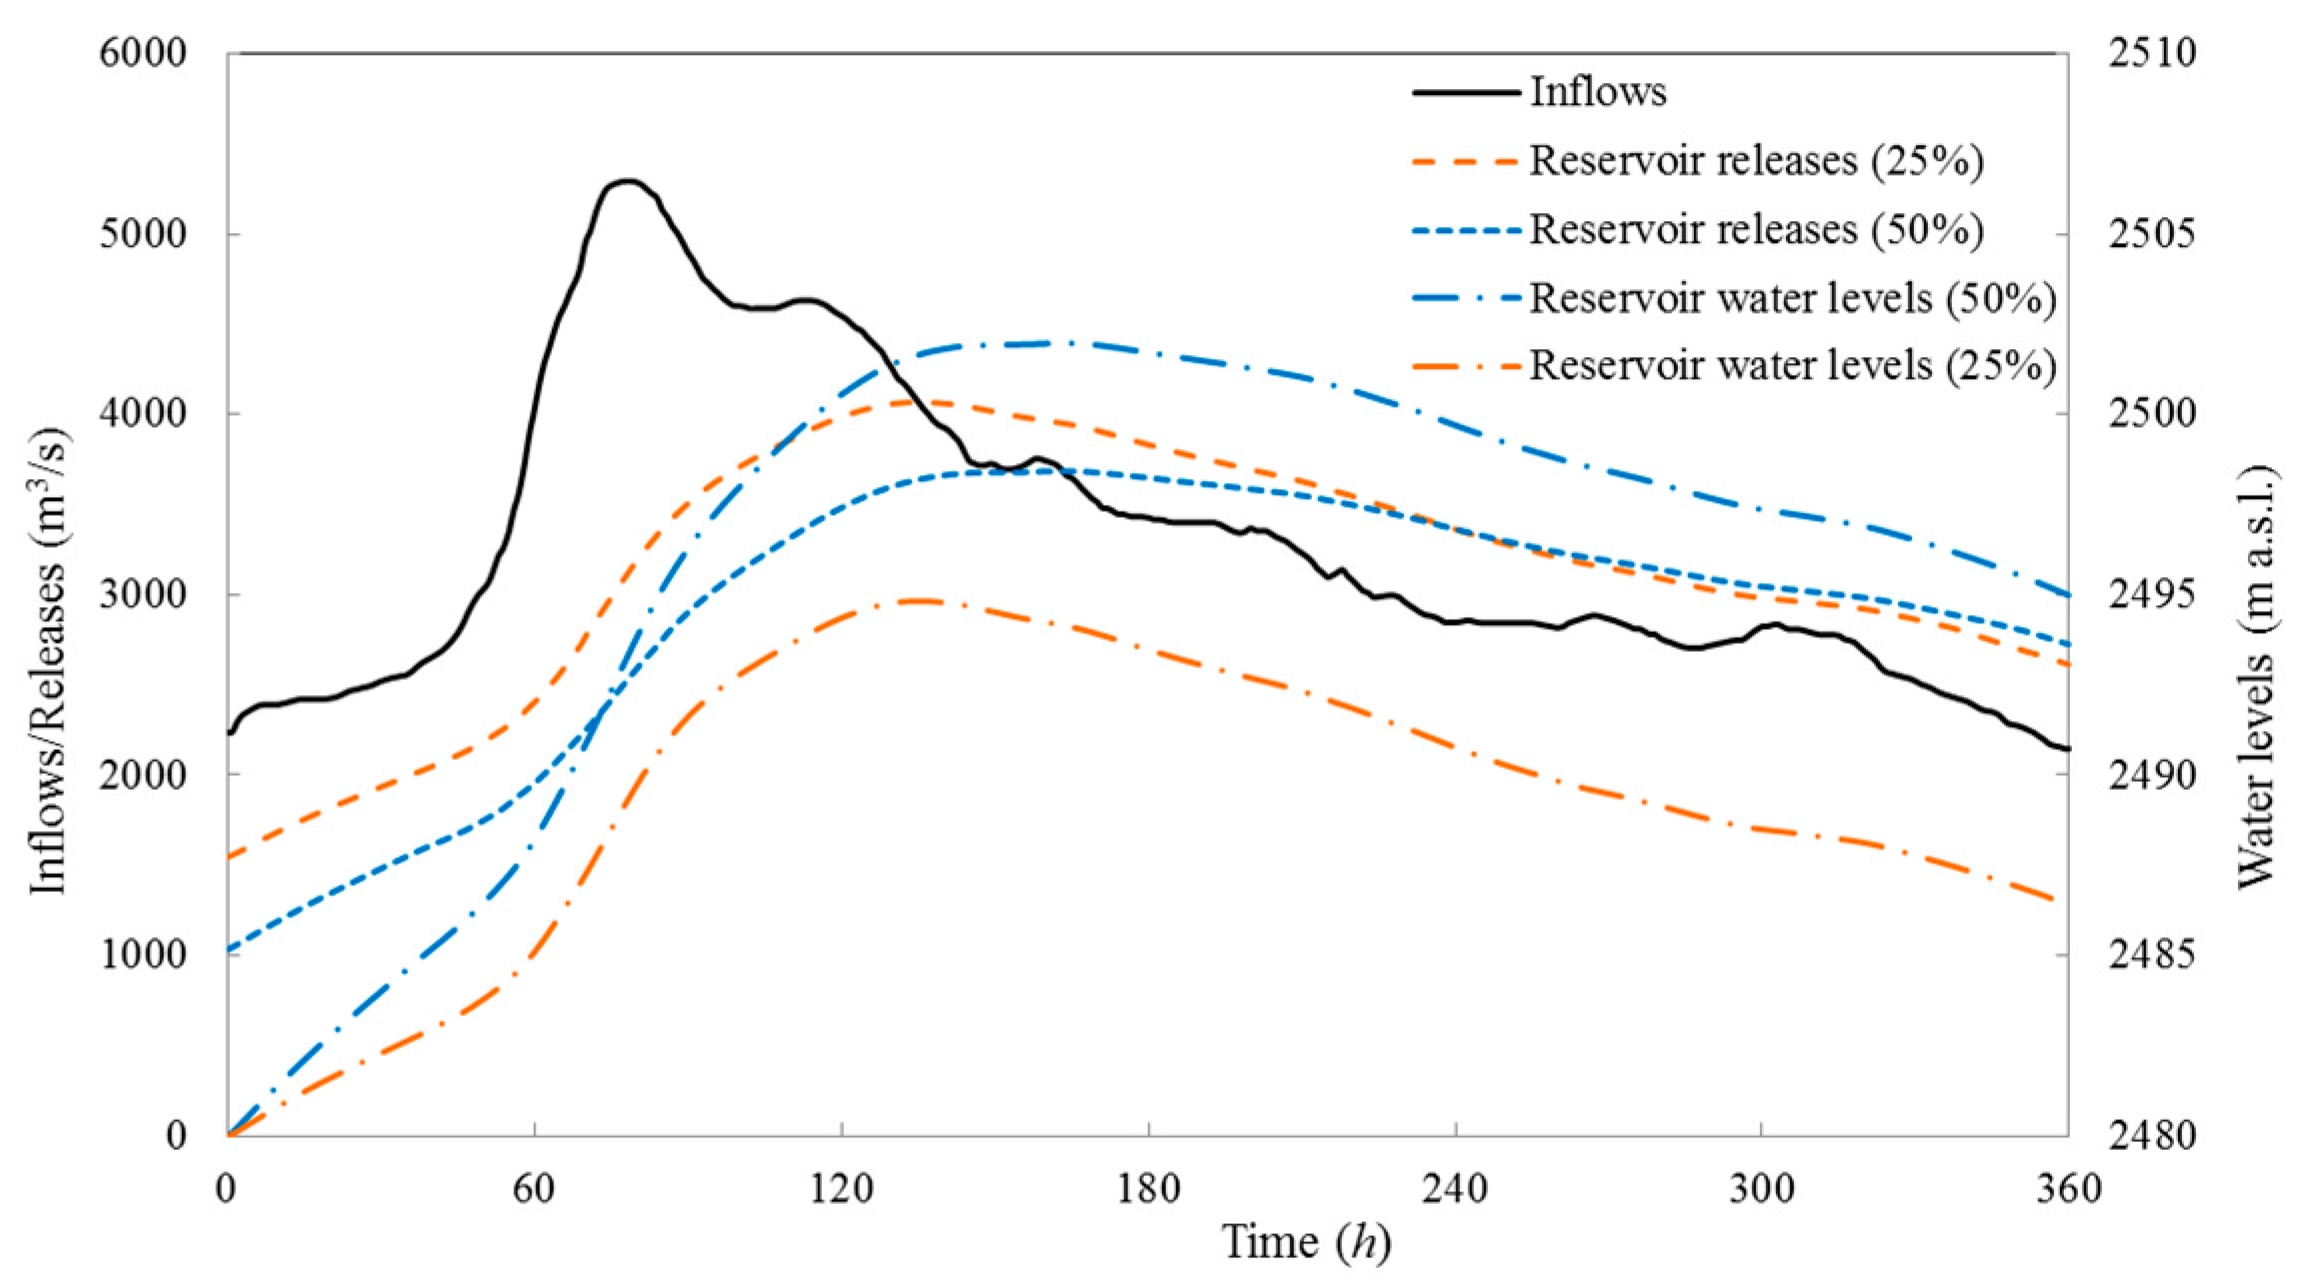
According to the data and parameters in Section 3.2.3 and the Monte Carlo Simulation steps in Figure 2, the reservoir flood routing of the Shuangjiangkou reservoir is carried out using the release capacity model. Figure 13 shows the mean processes of reservoir releases and water levels under the scenarios of reductions by 25% and 50% of the reservoir release capacity.
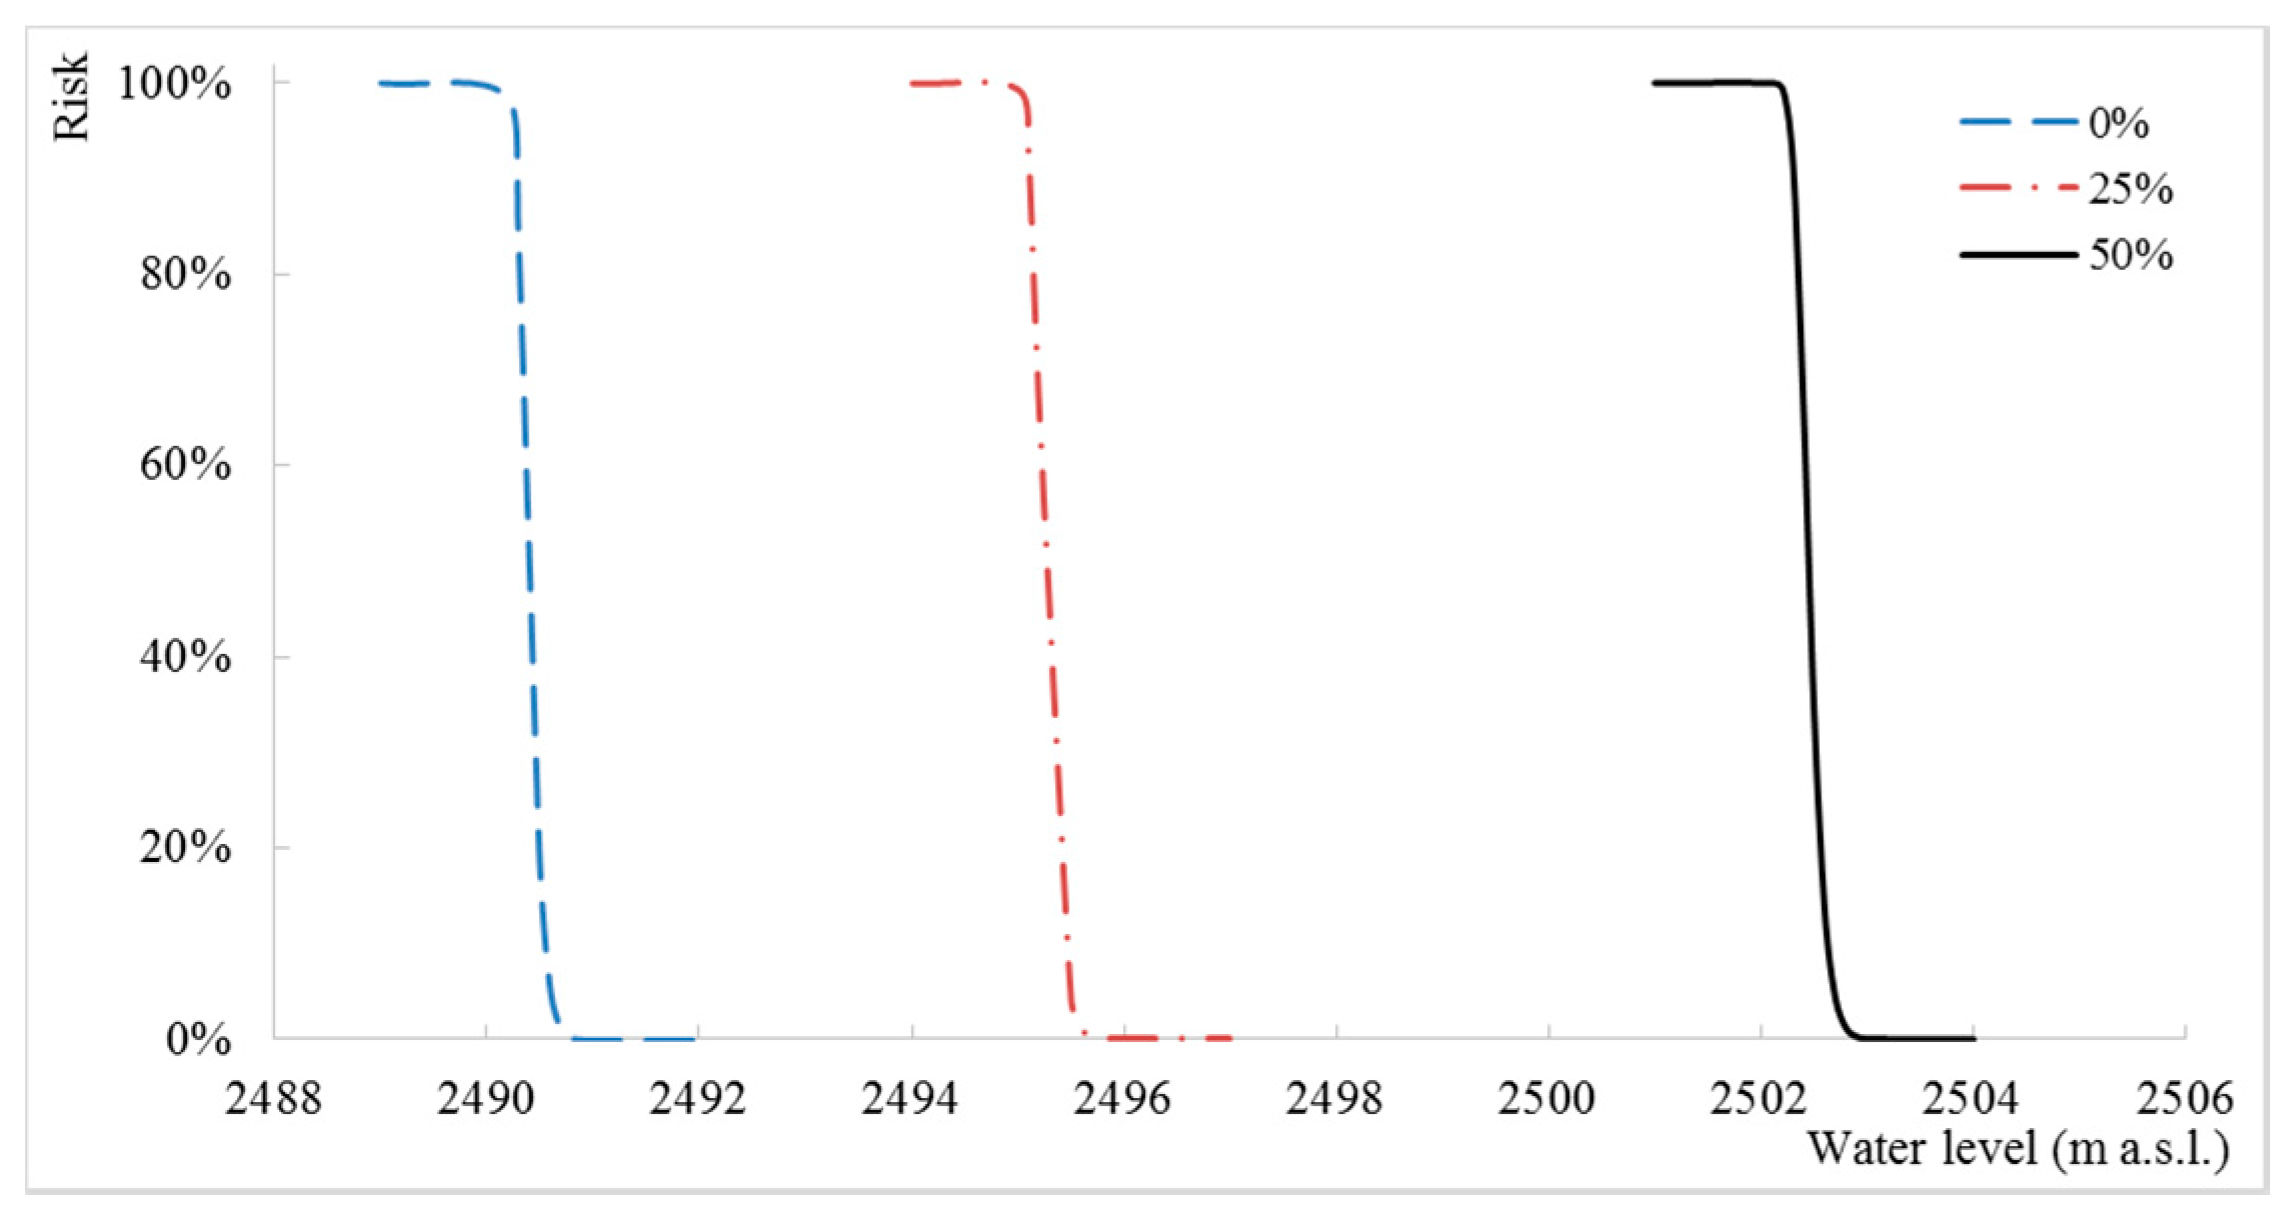
The distribution parameters of the stochastic water levels of Shuangjiangkou reservoir are also calculated according to the method proposed, and then we set different safe water levels for the reservoir and calculate the corresponding risks according to Equations (9) and (10). The relationship curves between the integrated risk of the entire flood and the selected safe water levels under the scenario of spillway failure are drawn in Figure 14.
5. Discussion
We draw some important conclusions from the results:
As Figure 8 shows, the integrated risk of the reservoir increases when the standard deviation of the relative errors of the forecasted inflows increases. It means that the risk of reservoir overtopping increases with the uncertainty degree of the reservoir inflows. The decision-makers can reduce the risk of reservoir overtopping by improving the accuracy of the forecasted reservoir inflows.
As Figure 12 shows, the integrated risk of the reservoir increases with the return period of the extreme floods. As Figure 14 shows, the integrated risk of the reservoir increases with the reduced percentage of the reservoir release capacity.
The proposed risk-based model for the real-time flood control operation of reservoirs under emergency conditions can provide important information about risks to decision-makers for conducting emergency operations. The potential applications are as follows:
(1) Application 1 can calculate the risk that the stochastic water levels of the reservoir exceed the safe reservoir water level under the emergency scenarios.
For example, the probability that the stochastic water levels of Shuangjiangkou reservoir exceed 2504.42 m a.s.l. is 23.39% using the release capacity model under the emergency scenario that an earthquake triggers the dam break of the upstream reservoir, as shown in point B of Figure 7. This means that, using the release capacity model, the risk that the stochastic water levels of Shuangjiangkou reservoir exceed the design flood water level is 23.99%. This is due to the uncertainty factors and the upstream dam break.
The probability that the stochastic water levels of the Shuangjiangkou reservoir exceed 2504.42 m a.s.l. is 37.77% using the command model under the emergency scenario that an earthquake triggers the dam break of the upstream reservoir, as shown in point A of Figure 10. This means that, using the command model, the risk that the stochastic water levels of the Shuangjiangkou reservoir exceed the design flood water level is 37.77% due to the uncertainty factors and the upstream dam break. Thus, the risk using the command model is 14.38% more than the risk using the release capacity model.
(2) Application 2 can provide the risk of reservoir overtopping of the reservoir under the emergency condition that an earthquake triggers the dam break of the upstream reservoir.
For example, the probability that the stochastic water levels of Shuangjiangkou reservoir exceed the dam crest elevation (2510 m a.s.l.) is 0 using the release capacity model, as shown in Figure 7. This means that the Shuangjiangkou reservoir does not have a risk of reservoir overtopping if it uses the release capacity model under the emergency condition that an earthquake triggers the dam break of the Xiaerga reservoir.
The probability that the stochastic water levels of Shuangjiangkou reservoir exceed the dam crest height (2510 m a.s.l.) is also 0 using the command model, as shown in Figure 10. Therefore, using the command model does not increase the risk of reservoir overtopping of the Shuangjiangkou reservoir. However, the command model can mitigate the emergency flood control situation for the downstream city simultaneously when guaranteeing the safety of the dam. This is because the maximum release of the Shuangjiangkou reservoir using the command model is smaller than that using the release capacity model as shown in Figure 6 and Figure 9.
(3) Application 3 can calculate the maximum initial water level of the reservoir under the emergency conditions in order to avoid the risk of reservoir overtopping.
The maximum initial water level of the Shuangjiangkou reservoir is 2447 m a.s.l. using the release capacity model and is 2444.5 m a.s.l. using the command model under the scenario of upstream dam break. Therefore, the decision-makers can choose the best operation model according to the actual initial water level of the reservoir. It should be noted that the flood control level is over the maximum initial water levels we proposed. This is because that the maximum initial water levels proposed in this paper are calculated using the release capacity operation model and the command operation model, which are special for emergency events, while the flood control level is calculated according to the normal operation rules and design floods of the reservoir.
There are some limitations to the methodology used, and further research could focus on them. For instance, the initial reservoir level could have been probabilistically assessed from observed reservoir levels’ time series [30,31] or from regular operation simulation [32]. The spillway reliability can be assessed through different methodologies as a fault tree analysis combined with an expert judgment [31,32]. Regarding to the flood control operation models and the assessment of the overtopping risk associated, stochastic parametric procedures [33,34] or probabilistic-multiobjective procedures [35,36] could have been accounted for. The proposed model is mainly used for the cascade reservoirs during flood season and its suitability in other situations could be evaluated. Finally, there is uncertainty in the determination of extreme floods [37] that could be studied in order to be incorporated within the proposed methodology in further studies.
6. Conclusions
In this paper, the research on the real-time flood control operation of reservoirs under the combination of the emergency conditions and uncertainties is carried out. The main points and conclusions are summarized as follows:
- (1)
- We considered the emergency events including the upstream dam break triggered by an earthquake, extreme floods and failure of some spillways of a reservoir and the uncertainty of reservoir inflows.
- (2)
- We developed a risk-based model for real-time flood control operation of reservoirs under the combination of these emergency conditions and uncertainties.
- (3)
- We calculated the risk of reservoir overtopping of a reservoir under the combination of an emergency condition and uncertainties. We suggested the maximum initial water levels of a reservoir for each operation model in order to avoid the risk of reservoir overtopping.
- (4)
- We applied the proposed model to the cascade reservoir system in the upper reaches of Daduhe river basin in China. The results show that the integrated risk of the reservoir increases with the initial reservoir water level, increases with the uncertainty degree of the reservoir inflows, increases with the return period of the extreme floods, and also increases with the reduced percentage of the reservoir release capacity. The maximum initial water level of the Shuangjiangkou reservoir is 2447 m a.s.l. using the release capacity model and is 2444.5 m a.s.l. using the command model under the scenario of upstream dam break. The decision-makers can choose the best operation model according to the actual initial water level of the reservoir.
Acknowledgments
This study is supported by the National Key R & D Program of China (grant 2017YFC0405606), National Natural Science Foundation of China (grant 51579068), and the China Postdoctoral Science Foundation (grants 2017M621612 and 2017M611864). We also thank David Navar for the English revision, and acknowledge the editors and the anonymous reviewers for their valuable comments and suggestions.
Author Contributions
This research was carried out in collaboration among all authors. Juan Chen, Ping-an Zhong and Xin-yu Wan had the original concept for the study and conducted the research; and Man-lin Wang, Fei-lin Zhu, and Yu Zhang conducted the case study of the proposed method.
Conflicts of Interest
The authors declare no conflict of interest.
References
- Tong, R.-P.; Chen, D.-W. Accident Risk Analysis and Flood Control Operation of Cascade Reservoir. China Saf. Sci. J. 2009, 19, 119–124. (In Chinese) [Google Scholar]
- Song, E.-L. Analysis of Several Dam Accidents in China. Dam Saf. 2000, 14, 41–44. (In Chinese) [Google Scholar]
- Qin, H.-Y.; Wang, X.-J.; Yang, L. Analysis of Dam Failure in China. J. Yellow River Conserv. Tech. Inst. 2008, 20, 4–6. (In Chinese) [Google Scholar]
- Federal Emergency Management Agency (FEMA). Federal Guidelines for Dam Safety Risk Management; Rep. FEMA P-1025; United States Department of Homeland Security: Washington, DC, USA, 2015.
- Long, W.-F.; Huang, J.-C. Comparative Analysis of Emergency Plans for Fighting Against Floods Between the US and China. China Water Resour. 2007, 2, 49–51. (In Chinese) [Google Scholar]
- Wang, B.; Feng, P. Emergency operation model for cascade reservoirs and its risk evaluation. J. Hydraul. Eng. 2011, 42, 218–225. (In Chinese) [Google Scholar]
- Zhou, X.-B.; Chen, Z.-Y.; Wang, L.; Deng, G.; Sha, P.-J.; Li, S.-Y. Risk analysis and emergency actions for Hongshiyan Barrier Lake. Nat. Hazards 2015, 79, 1933–1959. [Google Scholar] [CrossRef]
- Rodrigues, A.; Santos, M.; Santos, A.; Rocha, F. Dam-break flood emergency management system. Water Resour. Manag. 2002, 16, 489–503. [Google Scholar] [CrossRef]
- Diao, Y.-F.; Wang, B.-D. Risk analysis of flood control operation mode with forecast information based on a combination of risk sources. Sci. China Technol. Sci. 2010, 53, 1949–1956. [Google Scholar] [CrossRef]
- Kriauciuniene, J.; Jakimavicius, D.; Sarauskiene, D.; Kaliatka, T. Estimation of uncertainty sources in the projections of Lithuanian river runoff. Stoch. Environ. Res. Risk Assess. 2013, 27, 769–784. [Google Scholar] [CrossRef]
- Sattar, A.M.A. Gene expression models for prediction of dam breach parameters. J. Hydroinform. 2014, 16, 550–571. [Google Scholar] [CrossRef]
- Sun, Y.-F.; Chang, H.-T.; Miao, Z.-J.; Zhong, D.-H. Solution method of overtopping risk model for earth dams. Saf. Sci. 2012, 50, 1906–1912. [Google Scholar] [CrossRef]
- Li, B.-Q.; Liang, Z.-M.; Zhang, J.-Y.; Chen, X.-Q.; Jiang, X.-L.; Wang, J.; Hu, Y.-M. Risk Analysis of Reservoir Flood Routing Calculation Based on Inflow Forecast Uncertainty. Water 2016, 8, 486. [Google Scholar] [CrossRef]
- Hsu, Y.-C.; Tung, Y.-K.; Kuo, J.-T. Evaluation of dam overtopping probability induced by flood and wind. Stoch. Environ. Res. Risk Assess. 2011, 25, 35–49. [Google Scholar] [CrossRef]
- Cheng, W.-M.; Huang, C.-L.; Hsu, N.-S.; Wei, C.-C. Risk Analysis of Reservoir Operations Considering Short-Term Flood Control and Long-Term Water Supply: A Case Study for the Da-Han Creek Basin in Taiwan. Water 2017, 9, 424. [Google Scholar] [CrossRef]
- Jiang, S.-H. Application of stochastic differential equations in risk assessment for flood releases. Hydrol. Sci. J. 1998, 43, 349–360. [Google Scholar] [CrossRef]
- Tosun, H.; Zorluer, I.; Orhan, A.; Seyrek, E.; Savaş, H.; Türköz, M. Seismic hazard and total risk analyses for large dams in Euphrates basin, Turkey. Eng. Geol. 2007, 89, 155–170. [Google Scholar] [CrossRef]
- Wu, S.-J.; Yang, J.-C.; Tung, Y.-K. Risk analysis for flood-control structure under consideration of uncertainties in design flood. Nat. Hazards 2011, 58, 117–140. [Google Scholar] [CrossRef]
- Yan, B.-W.; Guo, S.-L.; Chen, L. Estimation of reservoir flood control operation risks with considering inflow forecasting errors. Stoch. Environ. Res. Risk Assess. 2014, 28, 359–368. [Google Scholar] [CrossRef]
- Chen, J.; Zhong, P.-A.; Xu, B.; Zhao, Y.-F. Risk Analysis for Real-Time Flood Control Operation of a Reservoir. J. Water Resour. Plan. Manag. 2015, 141, 04014092. [Google Scholar] [CrossRef]
- Zhu, F.-L.; Zhong, P.-A.; Sun, Y.-M.; Yeh, W.W.-G. Real-time optimal flood control decision making and risk propagation under multiple uncertainties. Water Resour. Res. 2017, 53. [Google Scholar] [CrossRef]
- Chen, Z.-Y.; Ma, L.-Q.; Yu, S.; Chen, S.-J.; Zhou, X.-B.; Sun, P.; Li, X. Back Analysis of the Draining Process of the Tangjiashan Barrier Lake. J. Hydraul. Eng. 2014, 141. [Google Scholar] [CrossRef]
- Chen, Z.-Y. Spreadsheet for the Dam Breach Analysis Model (DB-IWHR-2014), Beijing, China, 2014. Available online: http://www.geoeng.iwhr.com/geoeng/download.htm (accessed on 6 February 2018).
- Tung, Y.-K.; Mays, L.W. Risk model for flood levee design. Water Resour. Res. 1981, 17, 833–841. [Google Scholar] [CrossRef]
- Ministry of Water Resources (MWR). Standard for Hydrological Information and Hydrological Forecasting; Rep. SL250-2000; Ministry of Water Resources of the People’s Republic of China: Beijing, China, 2000. (In Chinese)
- Li, X.; Guo, S.-L.; Liu, P.; Chen, G.-Y. Dynamic control of flood limited water level for reservoir operation by considering inflow uncertainty. J. Hydrol. 2010, 391, 124–132. [Google Scholar] [CrossRef]
- Zhong, P.-A.; Zhang, Y.; Zhang, Y.; Chen, J.; Wu, Y.-N. An Analytical Method of Maintaining the Shape of Typical Flood Hydrograph to get Design Flood Hydrograph. Patent CN 201510008167.7, 6 May 2015. [Google Scholar]
- Olsson, A.; Sandberg, G.; Dahlblom, O. On Latin hypercube sampling for structural reliability analysis. Struct. Saf. 2003, 25, 47–68. [Google Scholar] [CrossRef]
- Manache, G.; Melching, C.S. Sensitivity Analysis of a Water-Quality Model Using Latin Hypercube Sampling. J. Water Resour. Plan. Manag. 2004, 3, 232–242. [Google Scholar] [CrossRef]
- Carvajal, C.; Peyras, L.; Arnaud, P.; Boissier, D.; Royet, P. Probabilistic modeling of floodwater level for dam reservoirs. J. Hydrol. Eng. 2009, 14, 223–232. [Google Scholar] [CrossRef]
- Micovic, Z.; Hartford, D.N.D.; Schaefer, M.G.; Barker, B.L. A non-traditional approach to the analysis of flood hazard for dams. Stoch. Environ. Res. Risk Assess. 2016, 30, 559–581. [Google Scholar] [CrossRef]
- Gabriel-Martin, I.; Sordo-Ward, A.; Garrote, L.; Castillo, L.G. Influence of initial reservoir level and gate failure in dam safety analysis. Stochastic approach. J. Hydrol. 2017, 550, 669–684. [Google Scholar] [CrossRef]
- Sordo-Ward, A.; Garrote, L.; Bejarano, M.D.; Castillo, L.G. Extreme flood abatement in large dams with gate-controlled spillways. J. Hydrol. 2013, 498, 113–123. [Google Scholar] [CrossRef]
- Sordo-Ward, A.; Gabriel-Martin, I.; Bianucci, P.; Garrote, L. A Parametric Flood Control Method for Dams with Gate-Controlled Spillways. Water 2017, 9, 237. [Google Scholar] [CrossRef]
- Bianucci, P.; Sordo-Ward, A.; Moralo, J.; Garrote, L. Probabilistic-Multiobjective Comparison of User-Defined Operating Rules.Case Study: Hydropower Dam in Spain. Water 2015, 7, 956–974. [Google Scholar] [CrossRef]
- Bianucci, P.; Sordo-Ward, A.; Perez, J.I.; Garcia-Palacios, J.; Mediero, L.; Garrote, L. Risk-based methodology for parameter calibration of a reservoir flood control model. Nat. Hazards Earth Syst. 2013, 13, 965–981. [Google Scholar] [CrossRef]
- Sordo-Ward, A.; Bianucci, P.; Garrote, L.; Granados, A. How safe is hydrologic infrastructure design? Analysis of factors affecting extreme flood estimation. J. Hydrol. Eng. 2014, 19. [Google Scholar] [CrossRef]
Figure 1.
The framework of the risk-based model for real-time flood control operation of reservoirs under emergency conditions.
Figure 1.
The framework of the risk-based model for real-time flood control operation of reservoirs under emergency conditions.

Figure 2.
The flowchart of the Monte Carlo simulations.

Figure 3.
The sketch map of the upper reaches of Daduhe River Basin in China.

Figure 4.
The inflows and their distribution parameters of the Shuangjiangkou reservoir.

Figure 5.
The spillway failure scenarios of the Shuangjiangkou reservoir.
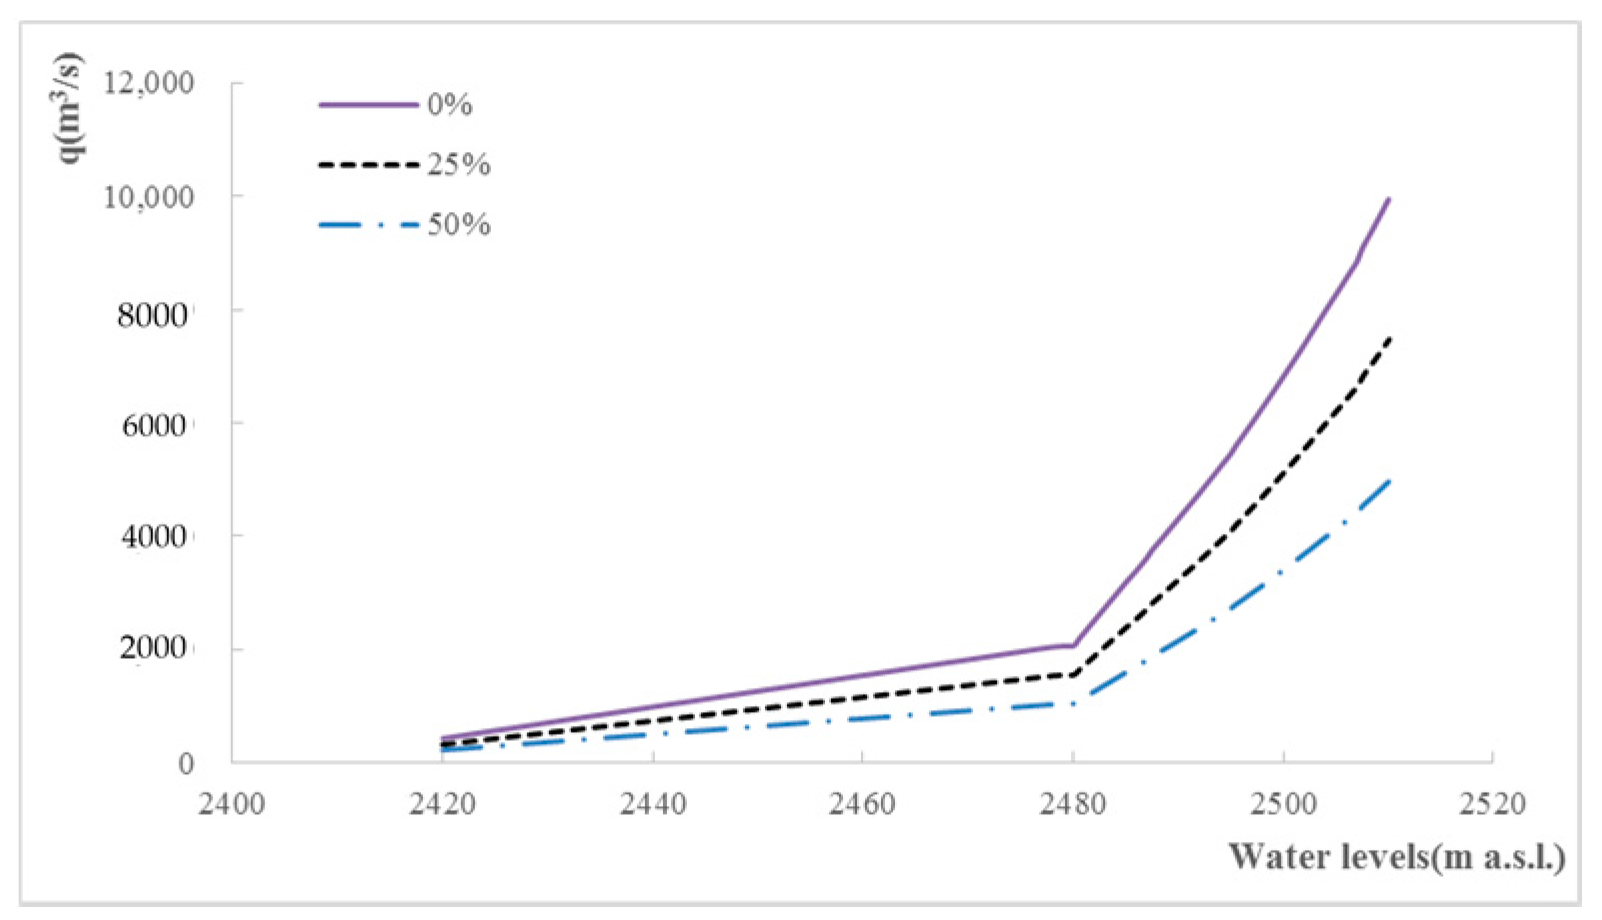
Figure 6.
The flood control operation results of the Shuangjiangkou reservoir using the release capacity model.
Figure 6.
The flood control operation results of the Shuangjiangkou reservoir using the release capacity model.

Figure 7.
The integrated risk of Shuangjiangkou reservoir using the release capacity model.
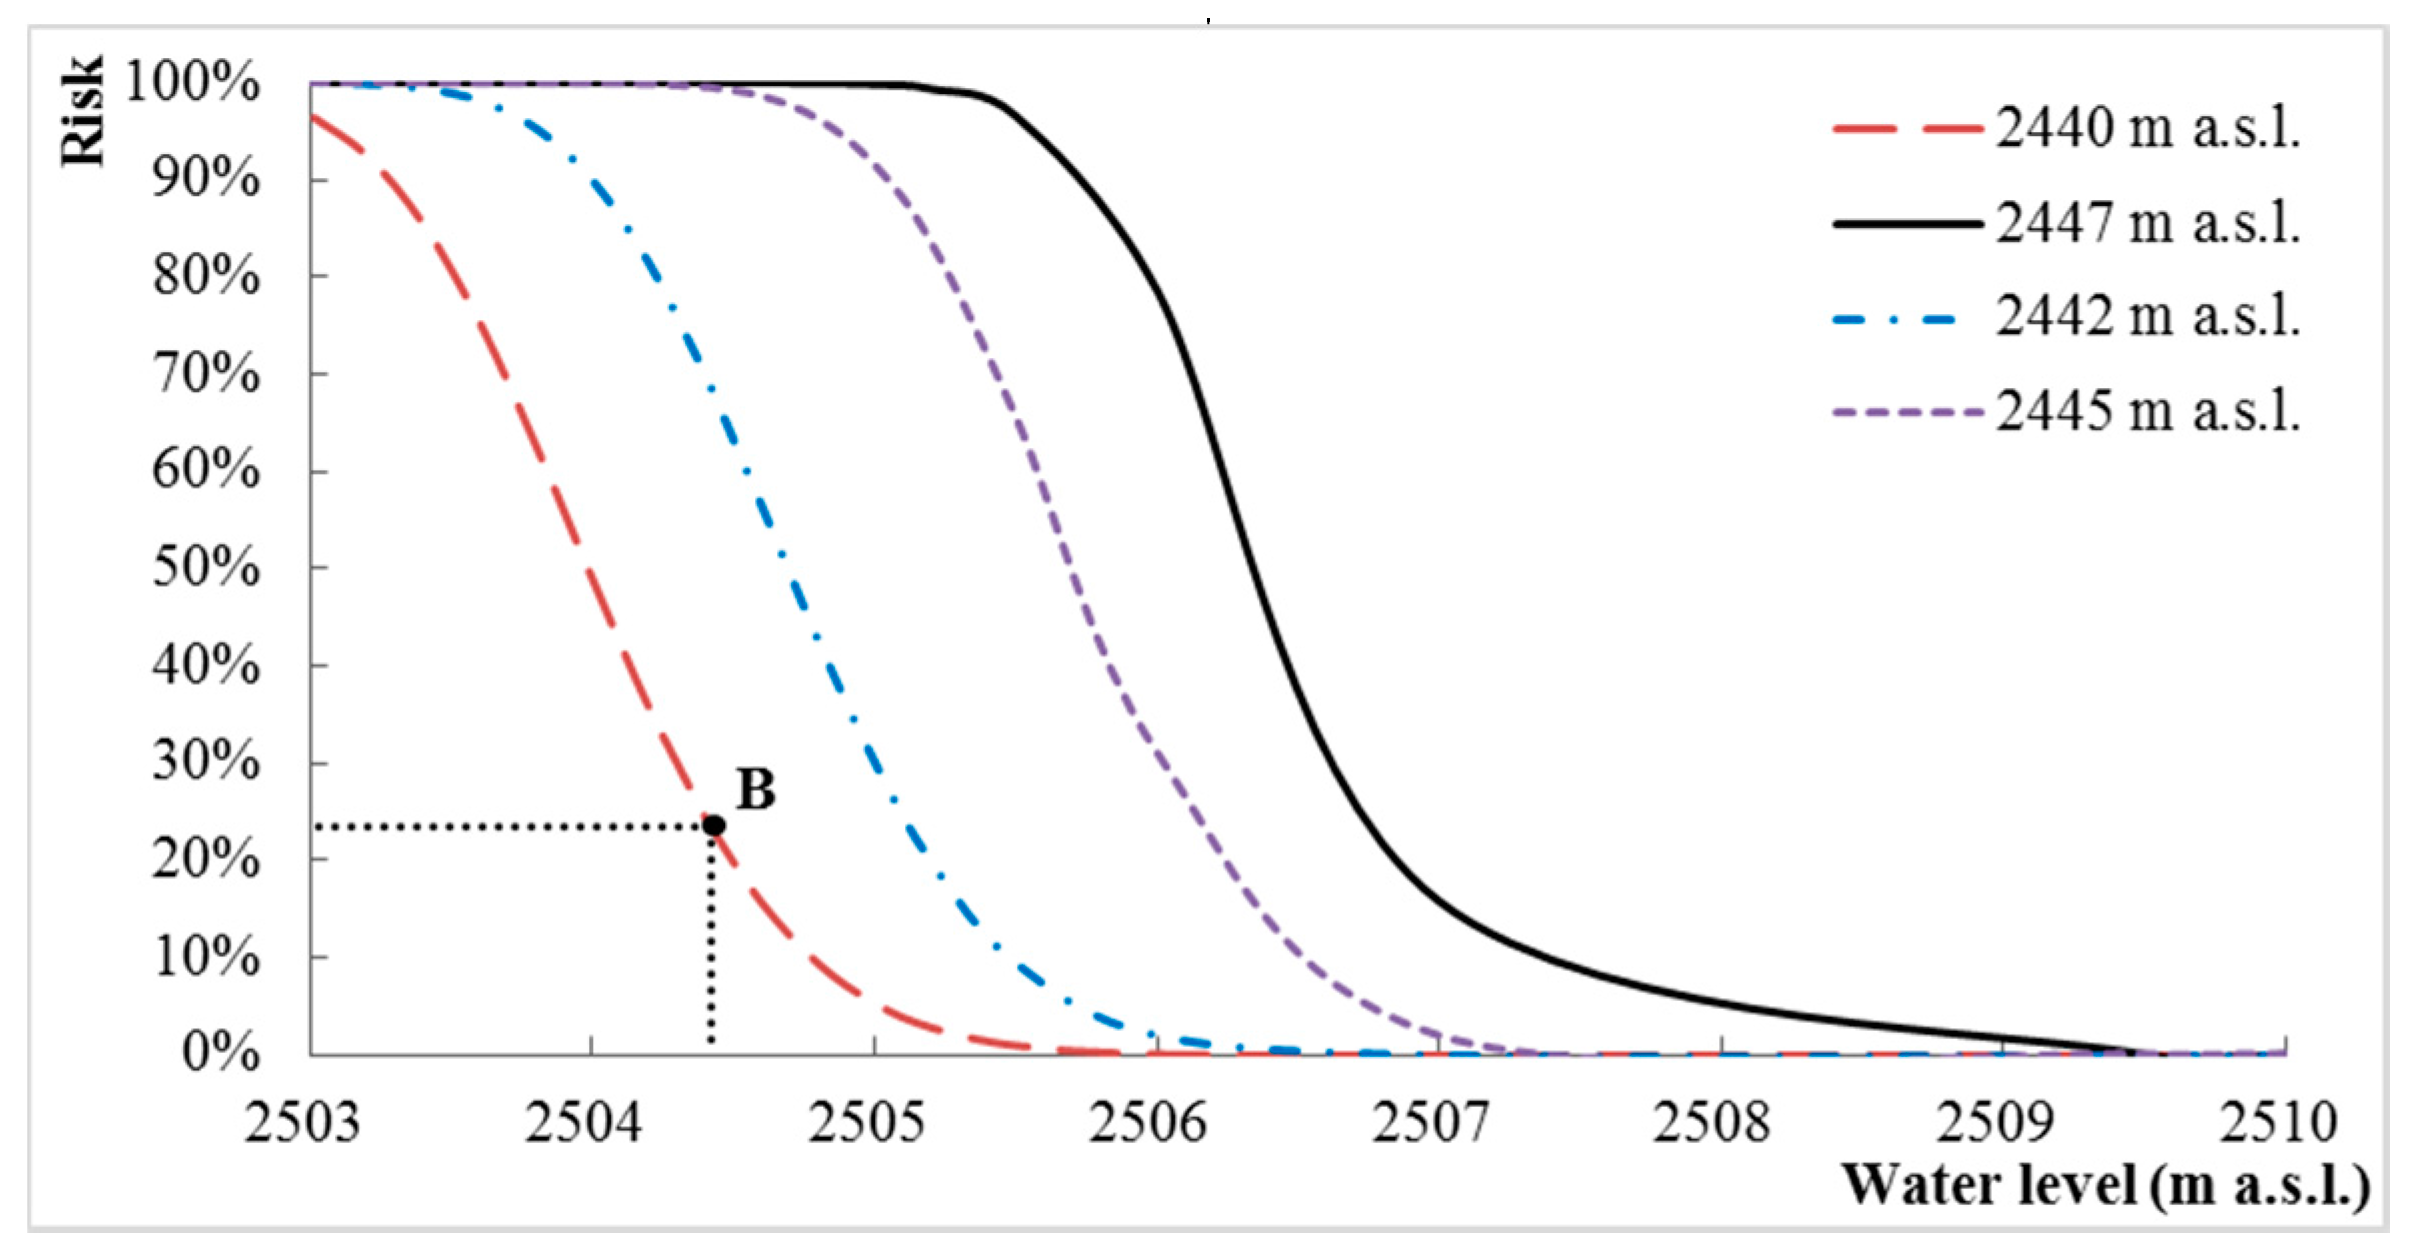
Figure 8.
The integrated risk of Shuangjiangkou reservoir using the release capacity model under different uncertainties.
Figure 8.
The integrated risk of Shuangjiangkou reservoir using the release capacity model under different uncertainties.
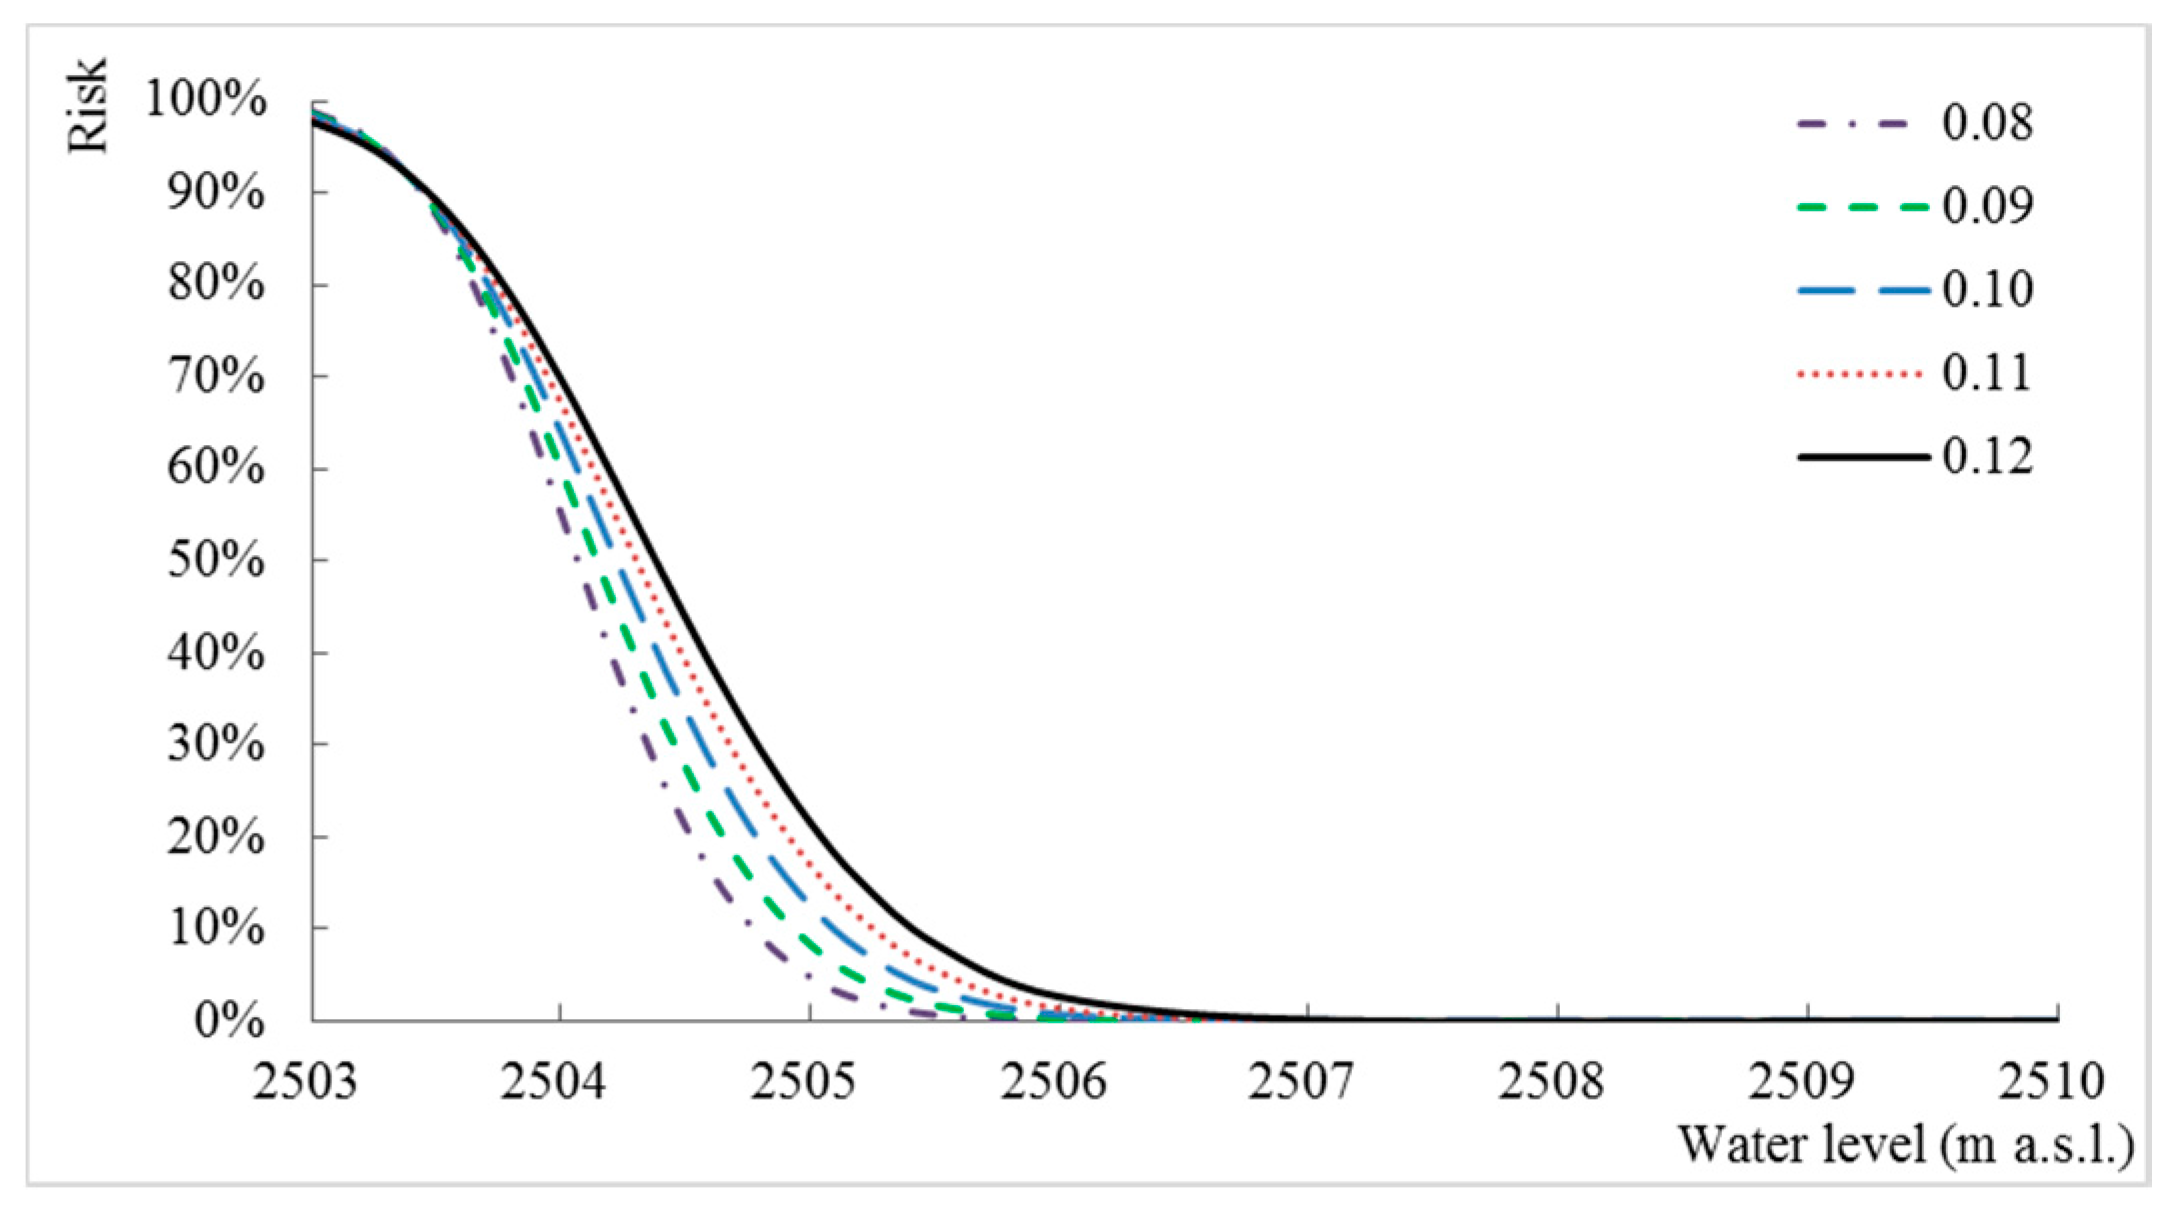
Figure 9.
The flood control operation results of Shuangjiangkou reservoir using the command model.

Figure 10.
The integrated risk of the Shuangjiangkou reservoir using the command model.

Figure 11.
The operation results of Shuangjiangkou reservoir for the design floods.

Figure 12.
The integrated risk of Shuangjiangkou reservoir for the scenario of extreme flooding.
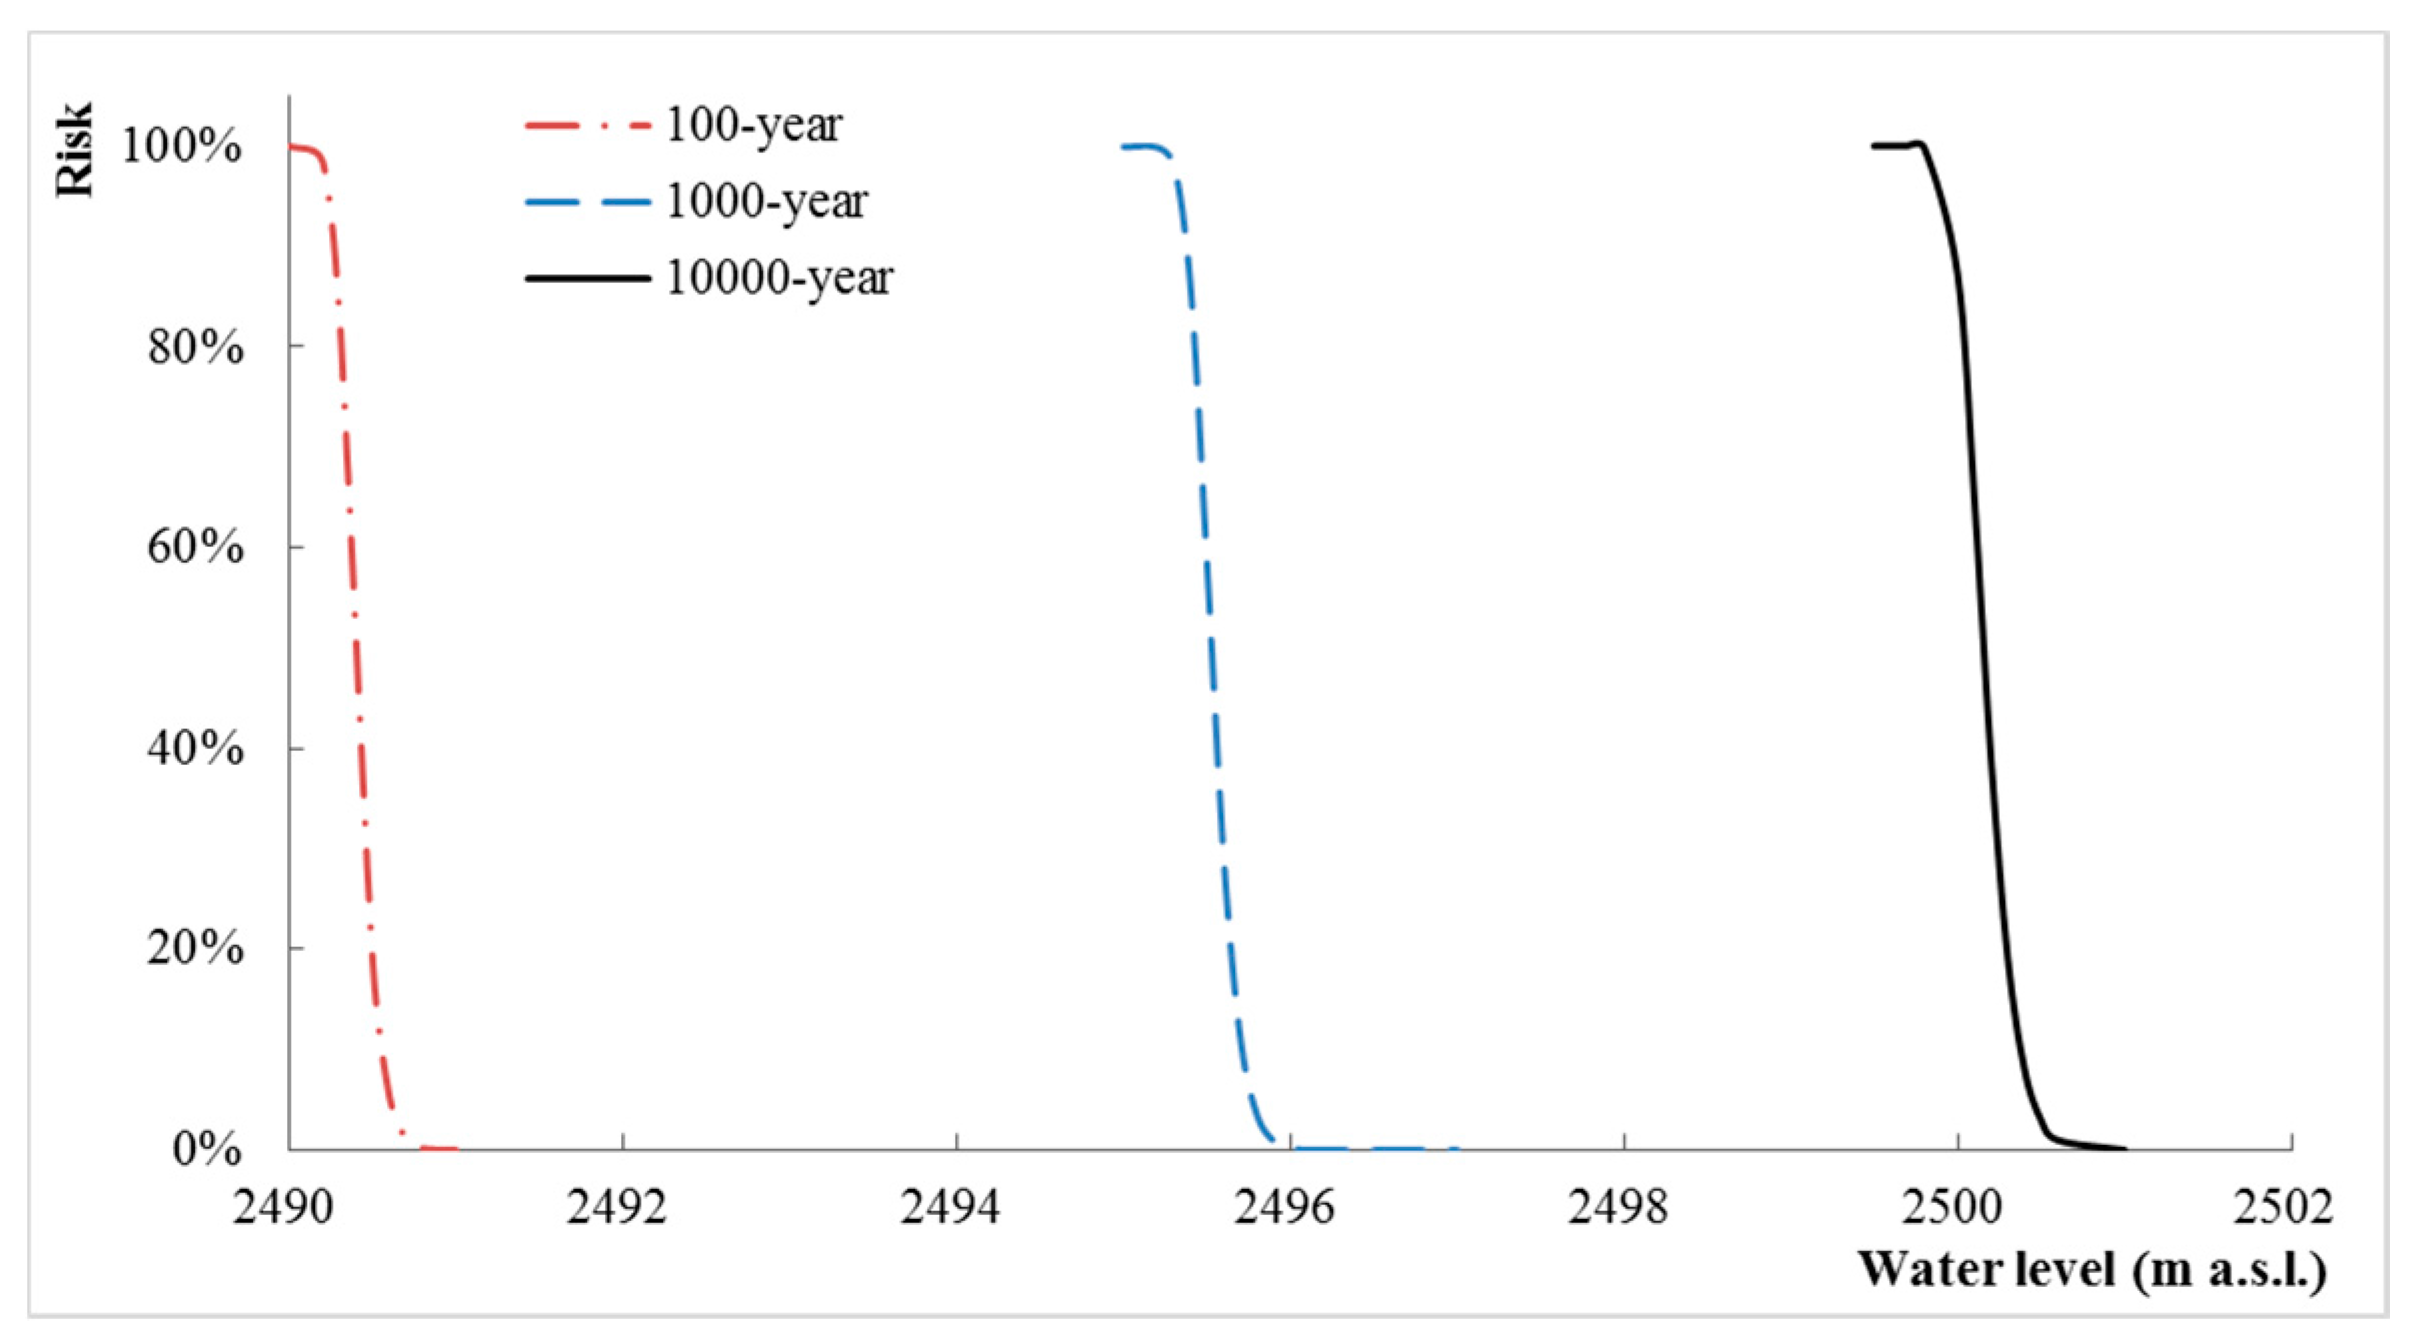
Figure 13.
The operation results of Shuangjiangkou reservoir under the scenario of a decrease of 25% and 50% of the reservoir release capacity.
Figure 13.
The operation results of Shuangjiangkou reservoir under the scenario of a decrease of 25% and 50% of the reservoir release capacity.

Figure 14.
The integrated risk of Shuangjiangkou reservoir under the scenario of spillway failure.


Table 1.
The main characteristics of the cascade reservoirs.
| Reservoirs | Xiaerga | Shuangjiangkou |
|---|---|---|
| River basin area (km2) | 15,500 | 39,330 |
| Annual inflows (m3/s) | 186 | 512 |
| Dam crest elevation (m a.s.l.) | 3175 | 2510 |
| Dam crest height (m) | 257 | 314 |
| Normal water level (m a.s.l.) | 3120 | 2500 |
| Flood control water level (m a.s.l.) | 3105 | 2480 |
| Dead water level (m a.s.l.) | 3060 | 2420 |
| Storage capacity (108 m3) | 28 | 31.15 |
| Installed capacity (MW) | 540 | 1800 |
Table 2.
The distribution parameters of the stochastic water levels of Shuangjiangkou reservoir using the release capacity model.
Table 2.
The distribution parameters of the stochastic water levels of Shuangjiangkou reservoir using the release capacity model.
| Time | Mean (m a.s.l.) | Standard Deviation (m) | Time | Mean (m a.s.l.) | Standard Deviation (m) |
|---|---|---|---|---|---|
| 1 | 2439.84 | 0.00 | 13 | 2478.95 | 0.64 |
| 2 | 2439.69 | 0.00 | 14 | 2483.45 | 0.69 |
| 3 | 2439.53 | 0.00 | 15 | 2487.50 | 0.72 |
| 4 | 2440.04 | 0.02 | 16 | 2491.13 | 0.75 |
| 5 | 2441.79 | 0.06 | 17 | 2494.31 | 0.80 |
| 6 | 2444.78 | 0.12 | 18 | 2497.03 | 0.80 |
| 7 | 2448.70 | 0.18 | 19 | 2499.37 | 0.83 |
| 8 | 2453.34 | 0.26 | 20 | 2501.22 | 0.82 |
| 9 | 2458.42 | 0.34 | 21 | 2502.53 | 0.83 |
| 10 | 2463.72 | 0.43 | 22 | 2503.28 | 0.82 |
| 11 | 2468.99 | 0.50 | 23 | 2503.44 | 0.81 |
| 12 | 2474.09 | 0.58 | 24 | 2503.13 | 0.79 |
Table 3.
The distribution parameters of the stochastic water levels of Shuangjiangkou reservoir using the command model.
Table 3.
The distribution parameters of the stochastic water levels of Shuangjiangkou reservoir using the command model.
| Time | Mean (m a.s.l.) | Standard Deviation (m) | Time | Mean (m a.s.l.) | Standard Deviation (m) |
|---|---|---|---|---|---|
| 1 | 2439.84 | 0.00 | 13 | 2478.95 | 0.64 |
| 2 | 2439.69 | 0.00 | 14 | 2483.45 | 0.69 |
| 3 | 2439.53 | 0.00 | 15 | 2487.50 | 0.72 |
| 4 | 2440.04 | 0.02 | 16 | 2491.13 | 0.75 |
| 5 | 2441.79 | 0.06 | 17 | 2494.31 | 0.80 |
| 6 | 2444.78 | 0.12 | 18 | 2497.03 | 0.80 |
| 7 | 2448.70 | 0.18 | 19 | 2499.37 | 0.83 |
| 8 | 2453.34 | 0.26 | 20 | 2501.23 | 0.83 |
| 9 | 2458.42 | 0.34 | 21 | 2502.58 | 0.86 |
| 10 | 2463.72 | 0.43 | 22 | 2503.38 | 0.88 |
| 11 | 2468.99 | 0.50 | 23 | 2503.62 | 0.88 |
| 12 | 2474.09 | 0.58 | 24 | 2503.38 | 0.89 |
© 2018 by the authors. Licensee MDPI, Basel, Switzerland. This article is an open access article distributed under the terms and conditions of the Creative Commons Attribution (CC BY) license (http://creativecommons.org/licenses/by/4.0/).
Share and Cite
MDPI and ACS Style
Chen, J.; Zhong, P.-a.; Wang, M.-l.; Zhu, F.-l.; Wan, X.-y.; Zhang, Y. A Risk-Based Model for Real-Time Flood Control Operation of a Cascade Reservoir System under Emergency Conditions. Water 2018, 10, 167. https://doi.org/10.3390/w10020167
AMA Style
Chen J, Zhong P-a, Wang M-l, Zhu F-l, Wan X-y, Zhang Y. A Risk-Based Model for Real-Time Flood Control Operation of a Cascade Reservoir System under Emergency Conditions. Water. 2018; 10(2):167. https://doi.org/10.3390/w10020167
Chicago/Turabian StyleChen, Juan, Ping-an Zhong, Man-lin Wang, Fei-lin Zhu, Xin-yu Wan, and Yu Zhang. 2018. "A Risk-Based Model for Real-Time Flood Control Operation of a Cascade Reservoir System under Emergency Conditions" Water 10, no. 2: 167. https://doi.org/10.3390/w10020167
Note that from the first issue of 2016, this journal uses article numbers instead of page numbers. See further details here.