Soil Media CO2 and N2O Fluxes Dynamics from Sand-Based Roadside Bioretention Systems

1
Department of Plant and Soil Science, University of Vermont, Burlington, VT 05405, USA
2
Rubenstein School of Environment and Natural Resources, University of Vermont, Burlington, VT 05405, USA
*
Author to whom correspondence should be addressed.
Water 2018, 10(2), 185; https://doi.org/10.3390/w10020185
Submission received: 3 January 2018
/
Revised: 30 January 2018
/
Accepted: 1 February 2018
/
Published: 10 February 2018
(This article belongs to the Special Issue Plant and Microbial Processes in Stormwater Treatment Systems)
Abstract
:Green stormwater infrastructure such as bioretention is commonly implemented in urban areas for stormwater quality improvements. Although bioretention systems’ soil media and vegetation have the potential to increase carbon (C) and nitrogen (N) storage for climate change mitigation, this storage potential has not been rigorously studied, and any analysis of it must consider the question of whether bioretention emits greenhouse gases to the atmosphere. We monitored eight roadside bioretention cells for CO2-C and N2O-N fluxes during two growing seasons (May through October) in Vermont, USA. C and N stocks in the soil media layers, microbes, and aboveground vegetation were also quantified to determine the overall C and N balance. Our bioretention cells contained three different treatments: plant species mix (high diversity versus low diversity), soil media (presence or absence of P-sorbent filter layer), and hydrologic (enhanced rainfall and runoff in some cells). CO2-C and N2O-N fluxes from all cells averaged 194 mg m−2 h−1 (range: 37 to 374 mg m−2 h−1) and 10 µg m−2 h−1 (range: −1100 to 330 µg m−2 h−1), respectively. There were no treatment-induced changes on gas fluxes. CO2-C fluxes were highly significantly correlated with soil temperature (R2 = 0.68, p < 0.0001), while N2O-N fluxes were weakly correlated with temperature (R2 = 0.017, p = 0.04). Bioretention soil media contained the largest pool of total C and N (17,122 g and 1236 g, respectively) when compared with vegetation and microbial pools. Microbial biomass C made up 14% (1936 g) of the total soil C in the upper 30 cm media layer. The total C and N sequestered by bioretention plants were 13,020 g and 320 g, respectively. After accounting for C and N losses via gas fluxes, the bioretention appeared to be a net sink for those nutrients. We also compared our bioretention gas fluxes to those from a variety of natural (i.e., grasslands and forests) and artificial (i.e., fertilized and irrigated or engineered) land-use types. We found bioretention fluxes to be in the mid-range among these land-use types, mostly likely due to organic matter (OM) influences on decomposition being similar to processes in natural systems.
1. Introduction
Cities are increasingly making efforts to improve their stormwater management capacities by integrating innovative green strategies into urban landscapes, broadly defined as green stormwater infrastructure (GSI), which includes but is not limited to bioretention. Bioretention (also known in the literature as “biofilters” and “raingardens”) is a porous vegetated media filter that accepts runoff from impervious surfaces and consequently mitigates the hydrologic “flashiness” of urban runoff and its associated pollution [1,2]. Although bioretention is primarily implemented for ecological treatment of urban stormwater, its benefits can extend well beyond stormwater control. Bioretention systems have the potential to sequester carbon (C) and nitrogen (N) in the soils and plants that comprise them. However, this presumed positive effect is not well documented and must be empirically measured.
Bioretention may therefore be at least a partial solution for the myriad challenges facing cities. Globally, many cities are concerned about coping with the deleterious effects of climate change, such as increasing frequency of extreme events (e.g., heavy rainfall and droughts) and associated threats from flooding, scarcity of water, and extreme heat events [3,4,5]. Along with increased consideration of climate change adaptation strategies, mitigation of greenhouse gases (GHGs) to slow the progress of climate change is also critical. Cities are important contributors to GHG emissions, typically from energy production and transportation systems (i.e., fossil fuel combustion; [6]) combined with lower potential for C sequestration due to relative absence of plants and soils [7]. As urban expansion continues, if appropriate counter measures are not taken, the rate of biogeochemical alteration may continue to increase, possibly worsening some climate effects. Additionally, climate change, which is predicted to increase precipitation volumes and intensities, e.g., the Northeastern United States [3,8], will challenge cities to effectively manage stormwater runoff without negatively impacting water bodies or GHG emissions. Bioretention cells foster C sequestration and enhance biogeochemical cycling, particularly C and N cycling, by supporting active soil microbial communities [9] and in some cases by receiving influxes of nutrient-enriched water [10,11,12]. The combination of nutrient influxes and variable soil moisture patterns can thus make bioretention systems hotspots for C and N transformation via biological processes such as root respiration and organic matter (OM) decomposition releasing CO2 [13,14] and microbial-mediated nitrification and denitrification releasing N2O [15]. As bioretention designs can greatly influence the extent of such biological processes, this has design implications and one must consider environmental tradeoffs accordingly. For example, from a water quality standpoint, removal of stormwater nitrate (NO3−) is a design goal, particularly in watersheds draining to N-sensitive water bodies (e.g., Chesapeake Bay; [16]). Thus, an ideal GSI design would maximize the water quality service of denitrification while minimizing production of nitrous oxide (N2O), a powerful GHG.
Thus far, only two studies have examined GHG fluxes from bioretention [12,17] and no study, to our knowledge, has quantified nutrient storage/stocks from a bioretention cell. As urban expansion and regulation of existing impervious surfaces continue, implementation of stormwater control structures such as bioretention will likely increase. It is therefore important to understand whether and how bioretention might contribute to urban climate change mitigation efforts, including C and N storage and GHG fluxes, to evaluate their benefits or trade-offs in meeting environmental goals. Additionally, a better evaluation and understanding of nutrient dynamics from bioretention cells will allow us to improve their design attributes to minimize detrimental effects (i.e., GHG emissions) and maximize beneficial functions (i.e., water quality).
In this paper, we examine soil fluxes of CO2-C and N2O-N from eight sand-based bioretention systems that had been previously maintained for 2.5 years and were designed to incorporate different vegetation, soil media, and hydrologic treatments. We evaluate whether gas fluxes vary significantly among cells receiving the different treatments. Since gas fluxes are tightly coupled with soil temperature [18] and moisture [19], we explore relationships between the observed gas fluxes and these environmental parameters, derived from the bioretention soil media across all treatments. To fill gaps in our understanding of nutrient stocks/accumulation and partitioning of the stocks among soil and plant biomass components in a bioretention system, we quantify the total amounts of C and N stored in bioretention cell and attribute these to soil, microbial, and plant sequestration. Lastly, to contextualize our findings, we compare fluxes from this bioretention study to fluxes reported in other types of stormwater treatment systems, as well as to fluxes associated with other natural and artificial land-use types.
2. Methods
2.1. Study Site Description and Experimental Design
The study examines eight bioretention cells in an outdoor research laboratory situated adjacent to a medium-traffic road on the University of Vermont campus in Burlington, Vermont, USA [20,21]. Burlington is the largest and most populous city in Vermont [22] and has a humid continental climate, with mean summer and winter temperatures of and 20 °C and −6 °C, respectively, and a mean annual precipitation of 94 cm [23]. The bioretention cells were constructed in November 2012 and have identical sizes (1.22 m wide, 3.05 m long, 0.9 m deep) and drainage configurations but drain road watersheds of varying sizes, ranging from 30 to 120 m2 (see [20] for experimental design details). The bioretention soil media consists of two layers, each approximately 30 cm deep: the upper layer is a 60:40 sand-compost mix, the lower layer is pure sand. A 7.6 cm-layer of pea stone was placed below the sand layer and the bottom 23 cm of each cell is occupied by 5-cm diameter stones. The cells are drained using a 26-cm long perforated polyvinyl chloride (PVC) underdrain pipe that is placed at the opposite end of the cell from the inlet and 2.5 cm from the bottom of the cell within the stone layer, and which conveys effluent to the campus storm sewer system. For the purposes of water quality monitoring, all cells (sides and bottoms) are lined with an impermeable rubber liner.
The eight bioretention cells received combinations of three treatments, previously described in [20]: (1) vegetation with low-diversity (VL; 2 species) or high-diversity (VH; 7 species) plant mixes (see Supplement Table S1 for a detailed planting list); (2) presence or absence of a proprietary SorbtiveMediaTM (SM, Contech® Engineered Solutions, LLC, West Chester, OH, USA) layer containing iron and aluminum oxide granules to enhance sorption capacity for phosphorus; and (3) “ambient” or “enhanced rainfall and runoff” (RR) at three levels (15%, RR15; 20%, RR20; and 60%, RR60) mimicking a range of anticipated precipitation increases associated with climate change. The additional rainfall and runoff that each of the three RR cells receives is proportional to the paired cell’s watershed size differences, such that each “enhanced” RR cell receives either 15%, 20%, or 60% more runoff and rainfall (via an attached rain pan, see [20]) than its paired “ambient” cell (Table 1). The additional SM and RR treatments are prescribed to VH cells only.
2.2. Gas Flux Measurements
In 2013, two PVC collars (18-cm height with 25-cm inner diameter) were installed permanently in each bioretention cell to a soil depth of 5–10 cm [24]. The collars were kept free of aboveground vegetation by clipping to the soil surface to prevent aboveground plant respiration and photosynthesis [25], and a bare soil surface was maintained by removing trash or leaf litter to avoid their confounding effects on gas diffusion. CO2-C and N2O-N fluxes were measured at roughly two- to three-week intervals from May to October in 2015 and 2016. Monitoring was done during the growing season only as it was timed with stormwater sampling [20] and to avoid frost and snow cover present much of the winter. Two subsample locations were sampled repeatedly from each of eight cells in 2015, while one location per cell was sampled in 2016. At each sampling date, flux measurements on the eight cells occurred within 45 min to 4.5 h in 2015, and within 2 to 2.5 h in 2016. All measurements were conducted in daylight between 9:30 am and 2:30 pm. In the wetter year 2015, only drier days were chosen for gas sampling due to logistical reasons, and no post-storm sampling was conducted. In 2016, however, efforts were made to sample immediately after storm events. However, this was a drier year, and only six storms (ranging from 0.762 mm (0.03 in) to 42.41 mm (1.67 in)) were sampled for fluxes on the day of or the next day following storms.
Gases were analyzed using two different protocols during this study. From 15 May to 26 June, 2015 sampling, a vented static chamber method was used for gas exchange measurements (n = 32) between the soil surface and atmosphere [24]. At the time of sampling, a PVC lid containing a gas sampling port equipped with a butyl rubber septum and a vent tube to allow equilibration of internal and external atmospheric pressures was used to enclose the chamber. An instantaneous measurement was taken immediately upon sealing of the chamber head (time-zero concentration) with a 20-mL polypropylene syringe fitted with one-way stop-cock valve. Headspace gas samples were withdrawn from the chamber at regular intervals over a period of 45 min (i.e., 0, 15, 30, 45 min), which allowed the sampling of all cells to occur within an hour. Air samples were immediately transferred to a pre-evacuated 10-mL glass vial sealed with butyl rubber septum. Vials were over-pressurized by injecting 15 mL of gas samples, which is considered to maintain the integrity of samples until analysis [26]. Glass vials were transported to the laboratory and analyzed for CO2-C and N2O-N concentrations on a Shimadzu AOC-5000 gas chromatograph (GC, Shimadzu Corporation, Tokyo, Japan) equipped with an electron capture detector (ECD, Shimadzu Corporation, Tokyo, Japan) and flame ionization detector (FID, Shimadzu Corporation, Tokyo, Japan). All samples were analyzed on the GC within one to three days.
From July 2015, due to mechanical malfunction with the GC, all the subsequent gas exchange measurements (n = 144) were conducted using 1412 Photoacoustic multi-gas monitor (PAS; INNOVA Air Tech Instruments, Hovedstaden, Denmark; calibrated by California Analytical Instruments (Orange, CA, USA), as in [27]. The same PVC lids were modified to be compatible with the PAS analyzer. When the PAS was in use, sampling intervals were shortened such that headspace gas samples were withdrawn every 2 min over a period of 12 min (i.e., 2, 4, 6, 8, 10, 12 min; [27]) in 2015, and at every one minute up to 10 min in 2016, and concentrations detected in situ by the PAS analyzer (INNOVA Air Tech Instruments, Hovedstaden, Denmark). No observable differences in fluxes (e.g., <0.04% difference) were noted between the 12 vs. 10-min duration. Atmospheric air samples were pulled as a “blank” before starting the actual sampling to check if CO2-C concentrations were far from the typically expected 400 to 430 ppm range.
Soil surface gas fluxes were determined by calculating the linear regression slope of the gas concentrations over time after chamber closure [28,29]. Regression slopes with p values lower than 0.05 were assigned flux values of zero (assuming no measurable increase or decrease in concentrations; proc lm in R (R software version 3.4.3, Vienna, Austria, www.r-project.org). All measured concentrations, originally in ppm, were converted to mass units and corrected for 20 °C and 1 atm (because PAS instrument calculates the concentration of each gas at 20 °C) and field chamber volume and surface area, based on which final flux values were calculated (See Supplementary Materials for additional detail on flux calculation).
Iqbal found PAS readings to be comparable to GC readings when calibrated properly [27]. In this study, overall, 22% and 78% of samples were analyzed on GC and PAS respectively. Soil temperature and volumetric moisture content at a depth of 10 cm was taken concurrently, once every sampling occasion in each of the sample locations in the chamber using a digital thermometer and a time-domain reflectometry moisture probe (FieldScout TDR300, Spectrum Technologies, Inc., Bridgend, UK).
2.3. Soil and Plant Measurements
Following GHG sampling, three random subsamples of the top 10 cm of soil outside of the chamber were collected from the ambient high and low diversity (VH and VL) plots for soil microbial biomass (SMB) C determination monthly from May to September 2014 and 2015. SMB measurements in 2015 coincided with the gas flux measurements. The chloroform fumigation-incubation extraction method [30,31] was used to determine SMB, following the extraction of soil samples with 0.5 M K2SO4 [32]. Analysis was done on field-moist soil within several hours from collection. The filtrate from the extraction procedure was analyzed for total organic carbon (TOC) on a TOC analyzer (TOC-L Shimadzu TOC Analyzer, Shimadzu Corporation, Kyoto, Japan). The difference in TOC between the chloroform-fumigated and non-fumigated soils divided by the kEC constant estimated as 0.45 is the chloroform-labile C pool, and is proportional to SMB carbon [31,33]. Moisture-correction was done for each sample to correct for differences in soil water content and results are expressed in dry weight equivalents (see Supplementary Materials for detailed methods). Microbial biomass C concentration was measured from the top 10 cm soil media, but given the upper 30 cm soil media profile had the same soil media composition, we assumed this concentration to stay constant over the top 30 cm.
Total C and N content from the top 10 cm of the bioretention soil from all eight cells were measured in May 2014 and 2016. Three 0–10 cm soil cores, taken near the influent, center, and effluent locations, were composited for each cell. Soil bulk density was measured twice, and soil OM by loss-on-ignition and pH were also measured six times from all cells during the sampling duration. Although not the focus of this study, we also measured soil ammonium (NH4+-N) and nitrate (NO3−-N) concentrations using a KCl extraction method in June, August, and November 2016 and results expressed in dry weight equivalents. KCl extracts were analyzed for NH4+-N) and nitrate (NO3−-N) by flow injection analysis on an automated colorimeter (Lachat Instruments QuickChem8000 AE, Hach Inc., Loveland, CO, USA).
In order to develop a quantification of bioretention’s pools/stocks of C and N in different design components (soil, microbes, and plants) at plot level, we selected one of the VL cells (cell 7). Soil C and N content was measured from the chosen VL cell in November 2016 at depth increments of 0–30 cm and 30–40 cm. The concentrations in the latter 30–40 cm apply to the whole 30–60 cm sand layer (as implied in the later results section on upscaling C sequestration). Soils were oven dried at 60 °C for two days, sieved through a 2 mm screen, homogenized, and ground into fine powder (<0.5 mm). Samples were analyzed in triplicate for C and N content by combustion method in a CN elemental analyzer (Flash EA-1112, CE Elantech, Lakewood, NJ, USA). The mass of total soil C and N in the upper and lower 30 cm soil media layers were determined by multiplying the concentrations of soil total C and N by the total soil mass in their respective layers, estimated using soil bulk density measurements (1.19 and 1.59 g cm−3 in upper and lower 30 cm layer respectively; see Supplementary Materials). Mass of carbon derived from microbial contribution was also determined by multiplying microbial biomass C concentration with the total soil mass in the upper 30 cm layer.
Aboveground plant tissues from the same VL cell were analyzed for C and N content in August and November 2016, where plant tissue samples were composited from three different individuals and analyzed in triplicate by combustion method. Since tissue C and N concentrations differed in summer versus fall, their average was used in the final calculations. Estimates for the aboveground plant biomass from the literature were used as proxy. Panicum biomass of 10 kg m−2 (or 10 Mg ha−1) estimated by [34], which examined 77 different observations from various peer reviewed literature in North America and Europe, was used to extrapolate carbon and nutrient capture at the bioretention plot level. Due to lack of biomass data for Hemerocallis, half of Panicum biomass (e.g., 5 kg m−2) was assumed, given that their height in the plots were approximately half of Panicum, and their spread over a given area was relatively equal. 55% of the plot area (3.72 m2) was covered by Panicum, and 45% by Hemerocallis (2.046 vs. 1.674 m2 respectively). Panicum and Hemerocallis coverage, in a 3.72 m2 cell, was determined through visual estimates. Tissue concentrations were multiplied by the total aboveground plant biomass and scaled to plot coverage level. In general, percent coverage of bioretention plants in all cells was also determined using visual estimates every 3 to 4 weeks in 2015 and 2016.
Additionally, dissolved organic C in the effluent water exiting from a few of the cells (VH; cell 2, SM; cell 4, and VL; cell 7 treatments) was also measured in three different storm events on 23 September, 28 October, and 3 November 2016. Effluent samples were collected real-time over the course of the storms using autosamplers (Teledyne ISCO 6712/7400, Lincoln, NE, USA) in up to 24 bottles. If all 24 bottles were filled, every three consecutive bottles were composited into one sample, otherwise samples were analyzed discretely for dissolved organic C concentrations on a TOC analyzer (TOC-L Shimadzu TOC Analyzer, Shimadzu Corporation, Kyoto, Japan).
2.4. Statistical Analyses
Gas fluxes from the VHRR15 and VHRR20 (high diversity with enhanced rainfall and runoff treatment at 15% and 20% respectively) treatments were averaged, as no significant differences were observed between the two treatments using repeated measures ANOVA, and will hereafter be called VHRR. The two treatments also had very similar plant cover throughout the monitoring period. Treatment effects on soil CO2-C and N2O-N flux, temperature, moisture and SMB carbon were examined using repeated measures (Proc mixed model) analysis in SAS 9.4 software (SAS Institute Inc., Cary, NC, USA) using the cell as a random effect, and treatment and day as fixed effects. The relationships between gas fluxes and environmental variables of soil temperature, soil moisture and microbial C biomass were examined using linear regression analysis in JMP Pro 12 (SAS Institute Inc., Cary, NC, USA). When necessary, soil CO2-C efflux, temperature, moisture, and microbial C biomass data were log transformed to meet normality assumptions. Means are followed by standard errors where indicated.
3. Results
3.1. Gas Flux Analysis
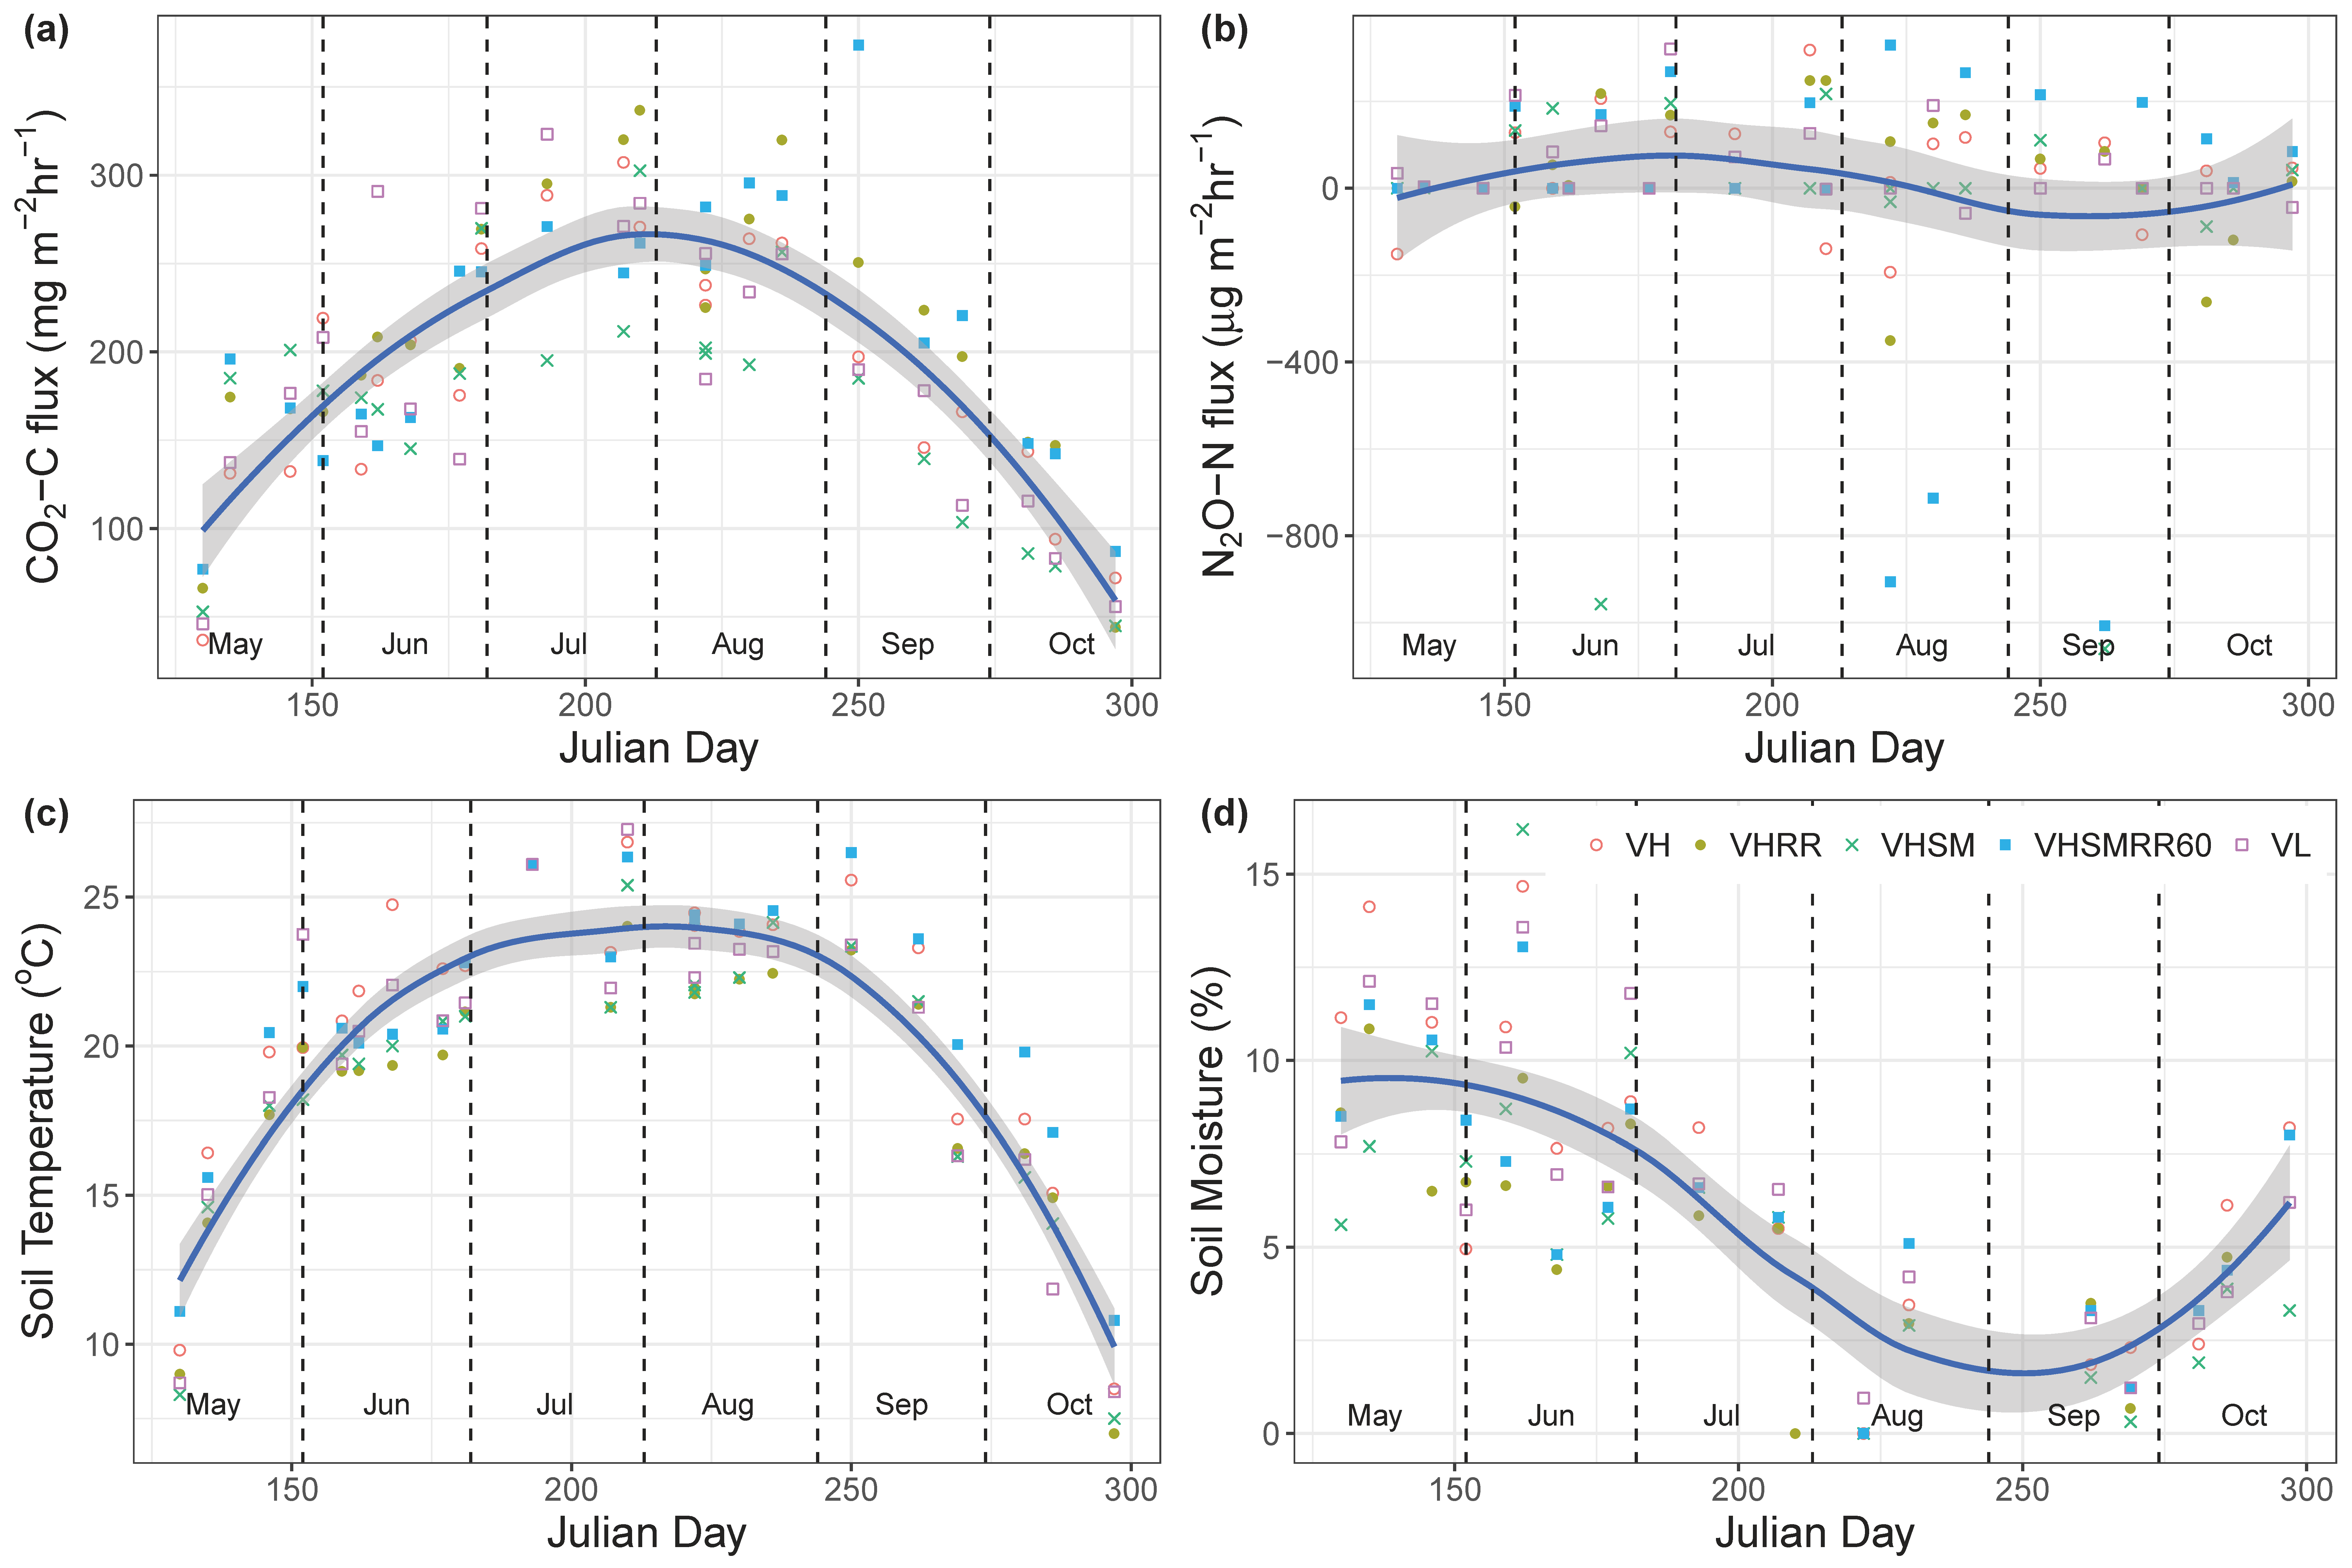
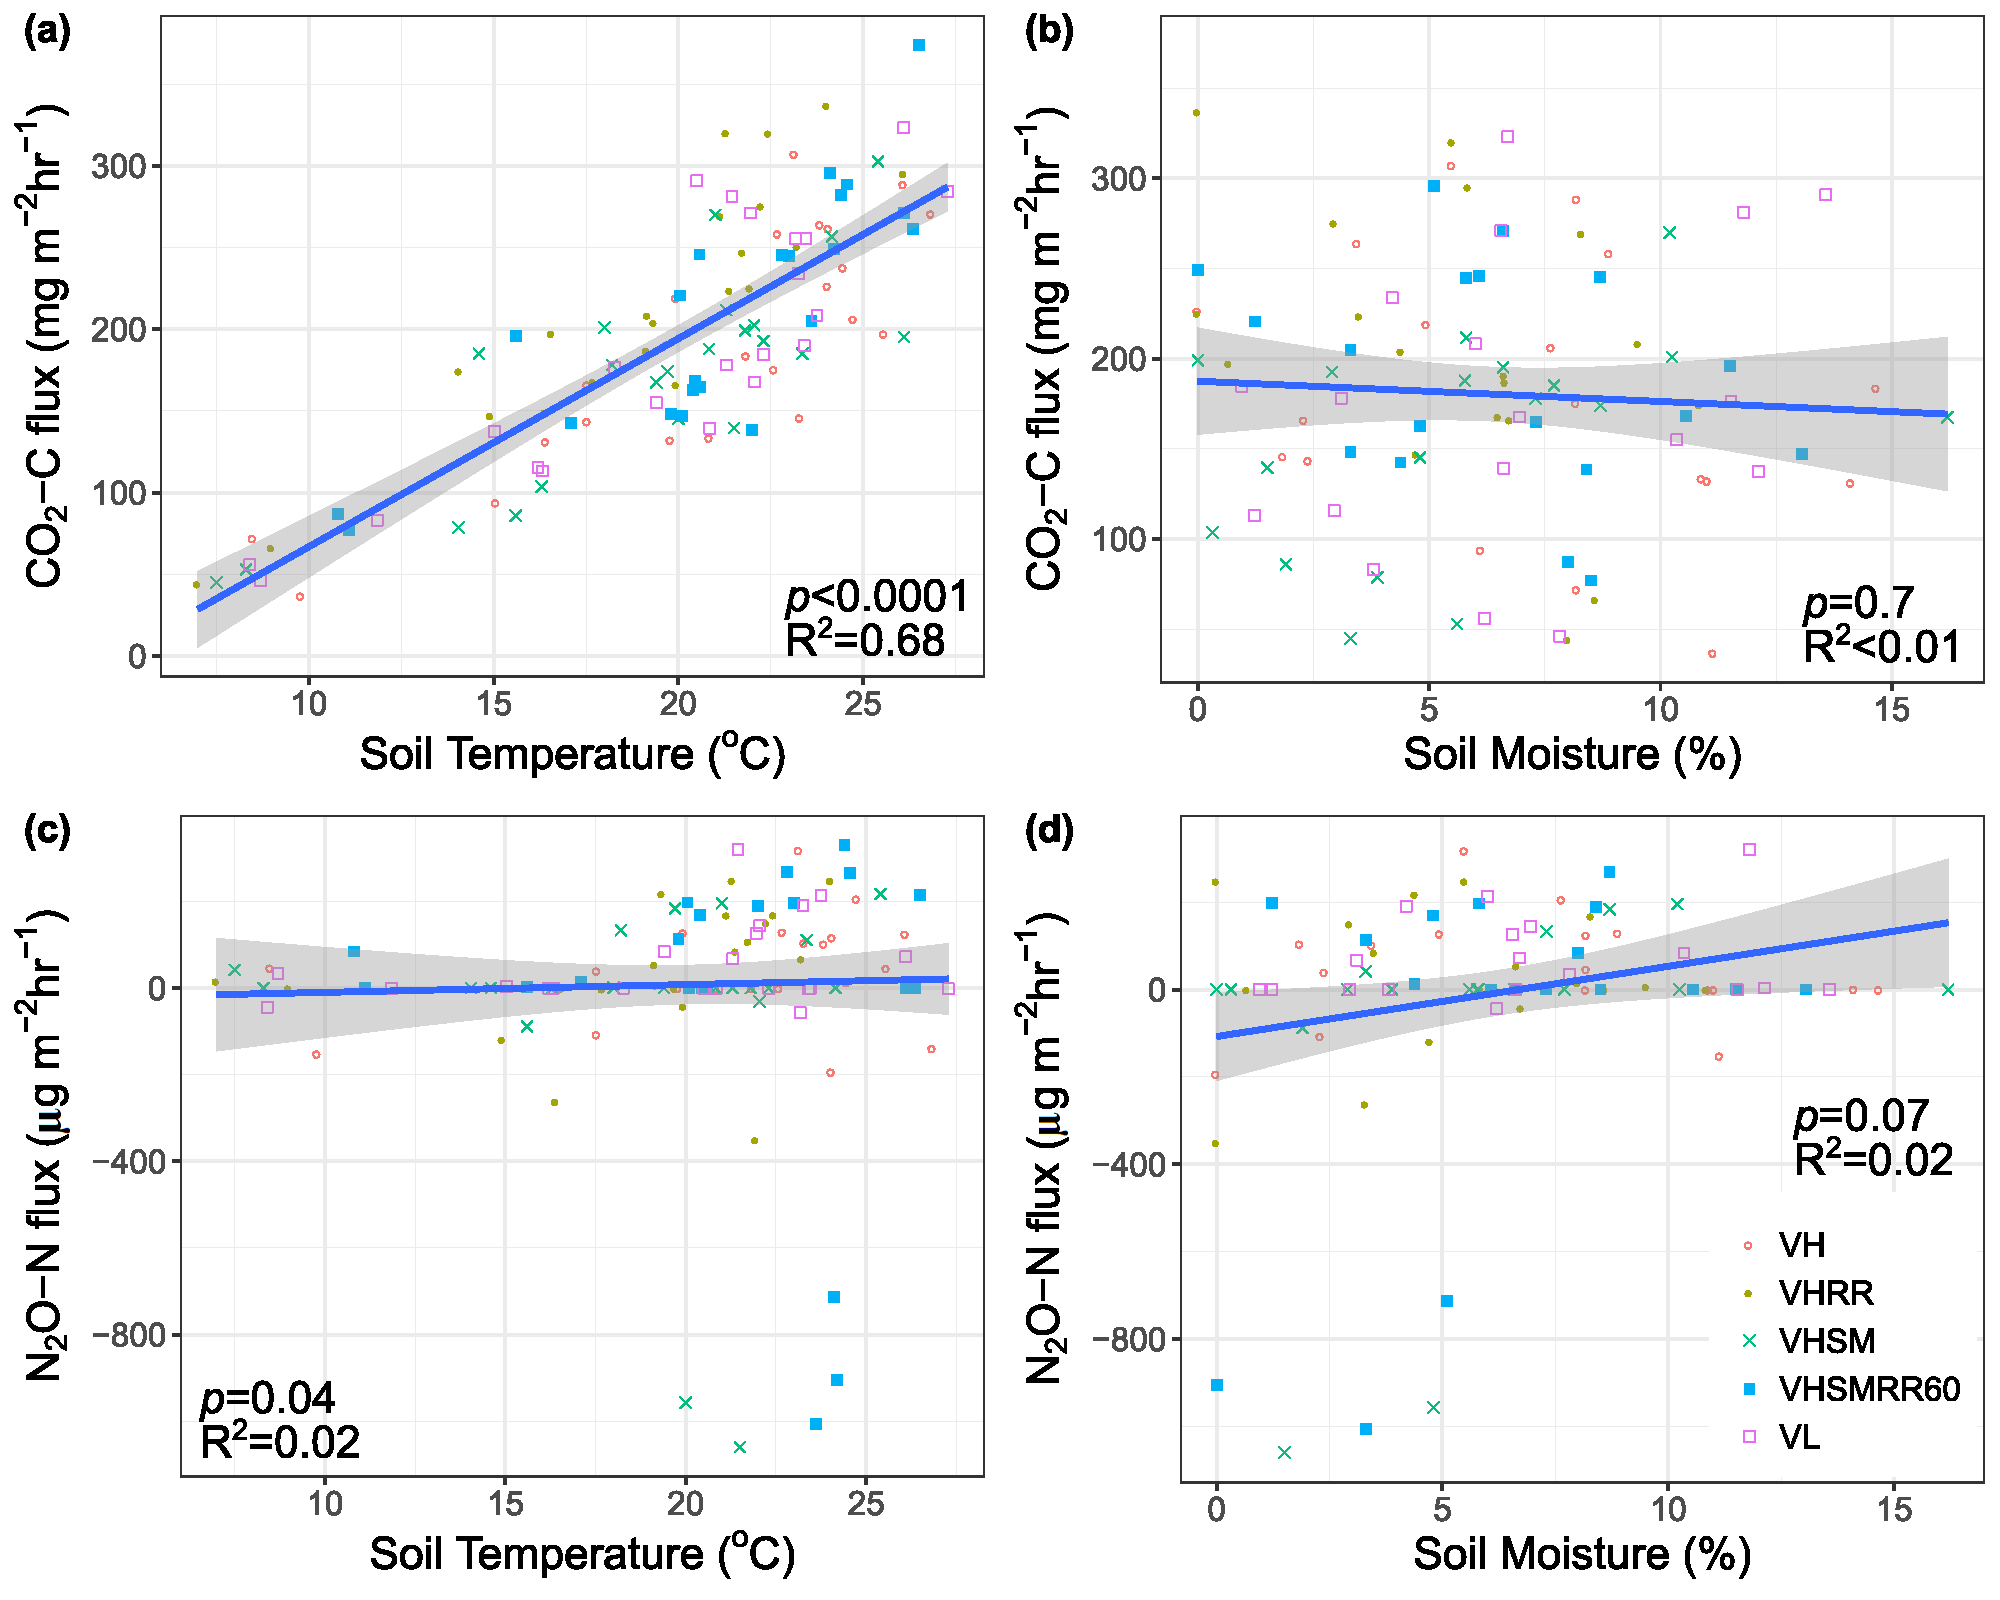
No significant treatment effects on either of the gas fluxes, soil temperature, or soil moisture were observed. During the sampling period, the mean growing season soil CO2–C flux across all eight bioretention cells was 194 ± 7 mg m−2 h−1 (May–October), with a range of 37 (9 May 2016) to 374 mg m2 h−1 (7 September 2015). Mean growing season soil N2O-N fluxes were thousands of orders of magnitude smaller than CO2-C fluxes with a mean of 10 ± 20 µg m−2 h−1, and ranged from −1100 (18 September 2016) to 330 µg m2 h−1 (10 August 2015). N2O-N fluxes were below zero for many sampling events in all eight bioretention cells, indicating N2O uptake (Figure 1). Overall, the soil CO2-C fluxes paralleled soil temperature changes with strong seasonal patterns, increasing in summer and decreasing in spring and fall (Figure 1). Soil CO2-C fluxes appeared to be strongly driven by soil temperatures in a linear fashion (R2 = 0.68, p < 0.0001; Figure 2). N2O-N fluxes also slightly positively correlated with soil temperature (R2 = 0.017, p = 0.04; Figure 2), but the resulting linear correlation was poor (Figure 2). Soil moisture did not significantly affect CO2-C or N2O-N fluxes. Both soil temperature (R2 = 0.81, p < 0.0001) and moisture (R2 = 0.49, p < 0.0001) showed significant temporal variability (Figure 1). Neither of the gas fluxes significantly correlated to microbial C biomass using linear regression.
3.2. Bioretention C and N Pools
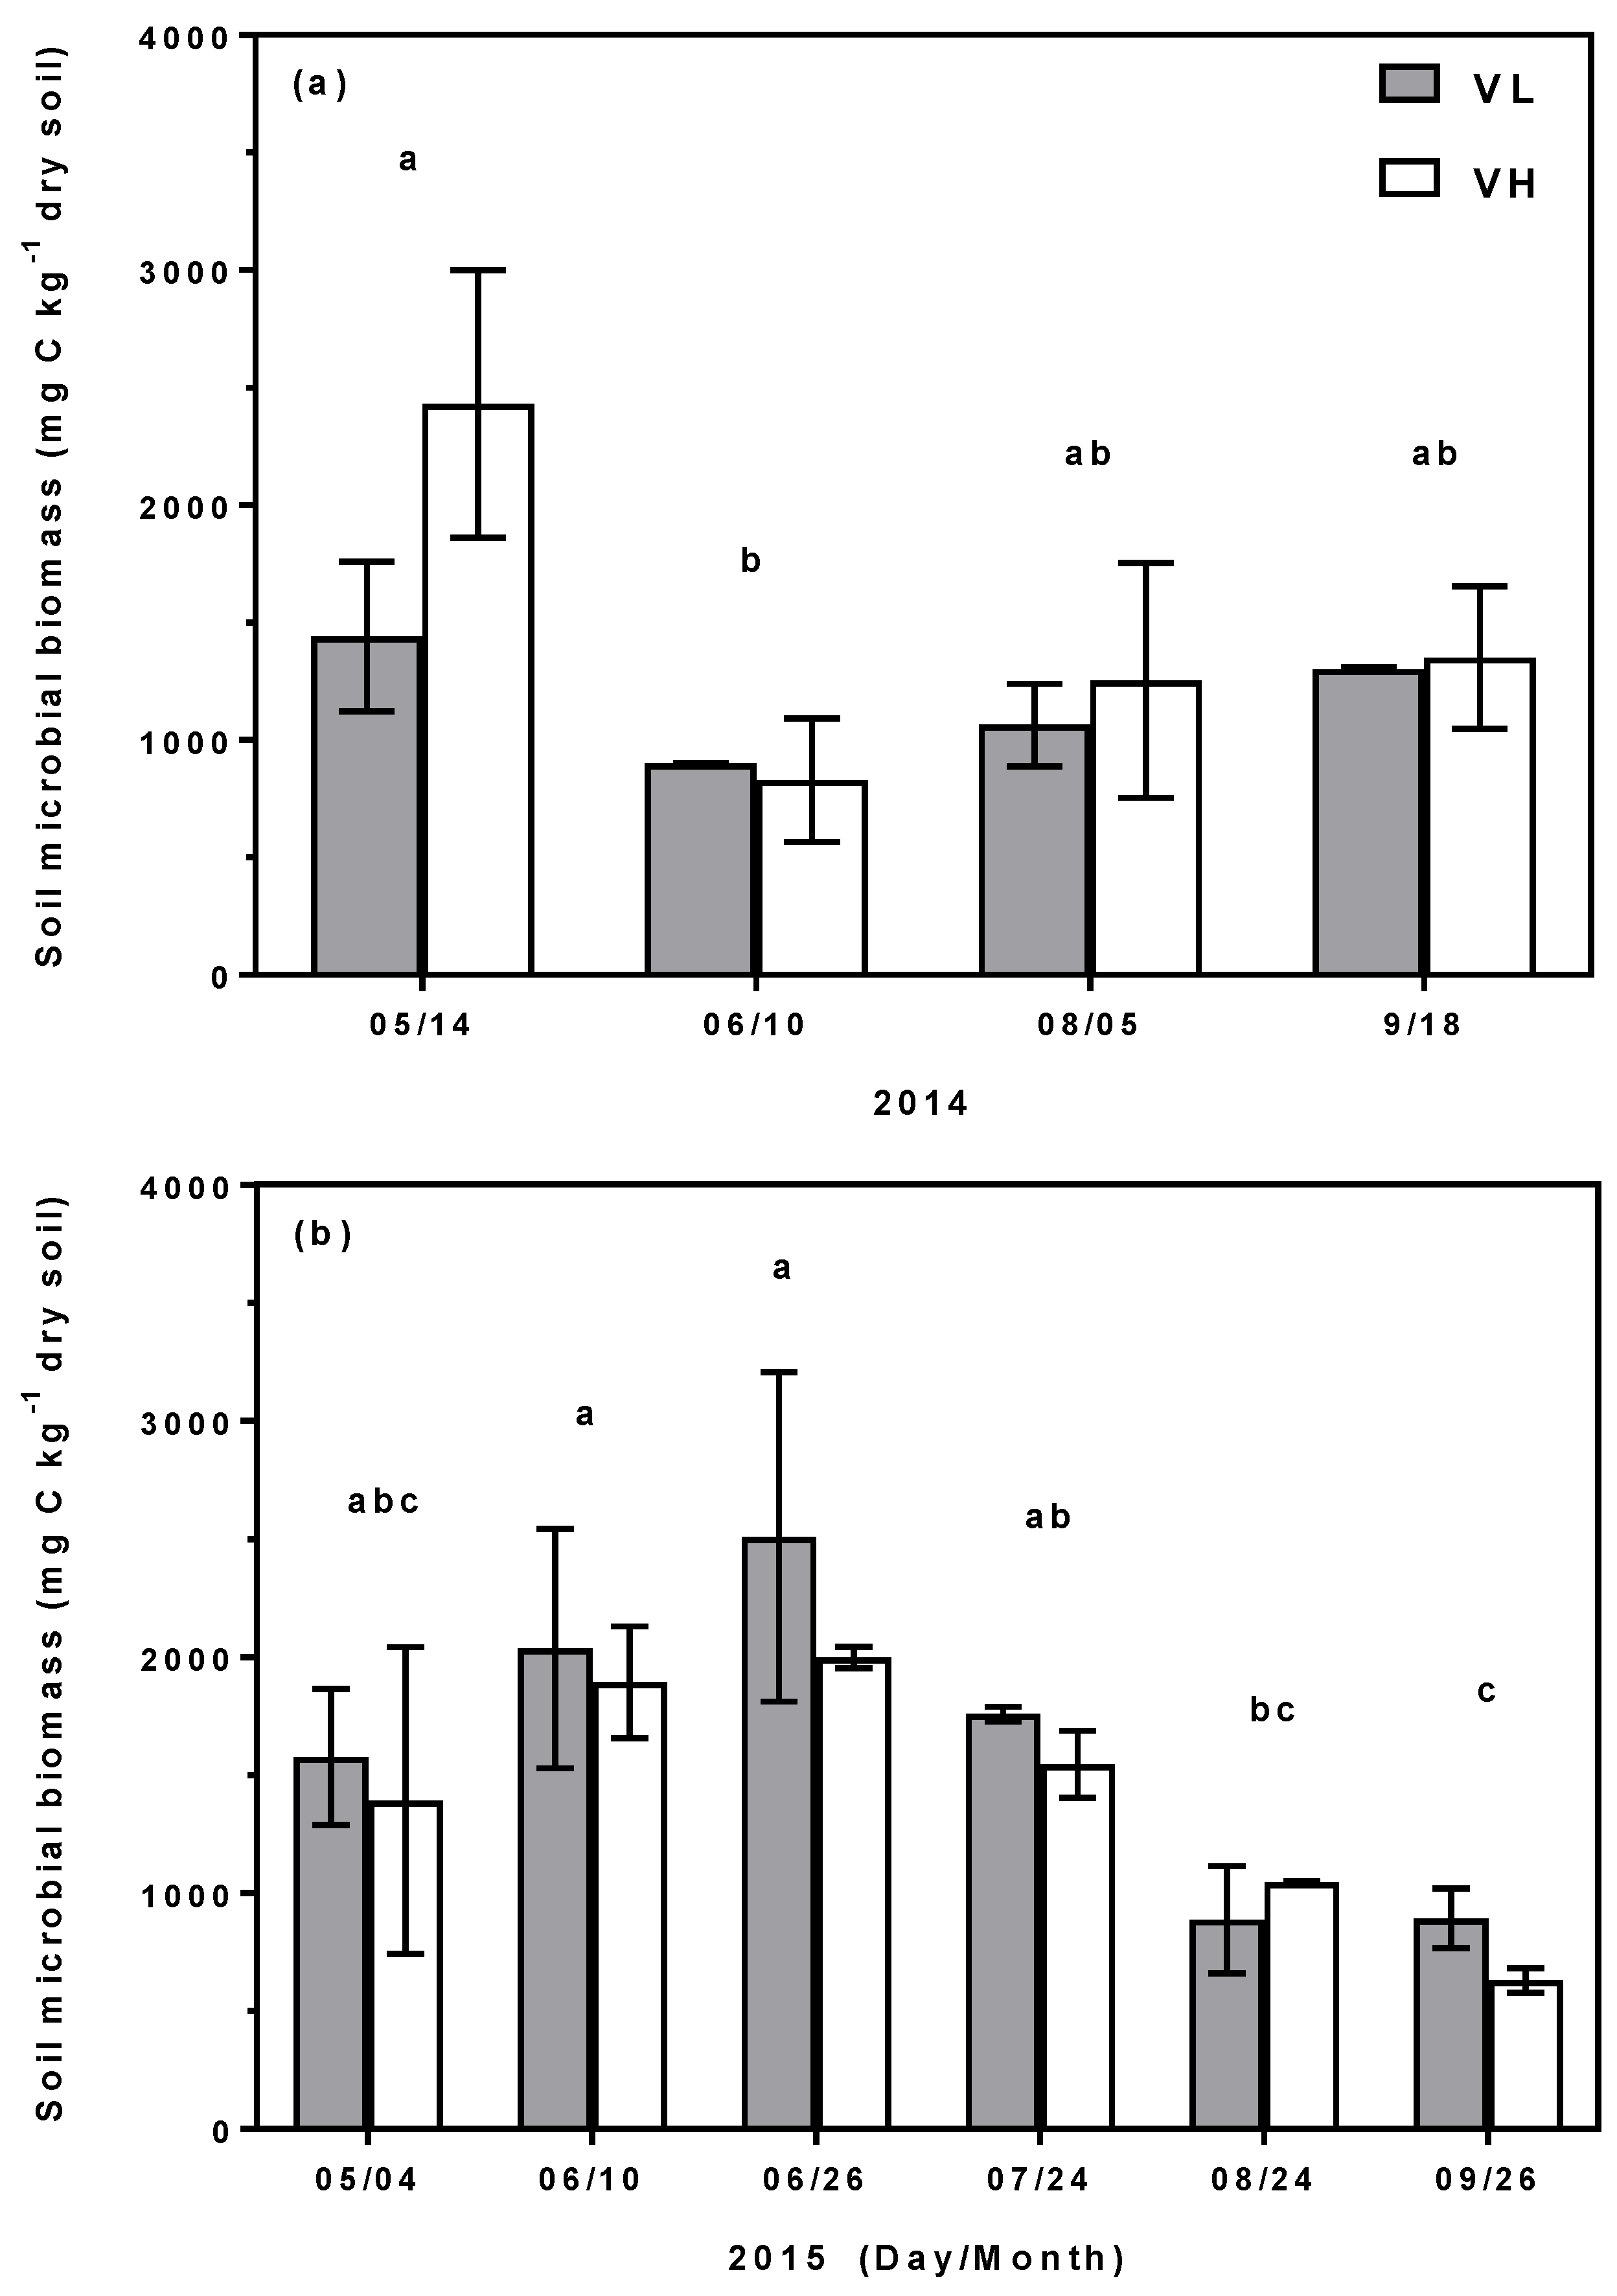
The low diversity (VL) bioretention cell that was chosen for a more in-depth analysis of belowground C and N storage showed a dramatic decrease in both total soil C and N content with depth (Table 2). The top 30 cm of soil profile stored approximately five times the C and N stored in the lower 30–40 cm soil profile (C:10.27 vs. 1.82 g kg−1 dry soil; N: 0.73 vs. 0.14 g kg−1 dry soil respectively; Table 2). The SMB concentration in the VL cell made up approximately 9% of the average total soil concentration measured (Table 2). Average SMB carbon concentration measured the same in both the VL and VH treatments: 1.436 ± 0.15 versus 1.436 ± 0.14 g C kg−1 dry soil respectively. Repeated measures analysis showed no significant differences in SMB carbon between the high and low diversity treatments, but significant temporal variation in SMB carbon were observed for each of the two years (Figure 3).
Plant concentration of C and N by far exceeded soil storage concentration in the VL cell per unit dry weight. Plant C and N concentrations were 28 and 5 times greater than that of the bioretention soil in the top 10 cm (Table 2 and Table 3). Between Hemerocallis and Panicum, Panicum appeared to have higher tissue C concentrations, while Hemerocallis had higher tissue N concentrations (Table 3). Tissue N concentrations were considerably higher in summer than fall for Panicum and Hemerocallis, while C concentrations seemed to have increased a little in the fall compared to summer (Table 3).
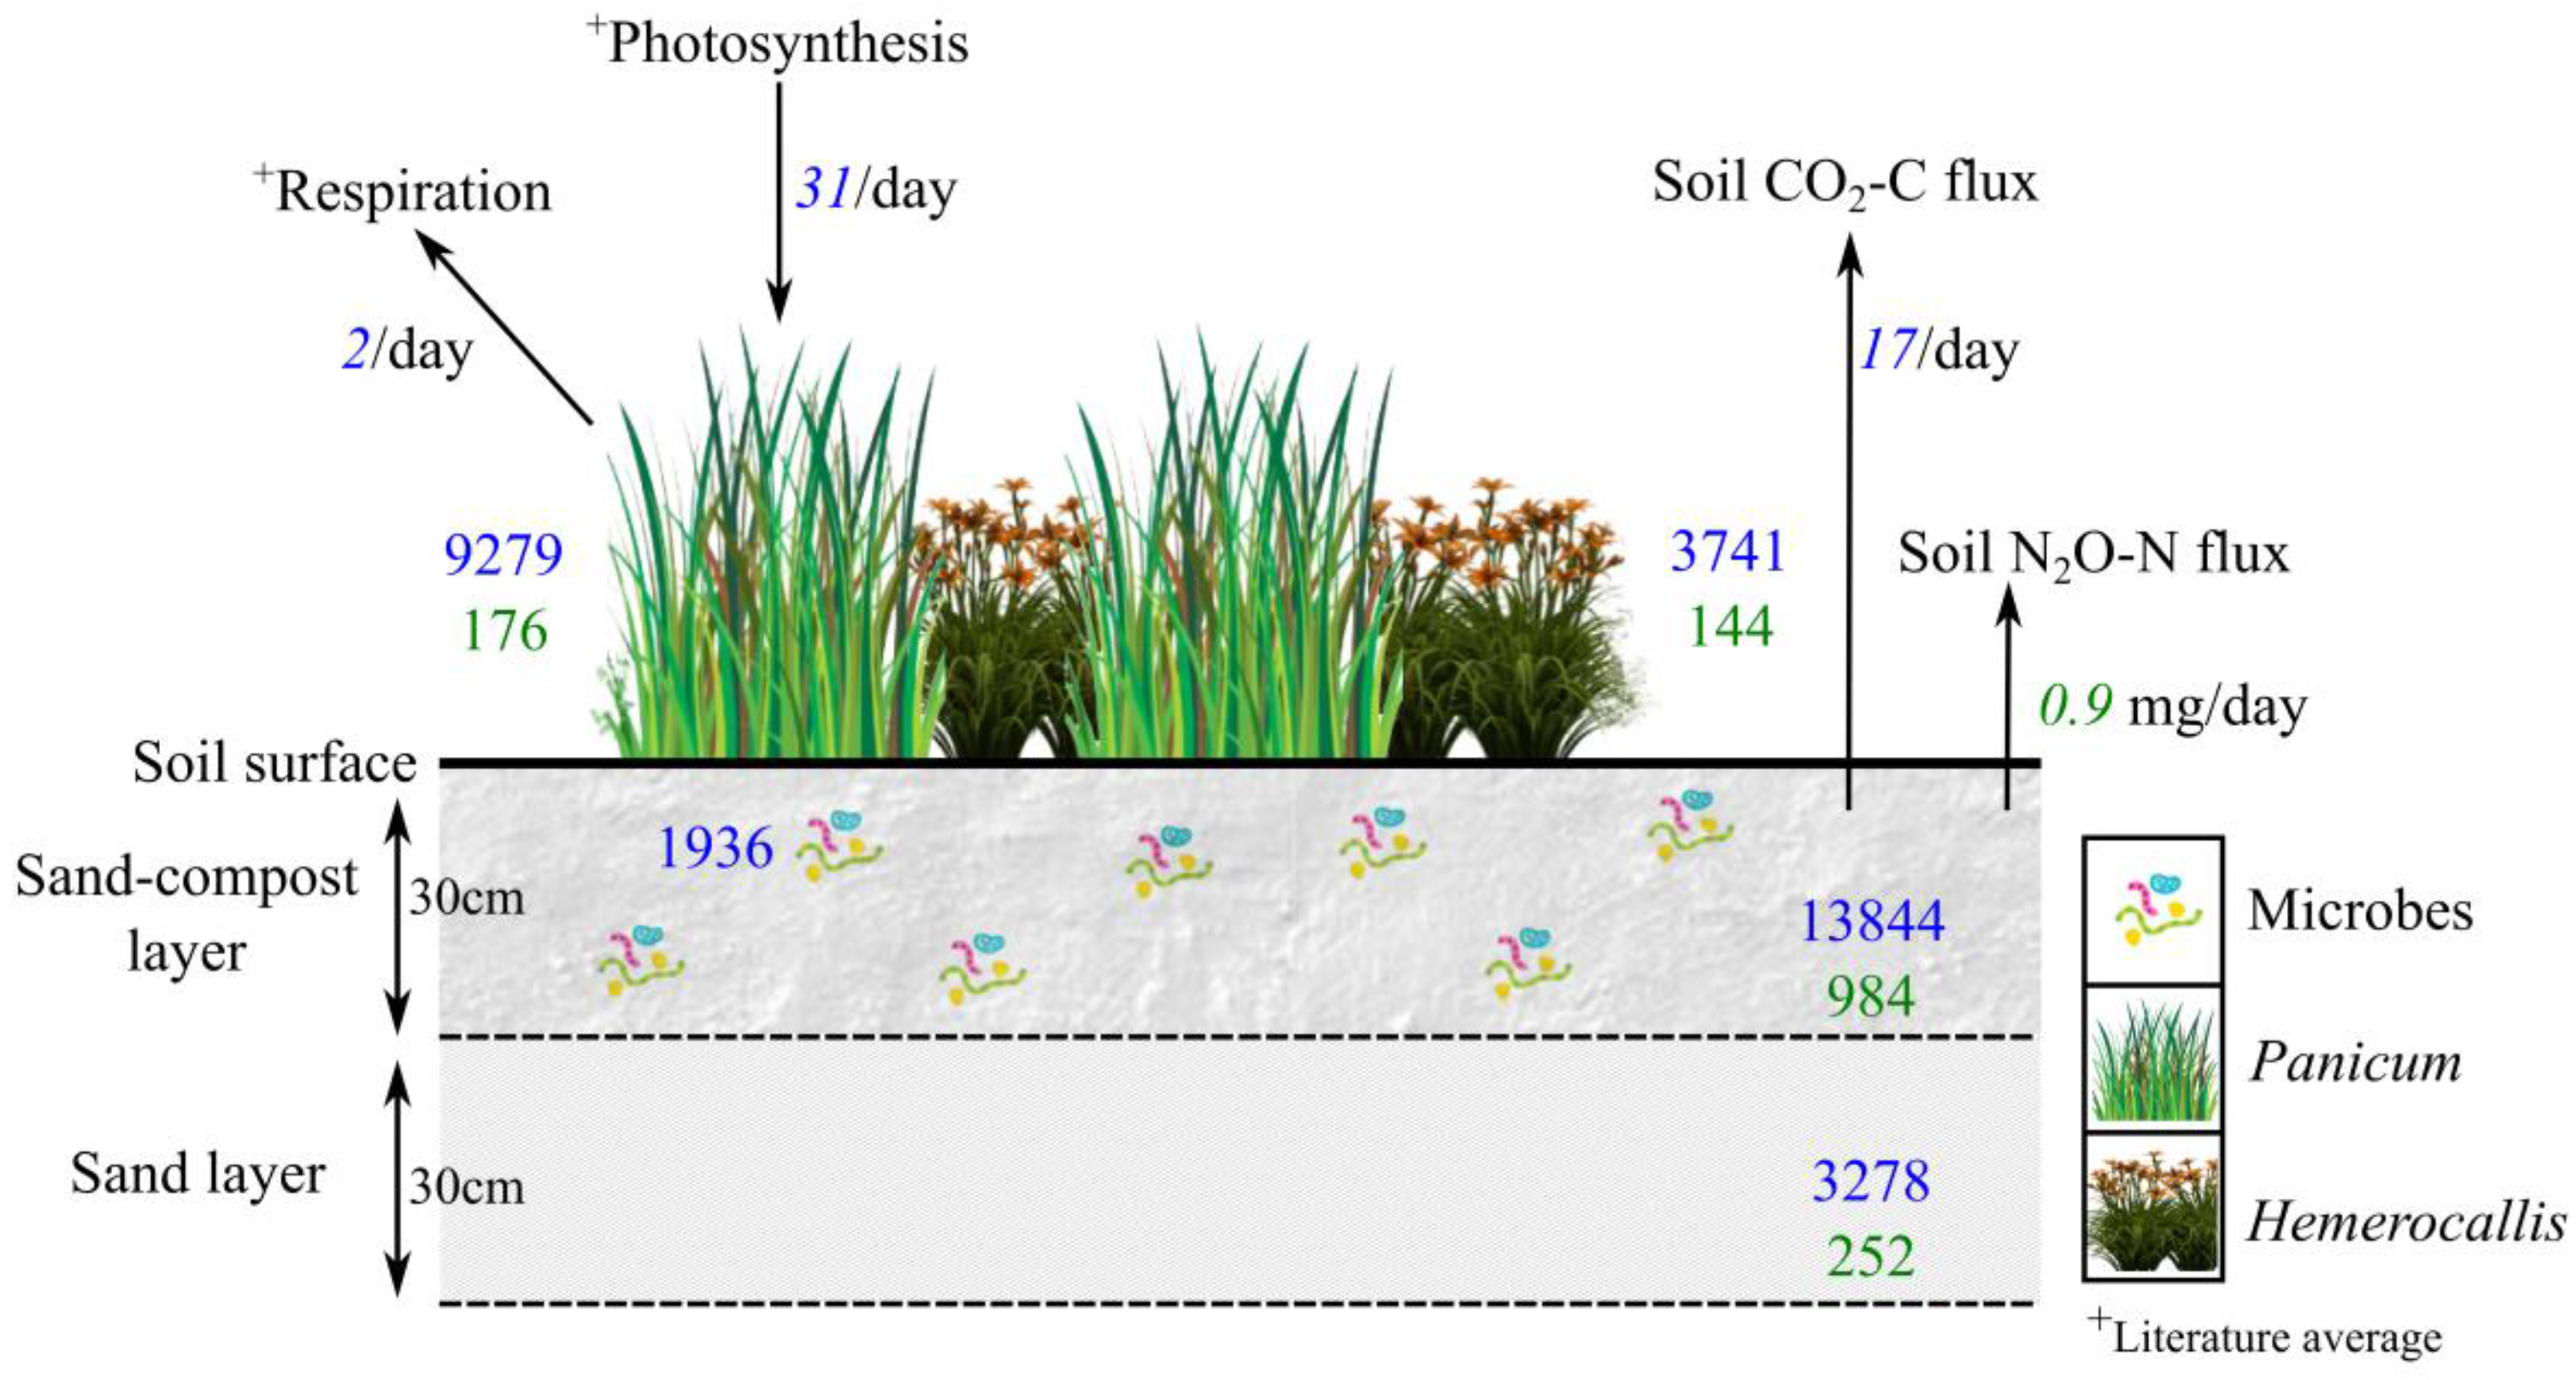
When extrapolating soil nutrient sequestration to the entire cell’s soil media volume (calculations detailed in Supplementary Materials), C sequestered in the top 30 cm vs. the lower 30 cm soil media was estimated to be 13,844 and 3278 g respectively (Figure 4). A portion of the soil C is sequestered in the microbial biomass fraction. Estimated C stored in the microbial biomass portion approximately amounted to 1936 g, which was 14% of the total soil C in the upper 30-cm layer.
Plants were larger reservoirs of C and N per unit dry mass relative to soil (Table 2 and Table 3). The amounts of C sequestered by Panicum and Hemerocallis were 9279 and 3741 g C respectively (Figure 4). The total amounts of N sequestered by the two species was 176 and 144 g N respectively (Figure 4). Excluding the winter months (November to April where no gas flux measurements were taken), gas fluxes represents 0.13% (17 g C day−1) of total soil C and 9 × 10⁻⁵% (0.9 mg N day−1) of total soil N lost daily from the top 30-cm of the bioretention soil media to the atmosphere (Figure 4). Dissolved organic C concentrations in the effluent averaged 6.1 mg L−1, with a range of 4.59 to 10.88 mg L−1.
4. Discussion
Our objective was to provide baseline estimates of soil CO2-C and N2O-N fluxes from the bioretention soils, as the fluxes represent a potential nutrient loss pathway from these systems, as GHGs. We examined whether these fluxes significantly varied among treatments associated with vegetation diversity, soil, and hydrologic (increased rainfall and runoff; RR) conditions, or with soil temperature and moisture. Estimating GHG fluxes is important for assessing potential environmental trade-offs associated with the water quality service provided by bioretention systems, as well as to better understand the mechanisms driving bioretention’s role in biogeochemical cycling within the greater urban context. To better quantify net C and N sequestration potential of the system, we also estimated C and N storage in the soil media and plants, which are critical bioretention design elements. Finally, we compared bioretention fluxes to those from a variety of other land-use types to examine relative C and N footprint based on gas flux measurements.
4.1. Treatment Effects on Gas Fluxes
Gas fluxes of CO2-C and N2O-N did not vary significantly with the different vegetation, soil, and hydrologic treatments applied to the bioretention cells. Across all treatments, gas fluxes increased significantly with temperature but not soil moisture. Average CO2 fluxes were slightly higher in the treatments receiving the enhanced rainfall and runoff (RR, and SMRR60; SorbtiveMedia with 60% additional RR), but results were not significant. From the percent cover measurements, all RR treatment cells had the maximum amount of plant coverage throughout the monitoring period in both years (up to 100% coverage in RRSM60, and up to 98% coverage in RR cells from June through August). The higher percent vegetation cover could be associated with greater root proliferation. Belowground C allocation (e.g., roots, root exudates) could therefore influence root respiration [35], and increase microbial respiration [36], both of which contribute to the soil CO2-C efflux. For N2O-N fluxes, the highest average flux observation was made in the VL treatment, and lowest (and negative) was in the SM treatment. Interestingly, VL had the highest soil NH4+-N concentrations, while SM had the lowest (0.575 ± 0.08 ppm vs. 0.0137 ± 0.4 ppm respectively) among the different treatments (detailed averages shown in Supplementary Materials Figure S1). The difference was not significant due to high variability in the data. Nevertheless, higher NH4+ concentrations can lead to increase nitrification potential, and as more NH4+ is available to undergo nitrification, this can increase nitrification contribution to N2O [37], which could corroborate the trend observed here.
4.1.1. CO2 Fluxes
As expected for any soils containing organic matter, the bioretention soils here were always a source (or efflux) of CO2 (Figure 1). Soil CO2 efflux is the pathway by which stored soil C is returned to the atmosphere via autotrophic root respiration and heterotrophic microbial respiration. Besides this study, there are only two published studies examining CO2 fluxes from bioretention filters by Grover [12] in Melbourne, Australia and McPhillips [17] in Ithaca, New York, USA. Grover [12] measured mean CO2-C fluxes of 102.2 mg m−2 h−1 from a sandy loam bioretention, and 98.3 mg m−2 h−1 from another sandy loam (80%) bioretention amended with compost (10%) and hardwood mulch (10%) with an internal saturated zone (ISZ). McPhillips [17] measured higher fluxes of 367.9 mg m−2 h−1 from a bioretention amended with 40% compost (15 cm of compost mixed to an approximately 38 cm soil depth). This study observed much higher CO2-C fluxes with a mean of 194 ± 7 mg m2 h−1 compared to the means observed in Grover et al. (102 and 98.3 mg m−2 h−1), which may be attributed to the high amounts of compost (40%) present in the top 30 cm of the soil media. Compost adds C, N and P, stimulating microbial biomass and activity [38,39], which likely increases the microbial contribution to soil CO2-C evolution. McPhillips [17] observed almost twice the amount of CO2-C fluxes than this study, which could have also resulted from compost amendments, as well as initial soil disturbances from tillage [40], given that they conducted gas measurements approximately one year following cell establishment during which period the soil was tilled to 38 cm depth.
The positive fluxes of CO2-C from bioretention soils to the atmosphere, however, can likely be offset by photosynthetic uptake and sequestration of C by biomass [41,42,43] and soil [44]. This is also highlighted later by our study (see ‘Carbon and nitrogen partitioned stocks in soils, microbial biomass, and plants’ below).
4.1.2. N2O Fluxes
Bioretention was not a significant source of N2O. N2O-N fluxes varied between uptake and emission, like in a study by McPhillips and Walter [26], which examined N2O-N fluxes in dry and wet grassed detention basins. Across the wet and dry basins, their N2O-N fluxes ranged from −2.4 to 26.9 µg m−2 h−1. Their maximum peak of 26.9 µg m−2 h−1 [26] is orders of magnitude lower than the peak observed in this study of 330 µg m−2 h−1 (Figure 1). Surprisingly, although they observed greater N2O-N fluxes from dry detention basins relative to wet basins, due to wetter conditions promoting denitrification fully to N2, the fluxes were not significantly different between the two basins. This suggests N2O production associated with nitrification rather than denitrification in these stormwater basins. The same author measured average N2O-N fluxes of 23.4 µg m−2 h−1 from a bioretention [17], which was derived by modifying an existing grassed detention basin mentioned above. Meanwhile, Grover [12] observed mean N2O-N fluxes of 13.8 and 65.6 µg m−2 h−1 from the two bioretention cells each. Our mean fluxes of N2O-N (10 µg m−2 h−1) are lower than mean fluxes of McPhillips [17] and Grover [12] study, despite having a greater proportion of compost in the soil than the Grover study. High fluxes from McPhillips [17] could result from tillage increasing microbial activity and therefore mineralization of compost N. Compost application increases microbial biomass and functional diversity [45], and C and N nutrients are plentiful in the compost for the various microbes to mediate nitrification and denitrification reactions when conditions are ideal.
Soil NO3−-N concentrations in the bioretention units were much higher (13 times) than soil NH4+-N concentrations (Table 1; also see Supplementary Figure S1 for full data), suggesting a strong possible occurrence of nitrification [46], forming NO3− in the soil, which subsequently is also the substrate for denitrification. N2O efflux from the soil can be due to nitrification and denitrification [47]. These reactions can occur simultaneously, as aerobic and anaerobic microsites can develop within the same soil aggregate [47], and their relative contribution to N2O efflux must be studied either isotopically through 15N-labelled compounds [48], or in the laboratory using acetylene inhibition techniques [49]. The case for nitrification induced N2O is stronger relative to denitrification in our study since the soil moisture during the sampling period was relatively low at an average of 6% (maximum of only 16%; Figure 1), and it is likely that nitrification rates exceeded denitrification rates at the relatively low soil moisture range observed here. Denitrification requires low-oxygen conditions, which were not observed during the sampling period, but periodic N2O flux stemming from denitrification likely occurred from saturated microsites within the soil media layers. In addition, occasional N2O production could be a result of incomplete denitrification due to the low soil moisture levels observed in the bioretention cells, where the N2O produced as an intermediate in the denitrification reaction could not be further reduced to inert N2 gas.
4.2. Environmental Effects on Fluxes
Fluxes of CO2-C were very predictable throughout the season, significantly increasing with warmer temperatures and decreasing with cooler temperatures (Figure 1 and Figure 2), while N2O-N showed no seasonal pattern (Figure 1). Temperatures are likely tied to corresponding plant and microbial activity, which strongly drive soil CO2 efflux rates [50,51,52]. Strong relationships between soil CO2-C efflux and soil temperature are well documented in the literature [53]. Soil temperature was weakly correlated with soil N2O fluxes (p = 0.04, R2 = 0.017; Figure 2) due to large variability in fluxes at relatively higher temperatures and near zero fluxes evident throughout the season (Figure 2). Neither CO2-C nor N2O-N was significantly influenced by soil moisture; it may be that respiration was never water-limited in the study as the range of values was narrow. Soil moisture impacts on gas fluxes may only be important in extreme conditions or times, i.e., very dry (desert, drought) or wet (waterlogged soils, wetlands and bogs). Søvik [54] measured CO2 efflux, with summer and winter averages of 187.5 and 50 mg m−2 h−1, respectively, from constructed wetlands in northern Europe. Summer and winter N2O efflux averaged 3790 and 192 µg m−2 h−1, respectively, in the same study. For both gases, temperature was positively correlated with gas fluxes. Various other environmental factors besides soil temperature and water content, and NH4+-N and NO3−-N concentrations regulate gas fluxes such as the amount of OM, mineralizable carbon, and microbial biomass [55,56,57], which are relevant to various stormwater control structures. Decina [56] observed significant and positive correlation of soil CO2 efflux with soil organic matter concentration, soil C:N ratio and the depth of the leaf litter layer. Bettez and Groffman [55], who measured denitrification rates (1.2 mg N kg−1 h−1) from stormwater control measures (wet ponds, dry detention ponds, dry extended detention, infiltration basin, filtering practices), observed that the rates strongly correlated with soil moisture, OM, microbial biomass, and soil CO2 efflux across sites. This may also be the case in our bioretention units, but in our study, CO2 fluxes were only significantly related to temperature, perhaps because of the limited number of coinciding samples for CO2, OM, and microbial biomass.
4.3. Carbon and Nitrogen Partitioned Stocks in Soils, Microbial Biomass, and Plants
The expansion of impervious cover associated with urbanization results in loss of soil C. Since urban development typically occurs at the expense of agricultural and forest lands, it is therefore necessary to consider the potential of developed lands to sequester C [7]. Green spaces like bioretention, by replacing impervious surfaces with porous soils and vegetation, offer opportunities to increase C (and N) sequestration in urban landscapes [7] while simultaneously mitigating stormwater problems (e.g., stormwater infiltration, peak flow attenuation, groundwater recharge) and restoring ecosystem functions within built environments (e.g., wildlife refuge, cooling of air, beautification of landscapes, benefits to human health [7,43,58]).
The VL treatment cell was chosen to study C and N partitioning in the different soil, microbial biomass, and plant stock components within a bioretention cell. We are aware of no previous studies that have calculated C and N partitioning among the soil, microbes, and plant stocks within bioretention cells. Of the two depth increments (0–30 cm vs. 30–40 cm) we analyzed to assess nutrient storage in the soil media profile, the upper layer showed much higher total C and N concentrations (10.27 and 0.73 g kg−1 dry soil respectively) than the deeper layer (1.82 and 0.14 g kg−1 dry soil respectively; Table 2). Thus, the total C and N stored in the upper soil media layer was approximately four times greater than the layer below (C: 13844 vs. 3278 g, N: 984 vs. 252 g). This is not surprising given that 40% of the original upper soil media consists of compost, with the remaining 60% being sand. Though the lower media (below 30 cm depth) consists entirely of sand, migration of nutrients and organic particulates from the upper layers over time as well as belowground inputs from plants (roots) may have contributed to C and N observed there. In fact, the bottom profile may have greater ability to capture and sequester C and N throughout the lifetime of the cell. Designers could potentially take this into account, considering attributes that make bioretention more effective for nutrient sequestration, such as by building deeper systems or utilizing greater volumes of the filter media in cases where achieving depth/volume is possible and groundwater is not a limiting factor. In both the soil media layers, a portion of C and N may be taken up by microbes and plants or be recycled back to the atmosphere in gaseous losses. A portion can leach out in the bioretention effluent as dissolved organic C. Average dissolved organic C leaching of 6.1 ± 1.6 mg L−1 was measured in the effluent from a few cells (VL, VH, and SM treatments) across three rain events. Average effluent NO3−-N and total N concentrations were 1.3 and 2.7 mg L−1, respectively, across the seven cells for 50 storms that were monitored in 2015 and 2016 [20].
The total soil C held in the bioretention unit, including in plant biomass, was 30,142 g, while the daily loss (excluding winter months from November to April) of C to the atmosphere from soil respiration was approximately 17 g day−1, which represented 0.13% of the upper layer total soil C pool (Figure 4). This may appear small, but when extrapolated to the six months period from May to October (183 days), at this rate, 24% of the total soil C pool is lost as CO2-C flux. The total standing C in bioretention vegetation was 13,020 g, representing the second largest C pool in the unit. Generally, approximately 40% of a plant’s dry mass consists of C fixed by photosynthesis [59]. Some portion of the assimilated C in vegetation is lost to atmosphere in plant respiration, which is a component of the ecosystem C balance [60]. The net ecosystem C flux will change as the balance between photosynthesis and respiration changes [60]. These would need to be quantified to accurately determine ecosystem level C-sequestration, which this study did not measure. Nevertheless, plants are a net C sink, where photosynthetic uptake of atmospheric C greatly exceeds respiratory losses of C.
As previously described, one of the two VL bioretention cell plant species is Panicum. Beyond bioretention this species has been well-studied due to its restoration, agricultural, and biomass applications. Sanderson [61] measured leaf photosynthesis and respiration rates of various Panicum cultivars in three different regions in the Southeastern US. Average Panicum photosynthesis rates were fourteen times higher than respiration rates: 31 vs. 2.18 g C day−1 (Figure 4). Therefore, the net C sequestration potential of bioretention systems renders promising due to the ability of soils and plants to act as great C sinks. However, it is important to consider the various factors influencing the C balance, as fluxes (both respiratory and/or photosynthetic) can vary with soil media composition, addition of compost/fertilizer, plant species, plant size and age, seasonality, soil temperature, and soil moisture (precipitation and evaporation balance) [7,50,51,62].
The size of the soil and plant N pools and soil N fluxes in bioretention soils are both smaller than the respective C pools and fluxes. For example, soil N fluxes averaged 0.90 mg day−1 while C fluxes averaged 17 g day−1 (excluding winter months); Figure 4). However, one caveat is that the study did not measure all soil N fluxes including gaseous losses of ammonia (NH3) from ammonification, N2 via denitrification, other fluxes of C and N solutes in the influent and effluent (e.g., via compost leaching), and internal plant gas transfers. Regardless, the lower levels of N2O-N emissions from bioretention are a favorable outcome considering that N2O is a potent gas, with 300-times greater global warming potential relative to CO2. N fluxes may seem negligible at the site scale in relation to C fluxes, but large-scale implementation of bioretention and other green infrastructure may bring about indirect changes in the urban landscapes that could potentially influence N fluxes and cycling at an ecosystem scale and in areas downstream. Where cities have expanded in their impervious surfaces, catchment hydrology has been altered due to routing stormwater into closed engineered pipes and sewers, in some cases resulting in the lowering of the water table and riparian drying [16]. This has negatively impacted the ability of low-lying riparian zones to intercept stormwater and function as sinks for upland-derived NO3− via denitrification process [63]. At larger scales (watersheds, urban areas), this can cause a shift in N forms, fluxes, and balance. Large-scale implementation of bioretention could restore some of this functioning.
4.4. Comparison of Bioretention Fluxes to Other Landscapes
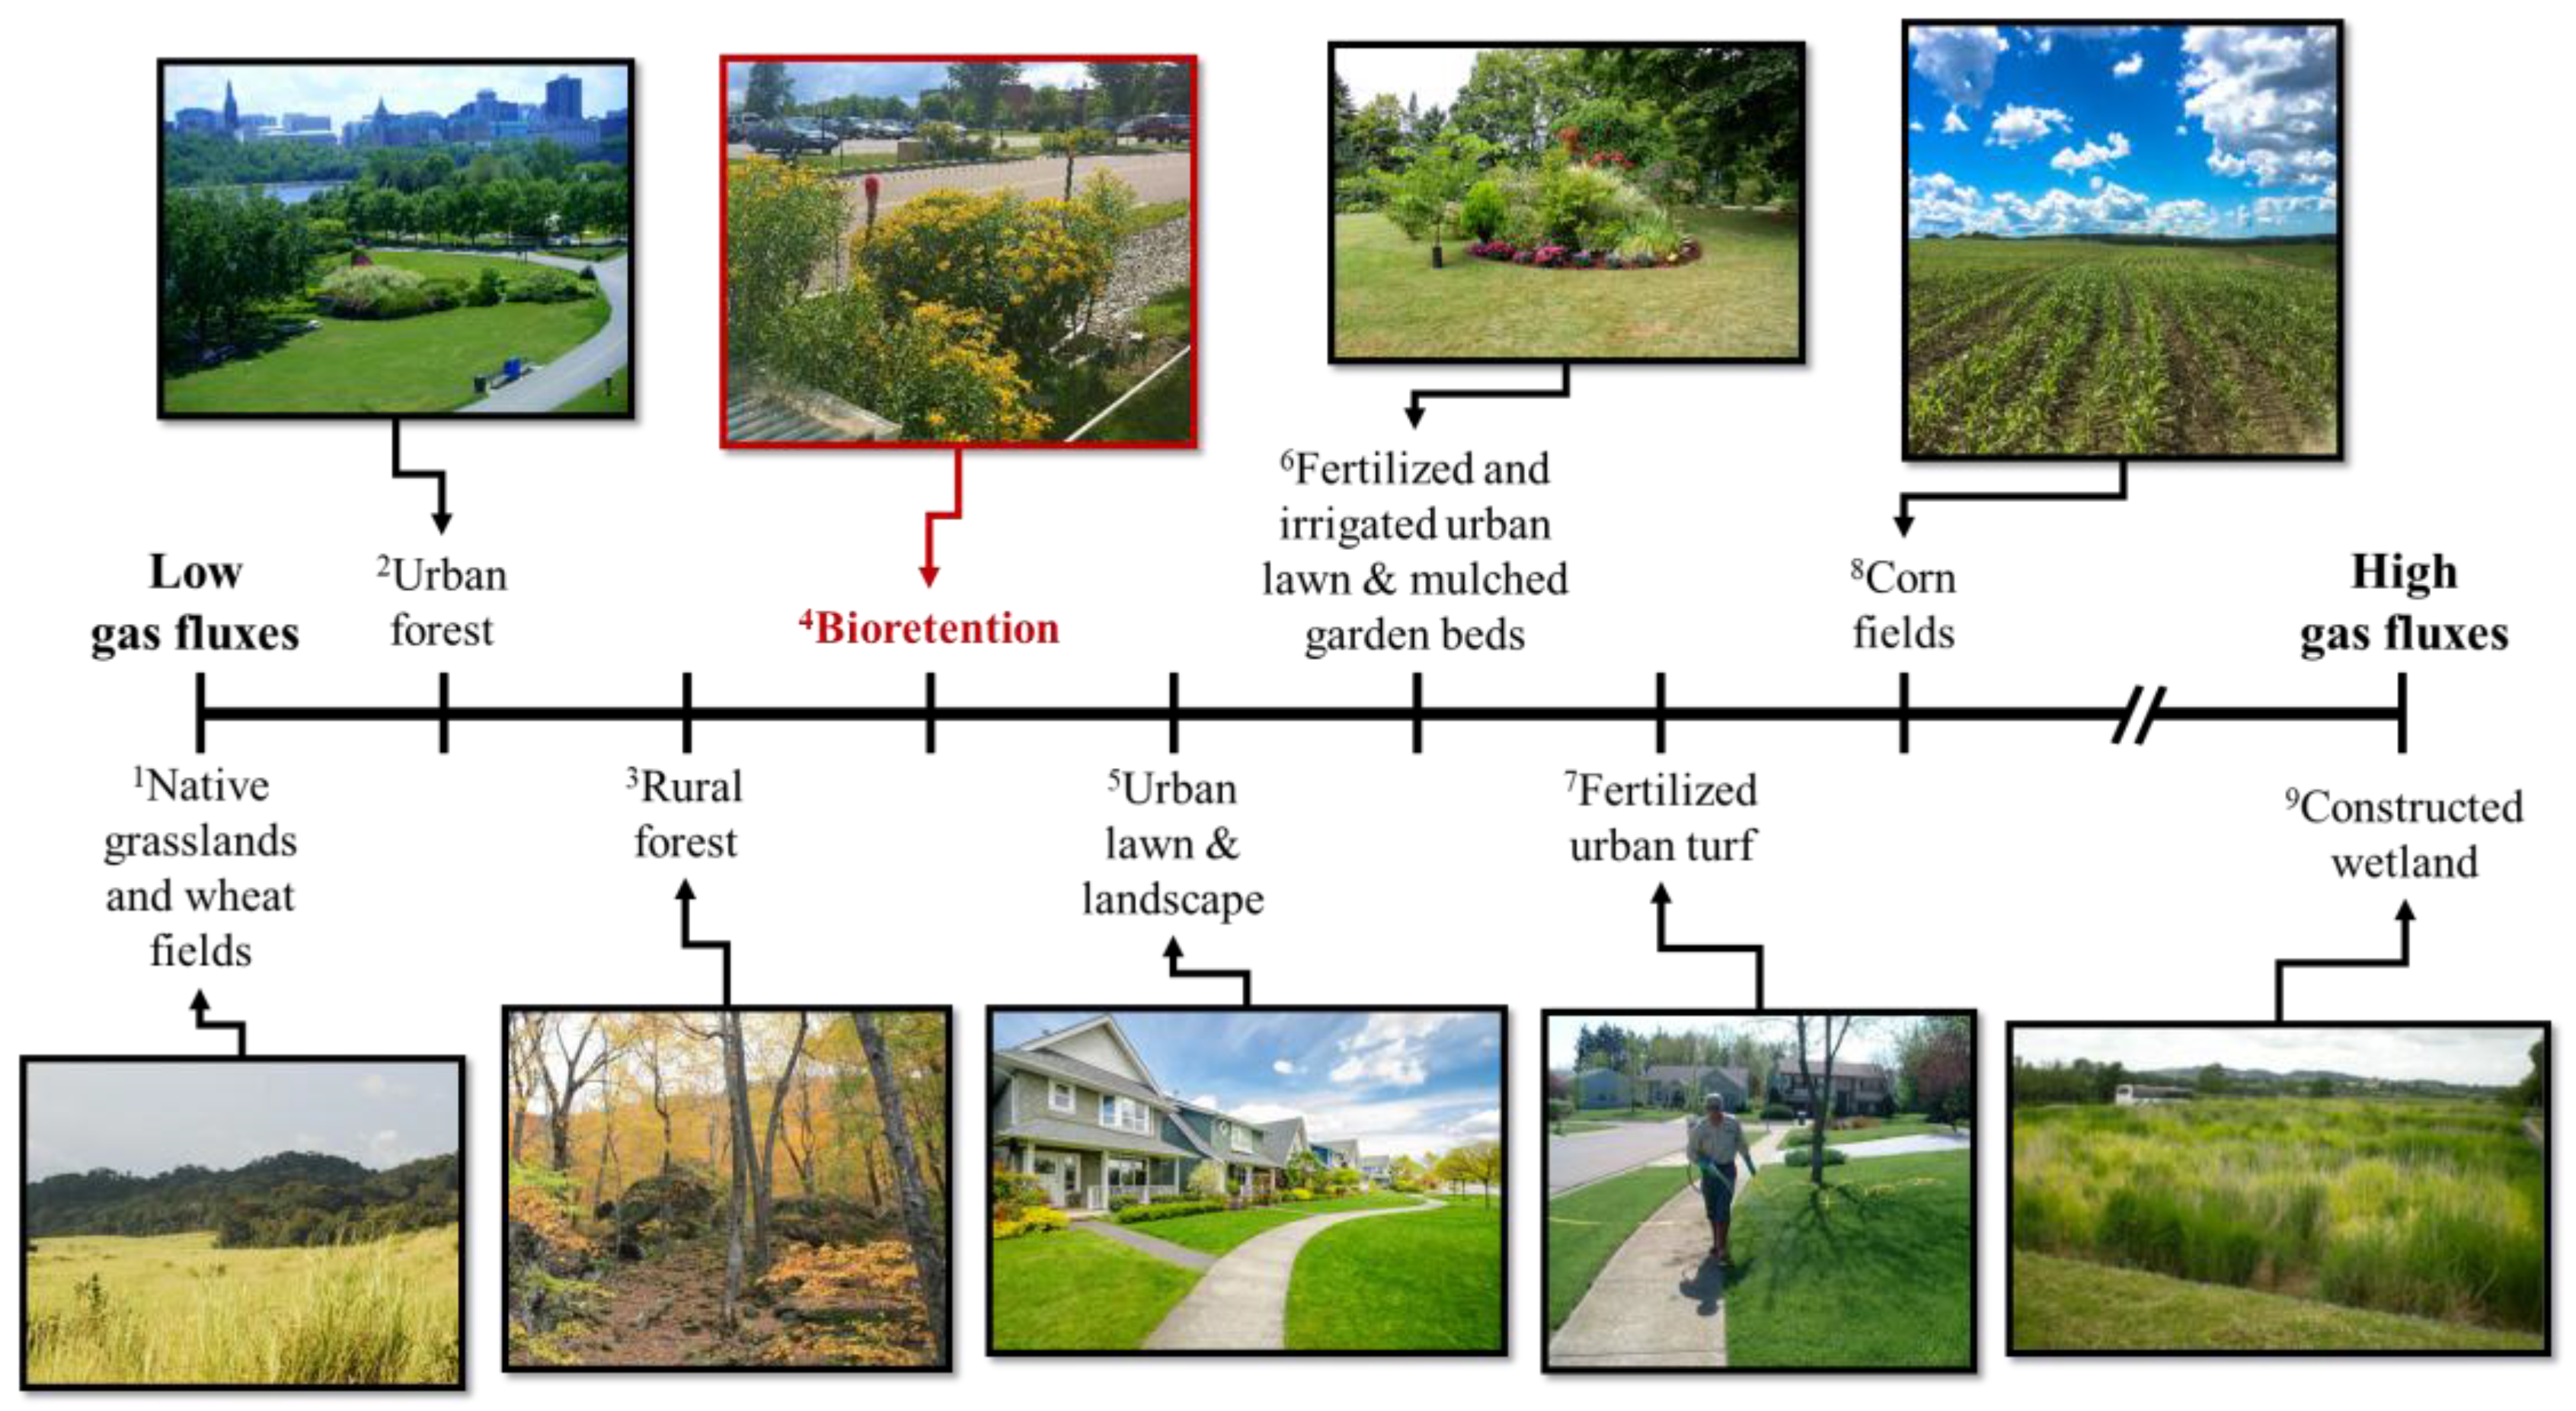
In some other stormwater treatment systems such as constructed wetlands, which are designed to be constantly saturated, the emissions of CO2 and N2O are likely to be high [54]. Søvik [54] observed CO2-C fluxes in the range of −35 to 3875 mg m−2 h−1 in constructed wetlands in several northern European countries, where even though the fluxes varied between sink and source, the maximum flux was orders of magnitude higher than found in our study (Figure 5, Table 4). High fluxes in the constructed wetlands could be attributed to variable flowrates/volumes of the influent [64] and fluctuating water levels bringing intermittent oxygen into the system, increasing CO2 efflux via decomposition, and affecting both nitrification (increasing the rates) and denitrification (interrupting the last biochemical step conversion to N2) in a way that contributes to more N2O release [65,66]. Søvik [54] measured N2O-N fluxes of up to 41,600 µg m−2 h−1 from the same constructed wetlands. In another study, Liikanen [53] measured average CO2-C and N2O-N fluxes of 566 mg m−2 h−1 and 19 µg m−2 h−1, respectively, from a constructed wetland in northern Finland. While N2O fluxes may appear at the lower range, impacts on increased CH4-C fluxes (17 mg m−2 h−1; [53]) from constructed wetlands should also be considered when evaluating the overall tradeoffs of these systems. The average fluxes of CO2-C and N2O-N in this study are lower than average fluxes measured from fertilized urban lawns and turf and mulched garden beds [67,68], but greater than in native grasslands and wheat fields that received no irrigation and fertilization ([69]; Figure 5). Average CO2-C fluxes observed in this study are lower than fluxes reported by Decina [56] from urban lawn and landscaped sites, but greater than average fluxes from urban [56] and rural forests [70] (Figure 5). For N2O-N, our average and range of fluxes were much smaller than the range of fluxes (30 to 900 µg m−2 h−1) observed from fertilized corn fields ([71]; Figure 5). Both Ma [71] and Kaye [69] observed increased N2O-N emissions following fertilization as well. In the latter study, maximum N2O-N fluxes (350 µg m−2 h−1) coincided with fertilization and irrigation events [69]. Our findings indicate that bioretention C and N fluxes can generally be expected be relatively greater than the ranges of fluxes produced by forests (urban and rural) and native grasslands and relatively less than fluxes produced by intensively landscaped areas, fertilized lawns, corn fields, and constructed wetlands. Among bioretention systems, fluxes may vary due to differences in design configuration, soil media composition, and spatial and temporal factors. These results underscore the need for more research that should focus on maximizing the nutrient capturing efficiencies of these systems and possible tradeoffs in conditions that minimize GHG emissions, while simultaneously promote water quality treatment.
5. Conclusions
This study assessed CO2-C and N2O-N fluxes from eight roadside bioretention cells in their third and fourth year of implementation in Vermont, USA. The cells received different vegetation, soil, and enhanced rainfall and runoff treatment designs. Results indicate no significant effects of the design variables on either type of GHG flux. Like most soils, the bioretention soil media was a source for CO2 fluxes, increasing in warmer months and decreasing in colder months. Soil C and plant C in biomass is seen to largely offset respiratory CO2-C loss from bioretention soil, therefore suggesting that the bioretention is an overall net C sink, which may contribute to climate change mitigation. Bioretention was not a significant source of N2O fluxes, which altered between uptake and emission. This is a favorable outcome given the high global warming potential of the gas. The case for nitrification-induced N2O was stronger relative to denitrification. Both C and N gas fluxes can arguably be decreased by eliminating or reducing the amount of organic matter such as compost in the filter media. If necessary, compost with a greater C:N ratio (>20; [17]) to promote N immobilization should be considered, the adoption of which may also benefit water quality where nutrients are concerned. When possible, the nutrient storage capacity of bioretention systems can be enhanced by increasing depth/volume of the filter media.
Plant tissue analysis suggests that the C and nutrient sequestration potential of bioretention can be further promoted by selecting plants that incorporate greater concentrations of nutrients and also gain greater aboveground and belowground biomass over the growing season. Plants that shed less, producing lower levels of litter, may be preferred to minimize nutrient re-release (in gaseous or soluble form) via microbial decomposition; meanwhile, this type of plant selection also suggests opportunities for reducing the need for vegetation maintenance by landscapers. Future work should measure the magnitude of the gas fluxes in correlation to dramatic changes in a wide range of biogeochemical parameters, including soil moisture (resulting from small to large storm events), soil organic C, soil microbial biomass, and soil nitrogen, and should parallel explorations of the trade-offs that may exist between gas fluxes and water quality function of a bioretention feature.
Supplementary Materials
The supplementary file is available on https://www.mdpi.com/2073-4441/10/2/185/s1.
Acknowledgments
This work was supported through University of Vermont’s College of Agriculture and Life Sciences and Lake Champlain Sea Grant (Award #NA10OAR4170063). We thank Vermont EPSCoR–funded interns Anna Levine, Lindsay Cotnoir, Jelissa Reynoso, Danya AbdelHameid, Hannah Klein, Nichole Montero, Wileyshka M. Rivera, Maxwell Landsman-Gerjoi, and Jacob Woodworth, and University of Vermont student Julie Stasiuk for field research assistance. Additionally, we thank Joel Tilley for laboratory assistance with soil analysis, Alan Howard for statistical counseling, Nelish Pradhan for aiding with R software and field work, Amanda Cording for construction of gas sampling chambers, and Josef Görres and Beverley C. Wemple for providing feedback on the manuscript. Lastly, thank you to Elizabeth Schaller Bhuju and Vanesa Perillo for providing landscape images.
Author Contributions
Paliza Shrestha, Stephanie E. Hurley, and E. Carol Adair conceived and designed the experiments; Paliza Shrestha performed the experiments and analyzed the data; Paliza Shrestha, Stephanie E. Hurley, and E. Carol Adair wrote the paper.
Conflicts of Interest
The authors declare no conflict of interest.
References
- United States Environmental Protection Agency. What is Green Infrastructure? Available online: http://water.epa.gov/infrastructure/greeninfrastructure/gi_what.cfm (accessed on 8 February 2018).
- Nocco, M.A.; Rouse, S.E.; Balster, N.J. Vegetation type alters water and nitrogen budgets in a controlled, replicated experiment on residential-sized rain gardens planted with prairie, shrub, and turfgrass. Urban Ecosyst. 2016, 19, 1665–1691. [Google Scholar] [CrossRef]
- Intergovernmental Panel on Climate Change (IPCC). Special Report of Working Groups 1 and 2: Managing the Risks of Extreme Events and Disasters to Advance Climate Change Adaptation; Cambridge University Press: Cambridge, UK, 2012. [Google Scholar]
- Zahran, S.; Brody, S.D.; Vedlitz, A.; Grover, H.; Miller, C. Vulnerability and capacity: Explaining local commitment to climate-change policy. Environ. Plan. C Gov. Policy 2008, 26, 544–562. [Google Scholar] [CrossRef]
- Galford, G.L.; Ann, H.; Sam, C.; Sarah, F.; Julie, N.; Elizabeth, P.; Sarah, P.; Kristin, U.; Daniel, V.B. Considering Vermont’s Future in a Changing Climate: The First Vermont Climate Assessment; Gund Institute for Ecological Economics: Burlington, VT, USA, 2014; p. 219. [Google Scholar]
- Grimm, N.B.; Faeth, S.H.; Golubiewski, N.E.; Redman, C.L.; Wu, J.; Bai, X.; Briggs, J.M. Global change and the ecology of cities. Science 2008, 319, 756–760. [Google Scholar] [CrossRef] [PubMed]
- Brown, S.; Miltner, E.; Cogger, C. Carbon Sequestration Potential in Urban Soils. In Carbon Sequestration in Urban Ecosystems; Springer: Dordrecht, The Nederland, 2012; pp. 173–196. [Google Scholar] [CrossRef]
- Northeast Climate Impacts Assessment (NECIA), Union of Concerned Scientists. Climate Change in the U.S. Northeast. A Report of the Northeast Climate Impacts Assessment; Union of Concerned Scientists (UCS): Washington, DC, USA, 2006. [Google Scholar]
- Liu, J.; Sample, D.J.; Bell, C.; Guan, Y. Review and research needs of bioretention used for the treatment of urban stormwater. Water 2014, 6, 1069–1099. [Google Scholar] [CrossRef]
- Bratieres, K.; Fletcher, T.D.; Deletic, A.; Zinger, Y. Nutrient and sediment removal by stormwater biofilters: A large-scale design optimisation study. Water Res. 2008, 42, 3930–3940. [Google Scholar] [CrossRef] [PubMed]
- Hatt, B.E.; Fletcher, T.D.; Deletic, A. Hydrologic and pollutant removal performance of stormwater biofiltration systems at the field scale. J. Hydrol. 2009, 365, 310–321. [Google Scholar] [CrossRef]
- Grover, S.P.; Cohan, A.; Chan, H.S.; Livesley, S.J.; Beringer, J.; Daly, E. Occasional large emissions of nitrous oxide and methane observed in stormwater biofiltration systems. Sci. Total Environ. 2013, 465, 64–71. [Google Scholar] [CrossRef] [PubMed]
- Ewel, K.C.; Cropper, W.P., Jr.; Gholz, H.L. Soil CO2 evolution in Florida slash pine plantations. II. Importance of root respiration. Can. J. For. Res. 1987, 17, 330–333. [Google Scholar] [CrossRef]
- Lytle, D.E.; Cronan, C.S. Comparative soil CO2 evolution, litter decay, and root dynamics in clearcut and uncut spruce-fir forest. For. Ecol. Manag. 1998, 103, 121–128. [Google Scholar] [CrossRef]
- Verstraete, W.; Focht, D.D. Biochemical Ecology of Nitrification and Denitrification. In Advances in Microbial Ecology, Advances in Microbial Ecology; Springer: Boston, MA, USA, 1977; pp. 135–214. [Google Scholar] [CrossRef]
- Groffman, P.M.; Boulware, N.J.; Zipperer, W.C.; Pouyat, R.V.; Band, L.E.; Colosimo, M.F. Soil nitrogen cycle processes in urban riparian zones. Environ. Sci. Technol. 2002, 36, 4547–4552. [Google Scholar] [CrossRef] [PubMed]
- McPhillips, L.; Goodale, C.; Walter, M.T. Nutrient Leaching and Greenhouse Gas Emissions in Grassed Detention and Bioretention Stormwater Basins. J. Sustain. Water Built Environ. 2018, 4, 04017014. [Google Scholar] [CrossRef]
- Pang, X.; Bao, W.; Zhu, B.; Cheng, W. Responses of soil respiration and its temperature sensitivity to thinning in a pine plantation. Agric. For. Meteorol. 2013, 171, 57–64. [Google Scholar] [CrossRef]
- Maier, C.A.; Kress, L.W. Soil CO2 evolution and root respiration in 11 year-old loblolly pine (Pinus taeda) plantations as affected by moisture and nutrient availability. Can. J. For. Res. 2000, 30, 347–359. [Google Scholar] [CrossRef]
- Shrestha, P.; Hurley, S.; Wemple, B.C. Effects of different soil media, vegetation, and hydrologic treatments on nutrient and sediment removal in roadside bioretention systems. Ecol. Eng. 2018, 112, 116–131. [Google Scholar] [CrossRef]
- Cording, A.; Hurley, S.; Whitney, D. Monitoring methods and designs for evaluating. J. Environ. Eng. 2017, 143, 05017006. [Google Scholar] [CrossRef]
- U.S. Census Bureau. Census Interactive Population Search. Available online: https://www.census.gov/2010census/popmap/ipmtext.php (accessed on 8 February 2018).
- National Climatic Data Center, NOAA, Burlington Vermont Airport (Station GHCND: USW00014742). Available online: http://www.ncdc.noaa.gov/oa/ncdc.html (accessed on 28 December 2017).
- Hutchinson, G.L.; Livingston, G.P. Vents and seals in non-steady-state chambers used for measuring gas exchange between soil and the atmosphere. Eur. J. Soil Sci. 2001, 52, 675–682. [Google Scholar] [CrossRef]
- Tufekcioglu, A.; Raich, J.W.; Isenhart, T.M.; Schultz, R.C. Fine root dynamics, coarse root biomass, root distribution, and soil respiration in a multispecies riparian buffer in Central Iowa, USA. Agrofor. Syst. 1998, 44, 163–174. [Google Scholar] [CrossRef]
- McPhillips, L.; Walter, M.T. Hydrologic conditions drive denitrification and greenhouse gas emissions in stormwater detention basins. Ecol. Eng. 2015, 85, 67–75. [Google Scholar] [CrossRef]
- Iqbal, J.; Castellano, M.J.; Parkin, T.B. Evaluation of photoacoustic infrared spectroscopy for simultaneous measurement of N2O and CO2 gas concentrations and fluxes at the soil surface. Glob. Chang. Biol. 2013, 19, 327–336. [Google Scholar] [CrossRef] [PubMed]
- Hutchinson, G.L.; Mosier, A.R. Improved soil cover method for field measurement of nitrous oxide fluxes. Soil Sci. Soc. Am. J. 1981, 45, 311–316. [Google Scholar] [CrossRef]
- Rochette, P.; Bertrand, N. Soil-surface gas emissions. In Soil Sampling and Methods of Analysis; Carter, M.R., Gregorich, E.G., Eds.; Canadian Society of Soil Science; CRC Press: Boca Raton, FL, USA, 2008; pp. 851–861. [Google Scholar]
- Jenkinson, D.S.; Powlson, D.S. The effects of biocidal treatments on metabolism in soil—V: A method for measuring soil biomass. Soil Biol. Biochem. 1976, 8, 209–213. [Google Scholar] [CrossRef]
- Vance, E.D.; Brookes, P.C.; Jenkinson, D.S. An extraction method for measuring soil microbial biomass C. Soil Biol. Biochem. 1987, 19, 703–707. [Google Scholar] [CrossRef]
- Brookes, P.C.; Landman, A.; Pruden, G.; Jenkinson, D.S. Chloroform fumigation and the release of soil nitrogen: A rapid direct extraction method to measure microbial biomass nitrogen in soil. Soil Biol. Biochem. 1985, 17, 837–842. [Google Scholar] [CrossRef]
- Beck, T.; Joergensen, R.G.; Kandeler, E.; Makeschin, F.; Nuss, E.; Oberholzer, H.R.; Scheu, S. An inter-laboratory comparison of ten different ways of measuring soil microbial biomass C. Soil Biol. Biochem. 1997, 29, 1023–1032. [Google Scholar] [CrossRef]
- Heaton, E.; Voigt, T.; Long, S.P. A quantitative review comparing the yields of two candidate C 4 perennial biomass crops in relation to nitrogen, temperature and water. Biomass Bioenergy 2004, 27, 21–30. [Google Scholar] [CrossRef]
- Hogberg, P.; Nordgren, A.; Buchmann, N.; Taylor, A.F.S.; Ekbald, A.; Hogberg, M.N.; Nyberg, G.; Lofvenius, M.O.; Read, D.J. Large scale forest girdling shows that current photosynthesis drives soil respiration. Nature 2001, 411, 789–791. [Google Scholar] [CrossRef] [PubMed]
- Paul, E.A. Soil Microbiology, Ecology and Biochemistry; Academic Press: Atlanta, GA, USA, 2014. [Google Scholar]
- Avrahami, S.; Conrad, R.; Braker, G. Effect of Soil Ammonium Concentration on N2O Release and on the Community Structure of Ammonia Oxidizers and Denitrifiers. Appl. Environ. Microbiol. 2002, 68, 5685–5692. [Google Scholar] [CrossRef] [PubMed]
- Tabatabai, M.A.; Dick, W.A. Distribution and stability of pyrophosphatase in soils. Soil Biol. Biochem. 1979, 11, 655–659. [Google Scholar] [CrossRef]
- Goberna, M.; Sánchez, J.; Pascual, J.A.; García, C. Surface and subsurface organic carbon, microbial biomass and activity in a forest soil sequence. Soil Biol. Biochem. 2006, 38, 2233–2243. [Google Scholar] [CrossRef]
- Calderón, F.J.; Jackson, L.E.; Scow, K.M.; Rolston, D.E. Short-Term Dynamics of Nitrogen, Microbial Activity, and Phospholipid Fatty Acids after Tillage. Soil Sci. Soc. Am. J. 2001, 65, 118–126. [Google Scholar] [CrossRef]
- Dietz, M.E.; Clausen, J.C. Saturation to improve pollutant retention in a rain garden. Environ. Sci. Technol. 2006, 40, 1335–1340. [Google Scholar] [CrossRef] [PubMed]
- Lucas, W.; Greenway, M. A comparative study of nutrient retention performance in vegetated and non-vegetated bioretention mesocosms. NOVATECH 2007, section 5.2, 1086–1089. [Google Scholar]
- Pataki, D.E.; Carreiro, M.M.; Cherrier, J.; Grulke, N.E.; Jennings, V.; Pincetl, S.; Pouyat, R.V.; Whitlow, T.H.; Zipperer, W.C. Coupling biogeochemical cycles in urban environments: Ecosystem services, green solutions, and misconceptions. Front. Ecol. Environ. 2011, 9, 27–36. [Google Scholar] [CrossRef]
- Schlesinger, W.H.; Lichter, J. Limited carbon storage in soil and litter of experimental forest plots under increased atmospheric CO2. Nature 2001, 411, 466. [Google Scholar] [CrossRef] [PubMed]
- Nair, A.; Ngouajio, M. Soil microbial biomass, functional microbial diversity, and nematode community structure as affected by cover crops and compost in an organic vegetable production system. Appl. Soil Ecol. 2012, 58, 45–55. [Google Scholar] [CrossRef]
- Malhi, S.S.; McGill, W.B. Nitrification in three Alberta soils: Effect of temperature, moisture and substrate concentration. Soil Biol. Biochem. 1982, 14, 393–399. [Google Scholar] [CrossRef]
- Stevens, R.J.; Laughlin, R.J.; Burns, L.C.; Arah, J.R.M.; Hood, R.C. Measuring the contributions of nitrification and denitrification to the flux of nitrous oxide from soil. Soil Biol. Biochem. 1997, 29, 139–151. [Google Scholar] [CrossRef]
- Yoshinari, T.; Hynes, R.; Knowles, R. Acetylene inhibition of nitrous oxide reduction and measurement of denitrification and nitrogen fixation in soil. Soil Biol. Biochem. 1977, 9, 177–183. [Google Scholar] [CrossRef]
- Sørensen, J. Denitrification Rates in a Marine Sediment as Measured by the Acetylene Inhibition Technique. Appl. Environ. Microbiol. 1978, 36, 139–143. [Google Scholar] [PubMed]
- Raich, J.W.; Schlesinger, W.H. The global carbon dioxide flux in soil respiration and its relationship to vegetation and climate. Tellus B 1992, 44, 81–99. [Google Scholar] [CrossRef]
- Raich, J.W.; Tufekciogul, A. Vegetation and soil respiration: Correlations and controls. Biogeochemistry 2000, 48, 71–90. [Google Scholar] [CrossRef]
- Schlesinger, W.H.; Andrews, J.A. Soil respiration and the global carbon cycle. Biogeochemistry 2000, 48, 7–20. [Google Scholar] [CrossRef]
- Liikanen, A.; Huttunen, J.T.; Karjalainen, S.M.; Heikkinen, K.; Väisänen, T.S.; Nykänen, H.; Martikainen, P.J. Temporal and seasonal changes in greenhouse gas emissions from a constructed wetland purifying peat mining runoff waters. Ecol. Eng. 2006, 26, 241–251. [Google Scholar] [CrossRef]
- Søvik, A.K.; Augustin, J.; Heikkinen, K.; Huttunen, J.T.; Necki, J.M.; Karjalainen, S.M.; Kløve, B.; Liikanen, A.; Mander, Ü.; Puustinen, M.; et al. Emission of the greenhouse gases nitrous oxide and methane from constructed wetlands in Europe. J. Environ. Qual. 2006, 35, 2360–2373. [Google Scholar] [CrossRef] [PubMed]
- Bettez, N.D.; Groffman, P.M. Denitrification Potential in Stormwater Control Structures and Natural Riparian Zones in an Urban Landscape. Environ. Sci. Technol. 2012, 46, 10909–10917. [Google Scholar] [CrossRef] [PubMed]
- Decina, S.M.; Hutyra, L.R.; Gately, C.K.; Getson, J.M.; Reinmann, A.B.; Gianotti, A.G.S.; Templer, P.H. Soil respiration contributes substantially to urban carbon fluxes in the greater Boston area. Environ. Pollut. 2016, 212, 433–439. [Google Scholar] [CrossRef] [PubMed]
- Smith, K.A.; Thomson, P.E.; Clayton, H.; Mctaggart, I.P.; Conen, F. Effects of temperature, water content and nitrogen fertilisation on emissions of nitrous oxide by soils. Atmos. Environ. 1998, 32, 3301–3309. [Google Scholar] [CrossRef]
- Tzoulas, K.; Korpela, K.; Venn, S.; Yli-Pelkonen, V.; Kaźmierczak, A.; Niemela, J.; James, P. Promoting ecosystem and human health in urban areas using Green Infrastructure: A literature review. Landsc. Urban Plan. 2007, 81, 167–178. [Google Scholar] [CrossRef]
- Lambers, H.; Chapin, F.S., III; Pons, T.L. Photosynthesis, respiration, and long-distance transport. In Plant Physiological Ecology; Springer: Dordrecht, The Nederland, 1998; pp. 10–153. [Google Scholar]
- Ryan, M.G. Effects of climate change on plant respiration. Ecol. Appl. 1991, 1, 157–167. [Google Scholar] [CrossRef] [PubMed]
- Sanderson, M.A.; Reed, R.L.; McLaughlin, S.B.; Wullschleger, S.D.; Conger, B.V.; Parrish, D.J.; Wolf, D.D.; Taliaferro, C.; Hopkins, A.A.; Ocumpaugh, W.R.; et al. Switchgrass as a sustainable bioenergy crop. Bioresour. Technol. 1996, 56, 83–93. [Google Scholar] [CrossRef]
- Davidson, E.A.; Savage, K.; Verchot, L.V.; Navarro, R. Minimizing artifacts and biases in chamber-based measurements of soil respiration. Agric. For. Meteorol. 2002, 113, 21–37. [Google Scholar] [CrossRef]
- Kaye, J.P.; Groffman, P.M.; Grimm, N.B.; Baker, L.A.; Pouyat, R.V. A distinct urban biogeochemistry? Trends Ecol. Evol. 2006, 21, 192–199. [Google Scholar] [CrossRef] [PubMed]
- Jia, W.; Zhang, J.; Li, P.; Xie, H.; Wu, J.; Wang, J. Nitrous oxide emissions from surface flow and subsurface flow constructed wetland microcosms: Effect of feeding strategies. Ecol. Eng. 2011, 37, 1815–1821. [Google Scholar] [CrossRef]
- Dotro, G.; Jefferson, B.; Jones, M.; Vale, P.; Cartmell, E.; Stephenson, T. A review of the impact and potential of intermittent aeration on continuous flow nitrifying activated sludge. Environ. Technol. 2011, 32, 1685–1697. [Google Scholar] [CrossRef]
- Mander, Ü.; Dotro, G.; Ebie, Y.; Towprayoon, S.; Chiemchaisri, C.; Nogueira, S.F.; Jamsranjav, B.; Kasak, K.; Truu, J.; Tournebize, J.; et al. Greenhouse gas emission in constructed wetlands for wastewater treatment: A review. Ecol. Eng. 2014, 66, 19–35. [Google Scholar] [CrossRef]
- Livesley, S.J.; Dougherty, B.J.; Smith, A.J.; Navaud, D.; Wylie, L.J.; Arndt, S.K. Soil-atmosphere exchange of carbon dioxide, methane and nitrous oxide in urban garden systems: Impact of irrigation, fertiliser and mulch. Urban Ecosyst. 2010, 13, 273–293. [Google Scholar] [CrossRef]
- Townsend-Small, A.; Czimczik, C.I. Carbon sequestration and greenhouse gas emissions in urban turf. Geophys. Res. Lett. 2010, 37, L02707. [Google Scholar] [CrossRef]
- Kaye, J.P.; Burke, I.C.; Mosier, A.R.; Pablo Guerschman, J. Methane and nitrous oxide fluxes from urban soils to the atmosphere. Ecol. Appl. 2004, 14, 975–981. [Google Scholar] [CrossRef]
- Giasson, M.-A.; Ellison, A.M.; Bowden, R.D.; Crill, P.M.; Davidson, E.A.; Drake, J.E.; Frey, S.D.; Hadley, J.L.; Lavine, M.; Melillo, J.M.; et al. Soil respiration in a northeastern US temperate forest: A 22-year synthesis. Ecosphere 2013, 4, 1–28. [Google Scholar] [CrossRef]
- Ma, B.L.; Wu, T.Y.; Tremblay, N.; Deen, W.; Morrison, M.J.; Mclaughlin, N.B.; Gregorich, E.G.; Stewart, G. Nitrous oxide fluxes from corn fields: On-farm assessment of the amount and timing of nitrogen fertilizer. Glob. Chang. Biol. 2010, 16, 156–170. [Google Scholar] [CrossRef]
- Vymazal, J. Constructed wetlands for wastewater treatment. Water 2010, 2, 530–549. [Google Scholar] [CrossRef]
Figure 1.
Approximately biweekly measurements of (a) CO2-C flux (mg m−2 h−1), (b) N2O-N flux (µg m−2 h−1), (c) soil temperature (°C), and (d) soil volumetric moisture content (%) from May to October 2015 and 2016 from all bioretention cells receiving the different treatments, where VL = vegetation low diversity, VH = vegetation high diversity, RR = enhanced rainfall and runoff, SM = SorbtiveMediaTM. Blue lines are smoothed conditional means using the locally weighted scatterplot smoothing (LOESS) method. Gray shadings are 95% confidence intervals.

Figure 2.
Relationships between (a) CO2-C flux (mg m−2 h−1) and soil temperature (°C), (b) N2O-N flux (µg m−2 h−1) and soil temperature (°C), (c) CO2-C flux and soil volumetric moisture content (%), and (d) N2O-N flux and soil volumetric moisture content from May to October 2015 and 2016 from all the cells receiving the different treatments, where VL= vegetation low diversity, VH = vegetation high diversity, RR = enhanced rainfall and runoff, SM = SorbtiveMediaTM. Blue lines represent the best fit line using linear regression. Gray shadings are 95% confidence intervals.

Figure 3.
Monthly mean (±1 S.E.) measurements of soil microbial biomass carbon (mg C kg−1 dry soil) from May to September 2014 (a) and 2015 (b) from cells receiving the ambient vegetation low (VL) and high diversity (VH) treatments. No significant differences were observed between the two treatments. Different letters indicate significant differences between months as determined using Tukey-Kramer HSD at p < 0.05.

Figure 4.
Carbon (C) and/or nitrogen (N) fluxes and stocks/pools (g, unless stated otherwise) in the bioretention soil media layers (sand-compost and sand layers), microbial biomass, and aboveground plants (Panicum and Hemerocallis) from a low vegetation diversity (VL) treatment cell. Numbers in blue are for C, and numbers in green are for N. Italicized numbers represent fluxes and non-italicized numbers represent stocks.

Figure 5.
This study’s bioretention gas fluxes in relation to fluxes from other natural and artificial systems.
Figure 5.
This study’s bioretention gas fluxes in relation to fluxes from other natural and artificial systems.


Table 1.
Soil properties from the top 10 cm of soil media in the bioretention cell averaged among the eight cells. Standard errors of the mean (n = number of sampling times) in parenthesis.
Table 1.
Soil properties from the top 10 cm of soil media in the bioretention cell averaged among the eight cells. Standard errors of the mean (n = number of sampling times) in parenthesis.
| Soil OM (%) | Soil C:N | Soil pH | Soil EC (µS cm−1) | Soil Media Bulk Density (g cm−3 Dry Soil) | Soil NH4+-N Concentration (ppm) | Soil NO3−-N Concentration (ppm) |
|---|---|---|---|---|---|---|
| 1.95 (0.09) | 13.39 (0.65) | 7.04 (0.02) | 30.18 (0.23) | 1.19 (0.03) | 0.311 (0.10) | 3.932 (0.69) |
| n = 7 | n = 2 | n = 7 | n = 7 | n = 2 | n = 3 | n = 3 |
Table 2.
Soil total carbon (C) and nitrogen (N) concentration (mg kg−1) and C:N values from top 10 cm of soil media in May 2016, and two depth increments (0–30 cm and 30–40 cm) in November from low diversity (VL) bioretention cell in 2016.
Table 2.
Soil total carbon (C) and nitrogen (N) concentration (mg kg−1) and C:N values from top 10 cm of soil media in May 2016, and two depth increments (0–30 cm and 30–40 cm) in November from low diversity (VL) bioretention cell in 2016.
| Sampled Year | Soil Depth | Total C | Total N | C:N |
|---|---|---|---|---|
| g kg−1 Dry Soil | ||||
| May 2014 | 0–10 cm | 18.36 | 1.69 | 10.9 |
| May 2016 | 0–10 cm | 14.17 | 0.9 | 15.7 |
| November 2016 | 0–30 cm | 10.27 | 0.73 | 14.1 |
| November 2016 | 30–40 cm | 1.82 | 0.14 | 13.5 |
Table 3.
Plant tissue carbon (C) and nitrogen (N) concentrations (g kg−1) and C: N values from low diversity (VL) bioretention cell in August (peak growing season) and November (after plant senescence) in 2016.
Table 3.
Plant tissue carbon (C) and nitrogen (N) concentrations (g kg−1) and C: N values from low diversity (VL) bioretention cell in August (peak growing season) and November (after plant senescence) in 2016.
| Season | Plant Species | C | N | C:N |
|---|---|---|---|---|
| g kg−1 Dry Plant | ||||
| Summer (August) | Panicum | 446 | 11.4 | 39 |
| Hemerocallis | 445 | 24.6 | 18 | |
| Fall (November) | Panicum | 461 | 5.85 | 79 |
| Hemerocallis | 449 | 9.76 | 46 | |
Table 4.
CO2-C (mg C m−2 h−1) and N2O-N fluxes (µg N m−2 h−1) from this study’s bioretention system and various other natural and artificial systems.
Table 4.
CO2-C (mg C m−2 h−1) and N2O-N fluxes (µg N m−2 h−1) from this study’s bioretention system and various other natural and artificial systems.
| System | Reference | Study Location | CO2-C Flux (mg C m−2 h−1) | N2O-N Flux (µg N m−2 h−1) | Image Credit |
|---|---|---|---|---|---|
| 1Native grasslands and wheat fields (unfertilized & unirrigated) | [69] | Colorado, USA | na | <4 | www.worldwildlife.org |
| 2Urban Forest | [56] | Massachusetts, USA | 113 | na | Paliza Shrestha |
| 3Rural forest | [70] | Massachusetts, USA | 133 | na | Paliza Shrestha |
| 4Bioretention | This Study | Vermont, USA | 194 | 10 | Paliza Shrestha |
| 5Urban lawn & landscaped | [56] | Massachusetts, USA | 194 & 291 | na | www.zillow.com |
| 6Fertilized and irrigated urban lawn | [69] | Colorado, USA | na | >10 | Elizabeth Schaller Bhuju |
| 6Fertilized and irrigated urban lawn & mulched garden beds | [67] | Melbourne, Australia | ~450 | 17 to 28 & 14 | Elizabeth Schaller Bhuju |
| 7Fertilized urban turf | [68] | Southern California, USA | na | 93 | mda.maryland.gov |
| 8Fertilized corn fields | [71] | Ontario, Canada | na | 30 to 900 | Vanesa Perillo |
| 9Constructed Wetland | [54] | Northern Europe (Estonia, Finland, Norway, Poland) | −35 to 3875 | −88 to 41,600 | [72] |
© 2018 by the authors. Licensee MDPI, Basel, Switzerland. This article is an open access article distributed under the terms and conditions of the Creative Commons Attribution (CC BY) license (http://creativecommons.org/licenses/by/4.0/).
Share and Cite
MDPI and ACS Style
Shrestha, P.; Hurley, S.E.; Adair, E.C. Soil Media CO2 and N2O Fluxes Dynamics from Sand-Based Roadside Bioretention Systems. Water 2018, 10, 185. https://doi.org/10.3390/w10020185
AMA Style
Shrestha P, Hurley SE, Adair EC. Soil Media CO2 and N2O Fluxes Dynamics from Sand-Based Roadside Bioretention Systems. Water. 2018; 10(2):185. https://doi.org/10.3390/w10020185
Chicago/Turabian StyleShrestha, Paliza, Stephanie E. Hurley, and E. Carol Adair. 2018. "Soil Media CO2 and N2O Fluxes Dynamics from Sand-Based Roadside Bioretention Systems" Water 10, no. 2: 185. https://doi.org/10.3390/w10020185
Note that from the first issue of 2016, this journal uses article numbers instead of page numbers. See further details here.