Forecasting Quarterly Inflow to Reservoirs Combining a Copula-Based Bayesian Network Method with Drought Forecasting


Department of Civil Engineering, Pukyong National University, Busan 48513, Korea
*
Author to whom correspondence should be addressed.
Water 2018, 10(2), 233; https://doi.org/10.3390/w10020233
Submission received: 4 January 2018
/
Revised: 11 February 2018
/
Accepted: 21 February 2018
/
Published: 24 February 2018
Abstract
:Especially for periods of drought, the higher the accuracy of reservoir inflow forecasting is, the more reliable the water supply from a dam is. This article focuses on the probabilistic forecasting of quarterly inflow to reservoirs, which determines estimates from the probabilistic quarterly inflow according to drought forecast results. The probabilistic quarterly inflow was forecasted by a copula-based Bayesian network employing a Gaussian copula function. Drought forecasting was performed by calculation of the standardized inflow index value. The calendar year is divided into four quarters, and the total inflow volume of water to a reservoir for three months is referred to as the quarterly inflow. Quarterly inflow forecasting curves, conforming to drought stages, produce estimates of probabilistic quarterly inflow according to the drought forecast results. The forecasted estimates of quarterly inflow were calculated by using the inflow records of Soyanggang and Andong dams in the Republic of Korea. After the probability distribution of the quarterly inflow was determined, a lognormal distribution was found to be the best fit to the quarterly inflow volumes in the case of the Andong dam, except for those of the third quarter. Under the threshold probability of drought occurrences ranging from 50% to 55%, the forecasted quarterly inflows reasonably matched the corresponding drought records. Provided the drought forecasting is accurate, combining drought forecasting with quarterly inflow forecasting can produce reasonable estimates of drought inflow based on the probabilistic forecasting of quarterly inflow to a reservoir.
1. Introduction
The higher the accuracy of reservoir inflow forecasting is, the more reliable the water supply from a dam is, especially for drought periods. Ensemble streamflow prediction (ESP) is a method by which streamflow is forecasted [1,2,3,4,5,6]. ESP is a typical method of probabilistic forecasting that combines initial conditions of a river basin with past weather conditions that can reappear in the future to forecast basin runoff. The forecast results of ESP, however, are greatly influenced by the accuracy of the watershed runoff model as well as the method used to assign weights to the flow scenarios [7]. ESP also assumes that the rainfall scenarios that occurred in the past will also occur in the future. Because of this assumption, ESP can have limitations in properly forecasting severe droughts that have not occurred in the past if the results are not adequately analyzed or combined with other techniques.
Bayesian networks are probabilistic models based on Bayesian theorem and were first developed by the artificial intelligence and machine learning community [8,9]. Bayesian networks have been increasingly used in studies of surface and groundwater management [10,11,12,13,14,15,16]. Recently, Elidan [17] developed copula Bayesian networks, a marriage between the Bayesian network and copula frameworks. Coupla as a multivariable probability distribution has recently been applied to complex hydrologic phenomenon with correlated variables such as flood analysis [18,19], deriving bivariate rainfall frequency distributions [20], constructing a joint distribution between drought duration and severity [21], characterizing drought events [22], and analyzing drought characteristics [23].
Most recently, Bayesian network has been applied as a forecasting method to forecast flows and droughts. Shin et al. [24] used a Bayesian network to perform meteorological drought forecasts and evaluate the accuracy of drought forecasts based on the weather observatories. Shin et al. [24] concluded that drought forecasts that use Bayesian networks can be extended for use for not only meteorological droughts but also hydrological droughts.
Madadgar and Moradkhani [25] proposed a copula-based Bayesian network to forecast the spring flow (April–June) and droughts in the Gunnison River in the United Sates. They compared the spring flow forecast with the results by ESP. They found the spring flow had high correlation with the previous winter flow (January–March) and concluded the forecast uncertainty of their method is more reliable than the ESP method. Their streamflow forecast method, however, is limited in its use to forecast summer streamflow in monsoon areas like the Korean Peninsula. The copula-based Bayesian network has a tendency to forecast flow proportional to the flow of the previous period, when the two flows have a high correlation. Because of this tendency, the copula-based Bayesian network is not reliable in forecasting summer flow mostly induced by random storms in a monsoon region. Nevertheless, the probability distribution of the forecast flow, derived from a copula-based Bayesian network, provides very useful information. If a procedure is devised to estimate a specific value of the random variable of the forecast flow, the forecast flow still has meaningful information as the posterior distribution of the random forecast flow.
Hence, we have devised a new approach to forecast quarterly flow defined by the flow volume of three months that includes the two processes: the combining of forecasting quarterly flow using a copula-based Bayesian network with drought forecasting; and how to select a specific value of the probabilistic forecast flow according to the drought forecast result. That is, we prepared five specific values on the distribution of each quarterly forecast flow that correspond to five specified drought index values. If drought is anticipated for the next period, one adopts the forecast flow corresponding to the flow of drought phase one step severer than the current phase. If no drought is forecast, one adopts the flow of the normal phase.
A summary of the objectives of this study is to forecast the probabilistic quarterly inflow to dams while taking drought forecast results into account. The quarterly inflow is defined by the inflow volume of three months to a reservoir. The probabilistic quarterly inflows are forecasted using a copula-based Bayesian network. The drought forecasting is performed by calculating a drought index. We utilized the drought forecasting results to determine a value among the predefined values of quarterly forecast inflow corresponding to drought phases.
2. Methodology
2.1. Procedures of Quarterly Inflow Forecasting
The following shows the overall procedures used to forecast a quarterly inflow to a reservoir combining the copula-based Bayesian network method with drought forecasting: (1) a preparation of a current quarterly inflow and its standardized inflow index (SII); (2) drought forecasting using the SII from a Bayesian network (BN); (3) taking a quarterly inflow forecasting curve developed from a BN considering the forecasted drought stage; and (4) determining a forecasted quarterly inflow on the selected quarterly inflow forecasting curve. The following sections describe the details of the above procedures.
2.2. Copula-Based Bayesian Network
Bayesian networks are probabilistic models that describe the conditional dependencies of a set of random variables via directed acyclic graphs (DAG). A DAG represents the sequence of events in a direct ordering with no direct circuits. The random vector (x) that evolve over time (e.g., streamflow or drought states) can be shown in a DAG and their probabilistic queries can be represented within a Bayesian network. The joint probability density function of the set of random variables in vector x forming a Bayesian network can be written as the product of individual density functions conditional on their parent variables [25,26]. If the dependency ordering of random variables exactly follows the temporal sequence, and the parent variables of is the set of all prior variables , the joint probability density function of the x can be written as Equation (1).
where Π is the product operator, is the random variable at time , and is the length of the time period over which the random variables evolve. That is the chain rule in the probability theory, and the conditional probabilities from Equation (1) can be shown simply by introducing copulas as in Equation (2) [25].
where is the copula density function, is the , and is the density function of a marginal distribution. A detailed description of copula-based Bayesian network is found in Madadgar and Moradkhani [25].
In this study, Equation (3) was used to calculate the conditional probability of two successive quarters’ inflows.
where is the quarterly inflow to be forecast, and is the previous quarter’s inflow. In the hydrological field, the Archimedean and elliptical families have been the main copula families. Madadgar and Moradkhani [25] showed that the Gaussian copula is the most suitable for forecasting the flow of the Gunnison River in the United States. Yoo et al. [27] used a copula function on Korean weather observatories and performed bivariate frequency analyses for droughts. They presented results showing that the Gaussian copula was the most suitable for the data from 32 of the 57 target weather observatories. In this study, we selected the Gaussian copula as the copula function to calculate Equation (3). The Gaussian copula is in the elliptical family, and it is easy to calculate compared to other copula functions. This is because the parameters do not need to be estimated and it can be calculated using only the correlation coefficient between two variables. The Gaussian copula equation is as follows [28]:
where and . The is the inverse function of the cumulative normal distribution function, and is the correlation coefficient matrix made from ρ, the correlation coefficient between two variables.
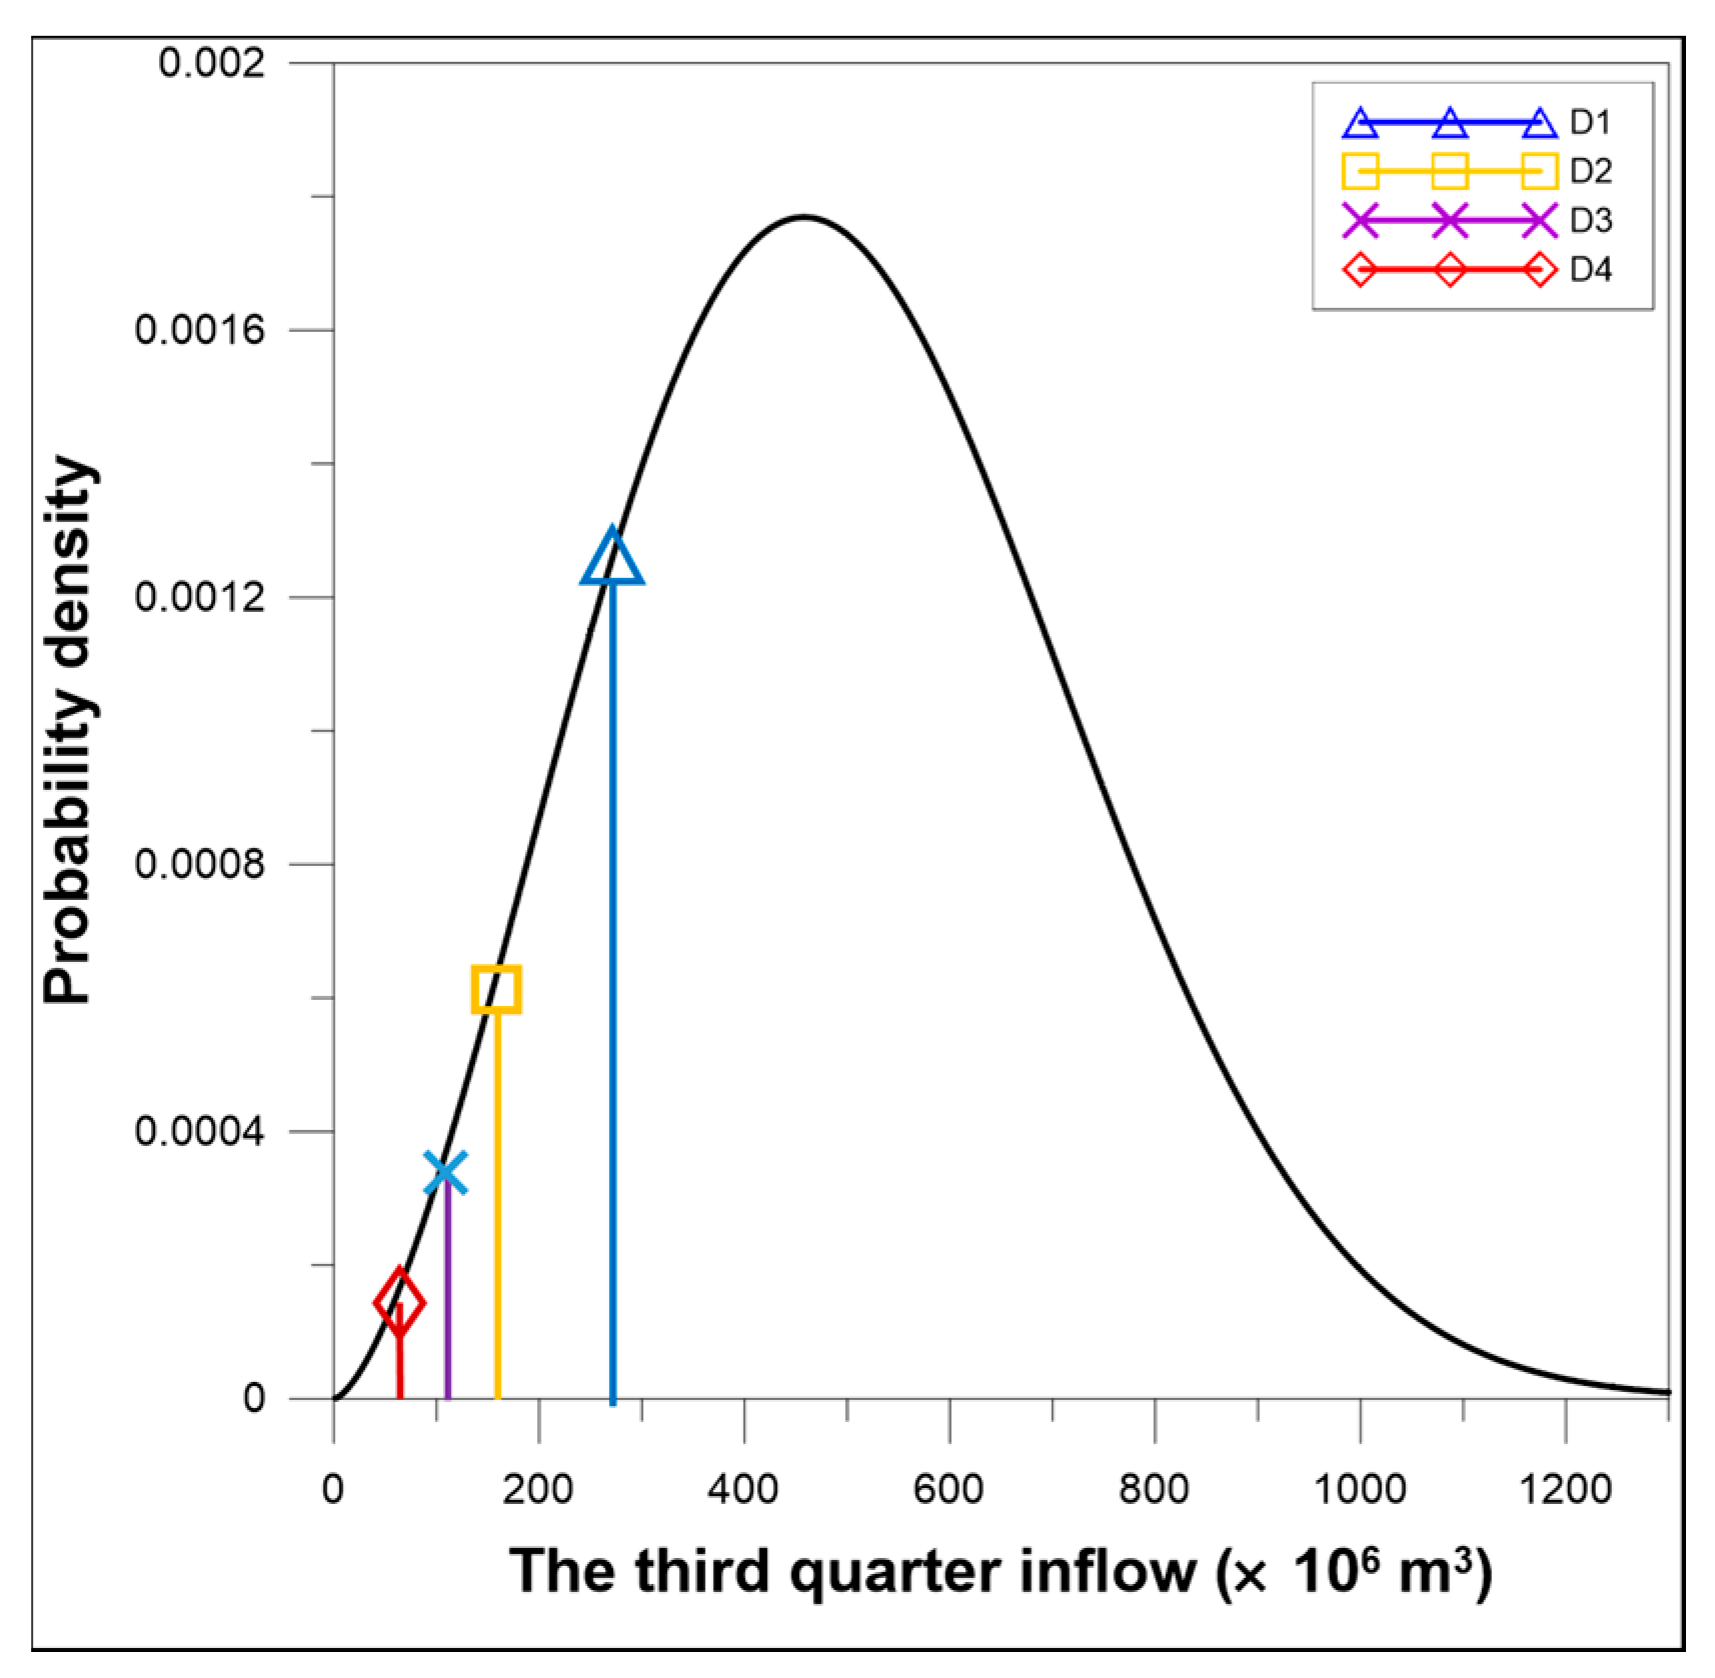
In this study, we used the probability distribution of the next quarter’s inflow calculated via Equation (3) from the previous quarter’s inflow to make inflow forecasts. For example, Figure 1 shows the probability distribution of the third quarter inflow of a reservoir when the second quarter inflow is 100 × 106 m3, calculated using Equation (3). According to the probability distribution, when the second quarter inflow is 100 × 106 m3, the third quarter inflow with the greatest probability density function value is around 480 × 106 m3. The next-quarter inflow with the greatest probability density function value is normally used as the inflow forecast value when drought forecasting is not performed. A quarterly inflow prediction that incorporates drought forecasting will be explained later.
2.3. Drought Forecasting Using Drought Index
If we take the forecast quarterly inflow as the value corresponding to the maximum of the probability density function (as in Figure 1), we do not take drought occurrence into account. Because of this, the drought forecasting for considering future droughts was performed by calculating the drought index. The drought forecast is performed using the standardized inflow index (SII), which is one of the drought indices. Many standardized indices have been introduced with a particular set of input parameters [29,30,31,32]. Characterizing droughts with standardized indices is an attractive approach due to consistency and flexibility developed by Mckee et al. [33]. The SII was developed by Gusyev et al. [32] and uses the inflow of reservoir as an input parameter. Table 1 shows the categories of drought stages using SII [34]. A negative SII is categorized as a drought and a smaller negative value means a severer drought.
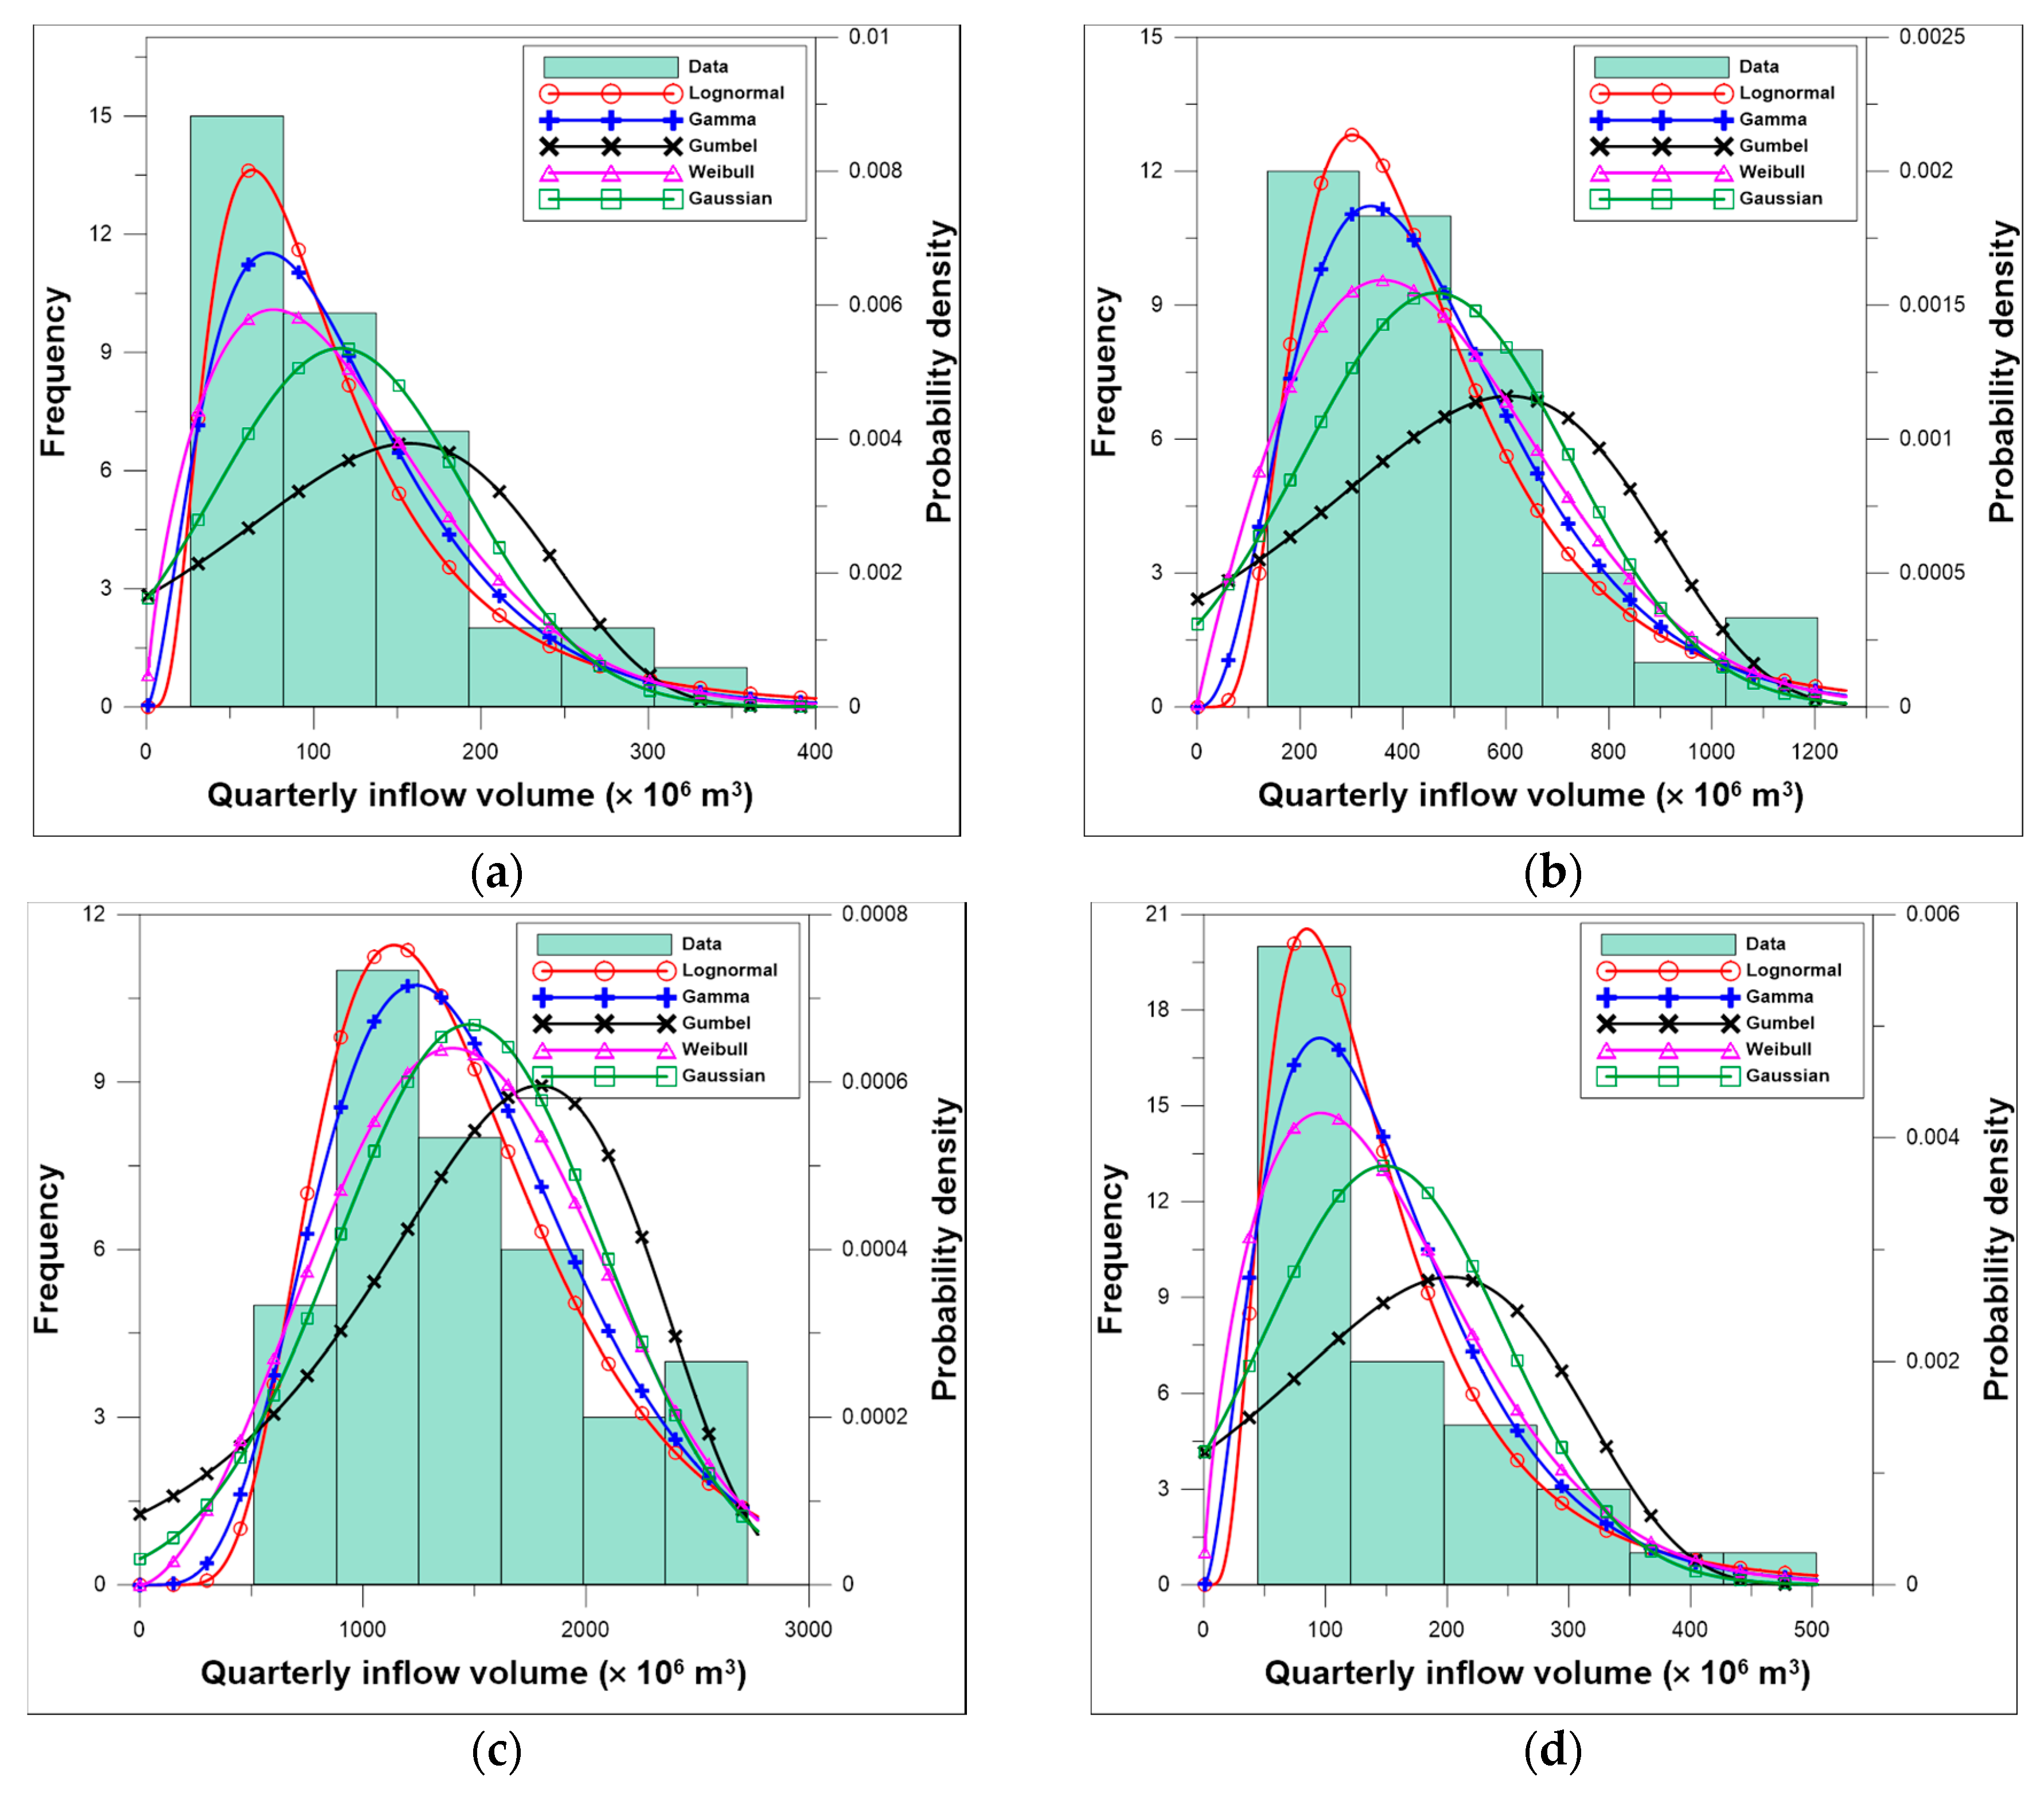
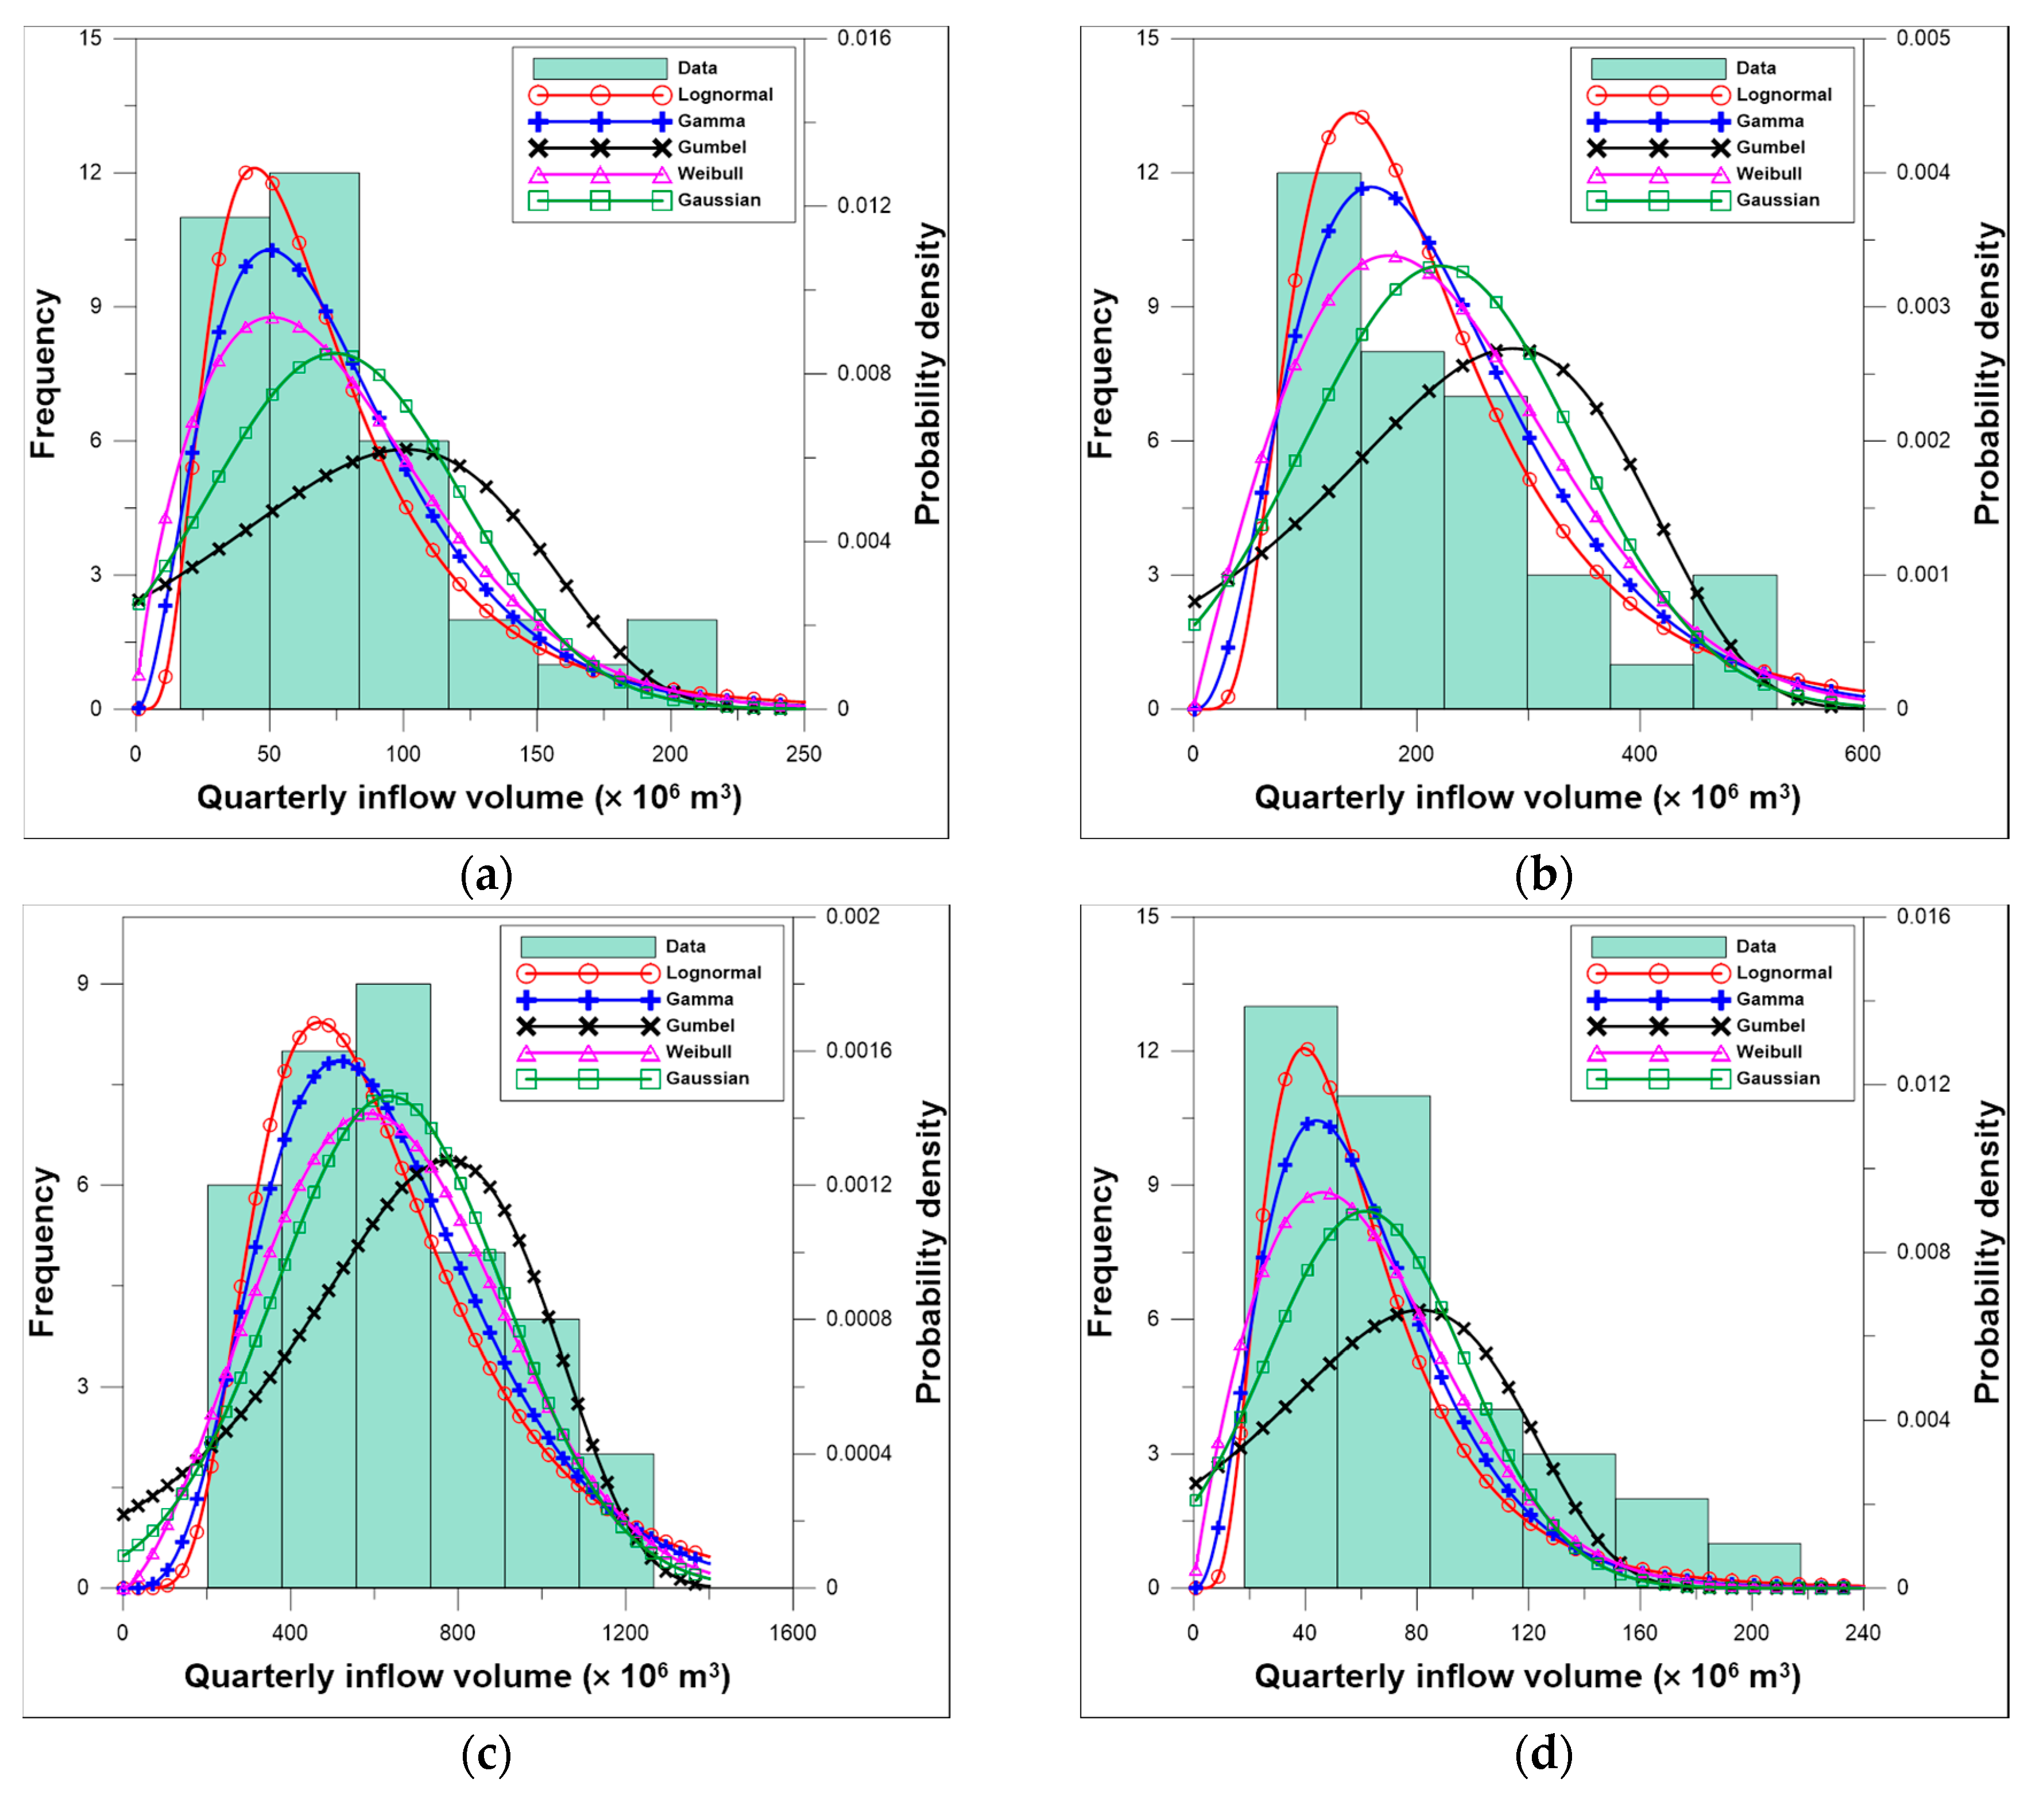
To calculate the SII for each quarter, we must first determine the probability distribution of the quarterly inflow. A set of distributions is tested to find the best one fitted to the quarterly inflow. The following five distributions are considered in this study: lognormal, gamma, Gumbel, Weibull, and Gaussian distributions. The method of maximum likelihood estimation (MLE) is used to estimate the parameters of each distribution. To find the best distribution fitted to the quarterly inflow, the Kolmogorov–Smirnov (K–S) test [35] is applied. The K–S test returns the value, which is the maximum value among the differences between the theoretical cumulative probability distributions derived from estimated parameters and the probability distributions derived from observed data. The value of is limited by the number of data values and the significance level of . A probability distribution in which is calculated to be beyond these values is considered to be inappropriate for the data. In this study, we compared the of several probability distributions and chose the probability distributions with the smallest calculated as the quarterly inflow probability distribution. If an optimal probability distribution is determined for each quarterly inflow, it is possible to fit the quarterly inflow to a cumulative distribution function (CDF) of the each quarter’s distribution. Then, the fitted CDF is converted to the standardized normal distribution. The SII value is computed as the standard score, or Z-score, of the corresponding quarterly inflow [36]. The conversion equations from the CDF, , to the Z-score are as follows.
where the approximation coefficients have the following values: is 2.515517; is 0.802853; is 0.010328; is 1.432788; is 0.189267; is 0.001308 [37].
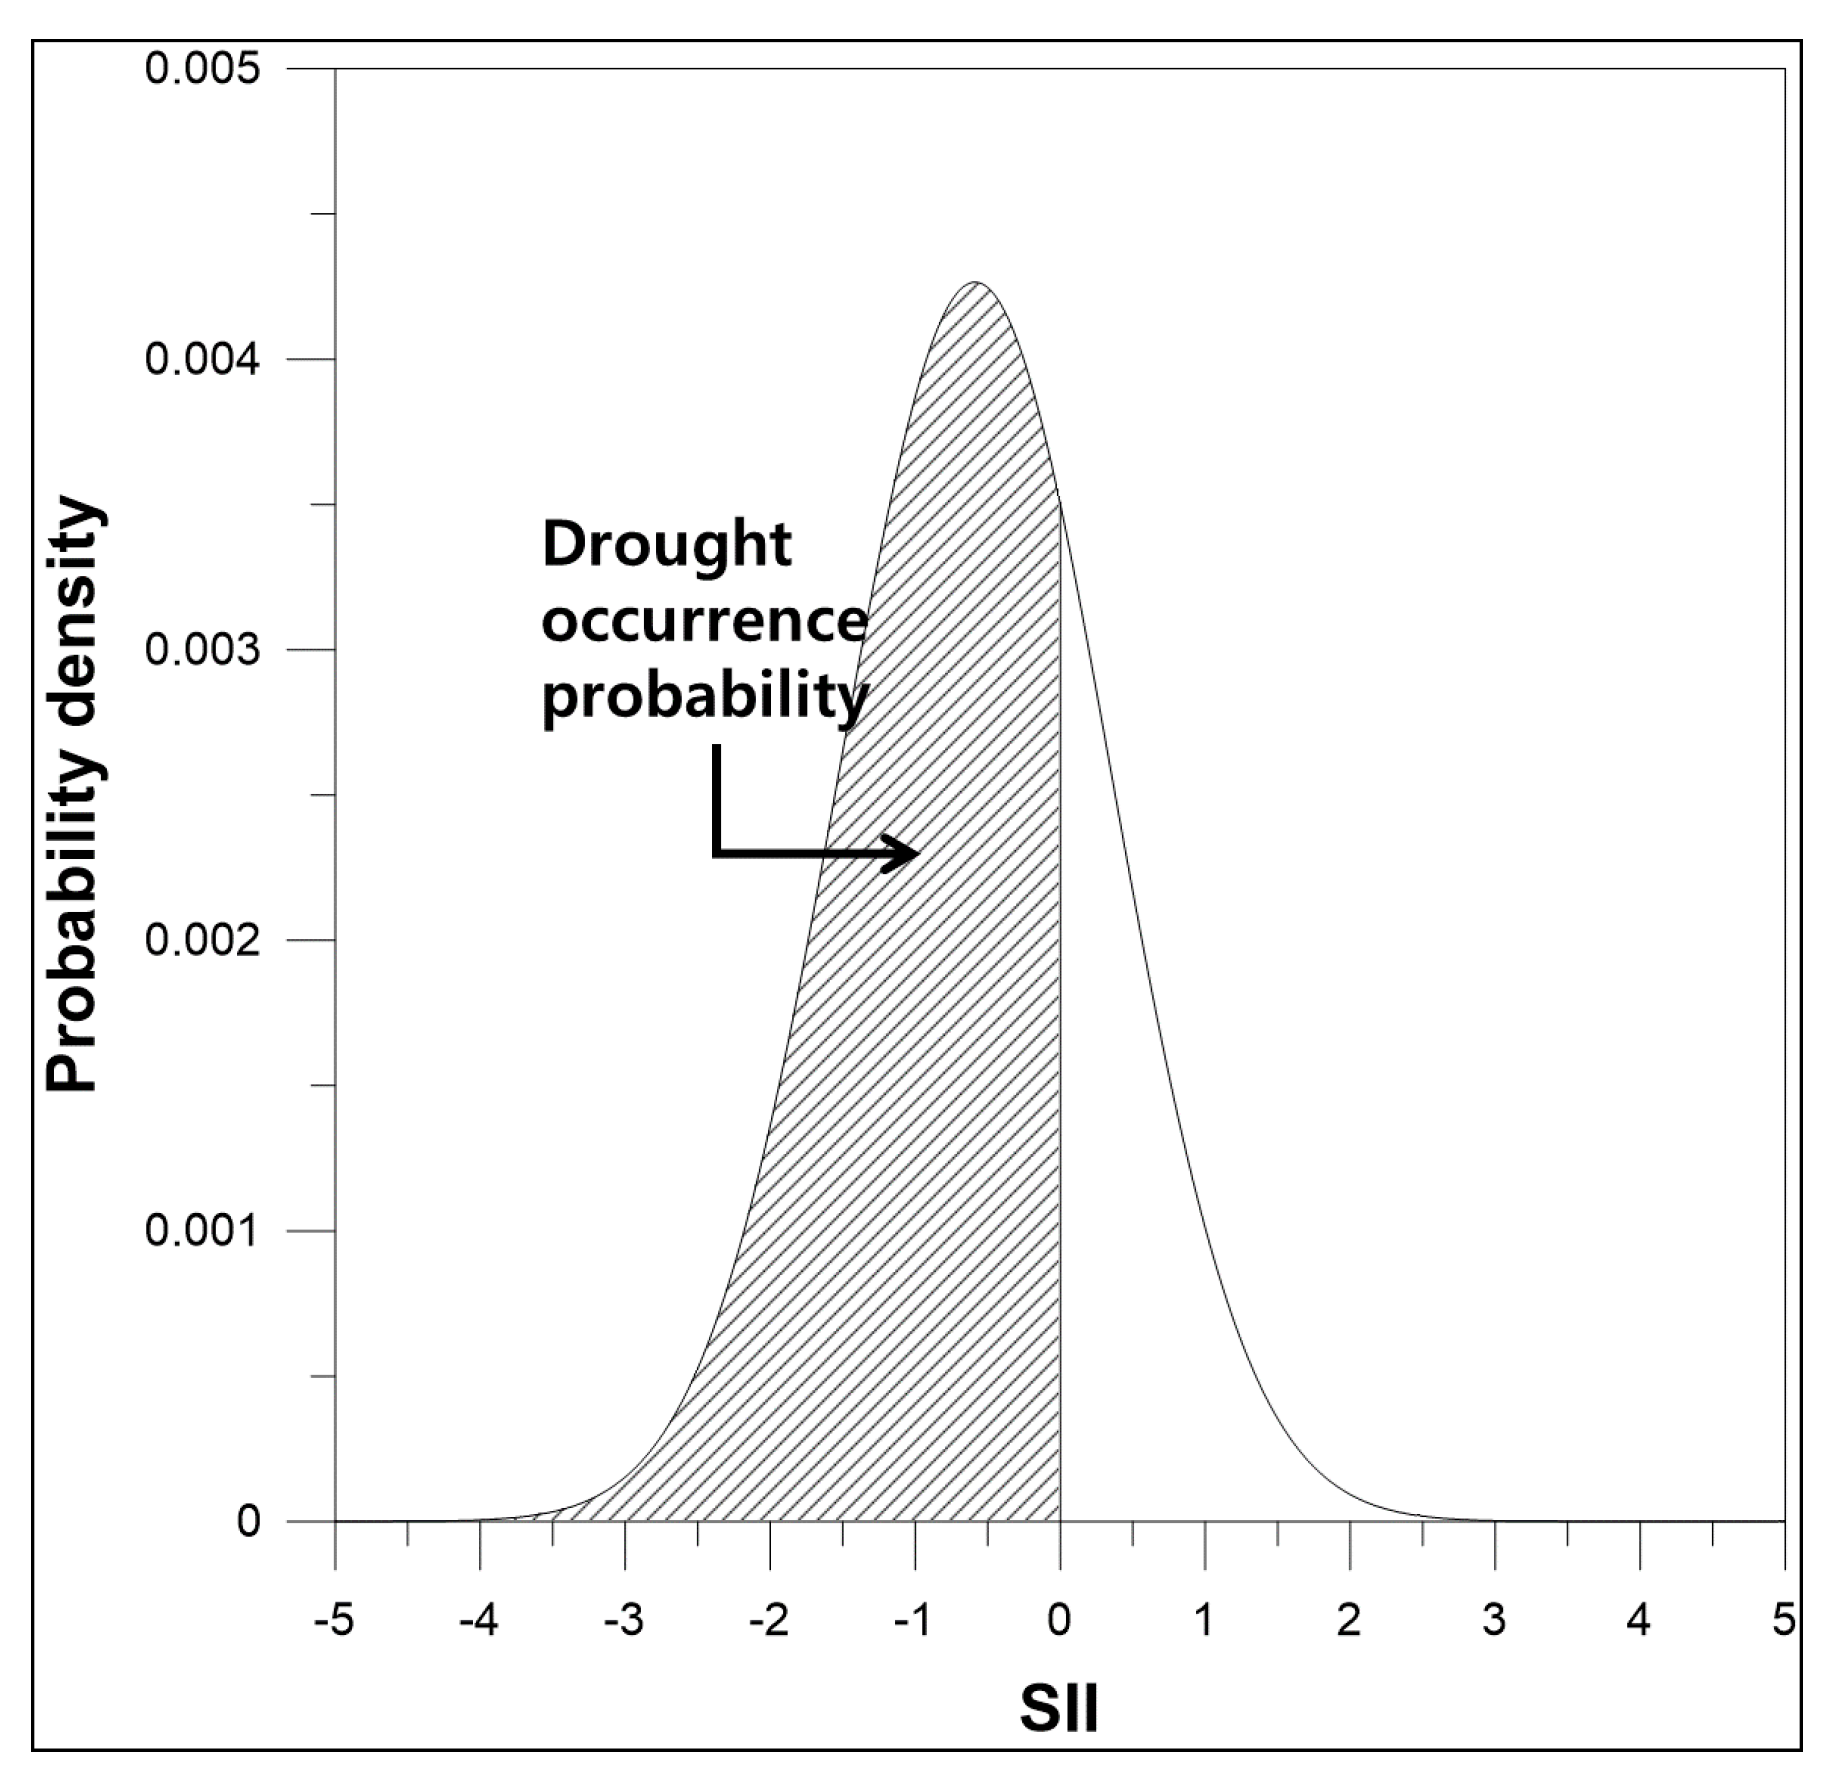
If the quarterly SII is calculated through the process above, Equation (3) is used to calculate the probability distribution of the next quarter’s SII from the previous quarter’s SII. The non-exceedance probability of the next-quarter SII probability distribution in which the SII is less than or equal to zero is the probability that a drought will occur in the next quarter. For example, Figure 2 shows the probability distribution of the third quarter SII of a reservoir when the second quarter SII is −1. Here, the area of the shaded part is the probability that the SII is less than or equal to zero in the third quarter. Drought forecasting is performed by comparing the probability that the SII is less than or equal to zero and the threshold probability of drought occurrence. If the probability of a drought occurring next quarter exceeds the threshold probability of drought occurrence, then a drought is predicted for the next quarter, otherwise a drought is not predicted.
2.4. Quarterly Inflow Forecasting Combined with Drought Forecasting
If we want to forecast the quarterly inflow using the drought forecast results, we must estimate the quarterly inflow, which represents each drought stage. To do this, we estimated the quarterly inflow forecasting curves conforming to drought stages. The quarterly inflow forecasting curves conforming to drought stages are estimated through the following method:
- (1)
- Use the probability distribution of the next quarter inflow (like that in Figure 3) to calculate the cumulative probability that corresponds to a specific inflow of the next quarter.
- (2)
- Use the cumulative probability to calculate the SII.
- (3)
- When the calculated SII is the same as the lower bound value of each drought stage, set the corresponding quarterly inflow as the quarterly inflow that represents that drought stage (for D4, the inflow where the SII is −2.5).
- (4)
- Repeat Steps (1) to (3) for all quarters and quarterly inflows.
If quarterly inflow forecasting curves conforming to drought stages are made, we must determine which curve will be selected to forecast the quarterly inflow when a drought has been forecasted. If a dam is being operated, especially for the purpose of municipal and irrigation water supplies, a drought over two successive quarters can incur damage to societies. Furthermore, continuous droughts in the second and third quarters may cause a limit on water supply due to the climate characteristics of Korea where rain is concentrated in the third quarter. In this study, if a drought occurred in the previous quarter and a drought is forecasted for the following quarter, the following quarter’s forecast inflow is determined through the quarterly inflow forecasting curve of the drought stage one stage severer than the drought stage of the previous quarter. On the other hand, if a drought is not forecasted, the quarterly inflow with the largest probability density function value is used as the following quarter’s inflow forecast value, as explained in Section 2.2.
3. Results
3.1. Two Selected Dams in This Study
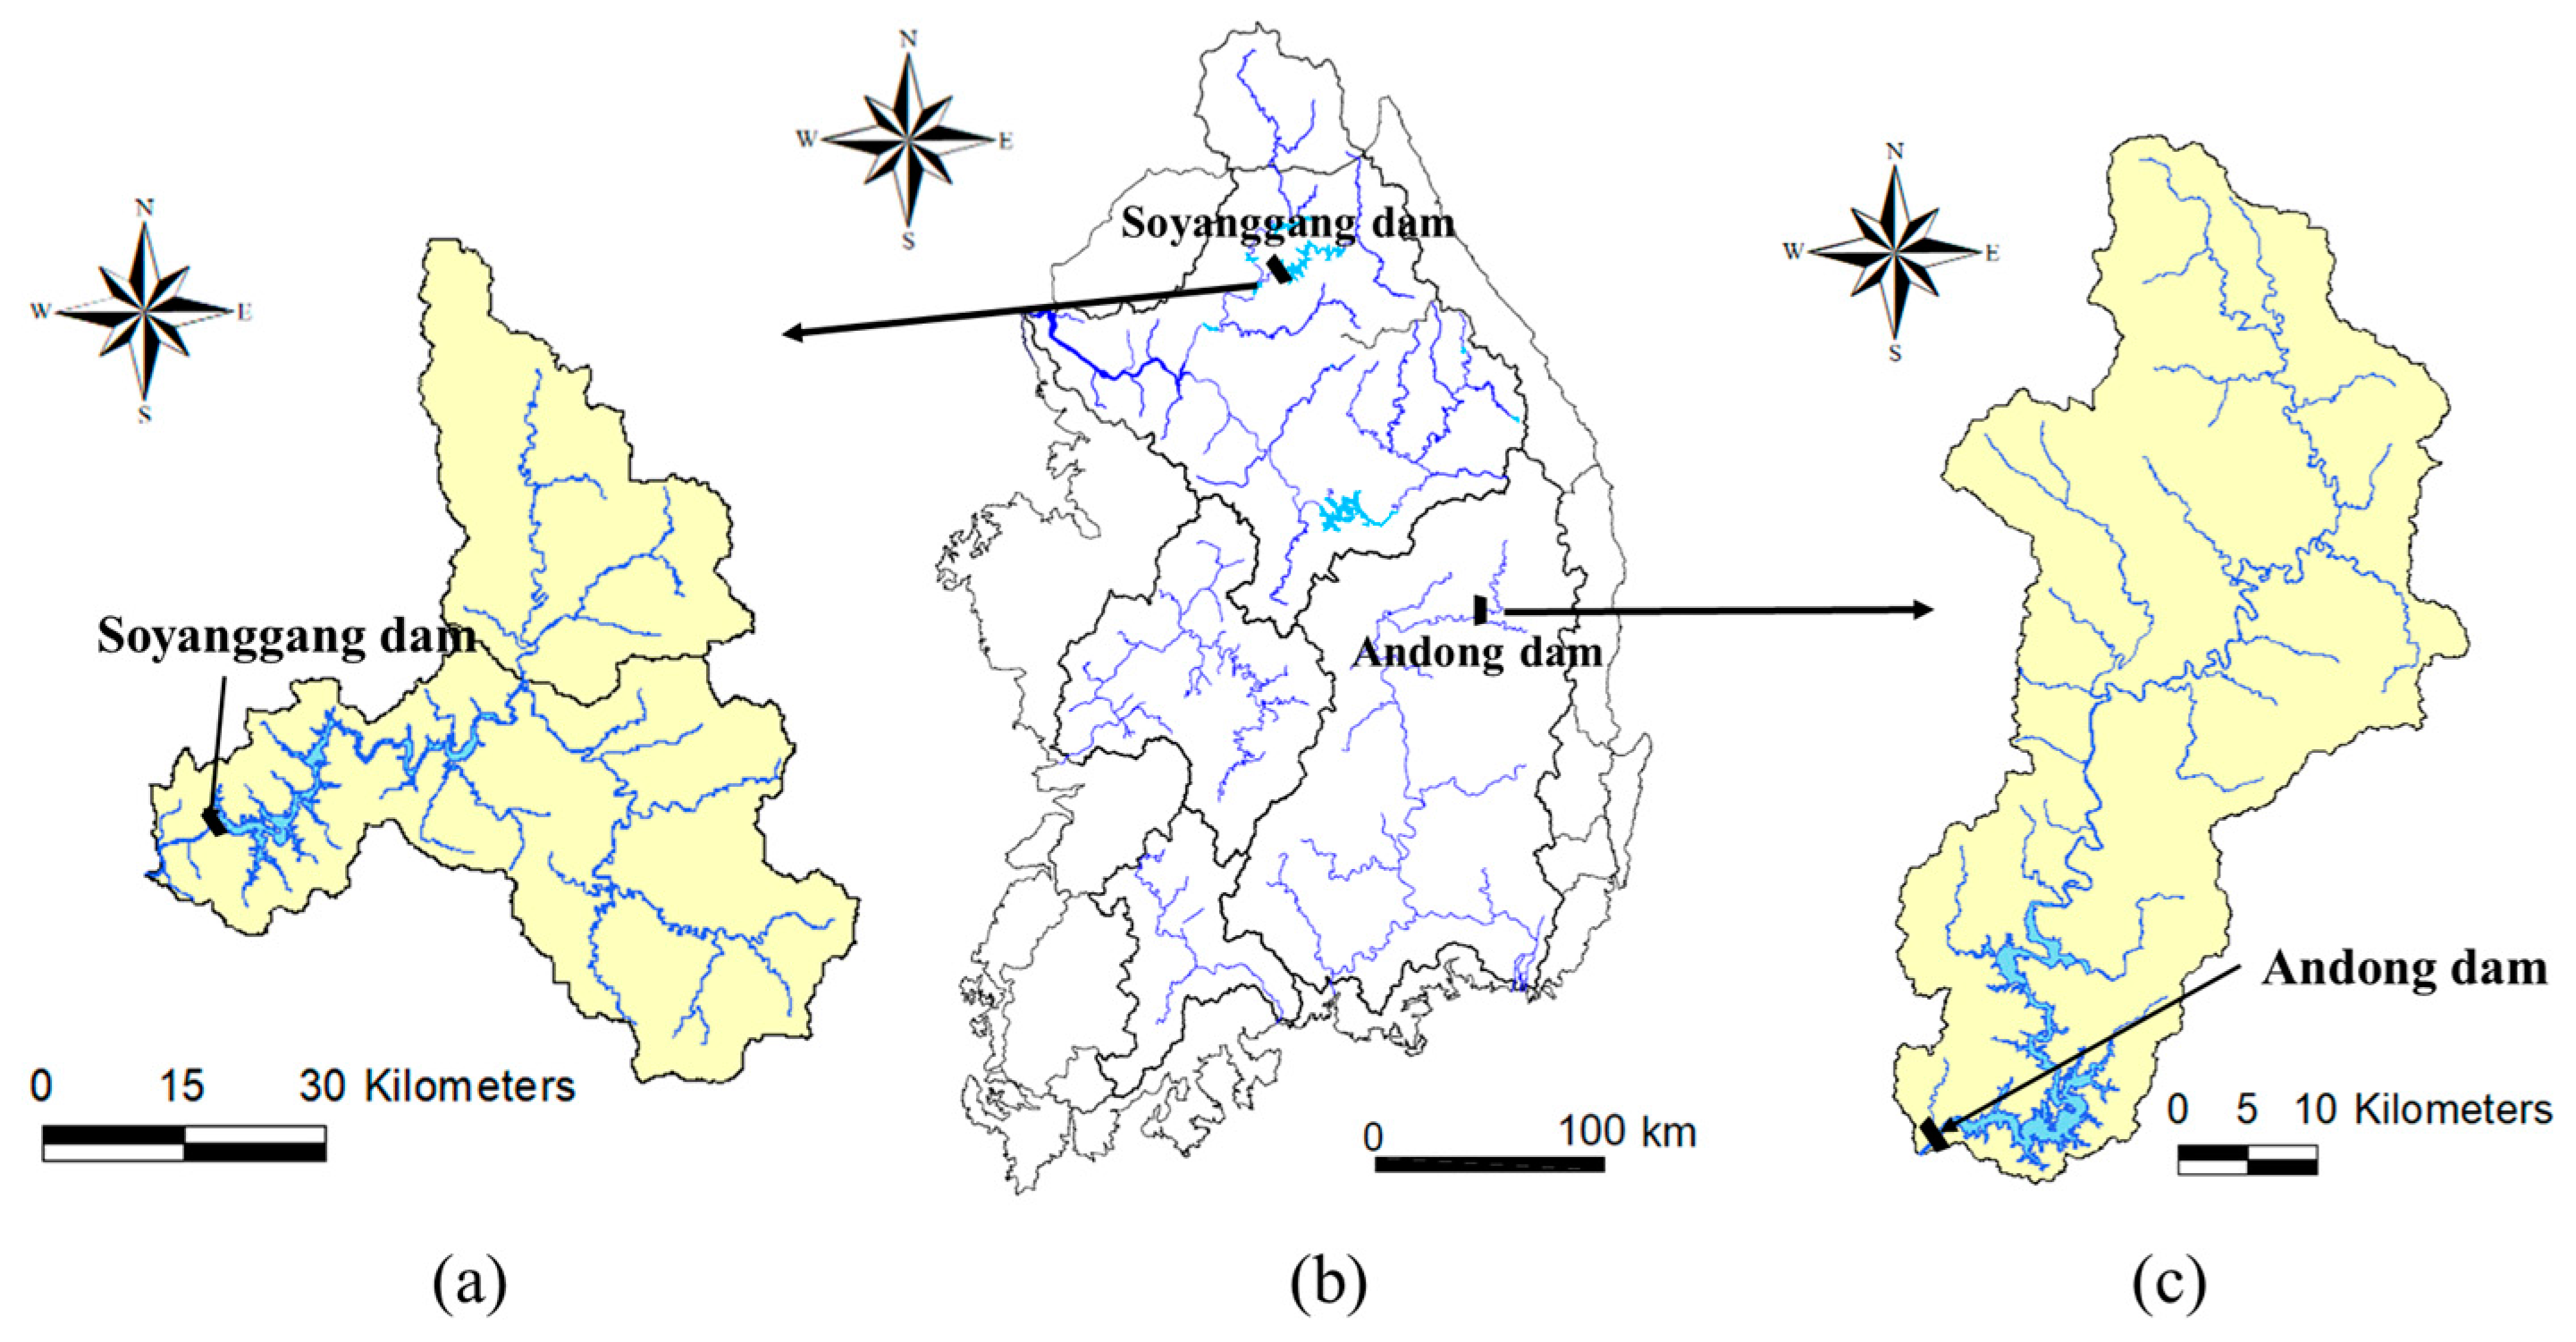
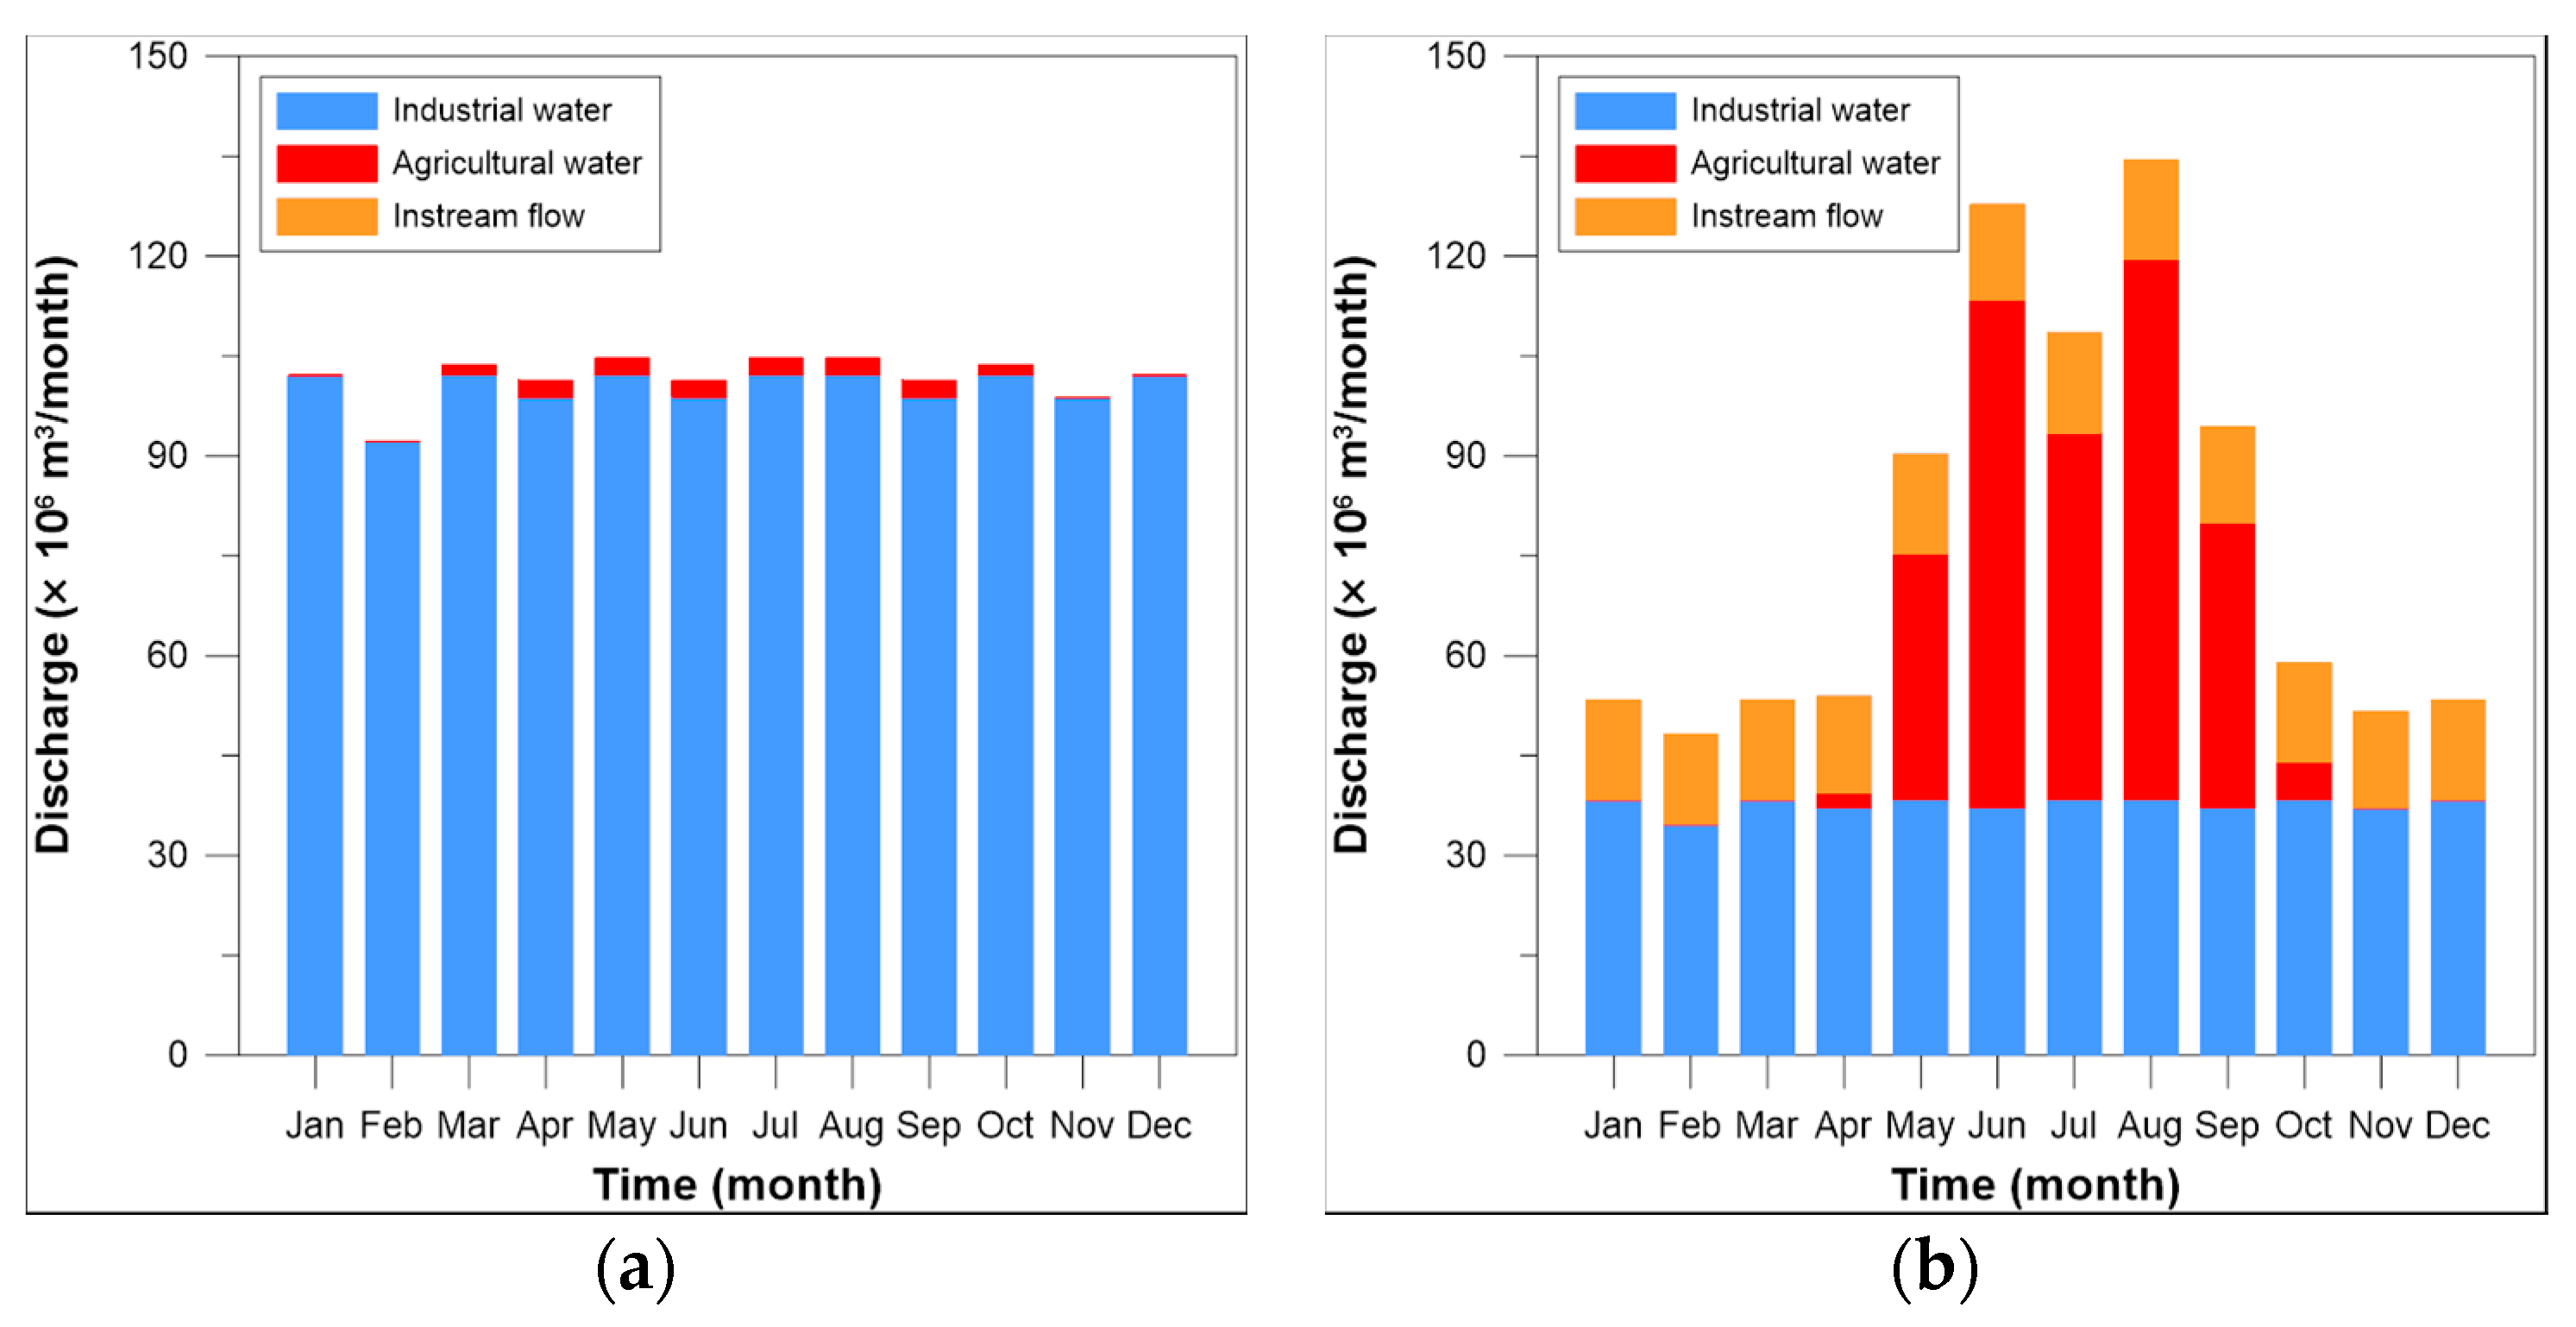
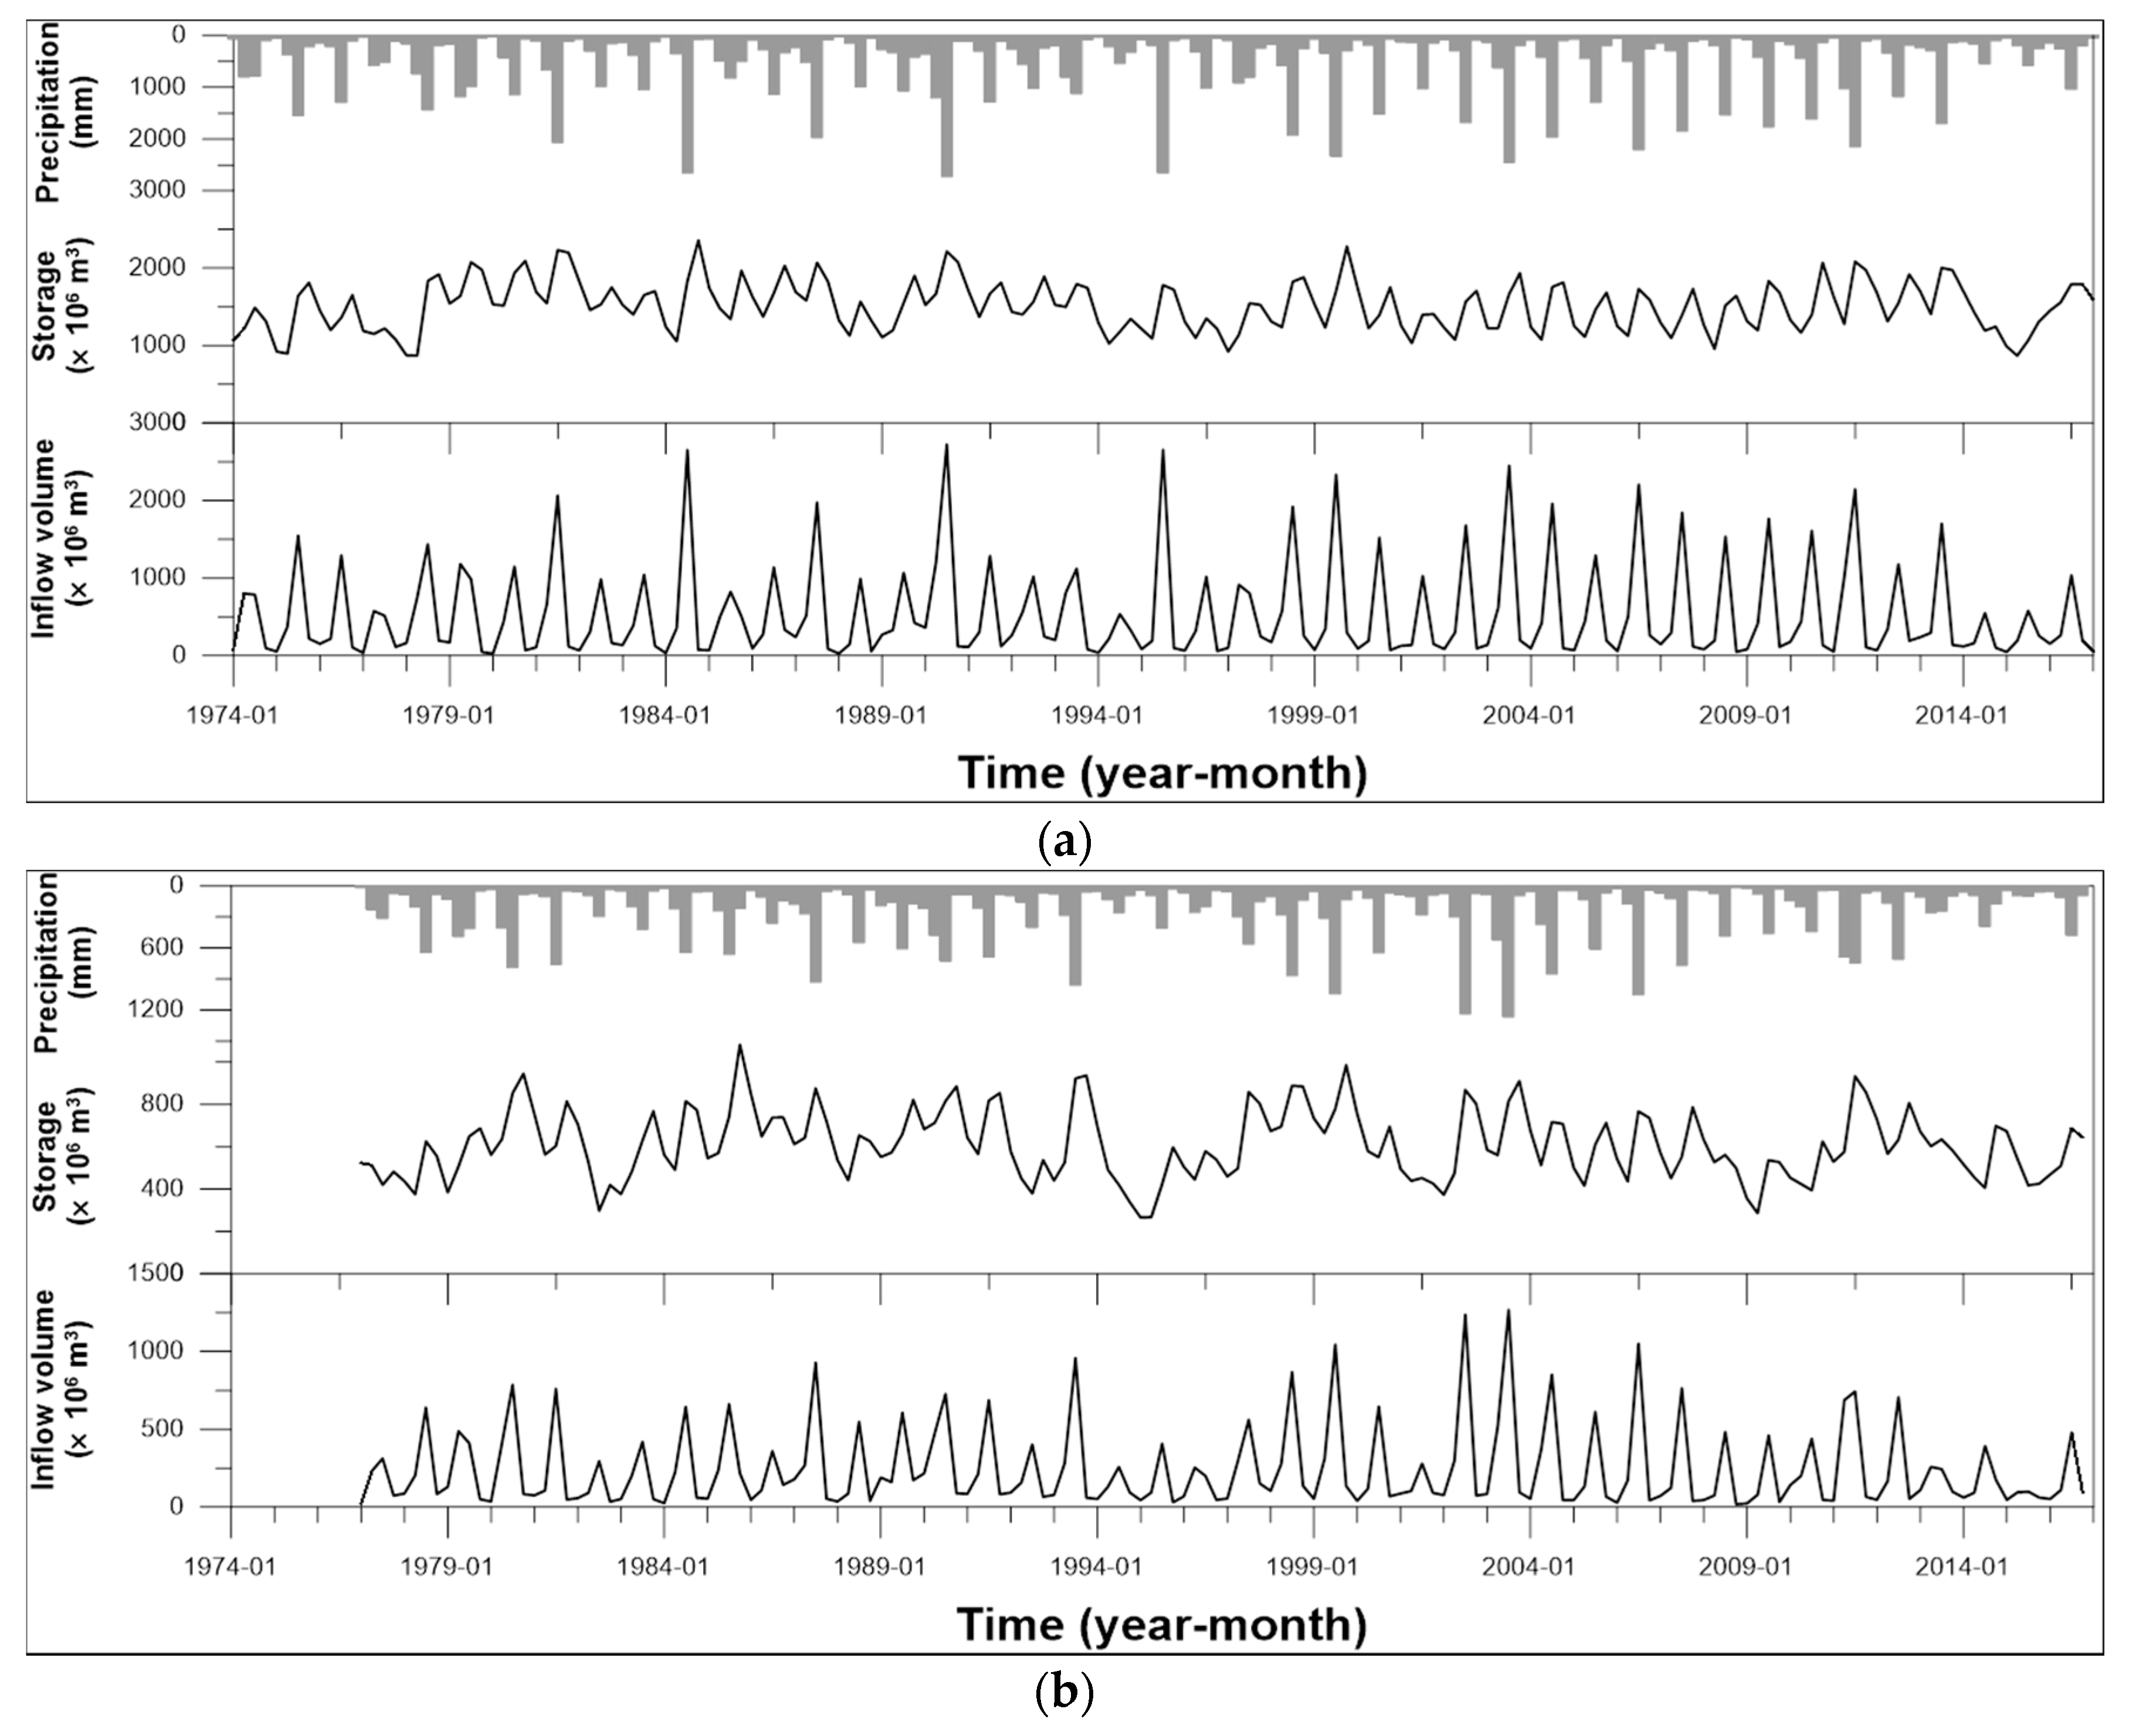
To perform probabilistic forecasting of quarterly inflow and evaluate the results, we must have data that has been recorded over a long period of time. The Soyanggang dam and the Andong dam are relatively important among all the multipurpose dams in the Republic of Korea and have long periods of recordkeeping. The two dams are located on the Han River basin and the Nakdong River basin, respectively (Figure 4). The Soyanggang dam was constructed in 1973, and flow records have been kept since 1974. The Andong dam was constructed in 1976 and has been keeping flow records since 1977. The basin area of the Soyanggang dam is 2703 km2. Its storage capacity is 2900 × 106 m3, making it the largest multipurpose dam in the Han River basin. The average yearly flow to the dam is 1750 × 106 m3 and provides 1213 × 106 m3 of water for use every year (Table 2). The Soyanggang dam supplies industrial water every month and agricultural water from March to October, and does not provide instream flow (Figure 5a). The Andong dam is located on the Nakdong River, and its basin area is 1584 km2. The storage capacity of the dam, the largest multipurpose dam in the Nakdong River basin, is 1248 × 106 m3. The average yearly flow to the dam is 940 × 106 m3 and provides 926 × 106 m3 of water for use every year (Table 2). The Andong dam supplies industrial water and instream flow every month and a relatively large amount of agricultural water from April to October (Figure 5b).
To forecast quarterly inflow, the calendar year was divided into four quarters: the first quarter is from January to March; the second from April to June; the third from July to September; the fourth from October to December. Total inflow volume of water to a reservoir for a quarter is referred to as the quarterly inflow. Figure 6 shows the quarterly operational records of the Soyanggang and Andong dams. The average amount of third quarter inflow to the Soyanggang dam is 1439 × 106 m3, and the standard deviation is 608 × 106 m3. The smallest third quarter inflow was recorded in 2014. At that time, the third quarter inflow was 513 × 106 m3, which is around 35% of the average inflow. Additionally, in 2015, the third quarter inflow of the Soyanggang dam was 578 × 106 m3, which is 40% of the average inflow. The average third quarter inflow of the Andong dam is 607 × 106 m3, and the standard deviation is 278 × 106 m3. In 2015, when the third quarter inflow of the Andong dam was the smallest, it was 98 × 106 m3, which is 16% of the average inflow. Unlike the Soyanggang dam, the third quarter inflow of the Andong dam in 2013 was smaller than that in 2014. The third quarter inflow in 2013 was 243 × 106 m3, which is 40% of the average inflow. As can be realized from the two dam's inflow states, the drought that occurred in the Republic of Korea from 2013 to 2015 was fairly severe. We used the quarterly inflow data from the first year of observation to 2010 to train the copula-based Bayesian network model. The quarterly inflow data from 2011 and 2016 were used to verify the forecast results from the trained copula-based Bayesian network module.
3.2. Quarterly Inflow Forecasting Curves Conforming to Drought Stages
To create a copula-based Bayesian network, we must first determine the best distribution of the quarterly inflow. Figure 7 and Figure 8 show histograms and five probability distribution curves calculated from the parameters estimated by the MLE from the quarterly inflow data for the Soyanggang dam and the Andong dam, respectively. Table 3 shows the results of the K–S test with a significance level set at 0.05. In Table 3, the values shown in bold are the smallest values of that do not exceed the threshold values. The lognormal distribution is found to be the best fit to the quarterly inflow volumes in the case of the Andong dam, except for those of the third quarter. These results are different from those of Gusyev et al. [32], who used gamma distributions to fit the inflow data. Rather, it is similar to the results of Madadgar and Moradkhani [25], who found that the lognormal distribution is suitable for the flow data at Gunnison River for all quarters except for the second.
Table 4 shows the results of calculating the correlation coefficient of the inflows between the two successive quarters, which is a variable used in the Gaussian copula function. Looking at Table 4, the correlation coefficients of the inflows between two successive quarters at the Soyanggang dam, with the exception of that between the first and second quarters, are not large. On the other hand, in the case of the Andong dam, the inflow correlation coefficients between the first and second quarters and between the second and third quarters were found to be larger than those between other successive quarters. These results indicate proportional dependence between the inflows in the second and third quarters and the inflows in the previous quarters.
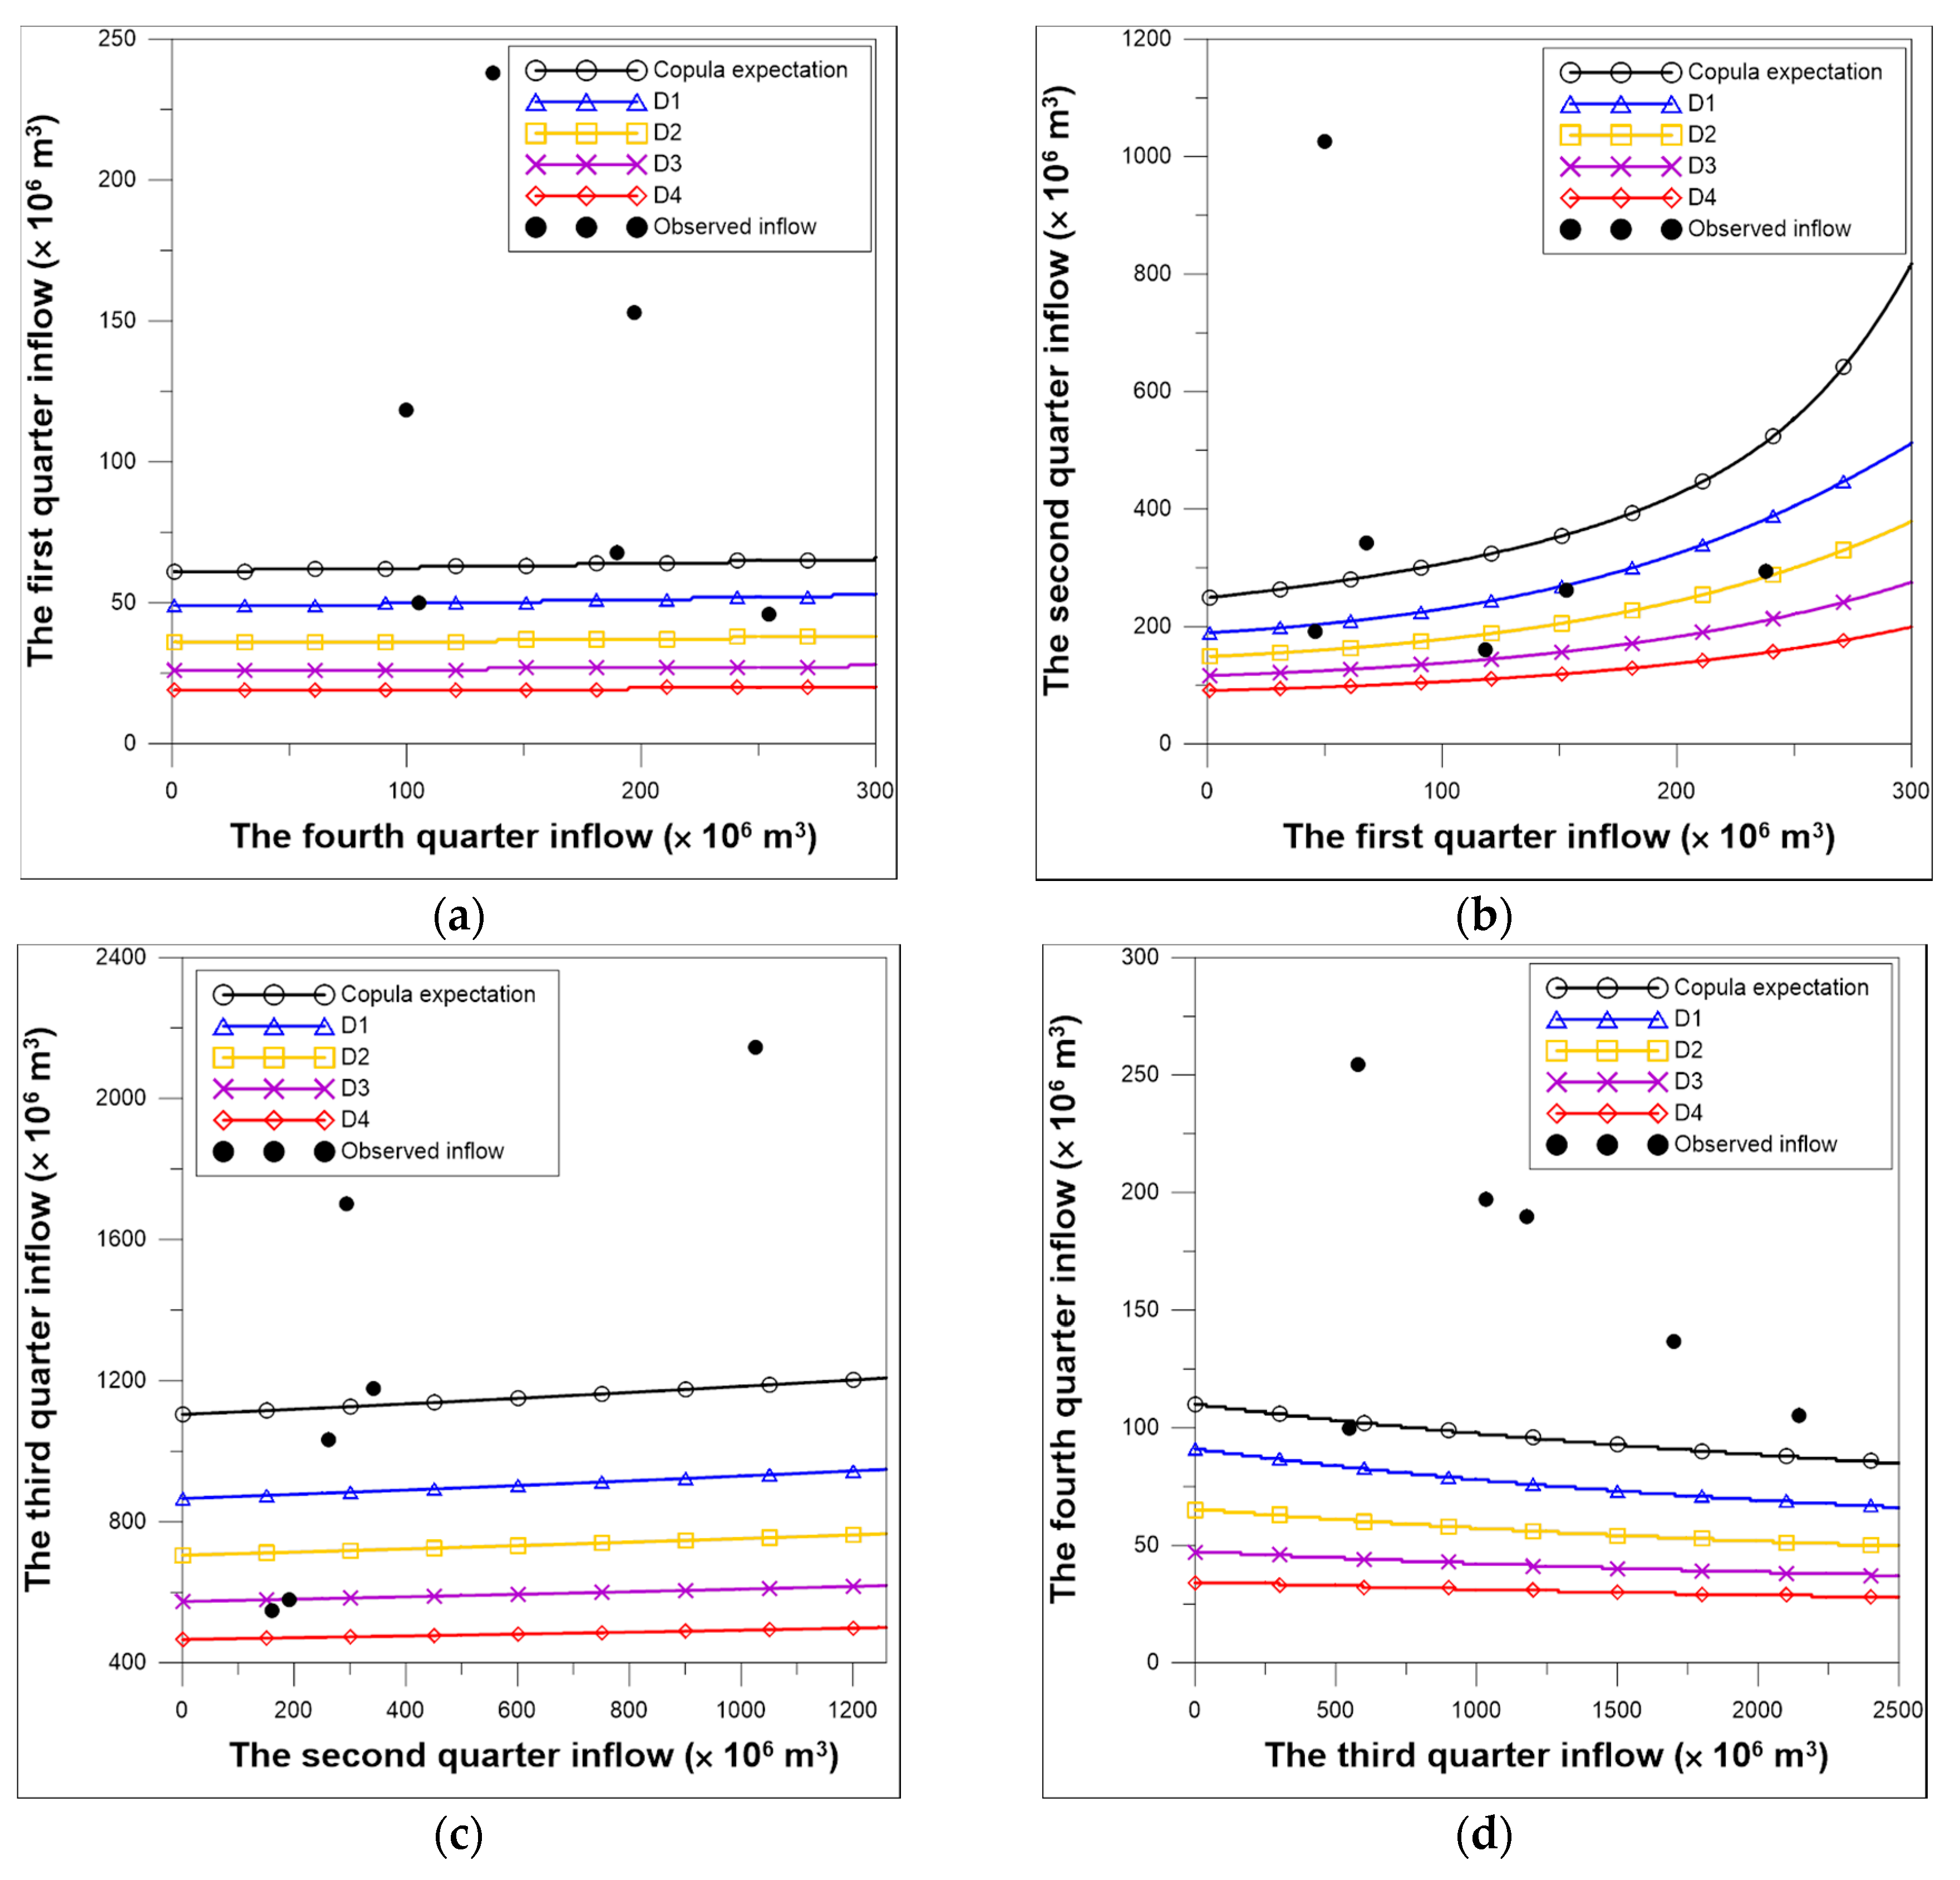
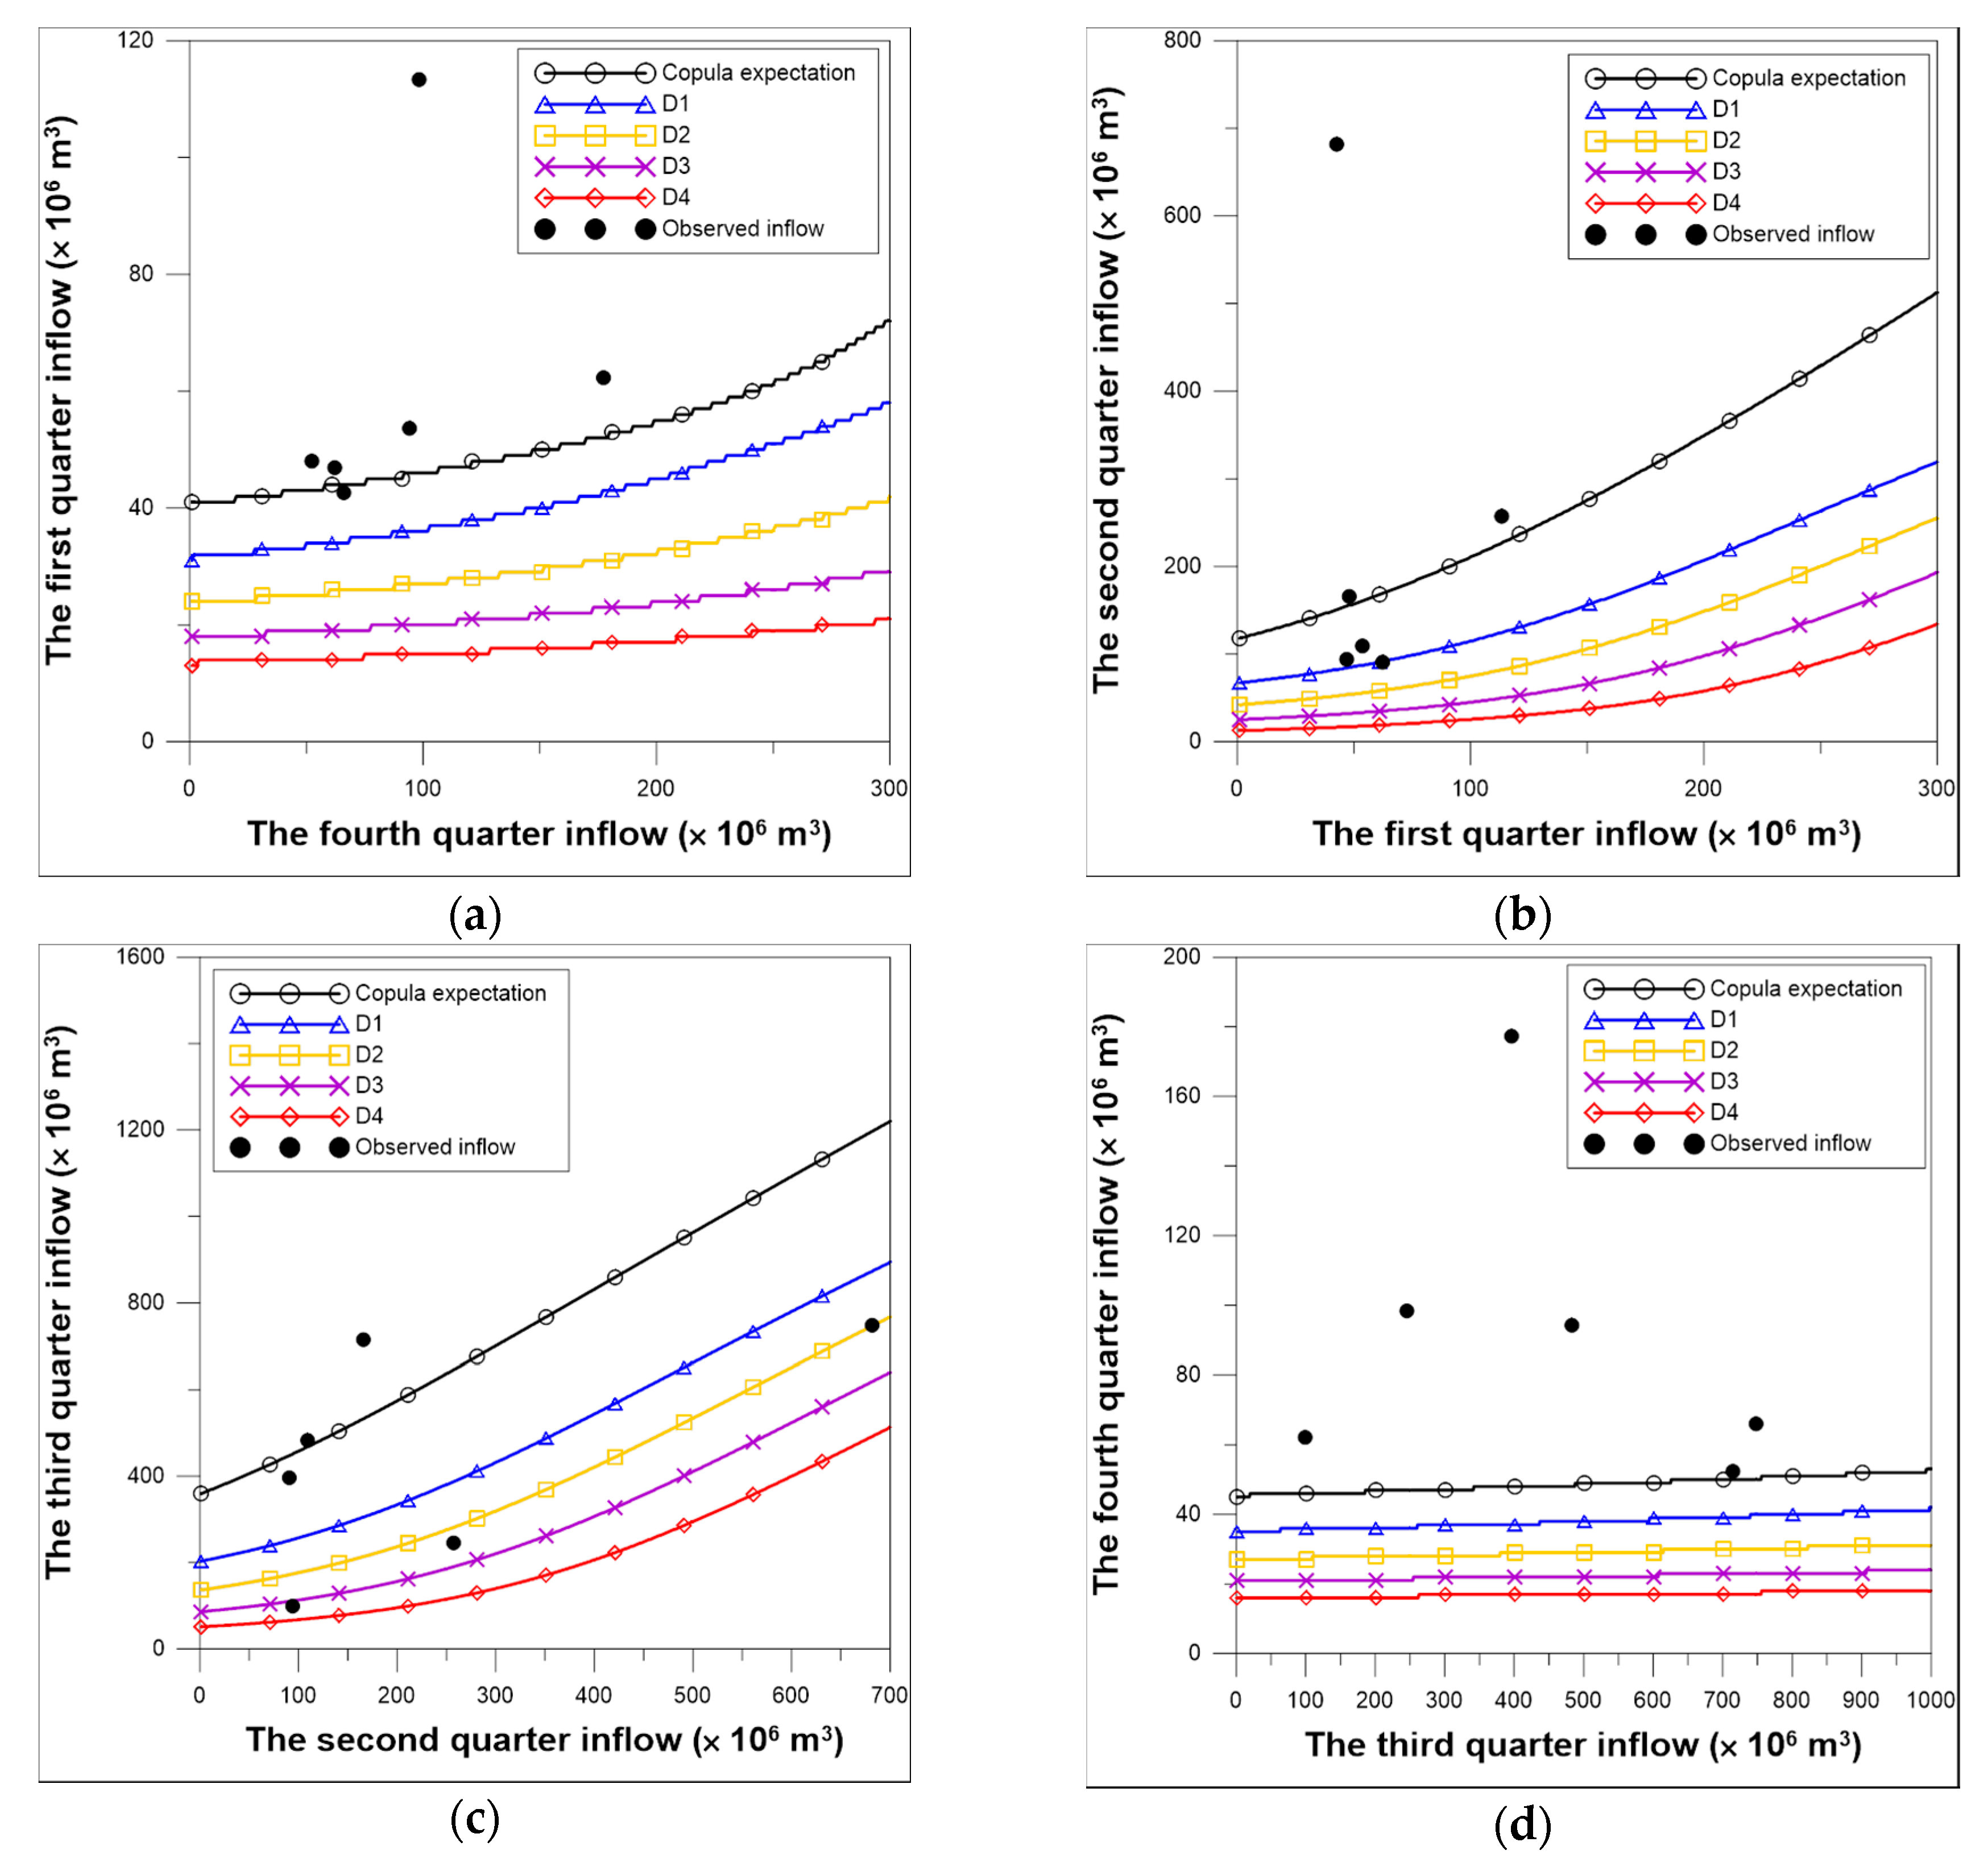
The previously determined probability distribution of quarterly inflow and the Gaussian copula function were used to create the two dams’ copula-based Bayesian networks. Figure 9 and Figure 10 show the quarterly inflow forecasting curves conforming to drought stages that were determined using the networks. In the figures, the horizontal axis denotes the previous quarter’s inflow, and the vertical axis denotes the next quarter’s inflow. The black circles in the figures show the observed quarterly inflows from 2011 to 2016. In Figure 9b, the second quarter inflow forecasting curves conforming to drought stages show a trend due to the effect of the correlation coefficient of inflow between the first and second quarters. There, however, are few such trends for the other quarters. Looking at the forecasting curves of the third quarter inflow conforming to drought stages (Figure 9c), there are two observed quarterly inflows that are much less than the other observed quarterly inflows. The two values, which represent the observed inflows in the third quarters of 2014 and 2015 during severe droughts at the Soyanggang dam, are located close to the curve that corresponds to the drought stage of D3. If a drought had occurred in the second quarter of 2014 and 2015 and a drought was forecast for the third quarter, it would have been possible to forecast adequately the quarterly inflows corresponding to these two observed values. The observed quarterly inflows in the fourth quarter are substantially larger than those indicated by the quarterly inflow forecasting curves (Figure 9d). Since the average of these inflows is about one-ninth of the average of the observed quarterly inflows in the third quarter, the above errors do not significantly affect the water supply operation of the reservoir.
In the case of the Andong dam, the correlation coefficients of inflows between the first and second quarters and between the second and third quarters were relatively large. As a result, the slopes of the second quarter inflow forecasting curves (Figure 10b) and the third quarter inflow forecasting curves conforming to drought stages (Figure 10c) were larger than the slopes of the other two quarters’ curves. There are two observed inflows located in the vicinity of the D2 and D3 curves on the third quarter inflow forecast curves (Figure 10c). These points are the observed third quarter inflows for 2013 and 2015. For the inflows corresponding to these two points, if droughts had occurred in the second quarters of 2013 and 2015 and droughts had been forecast for the third quarters, they could have been adequately forecasted.
3.3. Quarterly Drought Forecast Results
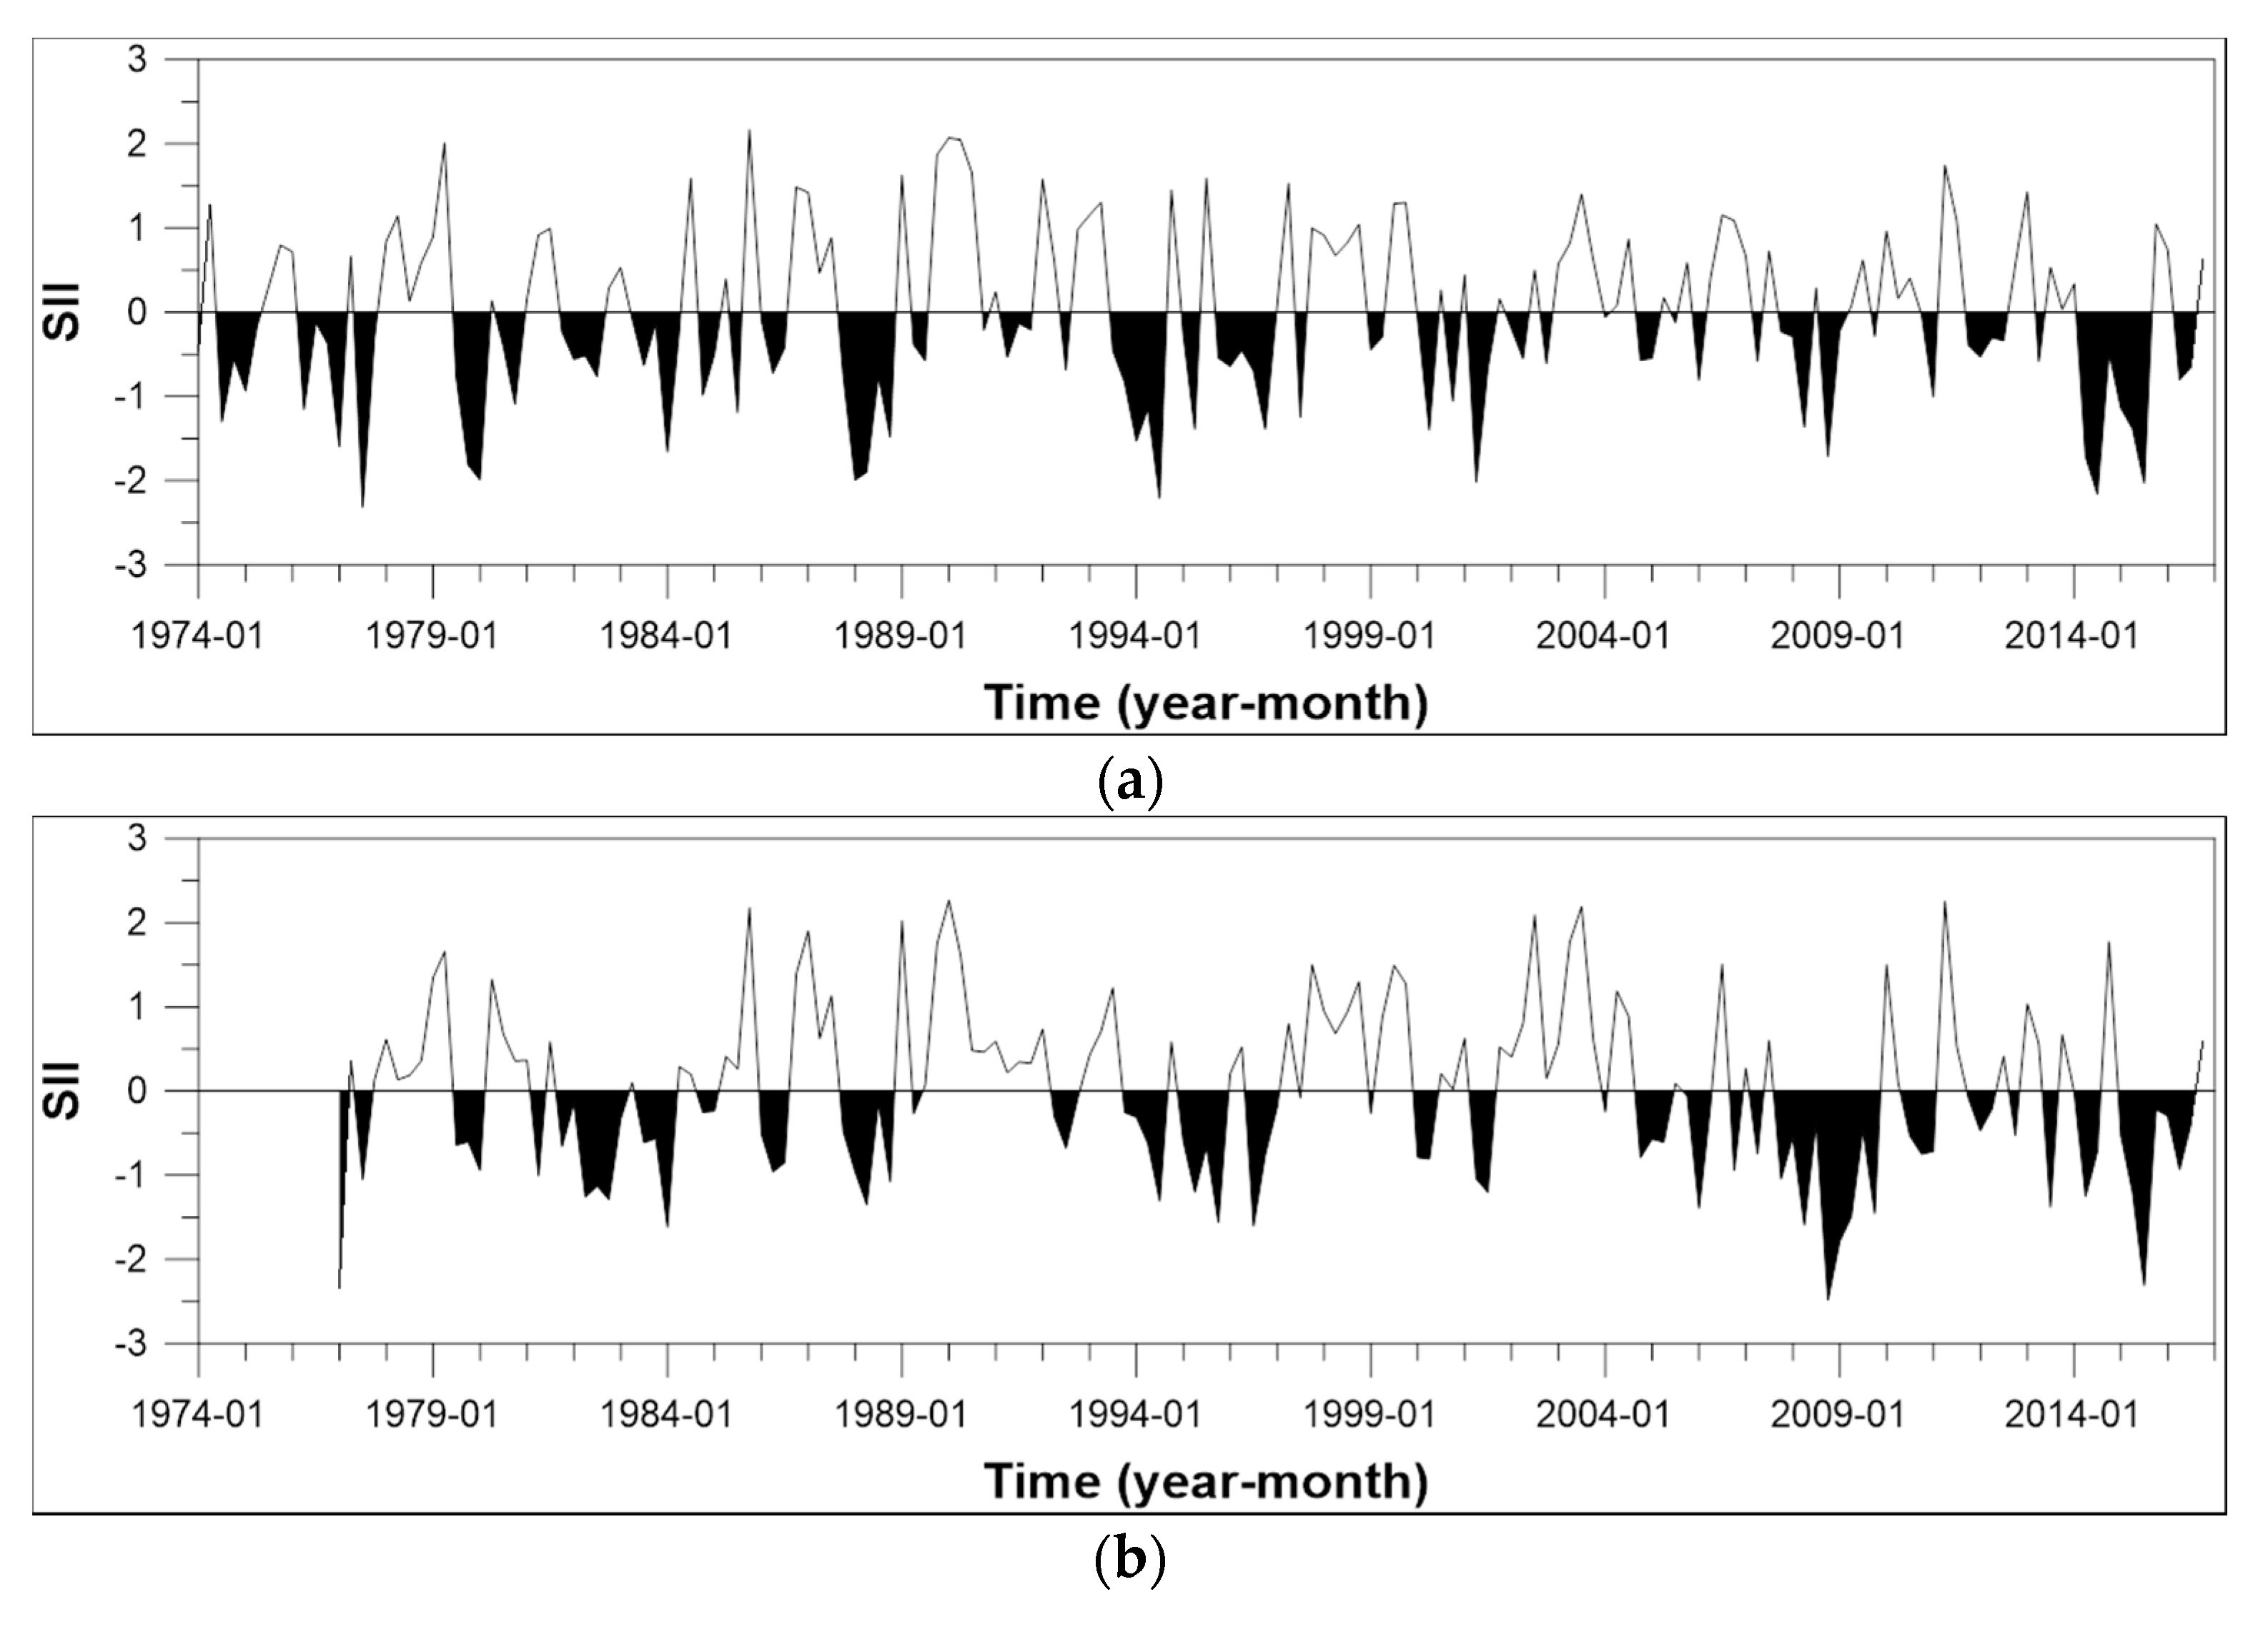
Figure 11 shows the calculation results of the quarterly SII of the two dams. In Figure 11, the black area with the SII below zero represents droughts. Figure 11a clearly shows that the Soyanggang dam experienced extreme droughts (SII < −2.0) in 2014 and 2015. Figure 11b shows that the Andong dam experienced moderate droughts (−1.0 ≤ SII < −1.5) in 2013 and 2014 and extreme drought in 2015.
Before verifying the drought forecasting, we evaluated the drought forecasting accuracy during the training period of the Bayesian network. The results showed that, in the case of the Soyanggang dam, drought forecasting had a 75% probability of success, and, in the case of the Andong dam, drought forecasting had a 65% probability of success, meaning the probabilities of drought forecasting success at both dams were not low.
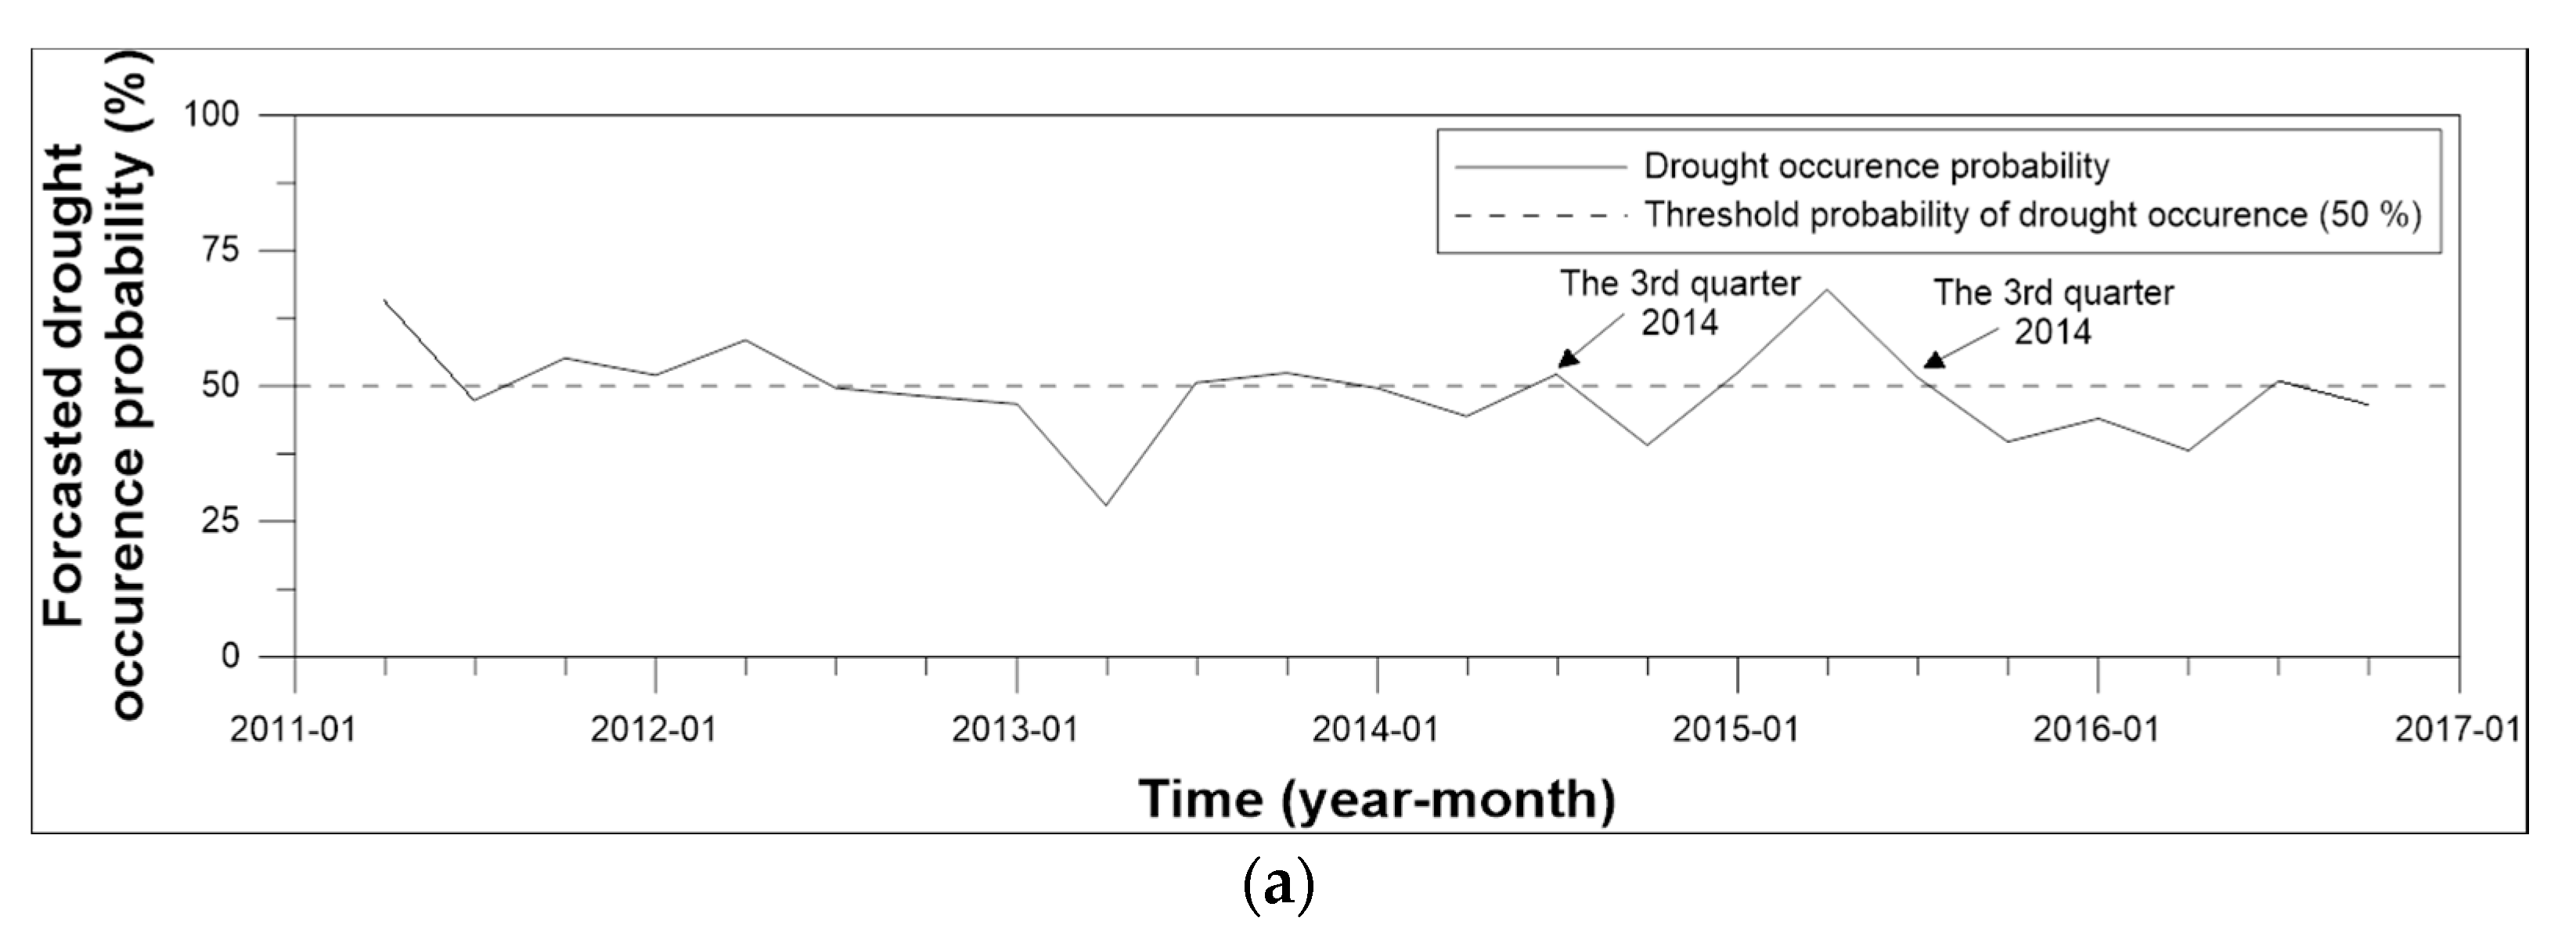
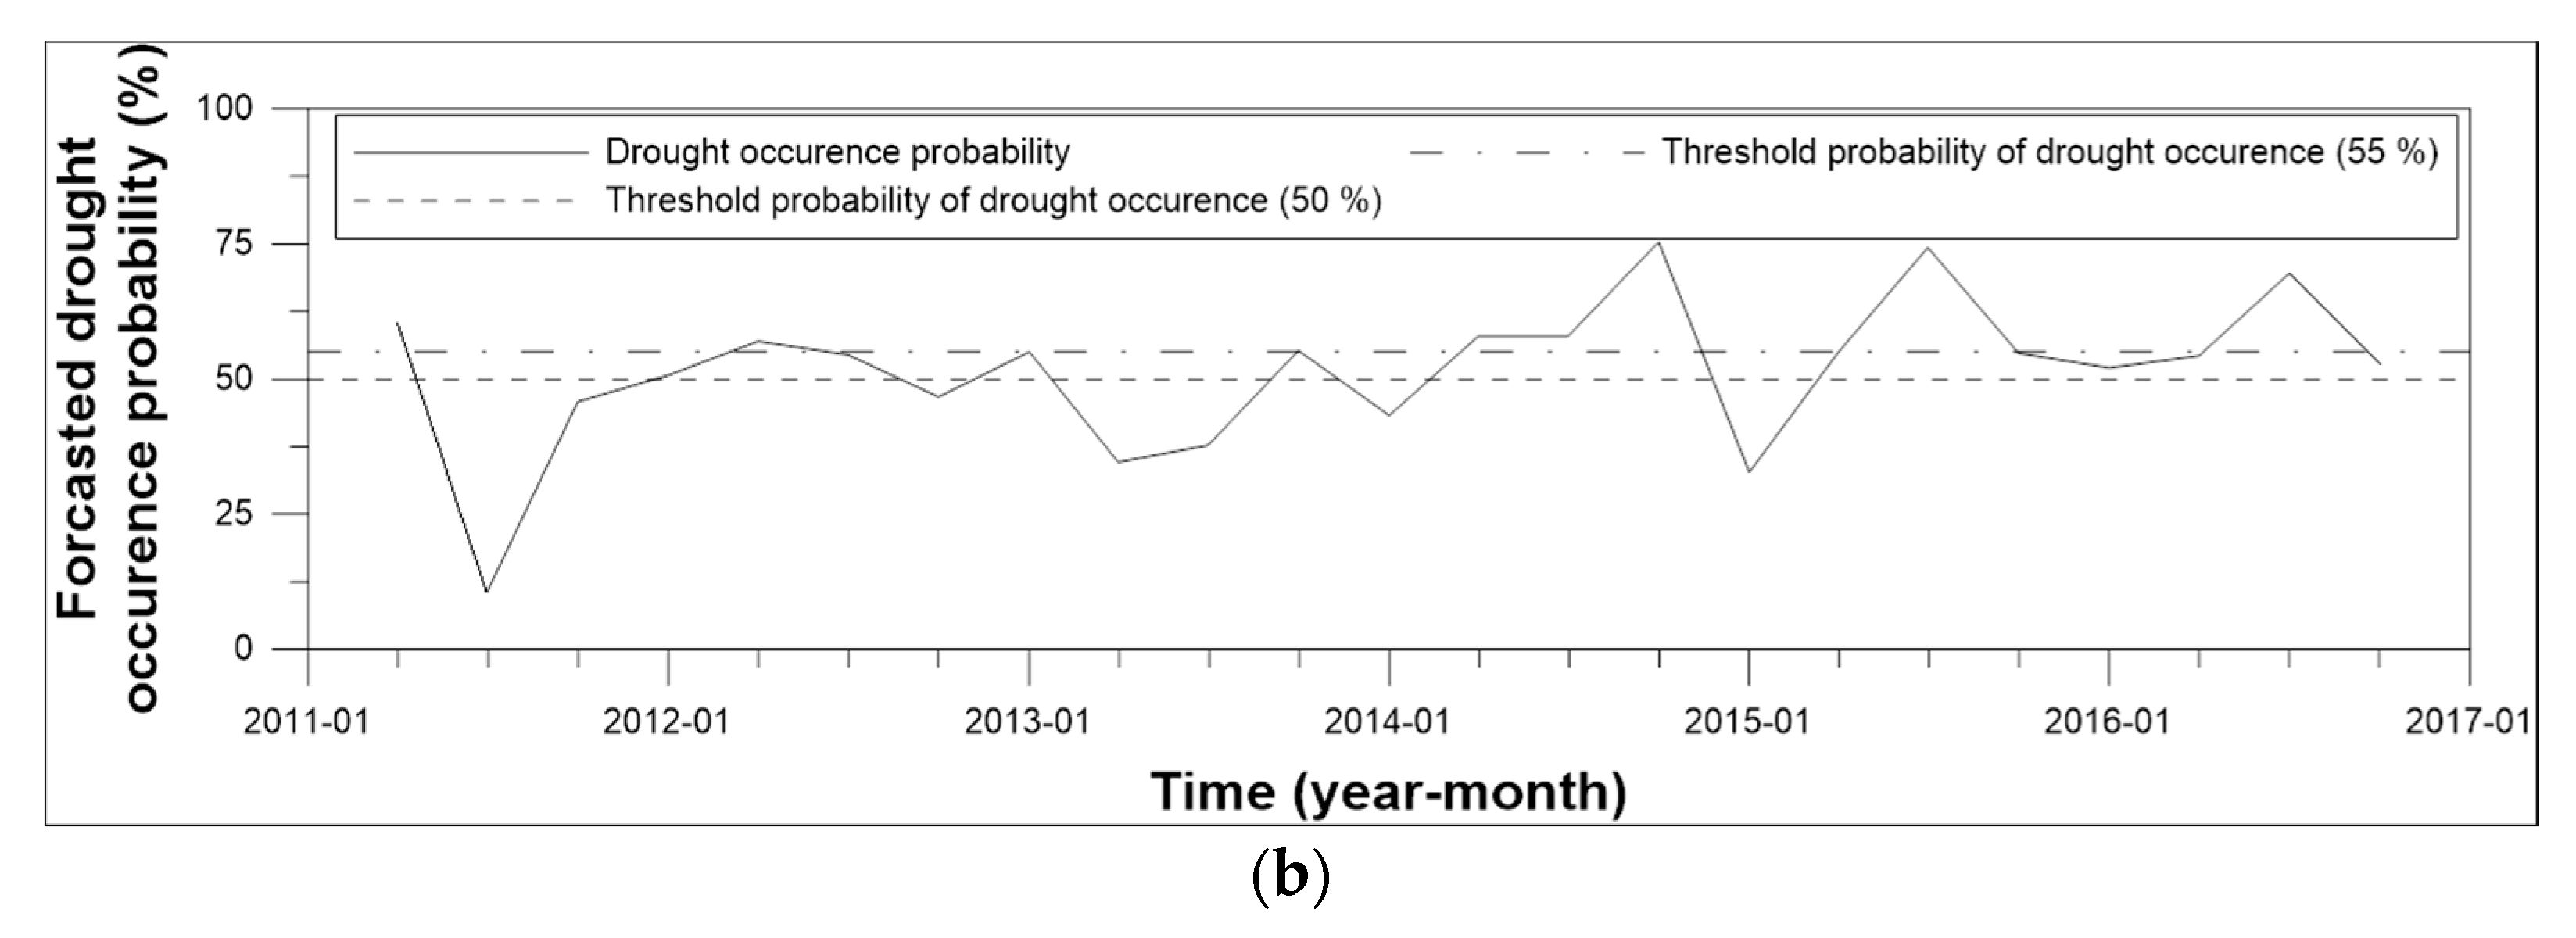
Figure 12 shows the drought forecast results for the verification period from 2011 to 2016, as a result of the probability that the SII for the next quarter will be less than or equal to zero, that is, the drought occurrence probability. In the third quarters of 2014 and 2015 (Figure 12a), the probabilities of drought occurrence in the Soyanggang dam exceeded 50%, and in reality, extreme droughts occurred with an SII value of −2 or less. These results mean that drought forecasts were reliable for the two quarters if the threshold probability of drought occurrence was set at 50%. In the case of the Andong dam, however, in the third quarter of 2013 (Figure 12b), when a moderate drought with an SII of −1.2 occurred in reality, the probability of a drought occurrence was calculated to be below 50%. It is believed that this result occurred due to the large correlation coefficient of inflows between the second and third quarter SIIs. Specifically, the SII of the Andong dam in the second quarter of 2013 was larger than zero in reality. Because of this, the non-exceedance probability that the SII is less than or equal to zero in the third quarter was forecasted to be small, since the SII in the third quarter has a large correlation coefficient with the SII in the second quarter. Unlike 2013, the probability of a drought occurrence in the third quarter of 2015 was forecasted to be high because the second quarter SII was small. This means that the drought forecasting method has limitations in forecasting moderate droughts that randomly occur without relation to the prior quarter’s SII at reservoirs with a large correlation coefficient for the SIIs of successive quarters. On the other hand, it was successful to forecast extreme droughts that occur after some continued droughts.
3.4. Quarterly Inflow Forecast Results
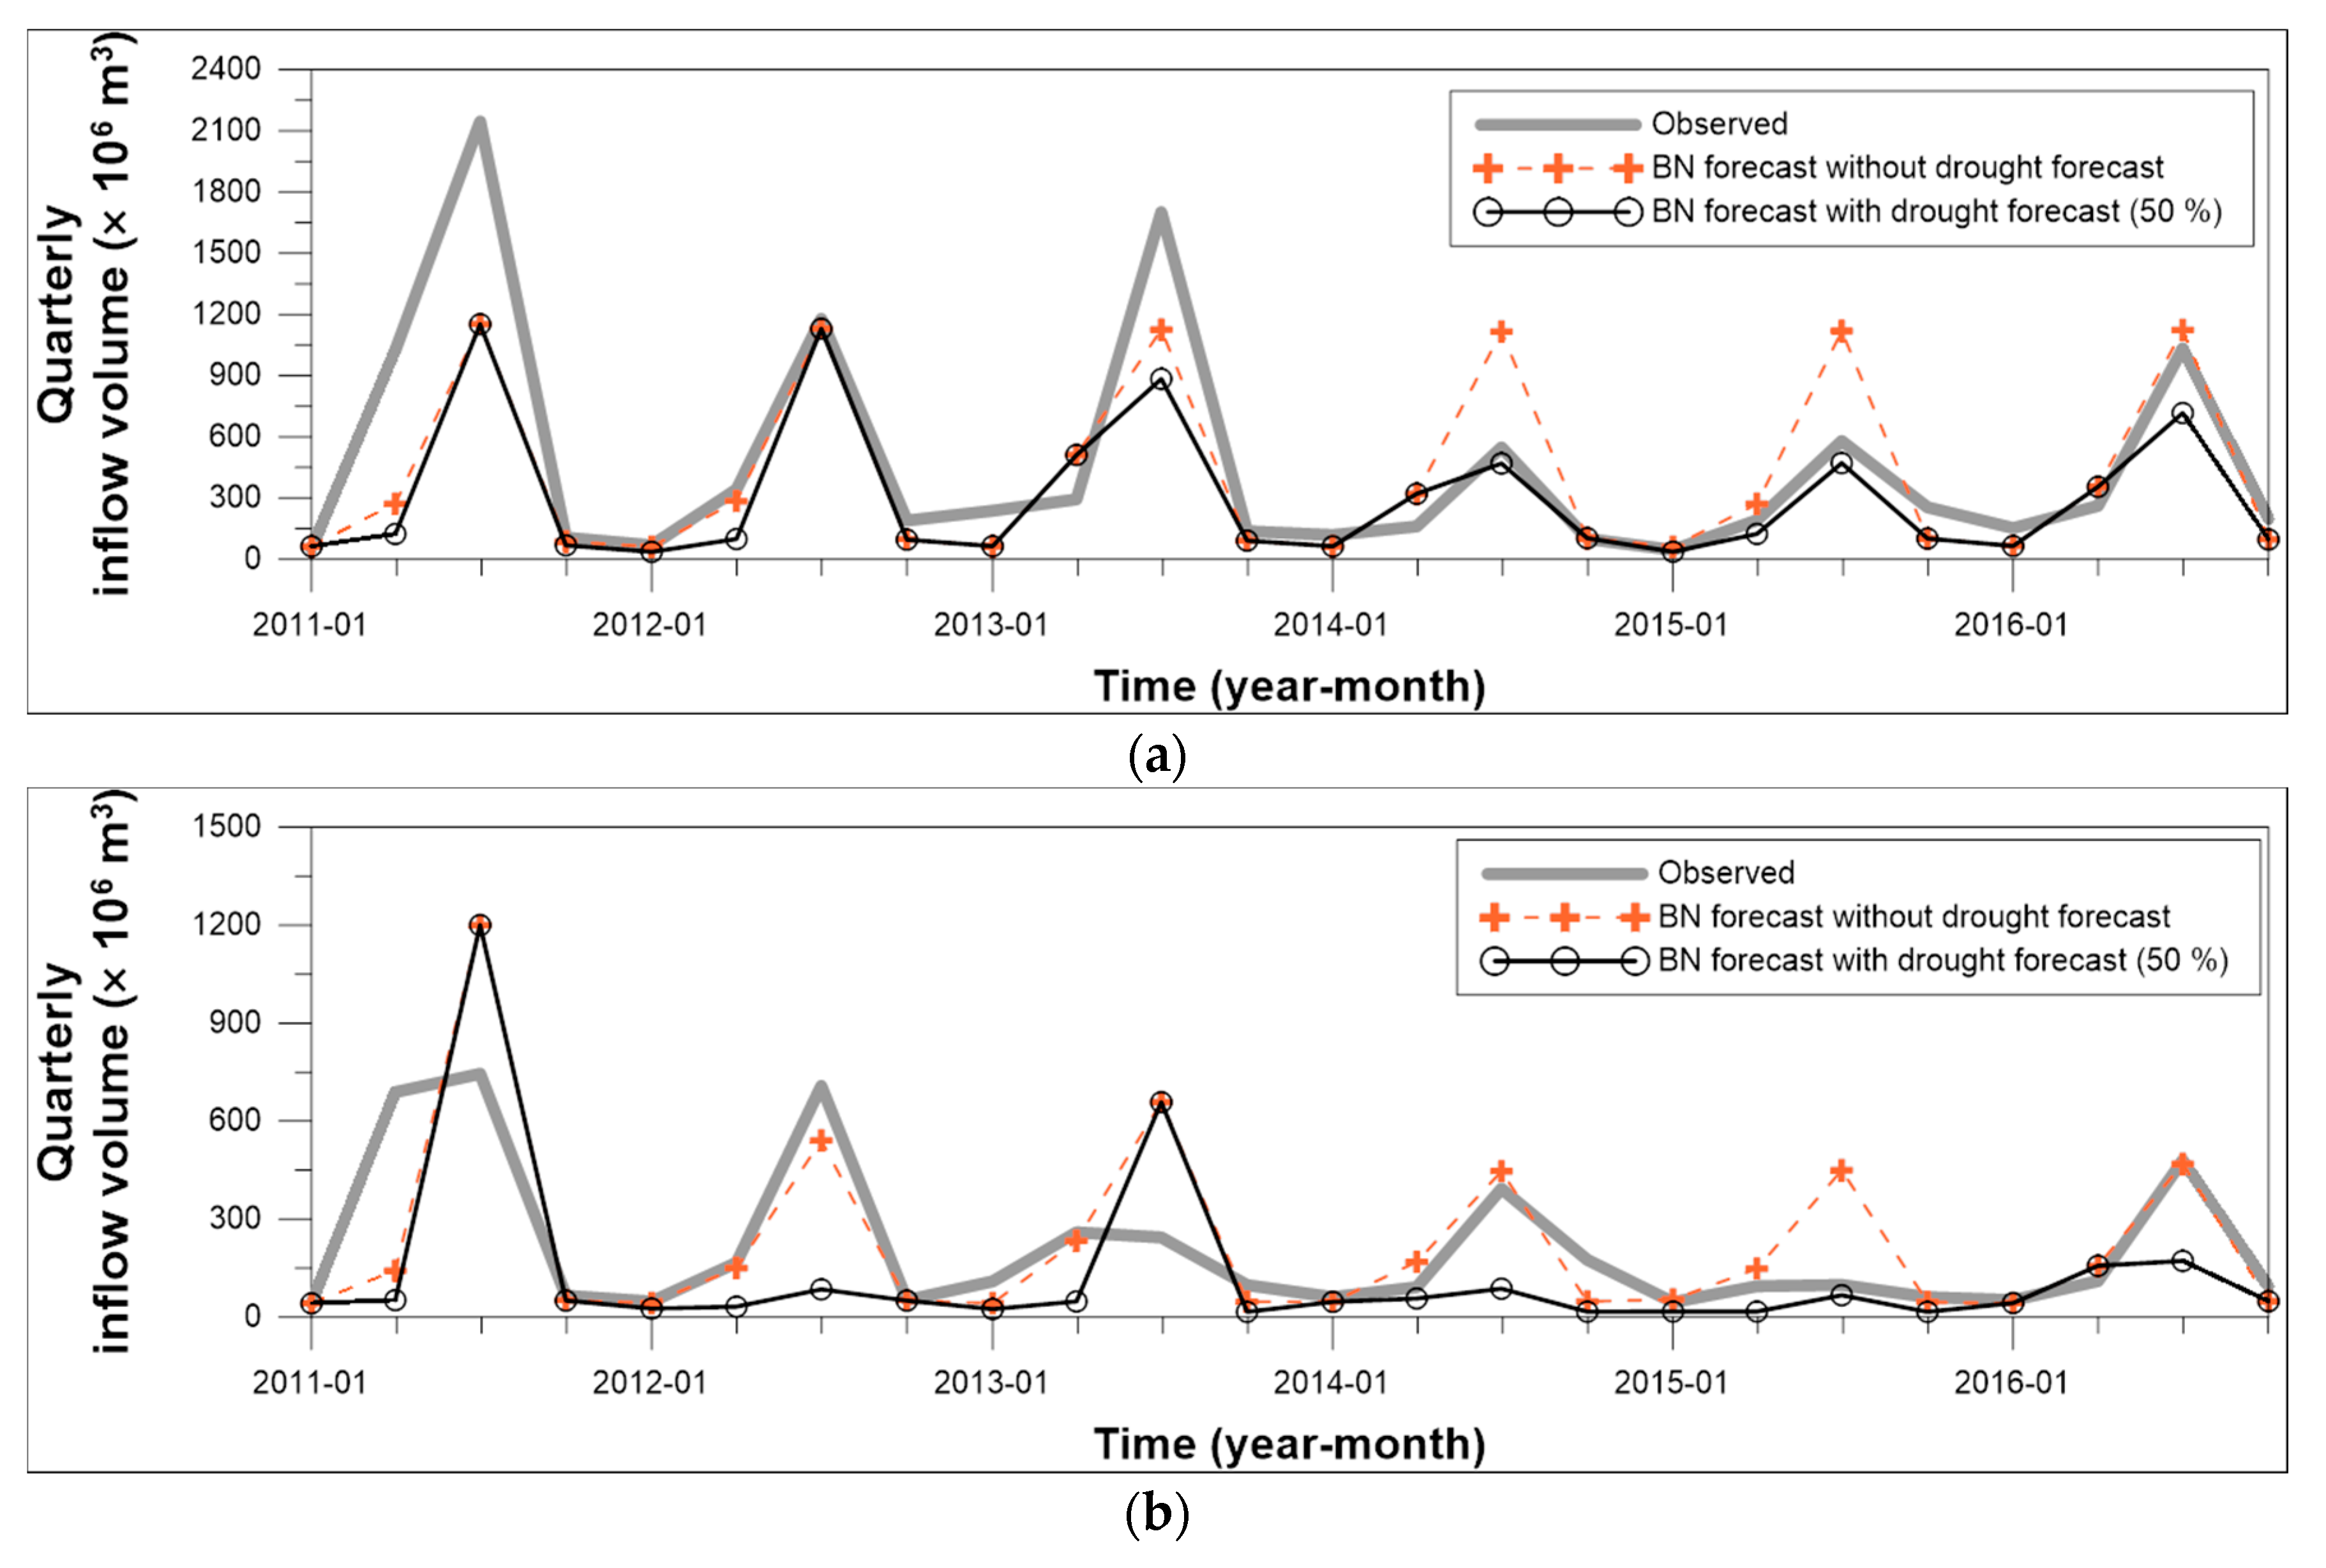
The results of quarterly inflow forecasting without or with drought forecasting under a threshold probability of drought occurrence of 50% are shown in Figure 13 and Table 5 and Table 6. In the absence of drought forecasts, the estimates of the quarterly inflow for the third quarter in 2014 and 2015 were excessive when the Soyanggang dam area experienced droughts (Figure 13a). So were those in 2013 and 2015 of the Andong dam (Figure 13b). On the other hand, the solid lines of the circular symbols in Figure 13 show the forecast results of the quarterly inflow, combined with drought forecasts with a 50% threshold probability of drought occurrence. In the case of the Soyanggang dam, the forecast inflow of the third quarter, combined with drought forecast, showed an absolute error of 14.2% in 2014 and 18.6% in 2015 (Table 5). Those results reasonably match the extreme drought records. This is because, in both years, the drought occurrence was forecasted in the third quarter due to the effect of a D3 drought in the previous quarter, and the quarterly inflow forecasting curve corresponding to D4 was used to predict the third quarter inflow. In the case of the Andong dam, the forecast inflow of the third quarter, combined with drought forecast, showed an absolute error of 32.1% in 2015 (Table 6), which reasonably matches the extreme drought record. The quarterly inflow forecast for the third quarter 2013, having experienced a moderate drought in reality, however, was still excessive due to the limitations of drought forecasting previously mentioned in Section 3.2. Furthermore, there was a tendency to forecast small amounts of inflows for many quarters. We believe that the forecast showed this tendency because the threshold probability of drought occurrence was set at 50% and the correlation coefficient between the second and third quarter inflows were high. In the case of the Andong dam, the correlation coefficient between the second and third quarter inflows was high, so the third quarter forecast inflow changed proportionally to the second quarter inflow. This characteristic had an effect on the correlation coefficient of the SII as well, and, even though the second quarter SII is slightly smaller than zero, the probability of drought occurrence in the third quarter was calculated to be large. That is, in the case of the Andong dam, setting the threshold probability of drought occurrence at 50% means that frequent drought forecasts can occur. In actuality, during the 40 years for which Andong dam inflow data exists, there have been 67 quarters where the actual drought index was below zero out of a total of 160 quarters. When the threshold probability of drought occurrence was set at 50% in the drought forecasting, the number of times a drought was forecast for all quarters was 82, which is 15 more than the actual number of times droughts occurred.
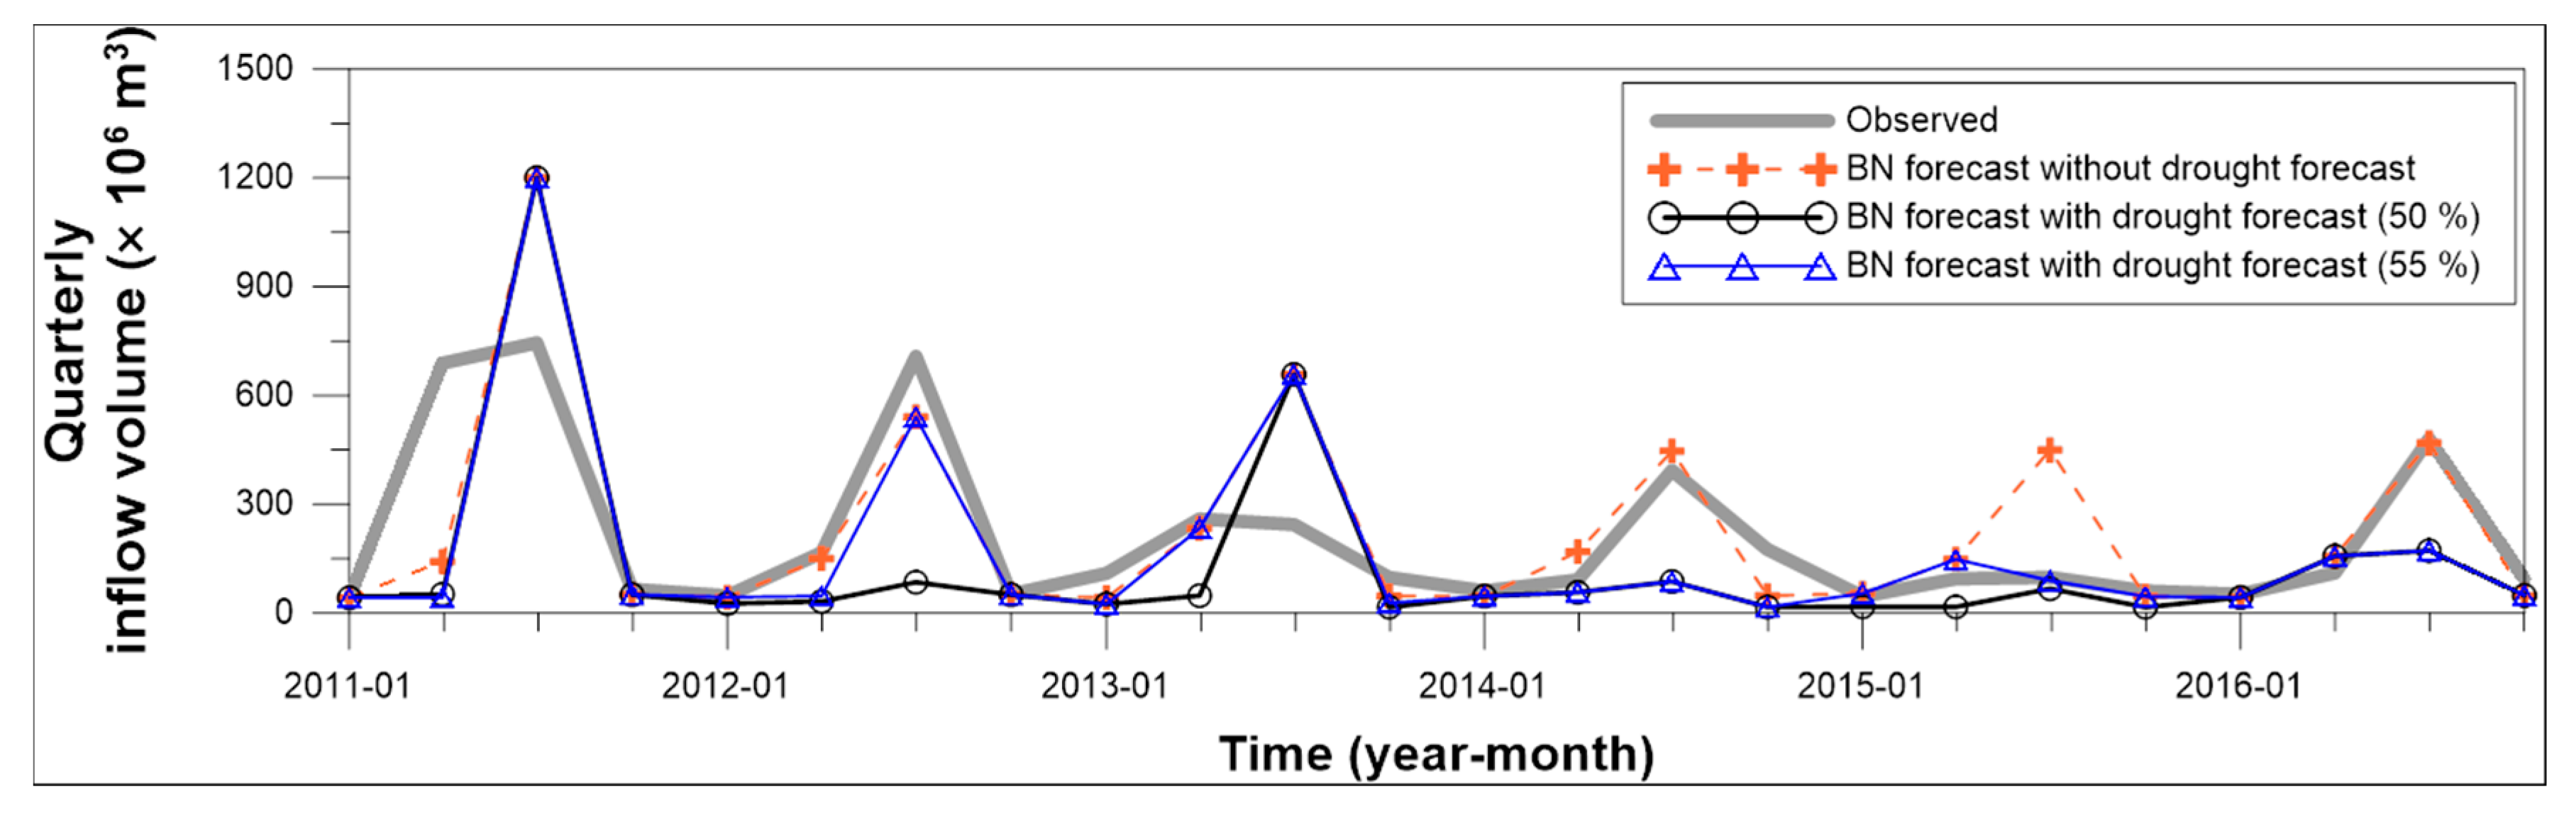
The solid line of triangular symbols in Figure 14 shows the results when the threshold probability of drought occurrence is increased to 55% in the case of the Andong dam to improve the tendency to forecast small amounts of inflows for many quarters. The quarterly inflow forecasts were surely larger and produced smaller absolute errors for the third quarter in 2012 and the second quarters in 2013 and 2015. The absolute error of the inflow forecast for the third quarter of 2015, when an extreme drought occurred, was further reduced to 9.4% (Table 6). The forecast inflows of the third quarter in 2014 and 2016 were smaller than the observed values. If, in such a case, the actual quarterly inflow increases, the drought response measures are withdrawn and water supply is normally carried out, resulting in very little damage to the water user.
4. Conclusions
In this study, we used a copula-based Bayesian network combined with drought forecasting to forecast the quarterly inflows of multipurpose dams. The study's target dams were the Soyanggang dam and the Andong dam, and 2011–2016 quarterly inflow data was used to evaluate the accuracy of the forecast results. The calendar year was divided into four quarters: the first quarter is from January to March; the second from April to June; the third from July to September; the fourth from October to December. After the probability distribution of quarterly inflow was determined, a lognormal distribution was found to be the best fit to the quarterly inflow volumes of the Andong dam, except for those of the third quarter. In the case of the Soyanggang dam, the correlation coefficient of inflows between two successive quarters was very small with the exception of the first-second quarters. In the case of the Andong dam, the correlation coefficients of inflows for the first-second quarters and the second-third quarters were large, but the correlation coefficients of inflows for the other two quarters were calculated to be small. We used the copula-based Bayesian network to determine the quarterly inflow forecasting curves conforming to drought stages, and we then used the standardized inflow index (SII) to forecast quarterly droughts. In the drought forecasts, we calculated the probability distribution of the SII for a quarter based on the previous quarter’s SII, found the non-exceedance probability of the drought index being less than or equal to zero, and compared it to the threshold probability of drought occurrence.
We drew the following conclusions from the study results. The results of quarterly inflow forecasting by a Bayesian network without drought forecasting are unsuitable for future inflow predictions for operating a dam. If drought forecasting is not used, then the inflow of the next quarter is simply the value with the largest probability density function out of the next-quarter probability inflows based on the previous quarter. Because of this characteristic, the inflow forecast results were very poor when droughts occurred at the two dams.
When drought forecasting is used, there is a need to vary the threshold probability of drought occurrence according to the hydrologic characteristics of the dam. We believe that the reason the proper threshold probability of drought occurrence is different for each dam is that the correlation coefficients of inflows between successive quarters are different for the two dams. According to the results of this study, the threshold probability of drought occurrence must be slightly larger than 50% for dams with a large correlation coefficient of inflows between successive quarters, and the threshold probability of drought occurrence does not need to be made large for dams with a small correlation coefficient of inflows between successive quarters.
Under the above limitations, reasonable estimates of drought inflow to a reservoir may be forecasted by combining the drought forecasting with the probabilistic forecasting of quarterly inflow using a copula-based Bayesian network.
In the future, one can apply the techniques used in this study to other dams, and proper threshold probabilities of drought occurrence according to the dams’ hydrological characteristics might be screened. We can also consider methods for finding a threshold probability of drought occurrence that minimizes the absolute error using an optimization technique. Finally, if weather forecasts are reliable, they can be used in drought forecasting.
Acknowledgments
This research was supported by the Basic Science Research Program through the National Research Foundation of Korea (NRF) funded by the Ministry of Science, ICT & Future Planning (NRF−2017R1A2B2003715). This work was also supported by the Korea Agency of Infrastructure Technology Advancement (KAIA) grant funded by the Ministry of Land, Infrastructure and Transport (Grant 18AWMP-B083066-05).
Author Contributions
Youngkyu Jin and Sangho Lee conceived the study methods; Kwanghoon Kim performed the numerical calculations of the study contents; Kwanghoon Kim and Sangho Lee analyzed the study results and wrote the paper.
Conflicts of Interest
The authors declare no conflict of interest.
References
- Jeong, D.I.; Kim, Y.O. Forecasting monthly inflow to Chungju dam using ensemble streamflow prediction. KSCE J. Civ. Eng. 2002, 22, 321–331. [Google Scholar]
- Croley, T.E. Using Meteorology Probability Forecasts in Operational Hydrology; ASCE Press: Reston, VA, USA, 2000; ISBN 978-0-7844-0459-1. [Google Scholar]
- Croley, T.E. Climate-biased storm-frequency estimation. J. Hydrol. Eng. 2001, 6, 275–283. [Google Scholar] [CrossRef]
- Stedinger, J.R.; Kim, Y.O. Updating ensemble probabilities based on climate forecasts. In Proceedings of the Conference on Water Resources Planning and Management and Symposium on Managing the Extremes Floods and Drought, Roanoke, VA, USA, 19–22 May 2002. [Google Scholar]
- Jeong, D.I.; Kim, Y.O.; Cho, S.Z.; Shin, H.J. A study on rainfall-runoff models for improving ensemble streamflow prediction—I. Rainfall-runoff models using artificial neural networks. KSCE J. Civ. Eng. 2002, 23, 521–530. [Google Scholar]
- Jee, Y.G.; Kim, S.J.; Kim, P.S. Forecasting monthly inflow for the storage management of small dams. In Proceedings of the Korea Water Resources Association Conference, Iksan, Korea, 11–16 September 2005. [Google Scholar]
- Jin, Y. Reservoir Operations Applying a Discrete Hedging Rule with Ensemble Streamflow Prediction to Cope with Droughts. Master’s Thesis, Pukyong National University, Busan, Korea, February 2016. [Google Scholar]
- Pearl, J. Fusion, propagation, and structuring in Belief networks. J. Artif. Intell. Res. 1986, 29, 241–288. [Google Scholar] [CrossRef]
- Jensen, F. Introduction to Bayesian Networks; Springer: Secaucus, NJ, USA, 1996; ISBN 0387915028. [Google Scholar]
- Reckhow, K.H. Water quality prediction and probability networks models. Can. J. Fish. Aquat. Sci. 1999, 56, 1150–1158. [Google Scholar] [CrossRef]
- Borsuk, M.E.; Stow, C.A.; Reckhow, K.H. Integrated approach to total maximum daily load development for the Neuse River estuary using a Bayesian probability network model (Neu-BERN). J. Water Res. Plan. Manag. 2003, 129, 271–282. [Google Scholar] [CrossRef]
- Bromley, J.; Jackson, N.A.; Clymer, O.J.; Giacomello, A.M.; Jensen, F.V. The use of Hugin® to develop Bayesian networks as an aid to integrated water resource planning. Environ. Model. Softw. 2005, 20, 231–242. [Google Scholar] [CrossRef]
- Castelletti, A.; Soncini-Sessa, R. Bayesian networks in water resource modelling and management. Environ. Model. Softw. 2007, 22, 1073–1074. [Google Scholar] [CrossRef]
- Ticehurst, J.L.; Newham, L.T.H.; Rissik, D.; Letcher, R.A.; Jakeman, A.J. A Bayesian network approach for assessing the sustainability of coastal lakes in New South Wales, Australia. Environ. Model. Softw. 2007, 22, 1129–1139. [Google Scholar] [CrossRef]
- Barton, D.N.; Saloranta, T.; Moe, S.J.; Eggestad, H.O.; Kuikka, S. Bayesian belief networks as a meta-modelling tool in integrated river basin management-Pros and cons in evaluation nutrient abatement decisions under uncertainty in a Norwegian river basin. Ecol. Econ. 2008, 66, 91–104. [Google Scholar] [CrossRef]
- Henriksen, H.J.; Barlebo, H.C. Reflections on the use of Bayesian belief networks for adaptive management. J. Environ. Manag. 2008, 88, 1025–1036. [Google Scholar] [CrossRef] [PubMed]
- Elidan, G. Copula Bayesian networks. In Proceedings of the Conference on Neural Information Processing Systems, Vancouver, BC, Canada, 6–9 December 2010. [Google Scholar]
- Fevre, A.C.; Adlouni, S.E.; Perreault, L.; Thiémonge, N.; Bobée, B. Multivariate hydrological frequency analysis using copulas. Water Resour. Res. 2004, 40, W01101. [Google Scholar] [CrossRef]
- De Michele, C.; Salvadori, G.; Canossi, M.; Petaccia, A.; Rosso, R. Bivariate statistical approach to check adequacy of dam spillway. J. Hydrol. Eng. 2005, 10, 50–57. [Google Scholar] [CrossRef]
- Zhang, L.; Singh, V.P. Gumbel-Hougaard copula for trivariate rainfall frequency analysis. J. Hydrol. Eng. 2007, 12, 409–419. [Google Scholar] [CrossRef]
- Gebremichael, M.; Krajewski, W.F. Application of copulas to modeling temporal sampling errors in statelite-derived rainfall estimates. J. Hydrol. Eng. 2007, 12, 404–408. [Google Scholar] [CrossRef]
- Wong, G.; Lambert, M.F.; Leonard, M.; Metcalfe, A.V. Drought analysis using trivariate copulas conditional on climatic states. J. Hydrol. Eng. 2010, 15, 129–141. [Google Scholar] [CrossRef]
- Madadgar, S.; Moradkhani, H. Drought analysis under climate change using copula. J. Hydrol. Eng. 2013, 18, 746–759. [Google Scholar] [CrossRef]
- Shin, J.Y.; Ajmal, M.; Yoo, J.Y.; Kim, T.W. A Bayesian network-based probabilistic framework for drought forecasting and outlook. Adv. Meteorol. 2016, 2016. [Google Scholar] [CrossRef]
- Madadgar, S.; Moradkhani, H. A Bayesian framework for probabilistic seasonal drought forecasting. J. Hydrometeorol. 2013, 14, 1685–1705. [Google Scholar] [CrossRef]
- Russel, S.J.; Peter, N. Artificial Intelligence: A Modern Approach, 3rd ed.; Prentice Hall: Upper Saddle River, NJ, USA, 2009; ISBN 978-0136042594. [Google Scholar]
- Yoo, J.Y.; Shin, J.Y.; Kim, D.; Kim, T.W. Drought risk analysis using stochastic rainfall generation model and copula functions. J. Korea Water Resour. Assoc. 2013, 46, 425–437. [Google Scholar] [CrossRef]
- Zezula, I. On multivariate Gaussian copula. J. Stat. Plan. 2009, 139, 3942–3946. [Google Scholar] [CrossRef]
- Shukla, S.; Wood, A.W. Use of standardized runoff index for characterizing hydrological drought. Geophys. Res. Lett. 2008, 35, L02405. [Google Scholar] [CrossRef]
- Nalbantis, I.; Tsakiris, G. Assessment of hydrological drought revisited. Water Resour. Manag. 2008, 23, 881–897. [Google Scholar] [CrossRef]
- Telesca, L.; Lovallo, M.; Lopez-Moreno, I.; Vicente-Serrano, S. Investigation of scaling properties in monthly streamflow and Standardized Streamflow Index (SSI) time series in the Ebro Basin (Spain). Physica A 2012, 391, 1662–1678. [Google Scholar] [CrossRef]
- Gusyev, M.A.; Hasegawa, A.; Magome, J.; Kuribayashi, D.; Sawano, H.; Lee, S. Drought assessment in the Pampanga River basin, the Philippines-Part1: Characterizing a role of dams in historical droughts with standardized indices. In Proceedings of the Conference on Modelling and Simulation, Broadbeach, Australia, 29 November–4 December 2015. [Google Scholar]
- Mckee, T.B.; Doesken, N.J.; Kleist, J. The relationship of drought frequency and duration to time scales. In Proceedings of the 8th Conference on Applied Climatology, American Meteorological Society, Anaheim, CA, USA, 17–22 January 1993. [Google Scholar]
- Son, K.H.; Bae, D.H.; Chung, J.S. Drought analysis and assessment by using land surface model on South Korea. J. Korea Water Resour. Assoc. 2011, 44, 667–681. [Google Scholar] [CrossRef]
- Massey, F.J. The Kolmogorov-Smirnov test for goodness of fit. J. Am. Stat. Assoc. 1951, 46, 68–78. [Google Scholar] [CrossRef]
- Hasegawa, A.; Gusyev, M.; Iwami, Y. Meteorological drought and flood assessment using the comparative SPI approach in Asia under climate change. J. Disas. Res. 2016, 11, 1082–1090. [Google Scholar] [CrossRef]
- Abramowitz, M.; Stegun, I.A. Handbook of Mathematical Function with Formulas, Graphs, and Mathematical Tables; U.S. Department of Commerce: Washington, DC, USA, 1964; ISBN 9781591242178.
Figure 1.
An example of probability density function of the third quarter inflow conditioned on the second quarter inflow of 100 × 106 m3.
Figure 1.
An example of probability density function of the third quarter inflow conditioned on the second quarter inflow of 100 × 106 m3.

Figure 2.
Probability density function of the third quarter SII conditioned on the second quarter SII of −1.
Figure 2.
Probability density function of the third quarter SII conditioned on the second quarter SII of −1.

Figure 3.
Example of estimating representative quarterly inflows corresponding to lower bounds of SII ranges of drought stages.
Figure 3.
Example of estimating representative quarterly inflows corresponding to lower bounds of SII ranges of drought stages.

Figure 4.
Locations of the Soyanggang and Andong dams. (a) Soyanggang dam region; (b) The Republic of Korea; (c) Andong dam region.
Figure 4.
Locations of the Soyanggang and Andong dams. (a) Soyanggang dam region; (b) The Republic of Korea; (c) Andong dam region.

Figure 5.
Monthly water supply planning of two dams: (a) Soyanggang dam; (b) Andong dam.

Figure 6.
Quarterly operational records of dams: (a) Soyanggang dam; (b) Andong dam.

Figure 7.
Histogram against the five distributions of the quarterly inflow volumes of the Soyanggang dam during the training period of 1974–2010: (a) first quarter; (b) second quarter; (c) third quarter; (d) fourth quarter.
Figure 7.
Histogram against the five distributions of the quarterly inflow volumes of the Soyanggang dam during the training period of 1974–2010: (a) first quarter; (b) second quarter; (c) third quarter; (d) fourth quarter.

Figure 8.
Histogram against the five distributions of the quarterly inflow volumes of the Andong dam during the training period of 1977–2010: (a) first quarter; (b) second quarter; (c) third quarter; (d) fourth quarter.
Figure 8.
Histogram against the five distributions of the quarterly inflow volumes of the Andong dam during the training period of 1977–2010: (a) first quarter; (b) second quarter; (c) third quarter; (d) fourth quarter.

Figure 9.
Quarterly inflow forecasting curves conforming to drought stages for the Soyanggang dam: (a) first quarter; (b) second quarter; (c) third quarter; (d) fourth quarter.
Figure 9.
Quarterly inflow forecasting curves conforming to drought stages for the Soyanggang dam: (a) first quarter; (b) second quarter; (c) third quarter; (d) fourth quarter.

Figure 10.
Quarterly inflow forecasting curves conforming to drought stages for the Andong dam: (a) first quarter; (b) second quarter; (c) third quarter; and (d) fourth quarter.
Figure 10.
Quarterly inflow forecasting curves conforming to drought stages for the Andong dam: (a) first quarter; (b) second quarter; (c) third quarter; and (d) fourth quarter.

Figure 11.
Quarterly SII: (a) Soyanggang dam; (b) Andong dam.

Figure 12.
The results of quarterly drought forecast: (a) Soyanggang dam; (b) Andong dam.


Figure 13.
The results of quarterly inflow forecasting without or with drought forecast under the threshold probability of drought occurrence to 50%: (a) Soyanggang dam; (b) Andong dam.
Figure 13.
The results of quarterly inflow forecasting without or with drought forecast under the threshold probability of drought occurrence to 50%: (a) Soyanggang dam; (b) Andong dam.

Figure 14.
The results of quarterly inflow forecasting without or with drought forecast under the threshold probability of drought occurrence ranging 50–55% for the Andong dam.
Figure 14.
The results of quarterly inflow forecasting without or with drought forecast under the threshold probability of drought occurrence ranging 50–55% for the Andong dam.


Table 1.
Classification of drought severity by the range of standardized inflow index (SII).
| SII Range | Drought Category |
|---|---|
| 2.00 ≤ SII | Extreme wet |
| 1.50 ≤ SII < 2.00 | Very wet |
| 1.00 ≤ SII < 1.50 | Moderately wet |
| 0.00 ≤ SII < 1.00 | Near normal |
| −1.00 ≤ SII < 0.00 | Mild drought (D1) |
| −1.50 ≤ SII < −1.00 | Moderate drought (D2) |
| −2.00 ≤ SII < −1.50 | Severe drought (D3) |
| SII < −2.00 | Extreme drought (D4) |
Table 2.
Project data of two dams.
| Engineering Data | Soyanggang Dam | Andong Dam |
|---|---|---|
| Basin area (km2) | 2703 | 1584 |
| Year completed | 1973 | 1976 |
| Total storage capacity (× 106 m3) | 2900 | 1248 |
| Average yearly inflow (× 106 m3) | 1750 | 940 |
| Yearly water supply (× 106 m3) | 1213 | 926 |
| industrial water | 1200 | 450 |
| agricultural water | 13 | 300 |
| instream flow | - | 176 |
Table 3.
The value of the K–S test.
| Dam | Distribution | Quarter | Threshold Value | |||
|---|---|---|---|---|---|---|
| First | Second | Third | Fourth | |||
| Soyanggang | Lognormal | 0.0724 | 0.0636 | 0.0898 | 0.1242 | 0.219 |
| Gamma | 0.1062 | 0.0898 | 0.1110 | 0.1583 | ||
| Gumbel | 0.2189 | 0.2029 | 0.1534 | 0.2334 | ||
| Weibull | 0.1169 | 0.1127 | 0.1261 | 0.1601 | ||
| Gaussian | 0.1691 | 0.1570 | 0.1438 | 0.2082 | ||
| Andong | Lognormal | 0.0915 | 0.1001 | 0.1057 | 0.0813 | 0.232 |
| Gamma | 0.1267 | 0.1123 | 0.0771 | 0.1072 | ||
| Gumbel | 0.2457 | 0.1930 | 0.1288 | 0.2396 | ||
| Weibull | 0.1394 | 0.1038 | 0.0736 | 0.1380 | ||
| Gaussian | 0.1871 | 0.1205 | 0.0932 | 0.1713 | ||
Table 4.
The correlation coefficient of each quarter’s inflow to that of prior quarter.
| Dam | First and Second Quarters | Second and Third Quarters | Third and Fourth Quarters | Fourth and First Quarters |
|---|---|---|---|---|
| Soyanggang | 0.4781 | 0.0543 | –0.1770 | 0.0739 |
| Andong | 0.3767 | 0.4828 | 0.1281 | 0.1831 |
Table 5.
Quarterly inflow forecasting errors for the Soyanggang dam.
| Cases | Absolute Error for the Third Quarter 2014 (%) | Absolute Error for the Third Quarter 2015 (%) | Range of Absolute Error for the Third Quarter (%) | Range of Absolute Error for All Quarters (%) |
|---|---|---|---|---|
| BN forecast without drought forecast | 103.6 | 93.3 | 4.1–103.6 | 3.2–103.6 |
| BN forecast with drought forecast by 50% criteria | 14.2 | 18.6 | 4.1–48.0 | 3.2–100.1 |
Table 6.
Quarterly inflow forecasting errors for the Andong Dam.
| Cases | Absolute Error for the Third Quarter 2013 (%) | Absolute Error for the Third Quarter 2015 (%) | Range of Absolute Error for the Third Quarter (%) | Range of Absolute Error for All Quarters (%) |
|---|---|---|---|---|
| BN forecast without drought forecast | 169.7 | 355.6 | 2.2–355.6 | 1.2–355.6 |
| BN forecast with drought forecast by 50% criteria | 169.7 | 32.1 | 32.1–169.7 | 1.2–169.7 |
| BN forecast with drought forecast by 55% criteria | 169.7 | 9.4 | 9.4–169.7 | 1.2–169.7 |
© 2018 by the authors. Licensee MDPI, Basel, Switzerland. This article is an open access article distributed under the terms and conditions of the Creative Commons Attribution (CC BY) license (http://creativecommons.org/licenses/by/4.0/).
Share and Cite
MDPI and ACS Style
Kim, K.; Lee, S.; Jin, Y. Forecasting Quarterly Inflow to Reservoirs Combining a Copula-Based Bayesian Network Method with Drought Forecasting. Water 2018, 10, 233. https://doi.org/10.3390/w10020233
AMA Style
Kim K, Lee S, Jin Y. Forecasting Quarterly Inflow to Reservoirs Combining a Copula-Based Bayesian Network Method with Drought Forecasting. Water. 2018; 10(2):233. https://doi.org/10.3390/w10020233
Chicago/Turabian StyleKim, Kwanghoon, Sangho Lee, and Youngkyu Jin. 2018. "Forecasting Quarterly Inflow to Reservoirs Combining a Copula-Based Bayesian Network Method with Drought Forecasting" Water 10, no. 2: 233. https://doi.org/10.3390/w10020233
Note that from the first issue of 2016, this journal uses article numbers instead of page numbers. See further details here.