Degradation of 4-Chlorophenol by Microwave-Enhanced Advanced Oxidation Processes: Kinetics and Influential Process Parameters


1
Process and Environmental Technology Lab, Department of Chemical Engineering, KU Leuven, J. De Nayerlaan 5, B-2860 Sint-Katelijne-Waver, Belgium
2
InOpSys NV, Zandvoortstraat 12A, B-2800 Mechelen, Belgium
*
Author to whom correspondence should be addressed.
Water 2018, 10(3), 247; https://doi.org/10.3390/w10030247
Submission received: 16 January 2018
/
Revised: 14 February 2018
/
Accepted: 21 February 2018
/
Published: 28 February 2018
Abstract
:In this study, the degradation of 4-chlorophenol (4-CP) is investigated by using a combination of microwave (MW) irradiation and hydrogen peroxide as oxidant (the MW–H2O2-process). The influence of the critical parameters on the efficiency of the process is examined by applying Partial Least Square Regression (PLS) on a Design of Experiments (DOE). Also, a kinetic evaluation of the process is carried out. Results showed that the MW–H2O2-process is effective in the degradation of 4-CP. The most influential parameter of the MW–H2O2-process is the reaction temperature. Besides this parameter, the reaction time, initial 4-CP concentration, and initial hydrogen peroxide concentration have a (minor) influence on the 4-CP degradation. A maximum degradation efficiency within the levels of the DOE (remaining percentage of 4-CP of 34%) was achieved with an initial 4-CP concentration of 1000 mg/L, an initial H2O2 concentration of 11 g/L, reaction temperature of 180 °C, and reaction time of 20 min. The process follows pseudo first order reaction kinetics.
1. Introduction
The environmental standards for pollutants in wastewater are becoming increasingly stringent. Non- or poorly biodegradable pollutants such as chlorophenols are frequently encountered in different types of industrial wastewater, with some of them also having toxic effects on the microorganisms of a biological wastewater treatment plant. Chlorophenols are widely used as disinfecting agents or preservatives in wood, paint, plant fibers, and leather [1]. They are especially known for their bactericidal properties, adverse effects on plant growth, and tendency to bioaccumulate in organisms [2].
Conventional techniques to remove chlorophenols from wastewater are biological, thermal and (physico)chemical treatments [3]. One specific group of techniques to remove these pollutants in wastewater are Advanced Oxidation Processes (AOPs). In these processes, hydroxyl radicals (*OH) are generated in situ, and are responsible for the oxidation and mineralization of the organic pollutants. Some examples of AOPs are Fenton, UV-, and ozone-based oxidation [2]. In these processes, the combination of hydrogen peroxide with iron salts, UV irradiation, and ozone, respectively, is used to produce these hydroxyl radicals.
In the MW–H2O2-process, hydrogen peroxide (H2O2) is decomposed into hydroxyl radicals (*OH) with the use of microwave (MW) irradiation. Equations (1)–(5) show the possible occurring reactions. Equation (1) shows the decomposition of H2O2 into *OH. When the MW power is too high, the unwanted side reaction shown in Equation (2) occurs, resulting in the decomposition of H2O2 into water and oxygen. Additionally, the formed *OH can also undergo other side reactions (Equations (3)–(5)), wherein *OH are consumed undesirably. When H2O2 is present in high concentration, it can react with *OH (Equation (3)), resulting in the formation of the HO2-radical. Consecutively, the formation of this HO2-radical can lead to the reactions shown in Equations (4) and (5). Hence, Equations (3)–(5) show that an excess of H2O2 can be disadvantageous for the MW–H2O2-process [4,5].
The produced *OH have a high standard electrode potential (2.8 V), making them ideal oxidants for the oxidation of most organic pollutants into CO2 and water. The oxidation of pollutants with *OH mainly happens in three different ways: (i) addition; (ii) hydrogen abstraction, and (iii) electron transfer [6]. Substituted aromatics, such as 4-CP, usually undergo addition reactions to the aromatic ring structure or reaction with the ring substituents [6]. Zhao et al. [7] proposed the degradation mechanism of 4-CP in a microwave-enhanced catalytic H2O2 oxidation process. The degradation products were proposed to be formed after the attack of *OH on 4-CP, resulting in a direct, ring-opening reaction. Most of the degradation products formed were short chain organic acids such as maleic and oxalic acid. A smaller quantity of 4-CP was dechlorinated first (with the formation of hydroquinone, quinine, and catechol as a result) and then converted into short organic acids.
In general, microwave-enhanced AOP’s are seen as a promising technique for the removal of environmental pollutants [8,9]. Wong et al. [10] investigated the efficiency of the process as secondary sludge treatment on sewage sludge and discovered that the MW–H2O2-process had the potential to attain 100% chemical oxygen demand (COD) solubilization. Likewise, Xiao et al. [11] studied the process as a sludge pretreatment method. The oxidation of nonylphenol in wastewater sludge by the MW–H2O2-process combined with nitric acid was studied by Chang et al. [12]. They discovered that a full degradation of nonylphenol could be achieved. The benefits of combining microwave irradiation with conventional AOPs for the removal of specific contaminants were studied by Zhihui et al. [3]. They found that the degradation of 4-CP could be greatly enhanced. Prasannakumar et al. [13] investigated the degradation of phenol using the MW–H2O2-process. They optimized the degradation efficiency of phenol by adjusting the initial phenol concentration, the microwave power input, and the irradiation time. The process was confirmed to be of pseudo first order. In a study by Klán & Vavrik [14], the degradation of five aromatic substances (phenol, chlorobenzene, nitrobenzene, 4-chlorophenol, and pentachlorophenol) by the MW–H2O2-process was investigated. Here, kinetic data showed a pseudo first order reaction and the H2O2 concentration was found to be of influence: increasing the H2O2 concentration 200 times resulted in an increase in reaction rate constant by a factor of 55.
Often, microwave-assisted experiments are conducted in (modified) domestic microwave ovens, as is for example the case in previously discussed research [12,14]. The use of this type of microwave oven has significant drawbacks such as non-homogeneous MW generation, unstable MW power generation, and the unability of properly controlling temperature and pressure in the reaction vessel [9]. In this study, an industrial monomode microwave system is used so these drawbacks are overcome. The degradation of 4-CP by the MW–H2O2-process is investigated in a more controlled manner than is the case in previous publications. Apart from its industrial relevance, 4-CP is frequently used a as a model compound in AOP research. Furthermore, it is a representative for chlorophenols in general and has bactericidal and toxic properties. First, a kinetic evaluation is carried out to obtain insight in the degradation process; Secondly, by using Principal Component Analysis (PCA) and Partial Least Squares Regression (PLS), the influence of different process parameters on the degradation efficiency of 4-CP is examined and a linear model is developed to predict the degradation process. To our knowledge, this is the first paper using this statistical method for determining the influential parameters of this process.
2. Materials and Methods
2.1. Chemicals
H2O2 (30% v/v), 4-chlorophenol (molar mass = 128.56 g/mol, solubility = 27 g/L, melting point = 42.8 °C, boiling point = 220 °C), and sodium sulfite were purchased from VWR International (Leuven, Belgium). Potassium titanium oxide oxalate dihydrate for the determination of the residual H2O2 concentration was purchased from Sigma-Aldrich (Steinheim, Germany). All solutions were made in Milli-Q water.
2.2. Experimental Set-Up
2.2.1. Microwave Reactor System
All experiments were carried out in a microwave reactor system (Monowave 300, Anton Paar GmbH, Graz, Austria). This is a closed reactor system so, during experiments, no external sources (such as light) can influence the reaction. Two types of temperature control are available in this system: temperature control with (i) an infrared (IR) temperature sensor and (ii) a ruby temperature sensor. The IR sensor enables temperature control on the outside of the reaction vessel, whereas the ruby temperature sensor can be placed inside the reaction vessel.
For every experiment, a heating profile could be specified. This heating profile can be divided in three steps: (i) heating the reaction vessel to the reaction temperature; (ii) holding this reaction temperature for a specified reaction time, and (iii) cooling the reaction vessel. The system enables two different ways for the heating of the reaction vessel to the desired reaction temperature: reaching the user specified temperature (i) as fast as possible (depending on the user defined maximal power output), and (ii) in a user-specified time. In all experiments, the maximum power output was set at 400 W to avoid rapid pressure increase. After reaching the desired temperature, the reaction time could be specified. Hereafter, the reaction vessel was cooled to 60 °C and placed in an ice bath to quench further reactions. The reaction mixture was continuously stirred at 1200 rpm. The microwave reactor system has two types of reaction vessels available: borosilicate glass vessels of 10 and 30 mL.
2.2.2. Kinetic Evaluation
For the kinetic experiments, borosilicate vessels of 10 mL were used. Temperature control was done with a ruby thermometer and for the heating rate of the reaction vessel, the respective temperatures were set to be reached in 5 min.
In a typical experiment, the reaction vessel was filled with 5 mL of a 5000 mg/L 4-CP solution and H2O2 (30%) was added to obtain a concentration of 11 g/L. This vessel was placed in the microwave reactor system and heated to the specified temperature (120, 150, 165 and 180 °C) in 5 min. This temperature was held for a specified reaction time and hereafter the reaction vessel was cooled to 60 °C. The reaction vessel was then placed in an ice bath to further stop any possible occurring reactions, and residual H2O2 was neutralized by adding 5 mL of a 1.6 M Na2SO3 solution. The residual 4-CP concentration was then measured via HPLC as further specified. The obtained data from this experiment were then used to fit a kinetic model. For every experiment, holding times of 5, 10, 15 and 20 min were chosen. If necessary, other time intervals were added to make sure a sufficient correlation coefficient was obtained.
The kinetic equation of a pseudo first order reaction is described in Equations (6) and (7), the temperature dependency of the reaction rate constant is included by substituting the Arrhenius equation in kobs from Equation (6).
where C4-CP is the 4-chlorophenol concentration, kobs is the observed reaction rate constant, k0 is the pre-exponential factor, Ea is the activation energy and R is the universal gas constant. Derived from Equation (6), it follows that the observed reaction rate constant can be determined by plotting the natural logarithm of (C4-CP/C4-CP,0) as a function of time: the observed reaction rate constant will be equal to the slope of this graph. From Equation (7), the other constants can be determined. This can be done by plotting the found reaction rate constants as a function of the inverse temperature. The slope will then be equal to (−Ea/R), from which Ea can be derived, and the intercept will be equal to ln(k0), from which k0 can easily be derived.
2.2.3. Design of Experiments
To obtain insight in the correlations between the measured output variables, a Design of Experiments (DOE) was developed and analyzed with PCA and PLS. The following input variables were chosen: reaction temperature, reaction time (holding time), initial 4-CP concentration, and initial H2O2 concentration. The chosen input variables, their abbreviations, and respective ranges for the DOE are shown in Table 1. As output variables, the residual 4-CP ratio (ratio of the residual 4-CP concentration to the initial 4-CP concentration), residual COD ratio (ratio of the residual COD to the initial COD), residual H2O2 ratio (ratio of the residual H2O2 concentration to the initial H2O2 concentration), chloride ratio (ratio of the released chloride ion concentration to the highest chloride concentration, i.e., the chloride concentration when all chlorine atoms of 4-CP would be released), and final pH were measured. These variables and their symbols are also described in Table 1. Based on these choices, a fractional factorial design of 27 runs was executed. The left columns of Table 2 display the executed runs with the levels of their input parameters.
A typical experiment was carried out in a reaction vessel of 30 mL. Temperature control was done with an IR thermometer, and for the heating of the reaction vessel, the respective temperatures were set to be reached as fast as possible. In a typical experiment, the reaction vessel was filled with 20 mL of 4-CP solution, and H2O2 (30%) was added to obtain the desired concentrations of the runs. In all experiments, the initial pH was not adjusted and measured to be in the range of 4–6.37, depending on the initial 4-CP and H2O2 concentration. This vessel was placed in the microwave reactor system, heated to the reaction temperature, and held at that temperature for a certain reaction time, as specified in Table 2. Hereafter, the reaction vessel was cooled to 60 °C. The reaction vessel was then placed in an ice bath to further stop any possible occurring reactions, and subsequently, the residual H2O2 concentration, final pH, and COD were measured as further specified. Thereafter, residual H2O2 was neutralized by adding 5 mL of a 1.6 M Na2SO3 solution and the residual 4-CP and chloride concentration were measured. Table 2 displays all the executed runs and the obtained results for every output parameter. In all experiments, relatively high concentrated solutions of 4-CP are used because of two reasons: (i) a high initial concentration of 4-CP enables a more adequate measurement of the 4-CP concentration over time, as well as the possibility of chloride ion measurement (the obtained chloride ion concentration is higher, making detection of this ion easier); and (ii) because MW-AOP is an energy intensive technique, its practical application will mainly be found in highly loaded aqueous streams, such as side streams of chemical production plants, in which these high concentrations can be encountered.
2.3. Analytical Techniques
The 4-CP concentrations were analyzed by HPLC-UV (Agilent 1100, Agilent Technologies, Santa Clara, CA, USA). For the HPLC-UV determination, an Agilent 1100 HPLC system was used, consisting of an Agilent 1100 Quaternary Pump, an Agilent 1100 Autosampler, and an Agilent 1100 VWD-detector. Separation was carried out on a Zorbax Eclipse Plus C18 column with an internal diameter of 4.6 mm, a length of 100 mm, and a particle size of 3.5 μm. The mobile phase consisted of a 40/60 (v/v) water-methanol mixture at a flowrate of 1 mL/min, and 4-CP was detected at a wavelength of 280 nm. The residual H2O2 concentration was measured via the titanium oxalate method [15]. Chemical oxygen demand (COD) was measured using COD test kits of Hach-Lange. Chloride concentration was measured with IC. A Dionex IC System (ICS 1000, Thermo Scientific, Waltham, MA, USA) was used. Separation was carried out on a Dionex Ionpac AS14A analytical column (Thermo Scientific, Waltham, MA, USA) with an internal diameter of 4 mm, length of 250 mm, and a particle size of 7 µm, at 30 °C. The mobile phase consisted of a 0.008 M Na2CO3–0.001 M NaHCO3 mixture at a flow rate of 1 mL/min.
2.4. Principal Component Analysis (PCA) and Partial Least Square Regression (PLS)
To determine the correlations between the investigated parameters of the Design of Experiments, Principal Component Analysis (PCA) was carried out using the free statistical software, of RStudio [16]. PCA is an exploratory statistical technique that is used to reduce multiple correlated parameters to a smaller number of uncorrelated orthogonal variables called ‘principal components’ [17].
Partial least Squares (PLS) regression was used to identify the dependency between the input and output parameters of the process. PLS regression is a statistical method used to find the relationship between two matrices (the input and output matrix, respectively X and Y), through the establishment of a linear model. This model will illustrate the output parameters (1, …, J) as a function of the input parameters (1, …, K) as described in Equation (8) [18].
The free statistical software RStudio was used to carry out PLS. Cross-validation was used to obtain a predictive model. This was done by dividing the dataset in ten segments of equal size. Thereafter, the observations of one segment are used as test set. The other nine segments are used as set to estimate the model parameters and the observations of the test set. This procedure is then applied for all ten segments. The choice of optimal number of latent variables is done automatically by the PLS software, based on the results of the cross-validation [19]. Prior to PCA and PLS analysis, the used data were auto-scaled to have zero mean and unit variance. This way, the magnitude of the original variables do not influence the outcome of the analysis [20,21].
3. Results
3.1. Preliminary Tests
To make sure the observed 4-CP degradation can only be attributed to the MW-enhanced H2O2 process, some preliminary experiments were carried out. First, MW were applied to a reaction mixture containing 1000 mg/L 4-CP and no H2O2 (reaction temperature 180 °C, holding time 20 min). In these experiments, no degradation of 4-CP was observed, indicating that MW alone could not initiate the degradation process. Secondly, the residual 4-CP concentration was monitored in a reaction mixture of 1000 mg/L 4-CP and 11 g/L H2O2 for 20 min at room temperature, without applying MW or other heat sources. Similarly, no degradation of 4-CP was observed.
3.2. Kinetics of the MW–H2O2-Process
The results of the kinetic evaluation are shown in Figure 1. In this figure, the x-axis represents the holding time of the reaction. This means that at a holding time of 0 min, already some degradation can be observed due to heating of the reaction vessel to its reaction temperature. When evaluating the data of the kinetic experiments, a clear linear correlation (R² of 0.9439, 0.9420, 0.9555, and 0.9888 for respectively 120, 150, 165, and 180 °C) between the natural logarithm of the observed relative concentrations and the reaction time is observed. This linear correlation implies a pseudo first order reaction. The observed reaction rate constants and their respective correlation coefficients can be derived from the data shown in Figure 1 (slope of the obtained straight line) and increase from 0.0041 min−1 at 120 °C to 0.0442 min−1 at 180 °C. From this, the assumption can be made that the reaction rate increases with a factor of 10 approximately when the temperature increases with a factor of 1.5. The obtained reaction rate constants are in the range of what was reported in a previous publication, when the difference in process conditions is taken into account. Asgari et al. [22] investigated the kinetics of the degradation of 4-CP by MW–H2O2 at different process conditions (initial 4-CP concentration 100 mg/L, hydrogen peroxide concentration 6.8 g/L, temperature of 105 °C, and pH = 11). Here they found an observed reaction rate constant of 0.055 min−1.
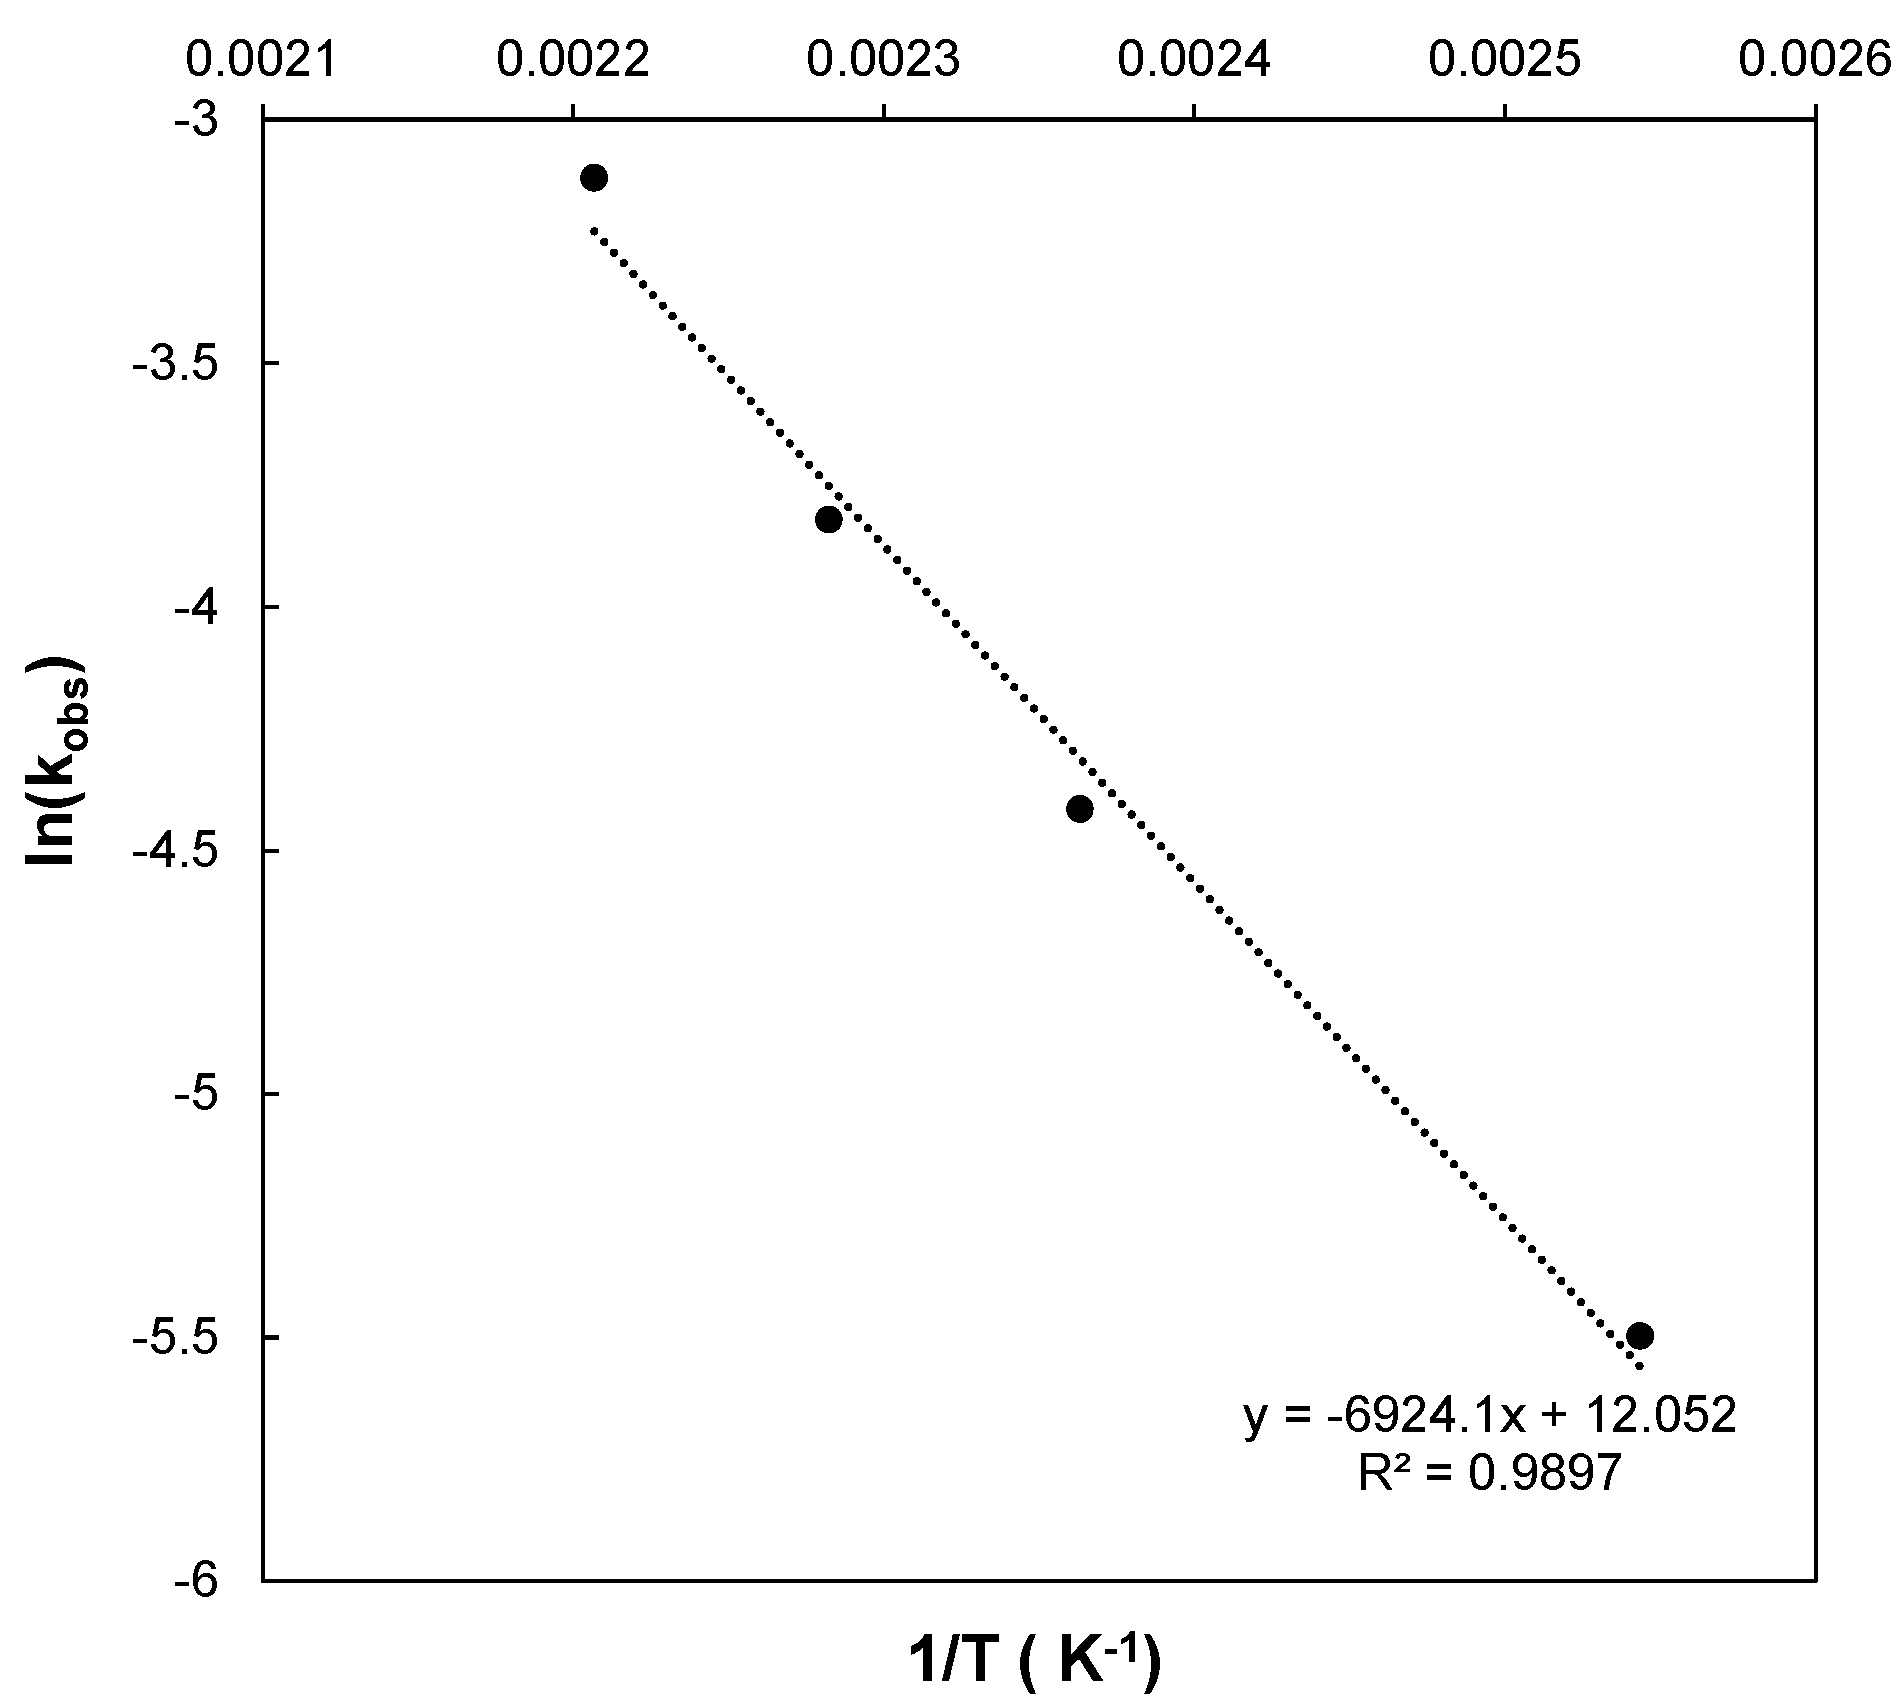
The pre-exponential factor k0 and activation energy Ea were also obtained graphically, by plotting the natural logarithm of the obtained reaction rate constants as a function of the inverse of their respective temperatures (Figure 2). From this linear fit, the activation energy and pre-exponential factor can be derived. This results in an activation energy of 57.6 kJ/mol and a pre-exponential factor of 171,442 min−1.
3.3. Influence of Process Parameters
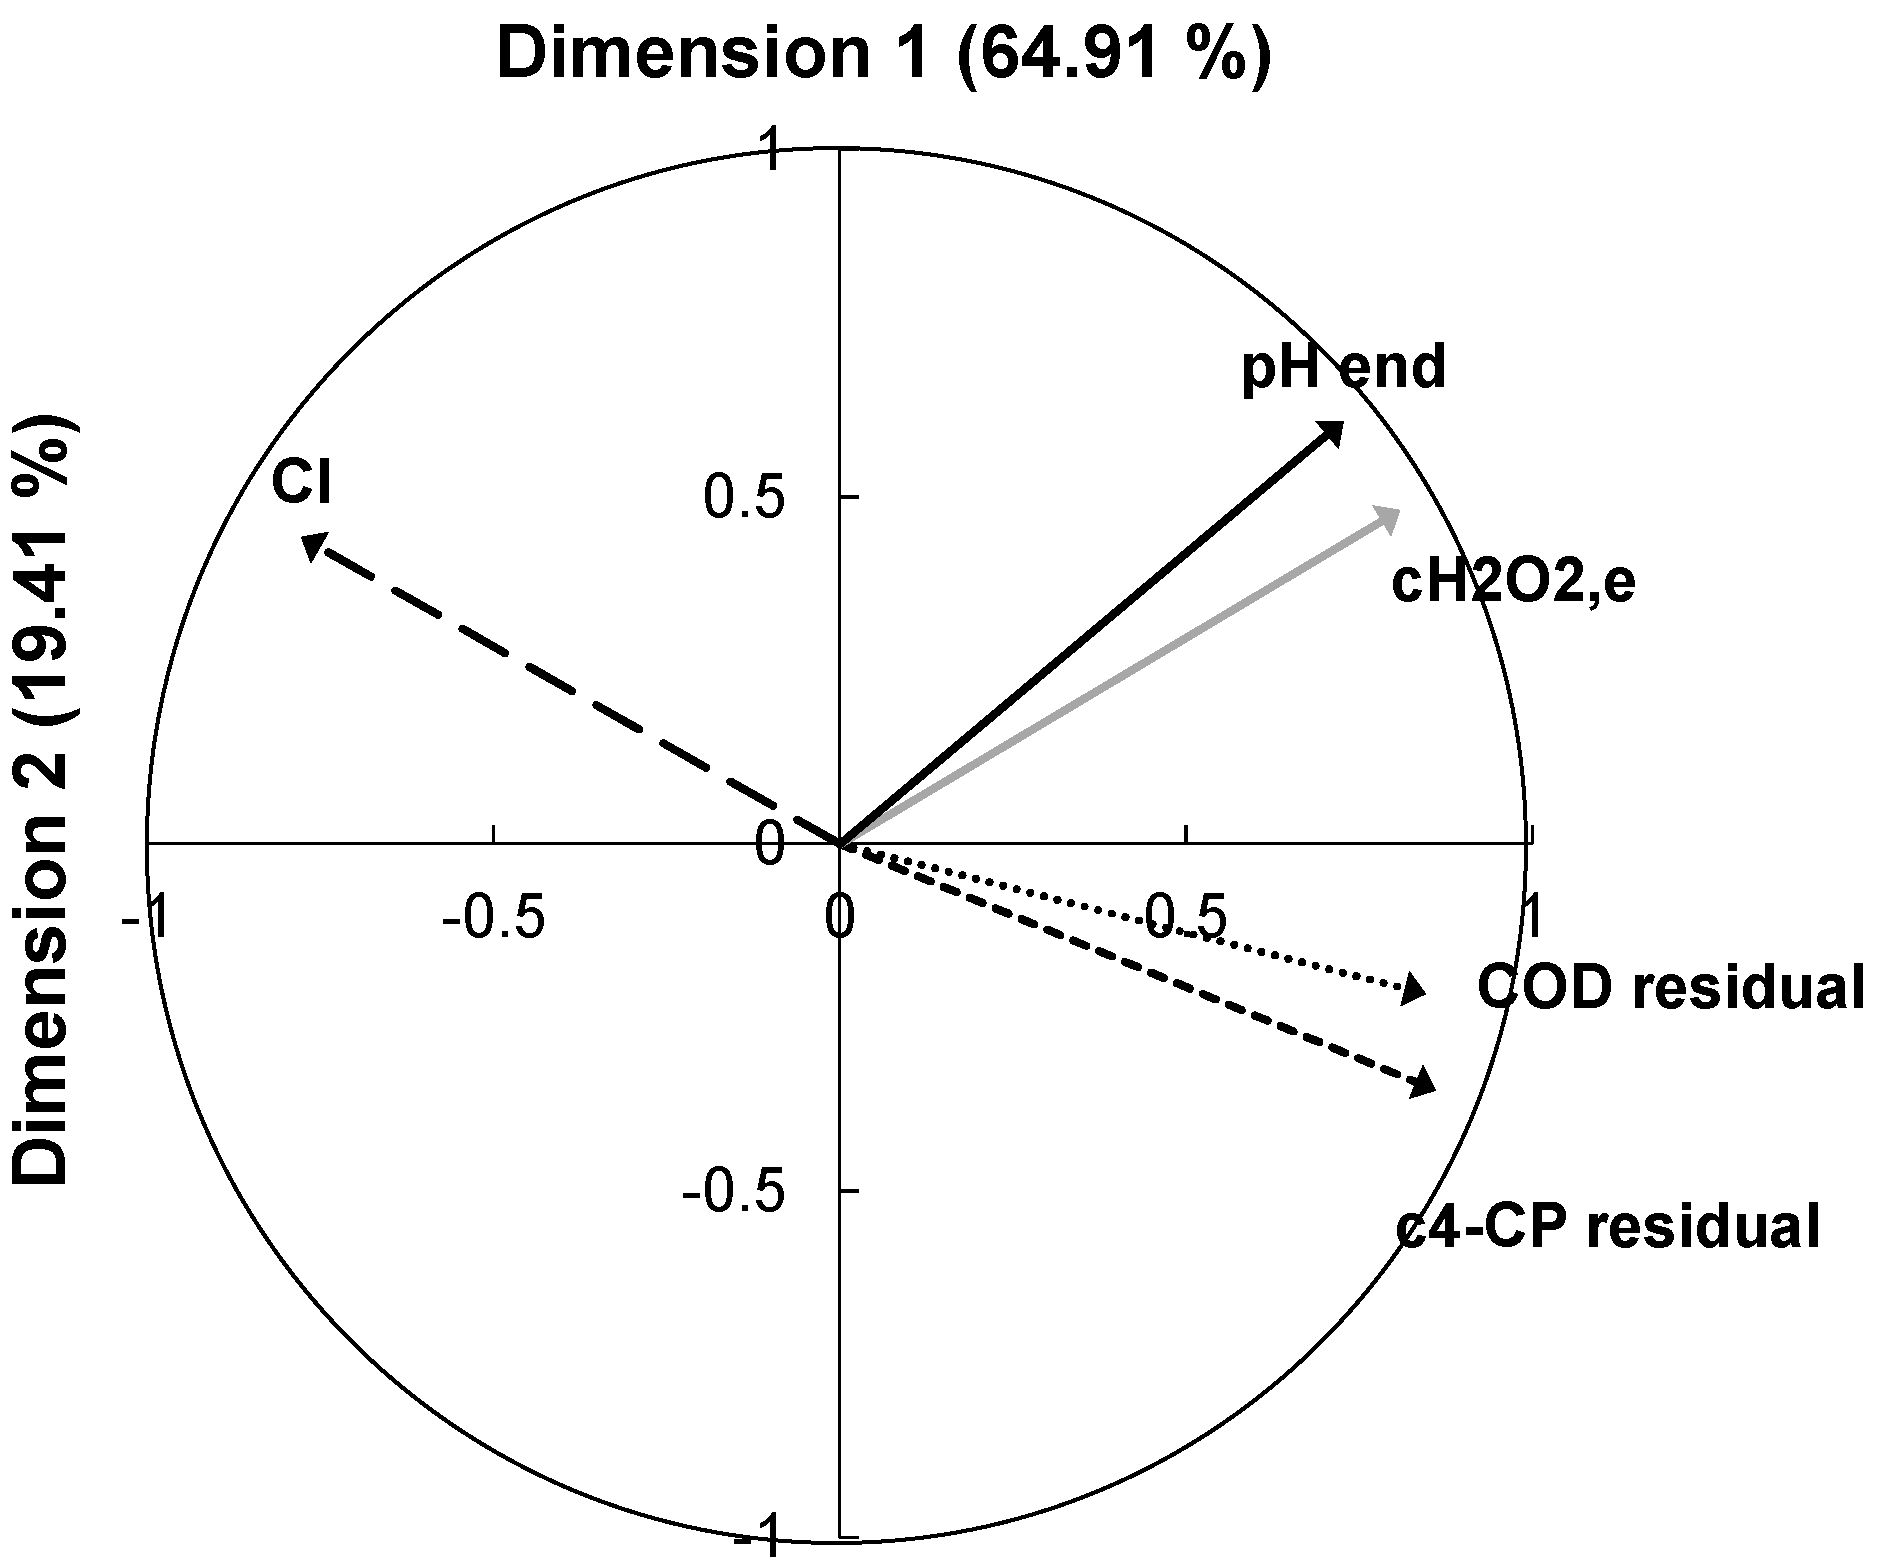
To investigate the correlations between the different output parameters, PCA was carried out. The result (biplot) of the PCA on the output matrix is shown in Figure 3. The symbols used in this figure are explained in Table 1. The first two principal components (PCs) account for 84.32% of the total variance of the output matrix (64.91% for PC1 and 19.41% for PC2). Therefore, it was chosen to only take these first two components into account. In the biplot, the vectors COD residual and C4-CP residual are situated very close to each other and the loading of these vectors (projection of the vectors) on the first dimension is high (0.846 and 0.860, respectively). This indicates a high correlation between these variables, which means that when more 4-CP is degraded (lower value for C4-CP residual), a decrease in COD will be observed, and thus compounds with lower COD are formed. This is an obvious relation, because the aim of the process is to oxidize 4-CP into better degradable (easier oxidizable) products. Another high correlation can be observed between the C4-CP residual vector and the Cl vector. Both vectors have the same direction, but opposite sense, which means these vectors are negatively correlated. A decrease in 4-CP concentration thus results in an increase of chloride ion concentration, which indicates that during the degradation of 4-CP, the chlorine atom is removed from 4-CP. However, because the 4-CP degradation products were not measured, this does not provide any information about where in the chemical reaction route this dechlorination takes place, whether it is the first step or an intermediate step in the degradation. Dechlorination during this process was also reported by Zhao et al. [7].
The last two vectors, pHend and seem to be correlated with each other (situated close to each other) which indicates that a change in H2O2 concentration influences the final pH. A few articles report that during 4-CP degradation, organic acids are formed [1,2]. An explanation for the pH drop when hydrogen peroxide is consumed can be that when more H2O2 is consumed, more organic acids are formed, which would include a drop in pH. Indirectly, this assumption would mean that vectors pHend and C4-CP residual are correlated, and this cannot be observed in the biplot (the orientation of the pHend vector to the C4-CP residual vector is close to perpendicular). The only possible explanation for this is that during the degradation process, hydrogen peroxide is consumed to form hydroxyl radicals, which will first react with the present 4-CP molecules in the solution, but will secondly (and mostly) react with the degradation products of 4-CP to form organic acids. In this way, a change in hydrogen peroxide would imply a drop in pH, and would not directly imply a change in 4-CP concentration, because degradation products are further oxidized. This indicates that the attack of *OH on the 4-CP molecule is rather non-selective. This has also been confirmed by Lee & von Gunten [23].
Also, the relative orientation of vectors C4-CP residual and is rather perpendicular. This can indicate inefficient H2O2 consumption in the MW–H2O2-process, which was confirmed by various researchers. This is due to the occurrence of unwanted side reactions as previously explained in Equations (2)–(5) [4,5].
3.4. Modeling of the MW–H2O2 Process
The correlation check of the output matrix resulted in high loadings and correlation between the vectors C4-CP residual, COD residual, and Cl. Because the aim of this process is to degrade as much 4-CP as possible, a model will be obtained for the C4-CP residual vector. As can be seen from the results of the DOE in Table 2, at 60 °C no 4-CP degradation is observed. This accounts for every combination of process parameters tested at this temperature. From this statement, it can be concluded that the energy needed for dissociation of H2O2 was not yet reached. Including this data in the model would only bring more noise into the model, because nine of 27 observations of an equal outcome are present. Therefore, it was chosen to leave these observations (runs 1–9) out of the model.
3.4.1. Obtaining the PLS Model
The resulting model equation of the PLS regression is shown in Equation (9).
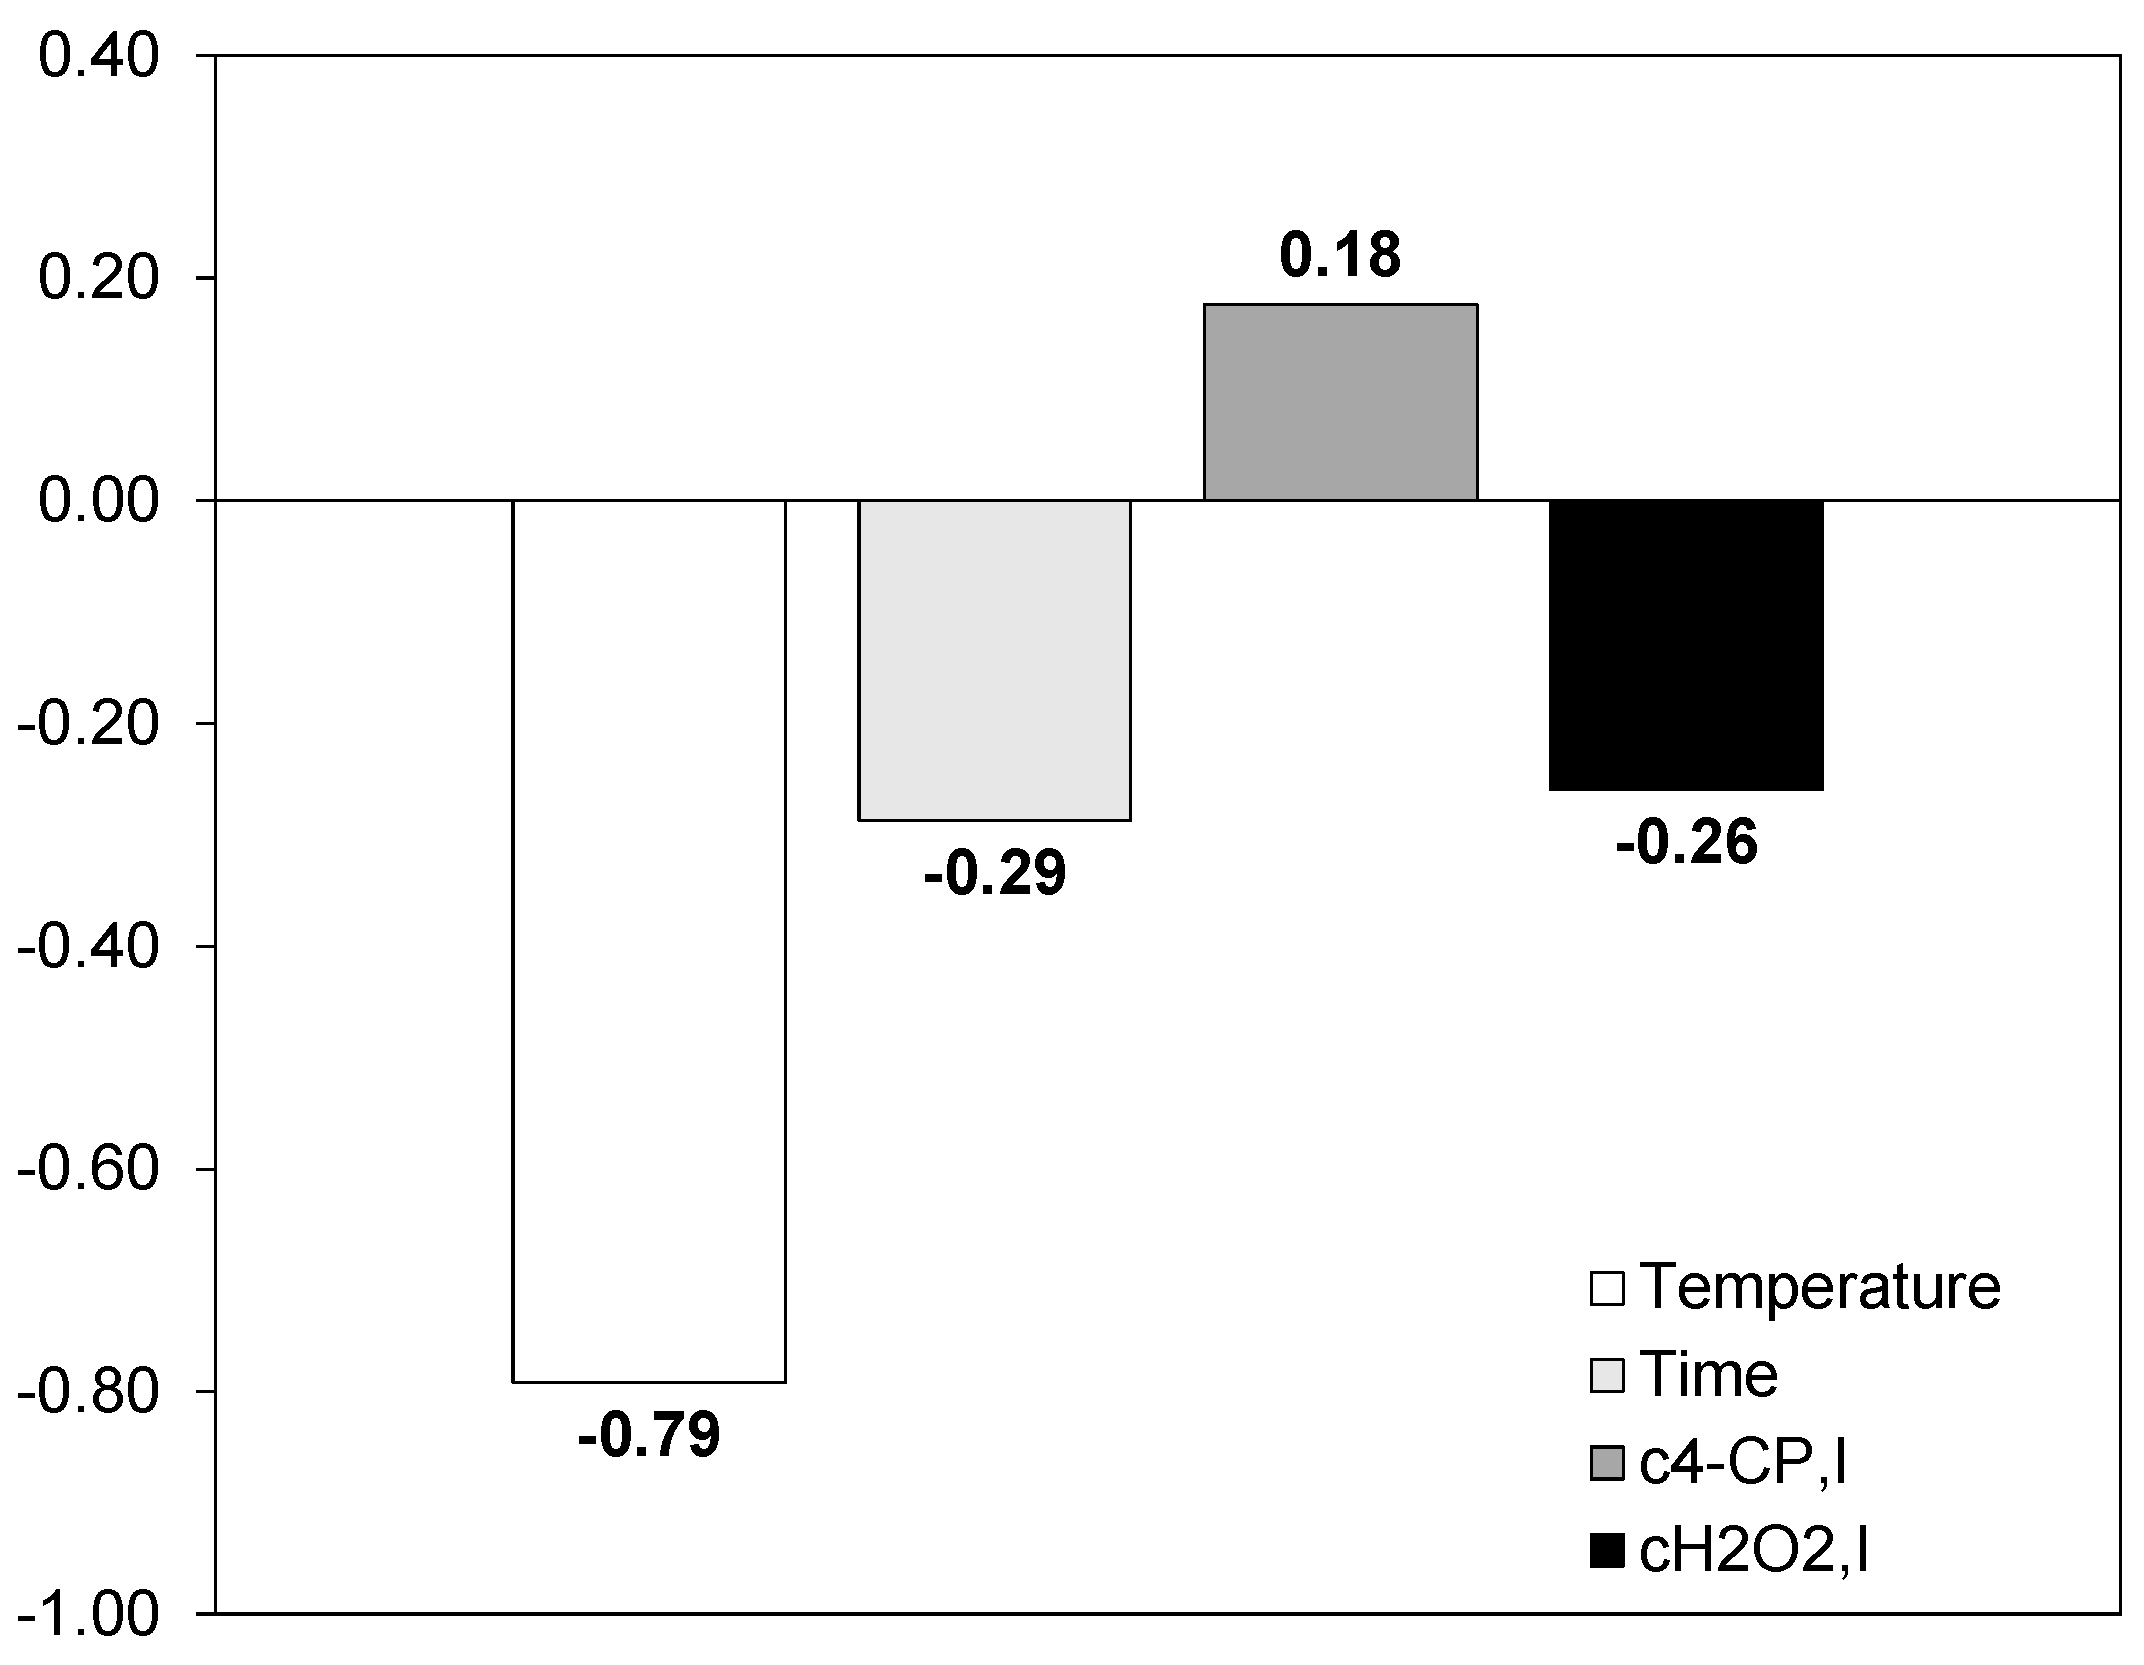
Because all process parameters are examined in different ranges of magnitudes, the absolute value of the coefficients is no direct measure for the influence of the process parameters. Therefore, the standardized coefficients for each parameter are displayed in Figure 4. Based on this figure, a ranking of the most influential parameters can be made: (i) temperature; (ii) time; (iii) initial H2O2 concentration, and (iv) initial 4-CP concentration. The large influence of temperature on the process can be explained through the underlying mechanism of the 4-CP oxidation. This mechanism relies on the supply of heat to break the peroxide bond of H2O2 and produce *OH. For this reaction, an energy barrier has to be overcome. Next to this, another temperature influence can be found in the temperature dependency of the reaction rate constant as the reaction rate constant increases with temperature (Equations (6) and (7)). A possible negative effect of higher temperatures is the decomposition of H2O2 into H2O and oxygen at higher MW power, as Remya & Lin [4] previously found that the MW power input rises proportionally with the reaction temperature. Because the model indicates an overall negative correlation between temperature and the residual 4-CP ratio (a higher temperature means a lower residual 4-CP ratio), the conclusion can be made that the positive effects of increasing temperature (producing *OH and higher reaction rate constant) dominate over the possible occurring negative inhibiting effects (decomposition of H2O2 in water and oxygen).
The influence of time on the process can be explained by the time-dependent reaction rate. The model predicts a negative correlation between the residual 4-CP concentration and the reaction time. If the reaction time increases, more H2O2 will be converted into *OH, and the oxidation of 4-CP will increase.
The third largest influence on the process is the initial H2O2 concentration. This can be explained by H2O2 being the source of the radicals firstly, and secondly the possibility of inhibiting effects when H2O2 is present in excess as previously explained in Equations (3)–(5). Thirdly, due to the non-selective nature of *OH [23], degradation products formed during the oxidation process can also consume *OH. Overall for this investigated range of H2O2 concentrations, an increase in hydrogen peroxide concentration will cause an increase in 4-CP oxidation.
Lastly, the least influential investigated parameter is the initial 4-CP concentration. In contrast to the other parameters, this parameter has a positive standardized coefficient. When increasing the initial 4-CP concentration, the residual 4-CP concentration will also increase. This can be explained as follows: at fixed conditions, the same amount of radicals are formed, irrespective from the used initial 4-CP concentration. When the initial 4-CP concentration increases, the amount of radicals available per mole of 4-CP decreases and the degradation rate of 4-CP decreases. This has also been confirmed in similar research by Bu et al., and Fang et al. [24,25].
From this model, the maximum degradation efficiency for the ranges investigated in the DOE can be determined. For a reaction temperature of 180 °C, reaction time of 20 min, initial H2O2 concentration of 11 g/L, and initial 4-CP concentration of 1000 mg/L, the residual 4-CP concentration will be 34%.
3.4.2. Model Validation
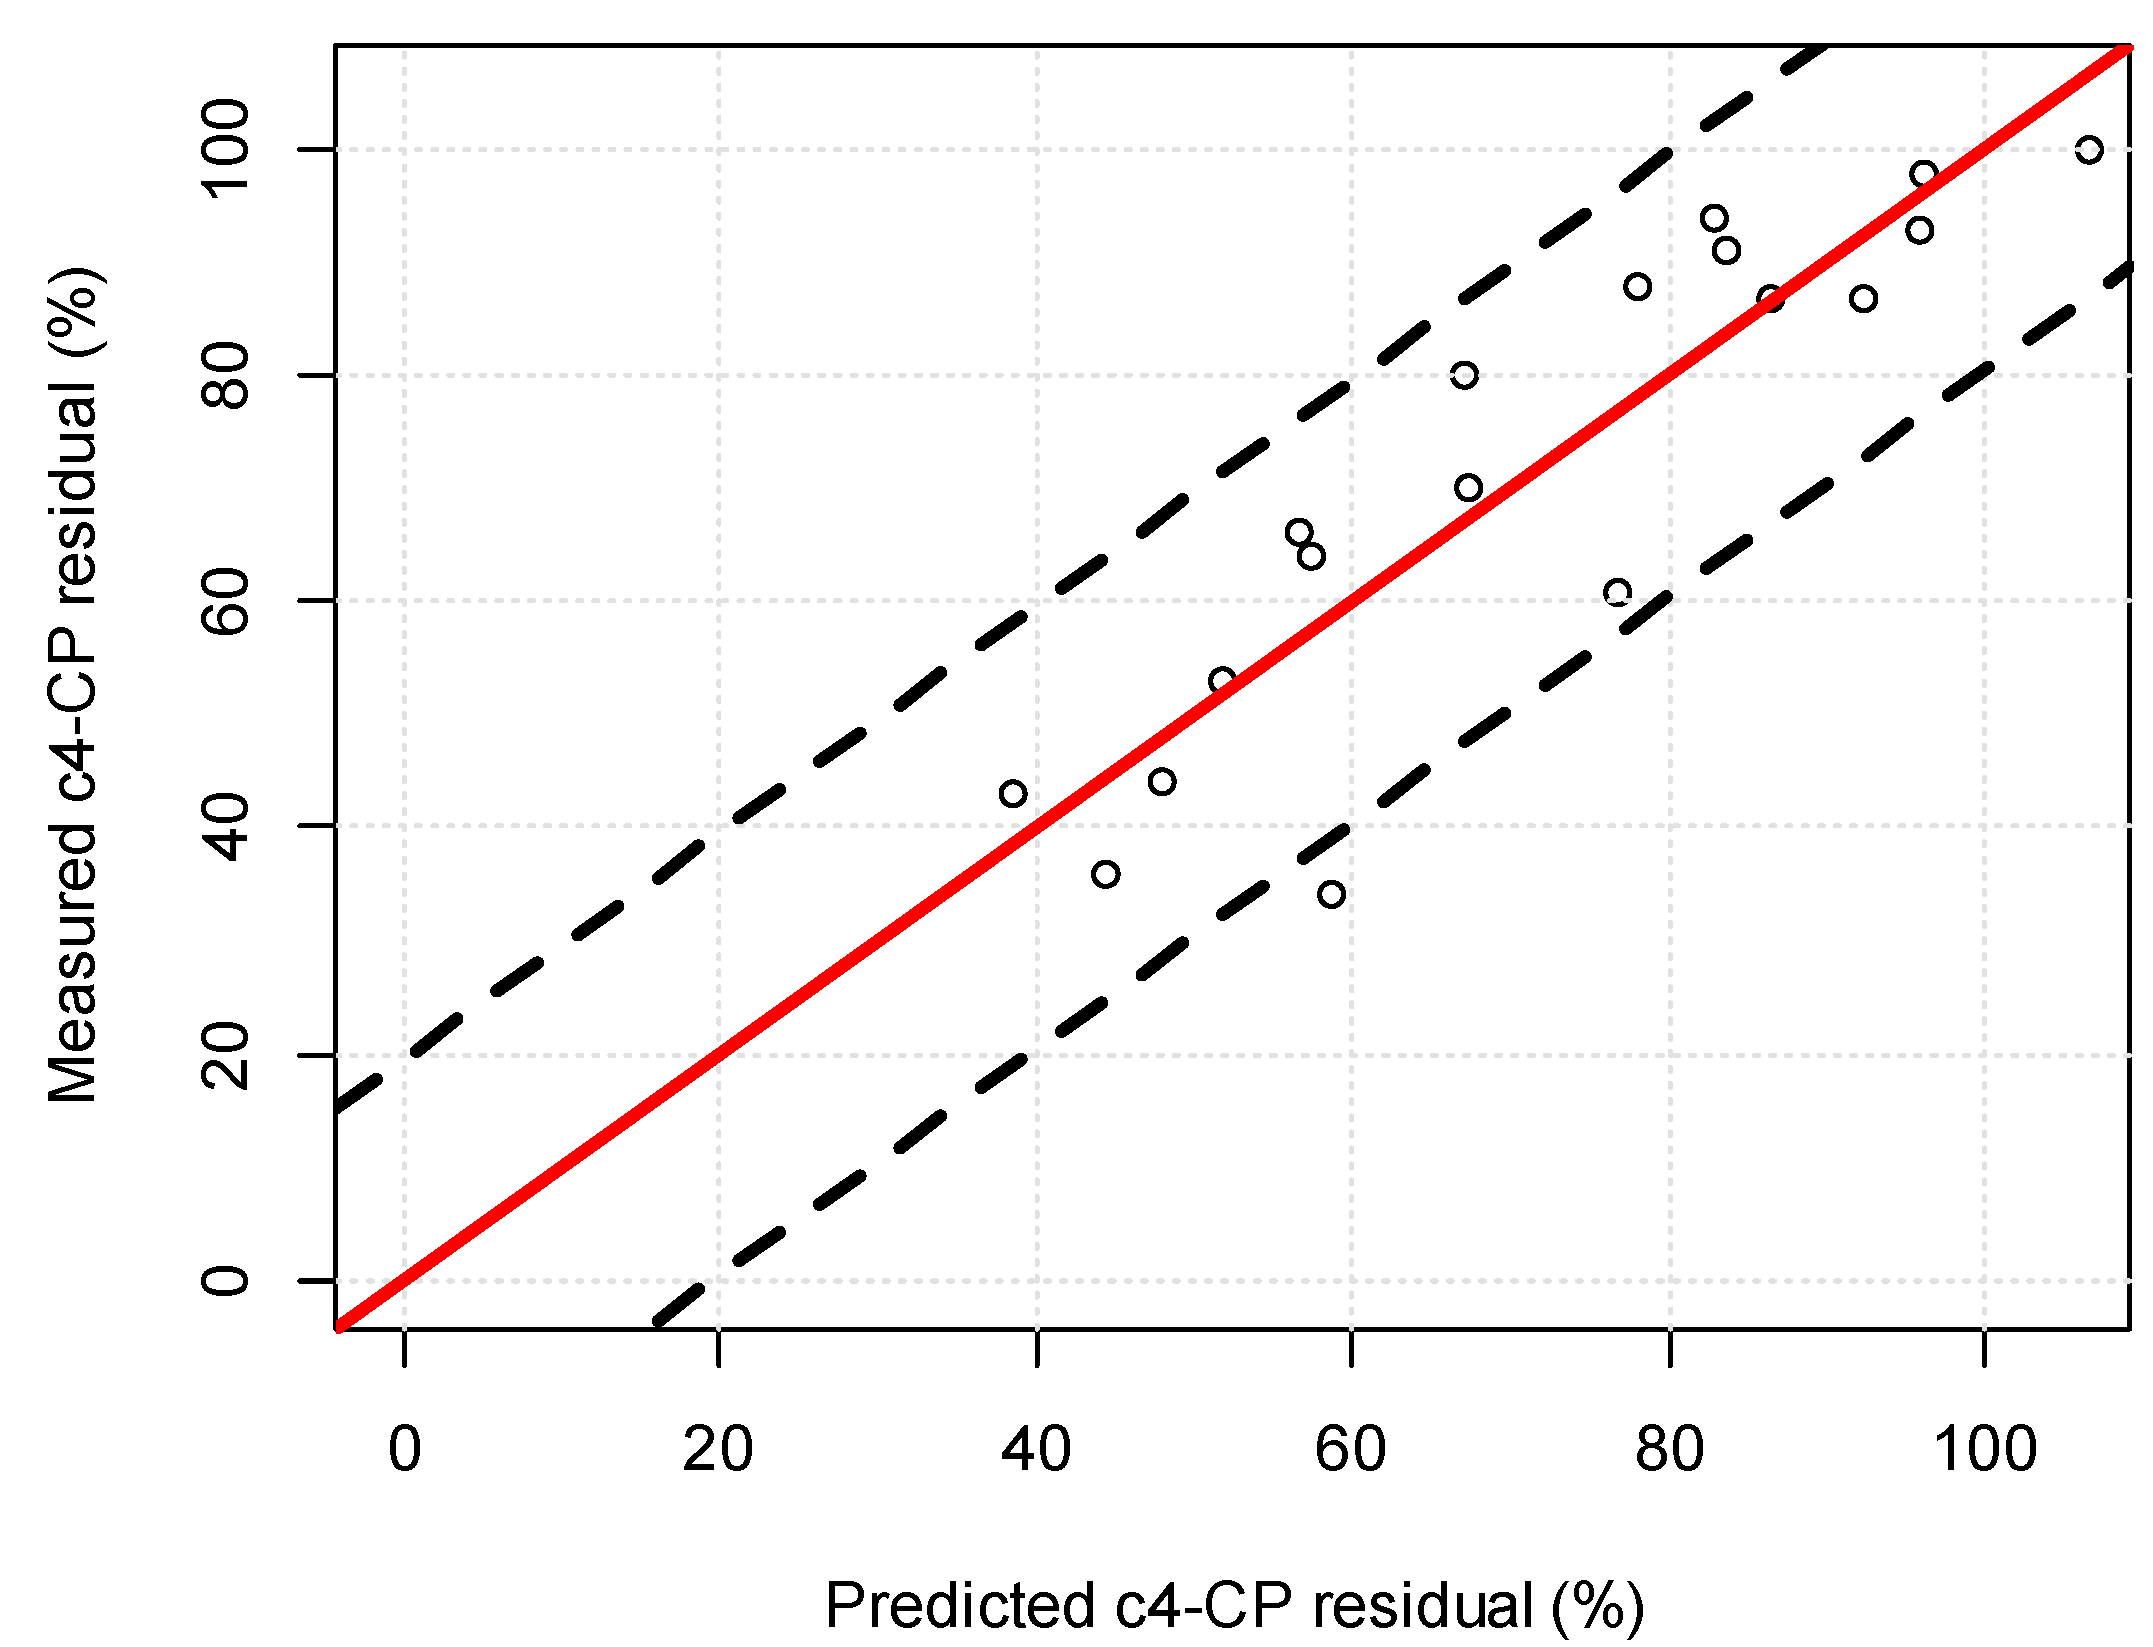
To make sure the predicted values of the model lay close to the actual observations, the predicted values are plotted against the actual observed values. If a good model is obtained, the values must lie in a confidential interval around a straight line with slope 1. The confidential interval (CI) is defined as stated in Equations (10) and (11). The factor t95% stands for the t-value of the inverse of the two-sided Student’s t distribution for a confidential interval of 95%.
The model predicts the observations perfectly if the values lie on the straight line. The results of these plots for each output parameter are stated in Figure 5. As seen in this figure, most of the values lie within the confidential interval. The R²Y-value for this model is equal to 0.81 which indicates a good fit (>0.7 [26]).
4. Discussion
The application of the MW–H2O2-process for the degradation of 4-CP was investigated. A kinetic evaluation of the process showed that the process follows pseudo first order kinetics. The observed reaction rate constant ranges from 0.0041 min−1 at a reaction temperature of 120 °C to 0.0442 min−1 at 180 °C, which is an increase of factor 10 in observed reaction rate constant. Determination of the pre-exponential factor and activation energy resulted in 171,442 min−1 and 57.6 kJ/mol respectively.
Principal Component Analysis (PCA) was used to investigate possible correlations between the measured output variables. These were the residual 4-CP concentration, the residual COD, the residual H2O2 concentration, final pH, and chloride concentration. The biplot of the PCA analysis showed that during the 4-CP degradation process, better degradable compounds are formed, and the Cl atom is removed from the molecule. Correlations between the residual H2O2 concentration and the residual 4-CP concentration showed that H2O2 consumption was not efficient in the process.
Partial Least Square (PLS) regression was applied on a fractional factorial experimental design to study the influence of the process parameters. The reaction temperature, reaction time, initial H2O2 concentration and initial 4-CP concentration were set as process variables, whereas the residual 4-CP concentration was measured as output variable. The standardized coefficients from the resulting PLS model revealed the influence of the different process parameters. The investigated process parameters can be ranked from largest to smallest influence as follows: reaction temperature, reaction time, initial H2O2 concentration, initial 4-CP concentration. From these variables, the initial 4-CP concentration has a negative effect on the residual 4-CP concentration (an increase in initial 4-CP concentration results in an increase of residual 4-CP concentration (less 4-CP is degraded)). The other parameters have a positive effect on the 4-CP degradation.
Acknowledgments
The authors would like to thank the Research Foundation Flanders for the financial support. HM holds a PhD fellowship of the Research Foundation Flanders (FWO).
Author Contributions
H.M. and K.V.E. conceived and designed the experiments; H.M. performed the experiments, analyzed the data and wrote the paper; R.D. supervised the research, contributed reagents and lab equipment and also contributed to writing the paper.
Conflicts of Interest
The authors declare no conflict of interest.
References
- Sharma, S.; Mukhopadhyay, M.; Murthy, Z.V.P. Treatment of chlorophenols from wastewaters by advanced oxidation processes. Sep. Purif. Rev. 2013, 42, 263–295. [Google Scholar] [CrossRef]
- Pera-Titus, M.; Garcı́a-Molina, V.; Baños, M.A.; Giménez, J.; Esplugas, S. Degradation of chlorophenols by means of advanced oxidation processes: A general review. Appl. Catal. B Environ. 2004, 47, 219–256. [Google Scholar] [CrossRef]
- Zhihui, A.; Peng, Y.; Xiaohua, L. Degradation of 4-chlorophenol by microwave irradiation enhanced advanced oxidation processes. Chemosphere 2005, 60, 824–827. [Google Scholar] [CrossRef] [PubMed]
- Remya, N.; Lin, J.G. Current status of microwave application in wastewater treatment-a review. Biochem. Eng. J. 2011, 166, 797–813. [Google Scholar] [CrossRef]
- Homem, V.; Alves, A.; Santos, L. Microwave-assisted Fenton’s oxidation of amoxicillin. Chem. Eng. J. 2013, 220, 35–44. [Google Scholar] [CrossRef]
- Tarr, M.A. Chemical Degradation Methods for Wastes and Pollutants; CRC Press: Boca Raton, FL, USA, 2003; p. 479. [Google Scholar]
- Zhao, G.; Lv, B.; Jin, Y.; Li, D. P-chlorophenol wastewater treatment by microwave-enhanced catalytic wet peroxide oxidation. Water Environ. Res. 2010, 82, 120–127. [Google Scholar] [CrossRef] [PubMed]
- Mudhoo, A.; Sharma, S.K. Microwave irradiation technology in waste sludge and wastewater treatment research. Crit. Rev. Environ. Sci. Technol. 2011, 41, 999–1066. [Google Scholar] [CrossRef]
- Nascimento, U.M.; Azevedo, E.B. Microwaves and Their coupling to advanced oxidation processes: Enhanced performance in pollutants degradation. J. Environ. Sci. Health A 2013, 48, 1056–1072. [Google Scholar] [CrossRef] [PubMed]
- Wong, W.T.; Chan, W.I.; Liao, P.H.; Lo, K.V. A hydrogen peroxide/microwave advanced oxidation process for sewage sludge treatment. J. Environ. Sci. Health A 2006, 41, 2623–2633. [Google Scholar] [CrossRef] [PubMed]
- Xiao, Q.; Yan, H.; Wei, Y.; Wang, Y.; Zeng, F.; Zheng, X. Optimization of H2O2 dosage in microwave-H2O2 process for sludge pretreatment with uniform design method. J. Environ. Sci. (China) 2012, 24, 2060–2067. [Google Scholar] [CrossRef]
- Chang, Y.M.; Tsai, K.S.; Tseng, C.H.; Chen, J.H.; Kao, C.M.; Lin, K.L. Rapid nonylphenol degradation in wastewater sludge using microwave peroxide oxidation with nitric acid. Environ. Prog. Sustain. Energy 2015, 34, 520–525. [Google Scholar] [CrossRef]
- Prasannakumar, B.R.; Regupathi, I.; Murugesan, T. An optimization study on microwave irradiated, decomposition of phenol in the presence of H2O2. J. Chem. Technol. Biotechnol. 2009, 84, 83–91. [Google Scholar] [CrossRef]
- Klán, P.; Vavrik, M. Non-catalytic remediation of aqueous solutions by microwave-assisted photolysis in the presence of H2O2. J. Photochem. Photobiol. A Chem. 2006, 177, 24–33. [Google Scholar] [CrossRef]
- Sellers, R.M. Spectrophotometric determination of hydrogen peroxide using potassium titanium (IV) oxalate. Analyst 1990, 105, 950–954. [Google Scholar] [CrossRef]
- Lê, S.; Josse, J.; Husson, F. FactoMineR: An R package for multivariate analysis. J. Stat. Softw. 2008, 25, 1–18. [Google Scholar] [CrossRef]
- Abdi, H.; Williams, L.J. Principal component analysis. Wiley Interdiscip. Rev. Comput. Stat. 2010, 2, 433–459. [Google Scholar] [CrossRef]
- Appels, L.; Lauwers, J.; Gins, G.; Degrève, J.; Van Impe, J.; Dewil, R. Parameter identification and modeling of the biochemical methane potential of waste activated sludge. Environ. Sci. Technol. 2011, 45, 4173–4178. [Google Scholar] [CrossRef] [PubMed]
- Sanchez, G. R package plsdepot: PLS regression 1. Retrieved Electron. May 2012, 5, 1–13. [Google Scholar]
- Wold, S.; Esbensen, K.; Geladi, P. Principal component analysis. Chemom. Intell. Lab. Syst. 1987, 2, 37–52. [Google Scholar] [CrossRef]
- Bro, R.; Smilde, A.K. Principal Component Analysis. Anal. Methods 2014, 6, 2812. [Google Scholar] [CrossRef]
- Asgari, G.; Seidmohammadi, A.; Chavoshani, A. Pentachlorophenol removal from aqueous solutions by microwave/persulfate and microwave/H2O2: A comparative kinetic study. J. Environ. Health Sci. Eng. 2014, 12, 94. [Google Scholar] [CrossRef] [PubMed]
- Lee, Y.; von Gunten, U. Oxidative transformation of micropollutants during municipal wastewater treatment: Comparison of kinetic aspects of selective (chlorine, chlorine dioxide, ferrateVI, and ozone) and non-selective oxidants (hydroxyl radical). Water Res. 2010, 44, 555–566. [Google Scholar] [CrossRef] [PubMed]
- Bu, L.; Shi, Z.; Zhou, S. Modeling of Fe(II)-activated persulfate oxidation using atrazine as a target contaminant. Sep. Purif. Technol. 2016, 169, 59–65. [Google Scholar] [CrossRef]
- Fang, J.; Fu, Y.; Shang, C. The roles of reactive species in micropollutant degradation in the UV/free chlorine system. Environ. Sci. Technol. 2014, 48, 1859–1868. [Google Scholar] [CrossRef] [PubMed]
- Granato, D.; de Araújo Calado, V.M. The use and importance of design of experiments (DOE) in process modelling in food science and technology. Math. Stat. Methods Food Sci. Technol. 2013, 1–18. [Google Scholar] [CrossRef]
Figure 1.
Determination of the reaction rate constants. Conditions: C4-CP, I = 5000 mg/L; = 11 g/L.
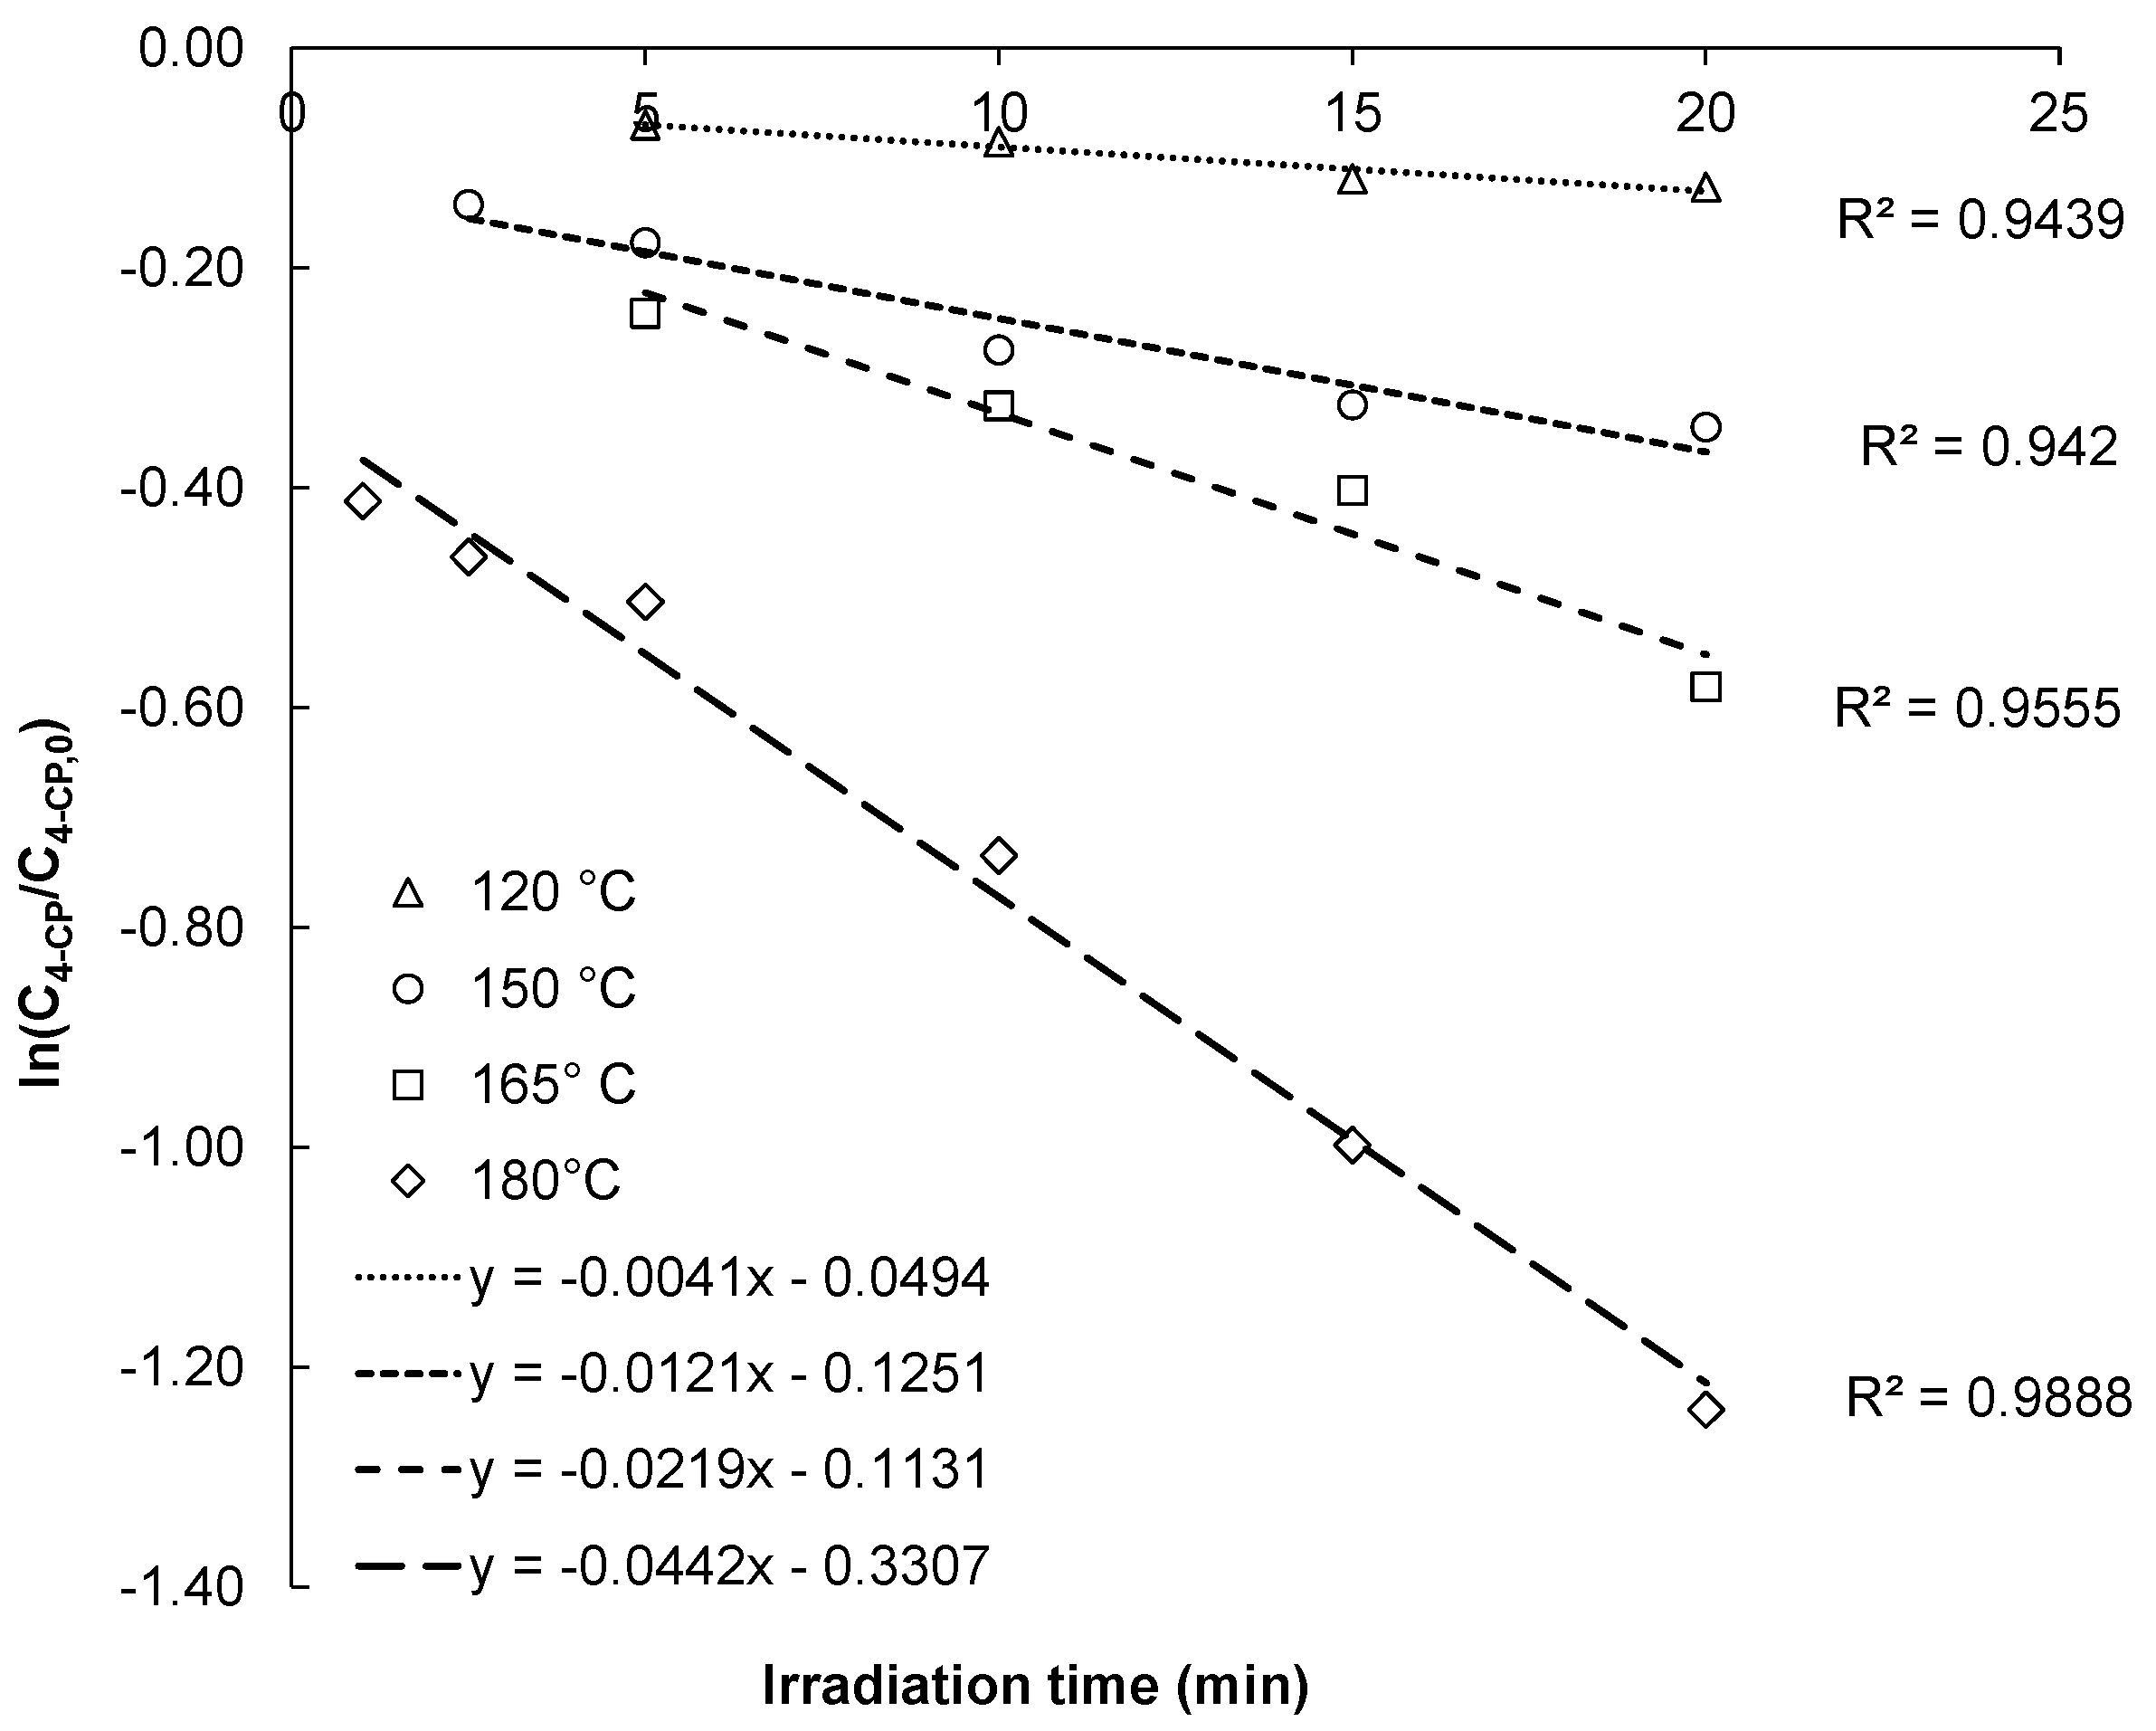
Figure 2.
Determination of the activation energy and pre-exponential factor of the MW–H2O2-process.

Figure 3.
Biplot of the Principal Component Analysis (PCA) performed on the output parameters.

Figure 4.
Standardized coefficients of the obtained model.

Figure 5.
Evaluation of the model: location of the observations in the confidence interval.


Table 1.
Input and output variables of the executed Design of Experiments (DOE) and their abbreviations.
Table 1.
Input and output variables of the executed Design of Experiments (DOE) and their abbreviations.
| Input Variables | Range | Output Variables | ||||||
|---|---|---|---|---|---|---|---|---|
| Variables | Symbols | Unit | Low | Medium | High | Variables | Symbols | Unit |
| Reaction temperature | T | (°C) | 60 | 120 | 180 | Residual 4-CP ratio | C4-CP residual | (%) |
| Reaction time | t | (min) | 5 | 10 | 20 | Residual COD ratio | COD residual | (%) |
| Initial 4-CP concentration | C4-CP, I | (mg/L) | 1000 | 5000 | 10,000 | Residual H2O2 ratio | (%) | |
| Initial H2O2 concentration | (g/L) | 5 | 7.5 | 11 | Chloride ratio | Cl | (%) | |
| Final pH | pHend | |||||||
Notes: 4-CP, 4-chlorophenol; COD, chemical oxygen demand.
Table 2.
Executed DOE.
| Run | Input Variables | Output Variables | |||||||
|---|---|---|---|---|---|---|---|---|---|
| T | t | C4-CP, I | COD Residual | C4-CP Residual | Cl | pHend | |||
| (°C) | (min) | (mg/L) | (g/L) | (%) | (%) | (%) | (%) | ||
| 1 | 60 | 5 | 1000 | 5 | 95% | 97% | 81% | 3% | 5.06 |
| 2 | 60 | 10 | 1000 | 7.47 | 100% | 100% | 79% | 1% | 4.79 |
| 3 | 60 | 20 | 1000 | 11 | 100% | 100% | 84% | 0% | 4.39 |
| 4 | 60 | 10 | 5000 | 5 | 89% | 97% | 85% | 0% | 4.64 |
| 5 | 60 | 20 | 5000 | 7.47 | 100% | 100% | 82% | 0% | 4.03 |
| 6 | 60 | 5 | 5000 | 11 | 85% | 99% | 92% | 7% | 4.37 |
| 7 | 60 | 20 | 10,000 | 5 | 100% | 97% | 77% | 2% | 2.68 |
| 8 | 60 | 5 | 10,000 | 7.47 | 96% | 100% | 76% | 1% | 3.25 |
| 9 | 60 | 10 | 10,000 | 11 | 96% | 98% | 77% | 2% | 2.56 |
| 10 | 120 | 10 | 1000 | 5 | 94% | 87% | 75% | 8% | 2.92 |
| 11 | 120 | 20 | 1000 | 7.47 | 100% | 61% | 72% | 19% | 2.53 |
| 12 | 120 | 5 | 1000 | 11 | 100% | 91% | 78% | 0% | 2.96 |
| 13 | 120 | 20 | 5000 | 5 | 94% | 87% | 72% | 2% | 2.63 |
| 14 | 120 | 5 | 5000 | 7.47 | 96% | 93% | 74% | 2% | 2.85 |
| 15 | 120 | 10 | 5000 | 11 | 95% | 94% | 78% | 2% | 2.74 |
| 16 | 120 | 5 | 10,000 | 5 | 97% | 100% | 67% | 2% | 2.52 |
| 17 | 120 | 10 | 10,000 | 7.47 | 100% | 98% | 65% | 3% | 2.21 |
| 18 | 120 | 20 | 10,000 | 11 | 93% | 88% | 63% | 4% | 2.13 |
| 19 | 180 | 20 | 1000 | 5 | 62% | 44% | 41% | 37% | 2.19 |
| 20 | 180 | 5 | 1000 | 7.47 | 79% | 64% | 60% | 17% | 2.41 |
| 21 | 180 | 10 | 1000 | 11 | 74% | 36% | 53% | 40% | 2.16 |
| 22 | 180 | 5 | 5000 | 5 | 88% | 80% | 45% | 0% | 2.06 |
| 23 | 180 | 10 | 5000 | 7.47 | 76% | 66% | 34% | 0% | 1.78 |
| 24 | 180 | 20 | 5000 | 11 | 62% | 43% | 19% | 15% | 1.58 |
| 25 | 180 | 10 | 10,000 | 5 | 89% | 70% | 10% | 23% | 1.6 |
| 26 | 180 | 20 | 10,000 | 7.47 | 90% | 53% | 8% | 22% | 1.46 |
| 27 | 180 | 5 | 10,000 | 11 | 75% | 34% | 22% | 42% | 1.39 |
© 2018 by the authors. Licensee MDPI, Basel, Switzerland. This article is an open access article distributed under the terms and conditions of the Creative Commons Attribution (CC BY) license (http://creativecommons.org/licenses/by/4.0/).
Share and Cite
MDPI and ACS Style
Milh, H.; Van Eyck, K.; Dewil, R. Degradation of 4-Chlorophenol by Microwave-Enhanced Advanced Oxidation Processes: Kinetics and Influential Process Parameters. Water 2018, 10, 247. https://doi.org/10.3390/w10030247
AMA Style
Milh H, Van Eyck K, Dewil R. Degradation of 4-Chlorophenol by Microwave-Enhanced Advanced Oxidation Processes: Kinetics and Influential Process Parameters. Water. 2018; 10(3):247. https://doi.org/10.3390/w10030247
Chicago/Turabian StyleMilh, Hannah, Kwinten Van Eyck, and Raf Dewil. 2018. "Degradation of 4-Chlorophenol by Microwave-Enhanced Advanced Oxidation Processes: Kinetics and Influential Process Parameters" Water 10, no. 3: 247. https://doi.org/10.3390/w10030247
Note that from the first issue of 2016, this journal uses article numbers instead of page numbers. See further details here.