Climate and Hydrological Change Characteristics and Applicability of GLDAS Data in the Yarlung Zangbo River Basin, China

State Key Laboratory of Hydraulics and Mountain River Engineering, College of Water Resource & Hydropower, Sichuan University, Chengdu 610065, China
*
Authors to whom correspondence should be addressed.
Water 2018, 10(3), 254; https://doi.org/10.3390/w10030254
Submission received: 20 December 2017
/
Revised: 25 February 2018
/
Accepted: 26 February 2018
/
Published: 1 March 2018
Abstract
:The hydrological cycle is particularly sensitive to and is greatly affected by global climate change. In addition, runoff change has a strong influence on the hydrological cycle and migration of biogenic substances. The Yarlung Zangbo River basin in China is a typical basin for which climate and hydrological data are lacking. Land surface models can provide data for studying land surface substance and energy circulation, which are meaningful to face climate change. The midstream region of the Yarlung Zangbo River basin, which is strongly affected by climate change, was selected as the study area. First, the observed mean temperature, precipitation and runoff characteristics were analysed. Second, after combining the Global Land Data Assimilation System (GLDAS) and the water balance equation, we simulated climate and hydrological processes for the same time period. Finally, the correlation and error between GLDAS and observed data were analysed to verify applicability of the GLDAS data, and the impacts of climate factors on runoff were discussed. The results revealed that under the background of global warming, precipitation, temperature, and runoff changed significantly and showed strong consistency during the research period. Mean monthly precipitation, temperature and runoff exhibited clear cyclical fluctuations of approximately 12 months, and they all tended to increase. GLDAS is not a good system to describe the land surface conditions of the Yarlung Zangbo River basin all the time. However, within a certain time period, GLDAS data have a good applicability in the basin. Thereinto, the GLDAS mean monthly precipitation was moderately correlated with observed precipitation, with a correlation coefficient of 0.75. GLDAS mean monthly temperature was highly correlated with observed data, with a correlation coefficient of 0.94. Based on the Brunke ranking method, it indicates that GLDAS-Noah-based runoff data were closer to observed runoff data than the three other GLDAS models. Correlation coefficients between precipitation and runoff for the three time scales were higher than those between temperature and runoff. This means that rainfall was the main factor affecting natural runoff change, as opposed to temperature, and it can control the evolution of the river to some degree. This paper indicates the impacts of climate change on runoff and the application of GLDAS for data-limited basins. The results provide a deeper understanding of the Yarlung Zangbo River basin characteristics and can provide a scientific basis for the management of water resources and policy implementation for this basin.
1. Introduction
Global warming is becoming an indisputable truth. The atmospheric carbon dioxide concentration has increased from 280 ppm to 407 ppm since the industrial revolution and will continue to increase at a rate of 1.8 ppm/a [1]. After five intensive discussions, the Intergovernmental Panel on Climate Change (IPCC) reported the following climatic and hydrological problems [2,3,4,5]: Mean temperature of the sea and land surface has exhibited a linear upward trend over the past 100 years, which has led to sea level rise and the snowfall and glaciers decreased. Extreme weather (i.e., heavy rainfall, heat waves, flooding and drought) due to global warming threatens human life, and the occurrence probability may increase. In China, the rates of warming and sea level rise are faster than the mean global rate. The glacier area has decreased by 10.1%, and frozen areas on earth have decreased by approximately 18.6% since the late 1970s. China’s air temperature will continue to increase in the future.
Under the background of global climate change, the global water cycle will change inevitably. The increase of greenhouse gas concentrations will have direct first-order effects on the global hydrological cycle, with impacts on water availability and demand [6]. The critical importance of water is undeniable-it is the essence of life. Insufficient rainfall results in a decrease in water supply and quality, crop failure, and famine. Too much water results in flooding, destruction, poor water quality, and famine [7]. Looking forward, water resources will become key and will play a restrictive role in the global environment and economic development on a daily basis. Research on the effects of climate change on water resources started in the late 1970s, and included the following: relationships between climate, climate change and water supply [8], the extent of climate prediction and the impact of human activity on climate [9], impact of climate change and fluctuation on water resources and the sensitivity of water resources to climate change [10,11], and large-scale climate and hydrological simulation technology [12]. The main results of these research are as follows: (1) Higher rainfall causes runoff to increase in high latitude regions, and runoff decreases in low latitude regions due to decreased rainfall and increased evaporation; (2) Mean annual runoff is more sensitive to precipitation than to temperature; (3) In the future, the frequency and intensity of drought may increase in areas with higher temperature and lower precipitation; (4) In basins with seasonal snowfall and melting snow, seasonal runoff is more sensitive to temperature changes than to other climate changes. Since the 1980s, China has also carried out a series of research to determine the impacts of gradual climate change on hydrology and water resources. However, Chinese scholars have focused mainly on regional research, including the Yangtze River, the Yellow River, the Hu River, Ning Xia Province, and other regions [13,14,15,16]. This research showed that under the background of global warming, mean temperature, and precipitation in major regions of China have changed significantly in recent years, with significant impacts on water resources. The results can provide a scientific basis for the management of climate and water resources and for the formulation of relevant policies.
The Tibetan Plateau is the highest plateau in the world. Due to its unique geographic environment, the energy and water cycles of this area contribute substantially to global energy and water cycles. In addition, the exchange of energy and water between the land surface and atmosphere play an important role in regional climate change and water resource management [17]. Therefore, the Tibetan Plateau is also known as “a driver and amplifier of global climate change”. The Yarlung Zangbo River basin, which is located in the southern Tibetan Plateau, is the main source of fresh water in the Tibet autonomous region, and is also a strategic water resource reserve area in China. Under the background of global warming, the climate in this area has changed significantly. The temperature is increasing significantly, especially in winter. Precipitation fluctuates considerably, and the regional difference in climate change is significant. As global warming intensifies, the water cycle is strengthened, especially in high latitude and alpine regions, and water resources are strongly affected by climate change. Hence, it is necessary to carry out researches on water cycle in the basin under climate change. The weather stations in western China are sparsely distributed, especially on the Tibetan Plateau, and the study of climate change in this region depends only on observed data, which are insufficient. Therefore, we need more accurate and high-resolution grid data to cover the whole area, and the Global Land Data Assimilation System (GLDAS) can provide data support for this requirement.
Midstream of the Yarlung Zangbo River basin is a core region of economic and social development in Tibet. The population in this area is very high, and water resource use is relatively high. However, this area is strongly affected by climate change. Hence, carrying out a study on runoff response under climate change in this area has important practical significance. In this paper, we selected this area as the study area. First, characteristics of observed temperature, precipitation and runoff change of Nuxia hydrologic station from 1979 to 2016 were analysed. Second, four GLDAS models were used to extract temperature, precipitation, soil moisture, and snow equivalent data for the same period. The water balance equation and GLDAS data were used to simulate runoff change. Finally, the GLDAS data in the study area were verified by comparison with observed data to analyse the application, and the impact of climate factors on runoff was discussed. This research is helpful to better understand the impact of climate change on water resources in the midstream region of the Yarlung Zangbo River basin and provides significant guidance for water resource management, related policy formulation, drought disaster, agricultural irrigation, and environmental problems that are caused by the reduction of hydrological flow. This research is also useful to study the response mechanisms of hydrology and ecological processes to climate change at the basin scale.
2. Objective, Study Area, Data and Methods
2.1. Objective
Under the background of global climate change, this research targets to the core rule of the applicability of the assimilation system data in data-limited area. With the midstream region of the Yarlung Zangbo River basin taken as study object, this research systematically focus on the analyse of climate and hydrology change characteristics, and the applicability of four models of GLDAS data in this area.
2.2. Study Area
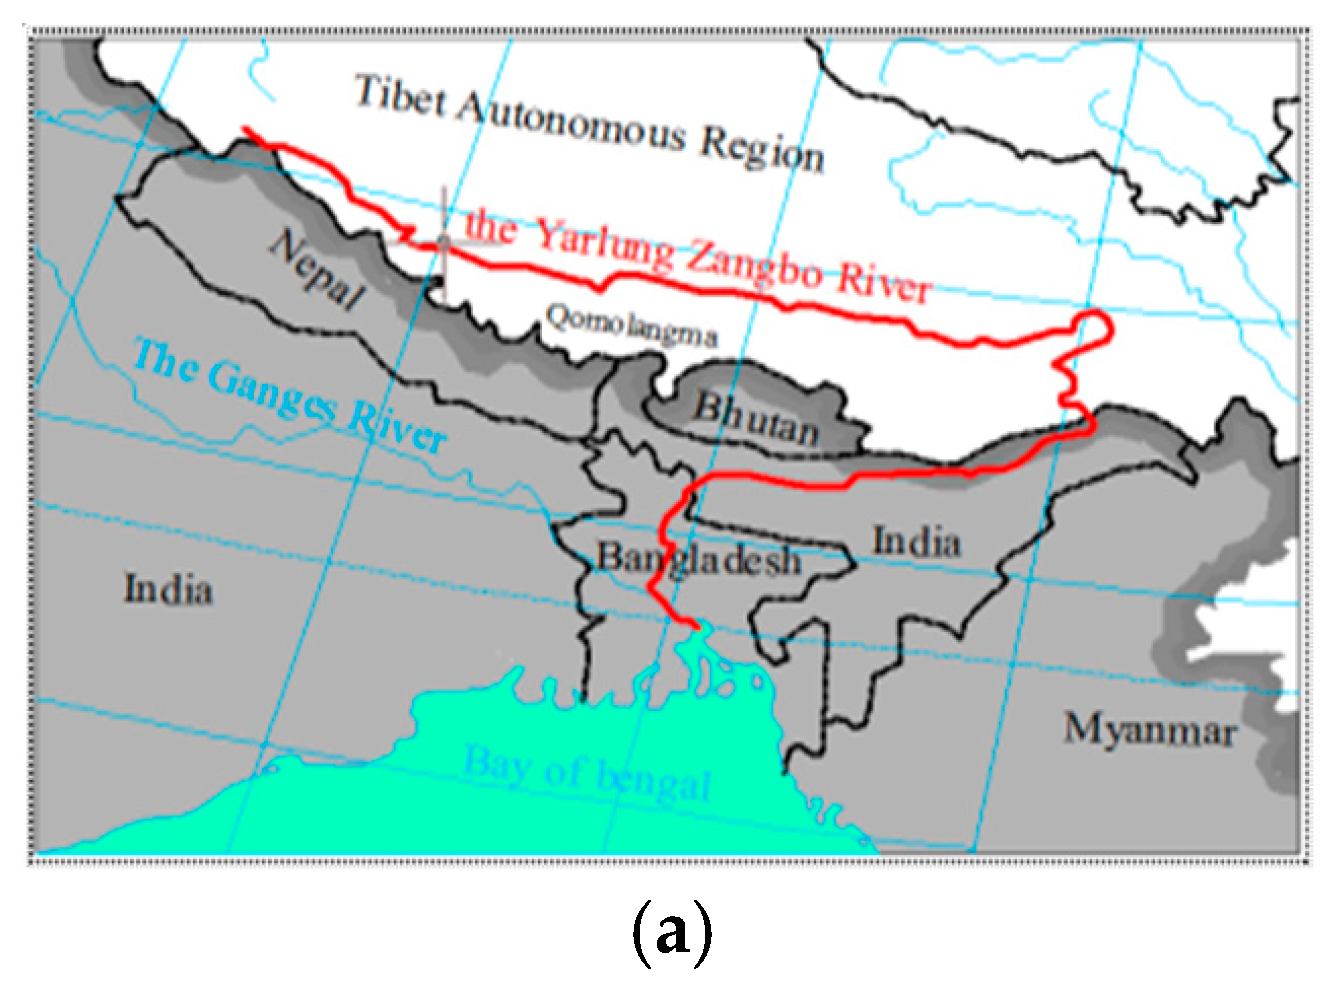
The Yarlung Zangbo River, which originates in Jie Ma Zong Yang glacier, runs through southern Tibet and leaves China through Pasighat. It is an important international river that has the highest mean altitude. The main stream in China is approximately 2.06 × 10³ km, ranging from 82°01′ E to 97°06′ E and from 27°40′ N to 31°17′ N. The catchment area is approximately 2.58 × 10⁵ km2, and mean annual runoff is approximately 1.40 × 10¹¹ m3, ranking third in China [18]. This basin is a typical subtropical climate zone that is located at the intersection of the southern and central Asian tropics and is greatly affected by the south Asian summer monsoon. The study area of this paper is the midstream region of this river, which runs from Lizi to Pai town. Its total length is 1300 km, and the control area is 1.64 × 10⁵ km2. The major tributaries are located in this area, and these huge tributaries not only provide abundant water resources, but also maintain a broad plain, which is the most important and richest agricultural region in Tibet. Therefore, understanding the spatial and temporal dynamics and determining the trend of the water cycle under climate change are meaningful for agricultural production, as well as a precondition to reasonably allot and develop water resources, leading to the sustainable use of regional water resources [19]. The geographic location, drainage distribution, and related hydrological stations of the study area can be observed in Figure 1.
2.3. Data
2.3.1. Observed Meteorological and Hydrological Data
Observed meteorological (i.e., precipitation and temperature) data are published by the China meteorological data service centre (http://data.cma.cn). The monthly mean precipitation (P) and temperature (T) from January 1979 to December 2016 of 20 meteorological stations in and near the midstream region of this basin were downloaded for this paper. The 20 meteorological stations are distributed unevenly because of manpower and resource limitations, as well as the natural environment. Hence, to obtain mean monthly values, related measures should be taken.
Using ArcGIS software, the Thiessen polygon method is used to calculate mean precipitation of a basin [20], which can be expressed in terms of the formula (1).
The Thiessen polygon formula:
where p1, p2, …, pn represent the precipitation of each meteorological station; f1, f2, …, fn represent the area of each controlled meteorological station; and F is the area of the whole basin.
To calculate mean evapotranspiration of a basin, this paper adopts a traditional but high-precision method, called Takahashi formula [20].
The Takahashi formula:
where, P is monthly mean precipitation; T is monthly mean temperature.
Observed runoff data for the Yarlung Zangbo River basin are extremely limited. There are four hydrological stations in the main stream of the midstream region, i.e., Lazi, Nugesha, Yongcun, and Nuxia stations. Figure 1b shows the location of the 4 gauging stations. We could only obtain partial observed runoff data from the 4 stations. In this paper, we used observed monthly runoff data from Nuxia gauging station from January 1979 to December 2000 to validate the results that were calculated from the GLDAS data.
2.3.2. Global Land Data Assimilation System (GLDAS)
GLDAS is an offline global land simulation system that was jointly developed by the Goddard Space Flight Center (GSFC) of National Aeronautics and Space Administration (NASA) and the National Centers for Environmental Prediction (NCEP) of National Oceanic and Atmospheric Administration (NOAA) (https://hydro1.gesdisc.eosdis.nasa.gov/data/). The system contains 3 land models (i.e., Mosaic-MOS, Noah and a community land surface model—CLM), and 1 hydrology model (i.e., the variable infiltration capacity model—VIC). The Noah model is a land surface process model which regards the soil surface and vegetation as a whole. The CLM contains three important sub-models: land surface model of the National Center for Atmospheric Research (NCAR), Biosphere—Atmosphere Transfer Scheme, and Land Surface model (LSM) of the institute of atmospheric physics of Chinese academy of sciences. The VIC model is a large scale semi-distributed hydrological model based on thermal balance and physical dynamic mechanism. In addition, the system has two versions (i.e., GLDAS-1 and GLDAS-2). GLDAS-1 provides all four models of global land surface data from 1979 to present, with 1° × 1° of spatial resolutions and 3 h and one month of temporal resolutions. GLDAS-1 also provides data of Noah model from 2000 to present with 0.25° × 0.25° of spatial resolutions. To GLDAS-2, it only has Noah model to provide data from 1979 to 2010 with 1° × 1° of spatial resolutions. All four GLDAS models coalesce data from both of the land surface and satellites, and provide 28 optimized real-time land surface state variables (e.g., soil moisture, surface temperature, rainfall rate, snow water equivalent, and pressure) [21,22,23]. These high quality global land surface data are widely used in weather and climate research, water cycle research and applications of water resource.
In this paper, all four GLDAS models from GLDAS-1 were used to provide monthly rainfall rate, air temperature, soil moisture, and snow water equivalent parameters for the 1.0° spatial resolution [17]. Precipitation was calculated by rainfall rate. By combining GLDAS data with the water balance equation, the runoff of this region was calculated. The purpose of this research is to analyse the characteristics of climate and hydrology change and to select the most suitable alternative climate and hydrology information for the midstream region of the Yarlung Zangbo River basin.
2.4. Methods
2.4.1. Comparison and Applicability Analysis of Meteorological Data
When GLDAS data were compared with observed meteorological data, we first extracted monthly data according to the longitude and latitude of the research region. We selected GLDAS-MOS to assess the precipitation and temperature data because these input data are the same for the four GLDAS models, and Wang wen [24] and Wang Xiaoju [25] also found that precipitation and temperature data from the 4 GLDAS models were strongly consistent. The change trend, correlation coefficient (R), and root mean square error (RMSE) were used to determine the degree of similarity between the two datasets.
2.4.2. Comparison and Applicability Analysis of Runoff Data
As the soil moisture input data for the four GLDAS models are different, we used all GLDAS data to compare runoff with observed values. The total runoff of the midstream of the Yarlung Zangbo River basin was calculated using the water balance equation by combining terrestrial water storage variations derived from the four GLDAS models (terrestrial water storage is represented by the sum of soil moisture and the snow water equivalent [20]) with precipitation and evapotranspiration. The regulation of distribution, the trend of variation, and continuity and mutability were analysed using the least square method. Subsequently, four statistical parameters (i.e., the correlation coefficient (R), mean bias (BIAS), standard deviation of the differences (σd), and the ratio of the standard deviations (σr/σobs)) were calculated to compare the correlation and error between the GLDAS and observed runoff data. In addition, the Brunke ranking method [26] was applied to evaluate the data quality and applicability of the four datasets for the Yarlung Zangbo River basin.
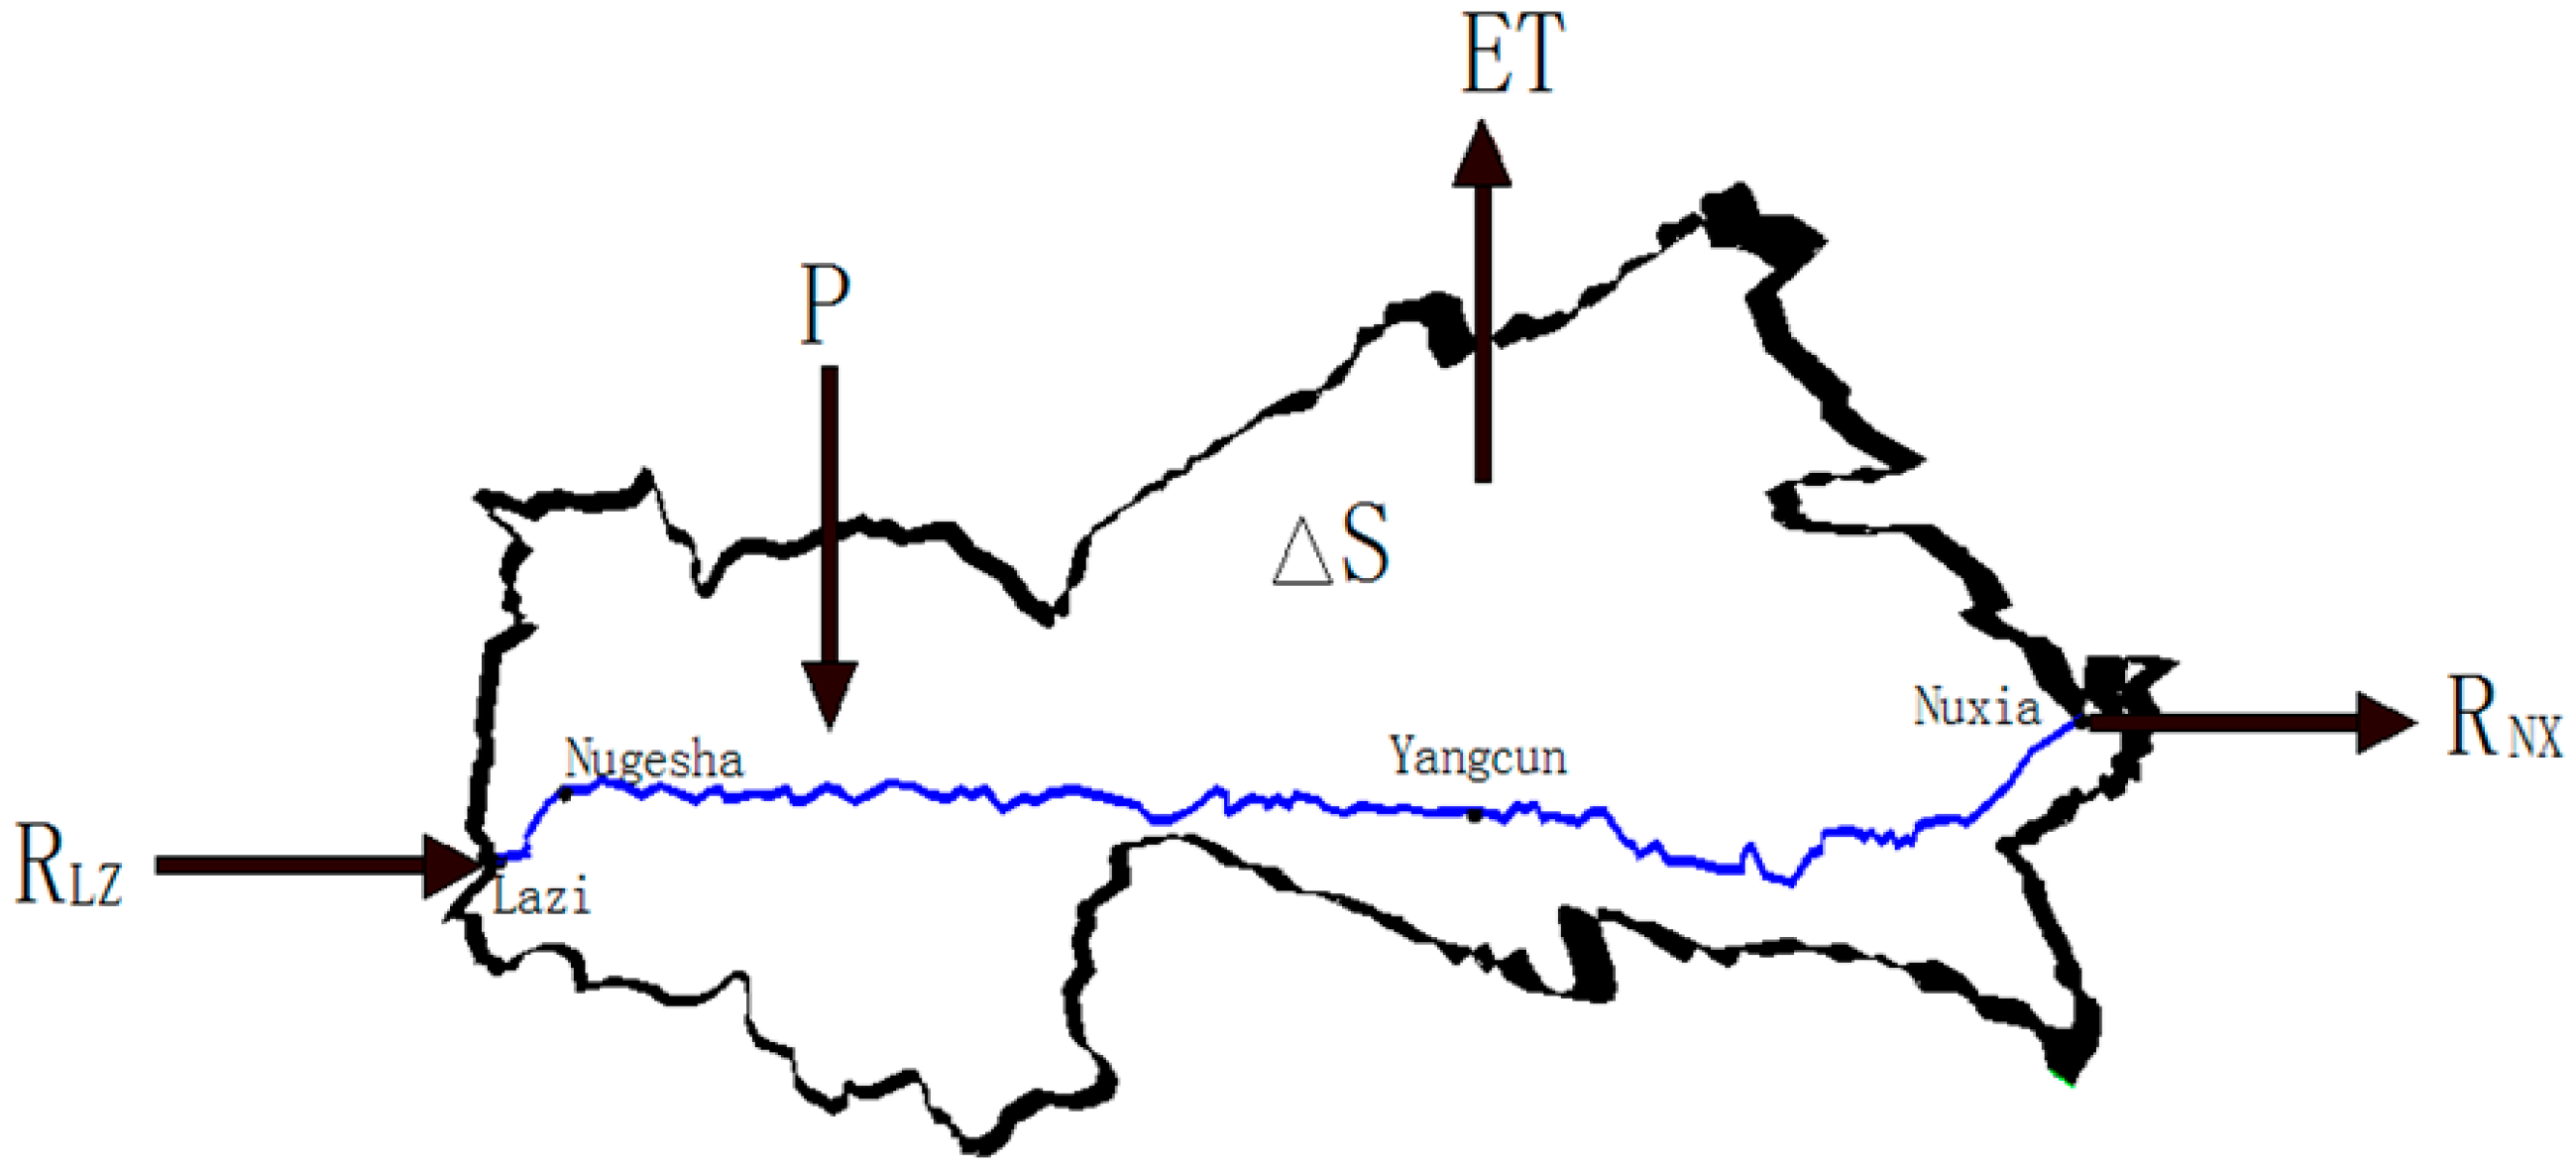
The water balance equation is as follows:
where P is the areal mean rate of precipitation, ET is the areal mean rate of evapotranspiration, R is the total basin runoff, S represents terrestrial water storage observed by GLDAS, and t is the time.
Figure 2 is a Schematic Diagram for the Water Balance Equation. In this paper, the variations are the monthly values for the Yarlung Zangbo River basin. So, ΔS(t) is the water-storage variation between times t1 and t2 (in which the subscripts 1 and 2 refer to the beginning and the end of the month).
Because GLDAS can only provide 3 h and one month’s mean land surface state variables. We used a briefly and efficient way to calculate the ΔS following the method. The ΔS of a month could be denoted as:
The equations of the four statistical parameters are as follows (6)–(9) [27]:
where Mi is runoff calculated from the four models of GLDAS data by using the water balance equation; is the mean runoff during the study period, based on the four models of GLDAS; Oi is the observed runoff from Nuxia gauging station; is the mean runoff from Nuxia gauging station during the study period; and, N is the number of months during the study period.
We used the Brunke ranking method [28] to rank the four datasets from 1 to 4. A ranking of 1 was assigned to the dataset with the lowest BIAS (or lowest σd, or highest R). A ranking of 4 was assigned to the dataset with the largest BIAS (or largest σd, or lowest R). The σr/σobs value closest to 1 was ranked 1, and the value furthest from 1 was ranked 4. The arithmetic mean of each dataset was calculated from the rankings of the four statistical parameters. We then obtained the total ranking scores of these datasets.
3. Results and Discussion
3.1. Characteristics of Observed Climate and Runoff Changes
3.1.1. Characteristics of Observed Precipitation Change during the Past 40 Years
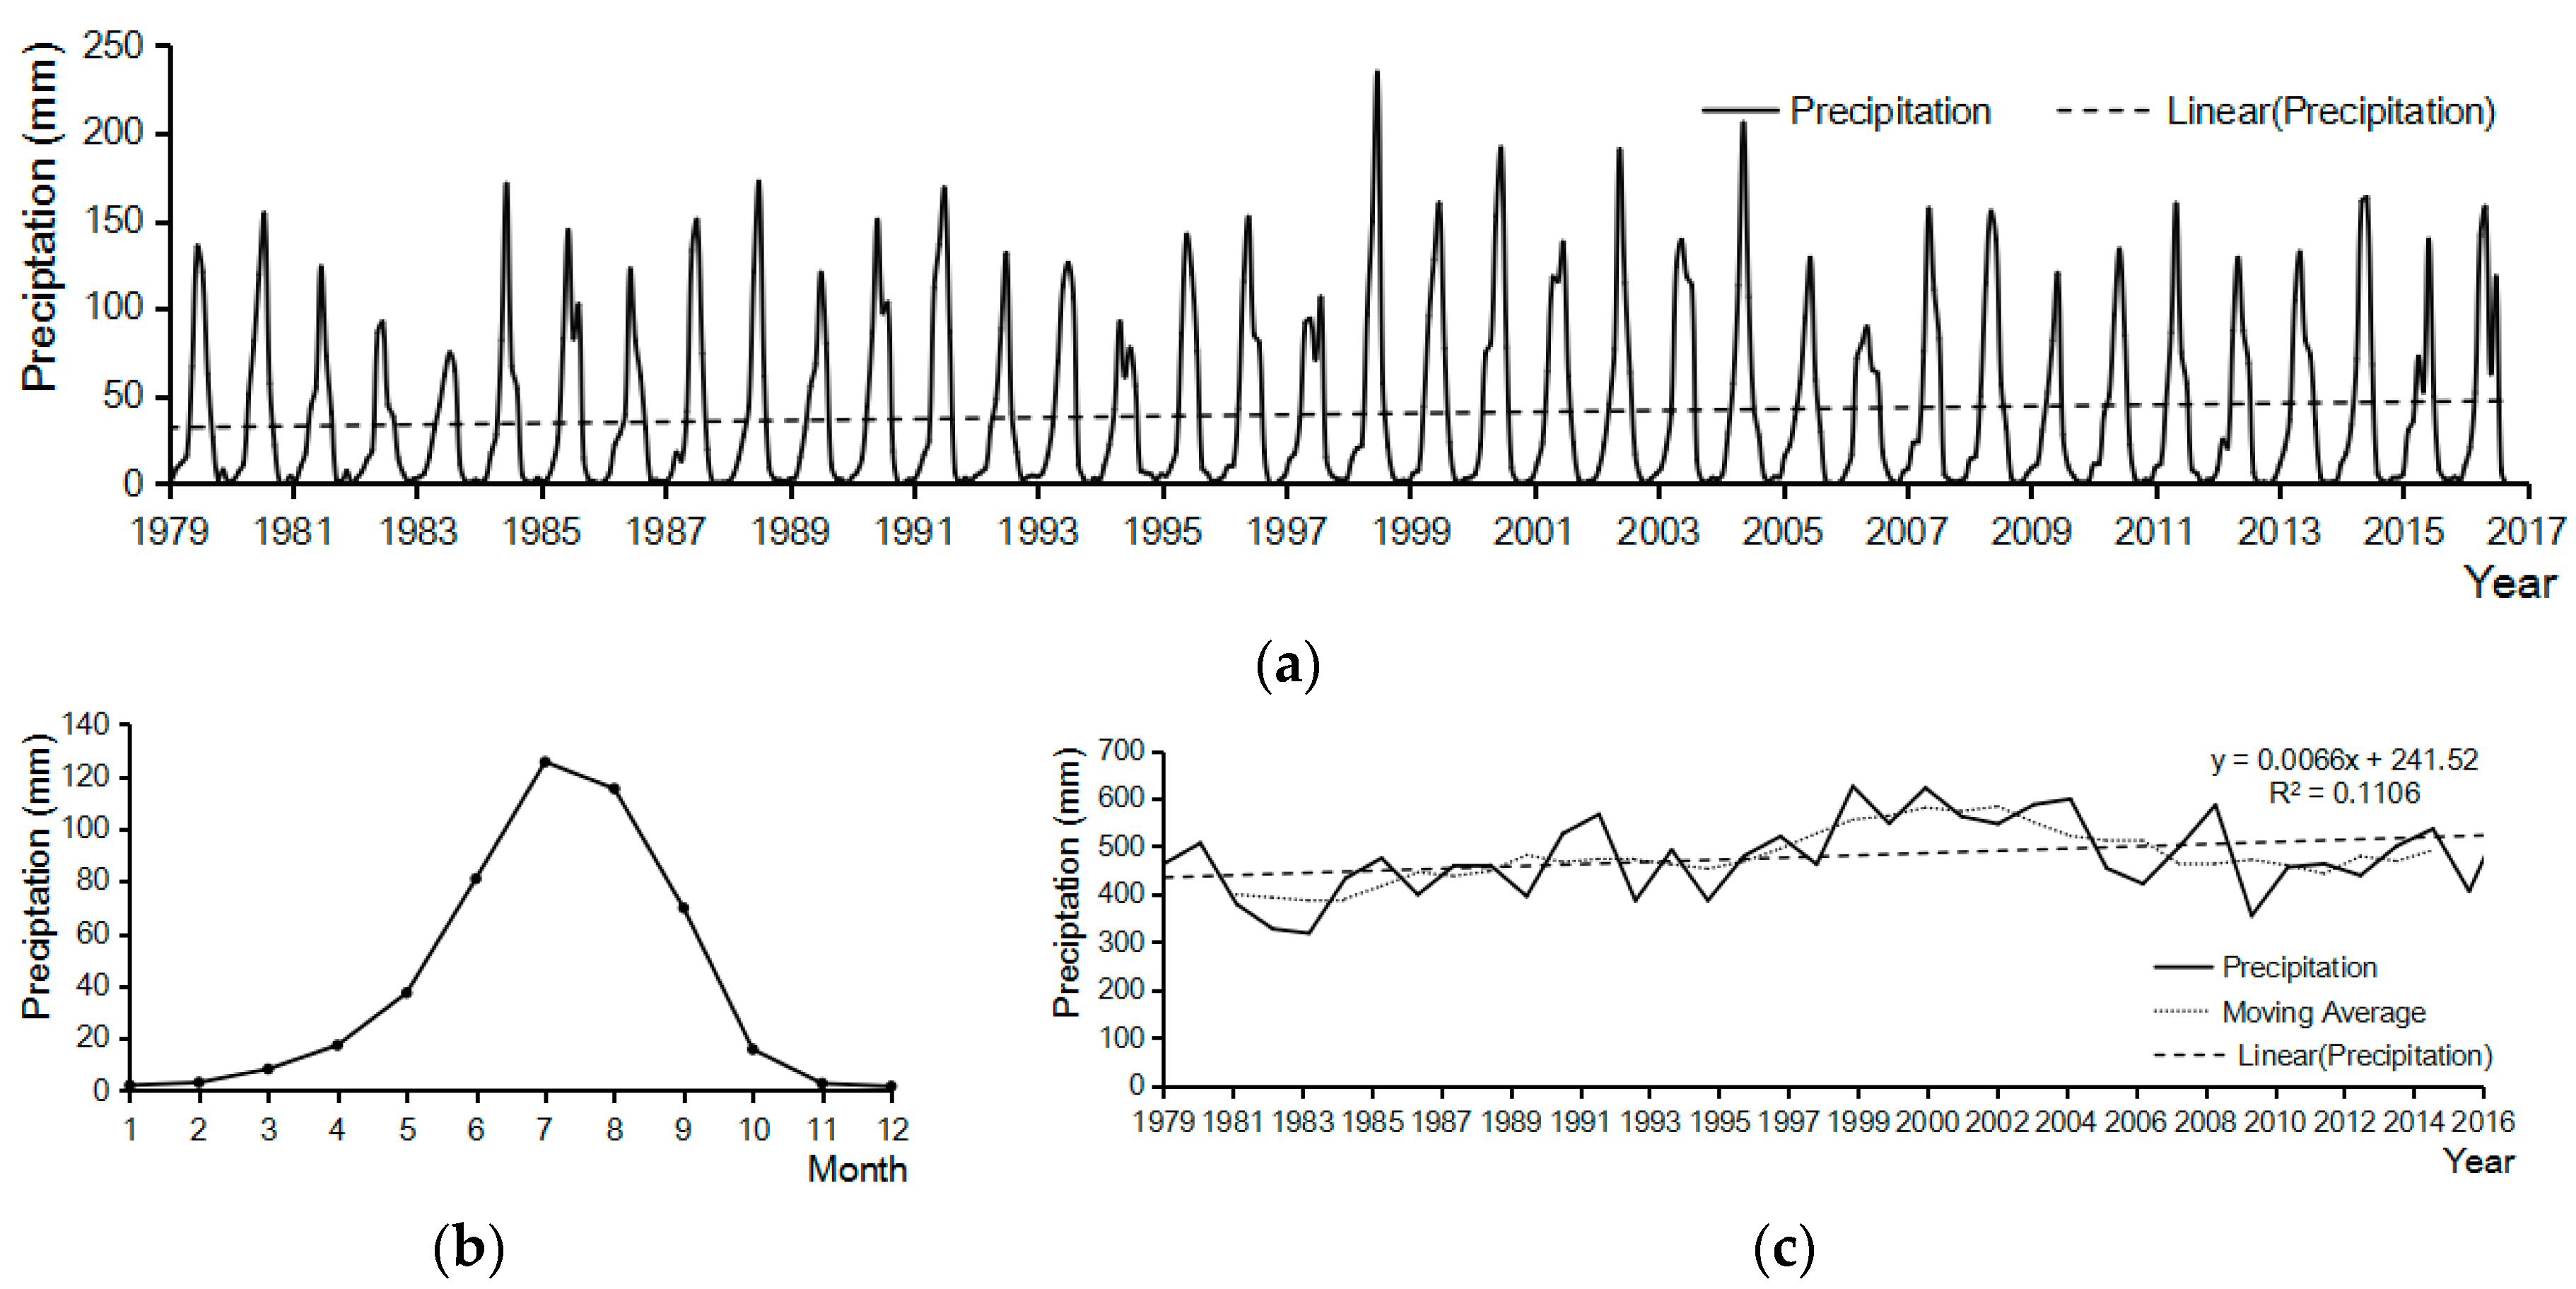
Precipitation changes in the midstream region of the Yarlung Zangbo River basin were analysed for three different time scales. Figure 3a–c show that mean monthly precipitation during the research period exhibited clear cyclical fluctuations of approximately 12 months. However, the peak values differed considerably between years. The mean monthly precipitation was 39.96 mm and fluctuated between 1.61 mm and 125.56 mm. The maximum monthly precipitation occurred in August 1998, whereas no precipitation was recorded in December 1996 and January 2016. In terms of secular mean monthly precipitation, the highest precipitation occurred in July (125.56 mm), and the lowest precipitation occurred in December (1.61 mm). In terms of interannual variation, the mean annual precipitation was 497.50 mm and fluctuated between 318.11 mm and 621.84 mm. The maximum monthly precipitation occurred in 2000, and the minimum monthly precipitation occurred in 1983. The trend of annual precipitation showed a slight increase of approximately 2.3 mm per year during the study period. Based on a 5-year moving average, the lowest mean annual precipitation was 386.53 mm, which occurred from 1981 to 1985, and the highest mean annual precipitation was 580.74 mm, which occurred from 1998 to 2002.
3.1.2. Characteristics of Observed Temperature Change during the Past 40 Years
Figure 4a shows that the mean monthly temperature during the research period also presented a clear cyclical fluctuation, similar to precipitation. The monthly mean temperature was 5.16 °C and fluctuated between −6.82 °C and 15.57 °C. The maximum monthly temperature occurred in July 2009, and the minimum monthly temperature occurred in January 1983. In terms of the secular mean monthly temperature, the highest temperature occurred in July (13.57 °C) and the lowest in January (−3.88 °C). In terms of interannual variation, the mean annual temperature of the study area was 5.61 °C and fluctuated between 4.45 and 6.85 mm. The maximum monthly temperature occurred in 2009, and the minimum monthly temperature occurred in 1983. The annual temperature trend showed a slight increase of approximately 0.035 °C per year. Based on a five-year moving average, it can be concluded that the lowest mean annual temperature was 4.67 °C, which occurred from 1979 to 1983, and the highest mean annual temperature was 6.49 °C, which occurred from 2006 to 2010.
3.1.3. Characteristics of Observed Runoff Change during the Past 20 Years
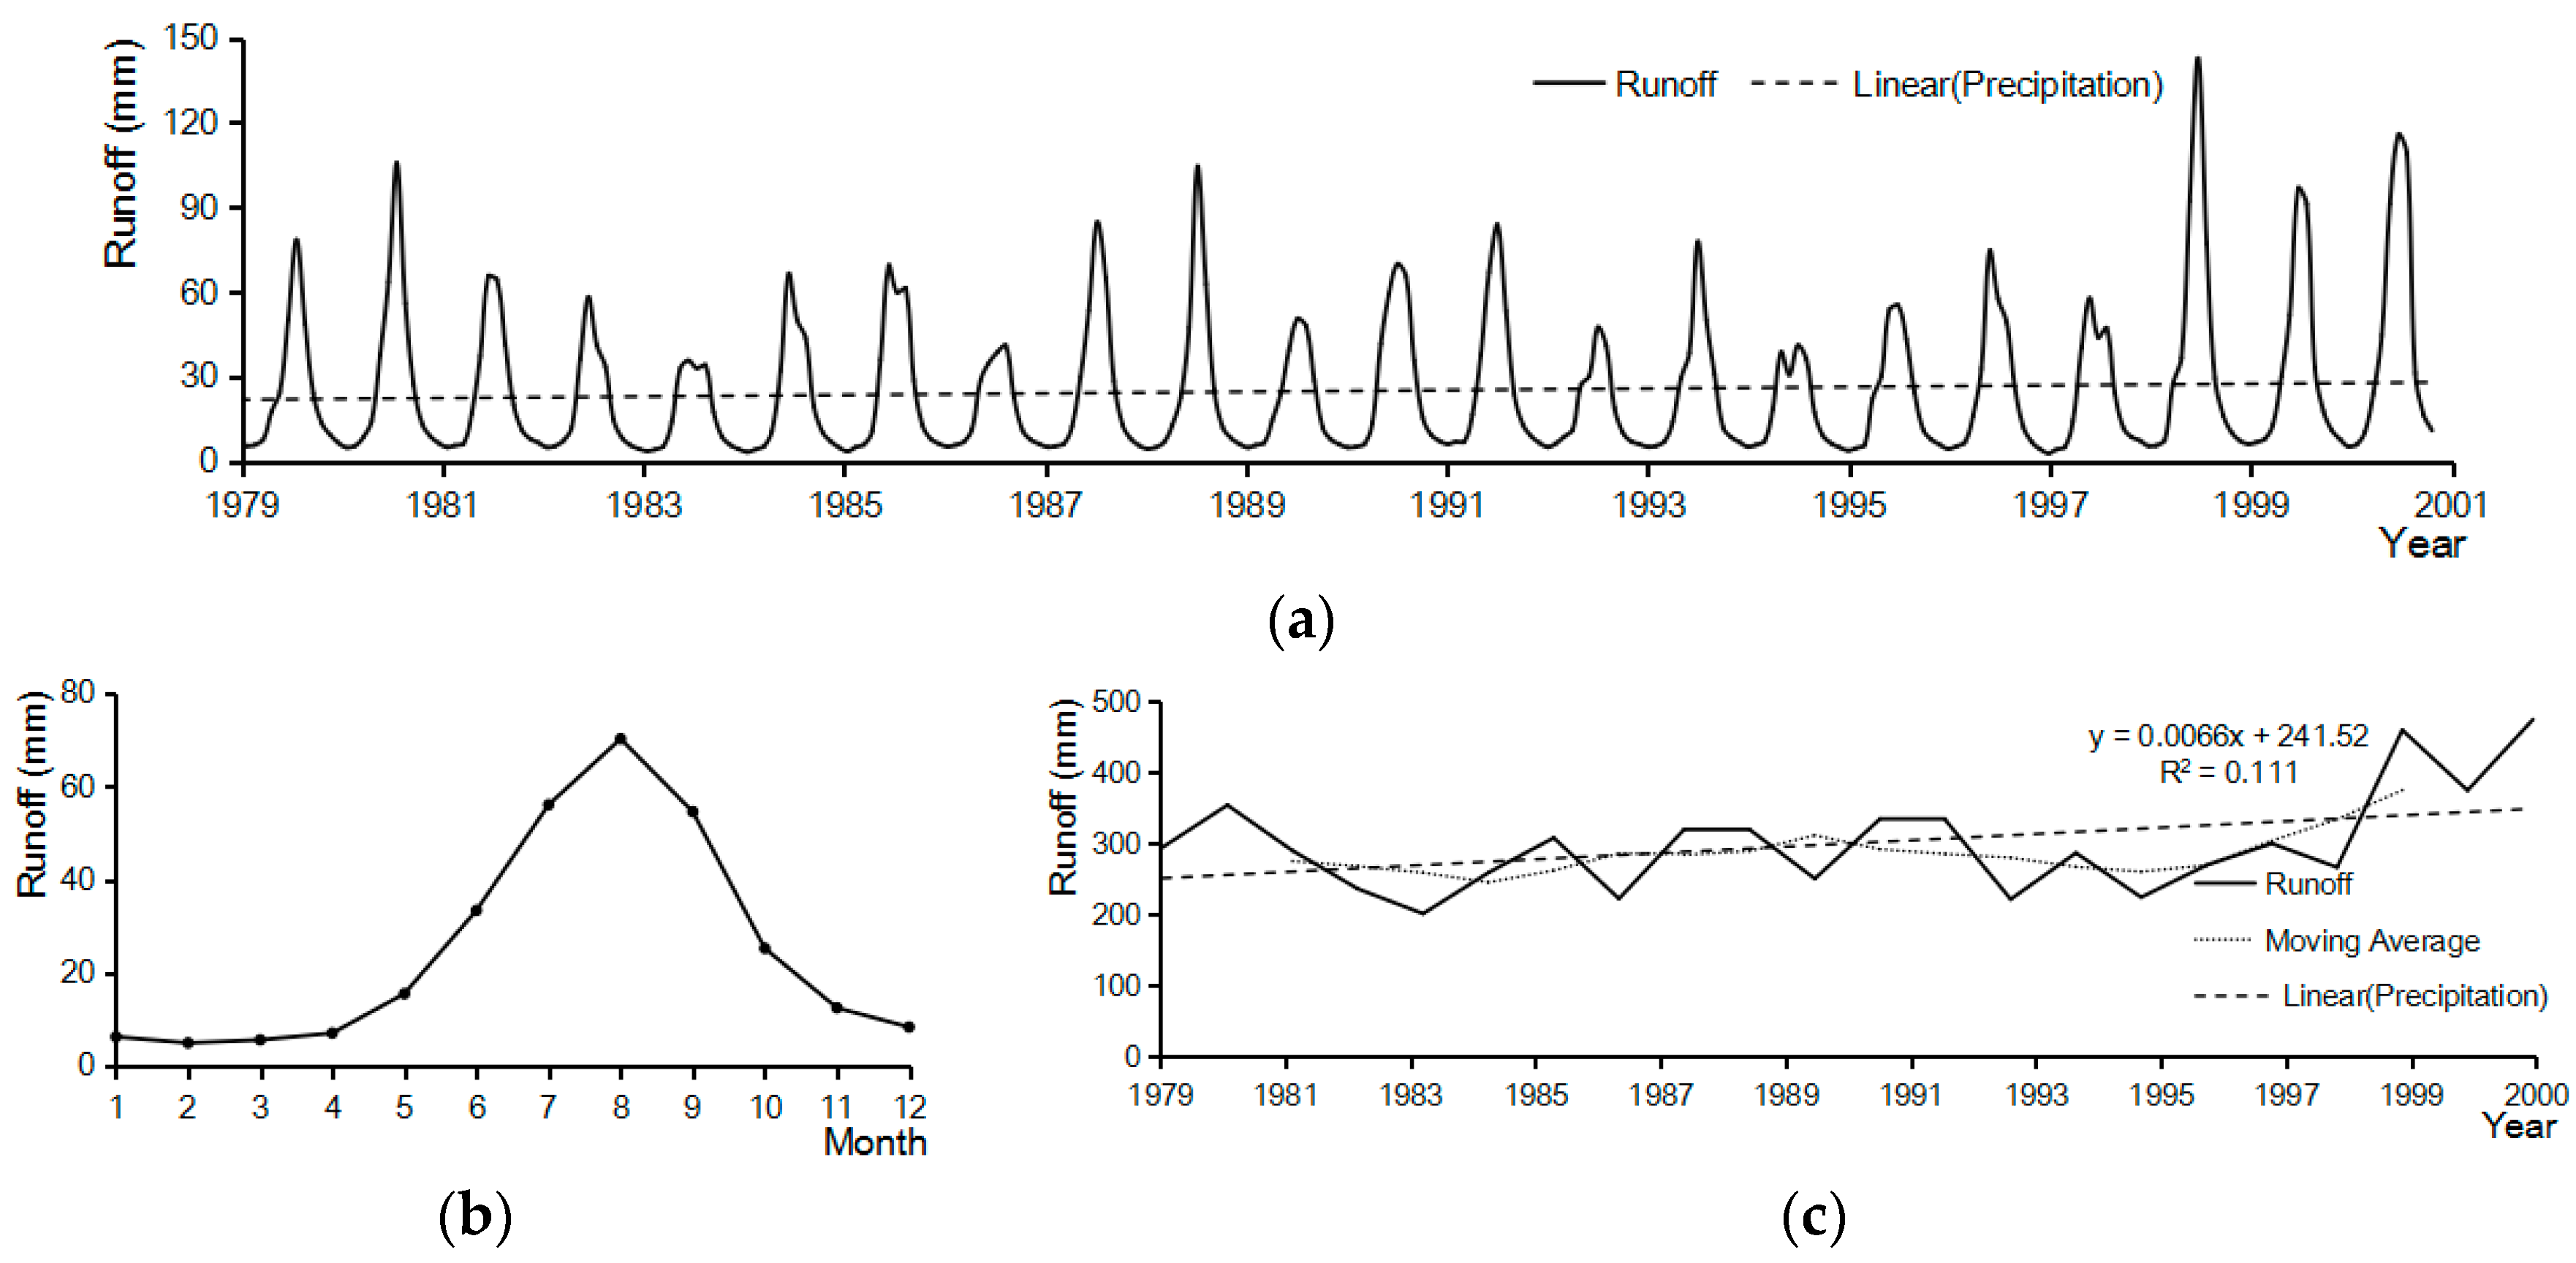
We used the observed monthly runoff data of Nuxia gauging station from January 1979 to December 2000 to validate the results based on the GLDAS. Figure 5a–c show observed runoff for the station for three time scales. It can be concluded that mean monthly runoff presented a clear cyclical fluctuation. Mean monthly runoff during the research period was 25.01 mm and fluctuated between 3.07 and 142.62 mm. The maximum monthly runoff occurred in August 1998, and the minimum monthly runoff occurred in February 1997 (3.07 mm). In terms of the secular mean monthly runoff, the highest runoff occurred in August (70.19 mm), and the lowest runoff occurred in February (5.00 mm). In terms of interannual variation, the mean annual runoff of Nuxia gauging station was 300.08 mm and fluctuated between 201.41 mm and 474.52 mm. The maximum annual runoff occurred in 2000, and the minimum runoff occurred in 1983. The trend of annual runoff showed a slight increase of 0.035 mm per year. This result is consistent with other research [29]. Based on a five-year moving average, the lowest runoff was 245.46 mm, which occurred from 1982 to 1986, and the highest runoff was 375.10 mm, which occurred from 1996 to 2000.
3.2. Applicability Analysis of GLDAS Data
3.2.1. Applicability Analysis of GLDAS Precipitation Data
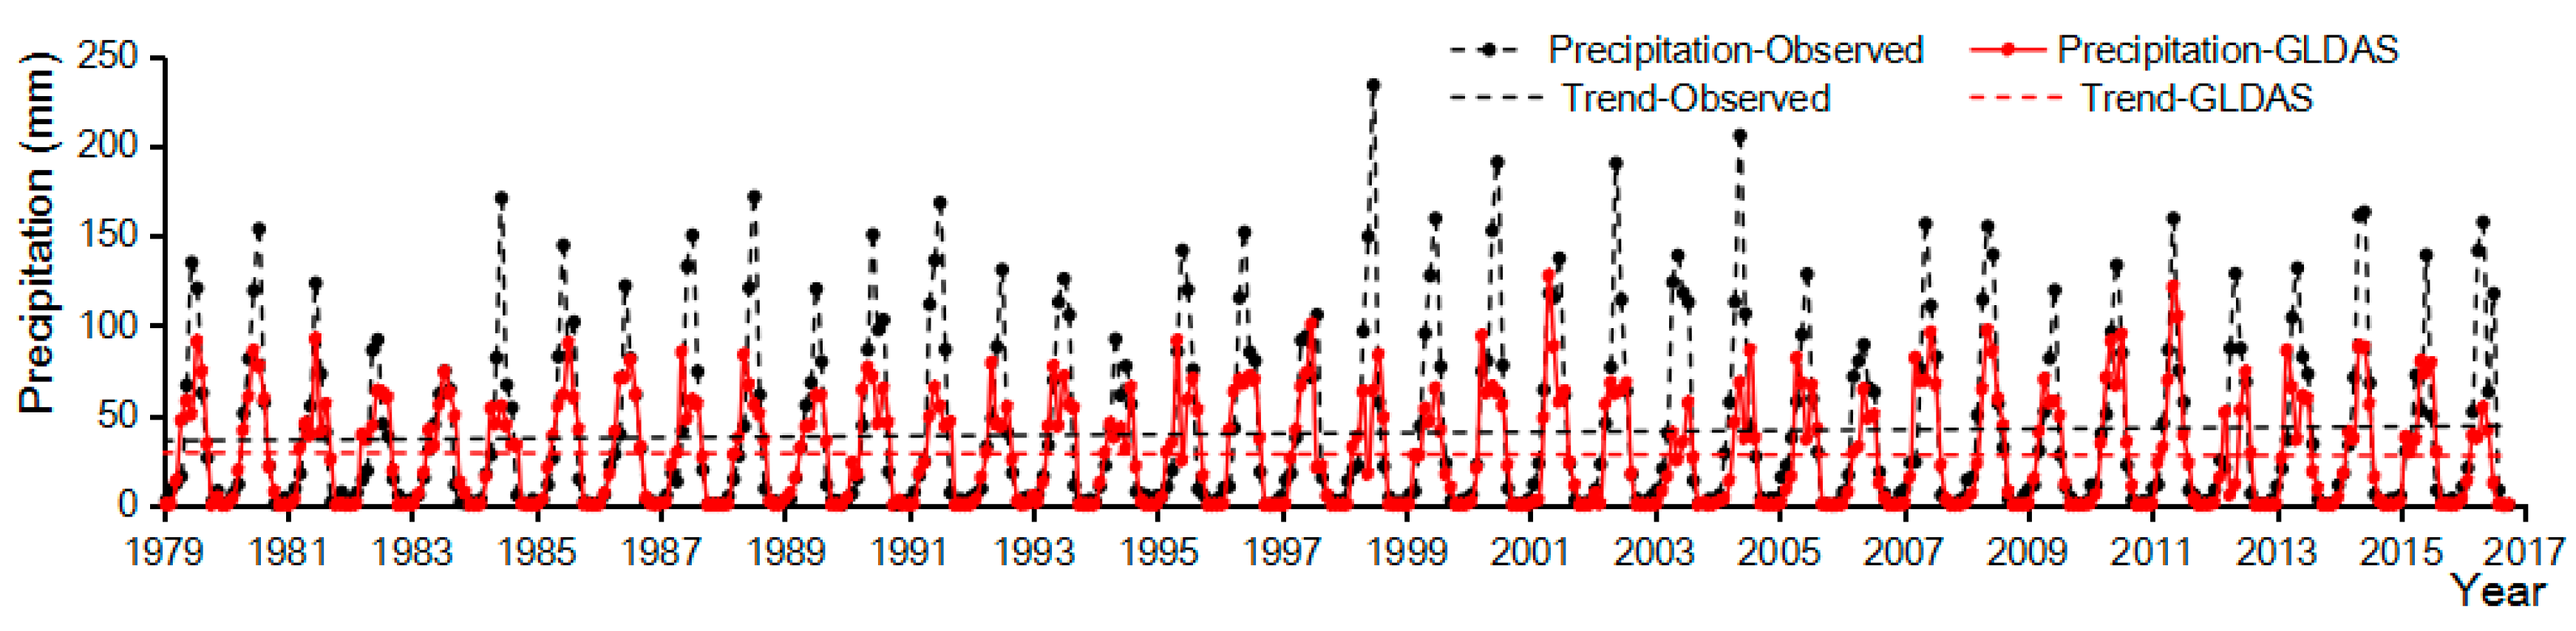
Because all four GLDAS data models have the same precipitation and temperature input data, we used GLDAS-MOS model data for comparison with observed data. Figure 6 indicates that GLDAS mean monthly precipitation during the research period presented the same clear cyclical fluctuation as that for observed precipitation. However, the amplitude of observed precipitation was significantly higher than the GLDAS precipitation. A root mean square error of 34.35 mm was recorded between the GLDAS and observed mean monthly precipitation from 1979 to 2016. Correlation analysis of the two data sets (Figure 7) indicated that GLDAS mean monthly precipitation from 1979 to 2016 was moderately correlated with observed precipitation, and the correlation coefficient was 0.75. Strong correlations were observed between GLDAS and observed precipitation from January to June and from September to December, with respective correlation coefficients of 0.98 and 0.96. However, there were big differences between GLDAS and observed precipitation in July and August; the mean monthly observed precipitation was higher than the GLDAS precipitation, and the correlation coefficient was very low. The above analysis shows that GLDAS precipitation data have a good applicability in the Yarlung Zangbo River basin within a certain time period. However, the quality of the July and August data needs to be improved. So, in the follow-up study, we should take measures to improve calculation method and mothod to extract data to improve data quality and precision of GLDAS.
3.2.2. Applicability Analysis of GLDAS Temperature Data
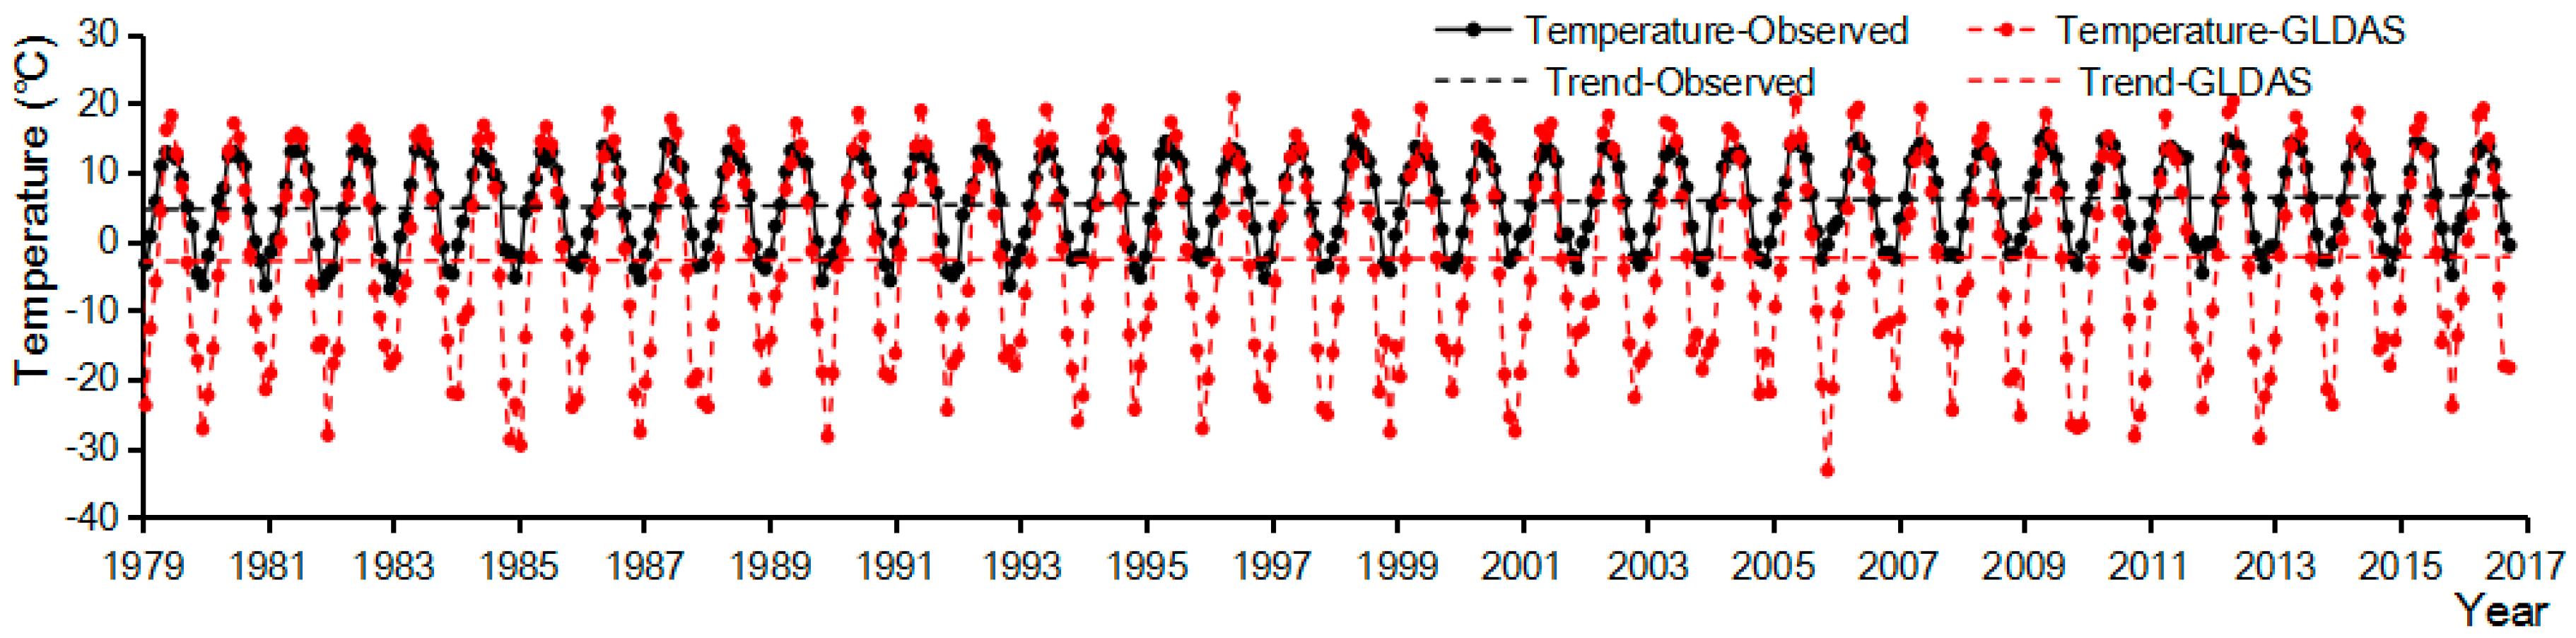
Figure 8 shows the GLDAS and observed temperature change from 1979 to 2016. It can be concluded that the GLDAS mean monthly temperature during the research period presented the same clear cyclical fluctuation as the observed temperature. However, the amplitude of the observed temperature was significantly lower than that of the GLDAS temperature. The root mean square error between GLDAS and observed mean monthly temperature from 1979 to 2016 was 11.57 °C. Correlation analysis of the two data sets (Figure 9) indicated that the GLDAS mean monthly temperature from 1979 to 2016 was highly correlated with observed temperature, with a correlation coefficient of 0.94. This result shows that GLDAS data can reproduce observed temperature changes in the study period. However, there was a big difference between the GLDAS and the observed temperature from November to February of the next year. The observed mean monthly temperature was higher than the GLDAS temperature, and the correlation coefficient was very low. The above analysis shows that GLDAS temperature data have a good applicability to the midstream region of the Yarlung Zangbo River basin within a certain time period. However, the quality of data from November to February of the next year needs to be improved. We also should take measures to improve data quality and precision of GLDAS in the follow-up study.
3.2.3. Applicability Analysis of GLDAS Runoff Data
Figure 10 presents the time series of mean monthly runoff based on the 4 GLDAS models and the observed runoff for Nuxia gauging station. It must point that the runoff values calculated in this paper are relative values relative to secular mean monthly runoff. Hence, there exists negative runoff in the text and Figure 10. It can observed that runoff from the 4 GLDAS models presented similar fluctuations and significant seasonal variability when compared with observed runoff. However, there were also some differences. The peak runoff values from the four GLDAS models were in good agreement, and the runoff amplitude of each GLDAS model was higher than the observed runoff. To quantitatively describe runoff variations, we adopted the least square method to fit the annual amplitude, cycle, phase and linear trend of the total runoff time series for each dataset. The result (Table 1) shows that all 4 datasets had similar change cycles of approximately 12 months compared with the observed runoff for Nuxia gauging station. The GLDAS-MOS based result had the highest annual amplitude of 91.91 mm water equivalent. In addition, the GLDAS model-based runoff values were considerably different from the observed runoff in terms of the phase. Observed runoff occurred later than GLDAS-based runoff. The reason for this off is that result of observed runoff presented is a value after a series of complex process, namely rainfall, evapotranspiration, surface and subsurface runoff, infiltration, et al. So, it will take a long time for all forms of water to converge to the exit section of the river basin. However, result of GLDAS presented is relativly simpler. The terrestrial water storage change (ΔS(t)) was represented only by the sum of soil moisture change and the snow water equivalent change. Hence, there exists one or two month’s off when compared with the observed runoff. With respect to the linear trend, runoff from the Yarlung Zangbo River basin increased slightly during the research period for all five datasets.
Table 2 presents four statistical parameters between the 4 datasets and observed runoff, as well as average ranking scores from these datasets. The results show that GLDAS-Noah-based products best represented time series of observed runoff, except for BIAS. The total Brunke ranking scores of the four datasets were 2.75, 1.75, 2.50, and 3.00, respectively. Hence, the result shows that GLDAS-Noah-based runoff data were closer to observed runoff compared with the three other GLDAS models.
3.3. Impact of Climate Change on Runoff
Climate change affects hydrological cycles locally and globally [30]. From precipitation and temperature and runoff curves under three time scales, from 1979 to 2000, over midstream of the Yarlung Zangbo river basin. It can be concluded that changes in runoff were very similar to precipitation and temperature changes: the high flow period was consistent with high precipitation and temperature, and the low flow period was consistent with low precipitation and temperature. July and August were the peak periods for mean monthly rainfall, temperature and runoff, and December and January exhibited the lowest mean monthly rainfall, temperature and runoff each year. At the annual time scale, the lowest amount of runoff was consistent with the lowest mean annual precipitation and temperature. For instance, in the midstream region of the Yarlung Zangbo River basin, 1983 was the driest year during the research period, with a mean annual runoff of 201.41 mm, mean annual precipitation of 318.11 mm, and a mean annual temperature of 4.45 °C. On the contrary, the year with the highest amount of runoff had the highest mean annual precipitation and temperature. For instance, 1998 was the wettest year in this region during the research period; the mean annual runoff was 459.58 mm, the mean annual precipitation was 625.17 mm, and the mean annual temperature was 6.34 °C.
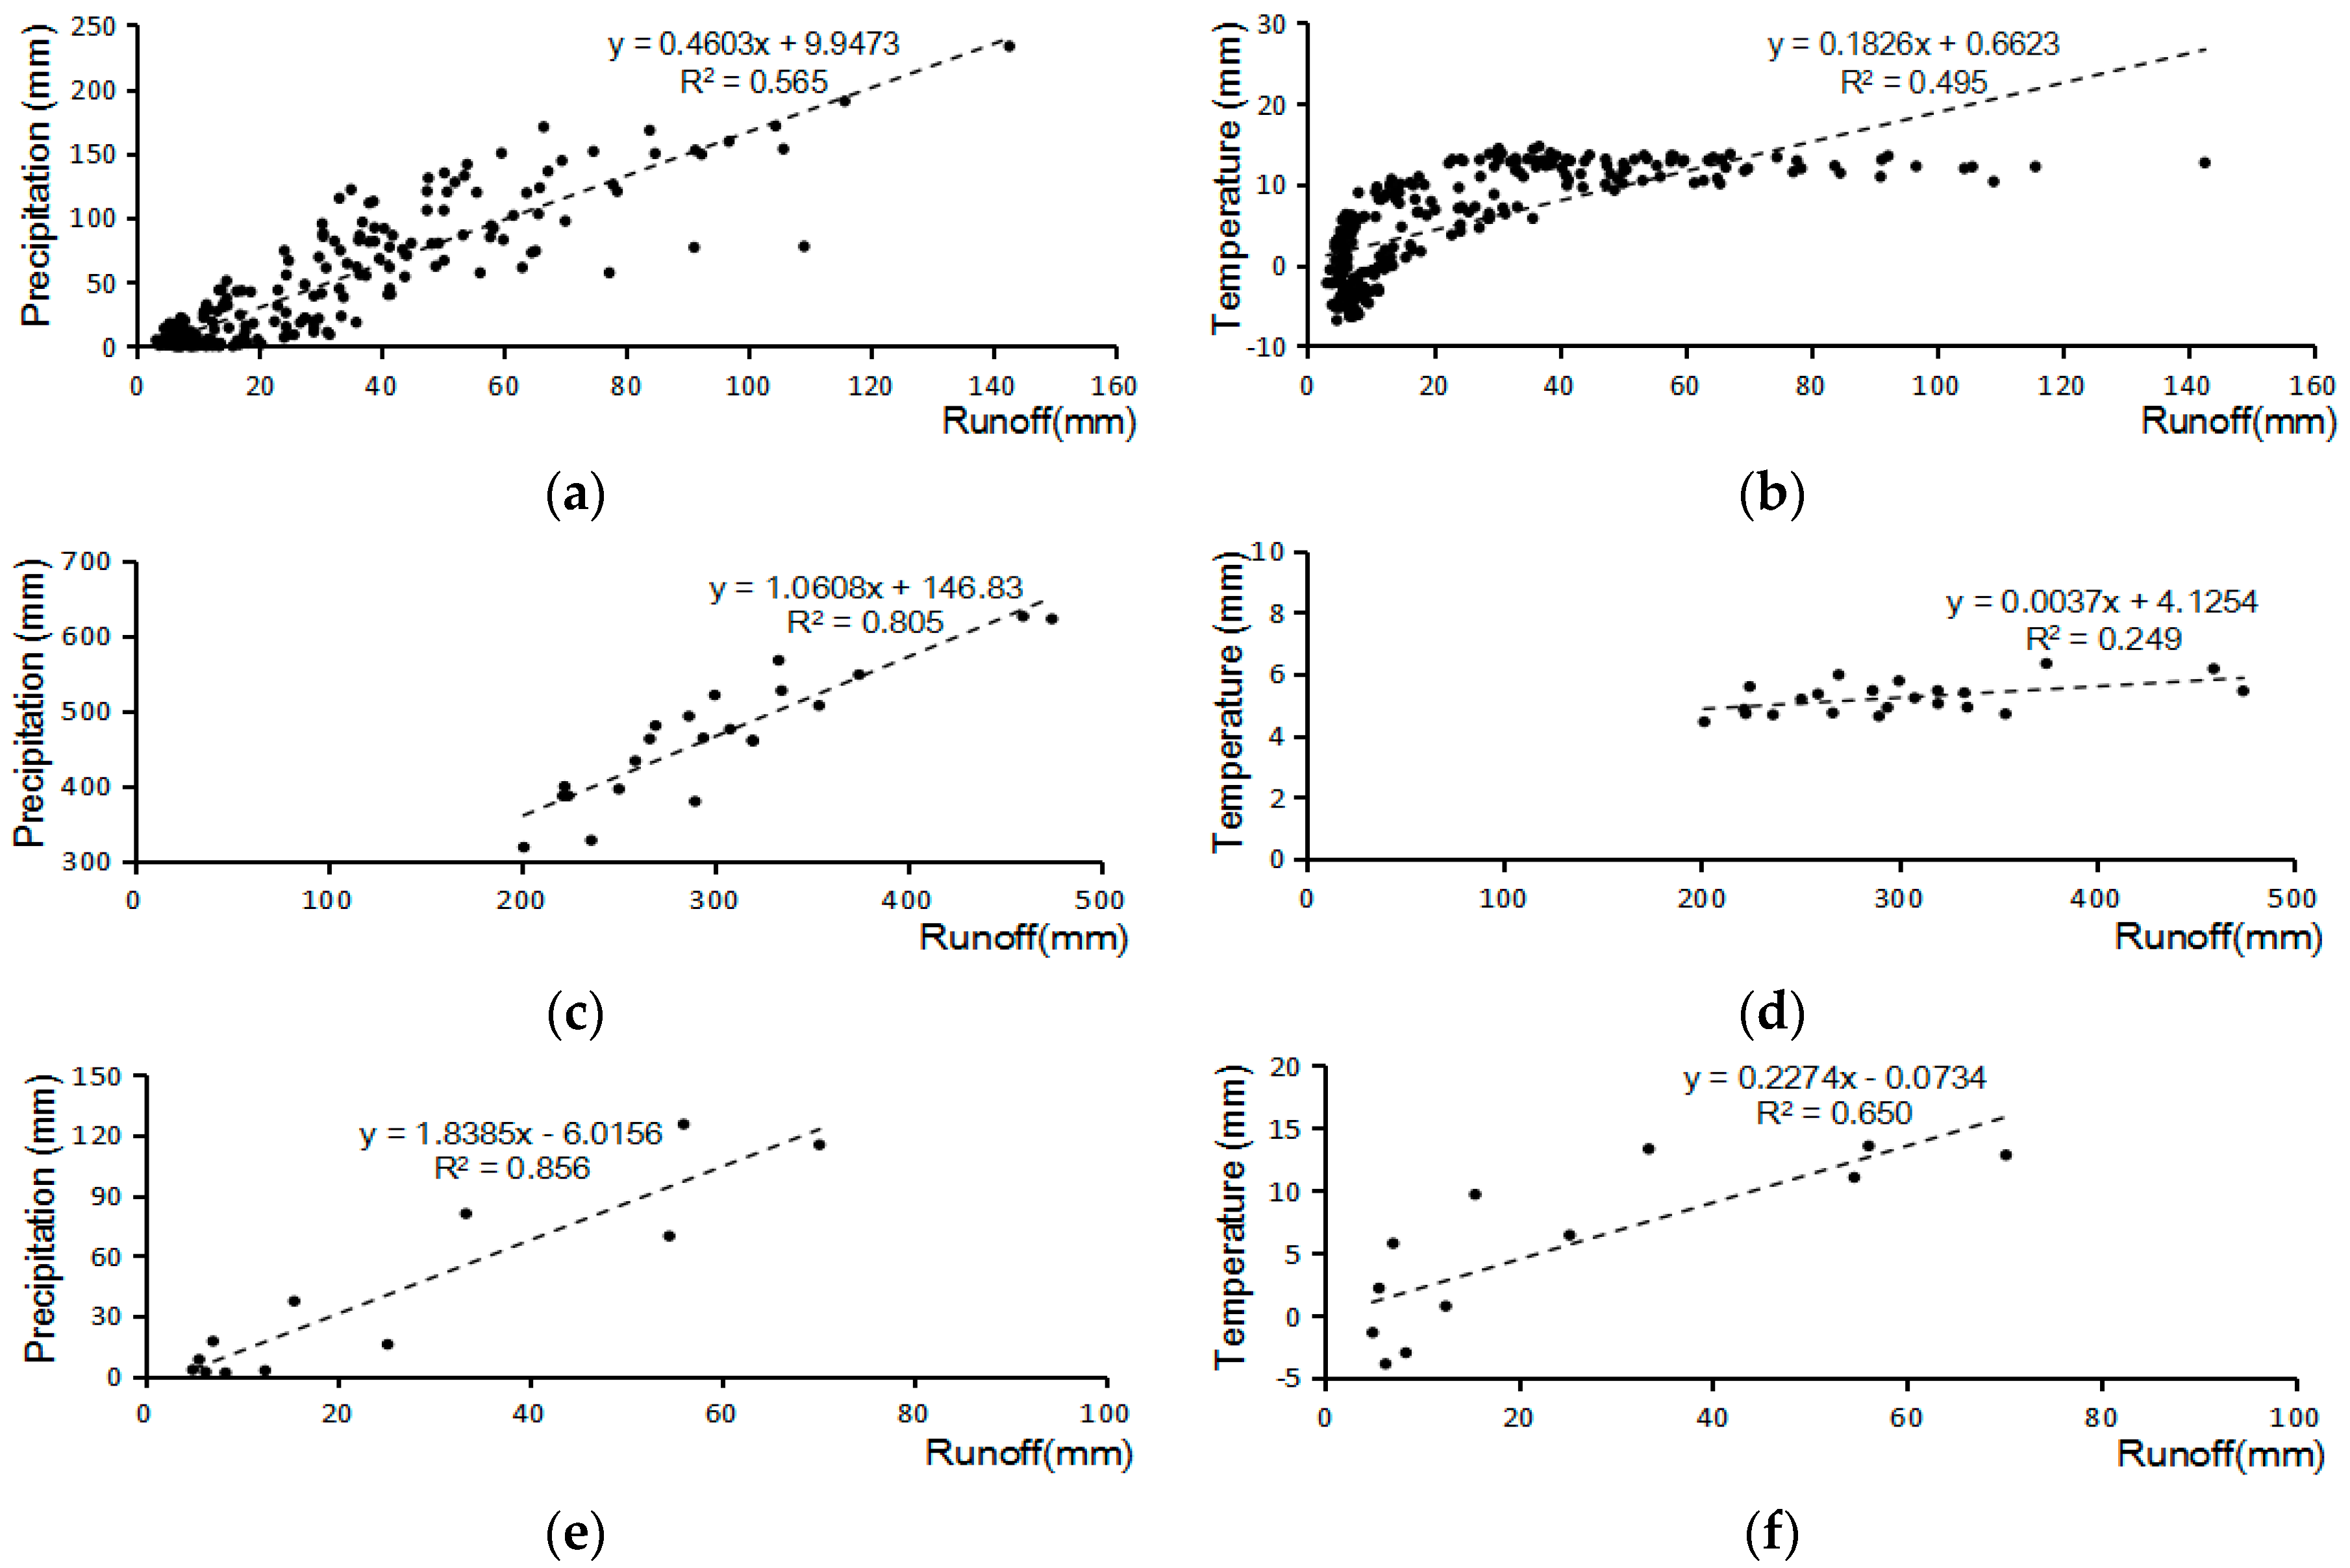
A relationship was determined between precipitation, temperature, and runoff. Figure 11 shows the correlation between monthly, annual, and secular mean monthly climate factors and runoff, and Table 3 shows the corresponding correlation coefficients at different time scales. The correlation coefficients between precipitation and runoff at monthly, annual and secular mean monthly scales were 0.752, 0.897 and 0.925, respectively, and all three passed the significance test at the 0.001 level. The correlation coefficients between temperature and runoff at the three time scales were 0.704, 0.499, and 0.806, and all three also passed the significance test at the 0.001 level. These results indicate that the correlation coefficients between precipitation and runoff at the three time scales were higher than the correlation coefficients between temperature and runoff. Secular mean monthly precipitation had the strongest relationship with secular mean monthly runoff. This means that precipitation is the most important factor that affects natural runoff changes in the midstream region of the Yarlung Zangbo River basin, and rainfall can control the evolution of the river to some degree.
4. Conclusions
This paper used observed data to analyse the characteristics of temperature, precipitation and runoff changes in the midstream region of the Yarlung Zangbo River basin. In order to enrich data material for this data-limited basin, the GLDAS was selected to provide alternative climate and hydrological data, and expect to provide reference for the fellow-up studies. The main results of this research are as follows:
- (1)
- Under the background of global warming, precipitation, temperature, and runoff changed significantly, and showed certain regularity during the research period. Based on the three time scales, we observed that mean monthly precipitation, temperature and runoff presented clear cyclical fluctuations of approximately 12 months. The highest secular mean monthly values occurred in July and August, and the lowest values occurred in December and January. The annual precipitation, temperature, and runoff trends showed slight increases during the study period. The maximum mean annual values occurred in 1998 and 1999, and the minimum mean annual values occurred in 1983. These analyses indicate that changes in precipitation, temperature, and runoff during the research period exhibited strong consistency.
- (2)
- A comparison of observed precipitation and temperature with GLDAS climate data indicated that the GLDAS data have good applicability in the midstream region of the Yarlung Zangbo River basin. The GLDAS mean monthly precipitation and temperature presented the same clear cyclical fluctuation as the observed climate values. The GLDAS mean monthly precipitation was moderately correlated with observed precipitation, with a correlation coefficient of 0.75. The GLDAS mean monthly temperature was highly correlated with observed temperature, with a correlation coefficient of 0.94. This shows that GLDAS temperature data can be used to reproduce observed temperature in the study period. However, the quality of precipitation data from July to August and of temperature data from November to February of the next year needs to be improved.
- (3)
- A comparison of observed and GLDAS-based runoff data indicated that runoff from the four GLDAS models had similar fluctuations and significant seasonal variability compared with observed runoff during the study period. All four datasets had similar change cycles of approximately 12 months compared with observed runoff for Nuxia gauging station, and runoff from the Yarlung Zangbo River basin increased slightly during the study period. However, the amplitudes of each GLDAS model were higher than those of observed runoff, and observed runoff occurred later than GLDAS-based runoff. The Brunke ranking method showed that the total ranking scores of the four GLDAS models were 2.75, 1.75, 2.50, and 3.00, respectively. Hence, it can be concluded that GLDAS-Noah-based runoff data are closer to observed runoff data for Nuxia gauging station compared with the three other GLDAS models.
- (4)
- Runoff from the Yarlung Zangbo River basin is strongly affected by climate change. Correlation coefficients between precipitation and runoff for the 3 time scales were higher than those between temperature and runoff. Secular mean monthly precipitation had the strongest relationship with runoff. This means that a change in precipitation is the most important factor that affects natural runoff changes in the midstream region of the Yarlung Zangbo River basin. Rainfall can control the evolution of the river to some degree.
Based on observed and GLDAS climate and hydrology data, the relationship between runoff and climate change characteristics, the applicability of GLDAS data and the impact of climate factors on runoff data were quantitatively analysed. In conclusion, under the background of global warming, the climate and hydrological elements in the study period showed significant regularity changes. Rainfall is the main factor that impacts runoff change in this area. To the whole study period, GLDAS is not a good system to describe the land surface conditions of the Yarlung Zangbo River basin. However, within a certain time period, GLDAS data have a good applicability in the Yarlung Zangbo River basin. To some extent, it could be a good supplement of climate and hydrology data to data limited areas. We need to take measures to improve data quality and the precision of GLDAS in the follow-up study. However, some problems exist. The Yarlung Zangbo River is an important international river that has the highest mean altitude in China. The number of climate and hydrological gauging stations is limited because of the complex terrain and environment. Certain results and the applicability of GLDAS in this period are limited because the time series are short and the data quality is poor. Hence, the selection of an alternative dataset specifically aimed at the Yarlung Zangbo River basin has certain limitations. This problem results in a degree of uncertainty in this study. In addition, with increasing human interference in the river, how to reduce the impacts of the underlying surface and other human activities will become the focus of future work when discussing the impact of climate change on runoff.
Acknowledgments
This work was funded by the National Natural Science Foundation of China (No. 91547211) and the National Key R&D Program of China (No. 2016YFC0502200). The authors also would like to thank China meteorological data service center providing meteorological data and the GES DISC providing GLDAS data. The work of these scientists is the basis for our investigations.
Author Contributions
Hong Zhang, Ling Lei Zhang and Jia Li conceived and designed the study; Rui Dong An provided data and analysis tools; Hong Zhang, Ling Lei Zhang and Jia Li analyzed the data; Hong Zhang wrote the paper; and all of the authors polished the writing.
Conflicts of Interest
The authors declare no conflict of interest.
References
- Guo, J. Research on the Impact of Climate Change on Watershed Water Cycle and Water Resource; Wuhan University: Wuhan, China, 2010. [Google Scholar]
- IPCC (Intergovernmental Panel on Climate Change). Synthesis Report; Cambridge University Press: Cambridge, UK, 2001. [Google Scholar]
- IPCC (Intergovernmental Panel on Climate Change). Climate Change: The IPCC Impacts Assessment; AGPS Press: Canberra, Australia, 2001. [Google Scholar]
- IPCC (Intergovernmental Panel on Climate Change). Impacts, Adaptations and Mitigation of Climate Change: Scientific Technical Analyses; Cambridge University Press: Cambridge, UK, 1995. [Google Scholar]
- IPCC (Intergovernmental Panel on Climate Change). Synthesis Report; Cambridge University Press: Cambridge, UK, 2007. [Google Scholar]
- Animesh, K.G.; Gain, C.; Fabrice, G. Renaud Climate Change Adaptation and Vulnerability Assessment of Water Resources Systems in Developing Countries: A Generalized Framework and a Feasibility Study in Bangladesh. Water 2012, 4, 345–366. [Google Scholar] [CrossRef] [Green Version]
- Lisa, J.L.; Joel, D.G.; Vernon, L.S. Climate Change and Classic Maya Water Management. Water 2011, 3, 479–494. [Google Scholar] [CrossRef]
- National Research Council. Climate, Climate Change and Water Supply; National Academy Press: Washington, DC, USA, 1977. [Google Scholar]
- Dong, L.H.; Xiong, L.H.; Yu, K.X.; Li, S. Research advances in effects of climate change and human activities on hydrology. Adv. Water Sci. 2012, 23, 278–285. [Google Scholar]
- Zhao, X.S.; Zhou, H.; Wang, W.C. Research Progresses of Impacts of the Climate Change on the Regional Hydrological Cycle System. J. North China Inst. Water Conserv. Hydroelectr. Power 2012, 33, 46–49. [Google Scholar]
- Zhang, L.P.; Chen, X.F.; Zhao, Z.P.; Hu, Z. Progress in Study of Climate Change Impacts on Hydrology and Water Resources. Prog. Geogr. 2008, 27, 60–67. [Google Scholar]
- Wang, G.Q.; Zhang, J.Y.; Liu, J.F.; Li, Y.; He, R.M. Review of impacts of climate change on hydrology and water resources. Adv. Water Sci. 2008, 2, 47–51. [Google Scholar]
- Bai, L.Y.; Rong, Y.S. Impacts of climate on water resources in source regions of Yangtze River and Yellow River. Water Resour. Prot. 2012, 28, 46–50. [Google Scholar]
- Tang, F.F.; Xun, Z.X.; Zuo, D.P. Response of Runoff to Climate Change in the Upper Yellow River Basin. Resour. Sci. 2012, 34, 1079–1088. [Google Scholar]
- Wang, G.Q.; Li, M.; Jin, J.L.; Liu, C. Variation Trend of Runoff in Fujiang River Catchment and Its Responses to Climate Change. J. China Hydrol. 2012, 32, 22–28. [Google Scholar]
- Jiao, K.Q.; Ye, B.S.; Han, T.D.; Jin, Z.; Yang, H.A. Response of Runoff to Climate Change in the Glacier NO.1 at the Headwater of Urumpi River, Tianshan Mountains during 1980–2006. J. Glaciol. Geocryol. 2011, 33, 606–611. [Google Scholar]
- Li, X.; Gao, Y.H.; Wang, W.Z.; Lan, Y.; Xu, J.; Li, K. Climate changes and applicability of GLDAS in the headwater of the Yellow River Basin. Adv. Earth Sci. 2014, 29, 531–540. [Google Scholar]
- Nie, N.; Zhang, W.C.; Deng, C. Spatial and Temporal Climate Variations from 1978 to 2009 and their Trend Projection over the Yarlung Zangbo River Basin. J. Glaciol. Geocryol. 2012, 34, 64–71. [Google Scholar]
- Li, Z.L.; Xu, Z.X.; Gong, T.L. Characteristics of runoff variationin the Yarlung Zangbo River basin. Geogr. Res. 2008, 27, 353–361. [Google Scholar]
- Xu, P.K. Study on Glacier&Groundwater Mass Changes of Yarlung Zangbo River Basin in the Recent Years; Nanjing University: Nanjing, China, 2013. [Google Scholar]
- Fang, H.L.; Beaudoing, H.K.; Rodell, M.; Teng, W.; Vollmer, B.E. Global Land Data Assimilation System (GLDAS) products, services and application from NASA Hydrology Data and Information Services Center (HDISC). In Proceedings of the ASPRS 2009 Annual Conference, Baltimore, MD, USA, 1–9 March 2009. [Google Scholar]
- Wang, Y.J.; Wang, S.D.; Song, W.L.; Yang, S. Application of GLDAS data to the potential evapotranspiration monitoring in Weihe River Basin. J. Arid Land Resour. Environ. 2013, 27, 54–58. [Google Scholar]
- Rodell, M.; Houser, P.R.; Jambo, R.U.; Gottschalck, J.; Mitchell, K.; Meng, C.; Arsenault, K.; Cosgrove, B.; Radakovich, J.; Bosilovich, M.; et al. The global land data assimilation system. Bull. Am. Meteorol. Soc. 2004, 85, 381–394. [Google Scholar] [CrossRef]
- Wang, W.; Wang, X.J.; Wang, P. Assessing the applicability of GLDAS monthly precipitation data in China. Adv. Water Sci. 2014, 25, 769–778. [Google Scholar]
- Wang, X.J.; Wang, W.; Wang, P. Assessing Applicability of GLDAS Monthly Temperature Data in China. Water Res. Power 2014, 32, 10–14. [Google Scholar]
- Brunke, M.A.; Fairall, C.W.; Zeng, X.B.; Eymard, L.; Curry, J.A. Which bulk aerodynamic algorithms are least problematic incomputing ocean surface turbulent fluxes. J. Clim. 2003, 16, 619–635. [Google Scholar] [CrossRef]
- Wei, F.Y. Modern Climatic Statistical Diagnosis and Prediction Technology; Climate Press: London, UK, 2007; pp. 1–298. [Google Scholar]
- Liu, C.; Ye, Y.; Jie, J.; Zhou, X.; Li, J.L.; Ge, J. Applicability of Soil Temperature and Moisture in Several Datasets over Qinghai-Xizang Plateau. Meteorology 2015, 34, 653–665. [Google Scholar]
- Jiang, C.; Zhang, L.B.; Li, D.Q.; Li, F. Water Discharge and Sediment Load Changes in China: Change Patterns, Causes, and Implications. Water 2015, 7, 5849–5875. [Google Scholar] [CrossRef]
- Zhu, T.J.; Ringler, C. Climate Change Impacts on Water Availability and Use in the Limpopo River Basin. Water 2012, 4, 63–84. [Google Scholar] [CrossRef]
Figure 1.
(a) Geographic location of the study area; (b) The water system map of the Yarlung Zangbo River basin. The green line is the midstream region of this river, and the blue line is the upstream and downstream region of this river.
Figure 1.
(a) Geographic location of the study area; (b) The water system map of the Yarlung Zangbo River basin. The green line is the midstream region of this river, and the blue line is the upstream and downstream region of this river.

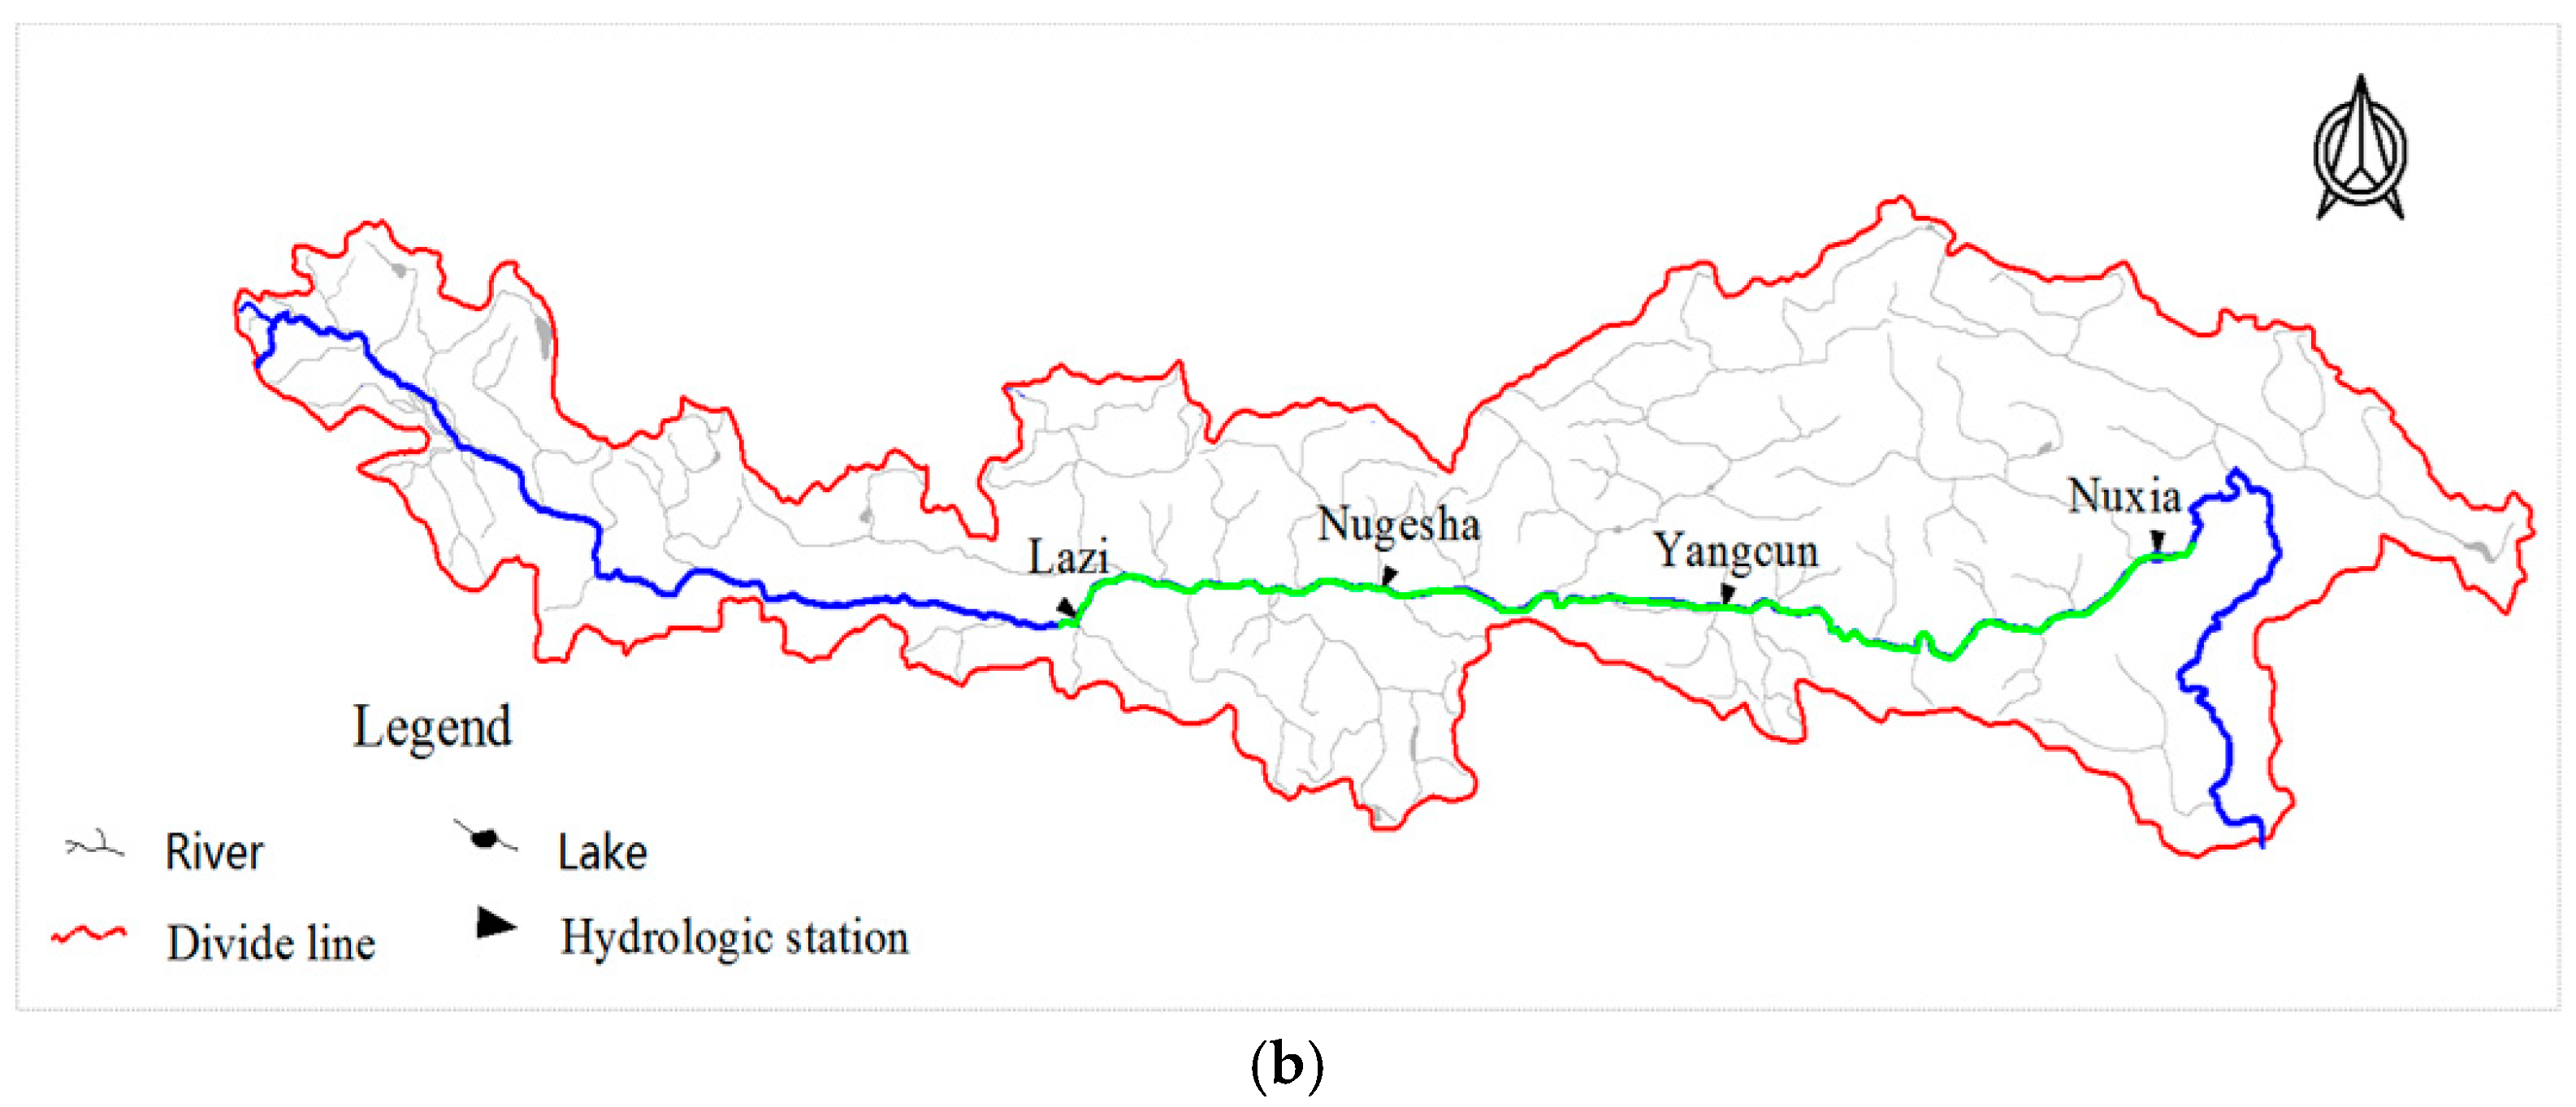
Figure 2.
A Schematic Diagram for the Water Balance Equation.

Figure 3.
Characteristics of precipitation change in the midstream region of the Yarlung Zangbo River basin. (a) Time series of mean monthly precipitation; (b) The secular mean monthly precipitation; and, (c) The mean annual precipitation
Figure 3.
Characteristics of precipitation change in the midstream region of the Yarlung Zangbo River basin. (a) Time series of mean monthly precipitation; (b) The secular mean monthly precipitation; and, (c) The mean annual precipitation

Figure 4.
Characteristics of temperature changes in the midstream region of the Yarlung Zangbo River basin. (a) Time series of monthly temperature; (b) The secular mean monthly temperature; and, (c) The mean annual temperature.
Figure 4.
Characteristics of temperature changes in the midstream region of the Yarlung Zangbo River basin. (a) Time series of monthly temperature; (b) The secular mean monthly temperature; and, (c) The mean annual temperature.
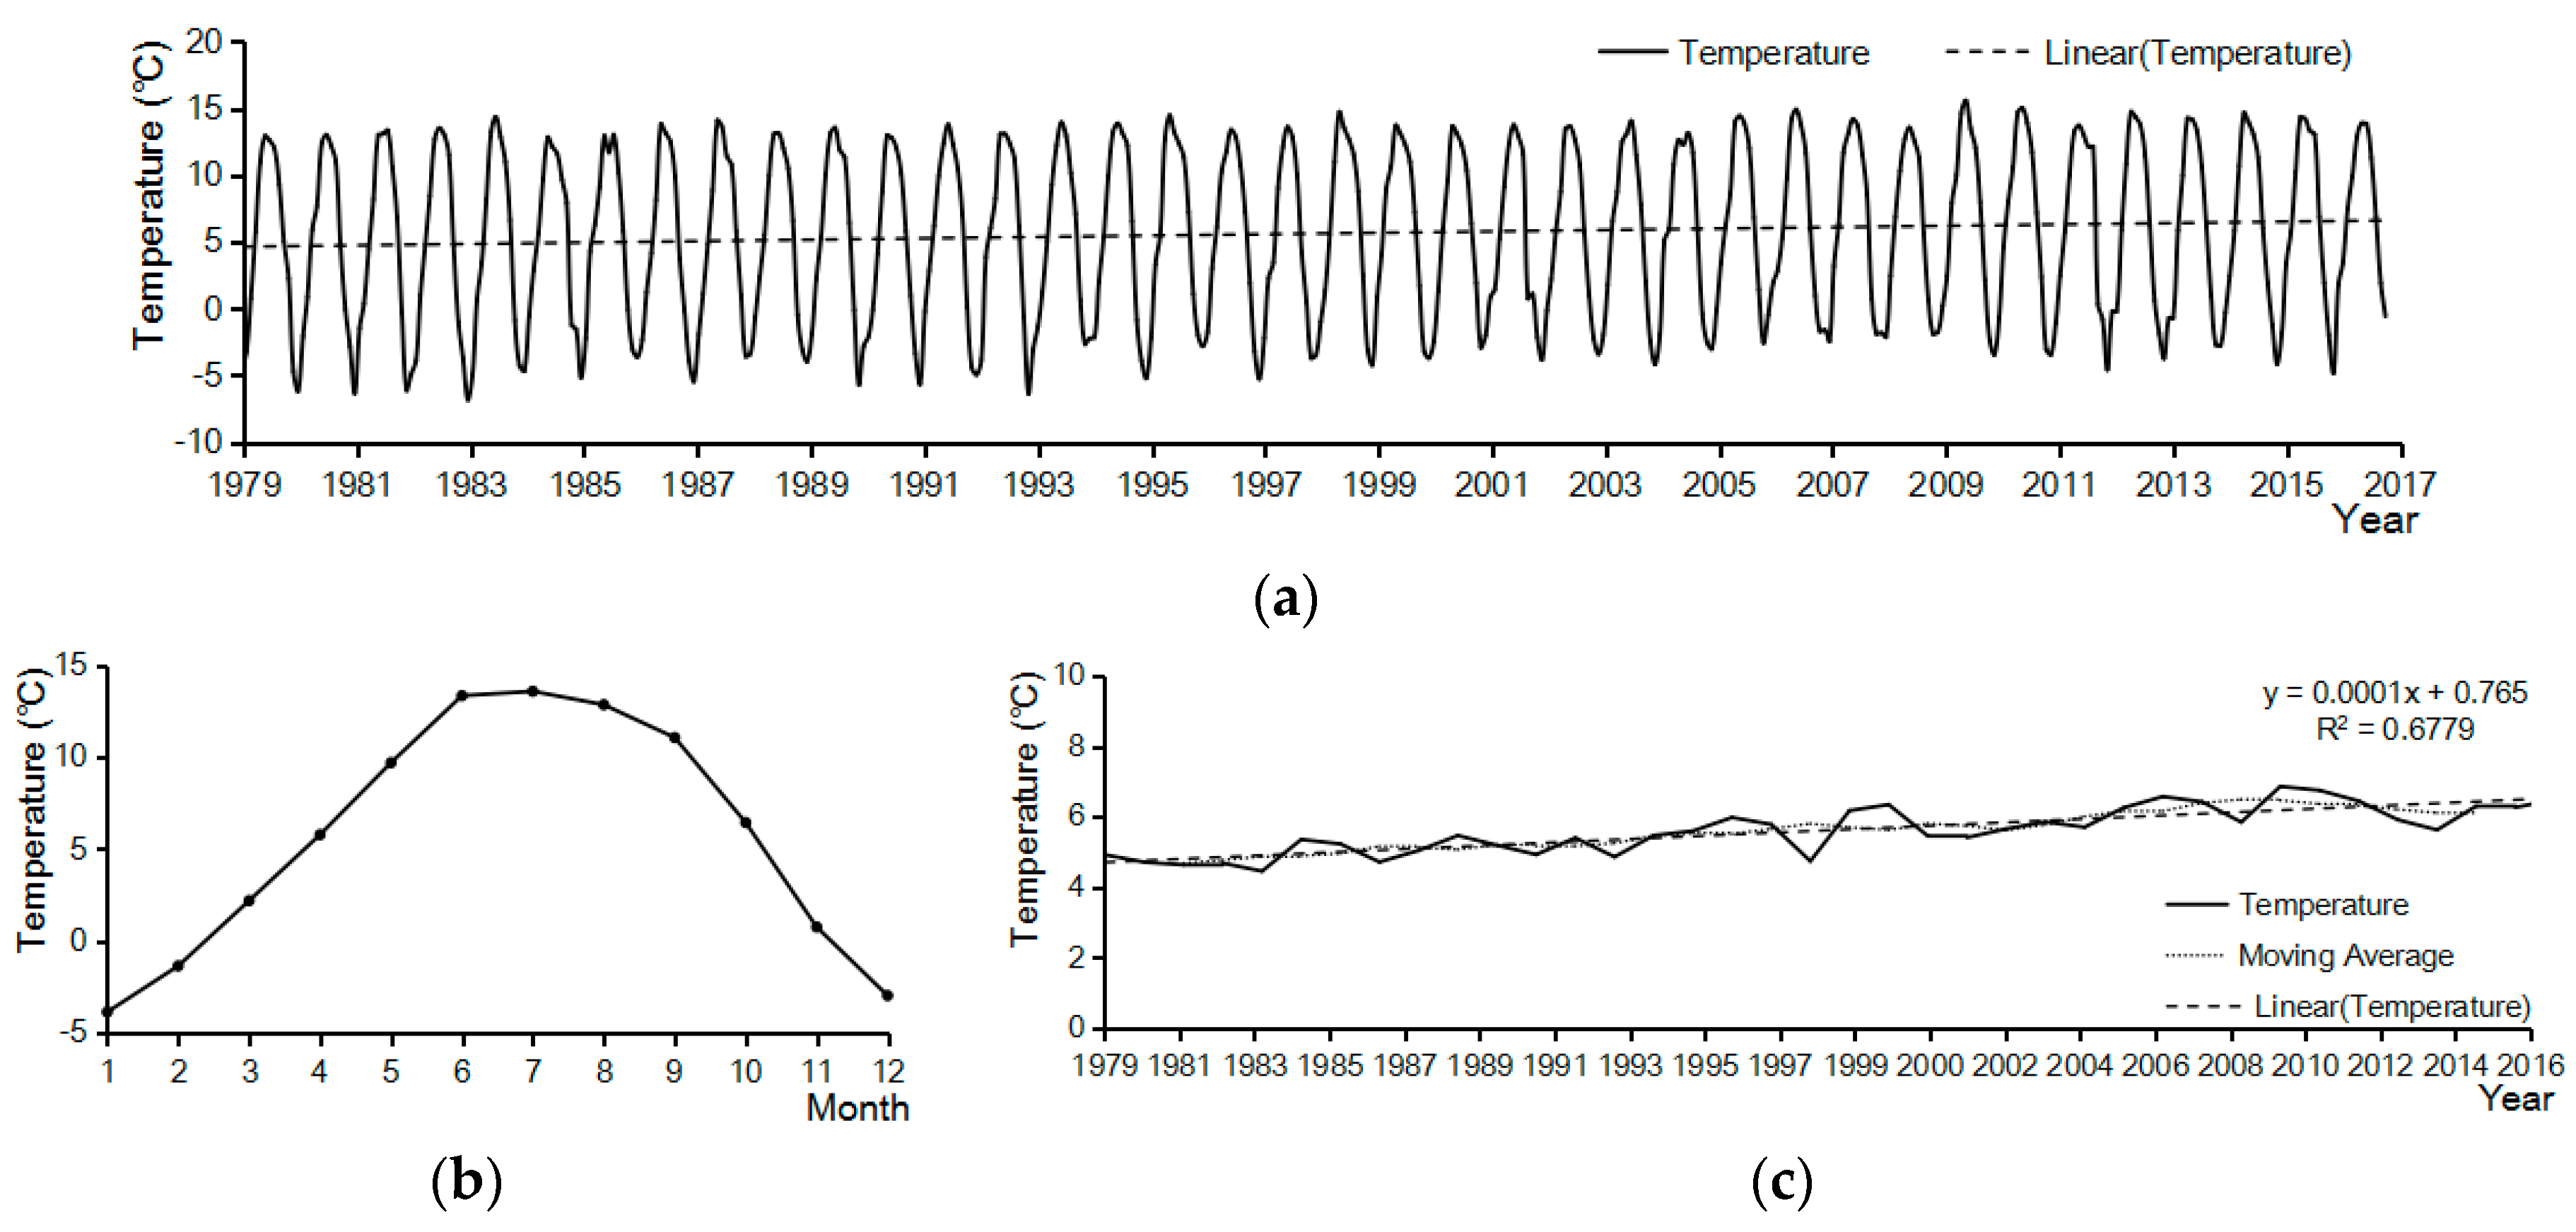
Figure 5.
Characteristics of observed runoff change for Nuxia gauging station. (a) Time series of monthly runoff; (b) The secular mean monthly runoff; and, (c) The mean annual runoff.
Figure 5.
Characteristics of observed runoff change for Nuxia gauging station. (a) Time series of monthly runoff; (b) The secular mean monthly runoff; and, (c) The mean annual runoff.

Figure 6.
GLDAS and observed precipitation changes from 1979 to 2016.

Figure 7.
Correlation coefficient between Global Land Data Assimilation System (GLDAS) and observed precipitation data. .
Figure 7.
Correlation coefficient between Global Land Data Assimilation System (GLDAS) and observed precipitation data. .
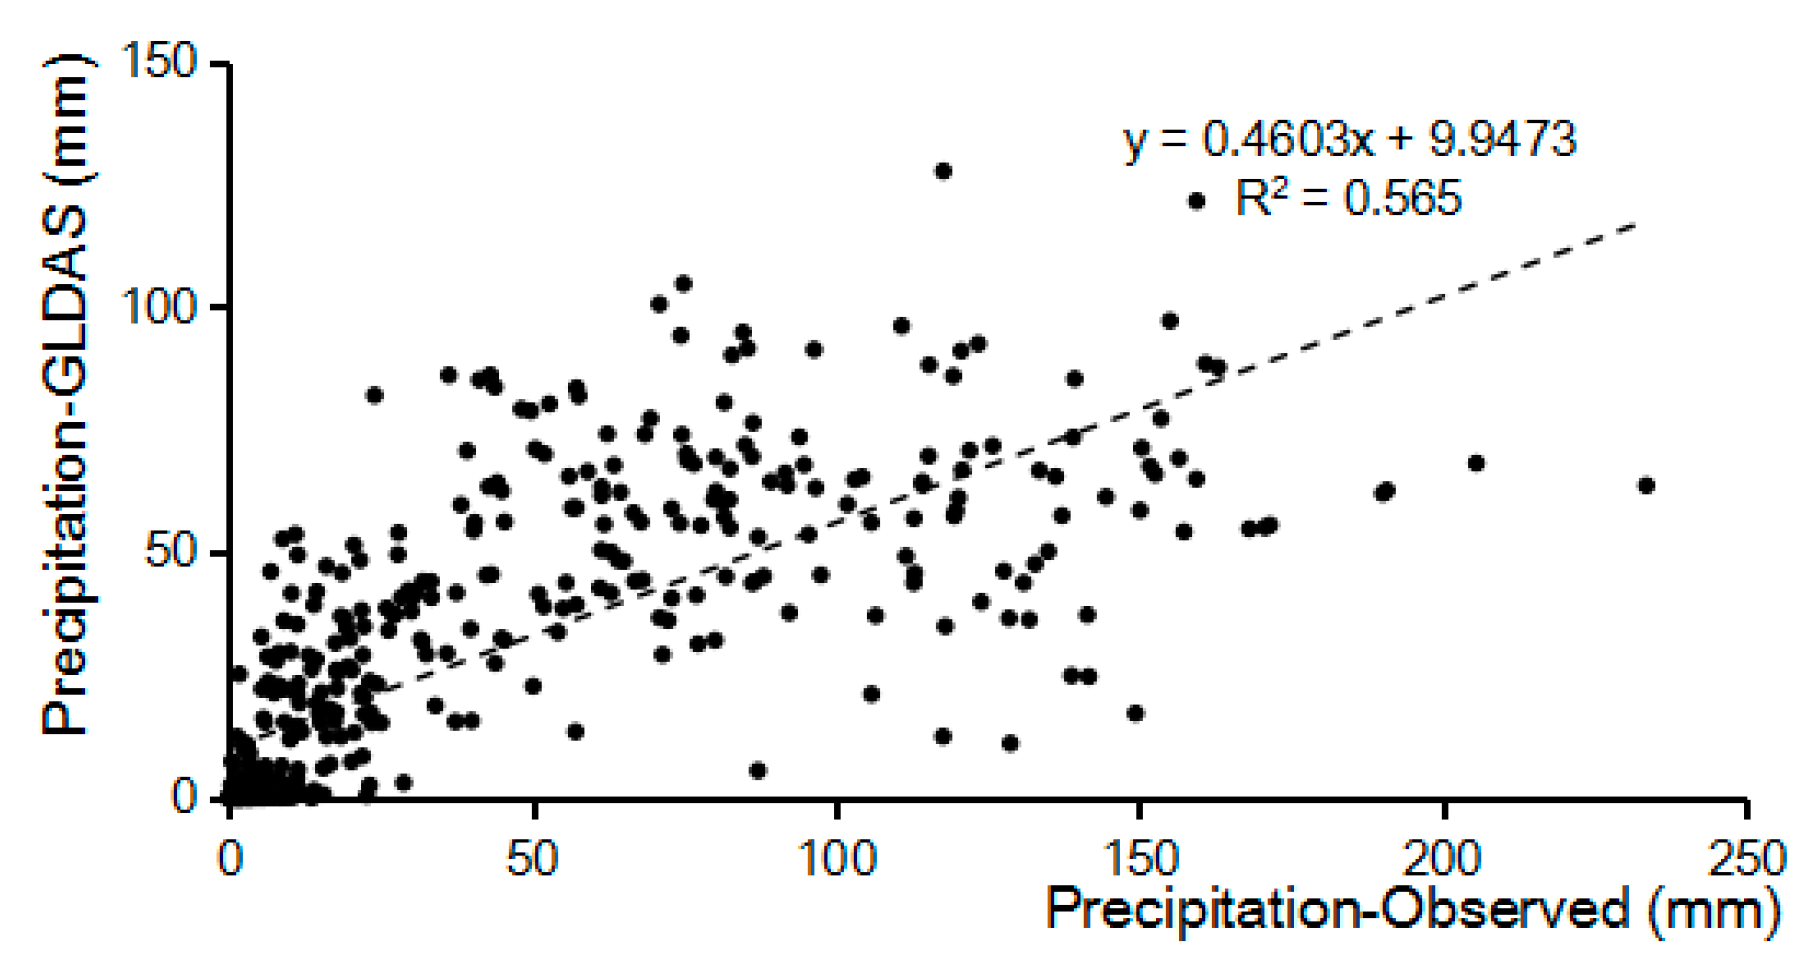
Figure 8.
GLDAS and observed temperature changes from 1979 to 2016.

Figure 9.
Correlation coefficient between GLDAS and observed temperature data.

Figure 10.
Time series of monthly runoff calculated from GLDAS and observed runoff data.
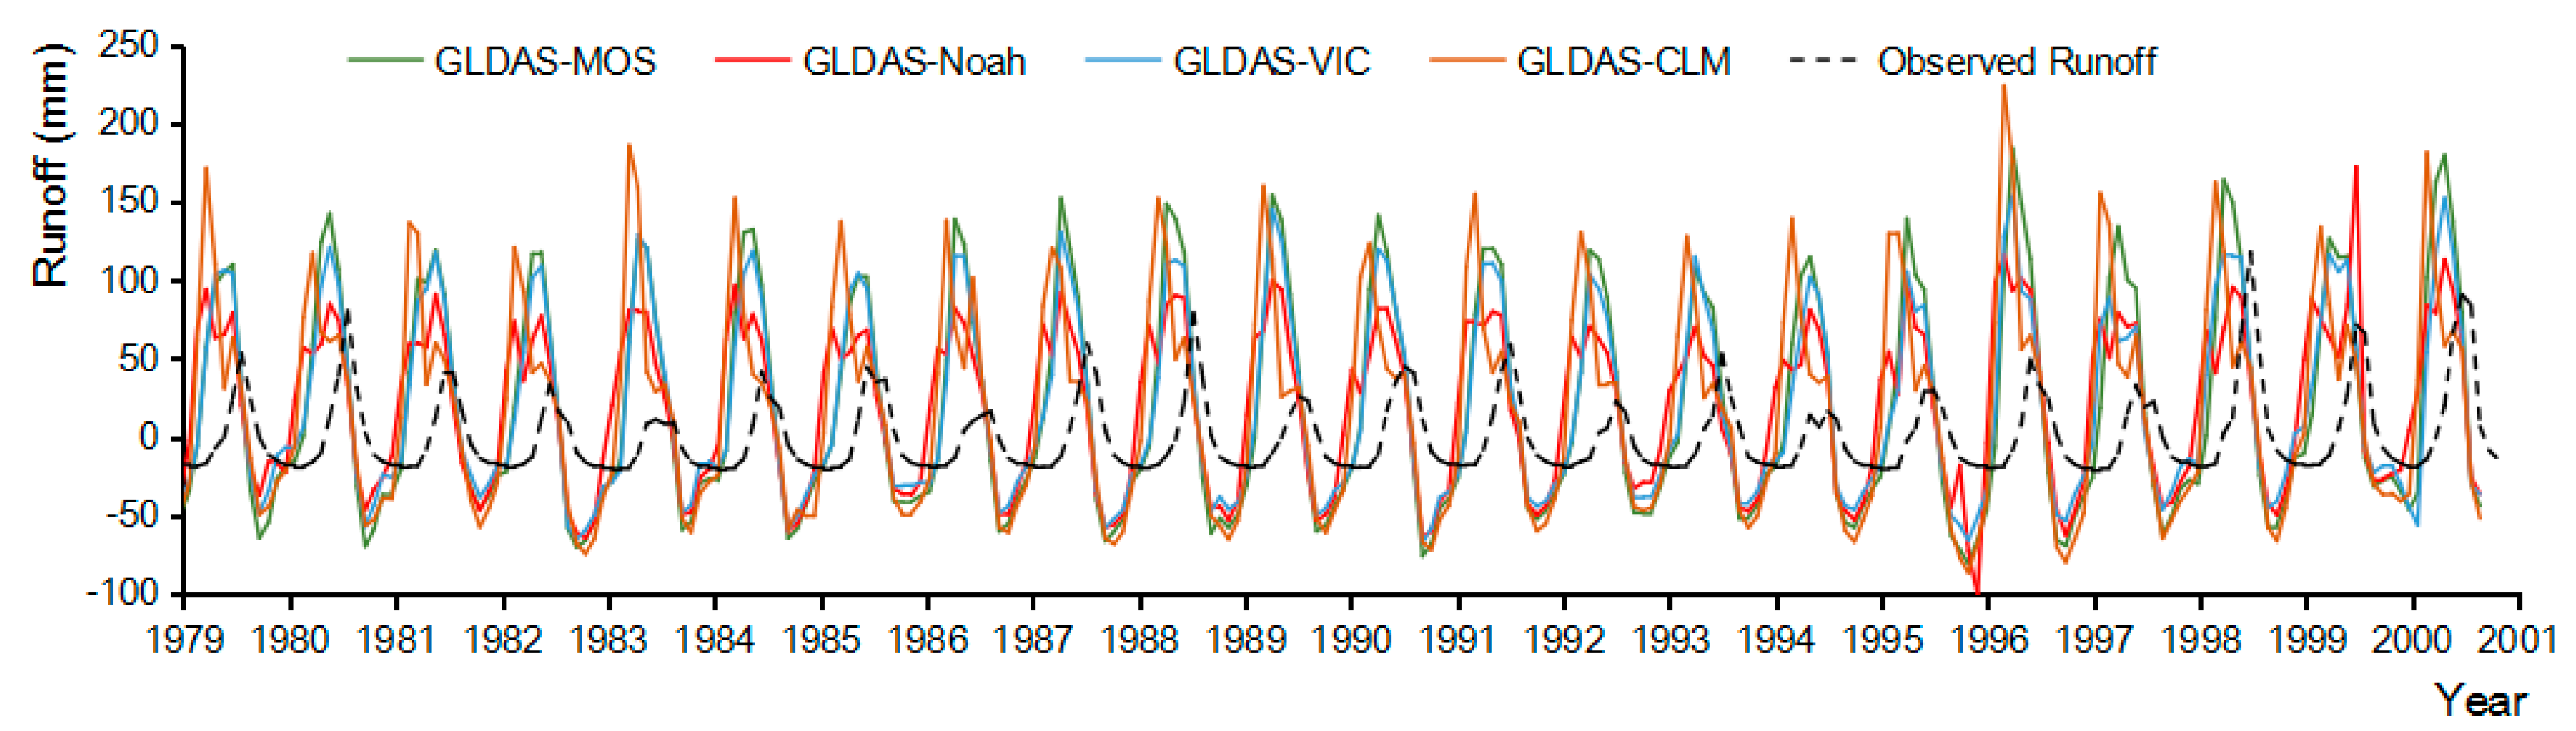
Figure 11.
Correlation analysis between climate factors and runoff for 3 different time scales. (a,b) Mean monthly values; (c,d) Mean annual values; and, (e,f) Secular mean monthly values.
Figure 11.
Correlation analysis between climate factors and runoff for 3 different time scales. (a,b) Mean monthly values; (c,d) Mean annual values; and, (e,f) Secular mean monthly values.

Table 1.
Annual amplitude, cycle, phase, and linear trend of runoff based on the least square method.
Table 1.
Annual amplitude, cycle, phase, and linear trend of runoff based on the least square method.
| Dataset | Amplitude (mm) | Cycle (month) | Phase (°) | Linear Trend (mm/a) |
|---|---|---|---|---|
| GLDAS-MOS | 91.91 | 12.00 | 146 | 0.44 |
| GLDAS-Noah | 67.11 | 12.01 | 108 | 0.33 |
| GLDAS-VIC | 77.92 | 11.99 | 151 | 0.26 |
| GLDAS-CLM | 83.19 | 12.00 | 107 | 0.11 |
| Observed runoff | 28.81 | 12.00 | 220 | 0.44 |
Table 2.
The average ranking scores of runoff data from the four GLDAS models.
| Name | GLDAS-MOS | GLDAS-Noah | GLDAS-VIC | GLDAS-CLM |
|---|---|---|---|---|
| R | 0.70/3 | 0.74/1 | 0.69/4 | 0.70/2 |
| BIAS | 18.82/1 | 19.53/4 | 18.87/2 | 18.96/3 |
| σd | 26.13/3 | 21.41/1 | 23.53/2 | 30.92/4 |
| σr/σobs | 2.78/4 | 2.05/1 | 2.38/2 | 2.66/3 |
| Total ranking scores | 2.75 | 1.75 | 2.50 | 3.00 |
Number a/number b: a represents the values of 4 statistical parameters; b represents the total ranking scores.
Table 3.
Correlation analysis between climate and runoff data at different scales.
| Data | Correlation Coefficient between Precipitation and Runoff | Correlation Coefficient between Temperature and Runoff |
|---|---|---|
| Mean monthly values | 0.752 | 0.704 |
| Mean annual values | 0.897 | 0.499 |
| Secular mean monthly values | 0.925 | 0.806 |
© 2018 by the authors. Licensee MDPI, Basel, Switzerland. This article is an open access article distributed under the terms and conditions of the Creative Commons Attribution (CC BY) license (http://creativecommons.org/licenses/by/4.0/).
Share and Cite
MDPI and ACS Style
Zhang, H.; Zhang, L.L.; Li, J.; An, R.D.; Deng, Y. Climate and Hydrological Change Characteristics and Applicability of GLDAS Data in the Yarlung Zangbo River Basin, China. Water 2018, 10, 254. https://doi.org/10.3390/w10030254
AMA Style
Zhang H, Zhang LL, Li J, An RD, Deng Y. Climate and Hydrological Change Characteristics and Applicability of GLDAS Data in the Yarlung Zangbo River Basin, China. Water. 2018; 10(3):254. https://doi.org/10.3390/w10030254
Chicago/Turabian StyleZhang, Hong, Ling Lei Zhang, Jia Li, Rui Dong An, and Yun Deng. 2018. "Climate and Hydrological Change Characteristics and Applicability of GLDAS Data in the Yarlung Zangbo River Basin, China" Water 10, no. 3: 254. https://doi.org/10.3390/w10030254
Note that from the first issue of 2016, this journal uses article numbers instead of page numbers. See further details here.