Effectiveness of a Natural Headwater Wetland for Reducing Agricultural Nitrogen Loads


1
Department of Geography, University of Tartu, 51014 Tartu, Estonia
2
National Institute ofWater and Atmospheric Research Limited, P.O. Box 11 115, Hamilton 3251, New Zealand
*
Author to whom correspondence should be addressed.
Water 2018, 10(3), 287; https://doi.org/10.3390/w10030287
Submission received: 10 February 2018
/
Revised: 2 March 2018
/
Accepted: 2 March 2018
/
Published: 8 March 2018
(This article belongs to the Special Issue Wetlands for the Treatment of Agricultural Drainage Water)
Abstract
:Natural wetlands can play a key role in controlling non-point source pollution, but quantifying their capacity to reduce contaminant loads is often challenging due to diffuse and variable inflows. The nitrogen removal performance of a small natural headwater wetland in a pastoral agricultural catchment in Waikato, New Zealand was assessed over a two-year period (2011–2013). Flow and water quality samples were collected at the wetland upper and lower locations, and piezometers sampled inside and outside the wetland. A simple dynamic model operating on an hourly time step was used to assess wetland removal performance for key N species. Hourly measurements of inflow, outflow, rainfall and Penman-Monteith evapotranspiration estimates were used to calculate dynamic water balance for the wetland. A dynamic N mass balance was calculated for each N component by coupling influent concentrations to the dynamic water balance and applying a first order areal removal coefficient (k20) adjusted to the ambient temperature. Flow and water quality monitoring showed that wetland was mainly groundwater fed. The concentrations of oxidised nitrogen (NOx-N, Total Organic Nitrogen (TON) and Total-N (TN) were lower at the outlet of the wetland regardless of flow conditions or seasonality, even during winter storms. The model estimation showed that the wetland could reduce net NOx-N, NH4-N, TON and TN loads by 76%, 73%, 26% and 57%, respectively.
1. Introduction
Nitrogen loads from diffuse water pollution (DWP) are a major water quality problem in many countries [1]. Compared to point source pollution, DWP is more complex and difficult to control due to its numerous and dispersed sources, and the difficulties in tracing its pathways [2]. Wetlands have been demonstrated to be an effective means to attenuate nitrogen derived from DWP [3,4] by plant and periphyton uptake and microbial denitrification [5,6]. In some wetlands, studies have shown that denitrification is the dominant nitrate removal mechanism [4,7,8]. However, microbial activity, which controls denitrification rates, can be reduced at low temperatures [9], pH, and carbon availability [6,10]. In line with these seasonal differences in wetlands, nitrogen removal performance is widely reported with reduced rates measured at colder temperatures [4]. Bernal [11] examined N content, N accumulation rates and soil C:N ratios over time in two riverine wetlands in the U.S. Midwest and found that, besides denitrification, organic accumulation was also important in N removal. Zaman [12] found that denitrification only accounted for 6–7% of observed NO3 removal in a short-term injection-resampling study, and suggested that plant uptake was the principal removal mechanism.
In New Zealand, about half of the land area is used in some form of pastoral production, ranging from intensively farmed lowland (often dairy) to extensively farmed hill country (usually sheep/beef/deer) [13]. Dairy cow numbers have risen from approximately 3 million in 1980 to approximately 6.5 million in 2015 [14] along with increased application of fertilisers and use of supplementary feed. For example, N fertiliser use increased from 50 Gg in 1989 to 329 Gg in 2010 [15]. At the same time, extensive drainage across many parts of New Zealand have converted large areas of natural wetlands into agricultural land [3] and small remnant wetland areas continue to be drained as farming practices intensify [16]. In New Zealand, it has been estimated that over 90% of the former wetland area has been lost within a century and a half [17] and the trend is continuing particularly for small wetlands in agricultural landscapes. Ongoing intensification has raised concerns about environmental sustainability and contamination of groundwater and surface water with nutrients particularly under intensive dairying [18,19]. Therefore, there is increasing need for effective management tools to reduce the nutrient losses to water bodies [13].
Natural headwater wetlands are a relatively common feature in the hilly parts of New Zealand. These wetlands often occur within the headwater areas of catchments and along the sides of streams [20]. Although they are individually small, they may represent a significant proportion of headwater catchments. The potential of these wetlands to attenuate upslope derived pollutants is well recognised [21]. However, they can also be a potential source of agricultural pollutants because of their direct connection to the stream network, and farmers see them as a suitable drinking water source for livestock [20]. Pastoral wetlands are often small (less than 5000 m2) and therefore they are rarely identified in wetland inventories or managed, and the ecosystem services they provide are poorly understood. Compared to constructed wetlands, the contaminant removal processes in natural wetlands are generally more complicated to study because they have diffuse, spatially and temporally variable groundwater inflows and outflows that are difficult to access and measure. There have been few attempts to quantify the effectiveness of natural seepage wetlands [22], whereas nutrient removal of constructed wetlands with discrete inflows and outflows is comparatively well studied [3,23,24,25,26].
Models are being increasingly used to help quantify and predict the efficacy of wetlands for removing excess nutrients. The biological, chemical and physical removal processes in wetlands vary in space and time [11]. Modelling enables improved understanding of the complex interplay of hydrology and biogeochemical processes taking place in wetlands and their variability in space and time at relatively low cost.
This study aims to estimate the performance of a natural headwater wetland in removing nitrogen loads originated from upland grazed dairy pasture. It was hypothesised that wetland N removal efficiency would vary depending on inflow loads and seasonal temperatures, and that the coincidence of high flows and low temperatures in winter would reduce removal efficiencies. The performance of the wetland was estimated by assessing nitrogen in-loads and out-loads by flow and water quality monitoring and modelling.
2. Materials and Methods
2.1. Study Site
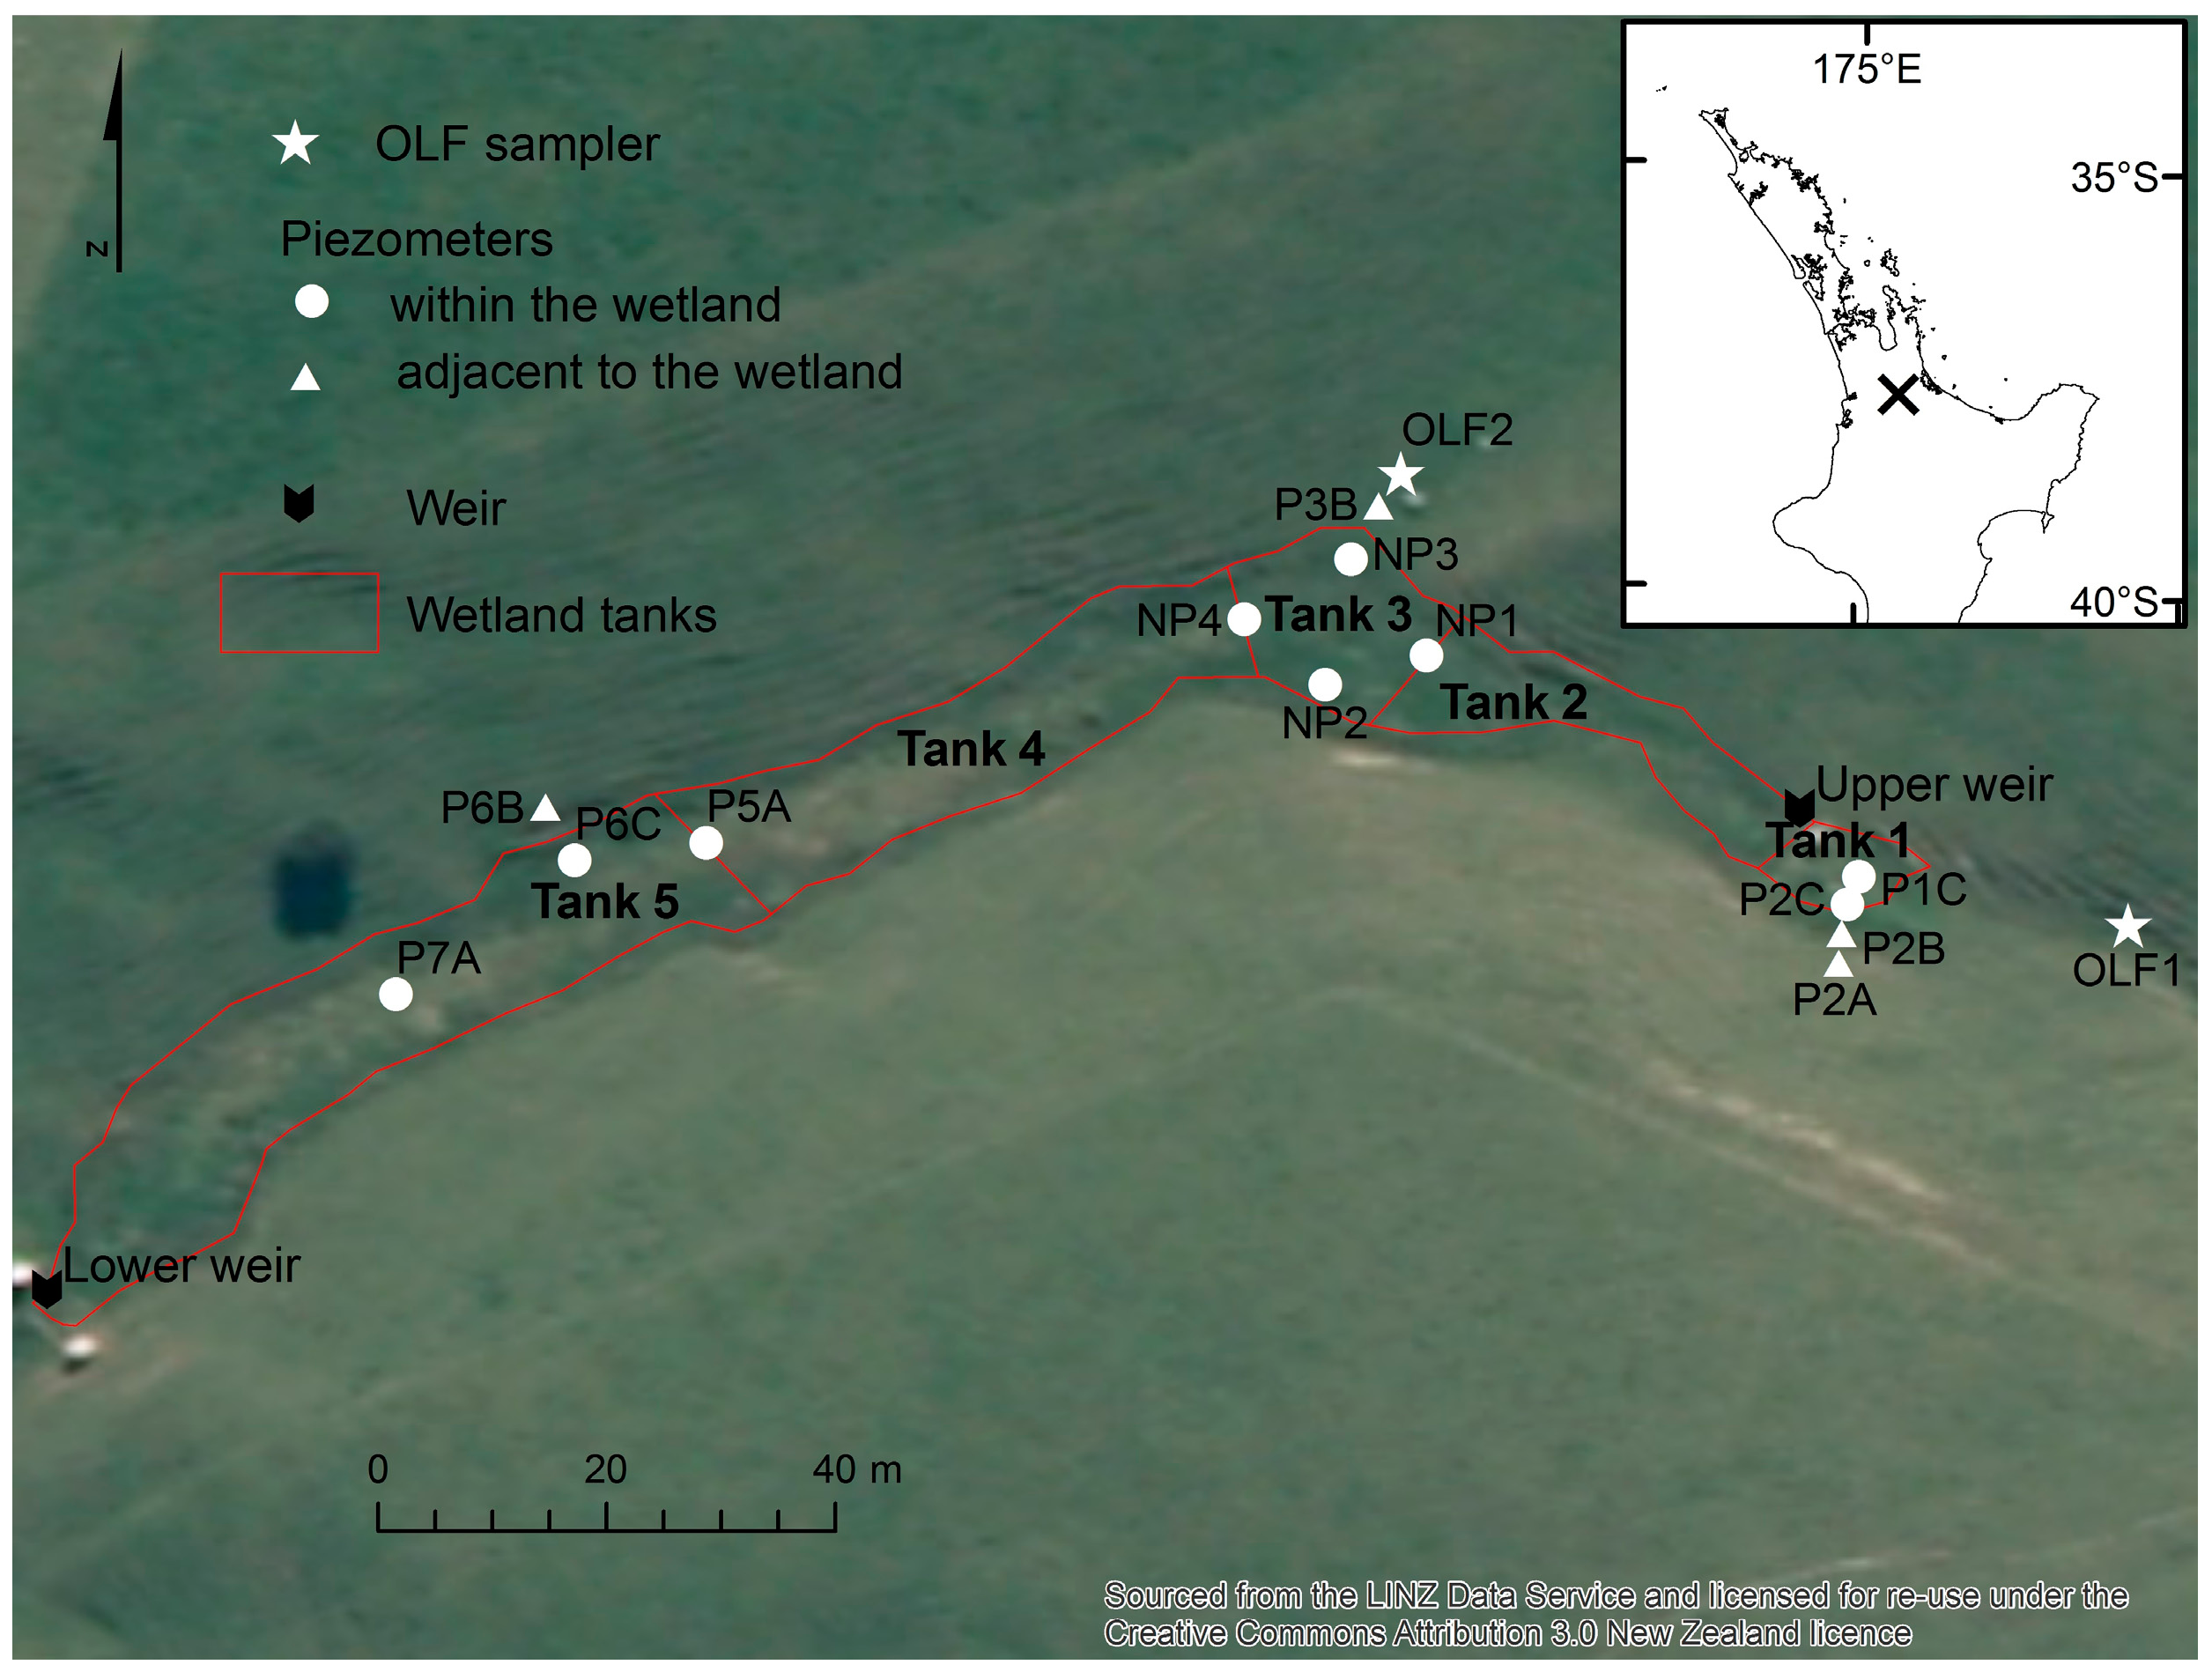
The study wetland is located on a dairy farm near Kiwitahi in the headwaters of the Toenepi catchment (15.8 km2) in the eastern Waikato region, New Zealand (Figure 1). The Toenepi catchment is intensively farmed and 75% of the catchment area is under dairy production with a stocking rate of ~3 cows ha−1 [27]. The mean annual rainfall of the area is 1377 mm. The upper Toenepi catchment is hilly with ~80% of the area classified as either rolling or steep (>10% gradient) [28]. The wetland catchment is dominated by Morrinsville clay soil (NZ Soil Classification: Orthic Granular).
Rotational grazing of a single herd of ~220 (Holstein Friesian) cattle is practiced on the dairy farm, which is divided into 33 individual paddocks or fields (fenced pasture area for grazing) of between 1.0 and 3.1 ha. The study wetland is located within a small (~1.9 ha) fenced paddock, which is grazed for ~1 day every 40 days during winter and summer and ~1 day every 20 days during spring and autumn. As most of the time the wetland does not provide ready access to surface water, drinking water is available to the herd from a water trough (groundwater bore source) within the paddock. The paddock containing the study wetland (with exception of the wetland itself) is steep (mostly exceeding 20° slope). The extent and impacts of grazing events on water quality at the outlet of the wetland over the period of the present study have been described by Hughes [29].
The wetland has an area of ~0.15 ha (2.8% of surface catchment) and an average slope of 3.5°. The permanently saturated wetland soil is composed largely of a mix of organic material and the clay-based soils eroded from the surrounding hillslopes. Sediment probe measurements indicated that within 1 m of the edge the saturated layer was generally between 0.5 and 1 m thick. Depths increased with distance from the edge, and were generally between 1 and 2 m in the centre of the wetland. The wetland vegetation is dominated by glaucous sweet grass (Glyceria declinata), a perennial aquatic grass widely naturalised in New Zealand.
2.2. Site Monitoring
The study site was monitored for a two-year period between October 2011 and September 2013. Flow was measured hourly at two 45° v-notch weirs with stage height measured by a Unidata Hydrologger water level recorder (1 mm resolution; Unidata Pty, O’Connor, WA, Australia) and converted to flow using a theoretical rating equation. The Upper Weir (UW) was located at the head of wetland, downstream from where there was significant ground water seepage (Figure 1). The catchment area above the UW is ~2.9 ha. The Lower Weir (LW) was located within a constricted part of the lower wetland with a total catchment area of ~5.2 ha (Figure 1). During the period between November 2012 and May 2013, the study site experienced exceptionally dry conditions [30]. Consequently, no flow was recorded at the UW from early January 2013 through to May 2013. Despite this, the wetland remained wet and boggy with flow at the LW.
An ISCO 3700 automatic water sampler (Teledyne Isco, Lincoln, NE, USA) was programmed to collect water samples behind each weir using a stage-based trigger. In addition, low flow grab samples were collected during site visits approximately every six weeks. Once collected, samples were immediately placed in an insulated storage bin containing an ice slurry. Samples were delivered to the NIWA—Hamilton Water Quality Laboratory on the day of collection for grab samples and within 24 h for samples collected from the automatic sampler.
Piezometers were installed at 13 locations, both within (nine piezometers) and adjacent to the wetland (four piezometers) (Figure 1). The within-wetland piezometers were installed to below the depth of the deposited wetland material (i.e., into the weathered underlying bedrock material) and were slotted to collect water from depths of 1–2.5 m. During site visits for grab samples, piezometer water level was recorded and water samples were collected. Two overland flow (OLF) samplers were also monitored at the site, one in the gully immediately upstream of UW (OLF1) and one at the base of a swale on the northern margin of the wetland (OLF2).
Rainfall was also measured at the lower weir at 10 min intervals by an Ota tipping bucket rain gauge (Ota Keiki Seisakusho, Tokyo, Japan). Potential evapotranspiration was calculated using the FAO Penman–Monteith equation [31].
2.3. Laboratory Analysis
Collected water samples were analysed for, oxidised N (nitrite- and nitrate-N, here-after referred to as NOx-N), ammonium-N (NH4-N), Total Nitrogen (TN). Total Organic Nitrogen (TON) was calculated by subtraction (TN minus (NOx-N plus NH4-N)). A Lachat flow injection analyser (Hach, Loveland, CO, USA) was used for NOx-N, NH4-N (detection limit 1 mg/m3), and for TN (detection limit 10 mg/m3). All water samples were filtered after subsampling for TN (as well as total suspended solids and total phosphorus not reported here) with a Millipore® syringe and filter holder containing a GF/C glass fibre pre-filter (47 mm diam., 1.2 µm pore size), and a Sartorius® cellulose acetate membrane filter (47 mm diam., 0.45 µm pore size).
To determine whether pollutant concentrations varied by season, the Kruskal–Wallis statistical test was used to test for differences in median seasonal pollutant concentrations. The Kruskal–Wallis test can be considered to be a non-parametric version of the ANOVA test. The Mann–Whitney U test was used for comparing upper and lower weir median pollutant concentrations. A significance level of p < 0.05 was adopted in all tests. The statistical software package Statistica 12 (StatSoft; Tulsa, OK, USA) [32] was used to perform these tests.
2.4. Modelling Nitrogen Removal
We used N measurements and flow measurements as inputs to a simple dynamic model [32,33] to explore potential wetland N removal performance during 2012 when continuous flow data were available. The model was set up in Microsoft Excel (365 Pro Plus ver. 1708, Redmond, WA, USA) (Figure 2) and uses Euler integration (Equation (1)). To simulate the internal hydraulic dynamics of the wetland, we used a five tanks-in-series approach (Figure 1 and Figure 2) with areas from 56 m2 to 637 m2 (Table 1). Tank 1 was situated above UW and Tank 5 terminated at LW. Each tank had at least one piezometer located near its outlet. Hourly measurements of flow at UW and LW, rainfall, and Penman evapotranspiration estimates were used to calculate a dynamic water balance for the wetland.
The following differential equation (Kadlec, 2012) was used for the dynamic water balance:
where is time (h), refers to Tanki+1, refers to Tanki, is the volume of water in the tank (m3), is the flow (m3/h), is the surface area for the tank (m2), is the precipitation (m/h), is the evapotranspiration (m/h), is the surface runoff inflow (m3/h), and is the net groundwater inflow (m3/h). When weir is not present, then Qi is calculated from water balance based on inputs/outputs from neighboring tanks, precipitation, surface runoff and evapotranspiration calculated based on each tank’s area.
Storm events above a certain threshold (rainfall intensity ≥ 1 mm/h, flow at weirs increasing and storm length ≥ 3 h) were assumed to always result in surface runoff. Altogether, 37 such storms were defined over the period of this study (12 months, January 2012 to December 2012), the shortest being 3 h and the longest 27 h. SR into each tank was calculated as P-ET during the storm event and multiplied by the catchment area of the tank. The subsurface infiltration rate of groundwater into or out of the wetland was derived from the water balance calculated at the outlet of the wetland, assuming that the wetland is a closed system. Changes in wetland depth and hence storage volume were simulated for a 45° V-notch weir set 35 cm above the base of the wetland using a modification of the Francis weir formula [34].
A dynamic N mass balance was calculated by coupling influent concentrations to the dynamic water balance and applying a first order areal removal rate coefficient (k) (Equation (2)) [35].
The mass balance for a tank is given by the differential equation:
where C is concentration (mg N/m3) and k is the removal rate coefficient (m/h).
The removal rate coefficient (k) is well known to be temperature sensitive [35]. The modified Arrhenius equation was used for adjusting k to the ambient temperature with temperature factors derived from field-scale wetland studies (Table 2) [35,36]. The annual water temperature regime was simulated using a sinusoidal function calibrated to air temperatures measured at the site, as described by Kadlec [33]. We adjusted within the range of k20 coefficients documented for surface flow wetlands (Table 2). For modelling net TON and TN removal, an irreducible background concentration C* was used (Table 2; Equation (2)).
Surface runoff was assigned higher NH4-N, NOx-N, TON and TN concentrations than UW, based on limited measurements of surface runoff around the wetland (Table 3). The median value recorded for each tank was used as constant input value for groundwater NH4-N, NOx-N, TON and TN (Table 3). Atmospheric deposition of dissolved inorganic forms of N in New Zealand is considerably lower than commonly found in continental Northern Hemisphere regions [33,37], ranging from 1–5 g N ha−1 year−1 [38]. Therefore, a very low constant input value (10 mg/m3) for all forms of nitrogen from rainfall was used. To improve the stability of the model, we decreased the time-step during the storms to 10 min. Wetland performance was calculated as:
and areal mass load removal rate was calculated:
Removal efficiency (%) = (Inload − Outload)/Inload × 100%,
Areal mass load removal rate (mg/m2/day) = (Inload − Outload)/wetland area/inflow days.
3. Results
3.1. Hydrology of the Wetland
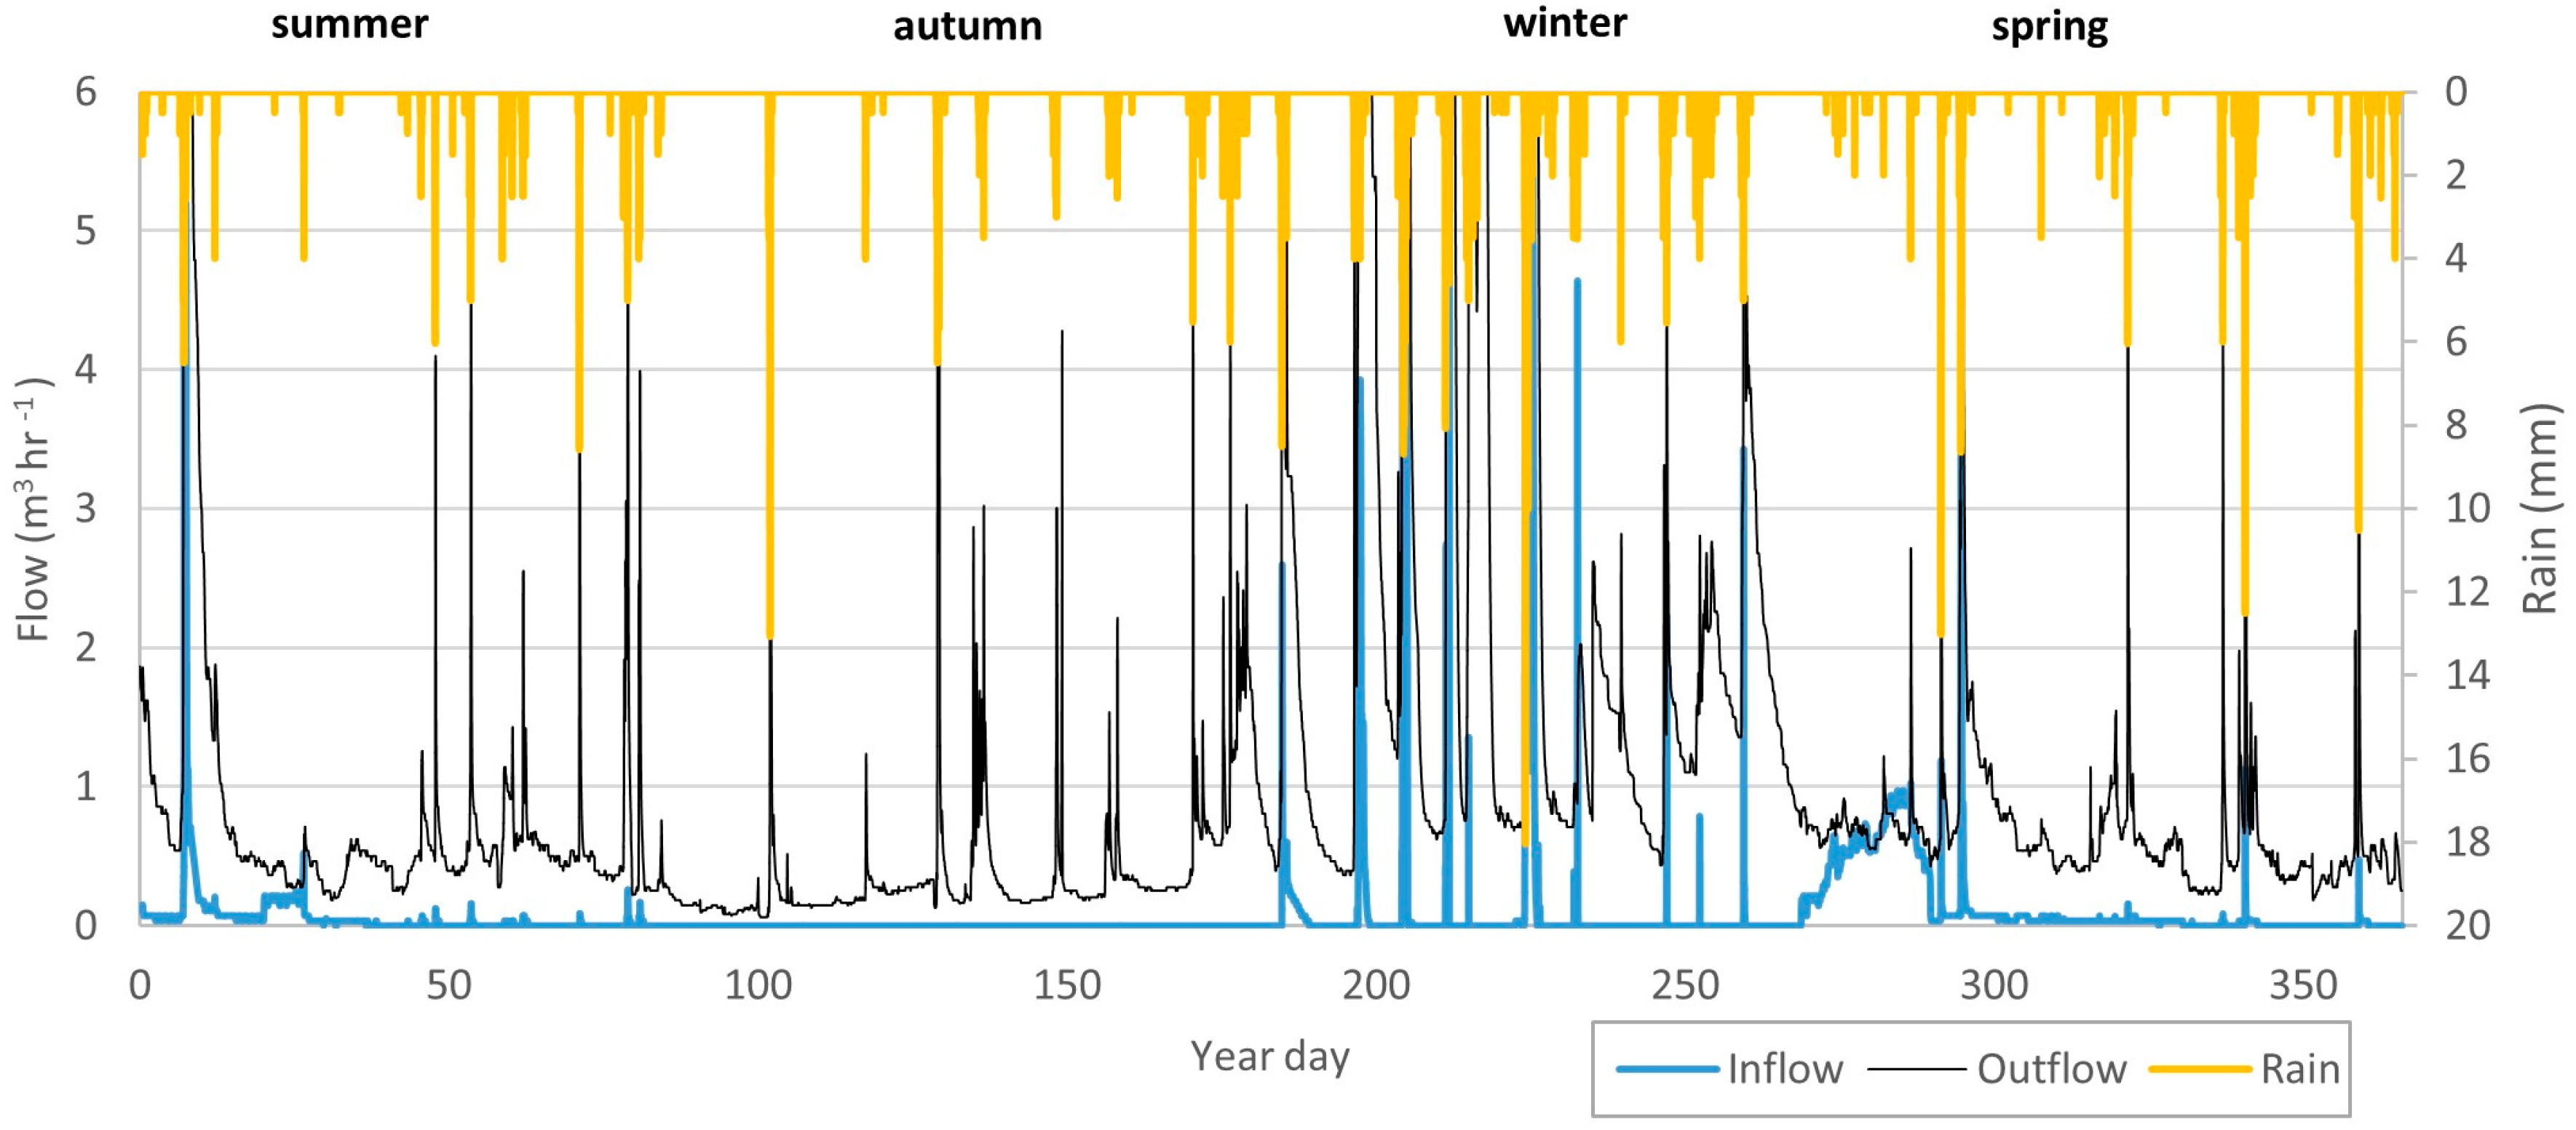
Annual precipitation of 1056 mm was recorded for the wetland catchment in 2012. About 40% of the rainfall occurred during winter, 30% in spring, 20% in summer and 10% in autumn (Figure 3). During 2012, flow occurred on all days at the LW (lower weir) but only on 122 days at the UW (upper weir). During that 122-day period, there was 1836 m3 inflow to the wetland as measured at the UW and 12,439.6 m3 outflow from the wetland as measured at the LW. Flow measured at the upper weir accounted for less than 15% of the flow exiting the lower weir. This is despite the area above the upper weir contributing over half the catchment area and including a highly convergent gully immediately upstream from the wetland. This suggests that a large proportion (85%) of the flow exiting the wetland is derived from subsurface inflows entering between the upper and lower weirs. Subsurface flow appeared to dominate regardless of conditions and time of year. However, it is difficult to accurately estimate the proportion of the seepage because it was not possible to accurately measure all surface runoff inputs during storm events. The estimated inputs to the wetland during 2012 were: 94.7% via groundwater (11,781.6 m3), 4.1% via surface runoff (511.4 m3), 1.2% via rain-ET (146.6 m3).
3.2. Water Quality of the Wetland
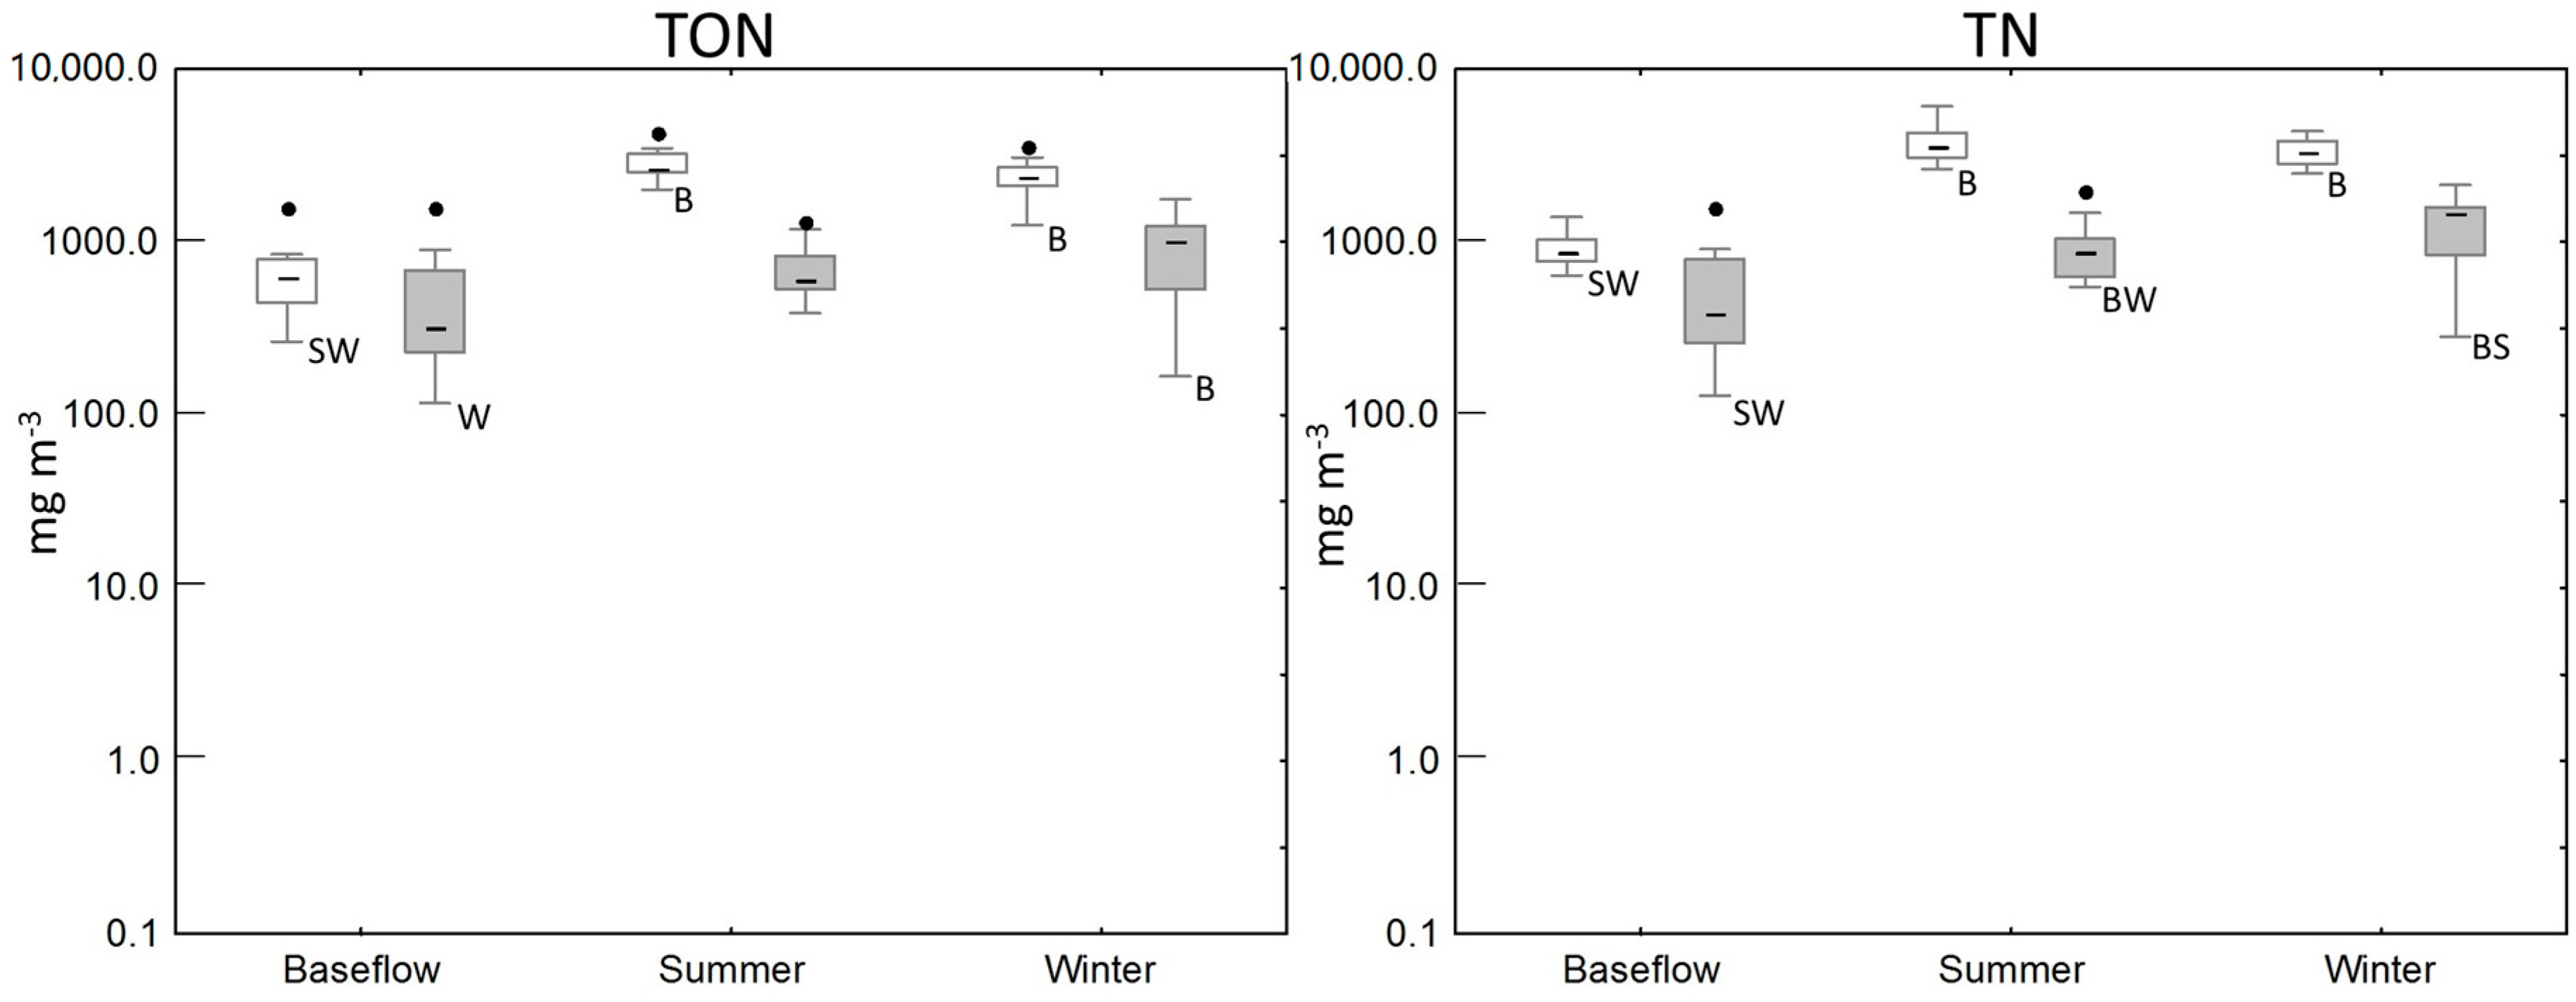
Altogether, 56 water quality samples from the upper weir and 95 samples from the lower weir were analysed (Table 3, Figure 4). Baseflow samples were collected throughout the study period and flow events were sampled over a range of both summer and winter conditions. Water quality data for storms has been grouped together into summer/autumn (December–May) and winter/spring (June–November).
When comparing upper and lower weir, all the measured variables showed lower (NOx-N and TN statistically significantly, p < 0.05) concentrations at the lower weir, regardless of flow conditions or seasonality (Figure 4, Table 2). During the winter/spring storms, all measured variables had significantly higher values (p < 0.05) at the upper weir (Table 3 and Table 4).
In terms of flow conditions, the concentration of all variables was highest during storm events (Figure 4). At the upper weir, all stormflow variables were highest during summer, which could be due to more frequent stock access to the wetland paddock during this period [29]. However, at the lower weir, all variables, except NH4-N, were highest for winter storms.
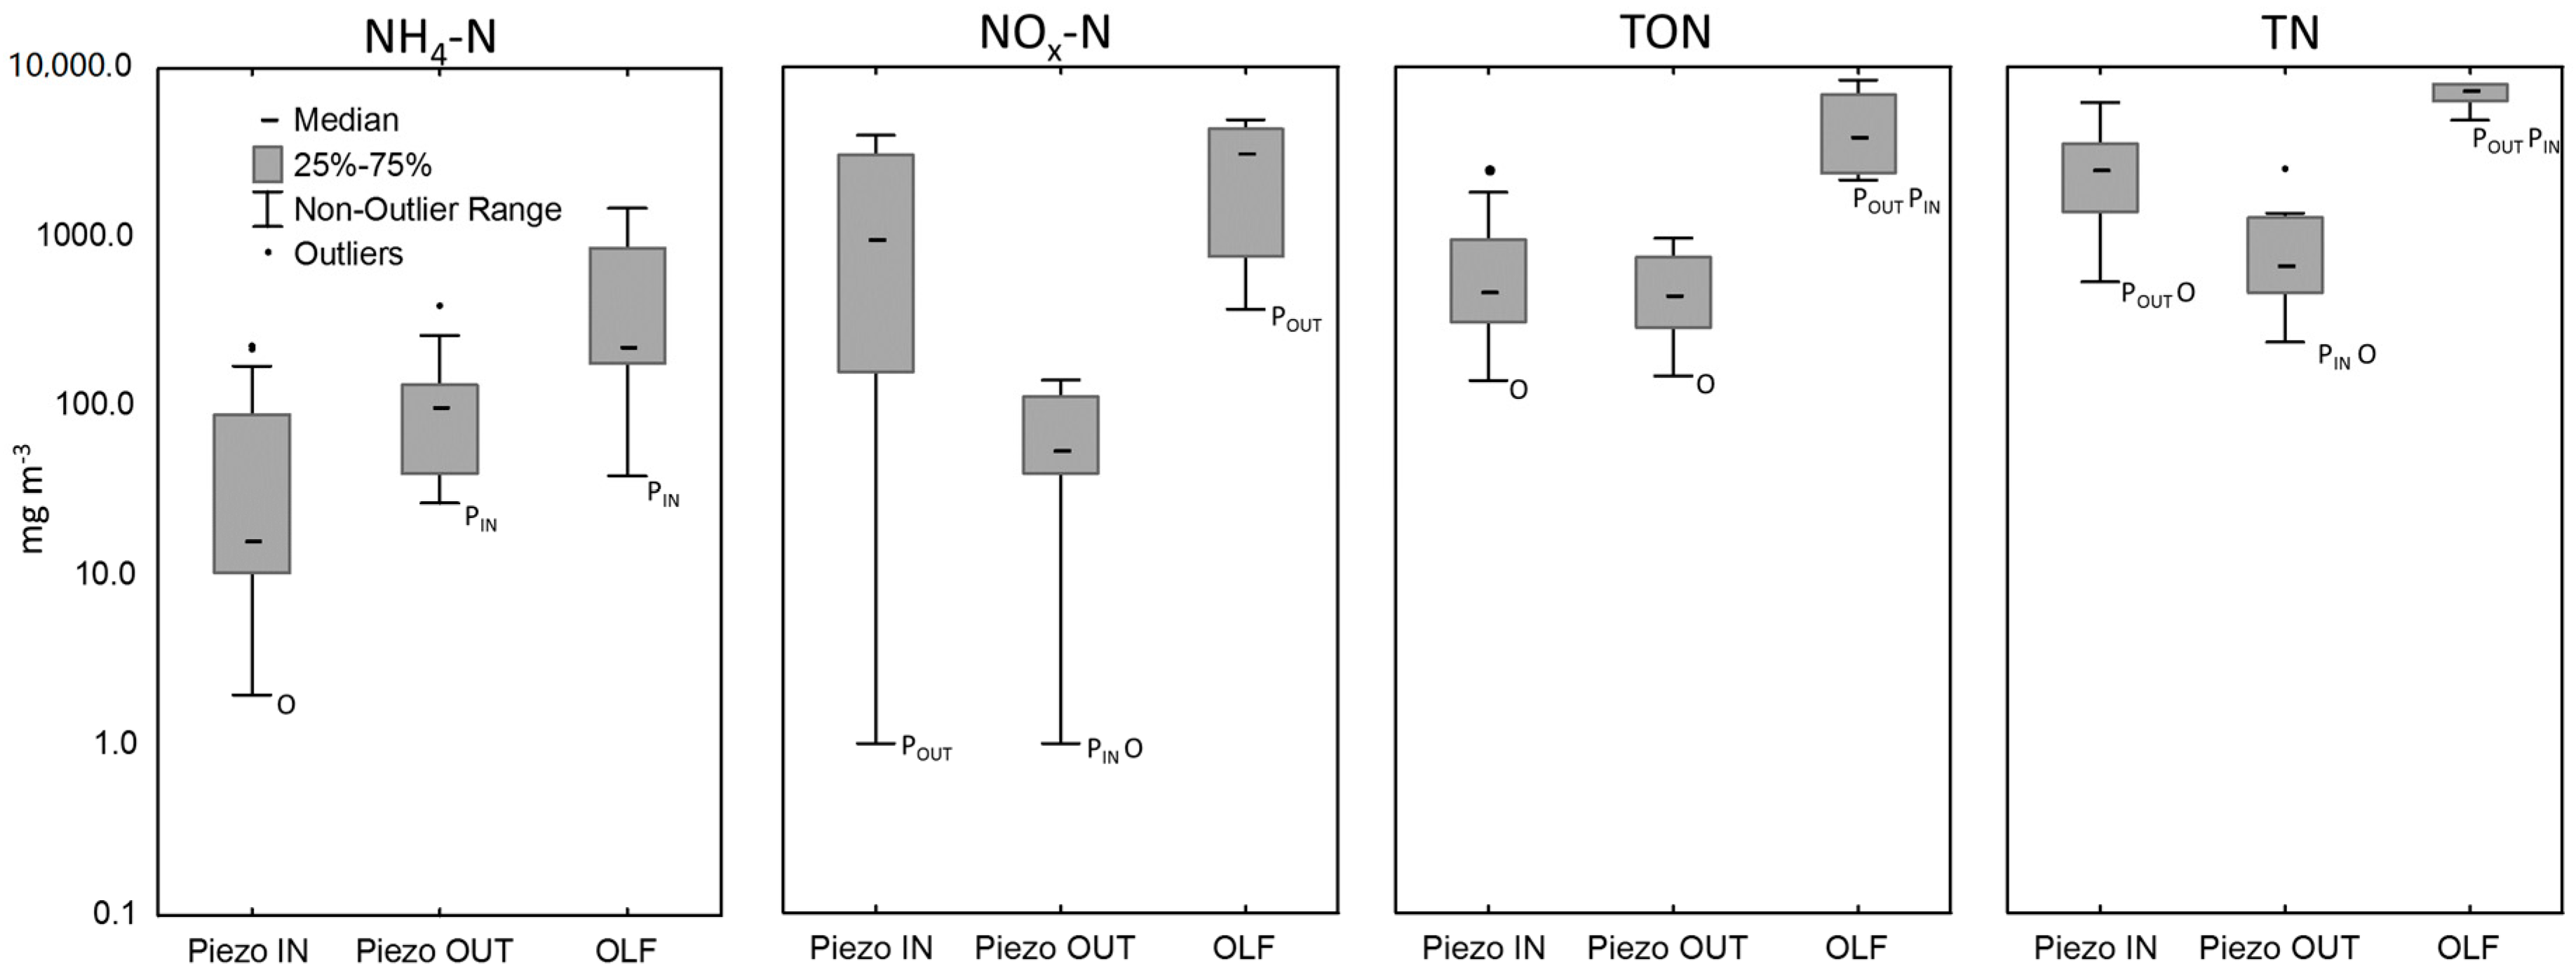
Fifty-nine groundwater samples were analysed. Fifteen of those were collected adjacent to the wetland area and 44 within the wetland. Only six discreet overland flow samples were collected from two sites, but, during storm-flows, OLF represented most of the flow at the upper weir. This confirmed that OLF entering the wetland had the most elevated levels of all measured pollutants (Figure 5). Groundwater around the wetland always had relatively low N concentrations. In case of NOx-N, it was significantly lower (p < 0.05) than overland flow and piezometers sampled within the wetland. Despite the similarity of the nitrate concentrations from around the wetland, the NOx-N concentrations from the sample sites within the wetland showed remarkable spatial variation. Above the UW, the measured NOx-N concentrations were consistently higher than 3000 mg/m3. Higher NOx-N concentrations were also detected in piezometer NP3, which was sited where another gully entered the wetland from north downstream of the UW. NH4-N and TON concentrations were significantly lower in the wetland groundwater than in OLF.
3.3. Modelling Wetland N Species Removal Efficiency
NOx-N was the dominant form of N (60.7% of in load) entering the wetland (Figure 6) mainly via groundwater seepage (90.7%). TON also comprised a significant proportion of the N loading (29.9% of in loads) with NH4-N only 9.4% of the load. TON and NH4-N were also mainly entering via groundwater (76.8% and 95.1%, respectively). However, a significant portion of TON was also entering the wetland via surface runoff (23%). TON was the dominant form leaving the wetland (56.1% of out load) followed by NOx-N (37.5% of out load) and NH4-N (6.4%).
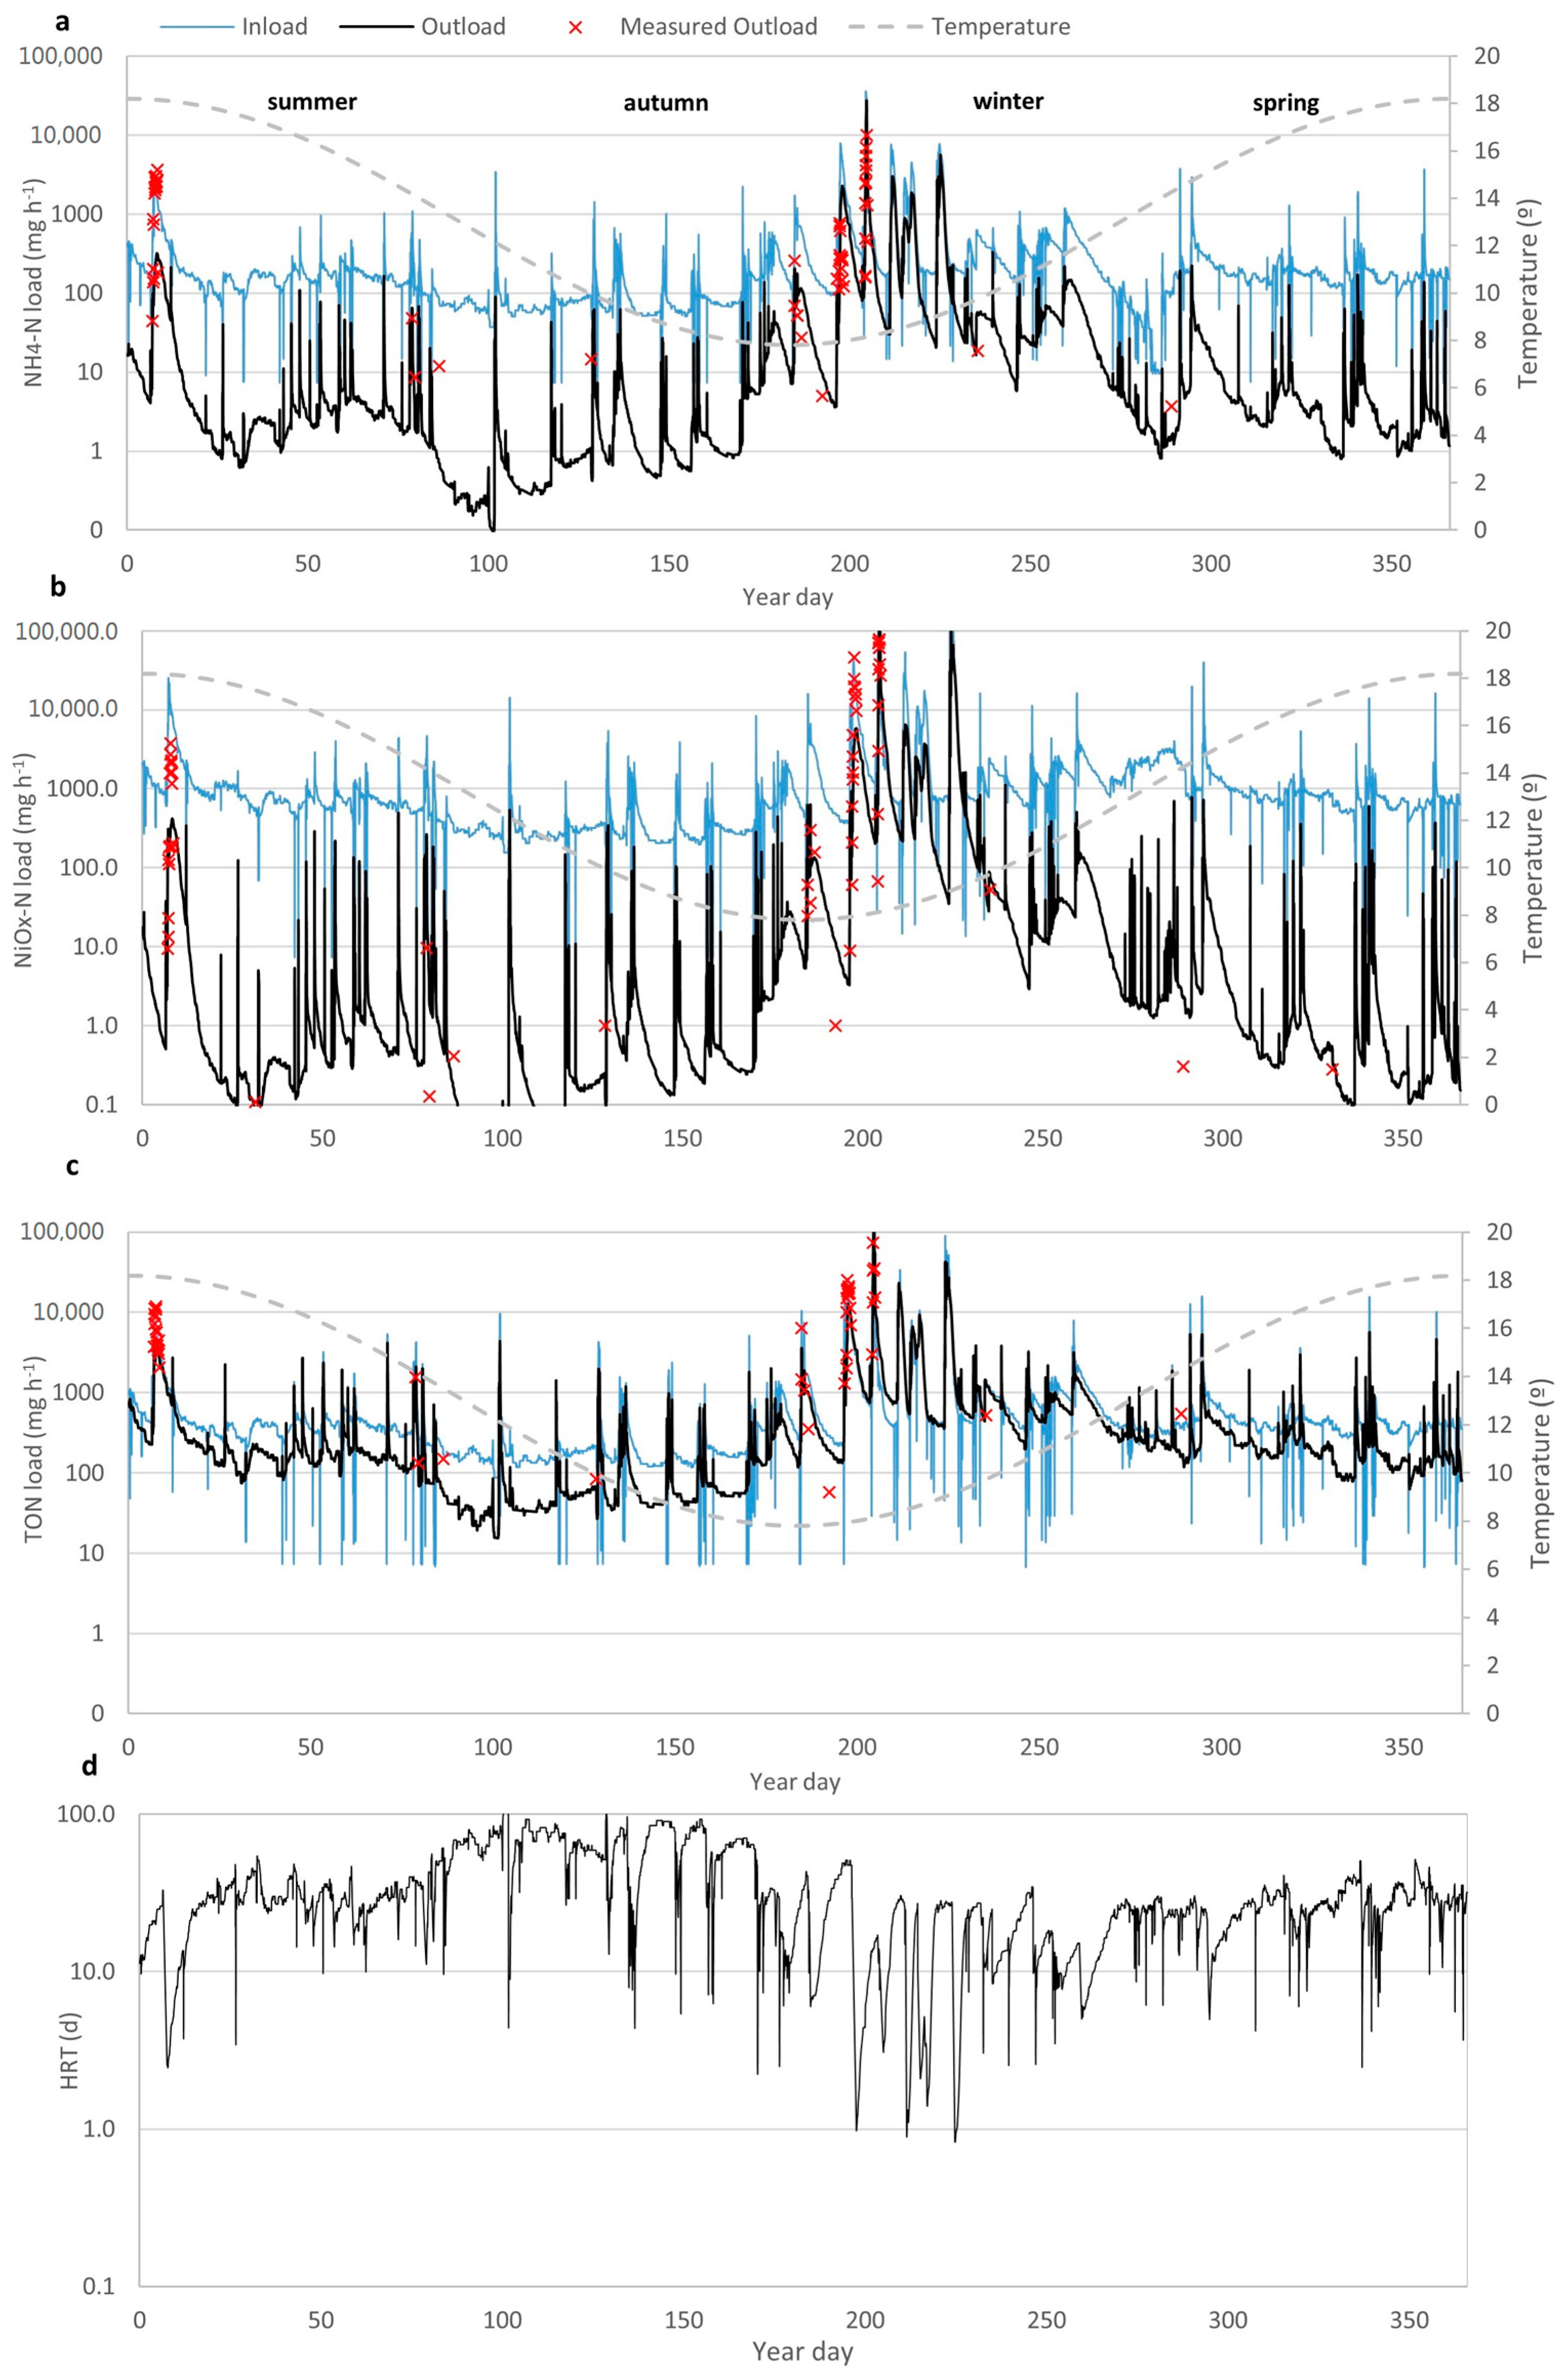
Best fit k20 values based on least squares varied for nitrogen forms. NOx-N and TN showed best fit at the upper boundary of commonly recorded k20 rates (168 and 40 m year−1, respectively; Table 2) and TON at lowest levels (5 m year−1). Calculated wetland removal efficiency (Equation (3)) varied considerably for different nitrogen forms (Table 5). Modelling results show substantial reductions in NH4-N and NOx-N loads after passage through the wetland, except during the winter period when load reductions were more muted (Figure 7a,b; Table 5). Although the overall NH4-N and NOx-N mass removal efficiency for the wetland (Equation (3)) was 72.9% and 75.5%, respectively, the removal efficiency during the winter storms was only 43.5% for NH4-N and 67.3% for NOx-N. This is likely to result from the coincidence of high flows (resulting in reduced hydraulic residence times; HRT) and low water temperatures during winter (Figure 7d). However, despite reduced removal efficiency NOx-N and NH4-N mass removal was actually greater over the winter period because of the higher and more consistent loads received (Table 5). The modelling showed only 26% of net TON reduction in the wetland, with highest rates during summer/autumn storm events. Annual reduction of TN was 57.2%, varying from 39.8% during baseflow to 75% during summer/autumn storms.
4. Discussion
Water quality monitoring showed that the concentrations of NH4-N, NOx-N, Total Dissolved Nitrogen and Total-N were consistently lower at the outlet of the wetland regardless of flow conditions or seasonality, and, during the winter storms, all pollutants had significantly lower values. This was a strong indication that the wetland is very efficient at attenuating the poor water quality entering from upstream. Although the water quality measurements at the upper and lower wetland weirs indicated highest concentrations for TON in the surface water, the N entering in groundwater was mainly in the form of NOx-N, with relatively lower TON concentrations. The dynamic hydrological sub-model calibrated with flow data from upper and lower weirs and local climatological data provided a rational approach to estimate relative inflows to the wetland from different pathways. It showed the wetland was almost 95% groundwater fed. Linking this information with median concentrations of N species measured in the different inflows to the wetland showed that NOx-N was the dominant form of N entering (estimated as ~61% of load). The first order removal model estimated annual wetland net removal efficiency to be approximately 76% for NOx-N, 73% for NH4-N and 26% for TON. These forms of N are of course subject to transformations between different organic and inorganic forms via microbial processes (nitrification, denitrification, anammox and DNRA), assimilation by plants and microbes, adsorption to particulate phases (particularly NH4-N), and settling and storage of particulate TON in the wetland. We did not have sufficient data about relative changes in N species or balance between different processes to be able to usefully infer sequential processing rates (e.g., [39]) in these large and highly dynamic systems.
The apparent treatment efficiency (percentage removal) of the headwater wetland was high for NOx-N and TN compared with that of surface-flow constructed wetlands receiving tile drainage [3,33]. The wetland influent N loading rates in the present study were relatively low (TN ~60, NOx-N 33 mg m−2 day−1) compared to rates in excess of 400 mg m−2 day−1 measured in the constructed wetlands receiving tile drainage [3]. However, the best fit k20 reaction rate coefficient for NOx-N was also very high compared to those measured in field scale constructed wetlands [4,33].
As with many headwater pastoral headwater wetlands in New Zealand, our study wetland is likely to have formed since European settlement of New Zealand. Since the catchment was cleared of its indigenous forest land cover during the 19th and early 20th centuries, clay-rich soils have eroded from the steep slopes and accumulated in the bottom of the gully to form a wetland swale stabilised by the dense sward of amphibious glaucous sweetgrass (Glyceria declinata). Similar features have been described from south-east Australia [40]. Our study wetland was strongly was by groundwater. However, the wetland was also losing water occasionally to groundwater. We detected slight spatial declining trend along the wetland in nitrate-N and Total-N concentrations, which has been also detected by other studies. Xu et al. [9] also detected decline in Total-N and nitrate-N concentrations along the wetland but not in the concentrations of ammonium, which may be removed by transient sorption, nitrification, anammox and plant uptake, but also generated through mineralization of organic N, and dissimilatory nitrate reduction to Ammonium [4]. Ackerman et al. [41], Maxwell et al. [42], and Brauer et al. [43] detected significant pollutant reduction along the groundwater flow paths associated with seepage from a wetland. They illustrate that subsurface flux away from wetlands provides another mechanism for N removal. Shallow groundwater infiltrating though the base and sides of the wetland would pass through saturated layers of anoxic sedimentary and organic material and plant detritus with high denitrification potential [7,35,44]. High denitrification rates are common in wetlands and riparian areas that are rich with organic material. For example, Whitmire and Hamilton [45] using push–pull techniques found that nitrate added to groundwater and re-injected into wetland sediments disappeared rapidly relative to conservative tracers without any lag time, and was depleted to below detection limits (10–15 µg N L−1) within 5 to 20 h. In a 15N denitrification study in a similar natural riparian wetland intercepting shallow groundwater, Burns and Nguyen [46] measured >90% removal of injected 15NO3-N along a 100 cm flow path through the organic wetland soil, with essentially all of the 15NO3-N- removed within 30 cm. Extensive 15N tracer study performed on small headwater agricultural streams in the USA by Peterson [21] showed that NH4-N and NOx-N entering the streams was removed within tens to hundreds of meters and in one of the streams the denitrification rate was 0.045 µg N m−2 s−1 [47]. Denitrification consisted almost entirely of N2 production (99%), with very little N2O production occurring.
To describe the temperature response of denitrification, we used Arrhenius equation, which is most commonly used in this case and where the temperature has a stronger effect on the denitrification at lower temperatures [4,47]. Several authors have reported that denitrification has a “breakpoint” temperature, below which denitrification rates decrease more rapidly [9,48,49]. The exact temperature of the breakpoint is not known, but, in most of the studies, it varies usually between 10 and 12 °C [50]. However, Holtan-Hartwig et al. [51] found significant decrease in denitrification rates below 0 degrees and reported major deviations from the regular Arrhenius response at near freezing temperatures. Our results showed lower removal efficiency between 8 and 10 degrees, which coincided with high flows from surface runoff, which also had high loads of pollutants. Some studies have showed that wetlands receiving very variable flows show reduced nitrate removal performance [3,52], whereas Hernandez and Mitsch [53] found in the opposite that denitrification rates in the high marsh zone were significantly higher under flood pulsing (778 ± 92 μg N m−2 h−1) than under steady flow (328 ± 63 μg N m−2 h−1), but, in the low marsh and edge zones, flood pulses did not affect denitrification. Kadlec [4] also argues that, if wetland receives pollutants in pulses and the water interval between flows is sufficiently long, then the wetland will contain very low nitrate concentrations when another pulse arrives due to inter-event treatment. In the present study, removal efficiency declined during winter period, which coincided with low temperatures. Plants have been found to improve the wetland removal efficiency during the cold season. Yates et al. [54] demonstrated that Carex aquatilis helped to enhance nitrogen removal at cold temperatures and high hydraulic load. In addition, extended HRT could improve TN removal at low temperatures [9].
High denitrification rates are likely to be stimulated by the Glyceria vegetation that dominated the wetland. Matheson et al. [8], investigating the fate of 15N-NO3 in wetland soil microcosms, found that, in the presence of Glyceria, denitrification was elevated compared to unplanted microcosms and was the principal mechanism of NOx-N removal (61–63%). They attributed high denitrification rates and low Dissimilatory Nitrate Reduction to Ammonium (DNRA) to differences in soil redox state induced by the presence of the plant. During the growth season, plant and periphyton uptake of dissolved inorganic forms of N is also likely to have occurred. Subsequent senescence and decay of this plant material is likely to have generated autochthonous particulate and dissolved organic N that was exported from the wetland.
Organic N export from agricultural land is often overlooked as a significant pathway of diffuse N loss from pasture lands [55,56], which, in some instances, can be of similar magnitude to NOx-N losses. The estimated load of TON exiting from our wetland was 6.5 kg, which equates to 1.3 kg ha−1. This is lower than the median level reported by van Kessel [55] (4.0 kg N ha−1 year−1), and compared to dissolved organic N leaching rates measured in lowland pastoral soils elsewhere in New Zealand of 28–117 kg N ha−1 year−1 [57].
TON, the second largest component of TN entering the wetland, passed through the wetland with 26% net reduction. Wetlands characteristically accumulate a large pool of organic C and N, and experience with constructed wetlands suggests incoming organic nitrogen is reduced to a non-zero background concentration, created by residuals and wetland return fluxes [35]. A significant proportion of the TON load entered the wetland via surface runoff during storms, suggesting that much may have been associated with particulates [20]. Wilcock [36] previously studied the narrow (1–3 m) riparian-planted wetland swale that starts ~65 m below the lower weir of the headwater wetland in the present study. Based on their first two years of data, it is likely that around 50–60% of the TON exiting the headwater wetland would have been particulate organic N, likely associated with fine particulate detritus from plant litter and sloughed biofilm flocs. The remainder of the TON exported is expected to be dissolved organic forms, a significant proportion of which is likely to be bioavailable [58,59]. Analysis of the mass loading and removal data of Wilcock [36] shows that around 80% of the DON was removed in the ~350 m length of relatively aerobic wetland swale downstream of our lower weir, suggesting that much of it was not recalcitrant. There are several processes that can lead to a decrease in the DON concentration as it moves through the soil profile. Dissolved organic N is used as a substrate by soil microbes [55]. Wymore et al. [60] hypothesize that under a high N scenario microbes may be more energy limited (i.e., low C:N ratio) and DON may serve primarily as an energy source. However, they also found strong underlying seasonal patterns in the response to NO3- addition, indicating that the role of DON can switch between serving as a nutrient source to an energy source. The other process that can lead to a decrease in the DON concentration is the uptake of DON by plants. The uptake of organic N has been found to be widespread across different ecosystems and to consist of an important source of N, in particular in ecosystems where microbial biomass is prone to large seasonal fluctuations and contributes to the release of labile organic N [55,61].
For modelling of TON removal, we used a relatively low background concentration (20 mg/m3) based on concentrations measured during very low flow periods and in the wetland downstream [36]. The effect of background concentration on modelling results was evident as most of the time wetland received TON levels only slightly higher than the background concentration and therefore the first order removal was applied to a very small proportion of TON, which resulted also in low removal efficiency. During the storms, TON in loads was considerably higher than background concentration and the removal efficiency was also higher. There also appears to be little or no temperature dependence of organic nitrogen k-values [35]. This was also evident in this wetland as summer and winter TON concentrations for lower weir did not differ significantly (Figure 4). For modeling, we used a low temperature coefficient (1.01, Table 2), which resulted in very small seasonal variation in TON removal.
NH4-N constituted only 9.4% of the inflow and the overall reduction was up to 73%. Most of the NH4-N likely originated from the mineralised urea in cattle urine patches. The amount of N under a urine patch can be equivalent to an application rate of 700 to 1200 kg N ha–1 [62], much higher than the demand of N for any agricultural crop [55]. NH4-N is commonly the preferred form of N for uptake by wetland plants, and, therefore, a proportion may have been assimilated by plants within the wetland during the growth season.
It is interesting to note that cattle grazing of the study wetland had only a very limited immediate impact on water quality [29]. According to Hughes et al. [29], a measurable increase in pollutants (attributable to cattle generated disturbance) occurred only once out of 18 high-intensity grazing days. This occurred when a cow became entrapped in close proximity to the downstream monitoring weir on a day when wetland flow was elevated.
The nitrogen (especially NOx-N and NH4-N) removal efficiency of our wetland was likely reduced by variability of inflow rates because the wetland received high nutrient level pulses during the winter storms, which coincided with lower temperatures [33]. This may have been exacerbated by water flowing across the wetland surface and around the wetland edges during high flow events [22,44]. Although the removed load during the storms was on an average 10 times higher than during baseflow, the removal efficiency (percentage removal) was lower. Nutrient removal by the wetland could be further improved by increasing residence time in the wetland through construction of a series of check dams and/or outflow control structures, although these would be prone to damage and erosion during storm-flows. The alternative of buffering inflow variability would appear to be practically difficult in the steep terrain surrounding the wetland, without changing from pasture to shrub or forest.
5. Conclusions
In comparison to constructed wetlands receiving defined surface flows (e.g., wastewaters or tile drainage), estimating the nutrient removal effectiveness of natural wetlands receiving a variable mix of seepage and overland flows is challenging. The measured concentrations of nitrate-N, Dissolved Inorganic Nitrogen and Total-N were always lower at the outlet of the wetland regardless of flow conditions or seasonality, even during winter storms. This indicated that the wetland is an effective removal mechanism for N. Use of the simple dynamic model calibrated to continuous flow monitoring, meteorological data and periodic water quality sampling enabled the loads from different pathways to be partitioned and load reductions estimated. Despite the highly variable flow of the wetland, it showed very high net overall reduction of NOx-N and NH4-N. Seepage of shallow nitrate-rich groundwater in through the organic-rich, anaerobic base of the wetland is likely to have stimulated the high denitrification rates modelled. Net removal of TON was less effective, likely due to decay processes in the wetland ecosystem, which regenerate N from plant detritus and biofilms, resulting in a natural background concentration. The results show that small seepage wetlands in the headwaters of New Zealand streams can be very effective at removing nitrogen loads. As their nutrient removal efficiency per unit land area is high, farmers might be more willing to maintain these natural wetlands undrained and fence them to prevent stock access. The study helps to raise awareness of the functions and values of these small pastoral seepage wetlands located in the headwater areas of the catchments.
Acknowledgments
The authors thank Jonathan Armstrong for permitting this study to be carried out on his property and allowing unlimited access to the monitoring sites. George Timpany, George Payne, Pete Pattinson, Kerry Costley, James Sukias and Gareth van Assema (NIWA) undertook site setup and maintenance. Water quality samples were analysed by NIWA-Hamilton’s Water Quality Laboratory. The authors also wish to acknowledge Bob Kadlec (Wetland Management Services, Chelsea, MI, USA) for original conception of the modelling approach we have elaborated on here, Sandy Elliot (NIWA) for his advice on the modelling, and Kit Rutherford for review and useful comments on the manuscript. The first author is thankful to NIWA for hosting her for two years and for funding from the Marie Skłodowska-Curie Actions individual fellowships offered by the Horizon 2020 Programme under Research Executive Agency grant agreement number 660391, the Ernst Jaakson memorial stipend by University of Tartu Foundation, and institutional grant no. IUT 2-16 funded by the Estonian Ministry of Education and Research. Involvement of the other authors was supported through the AgResearch-led Clean Water: Productive Land Programme (C10X1006) and NIWA’s Strategic Science Investment Funding (Ministry of Business, Innovation and Employment). We thank all the anonymous reviewers for insightful comments on the paper, as these comments led us to an improvement of the work.
Author Contributions
Chris C. Tanner and Andrew O. Hughes conceived the study and designed the monitoring programme; Chris C. Palliser, Evelyn Uuemaa and Chris C. Tanner developed and tested the model; Evelyn Uuemaa, Chris C. Palliser, Andrew O. Hughes and Chris C. Tanner wrote the paper.
Conflicts of Interest
The authors declare no conflict of interest.
References
- Passeport, E.; Vidon, P.; Forshay, K.J.; Harris, L.; Kaushal, S.S.; Kellogg, D.Q.; Lazar, J.; Mayer, P.; Stander, E.K. Ecological Engineering Practices for the Reduction of Excess Nitrogen in Human-Influenced Landscapes: A Guide for Watershed Managers. Environ. Manag. 2013, 51, 392–413. [Google Scholar] [CrossRef] [PubMed]
- Wang, J.L.; Yang, Y.S. An approach to catchment-scale groundwater nitrate risk assessment from diffuse agricultural sources: A case study in the Upper Bann, Northern Ireland. Hydrol. Process. 2008, 22, 4274–4286. [Google Scholar] [CrossRef]
- Tanner, C.; Sukias, J. Multiyear nutrient removal performance of three constructed wetlands intercepting tile drain flows from grazed pastures. J. Environ. Qual. 2011, 40, 620–633. [Google Scholar] [CrossRef] [PubMed]
- Kadlec, R.H. Constructed marshes for nitrate removal. Crit. Rev. Environ. Sci. Technol. 2012, 42, 934–1005. [Google Scholar] [CrossRef]
- Baker, L.A. Design considerations and applications for wetland treatment of high-nitrate waters. Water Sci. Technol. 1998, 38, 389–395. [Google Scholar]
- Fisher, J.; Acreman, M.C. Wetland nutrient removal: A review of the Wetland nutrient removal: A review of the evidence. Hydrol. Earth Syst. Sci. Discuss. 2004, 8, 673–685. [Google Scholar] [CrossRef]
- Davidsson, T.E.; Stahl, M. The influence of organic carbon on nitrogen transformations in five wetland soils. Soil Sci. Soc. Am. J. 2000, 64, 1129–1136. [Google Scholar] [CrossRef]
- Matheson, F.E.; Nguyen, M.L.; Cooper, A.B.; Burt, T.P.; Bull, D.C. Fate of 15N-nitrate in unplanted, planted and harvested riparian wetland soil microcosms. Ecol. Eng. 2002, 19, 249–264. [Google Scholar] [CrossRef]
- Xu, J.H.; He, S.B.; Wu, S.Q.; Huang, J.C.; Zhou, W.L.; Chen, X.C. Effects of HRT and water temperature on nitrogen removal in autotrophic gravel filter. Chemosphere 2016, 147, 203–209. [Google Scholar] [CrossRef] [PubMed]
- Ambus, P.; Christensen, S. Denitrification variability and control in a riparian fen irrigated with agricultural drainage water. Soil Biol. Biochem. 1993, 25, 915–923. [Google Scholar] [CrossRef]
- Bernal, B.; Anderson, C.J.; Mitsch, W.J. Nitrogen Dynamics in Two Created Riparian Wetlands over Space and Time. J. Hydrol. Eng. 2017, 22. [Google Scholar] [CrossRef]
- Zaman, M.; Nguyen, M.L.; Gold, A.J.; Groffman, P.M.; Kellogg, D.Q.; Wilcock, R.J. Nitrous oxide generation, denitrification, and nitrate removal in a seepage wetland intercepting surface and subsurface flows from a grazed dairy catchment. Aust. J. Soil Res. 2008, 46, 565–577. [Google Scholar] [CrossRef]
- Matthew, C.; Horne, D.J.; Baker, R.D. Nitrogen loss: An emerging issue for the ongoing evolution of New Zealand dairy farming systems. Nutr. Cycl. Agroecosyst. 2010, 88, 289–298. [Google Scholar] [CrossRef]
- Statistics New Zealand. Agriculture, Horticulture, and Forestry. 2016. Available online: http://www.stats.govt.nz/infoshare/ (accessed on 7 March 2017).
- Parfitt, R.L.; Stevenson, B.A.; Dymond, J.R.; Schipper, L.A.; Baisden, W.T.; Ballantine, D.J. Nitrogen inputs and outputs for New Zealand from 1990 to 2010 at national and regional scales. N. Z. J. Agric. Res. 2012, 55, 241–262. [Google Scholar] [CrossRef]
- Tanner, C.; Sukias, J.; Burger, D. Realising the value of remnant wetlands as farm attenuation assets. In Moving Farm Systems to Improved Nutrient Attenuation; Currie, L.D., Burkitt, L.L., Eds.; Occassional Report No. 28; Fertilizer and Lime Research Centre, Massey University: Palmerston North, New Zealand, 2015. [Google Scholar]
- Ausseil, A.G.E.; Dymond, J.R.; Shepherd, J.D. Rapid mapping and prioritisation of wetland sites in the Manawatu-Wanganui region, New Zealand. Environ. Manag. 2007, 39, 316–325. [Google Scholar] [CrossRef] [PubMed]
- Gluckman, P. New Zealand’s Fresh Waters: Values, State Trends and Human Impacts; Office of the Prime Minister’s Chief Science Advisor: Wellington, New Zealand, 2017; Available online: http://www.pmcsa.org.nz/wp-content/uploads/PMCSA-Freshwater-Report.pdf (accessed on 7 February 2018).
- Organization for Economic Cooperation and Development (OECD). Third Environmental Performance Review: New Zealand 2017; Organization for Economic Cooperation and Development (OECD): Paris, France, 2017. [Google Scholar]
- McKergow, L.A.; Rutherford, J.C.; Timpany, G.C. Livestock-Generated Nitrogen Exports from a Pastoral Wetland. J. Environ. Qual. 2012, 41, 1681–1689. [Google Scholar] [CrossRef] [PubMed]
- Peterson, B.J. Control of Nitrogen Export from Watersheds by Headwater Streams. Science 2001, 292, 86–90. [Google Scholar] [CrossRef] [PubMed]
- Jordan, T.E.; Whigham, D.F.; Hofmockel, K.H.; Pittek, M.A. Nutrient and Sediment Removal by a Restored Wetland Receiving Agricultural Runoff. J. Environ. Qual. 2003, 32, 1534–1547. [Google Scholar] [CrossRef] [PubMed]
- Kovacic, D.A.; David, M.B.; Gentry, L.E.; Starks, K.M.; Cooke, R.A. Effectiveness of constructed wetlands in reducing nitrogen and phosphorus export from agricultural tile drainage. J. Environ. Qual. 2000, 29, 1262–1274. [Google Scholar] [CrossRef]
- Borin, M.; Tocchetto, D. Five year water and nitrogen balance for a constructed surface flow wetland treating agricultural drainage waters. Sci. Total Environ. 2007, 380, 38–47. [Google Scholar] [CrossRef] [PubMed]
- Knox, A.K.; Dahlgren, R.A.; Tate, K.W.; Atwill, E.R. Efficacy of natural wetlands to retain nutrient, sediment and microbial pollutants. J. Environ. Qual. 2008, 37, 1837–1846. [Google Scholar] [CrossRef] [PubMed]
- O’Geen, A.T.; Budd, R.; Gan, J.; Maynard, J.J.; Parikh, S.J.; Dahlgren, R.A. Mitigating Nonpoint Source Pollution in Agriculture with Constructed and Restored Wetlands. In Advances in Agronomy; Academic Press: Cambridge, MA, USA, 2010; Volume 108, ISBN 9780123810311. [Google Scholar]
- Wilcock, R.J.; Monaghan, R.M.; Quinn, J.M.; Campbell, A.M.; Thorrold, B.S.; Duncan, M.J.; McGowan, A.W.; Betteridge, K. Land-use impacts and water quality targets in the intensive dairying catchment of the Toenepi Stream, New Zealand. N. Z. J. Mar. Freshw. Res. 2006, 40, 123–140. [Google Scholar] [CrossRef]
- Müller, K.; Srinivasan, M.S.; Trolove, M.; McDowell, R.W. Identifying and linking source areas of flow and P transport in dairy-grazed headwater catchments, North Island, New Zealand. Hydrol. Process. 2010, 24, 3689–3705. [Google Scholar] [CrossRef]
- Hughes, A.; Tanner, C.; McKergow, L.; Sukias, J. Unrestricted dairy cattle grazing of a pastoral headwater wetland and its effect on water quality. Agric. Water Manag. 2016, 165, 72–81. [Google Scholar] [CrossRef]
- Porteous, A.; Mullan, B. The 2012-13 Drought: An Assessment and Historical Perspective; MPI Technical Paper No: 2012/18; Prepared for the Ministry for Primary Industries; National Institute of Water and Atmospheric Research: Wellington, New Zealand, 2013. [Google Scholar]
- Allen, R.G.; Pereira, L.S.; Raes, D.; Smith, M. Crop Evapotranspiration: Guidelines for Computing Crop Water Requirements; Food and Agriculture Organization of the United Nations (FAO): Rome, Italy, 1998; p. 300. ISBN 9251042195. [Google Scholar]
- StatSoft Inc StatSoft. Available online: http://www.statsoft.com/ (accessed on 1 November 2017).
- Kadlec, R.H. Nitrate dynamics in event-driven wetlands. Ecol. Eng. 2010, 36, 503–516. [Google Scholar] [CrossRef]
- French, R.H. Open-Channel Hydraulics; McGraw-Hill: New York, NY, USA, 1985. [Google Scholar]
- Kadlec, R.H.; Wallace, S.D. Treatment Wetlands, 2nd ed.; CRC Press: Boca Raton, FL, USA, 2009; ISBN 9781566705264. [Google Scholar]
- Wilcock, R.J.; Müller, K.; Van Assema, G.B.; Bellingham, M.A.; Ovenden, R. Attenuation of nitrogen, phosphorus and E. coli inputs from pasture runoff to surface waters by a farm wetland: The importance of wetland shape and residence time. Water Air Soil Pollut. 2012, 223, 499–509. [Google Scholar] [CrossRef]
- Wells, N.S.; Baisden, W.T.; Horton, T.; Clough, T.J. Spatial and temporal variations in nitrogen export from a New Zealand pastoral catchment revealed by stream water nitrate isotopic composition. Water Resour. Res. 2016, 52, 2840–2854. [Google Scholar] [CrossRef]
- Parfitt, R.L.; Baisden, W.T.; Schipper, L.A.; Mackay, A.D. Nitrogen inputs and outputs for new zealand at national and regional scales: Past, present and future scenarios. J. R. Soc. N. Z. 2008, 38, 71–87. [Google Scholar] [CrossRef]
- Tanner, C.; Kadlec, R.; Gibbs, M.; Sukias, J.; Nguyen, M. Nitrogen processing gradients in subsurface-flow treatment wetlands—Influence of wastewater characteristics. Ecol. Eng. 2002, 18, 499–520. [Google Scholar] [CrossRef]
- Zierholz, C.; Prosser, I.P.; Fogarty, P.J.; Rustomji, P. In-stream wetlands and their significance for channel filling and the catchment sediment budget, Jugiong Creek, New South Wales. Geomorphology 2001, 38, 221–235. [Google Scholar] [CrossRef]
- Ackerman, J.R.; Peterson, E.W.; Van der Hoven, S.; Perry, W.L. Quantifying nutrient removal from groundwater seepage out of constructed wetlands receiving treated wastewater effluent. Environ. Earth Sci. 2015, 74, 1633–1645. [Google Scholar] [CrossRef]
- Maxwell, E.; Peterson, E.W.; O’Reilly, C.M. Enhanced Nitrate Reduction within a Constructed Wetland System: Nitrate Removal within Groundwater Flow. Wetlands 2017, 37, 413–422. [Google Scholar] [CrossRef]
- Brauer, N.; Maynard, J.J.; Dahlgren, R.A.; O’Geen, A.T. Fate of nitrate in seepage from a restored wetland receiving agricultural tailwater. Ecol. Eng. 2015, 81, 207–217. [Google Scholar] [CrossRef]
- Rutherford, J.C.; Nguyen, M.L. Nitrate removal in riparian wetlands: Interactions between surface flow and soils. J. Environ. Qual. 2004, 33, 1133–1143. [Google Scholar] [CrossRef] [PubMed]
- Whitmire, S.L.; Hamilton, S.K. Rapid Removal of Nitrate and Sulfate in Freshwater Wetland Sediments. J. Environ. Qual. 2005, 34, 2062–2071. [Google Scholar] [CrossRef] [PubMed]
- Burns, D.A.; Nguyen, L. Nitrate movement and removal along a shallow groundwater flow path in a riparian wetland within a sheep-grazed pastoral catchment: Results of a tracer study. N. Z. J. Mar. Freshw. Res. 2002, 36, 371–385. [Google Scholar] [CrossRef]
- Mulholland, P.J.; Valett, H.M.; Webster, J.R.; Thomas, S.A.; Cooper, L.W.; Hamilton, S.K.; Peterson, B.J. Stream denitrification and total nitrate uptake rates measured using a field 15N tracer addition approach. Limnol. Oceanogr. 2004, 49, 809–820. [Google Scholar] [CrossRef]
- Malhi, S.S.; McGill, W.B.; Nyborg, M. Nitrate losses in soils: Effect of temperature, moisture and substrate concentration. Soil Biol. Biochem. 1990, 22, 733–737. [Google Scholar] [CrossRef]
- Addy, K.; Gold, A.; Nowicki, B.; McKenna, J.; Stolt, M.; Groffman, P. Denitrification capacity in a subterranean estuary below a Rhode Island fringing salt marsh. Estuaries 2005, 28, 896–908. [Google Scholar] [CrossRef]
- Schaefer, S.C.; Alber, M. Temperature controls a latitudinal gradient in the proportion of watershed nitrogen exported to coastal ecosystems. Biogeochemistry 2007, 85, 333–346. [Google Scholar] [CrossRef]
- Holtan-Hartwig, L.; Dörsch, P.; Bakken, L.R. Low temperature control of soil denitrifying communities: Kinetics of N2O production and reduction. Soil Biol. Biochem. 2002, 34, 1797–1806. [Google Scholar] [CrossRef]
- Tanner, C.; Kadlec, R. Influence of hydrological regime on wetland attenuation of diffuse agricultural nitrate losses. Ecol. Eng. 2013, 56, 79–88. [Google Scholar] [CrossRef]
- Hernandez, M.E.; Mitsch, W.J. Denitrification in created riverine wetlands: Influence of hydrology and season. Ecol. Eng. 2007, 30, 78–88. [Google Scholar] [CrossRef]
- Yates, C.N.; Varickanickal, J.; Cousins, S.; Wootton, B. Testing the ability to enhance nitrogen removal at cold temperatures with C. aquatilis in a horizontal subsurface flow wetland system. Ecol. Eng. 2016, 94, 344–351. [Google Scholar] [CrossRef]
- Van Kessel, C.; Clough, T.; van Groenigen, J.W. Dissolved Organic Nitrogen: An Overlooked Pathway of Nitrogen Loss from Agricultural Systems? J. Environ. Qual. 2009, 38, 393–401. [Google Scholar] [CrossRef] [PubMed] [Green Version]
- Vogt, E.; Braban, C.F.; Dragosits, U.; Durand, P.; Sutton, M.A.; Theobald, M.R.; Rees, R.M.; McDonald, C.; Murray, S.; Billett, M.F. Catchment land use effects on fluxes and concentrations of organic and inorganic nitrogen in streams. Agric. Ecosyst. Environ. 2015, 199, 320–332. [Google Scholar] [CrossRef]
- Ghani, A.; Müller, K.; Dodd, M.; Mackay, A. Dissolved organic matter leaching in some contrasting New Zealand pasture soils. Eur. J. Soil Sci. 2010, 61, 525–538. [Google Scholar] [CrossRef]
- Pellerin, B.A.; Wollheim, W.M.; Hopkinson, C.S.; McDowell, W.H.; Williams, M.R.; Vörösmarty, C.J.; Daley, M.L. Role of wetlands and developed land use on dissolved organic nitrogen concentrations and DON/TDN in northeastern U.S. rivers and streams. Limnol. Oceanogr. 2004, 49, 910–918. [Google Scholar] [CrossRef]
- Seitzinger, S.P.; Sanders, R.W.; Styles, R. Bioavailability of DON from natural and anthropogenic sources to estuarine plankton. Limnol. Oceanogr. 2002, 47, 353–366. [Google Scholar] [CrossRef]
- Wymore, A.S.; Rodríguez-Cardona, B.; McDowell, W.H. Direct response of dissolved organic nitrogen to nitrate availability in headwater streams. Biogeochemistry 2015, 126, 1–10. [Google Scholar] [CrossRef]
- Lipson, D.; Näsholm, T. The unexpected versatility of plants: Organic nitrogen use and availability in terrestrial ecosystems. Oecologia 2001, 128, 305–316. [Google Scholar] [CrossRef] [PubMed]
- Jarvis, S.C.; Scholefi, D.; Pain, B. Nitrogen cycling in grazing systems. In Nitrogen Fertilization in the Environment; Bacon, P.E., Ed.; Marcel Dekker: New York, NY, USA, 1995. [Google Scholar]
Figure 1.
Wetland study site location in the North Island of New Zealand, showing sampling weirs, piezometers, overland flow samplers and conceptual tanks used for modelling of wetland hydrology and N attenuation.
Figure 1.
Wetland study site location in the North Island of New Zealand, showing sampling weirs, piezometers, overland flow samplers and conceptual tanks used for modelling of wetland hydrology and N attenuation.

Figure 2.
Conceptual diagram of the wetland model. Rainfall (R), evapotranspiration (ET), groundwater (GW) seepage in or out based on each tank’s area, surface runoff (SR), and first order N removal adjusted by ambient temperature are calculated for each tank on an hourly time step.
Figure 2.
Conceptual diagram of the wetland model. Rainfall (R), evapotranspiration (ET), groundwater (GW) seepage in or out based on each tank’s area, surface runoff (SR), and first order N removal adjusted by ambient temperature are calculated for each tank on an hourly time step.
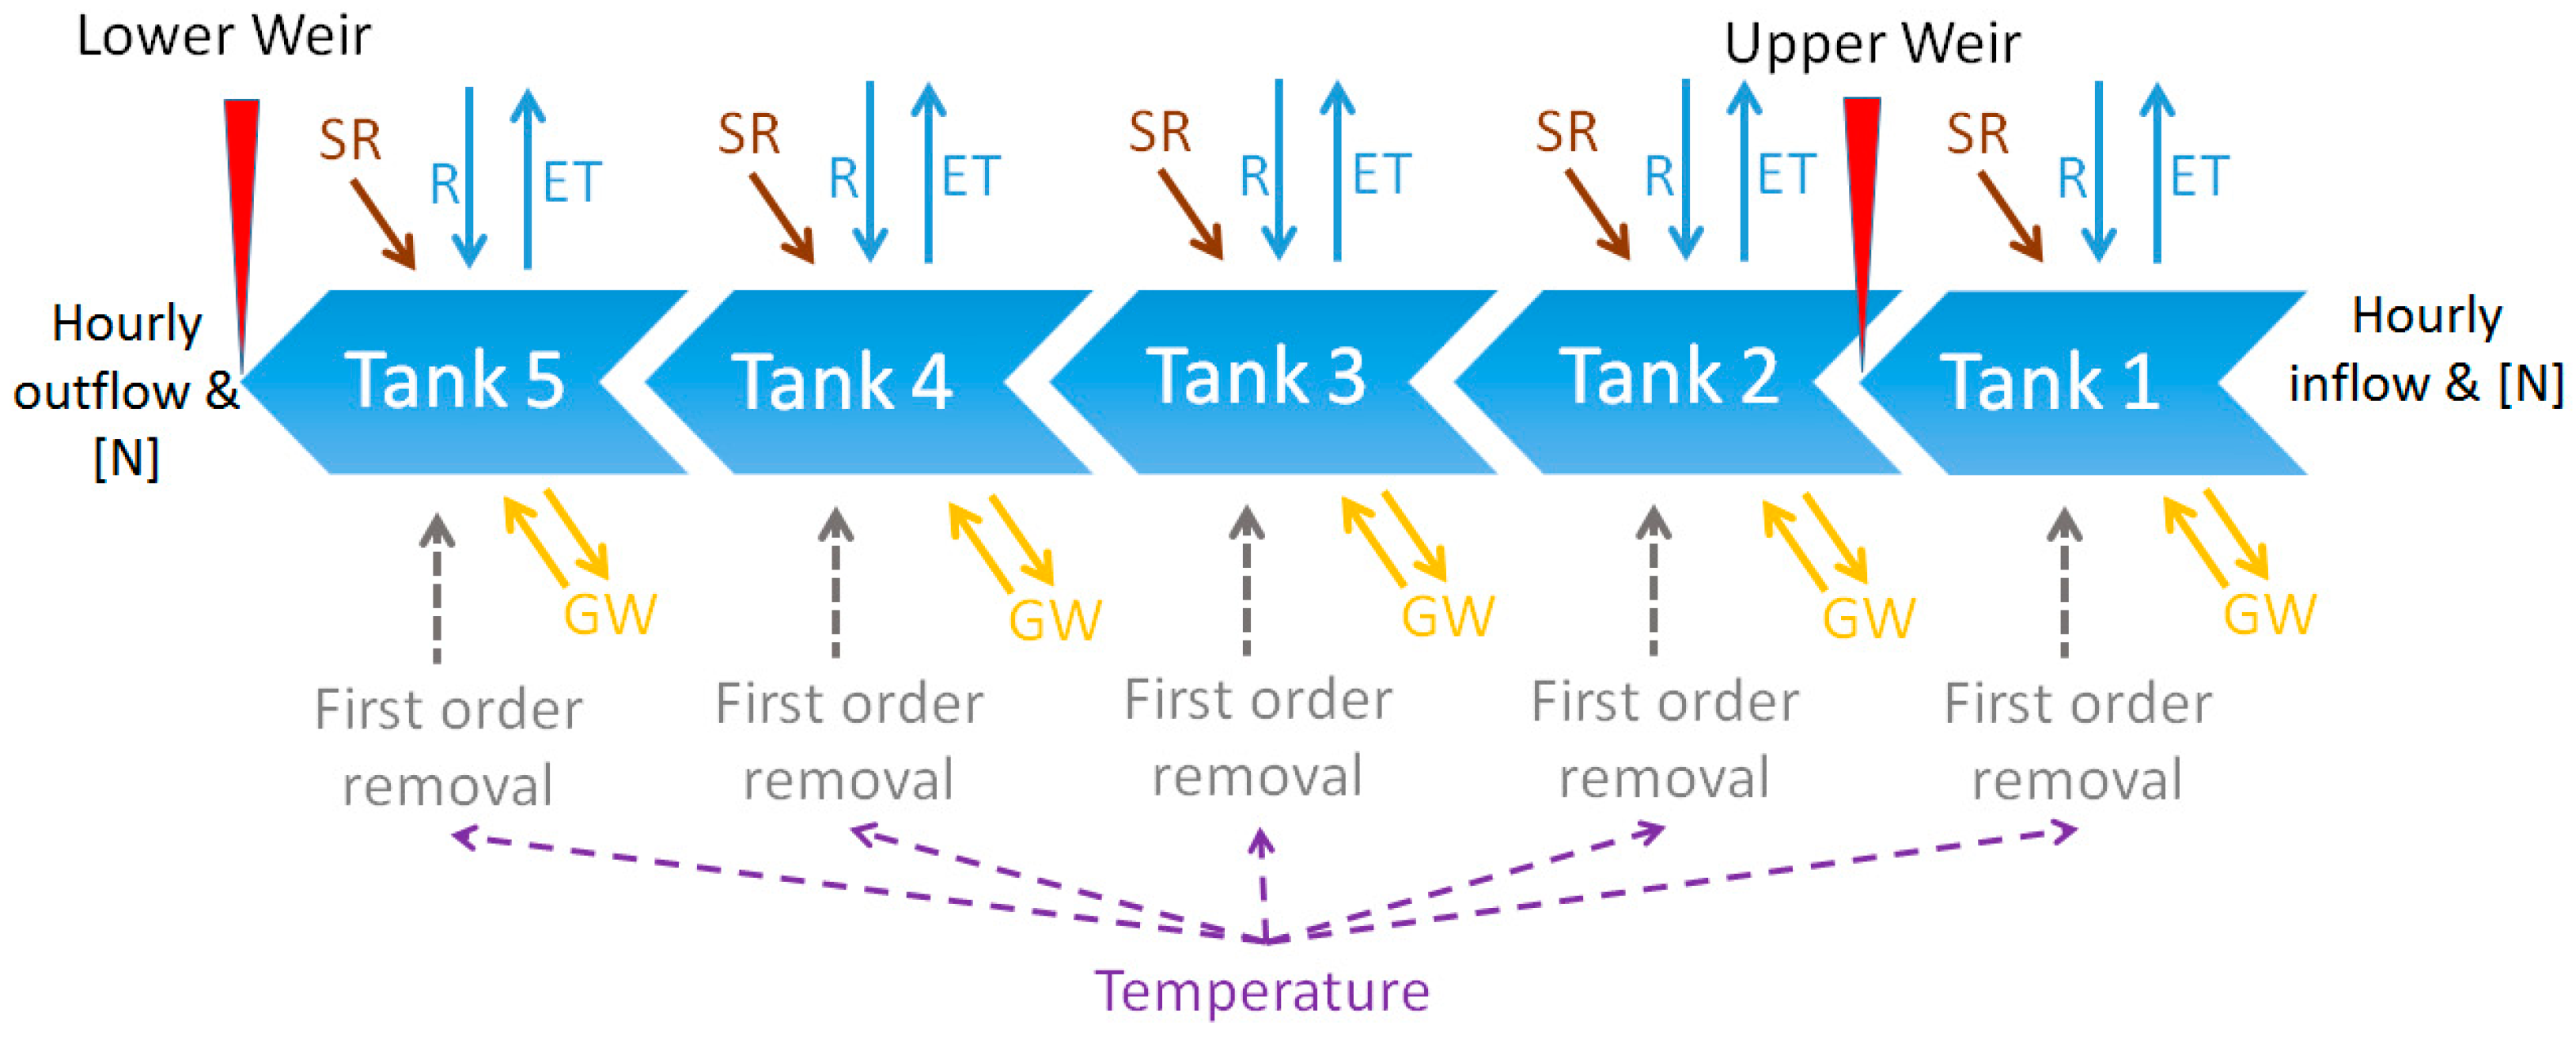
Figure 3.
Measured rainfall, upper weir inflow and lower weir outflow of the wetland (with Southern Hemisphere seasons indicated). Year day = 0 corresponds to 1 January 2012. Inflow extends to a maximum of 74.5 m3/h and outflow to 197.6 m3/h, which occurred during an extreme storm in 23 July (year day = 205).

Figure 4.
Box plots of different forms of N during baseflow, summer storm flow and winter storm flow at the upper (unshaded boxes) and lower (shaded boxes) wetland weirs. The ‘summer’ period is defined as the period between the months of December and May while ‘winter’ is defined as June through to November. Based on Kruskal–Wallis test and post-hoc multiple comparisons: B—statistically significant difference from baseflow, S—statistically significant difference from summer storms, W—statistically significant difference from winter storms (p < 0.05).
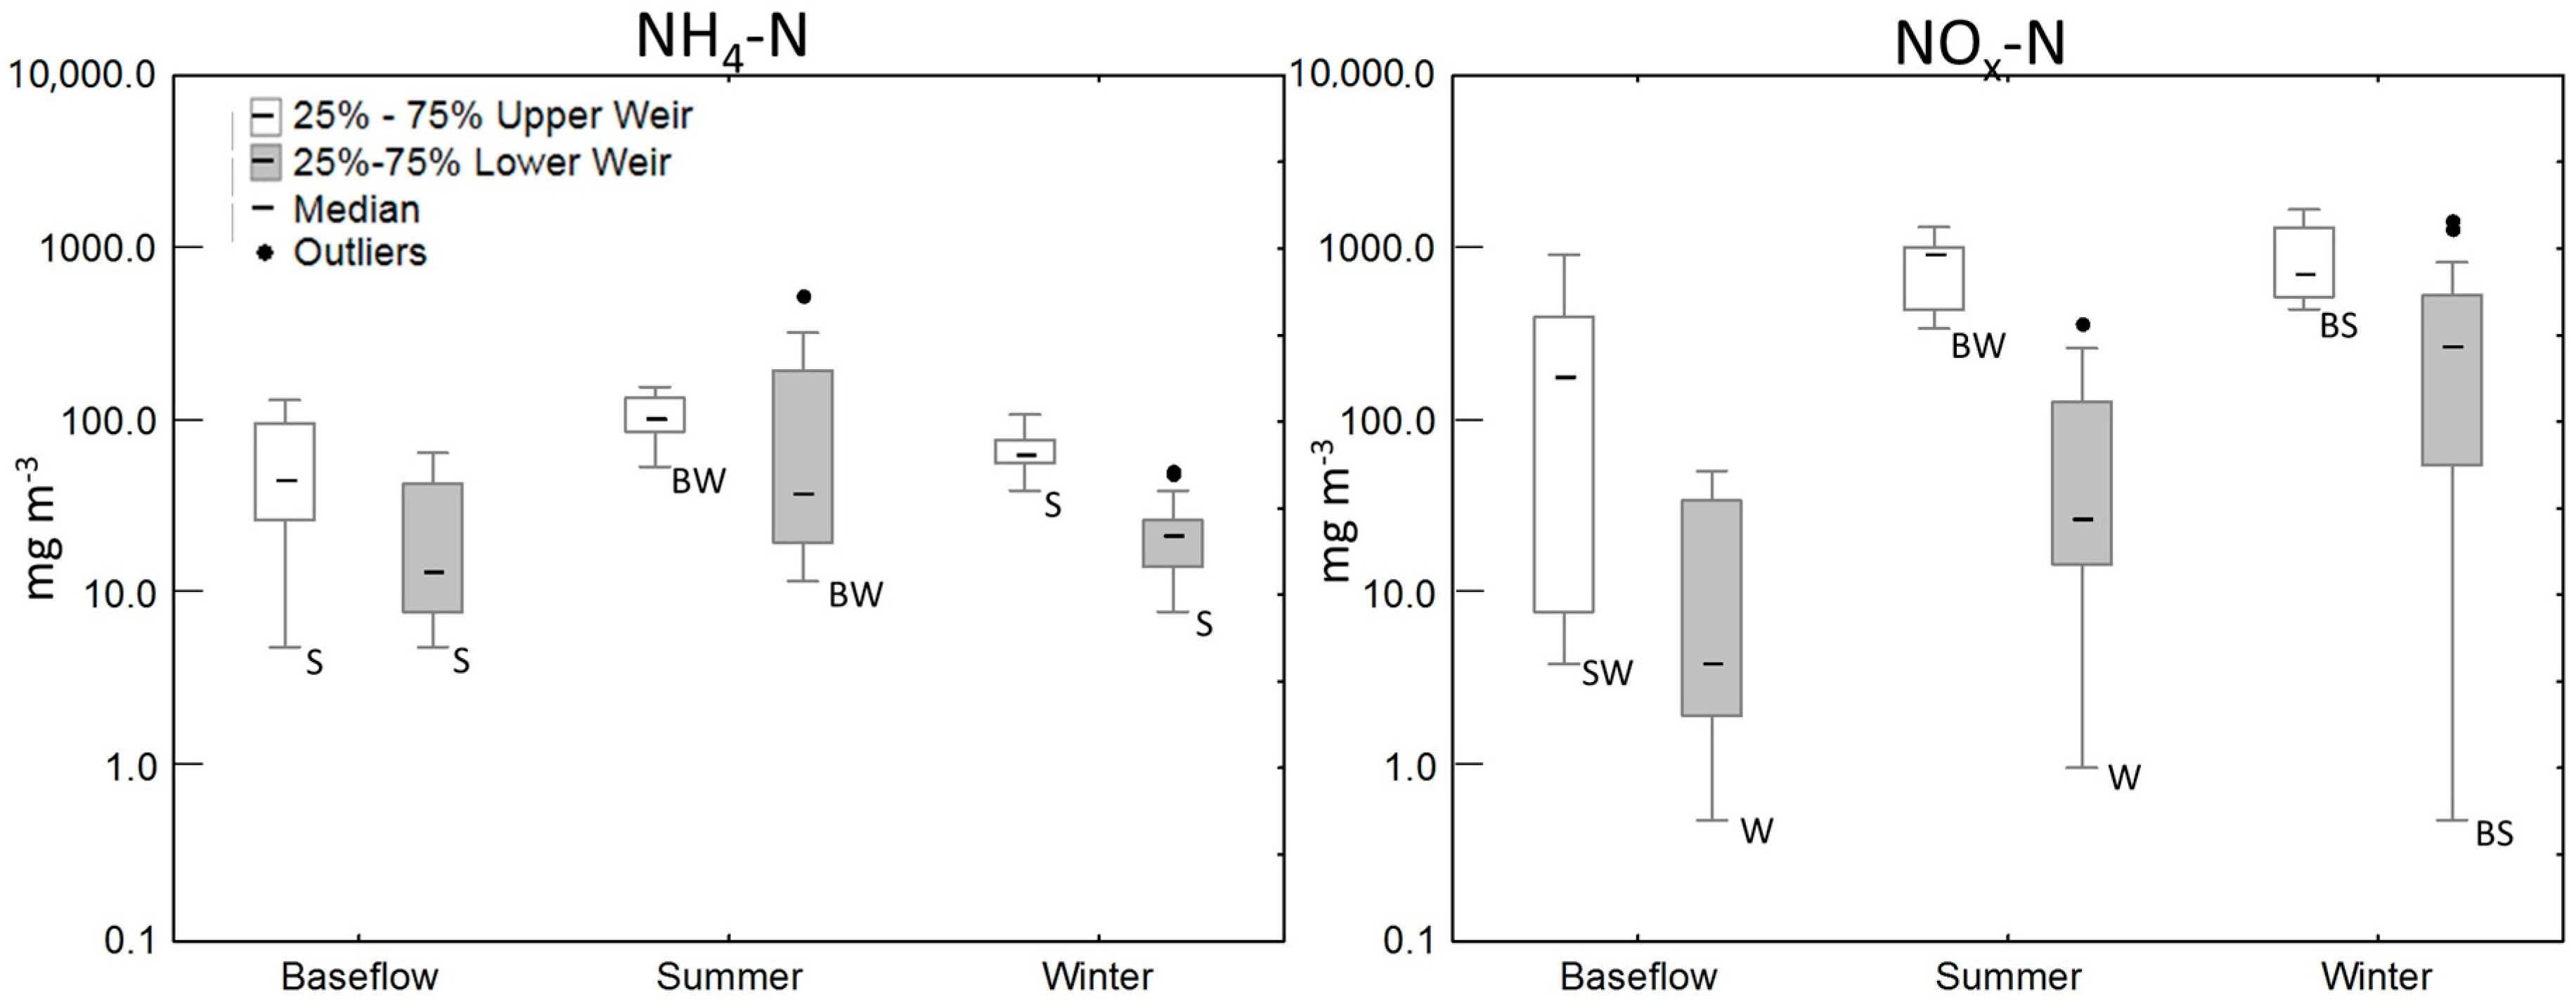

Figure 5.
Box plots of different forms of N from piezometers within the wetland (Piezo IN), piezometers adjacent to the wetland (Piezo OUT) and overland flow samplers (OLF). Based on Kruskal–Wallis test and post hoc multiple comparisons: PIN—statistically significant difference from piezometers within wetland, POUT—statistically significant difference from piezometers adjacent to the wetland, O—statistically significant difference from overland flow (p < 0.05).

Figure 6.
Proportions of total nitrogen components entering and leaving the wetland, and removed. P = precipitation; SR = Surface runoff; GW = Groundwater; LW = Lower weir.
Figure 6.
Proportions of total nitrogen components entering and leaving the wetland, and removed. P = precipitation; SR = Surface runoff; GW = Groundwater; LW = Lower weir.
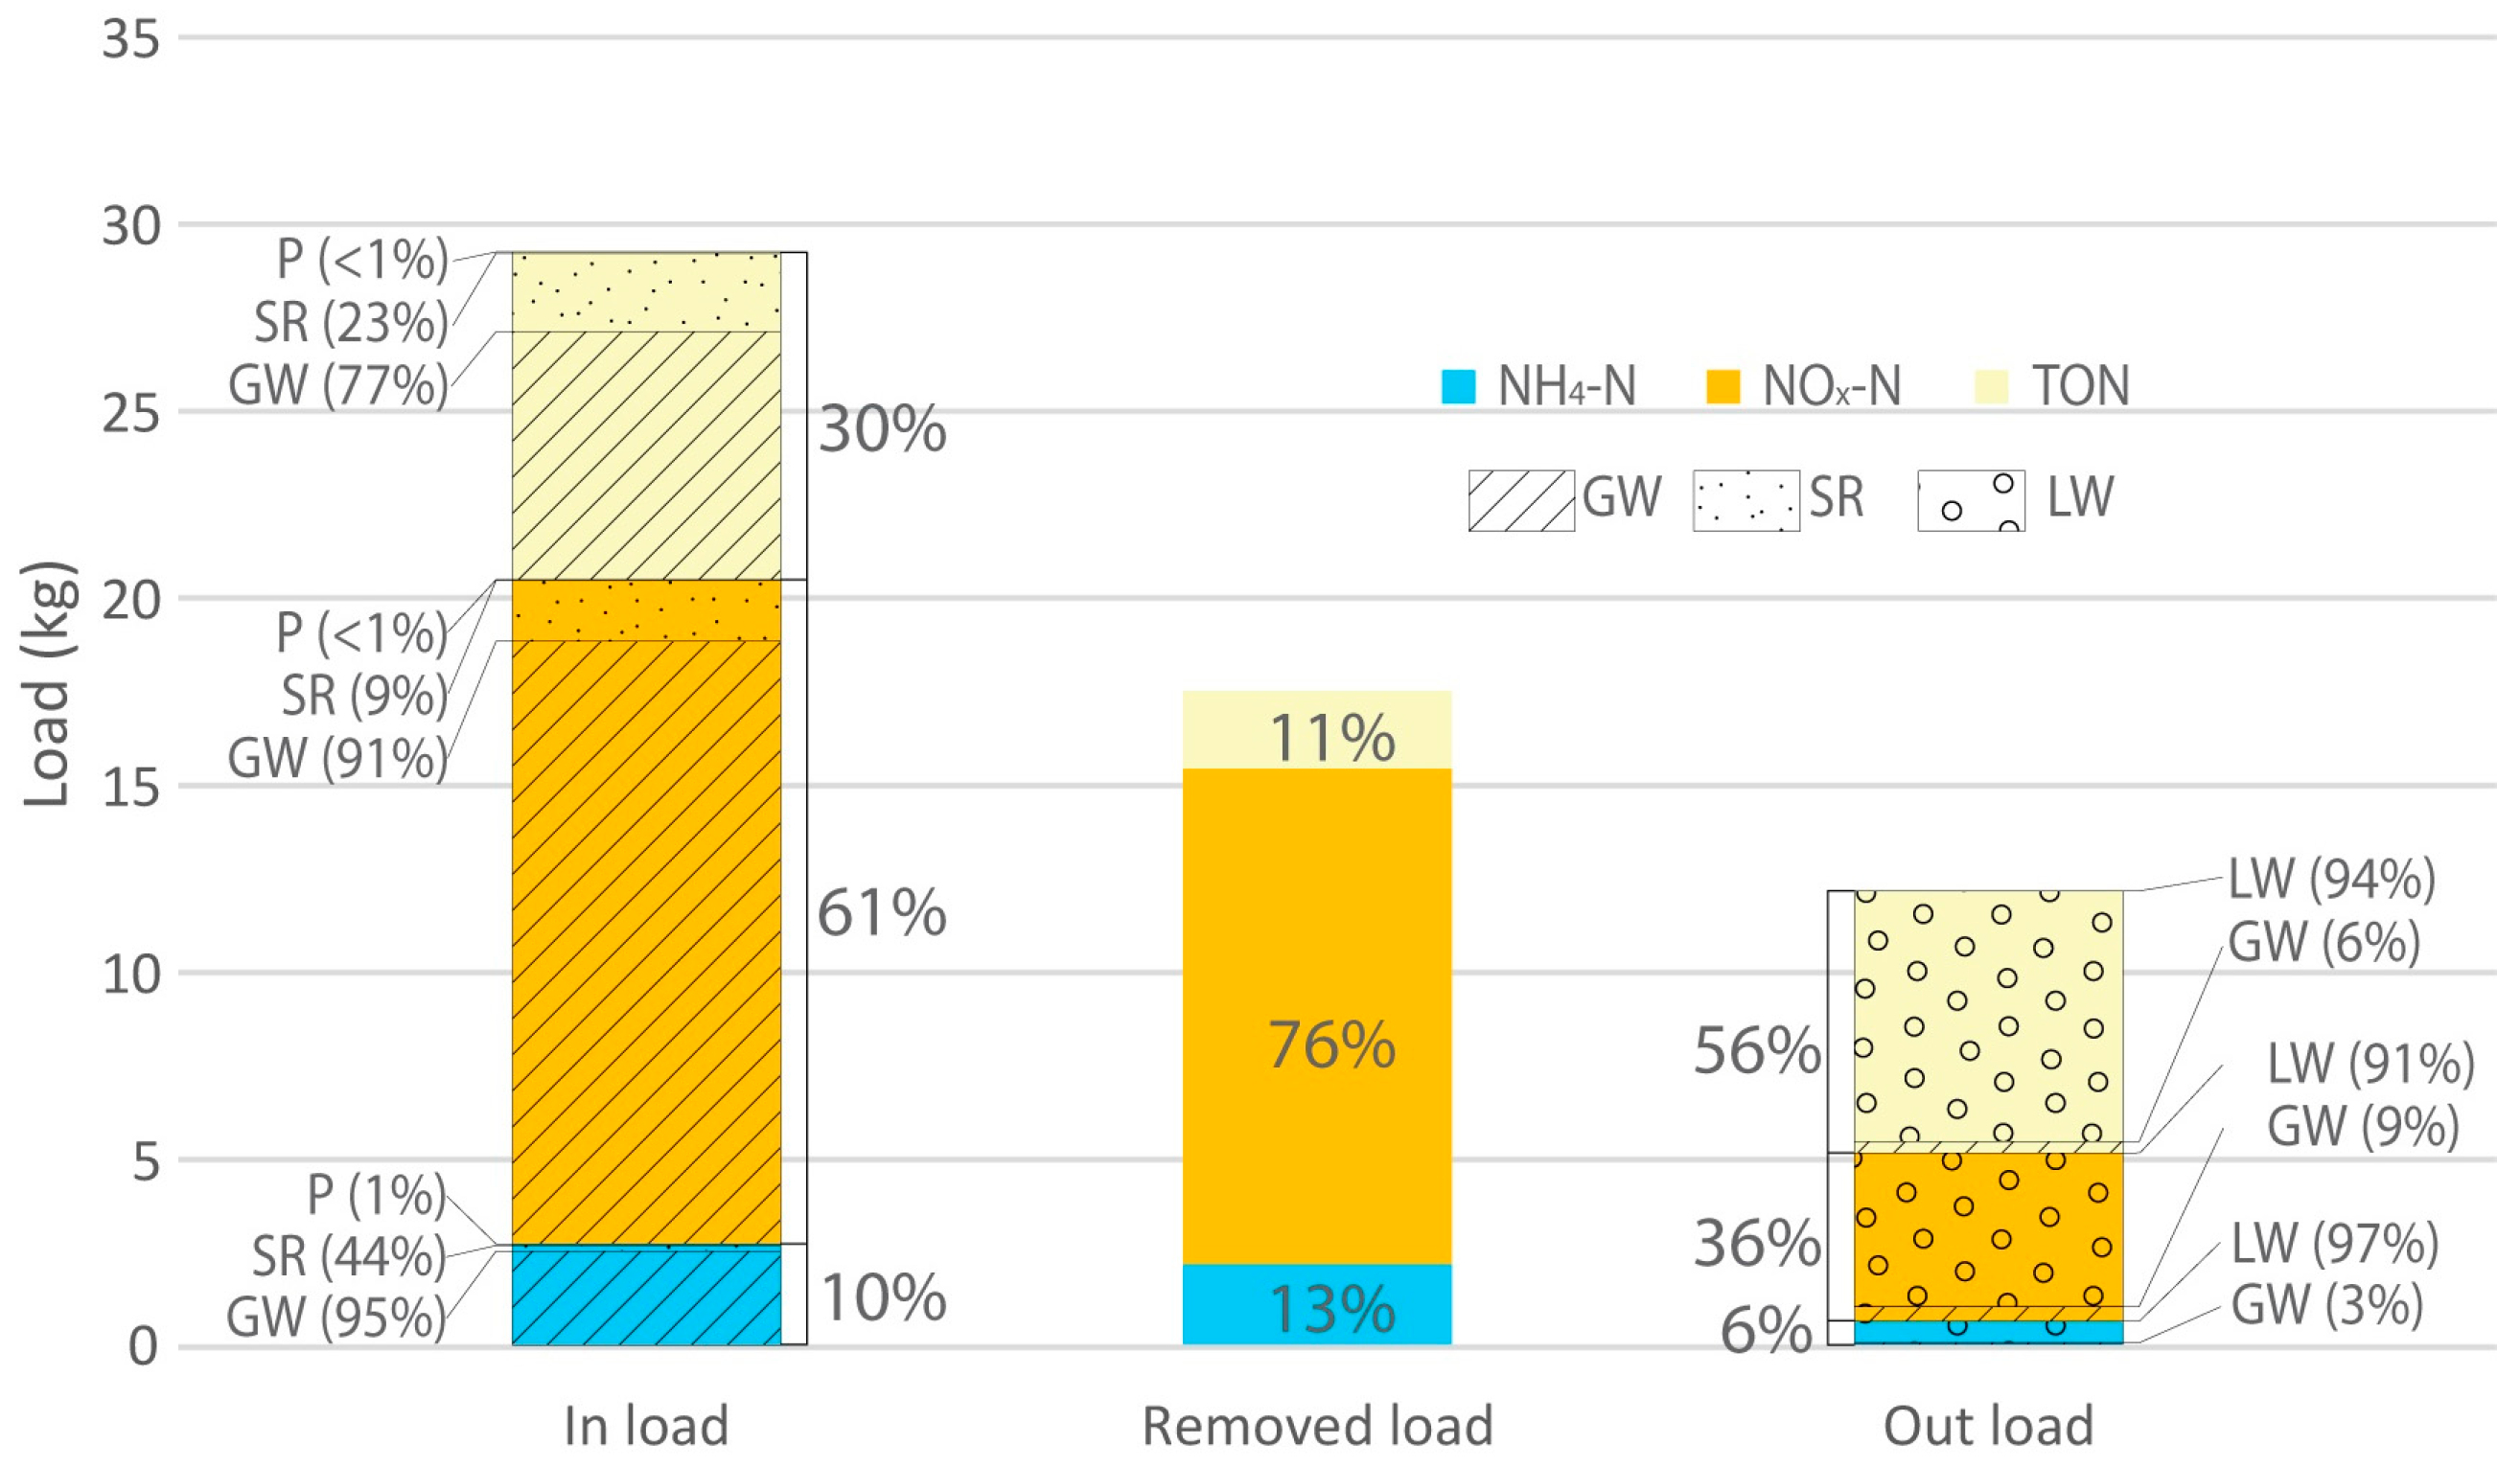
Figure 7.
Time series for 2012 showing modelled and measured inflow and outflow NH4-N (a), NOx-N (b) and TON (c) loads at UW and LW; and (d) modelled hydraulic retention times (HRT).
Figure 7.
Time series for 2012 showing modelled and measured inflow and outflow NH4-N (a), NOx-N (b) and TON (c) loads at UW and LW; and (d) modelled hydraulic retention times (HRT).

Table 1.
Summary of wetland tank characteristics.
| Wetland Area (m2) | Apparent Catchment Area * (m2) | Over 15° Slope Areas Draining to the Wetland (m2) | |
|---|---|---|---|
| Tank 1 | 56 | 23,710 | 3613 |
| Tank 2 | 191 | 4408 | 803 |
| Tank 3 | 173 | 14,397 | 1686 |
| Tank 4 | 409 | 4697 | 1021 |
| Tank 5 | 637 | 4341 | 1096 |
| Total | 1467 | 51,553 | 8218 |
Note: * Excluding areas draining to upstream tanks.
Table 2.
Ranges for removal rate coefficients (k), temperature factors (θ) and background concentrations used for modelling NH4-N, NOx-N, TON and TN removal.
Table 2.
Ranges for removal rate coefficients (k), temperature factors (θ) and background concentrations used for modelling NH4-N, NOx-N, TON and TN removal.
| k20 | C* (mg/m3) | θ | Reference | |
|---|---|---|---|---|
| NH4-N | 5–86 | 0 | 1.049 | Kadlec and Wallace [35] |
| NOx-N | 5–168 | 0 | 1.106 | Kadlec [4] |
| TON | 5–62 | 20 | 1.017 | Wilcock [36] |
| TN | 4–40 | 200 | 1.056 | Kadlec and Wallace [35] |
Table 3.
Median and min-max concentrations of forms of nitrogen by sampling site.
| Site | n | NH4-N (mg/m3) | NOx-N (mg/m3) | TON (mg/m3) | TN (mg/m3) |
|---|---|---|---|---|---|
| Piezometers adjacent to the wetland | 15 | 99 (27–389) | 55 (1–885) | 441 (148–3266) | 688 (235–3850) |
| Piezometers within the wetland | 44 | 17 (2–2440) | 956 (1–3930) | 461 (139–5927) | 2495 (533–10700) |
| Overland-flow (OLF) | 6 | 228 (39–1490) | 3165 (367–4860) | 3929 (2134–8352) | 7320 (4830–13,500) |
| Upper weir | |||||
| Baseflow | 11 | 46 (5–733) | 186 (4–923) | 628 (266–1591) | 880 (640–2510) |
| Summer/Autumn | 9 | 105 (55–487) | 934 (346–1330) | 2640 (2005–4263) | 3851 (2630–6080) |
| Winter/Spring | 36 | 65 (40–110) | 715 (447–1680) | 2383 (1247–3595) | 3245 (2490–4360) |
| Lower weir | |||||
| Baseflow | 15 | 14 (5–177) | 4 (1–52) | 322 (117–1594) | 381 (129–1600) |
| Summer/Autumn | 33 | 43 (12–537) | 28 (1–376) | 586 (387–4601) | 864 (550–4830) |
| Winter/Spring | 47 | 22 (8–67) | 280 (1–1450) | 1009 (167–1768) | 1490 (321–2130) |
Table 4.
Comparison of upper and lower weir nitrogen variables. Mann–Whitney U Tests statistics shown in bold are significant at p < 0.05.
Table 4.
Comparison of upper and lower weir nitrogen variables. Mann–Whitney U Tests statistics shown in bold are significant at p < 0.05.
| Variable | Baseflow | Summer Storms | Winter Storms | |||
|---|---|---|---|---|---|---|
| Z | p-Value | Z | p-Value | Z | p-Value | |
| NH4-N | 1.54 | 0.12 | 1.27 | 0.20 | 7.52 | 0.00 |
| NOx-N | 3.24 | 0.00 | 4.52 | 0.00 | 5.72 | 0.00 |
| TDN | 2.33 | 0.02 | 4.26 | 0.00 | 7.02 | 0.00 |
| TON | 1.57 | 0.12 | 4.28 | 0.00 | 7.32 | 0.00 |
| TN | 2.49 | 0.01 | 4.31 | 0.00 | 7.77 | 0.00 |
Table 5.
Estimated NH4-N, NOx-N, TON and TN daily mass loading and removal rates, and wetland performance for different flow conditions.
Table 5.
Estimated NH4-N, NOx-N, TON and TN daily mass loading and removal rates, and wetland performance for different flow conditions.
| Flow-Type | Daily Mass Loading Rate (mg/m2/day) | Daily Mass Removal Rate (mg/m2/day) | Performance (%) | |
|---|---|---|---|---|
| NH4-N | Winter/Spring storms | 49 | 21 | 44 |
| Summer/Autumn storms | 6 | 5 | 90 | |
| Baseflow | 4 | 1 | 78 | |
| All | 5 | 4 | 73 | |
| NO3-N | Winter/Spring storms | 730 | 492 | 67 |
| Summer/Autumn storms | 48 | 47 | 97 | |
| Baseflow | 21 | 16 | 80 | |
| All | 33 | 25 | 76 | |
| TON | Winter/Spring storms | 328 | 114 | 35 |
| Summer/Autumn storms | 38 | 17 | 44 | |
| Baseflow | 11 | 2.0 | 20 | |
| All | 16 | 4 | 26 | |
| TN | Winter/Spring storms | 1147 | 589 | 51 |
| Summer/Autumn storms | 95 | 71 | 75 | |
| Baseflow | 41 | 16 | 40 | |
| All | 60 | 35 | 57 |
© 2018 by the authors. Licensee MDPI, Basel, Switzerland. This article is an open access article distributed under the terms and conditions of the Creative Commons Attribution (CC BY) license (http://creativecommons.org/licenses/by/4.0/).
Share and Cite
MDPI and ACS Style
Uuemaa, E.; Palliser, C.C.; Hughes, A.O.; Tanner, C.C. Effectiveness of a Natural Headwater Wetland for Reducing Agricultural Nitrogen Loads. Water 2018, 10, 287. https://doi.org/10.3390/w10030287
AMA Style
Uuemaa E, Palliser CC, Hughes AO, Tanner CC. Effectiveness of a Natural Headwater Wetland for Reducing Agricultural Nitrogen Loads. Water. 2018; 10(3):287. https://doi.org/10.3390/w10030287
Chicago/Turabian StyleUuemaa, Evelyn, Chris C. Palliser, Andrew O. Hughes, and Chris C. Tanner. 2018. "Effectiveness of a Natural Headwater Wetland for Reducing Agricultural Nitrogen Loads" Water 10, no. 3: 287. https://doi.org/10.3390/w10030287
Note that from the first issue of 2016, this journal uses article numbers instead of page numbers. See further details here.