Experimental Analysis of the Hydraulic Performance of Wire-Wound Filter Cartridges in Domestic Plants


1
Department of Civil Engineering, Università degli Studi di Salerno, 84084 Fisciano, Italy
2
Department of Civil and Mechanical Engineering, Università di Cassino e del Lazio Meridionale, 03043 Cassino, Italy
*
Author to whom correspondence should be addressed.
Water 2018, 10(3), 309; https://doi.org/10.3390/w10030309
Submission received: 18 January 2018
/
Revised: 8 March 2018
/
Accepted: 8 March 2018
/
Published: 13 March 2018
Abstract
:Among the treatment processes in water networks—of increasing importance in recent decades due to the progressive deterioration of water quality—filtration still represents a major solution. The present work focuses in particular on the filtration of drinking water with wire-wound filter cartridges, the most widely used type of cartridge in domestic plants among the commercially available cartridges, due to their efficiency and relatively low costs. Specifically, the hydraulic performance of these cartridges was analyzed, i.e., mainly the effect of their introduction into a hydraulic system in terms of head losses. The local pressure drops produced by the cartridges may, in fact, create problems in hydraulic plants already characterized by low pressures, where pressure levels may fall below the minimum limit recommended to ensure the smooth operation of domestic devices. To this aim, a set of experiments was conducted in a pilot circuit in the Laboratory of Environmental and Maritime Hydraulics (LIDAM) at University of Salerno, where pressure drops produced by the cartridges were measured in different operating conditions. The artificially dirty conditions of the wire-wound filters were analyzed in order to evaluate the effect of the filter obstruction. The analysis provided some useful information about the performance and duration of these filters, as well as suggestions for more efficient commercial filters.
1. Introduction
Among the different water treatment techniques—increasingly necessary nowadays due to pollution and environmental degradation attributable to the progressive industrialization and the uncontrolled social and economic development—filtration still represents the main solution. Almost all the domestic apparatus which make use of water are equipped with internal filtration elements or are installed with proper filtration systems.
The present study is focused on the drinking water filtration and, in particular, on the hydraulic performance of wire-wound filter cartridges, the most widely used in domestic water systems among the commercially available cartridges, due to their efficiency and relatively low costs. This cartridge was also one of the first to be made in standard dimensions, able to fit into housings from a variety of manufacturers, and was a major form of filter cartridge for a long period. It is a very effective filter, with filtration not only in the apertures between the turns of the yarn, but between the fibers in the yarn as well [1]. For this reason, it is also the cartridge that makes easier and more controlled the experiments on progressive clogging of the filter, a condition which is the objective of this research as well.
More specifically, the effects in terms of head losses produced by the installation of wire-wound filter cartridges in a pilot laboratory plant have been analyzed. In fact, these effects are not negligible and may determine pressure values not compatible with those required for a proper functioning of some electro-mechanical elements present in domestic water systems (dishwashers, washing machines, boilers, etc.). The gradual clog of the filter by the solid particles suspended in the flowing water was also analyzed, since it produces, with prolonged use, an increase in head losses, which may further compromise the operating conditions of the plant.
An analysis of the literature shows very few studies on the hydraulic analysis of filtering cartridges. Besides, these works are usually focused on different features, such as water quality aspects or efficiency of the filtration process, or on specific topics, such as the removal of specific substances from drinking water [2,3,4,5]. An ad-hoc pilot circuit was, therefore, designed and built at the Laboratory of Environmental and Maritime Hydraulics (LIDAM) of the Department of Civil Engineering (DiCiv), University of Salerno. The aim of the conducted experiments was to measure the head losses produced by wire-wound filter cartridges progressively clogged by fine solid particles (see also [6,7]) and to contribute to the better understanding of the clogging process and its effect on the pressure drops. This may suggest the optimal times of replacement of the cartridges and the design of more competitive mechanical filters, capable of producing—the number of solid particles being equal—lower head losses than the commercial ones.
2. Materials and Methods
2.1. Wire-Wound Polyester Filter Cartridges
A wire-wound filter cartridge works for mechanical filtration. It is produced by winding a wire on a central support core, both made of pure polypropylene, very tenacious and non-toxic, that make it suitable also for the treatment of drinking water. The main uses are as follows: protection of boilers, taps, washing machines, pre-filter for pumps, irrigation systems, industrial installations of several types.
The wire-wound filter cartridges tested in the laboratory in this work were produced by “Acqua Brevetti 95 S.r.l.”, Mestrino (PD), and “Idrocosmotek, Fimi S.p.A.”, Izano, Italy. However, since their characteristics agree with the standards of most brands on the market, results, which are very similar in the two cases, can be considered generalizable to other commercial cartridges.
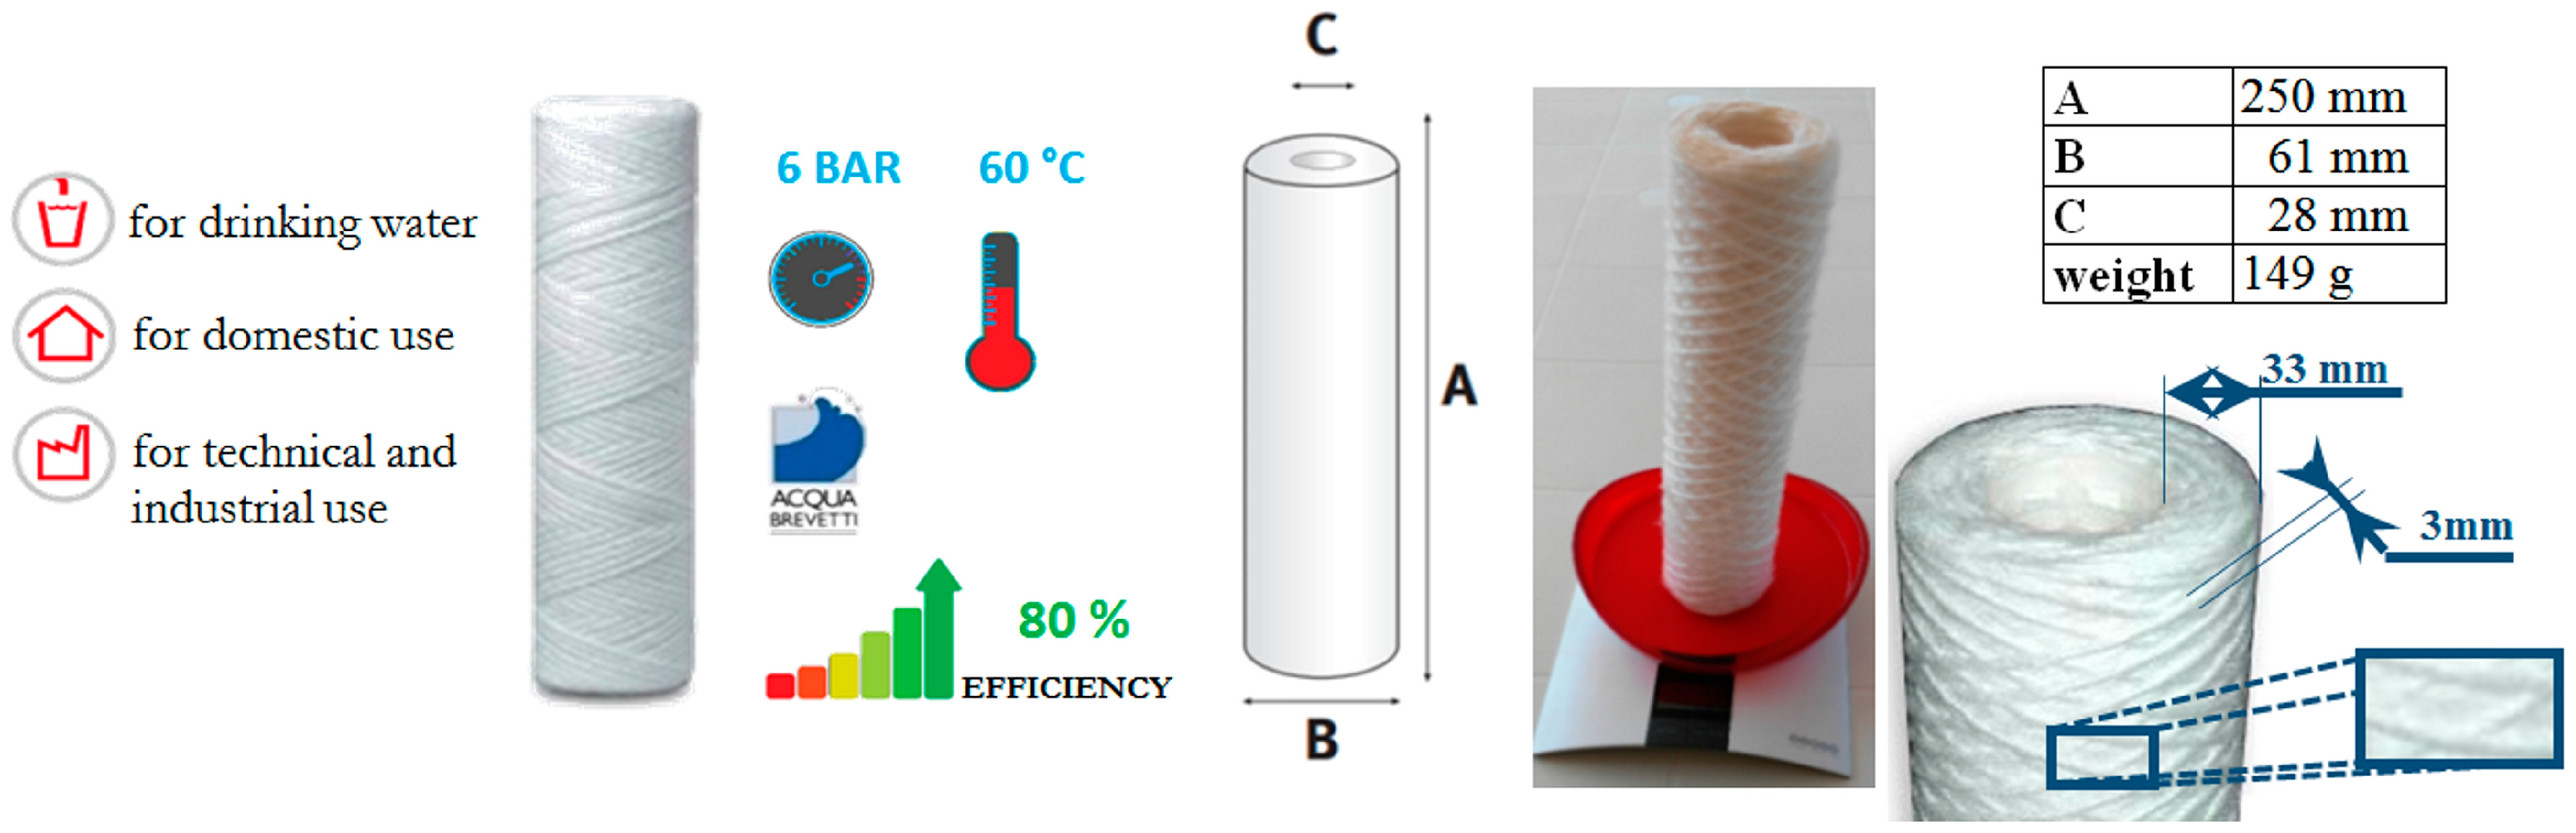
These cartridges are of the type shown in Figure 1, where size, weight and efficiency are also reported. The filtering set has a particular honeycomb uniform texture, with precisely shaped and uniformly sized holes.
The transit of the fluid in the cartridge, during which the treatment phase takes place, occurs in such a way (Figure 2) that the fluid flows through the cartridge via a side entrance (lateral inflow), the solid particles are deposited in the filter and, once water reaches the central part, it flows upward (outflow) through the duct created in the inner core.
The pore size nominal rating or nominal filtration of a cartridge, defined as the pore size at which particles of a given size will be retained with efficiency below 100% [5], is 50 μm. This rate refers to the capability of the filter to capture particles by the process of absorption, which depends on the size of the filter holes; it is linked to the efficiency of the filter expressed as a percentage (e.g., an efficiency of 80% with a nominal pore size rating of 50 μm means that 80% of the suspended solid particles dispersed in water, having a nominal size greater than 50 μm, are retained by the filtering septum during their transit through it). This cartridge can be used without further filtration stations, since the outflowing water is devoid of all solid impurities. With a prolonged filtration, the amount of particles retained by the filter progressively increases. This puts an increasingly reduced transit space with a consequent increasing pressure loss at the disposal of the fluid. The most unfavorable condition results from the completely clogged filter, corresponding to a very significant head loss. When the filter is completely clogged, to restore the filtration system in its early ideal conditions, the cartridge has to be replaced, since a wash would not completely clean the septum, with the solid particles being retained in the filter matrix and not only on the external surface.
In this study, artificially dirty conditions have been reproduced in the laboratory experiments with a partial occlusion of the pores, in order to evaluate the head losses produced by the filter obstruction.
2.2. Laboratory Setup
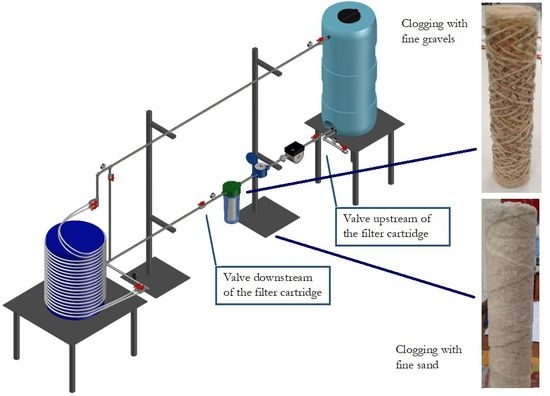
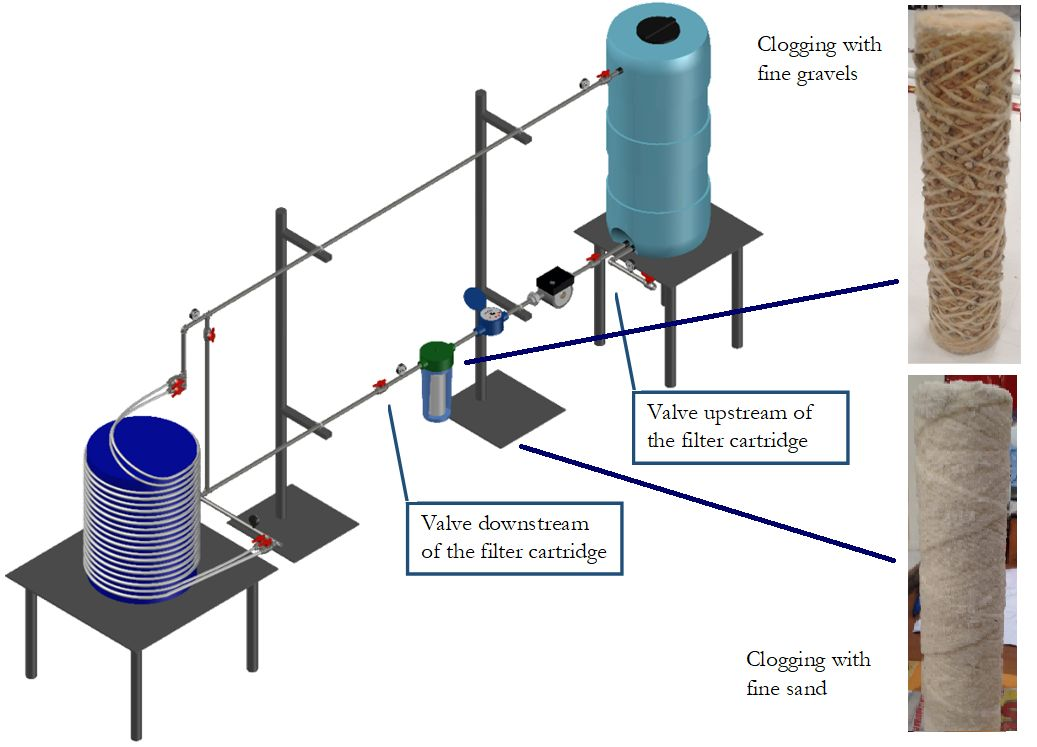
A hydraulic circuit (Figure 3) was designed and built with the aim to simulate in the laboratory a generic residential plant with a cartridge filtration system, in order to calculate the local head losses produced by the filter. To make the experiment as realistic as possible, pipes with commercially popular materials and diameters were adopted.
The experimental circuit consists essentially of the following:
- a polyethylene tank with capacity of 300 L;
- an electronic circulation pump with maximum head equal to 6.9 m (model Evosta 40-70/130, flow rate range 0.4 ÷ 3.3 m3/h);
- a galvanized steel pipe with diameter ϕ¾” (internal diameter 20.9 mm) and length 7.05 m;
- a single-jet water meter;
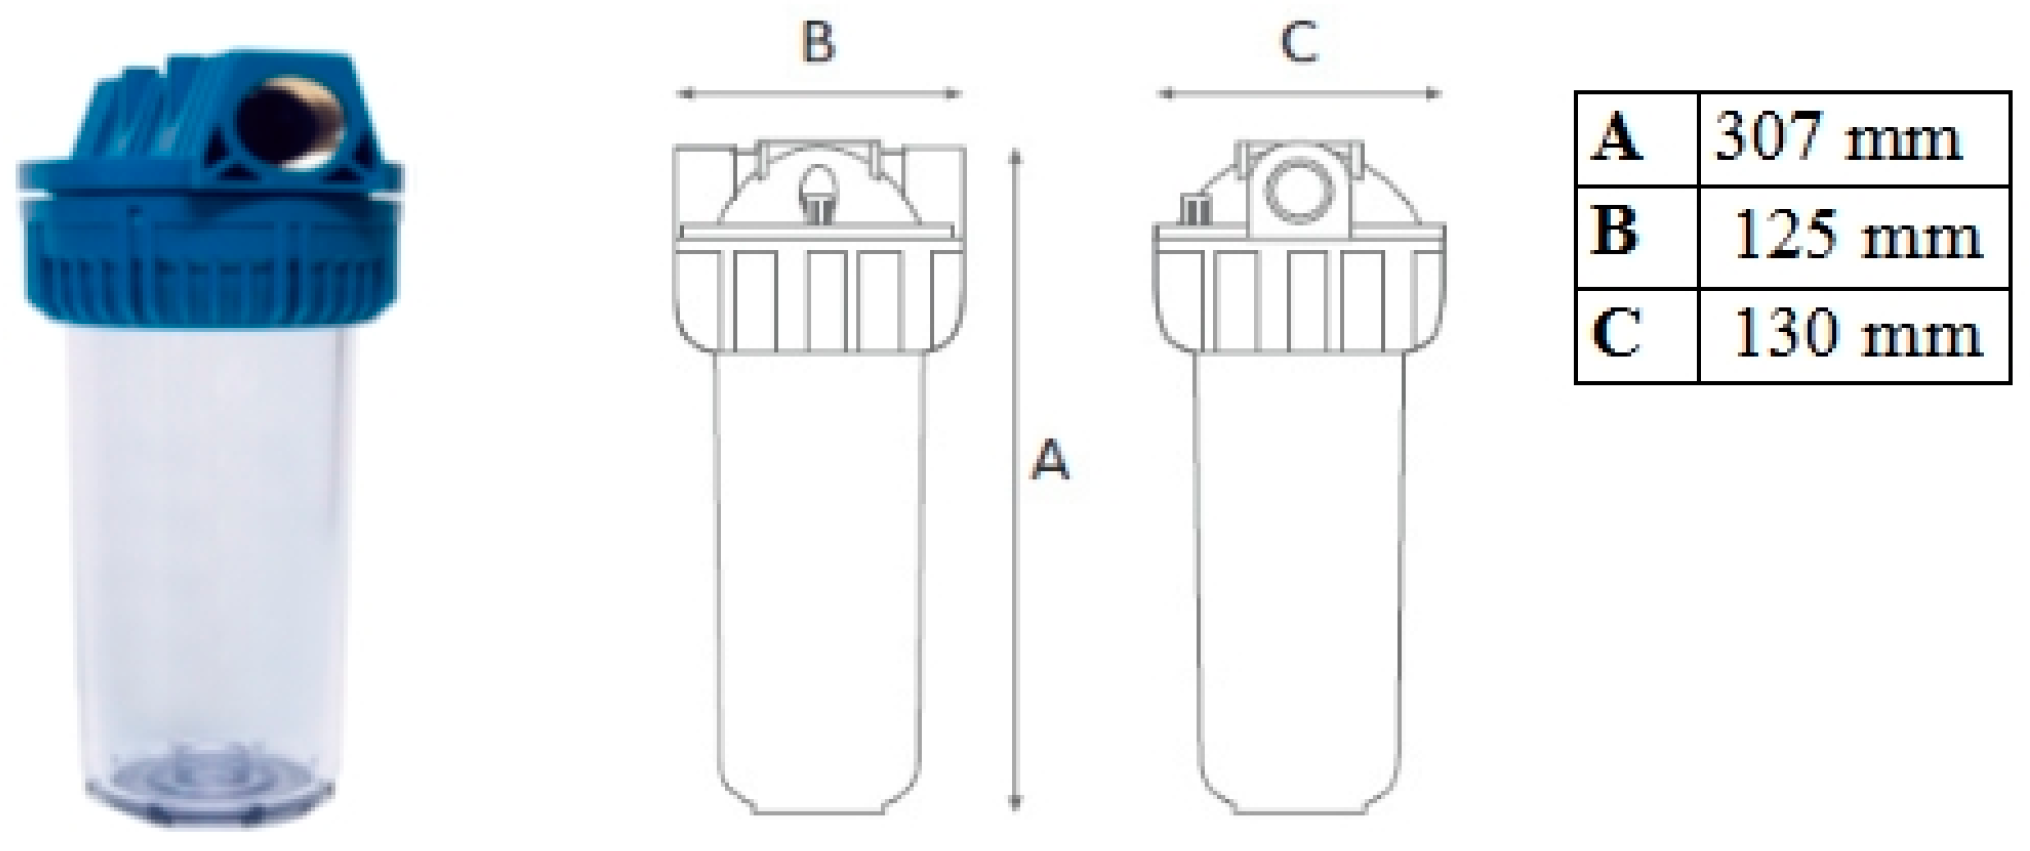
- a housing element (Figure 4) with interchangeable filter cartridges.
The coiled pipes in multiple layers that can be observed in Figure 3 (numbers 2 and 3) were by-passed in this experimental campaign through the closing of the proper ball valves (number 4).
The cartridge container (model FC GREEN V/T, Figure 4) is also produced by Acqua Brevetti 95 S.r.l. of Mestrino (PD), Italy and it is of sufficient size and shape to accommodate a filter cartridge of 9 ¾”, such as the ones considered here. It has transparent walls, which permit one to observe the way the sand is deposited in the filter as the degree of artificial clogging increases.
2.3. Experiments
Experiments have been conducted with three different values of discharge (Qmin, Qinter-intermediate- and Qmax), depending on the operating modes of the pump, in the conditions of no filter cartridges and introducing the cartridges each time, with the progressively increasing clogging rate, in the proper plastic container.
Before performing the tests, the storage tank was filled up to a certain level (1.50 m referred to the extrados of the slab on which the circuit was placed), to be kept constant during the tests in order to maintain the water head upstream of the circuit; all the measurements taken during the laboratory activity refer to this level. The shut-off valves upstream and downstream of the container are closed each time in order to disconnect it and insert it inside the filter cartridges artificially clogged with quantities of sand established a priori.
When the circuit is operating, it is possible to measure the head losses in the filter element and along the pipe. The measurement of the continuous head losses along the pipes was performed through digital pressure gauges (model Sino Instruments HX601, Huaxin Instrument, Beijing, China) for direct reading of the relative pressure, properly positioned in selected detection points. Concentrated head losses at the filter cartridges were measured, instead, through electronic differential manometers (model Digitron Engineering B.V. 2082P, Digitron Instruments, Belfast, Northern Ireland), capable of guaranteeing a significantly higher gauging precision, positioned with the two detection points (equipped with valves to regulate the inflow and outflow) upstream and downstream of the cartridge, respectively (Figure 3). Each measurement was performed three times in order to verify the repeatability of the experimental tests. Also, a flow meter by B Meters S.r.l. (Gonars, Italy), was installed between the pump and the filter housing.
The accuracy of the measurements was ascertained prior in a single campaign of experimental tests, by comparing the readings obtained from the instruments with known values, alternatively detected. Concerning the flow rates measured by the flow meter, the comparison was made by adopting the procedure known as the bucket method. For each pump speed and filter condition, once the level in the polypropylene tank reached a constant value thanks to an external water source, at the steel pipe outlet it was measured how long the water takes to fill a 20 L bucket. After repeating this procedure five times, the flow rate was obtained by dividing the volume of the bucket by the average time it took to fill the bucket. Before each test, digital pressure gauges were reset to zero in the absence of water in the steel pipe, to match the atmospheric pressure value. In addition, for pressure gauges with readings lower than 0.2 bar, a comparison was made by reading the water levels at piezometers, 2 m high, placed in the same locations thanks to the presence of four-way fittings.
2.4. Clogging Scenarios
This analysis of the clogging conditions is of particular interest, because the head losses increase significantly when, with prolonged use, the filter gradually clogs until the saturation degree is reached. The filter is expected to remove suspended particles but in doing so these particles get deposited either inside the filter matrix or on its surface. The yarn structure in itself is porous, resulting in particles becoming embedded inside it. Thus, with time, as the filter becomes clogged, it will resist the passage of flow [2]. The wire-wound filter cartridge does not allow maintenance (e.g., washing) to restore the initial status; this implies that after a certain period of time, it has to be replaced.
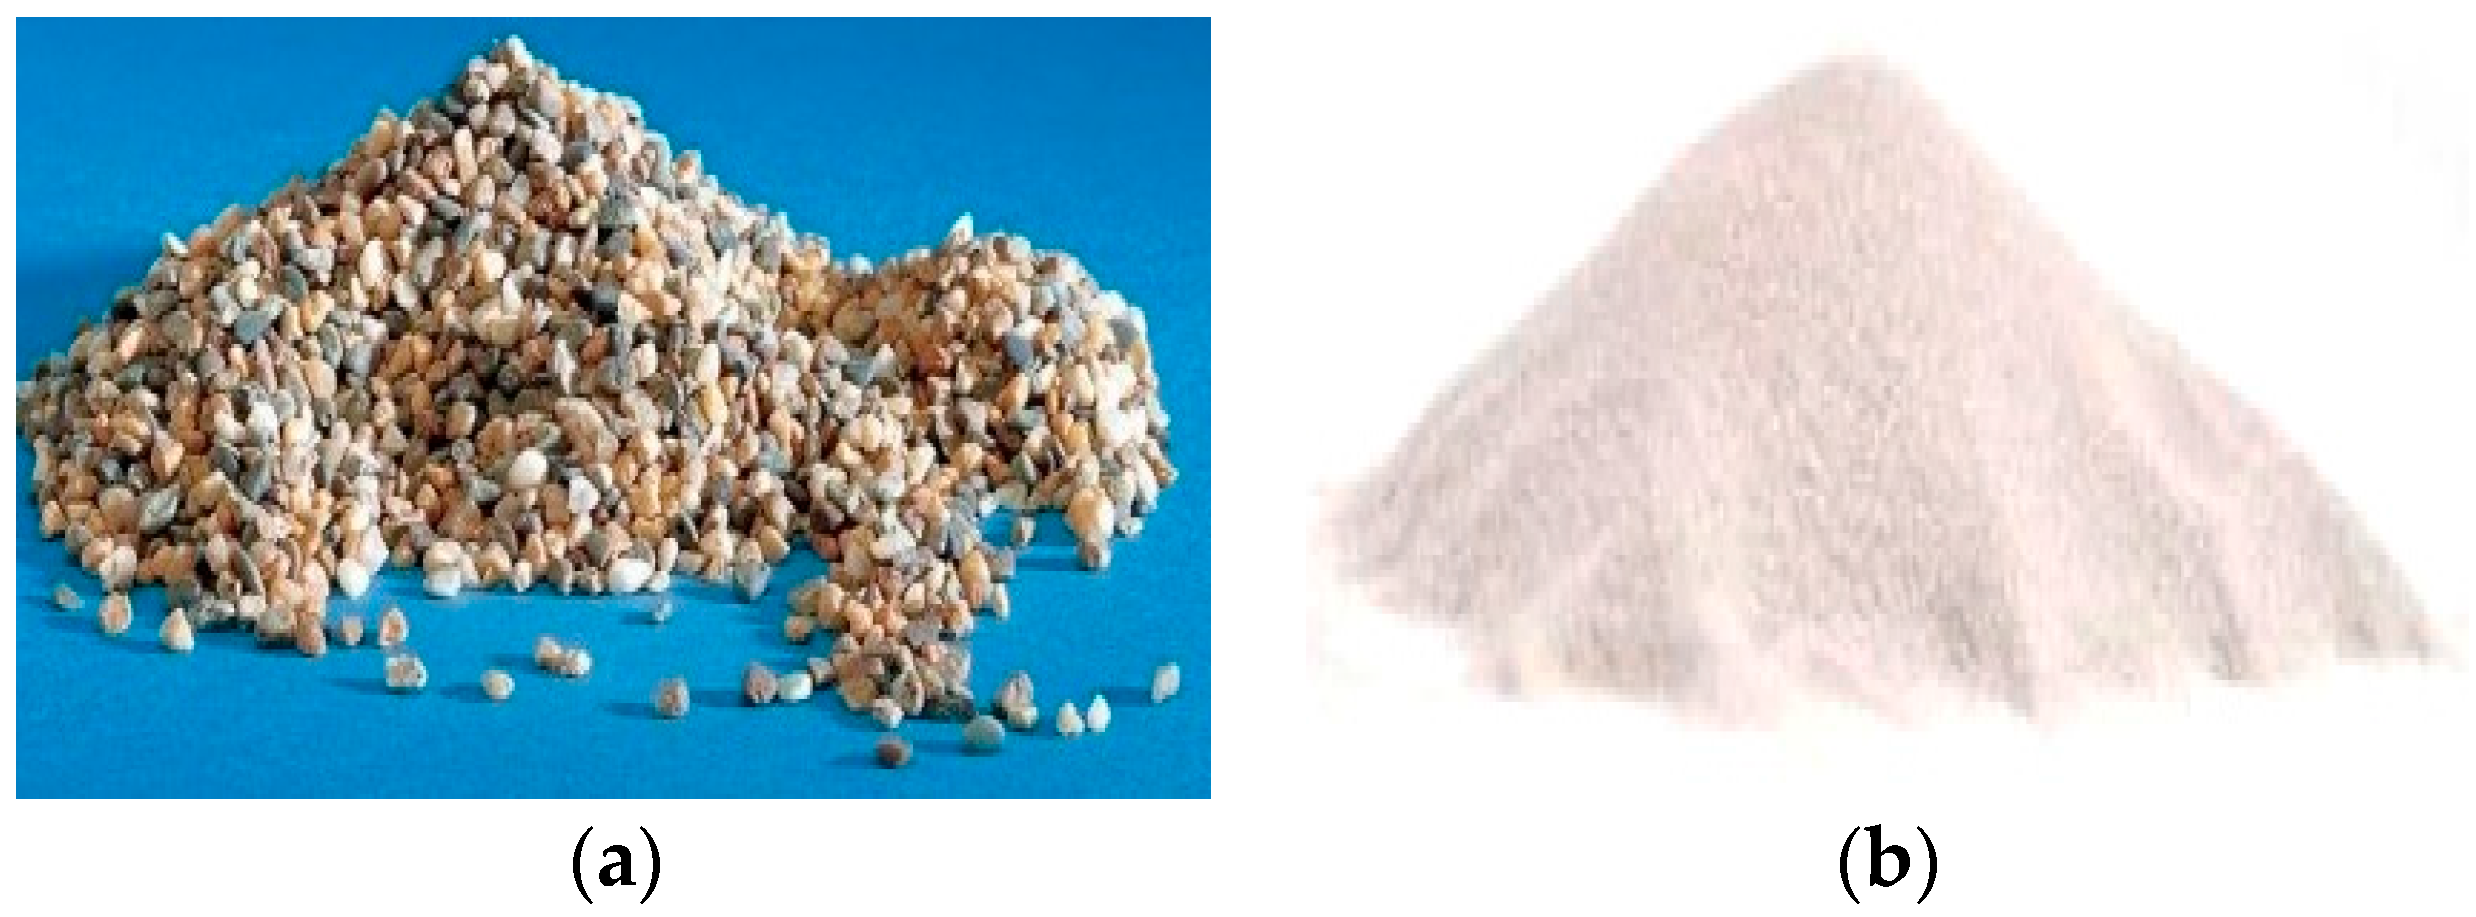
Clogging has been simulated after appropriately selecting the material to be used and the way to put it into the cartridge. Two different types of clogging have been considered: clogging by fine gravel (2–10 mm) and fine sand (0.10 mm) (Figure 5). As stated in Section 2.1, the wire-wound filter cartridge is able to retain particles up to 50 mm in size.
The two experimental scenarios differed not only in the used material but also in the method of application.
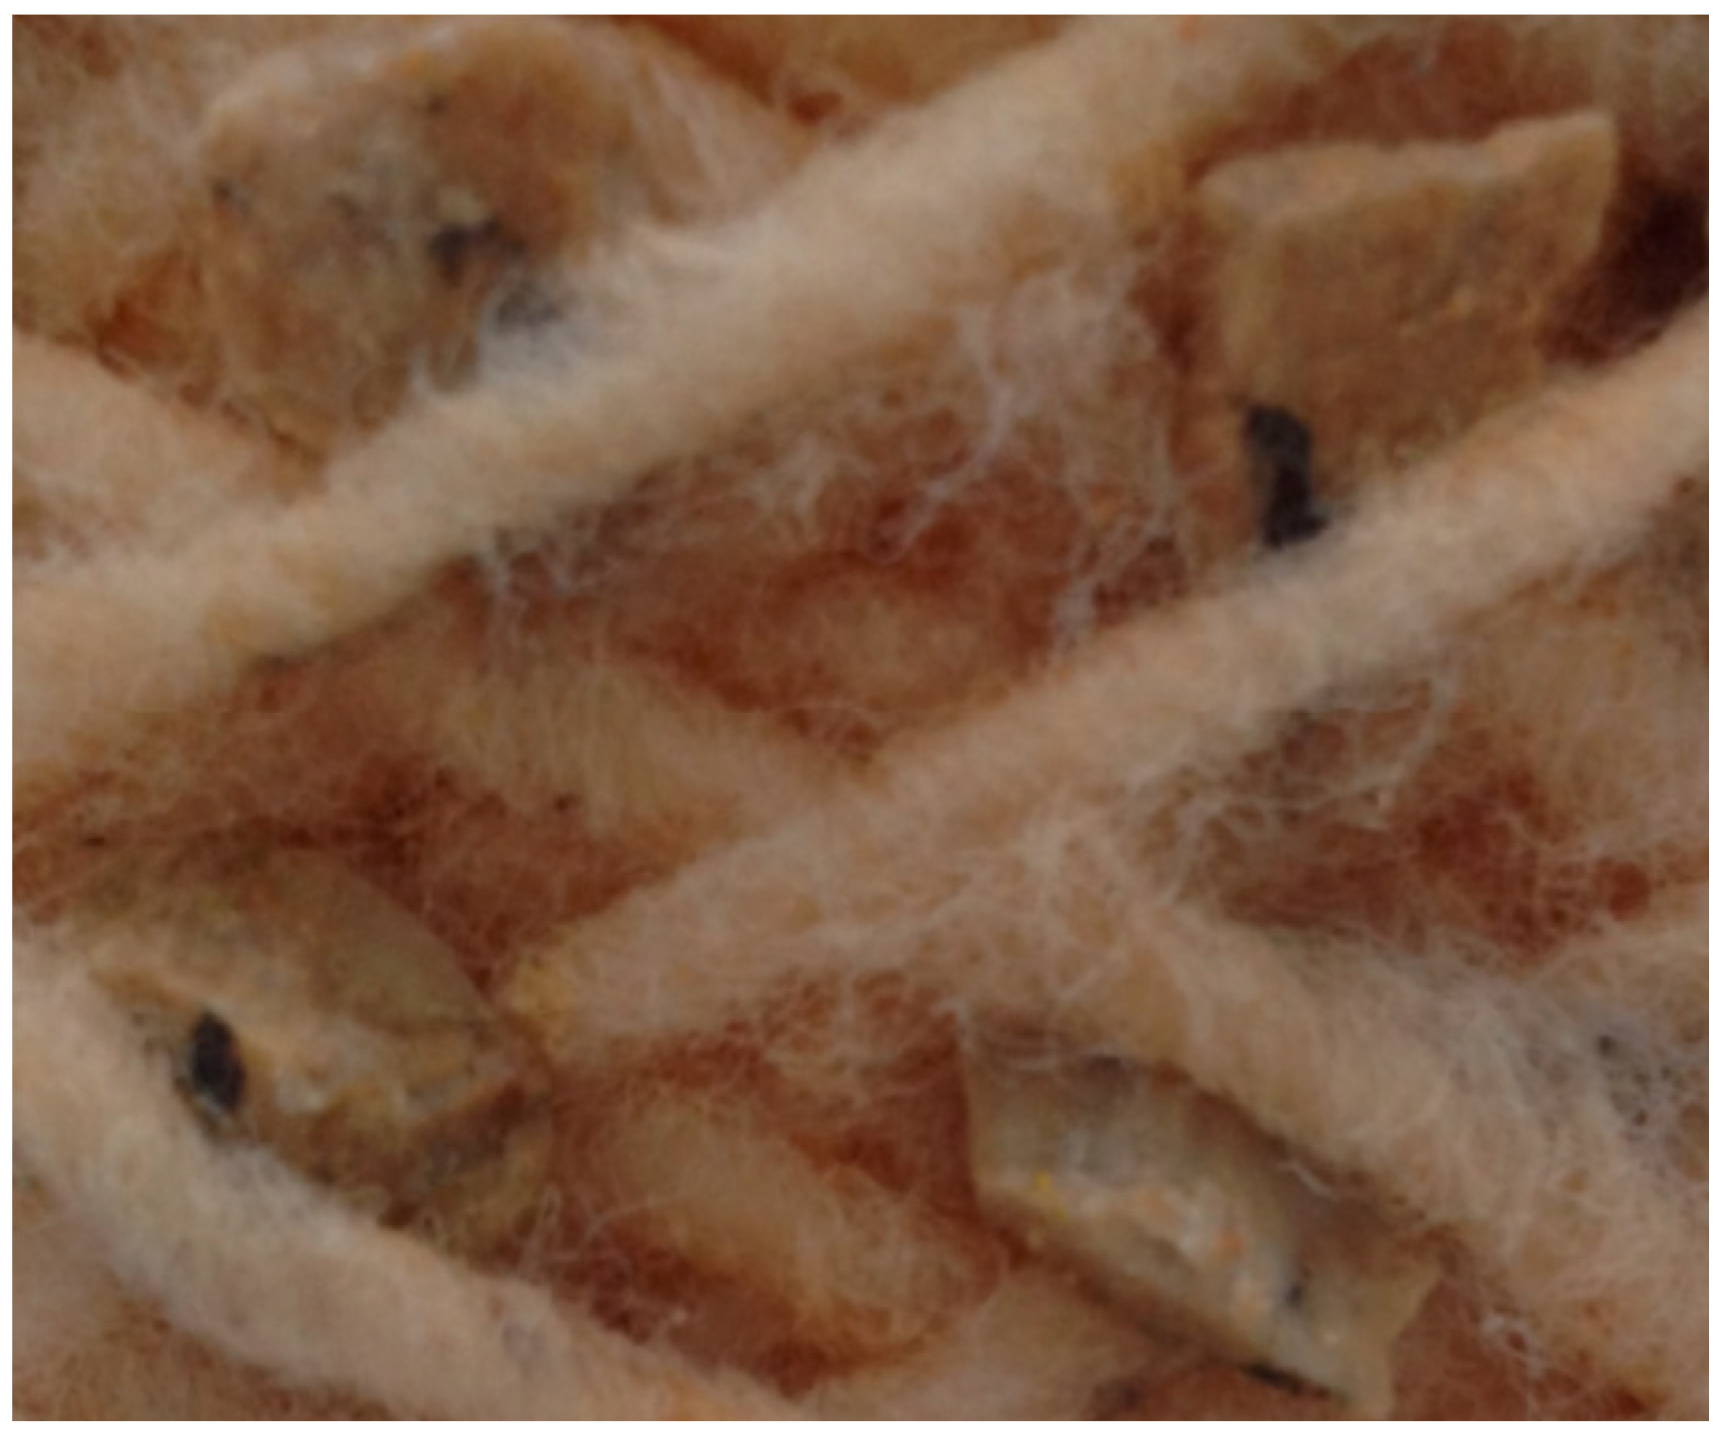
The selection of the fine gravel material (Figure 5a) was made after trials with different granulometries and the final choice was based on the one most suited to be retained in the special honeycomb structure of the filter. Although this size is not compatible with that of the particles that might be suspended in drinking water, it helps to understand the physical processes in the clogging process and, therefore, to highlight remarks on the filter behavior. The gravel was introduced by physically moving the wire from its position with the help of a rigid metal bar with a diameter of about 3 mm, and inserting the particles in the middle in such a way that, at the end, they were positioned on the filter in a systematic way (Figure 6).
By following this procedure, a maximum of 225 particles were placed along the entire surface of the filter cartridge. To quantify the obtained filter obstruction, a clogging rate μ in percentage was introduced, defined as the ratio of the total average clogged area over the total free surface area available to the flux ():
The total average clogged surface area was calculated perpendicular to the flow direction through the product between the unit average clogged area and the number of used particles N:
The unit average clogged surface area was estimated taking into account the average diameter of the used gravel (8 mm), approximating the typical particle shape to a square 8 mm in size. Then:
The aim to achieve orderly and manageable clogging resulted in a limited number of particles that could be placed on the filter cartridge.
The head losses were measured during the experiments using three different values of the parameter μ:
The three clogging conditions with fine gravel are summarized in Table 1.
As for the clogging by fine sand (Figure 5b), it was decided to use particles a tenth of a millimeter in size, a size more compatible with that of particles that are most likely suspended in drinking water. In this case, difficulty arose regarding how to stick the sand along the side surface of the filter cartridge. To avoid using artificial glues, which may also alter the nature of the fluid, and consequently pressure values and head losses, it was decided to apply a water-soluble natural substance which, below a certain amount, does not alters the objectivity of the measurements. After a series of research and trials, honey and flour glue were selected as the glues suitable for this experimental activity, according to the hydrosolubility characteristics of both substances. The preparation of the flour glue involved 350 g of white flour, 0.75 L of water, 45 g of sugar (to enhance the adhesive power), 45 mL of vinegar (to delay the decomposition), 12 min cooking time. Several tests were repeated with both glues in order to check the influence of the substance on the head losses results.
The first clogging was done by spreading the flour glue along the entire side of the cartridge, using a silicone kitchen brush, obtaining a layer of 5 mm. The filter was then subjected to a rolling process on a paper support where a known amount of fine sand was poured. At the end of this process, residual sand was weighed and the amount of sand retained by the filter was obtained by the difference in weight. The filter inserted into the enclosure was tested for 24 h, with the minimum pump speed upstream of it. The observations made during and after this first test led to a reduction in the thickness of flour glue in an attempt to solve, or at least reduce, the problem of fast dragging water. In the second application, therefore, sand was applied in the same manner with a 2 mm-thick layer of flour glue. Before conducting the experiment, the cartridge was subjected to a drying process within a period of one to five hours to allow the glue to dry and the sand to adhere fully to the filter lateral surface. At the end of this second test, it was observed that sand losses were lower than those detected in the first test. To quantify these losses, the deposited sand was extracted and dried; then, the effective sand applied to the filter cartridge was determined by the difference between the sand used in the clogging phase and the dried deposited sand (right most column in Table 2, indicated as effective sand weight).
Four clogging scenarios with different amounts of sand were produced, as reported in Table 2.
Figure 8 contains, instead, pictures of the filter at progressively increasing clogging rates, with quantities of sand equal to (a) 20 g, (b) 40 g, (c) 60 g and (d) 80 g, respectively. Sand was added in equal amounts from time to time, to guarantee an appreciable variation in head losses recorded at each increment.
The filter was thus made artificially dirty by laying a uniform layer of sand to reproduce a severe clogging condition. Once a sample was prepared, it was put in the filter housing, then a flow was recirculated to re-clean the filter. The glue was found to be completely dissolved in water after running about for 10 min, but most of the sand was held in position, thanks to the water pressure acting on the filter surface with percentages of deposition to the filter bottom between 0% and 25%. After carefully removing the filter, the weight of the residual layer of sand was measured and used in correlation with the pressure drop [7], as shown in Section 3.
3. Results and Discussion
The results of the experiments with fine sand are plotted in Figure 9 in terms of head losses ∆H (in m) as functions of corresponding discharges Q (in L/s) for cartridges progressively clogged with 10 g of sand each time up to 80 g and flour glue for the three different values of discharge.
The graphs allow us to highlight some outcomes. As expected, the trend is increasing head losses with growing discharge values with an exponent bigger than one. The head losses also increase as the clogging rate increases but the curves show a similar trend. A generalization of these results and a formula of the type of Equation (4) to calculate the local head loss produced by the filter cartridge in each scenario have been sought:
Starting from the pair values of discharges Q and the corresponding local head losses ∆Hloc, first the corresponding mean velocities were calculated by the continuity equation and then the values of coefficient β in Equation (4) were calculated: the results are reported in Table 3.
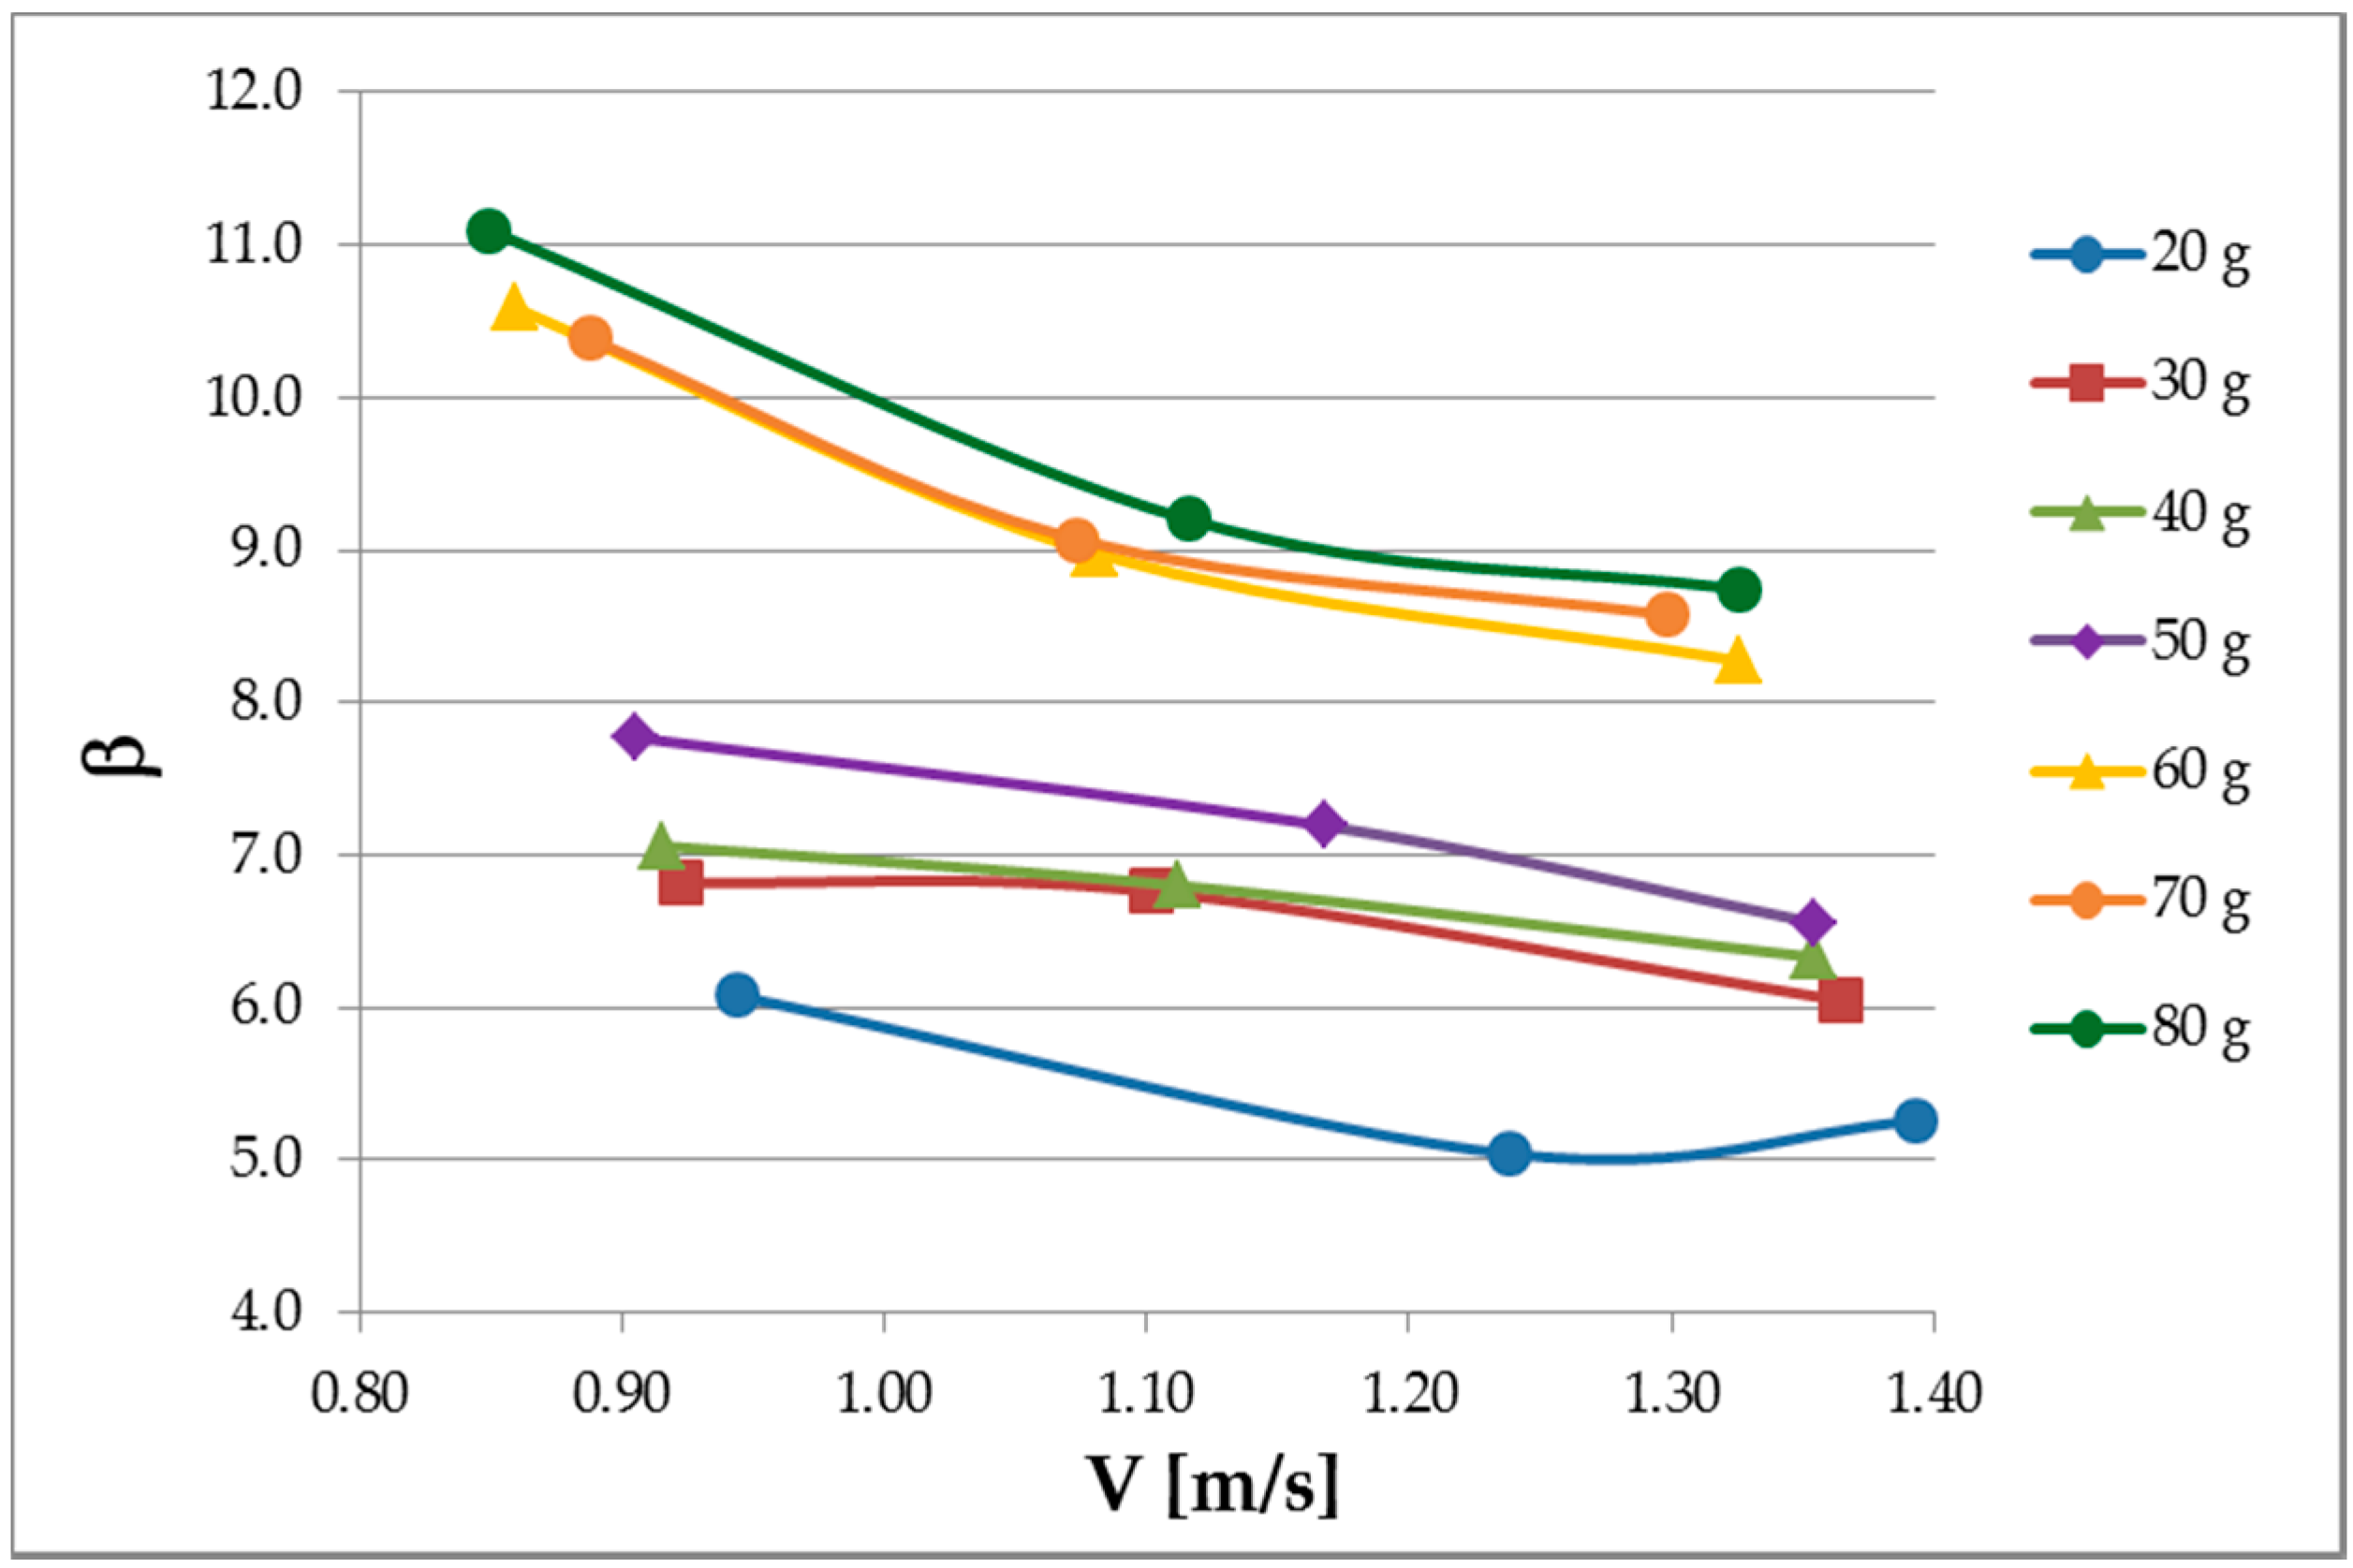
In Figure 10, the values of β are plotted as functions of the corresponding values of the mean velocity V in all the scenarios.
The trend again respects the progressive clogging rates. The values of β reduce as the velocity increases (inverse proportionality) and enter the range of about 5–11. As expected, for higher clogging rates, the values of β increase, since head losses increase. Different trends can be distinguished for the analyzed cartridges: the curves are concave for 20 g, 60 g, 70 g and 80 g of clogging sand, while they appear convex and almost linear for 40 g, 50 g and 60 g of clogging sand.
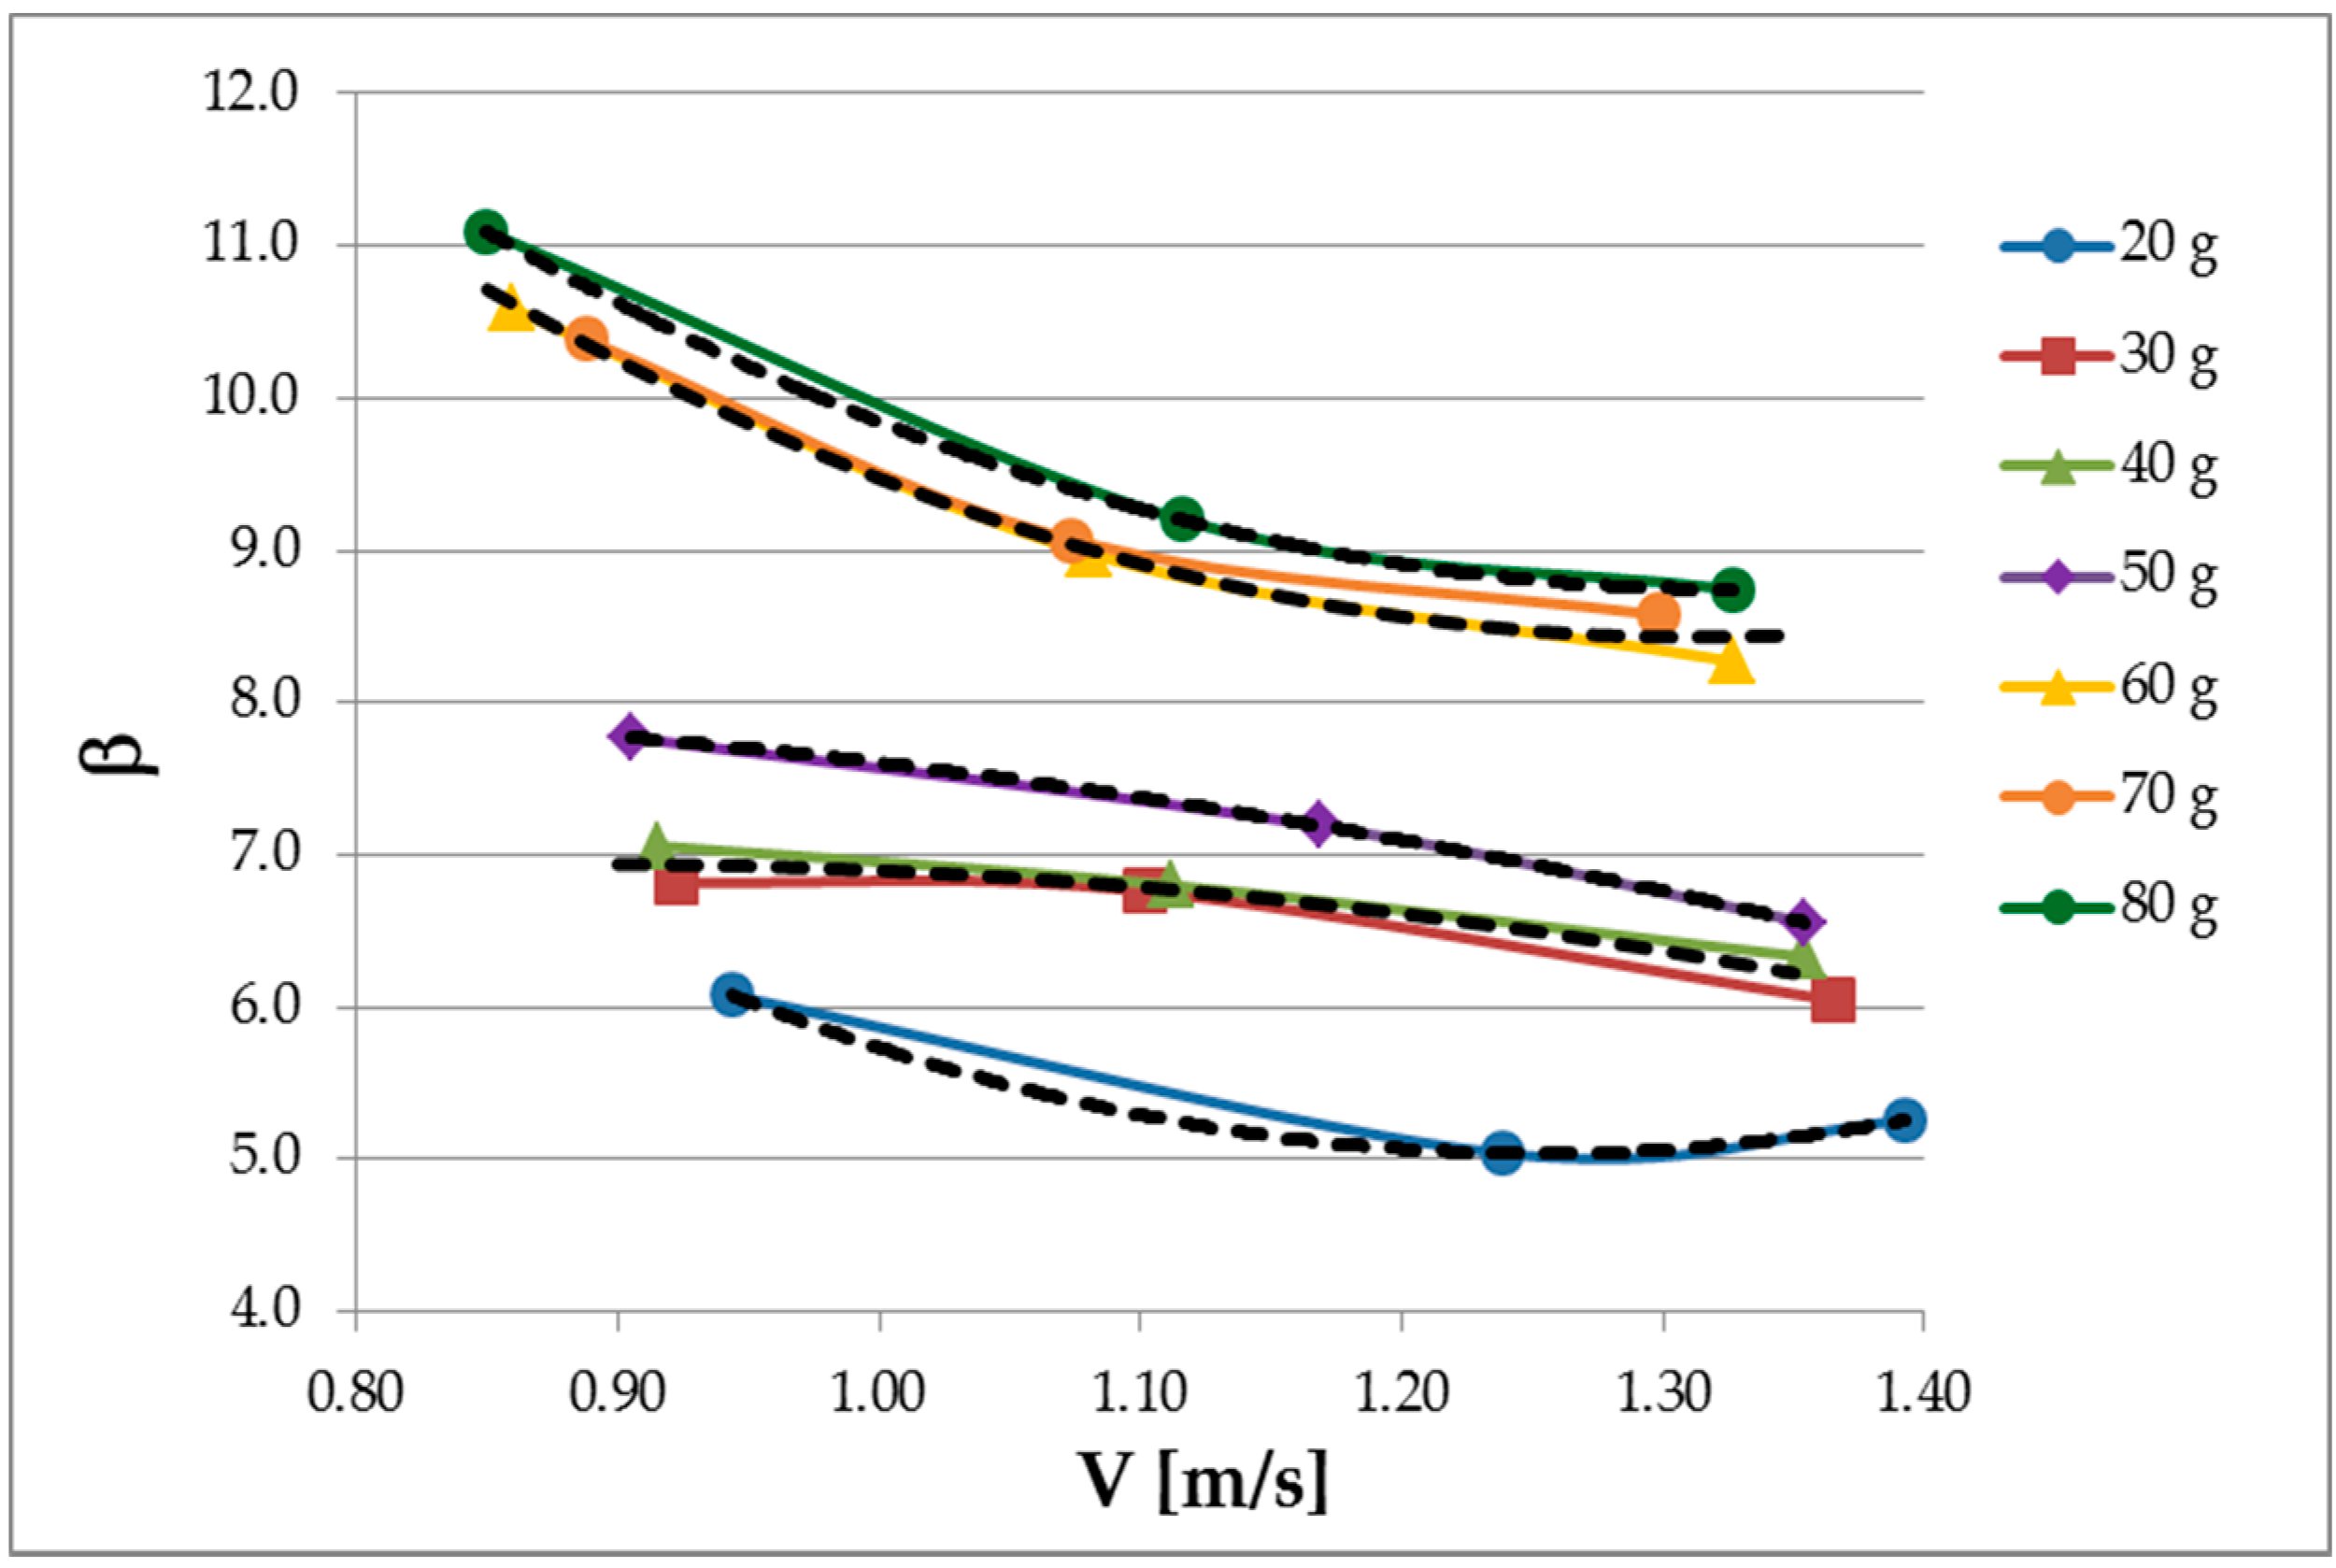
The following relations can be obtained from the trend curves, which are also illustrated in Figure 11, where the line trends are plotted as black bold broken lines:
- -
- trend for 20 g: ;
- -
- trend for 30 and 40 g: ;
- -
- trend for 50 g: ;
- -
- trend for 60 and 70 g: ;
- -
- trend for 60 and 70 g: .
It can be observed that the curve that better approximates the curves is a second-degree polynomial.
One interesting remark is that while with the first amounts of added sand the differences in the values of head losses are significant, for values of clogging higher than 60 g the head losses do not increase much in further steps. This is due to the fact that the filter is close to the condition of complete clogging.
The cartridges tested in the laboratory in this work have characteristics that agree with the standards of most brands on the market and, therefore, these results, obtained for two different brands, can be considered generalizable to other commercial cartridges. Besides, the values of head losses calculated here are also in the same order of magnitude as those measured in [2] for comparable water flow rates. Unfortunately, there are not many data available in the literature, but the values obtained here are compatible with those observed in technical practice by manufacturers and installers.
Discharges, measured by volumetric flow meters, show that in this case, without perfectly clean water, the pump changed its functioning point, with higher values of continuous head losses and, consequently, discharges.
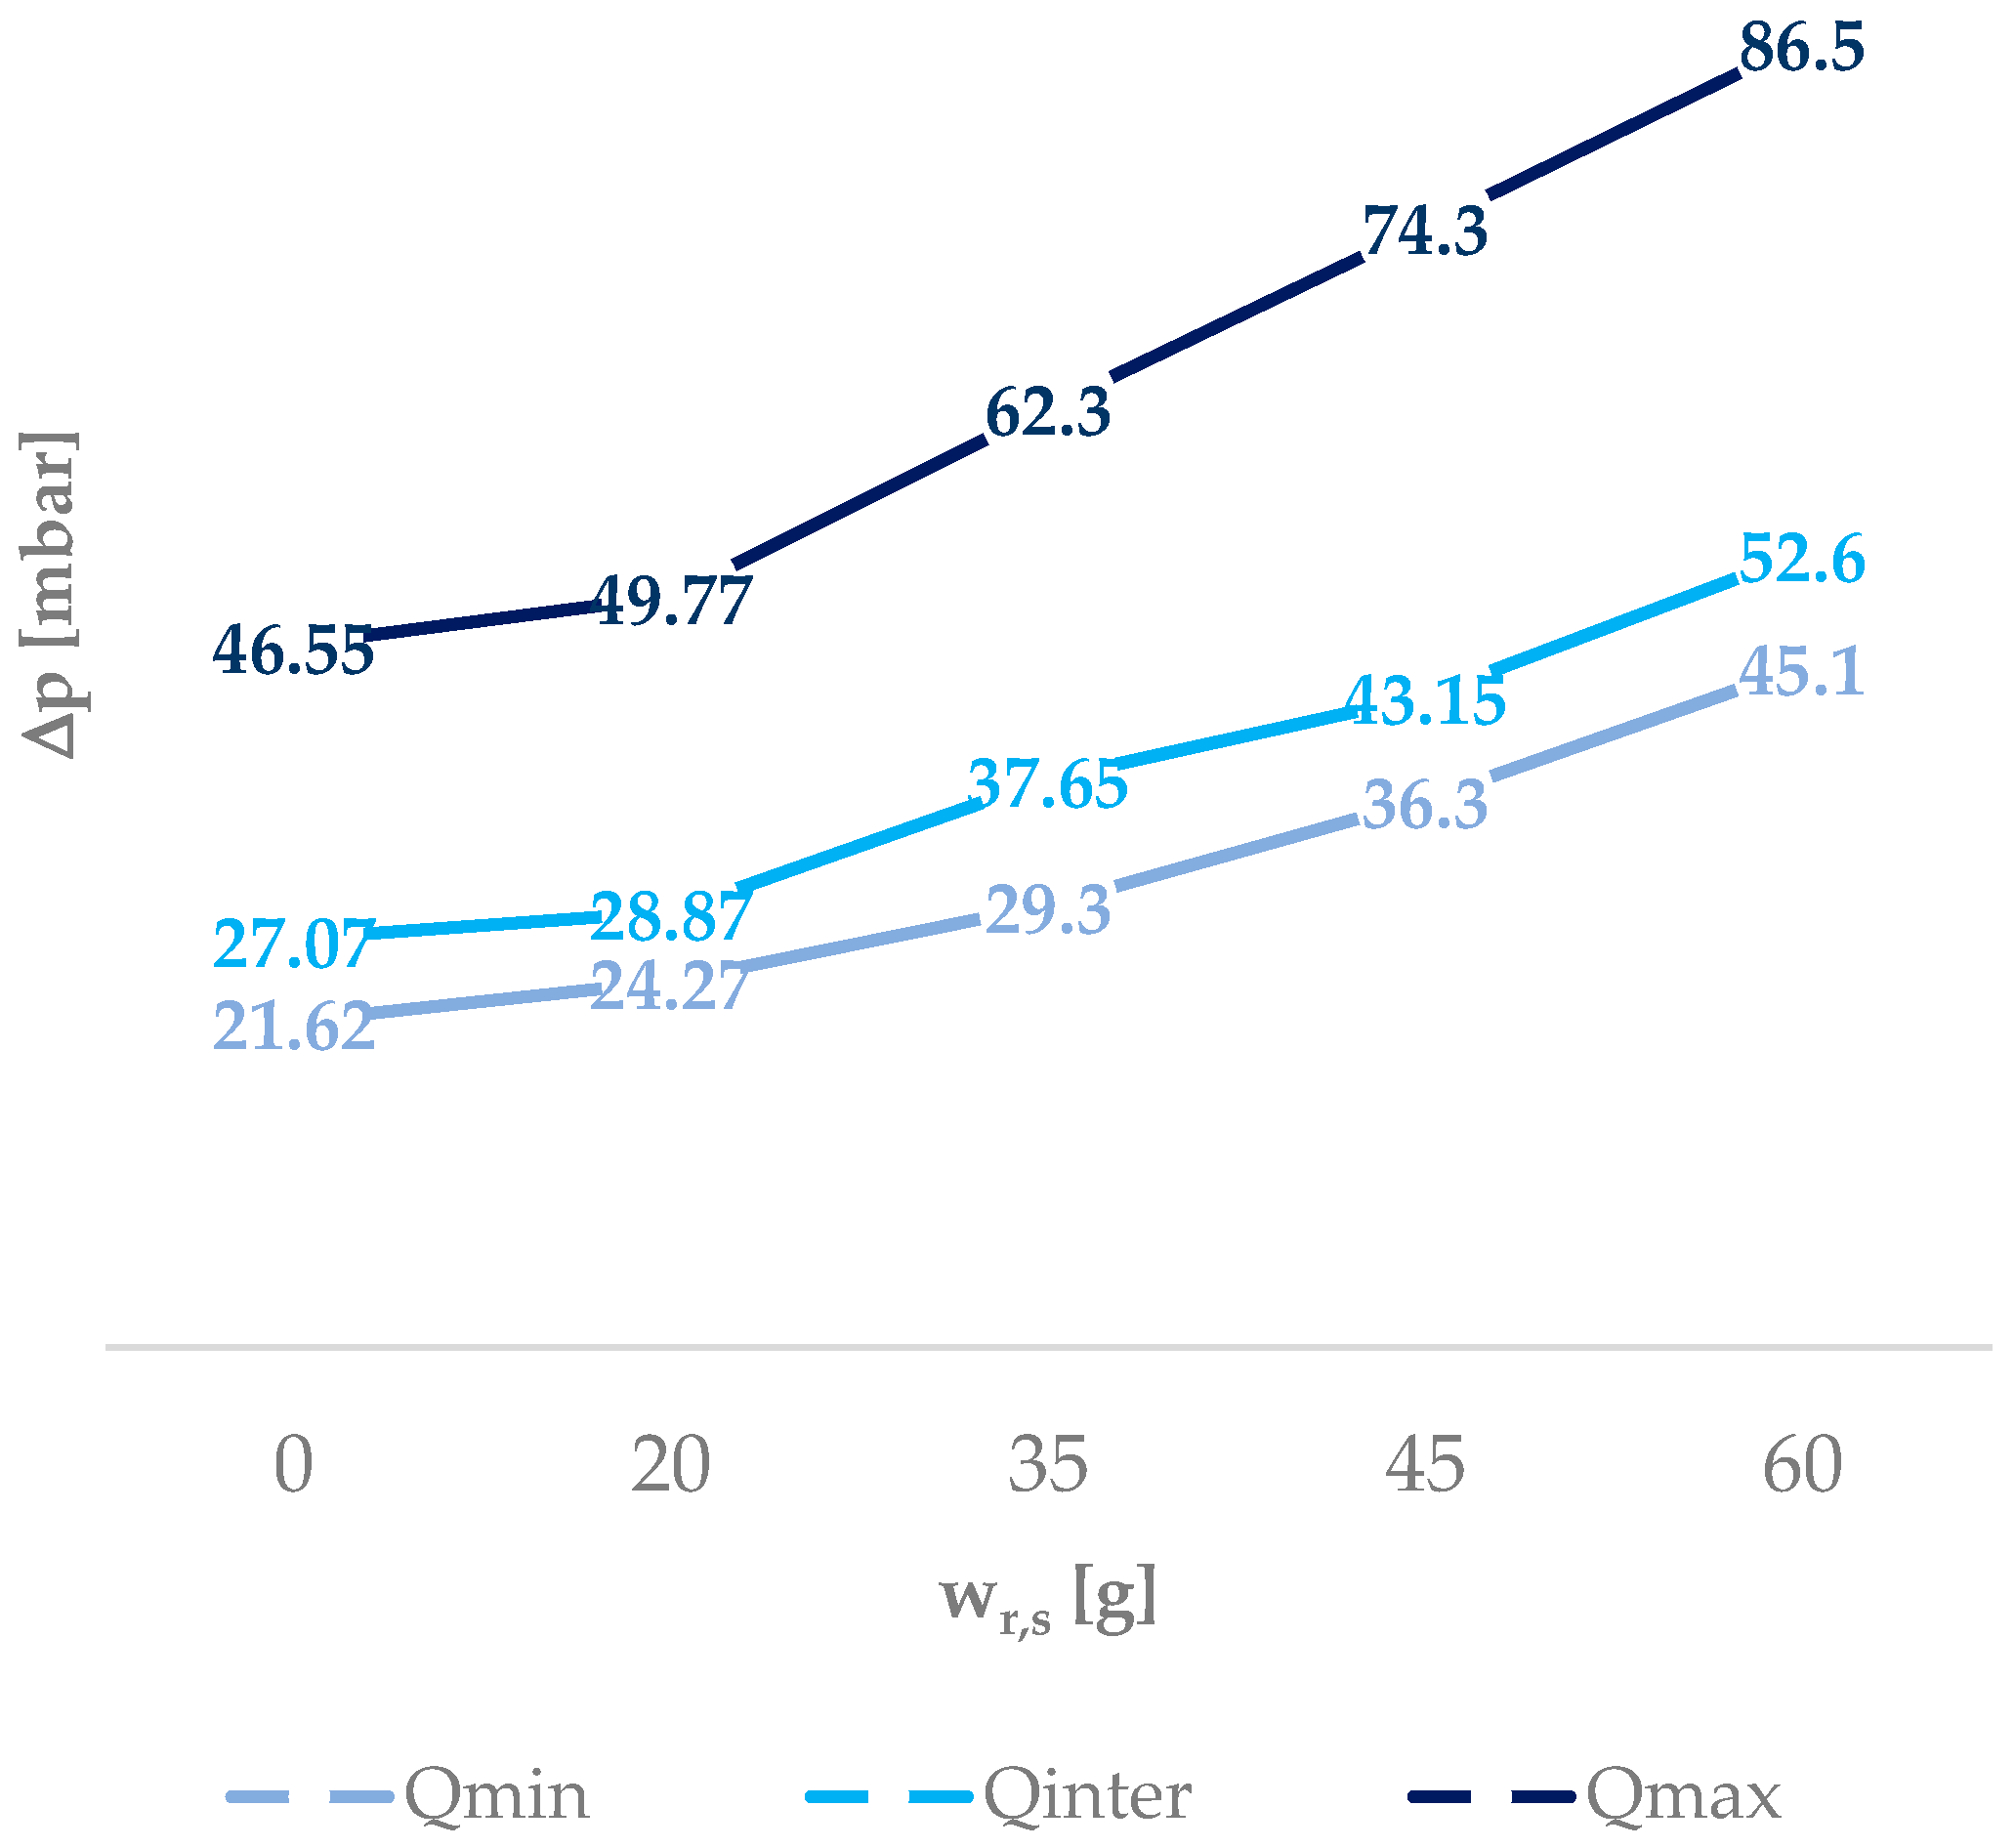
The values of pressure drops produced by the filter, measured through the differential pressure gauges at its upstream and downstream sections, have also been plotted in Figure 12 and Figure 13, for fine gravel and fine sand respectively, as functions of the effective clogging rate. The results obtained in the condition of clogging by fine gravel and honey are plotted in Figure 12 in terms of pressure drops ∆p evaluated in the three different flow rate operating conditions correlated to the clogging rate μ. The values reported in each curve correspond to the pressure drops in the absence of clogging and for the three analyzed clogging scenarios (Table 1).
The results obtained in the condition of clogging by fine sand and honey are plotted, instead, in Figure 13, taking into account the effective clogging sand, as values of pressure drops ∆p evaluated in the three different operating conditions as functions of the sand residual weight wr,s. In this case, in fact, the filter was made artificially dirty by a uniform layer of sand of weight ws. After carefully removing the filter, the weight of the residual layer of sand wr,s was finally measured and used in correlation with the pressure drop ∆p. The values reported in each curve correspond to the pressure drops in the absence of clogging and for the four analyzed clogging scenarios (Table 2).
This experimental activity allowed us to obtain useful information about the wire-wound filter cartridge, in particular its behavior in terms of head losses under the condition of progressive clogging. As expected, as particles are deposited either inside the filter matrix and on its surface, the filter becomes clogged and offers greater resistance to the passage of flow. This explains the increasing trend of pressure drop observed in all tests (see also [2,8]).
However, the graphs in Figure 12 and Figure 13 show a different average trend depending on the material used for the two types of clogging: more than linear with fine gravel and less than linear with fine sand.
In the case of fine gravel, in Figure 12, it is possible to distinguish two zones of the graph with different head losses trends. Specifically, the slopes of the curves change when μ is about 8%.
For minimum and intermediate flow rates, the curves are convex and the following zones can be distinguished:
- -
- Zone 1, in the range of 0–57 particles, i.e., μ < 8%, where the development of the head losses is pronounced and the maximum ratio between the pressure drop ∆p and the particle increment ∆part, here equal to 57, corresponding to the curve slope, is ∆p/∆part = 0.24;
- -
- Zone 2, in the range of 57–225 particles, i.e., 8% < μ < 30%, where the head losses increase more slowly, and the maximum values of ∆p/∆part = 0.04, with a particle range ∆part of 168.
As for the higher flow rate, the curve is concave and it is possible to distinguish the following zones:
- -
- Zone 1, in the range of 0–57 particles, where the losses development is lower than the previous zone 1 (∆p/∆part = 0.15);
- -
- Zone 2, in the range of 57–225 particles, with a steeper growth and maximum slope equal to ∆p/∆part = 0.21.
In the real cases of domestic systems, particles are transported in the distributed water; 80% of the maximum head loss due to the clogging is reached in less time than is necessary to achieve 100% of the maximum loss. According to the measurements, 80% corresponds to a loss of about 65 mbar, just enough to lower the inlet pressure (just over 1 bar) so as not to trigger the operation of electromechanical elements (boilers, washing machines, etc.).
In the case of fine sand, as mentioned above, the chart in Figure 13 shows a different behavior: the growth in losses is increasingly pronounced as the amount of used sand increases and the curves are concave.
In the range of the minimum and intermediate measured flow rates, four zones can be identified:
- -
- Zone 1: 0–20 g of sand, maximum ∆p/∆wr,s = 0.13, with an ∆pr,s increment in the sand residual layer weight;
- -
- Zone 2: 20–35 g of sand, maximum ∆p/∆wr,s = 0.58;
- -
- Zone 3: 35–45 g of sand, maximum ∆p/∆wr,s = 0.70;
- -
- Zone 4: 45–60 g of sand, maximum ∆p/∆wr,s = 0.63.
For the maximum measured flow rate of 0.32 L/s:
- -
- Zone 1: 0–20 g of sand, maximum ∆p/∆wr,s = 0.16;
- -
- Zone 2: 20–35 g of sand, maximum ∆p/∆wr,s = 0.84;
- -
- Zone 3: 35–45 g of sand, maximum ∆p/∆wr,s = 1.20;
- -
- Zone4: 45–60 g of sand, maximum ∆p/∆wr,s = 0.81.
Also, in this case, the different velocity values cause different head losses and, in particular, the greater the velocity the greater the losses. In both cases, the pressure drop ∆p increases with the degree of obstruction, as expected. However, the behavior is slightly different according to the materials used to clog the filter: in the case of clogging caused by fine gravel, pressure drop trends are convex downward for the minimum and intermediate flow rates, whereas for the clogging caused by fine sand, related trends are convex upward. This observation has a physical explanation: fine gravel creates preferential directions for the incoming water flow, while clogging fine sand opposes a more uniform resistance to the fluid motion. The less than linear trend of the gravel sand is due to the capacity of the filter to adapt as the liquid keeps flowing through the available empty spaces without any substantial increase in energy loss. The more than linear trend of the fine sand is due to the uniform thickness of the permeable material which leaves no space for preferential path flows.
It is worth noting that the use of fine sand makes the case study much closer to reality in comparison with fine gravel. The presence of particles of the order of 2–8 mm is, in fact, highly unlikely in drinking water plants, besides those fed by well supply systems. However, the comparison of the results for the two clogging materials enabled some features to be highlighted in the comprehension of the filtering physical process.
Additionally, head losses begin to reach significant values, for the purpose of a residential user, with a quantity of sand greater than 40 g. Given that the water in usual pipelines does not exclude much larger quantities of sand, it is important not to underestimate the effects of such filtration systems in terms of pressure. Replacement of the cartridges becomes compulsory after a certain period of use.
Further experimental investigations on the clogging process of wire-wound filtering cartridges have been performed at the LIDAM Laboratory in order to better understand the filtration mechanisms and to suggest technical applications to realize more efficient cartridges [9].
Besides the experimental laboratory activities, a numerical model in EPANET [10] was also set up in order to perform hydraulic simulations with the same aim of calculating the head losses produced by the cartridges. In fact, after a proper calibration based on the observed results, numerical calculations allow for the analysis of a greater number of test cases, with a wide range of flow rates and different operating conditions [11].
4. Conclusions
In this work, some experimental data are presented on head losses produced in drinking water networks by wire-wound filter cartridges. The experiments were performed in the Laboratory of Environmental and Maritime Hydraulics (LIDAM), University of Salerno. Different operating conditions (three discharge values) were considered, in which the performance of the commercial filtering cartridge was evaluated in terms of local pressure drops produced for progressive clogging of the filter.
Pressure drops were measured with the filter artificially clogged by laying fine gravel or fine sand over the permeable surface intersected to the flux. Although fine sand is the type of solid particles more likely present in drinking water plants, with the exception of well supply systems, the comparison of the results for the two clogging materials allowed us to highlight some features of the physical process. The behavior is slightly different according to the materials used to clog the filter: in the case of fine gravel, the filter adapts as the particles create preferential directions for the incoming water flow, that keeps flowing through the available empty spaces without any substantial increase in energy loss; the clogging fine sand, instead, is more uniformly dispersed, thus leaving no space for preferential path flows and opposing a more uniform resistance to the fluid motion. The results prove that, in all the cases, the pressure drops increase with the degree of obstruction, as expected. Furthermore, the local head losses begin to reach significant values for a residential plant with a quantity of sand greater than 40 g. Since, in common plants, the presence of large quantities of sand cannot be excluded, it is important not to underestimate the effects in terms of pressure drops produced by filtration systems. Replacement of the cartridges is compulsory after a certain period of use.
Author Contributions
The tasks of conceiving and designing the experiments, analyzing data, drawing conclusions and writing the paper were uniformly shared among the authors.
Conflicts of Interest
The authors declare no conflict of interest.
References
- Sutherland, K. Filters and Filtration Handbook, 5th ed.; Elsevier Ltd.: Amsterdam, The Netherlands, 2008; ISBN 978-1-8561-7464-0. [Google Scholar]
- Kanade, P.S.; Koranne, M.V.; Desai, T. Analysis of wound filter performance from DREF yarn spun at different suction pressure. Alex. Eng. J. 2017, 56, 115–121. [Google Scholar] [CrossRef]
- Pawlowicz, M.B.; Evans, J.E.; Johnson, D.R.; Brooks, R.G. A study of the efficacy of various home filtration substrates in the removal of microcystin-LR from drinking water. J. Water Health 2006, 4, 99–107. [Google Scholar] [CrossRef] [PubMed]
- Tomaszewska, J.; Jakubiak, S.; Michalski, J.; Pronk, W.; Hug, S.J.; Kurzydłowski, K.J. A polypropylene cartridge filter with hematite nanoparticles for solid particles retention and arsenic removal. Appl. Surf. Sci. 2016, 366, 529–534. [Google Scholar] [CrossRef]
- Kanade, P.S.; Bhattacharya, S.S. A Guide to Filtration with String Wound Cartridges; Elsevier: Amsterdam, The Netherlands, 2016; ISBN 978-0-12-804847-4. [Google Scholar]
- Viccione, G.; Evangelista, S. Head loss induced by filter cartridges in drinking water networks. In Proceedings of the 15th International Conference on Environmental Science and Technology (CEST2017), Rhodes, Greece, 31 August–2 September 2017; n. CEST2017_00576. Lekkas, D.F., Ed.; pp. 1–5, ISBN 978-960-7475-53-4. [Google Scholar]
- Viccione, G.; Evangelista, S. A laboratory investigation of the hydraulic performance of string-wound filters. In Recent Advances in Environmental Science from the Euro-Mediterranean and Surrounding Regions; Kallel, A., Ksibi, M., Ben Dhia, H., Khélifi, N., Eds.; Springer: Berlin, Germany, 2017; pp. 111–112, Print ISBN 978-3-319-70547-7; Online ISBN 978-3-319-70548-4. [Google Scholar] [CrossRef]
- Logsdon, G.S. Water Filtration Practices (Including Slow Sand Filters and Precoat Filtration), 1st ed.; American Water Works Association: Denver, CO, USA, 2008; ISBN 978-1-58321-595-1. [Google Scholar]
- Viccione, G.; Evangelista, S.; Siani, O. A new cost effective, long life and low resistance filter cartridge for water treatment. (submitted).
- EPANET 2 Users’ Manual, United States Environmental Protection Agency Public Domain Software; Rossman: Washington, DC, USA, 2000; EPA/600/R-00/057.
- Viccione, G.; Evangelista, S. Experimental and numerical analysis of the hydraulic performance of filtering cartridges for water treatment. In Proceedings of the 13th International Conference on Hydroinformatics (HIC 2018), University Campus of Palermo, Palermo, Italy, 1–5 July 2018. (submitted). [Google Scholar]
Figure 1.
Adopted wire-wound filter cartridge.

Figure 2.
Fluid flow mode in the wire-wound filter cartridge: radial flux.
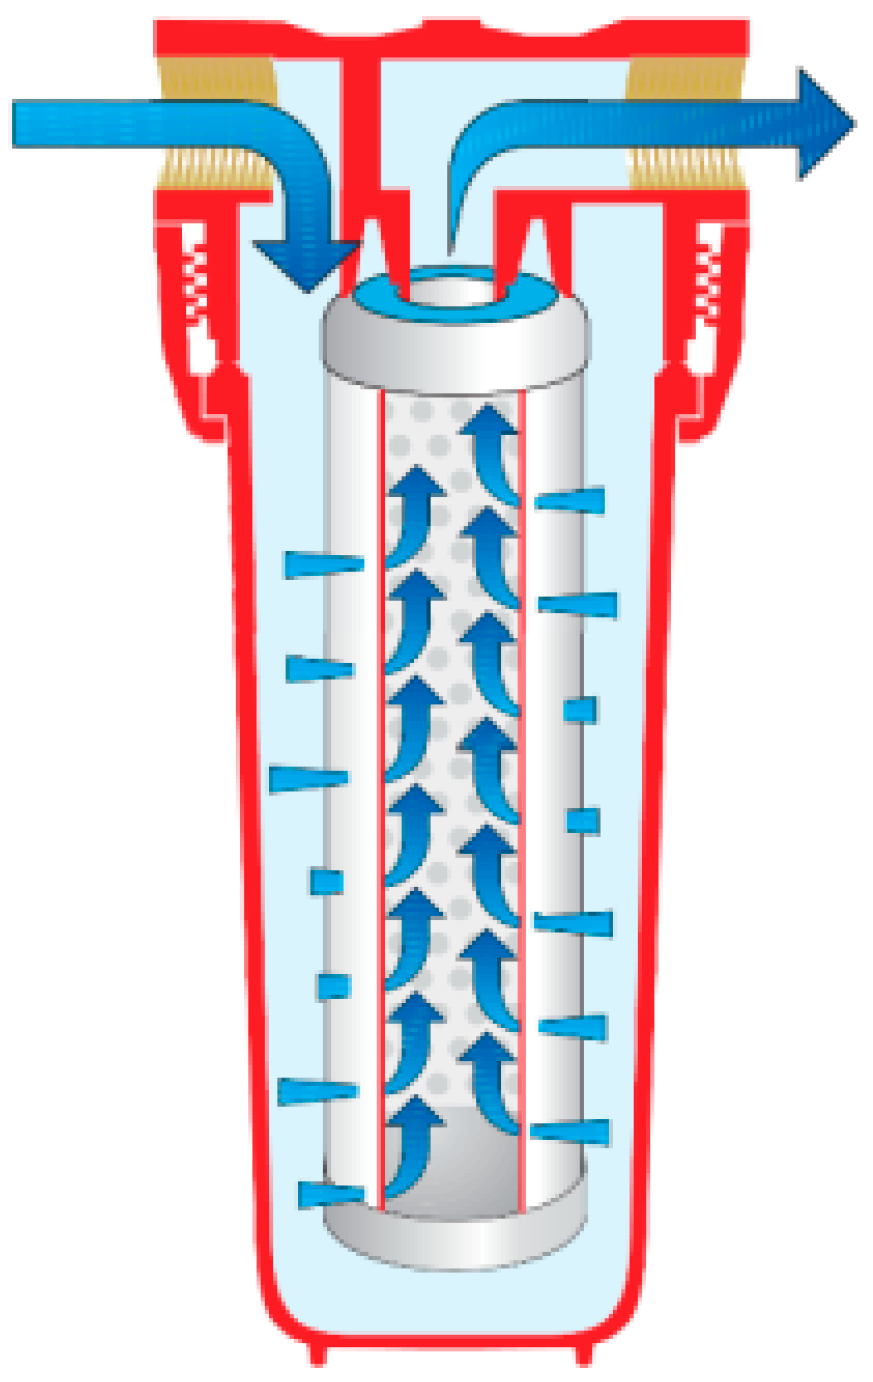
Figure 3.
Sketch of the pilot circuit adopted for the laboratory experiments.
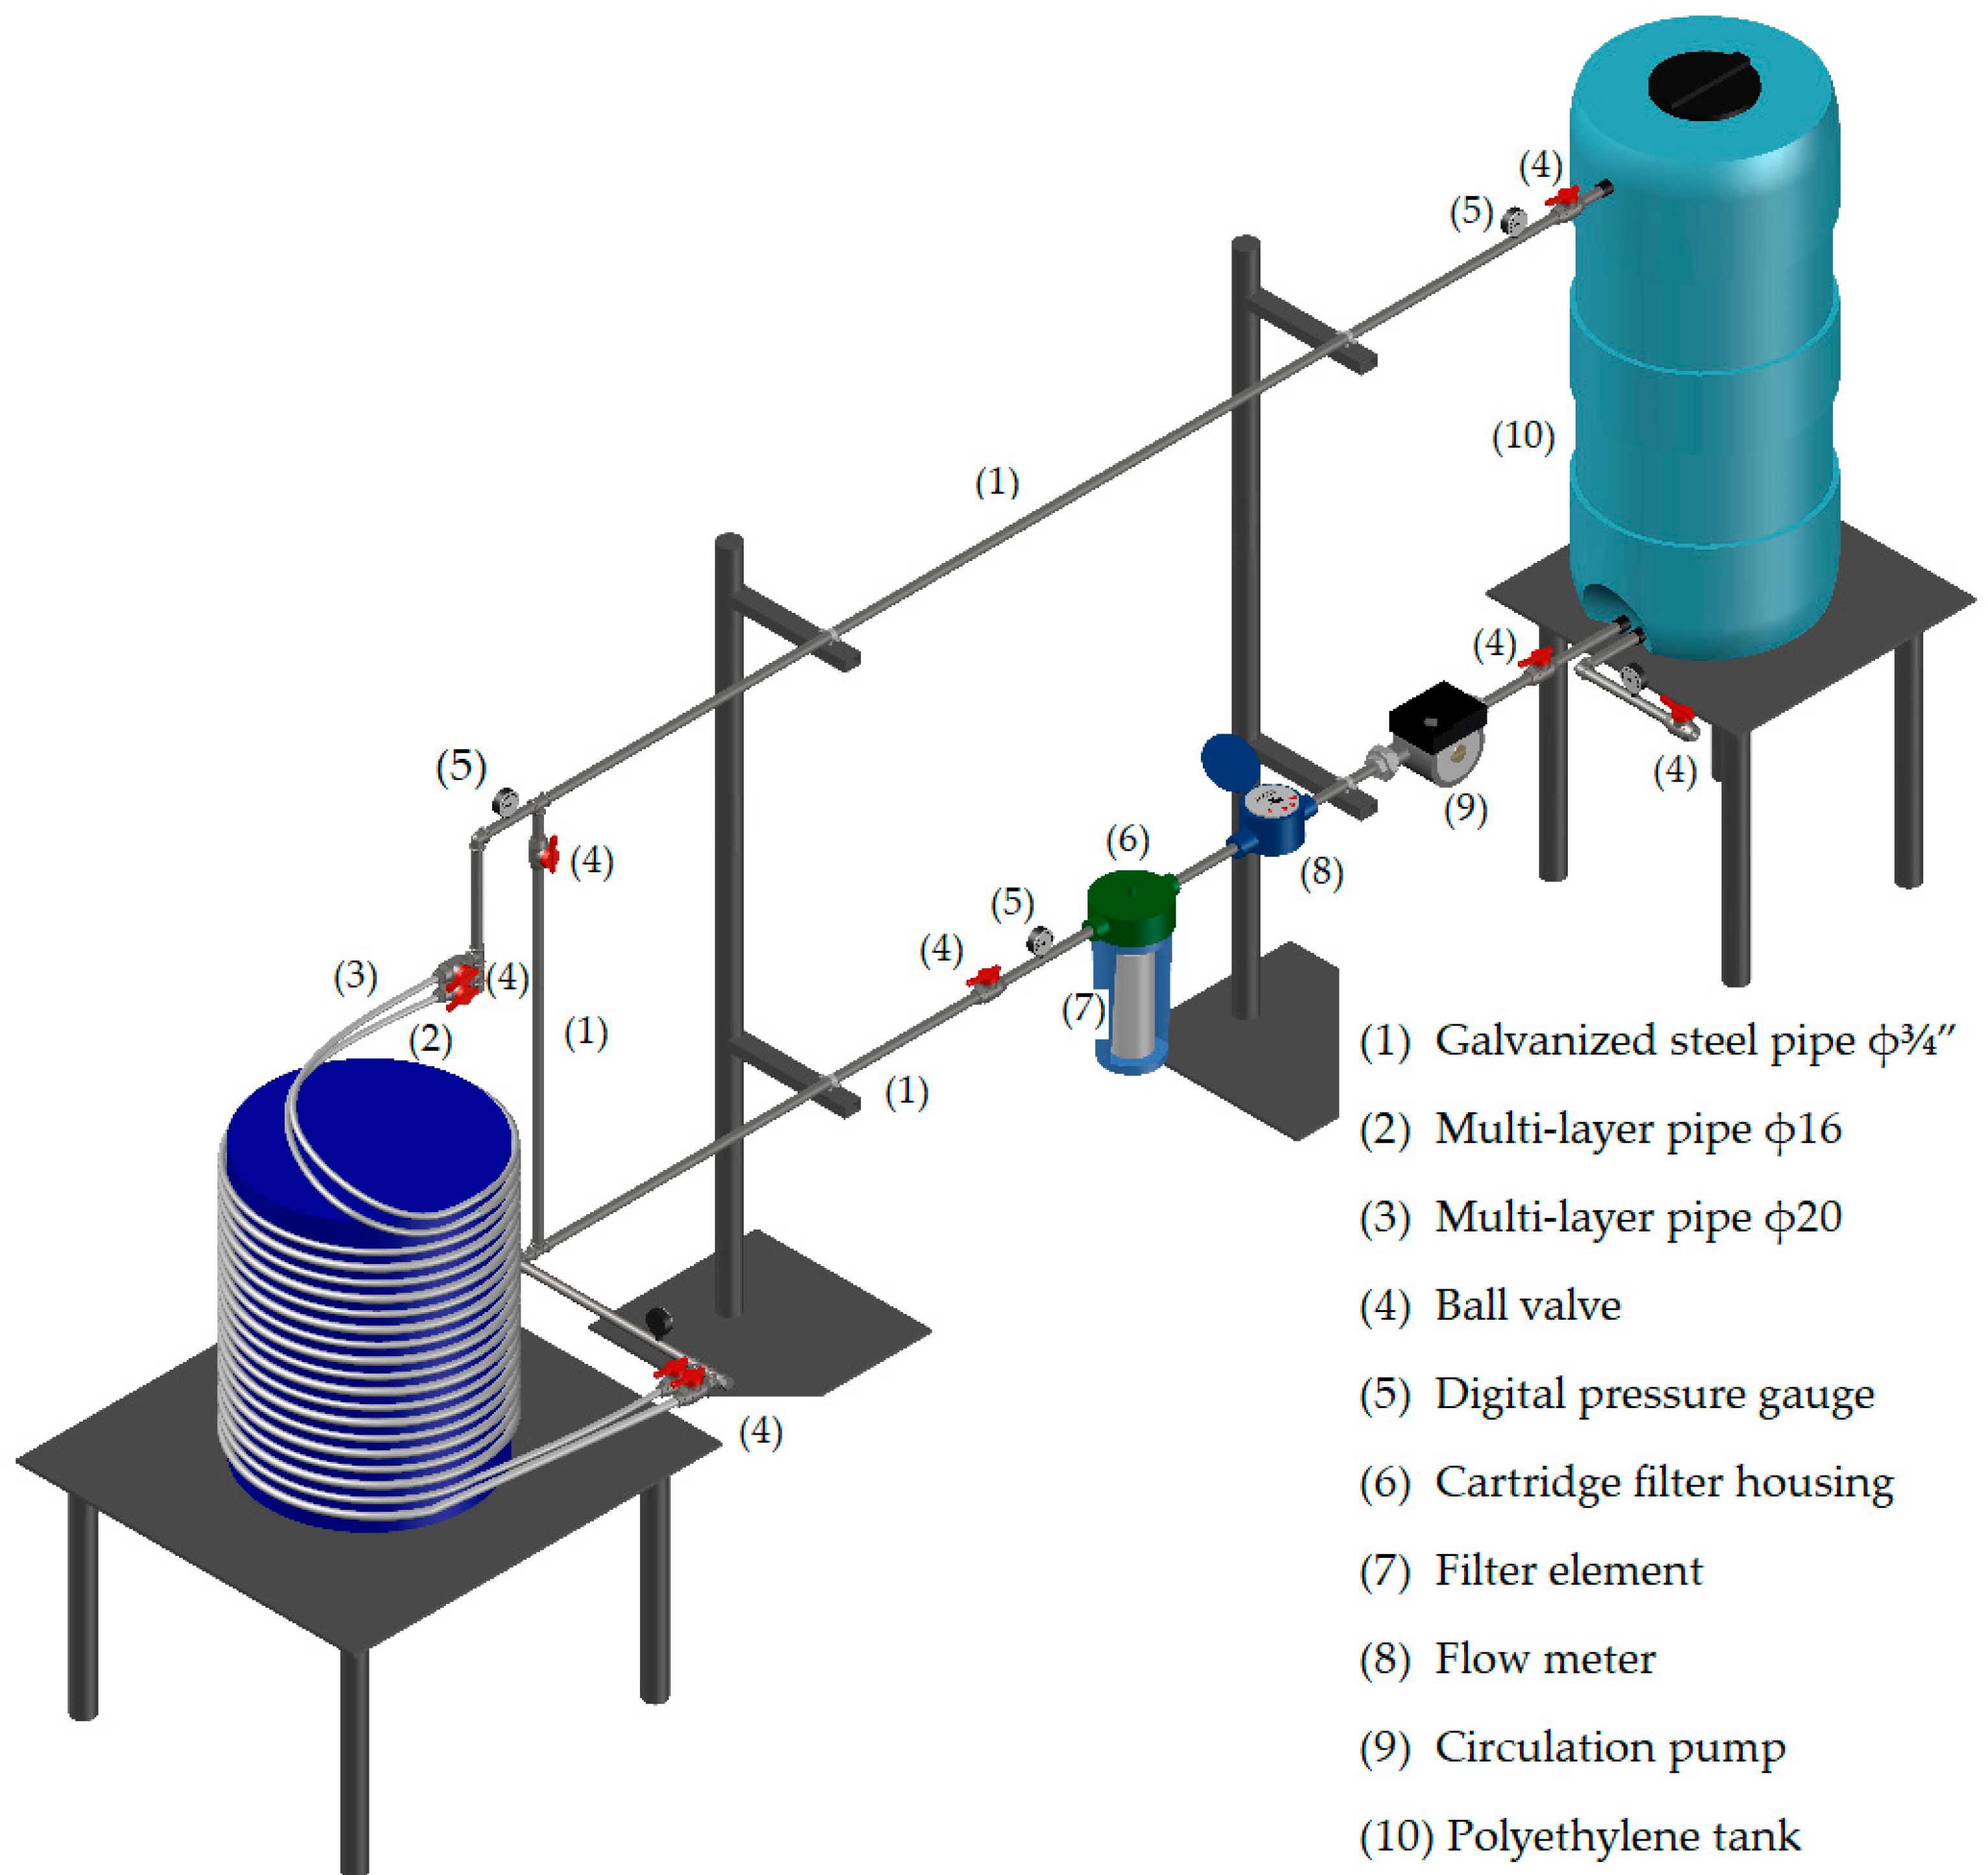
Figure 4.
Container for filter cartridges.

Figure 5.
Materials used for the filter clogging: (a) fine gravel; (b) fine sand.

Figure 6.
Fine gravel clogging.

Figure 7.
Progressive clogging rates of fine gravel: (a) 7.5%; (b) 15%; (c) 30%.
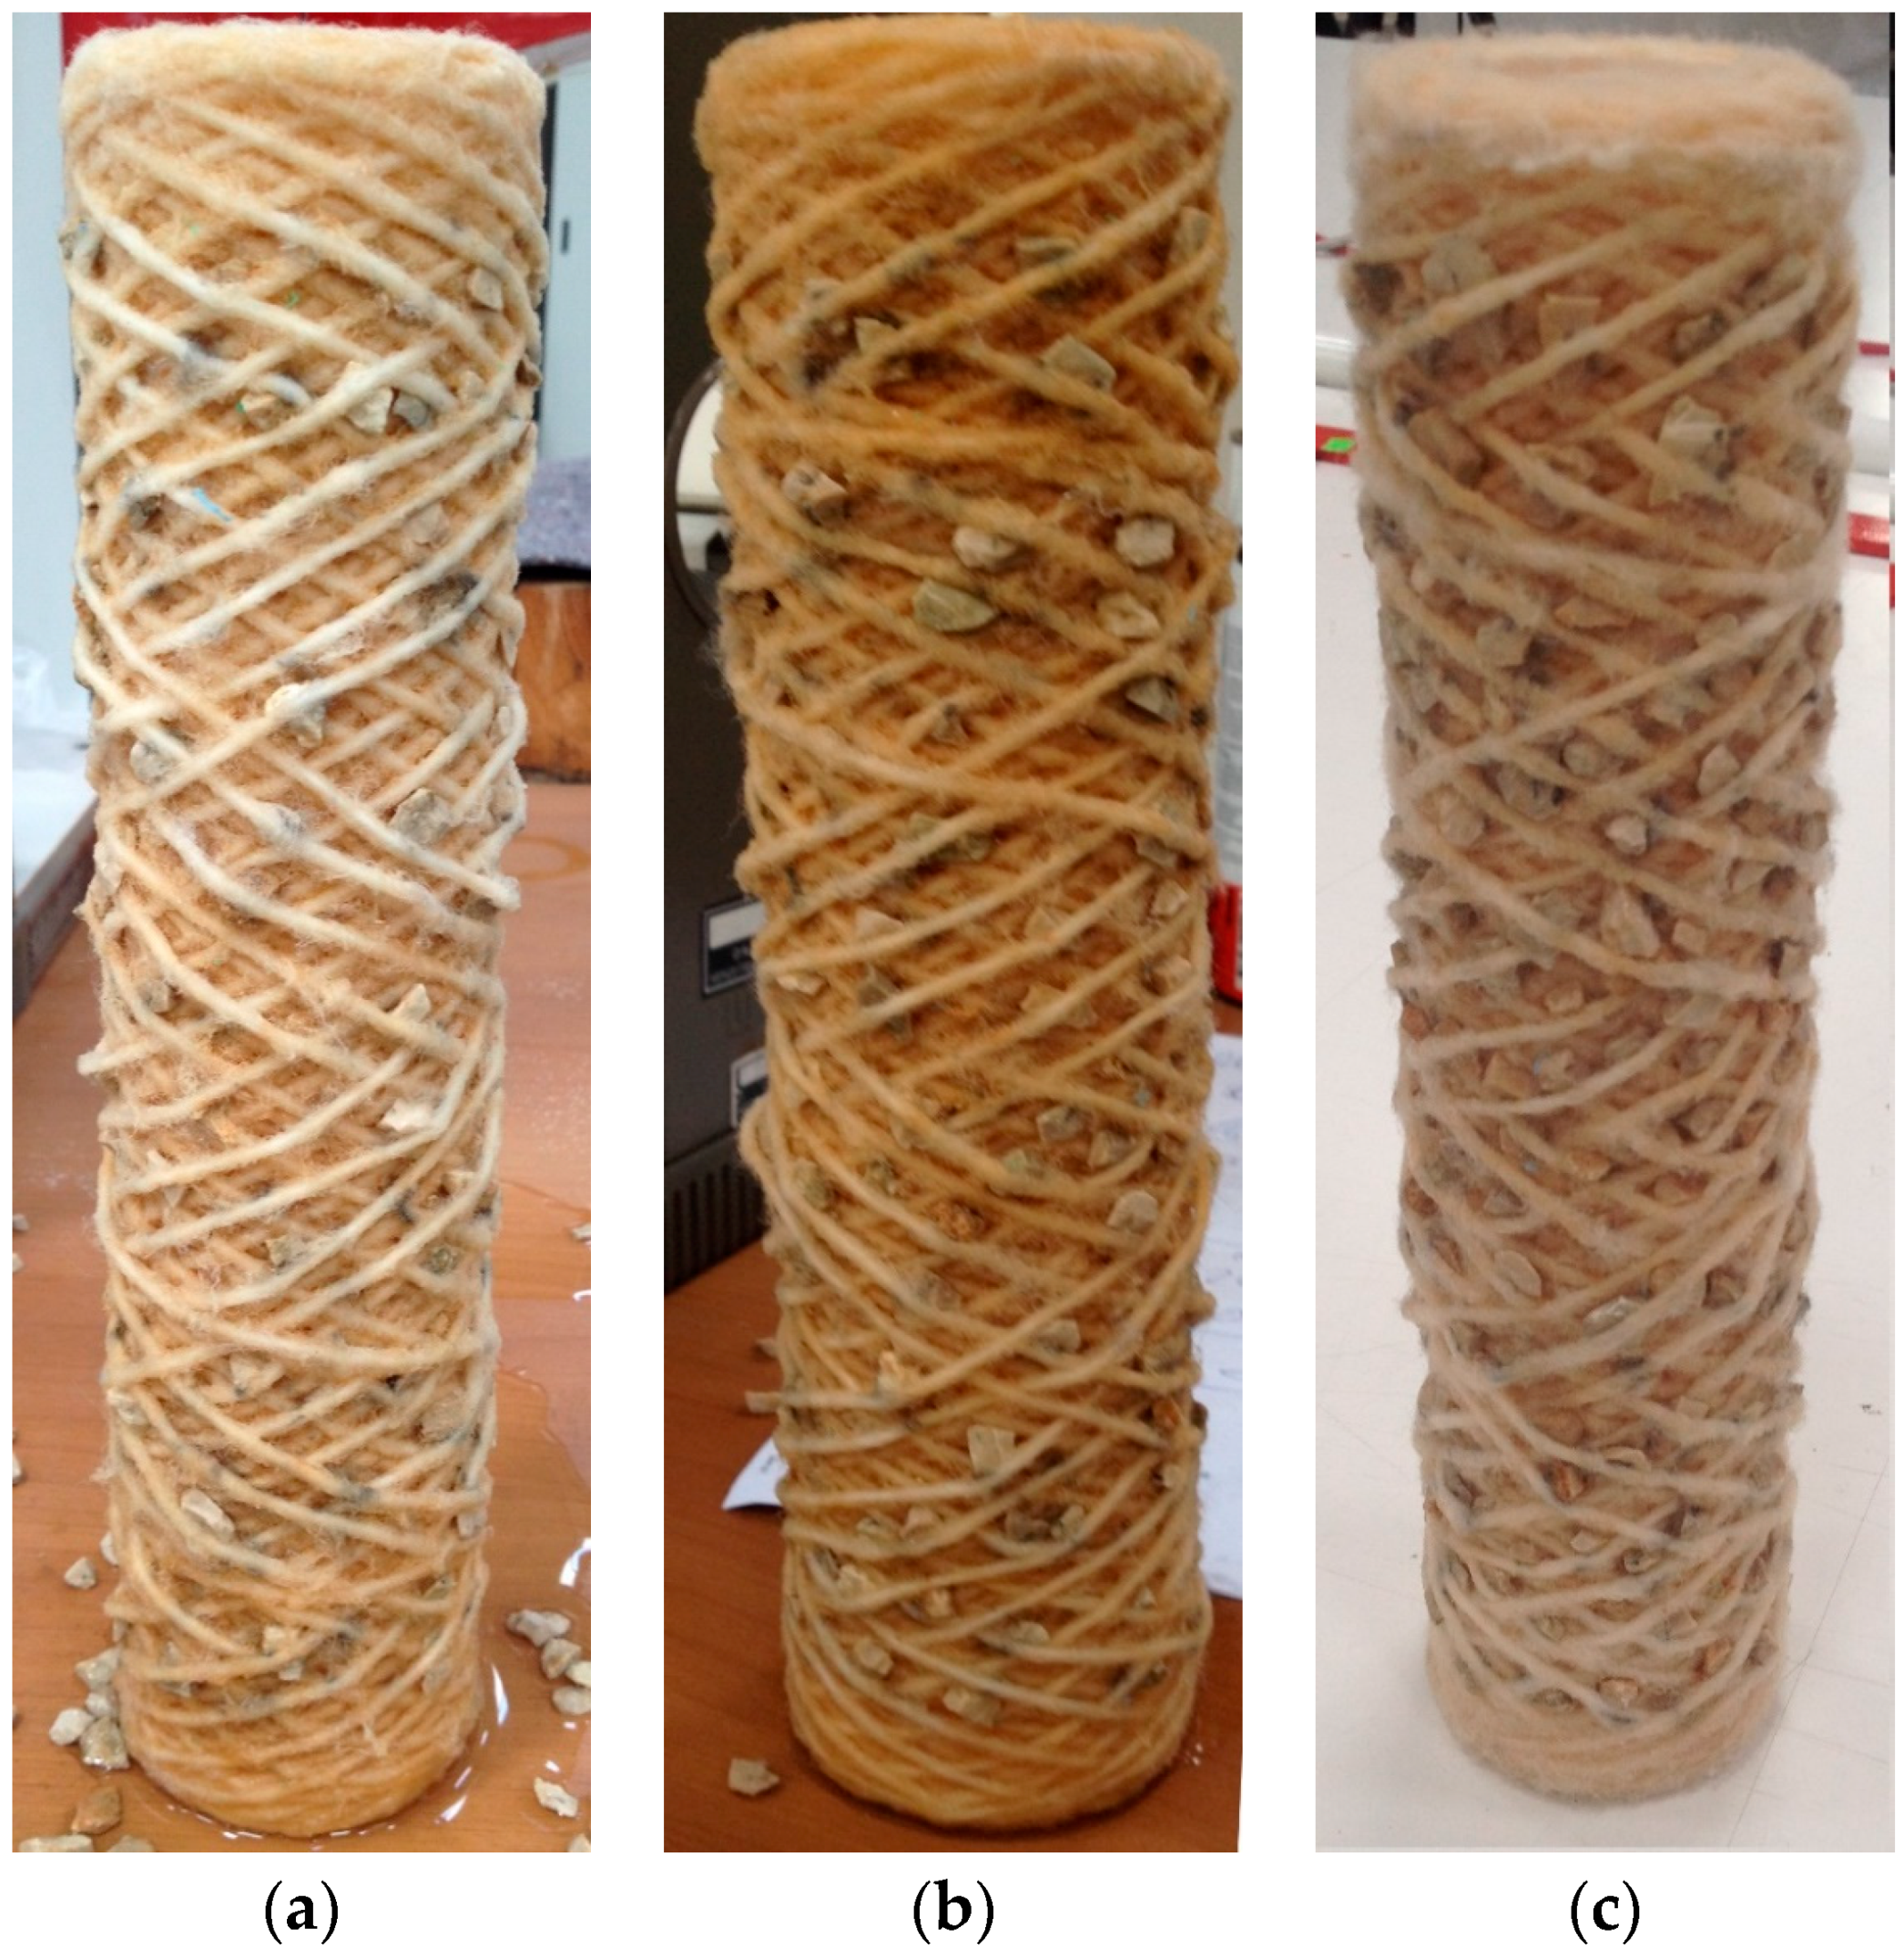
Figure 8.
Progressively increasing clogging rates with fine sand: (a) 20 g, (b) 40 g, (c) 60 g and (d) 80 g, respectively.
Figure 8.
Progressively increasing clogging rates with fine sand: (a) 20 g, (b) 40 g, (c) 60 g and (d) 80 g, respectively.
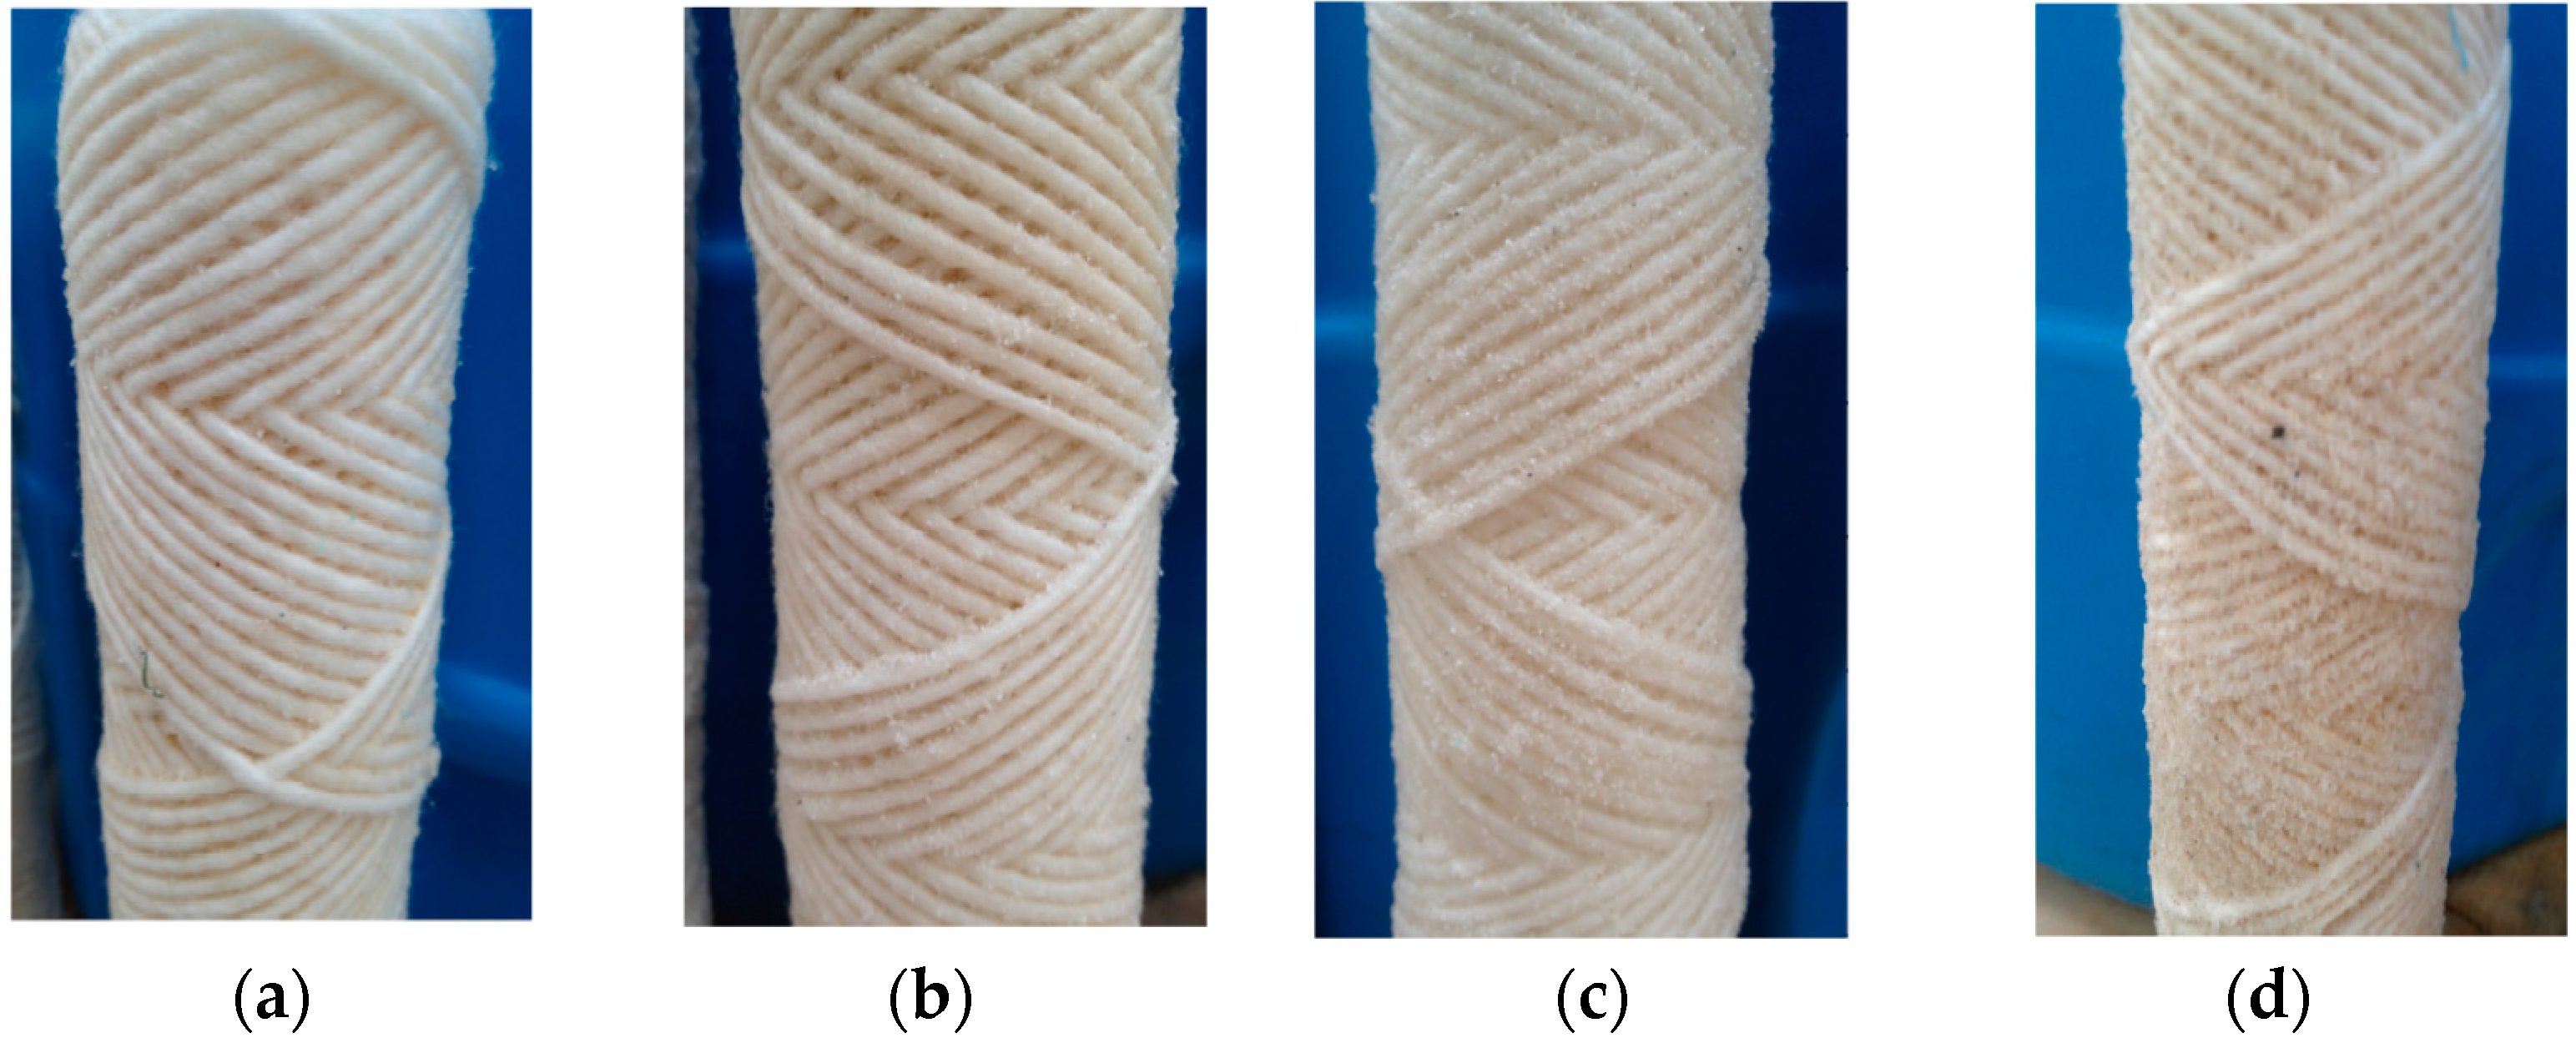
Figure 9.
Results of all tests of clogging with fine sand in terms of head losses as functions of discharges for the three different discharges.
Figure 9.
Results of all tests of clogging with fine sand in terms of head losses as functions of discharges for the three different discharges.
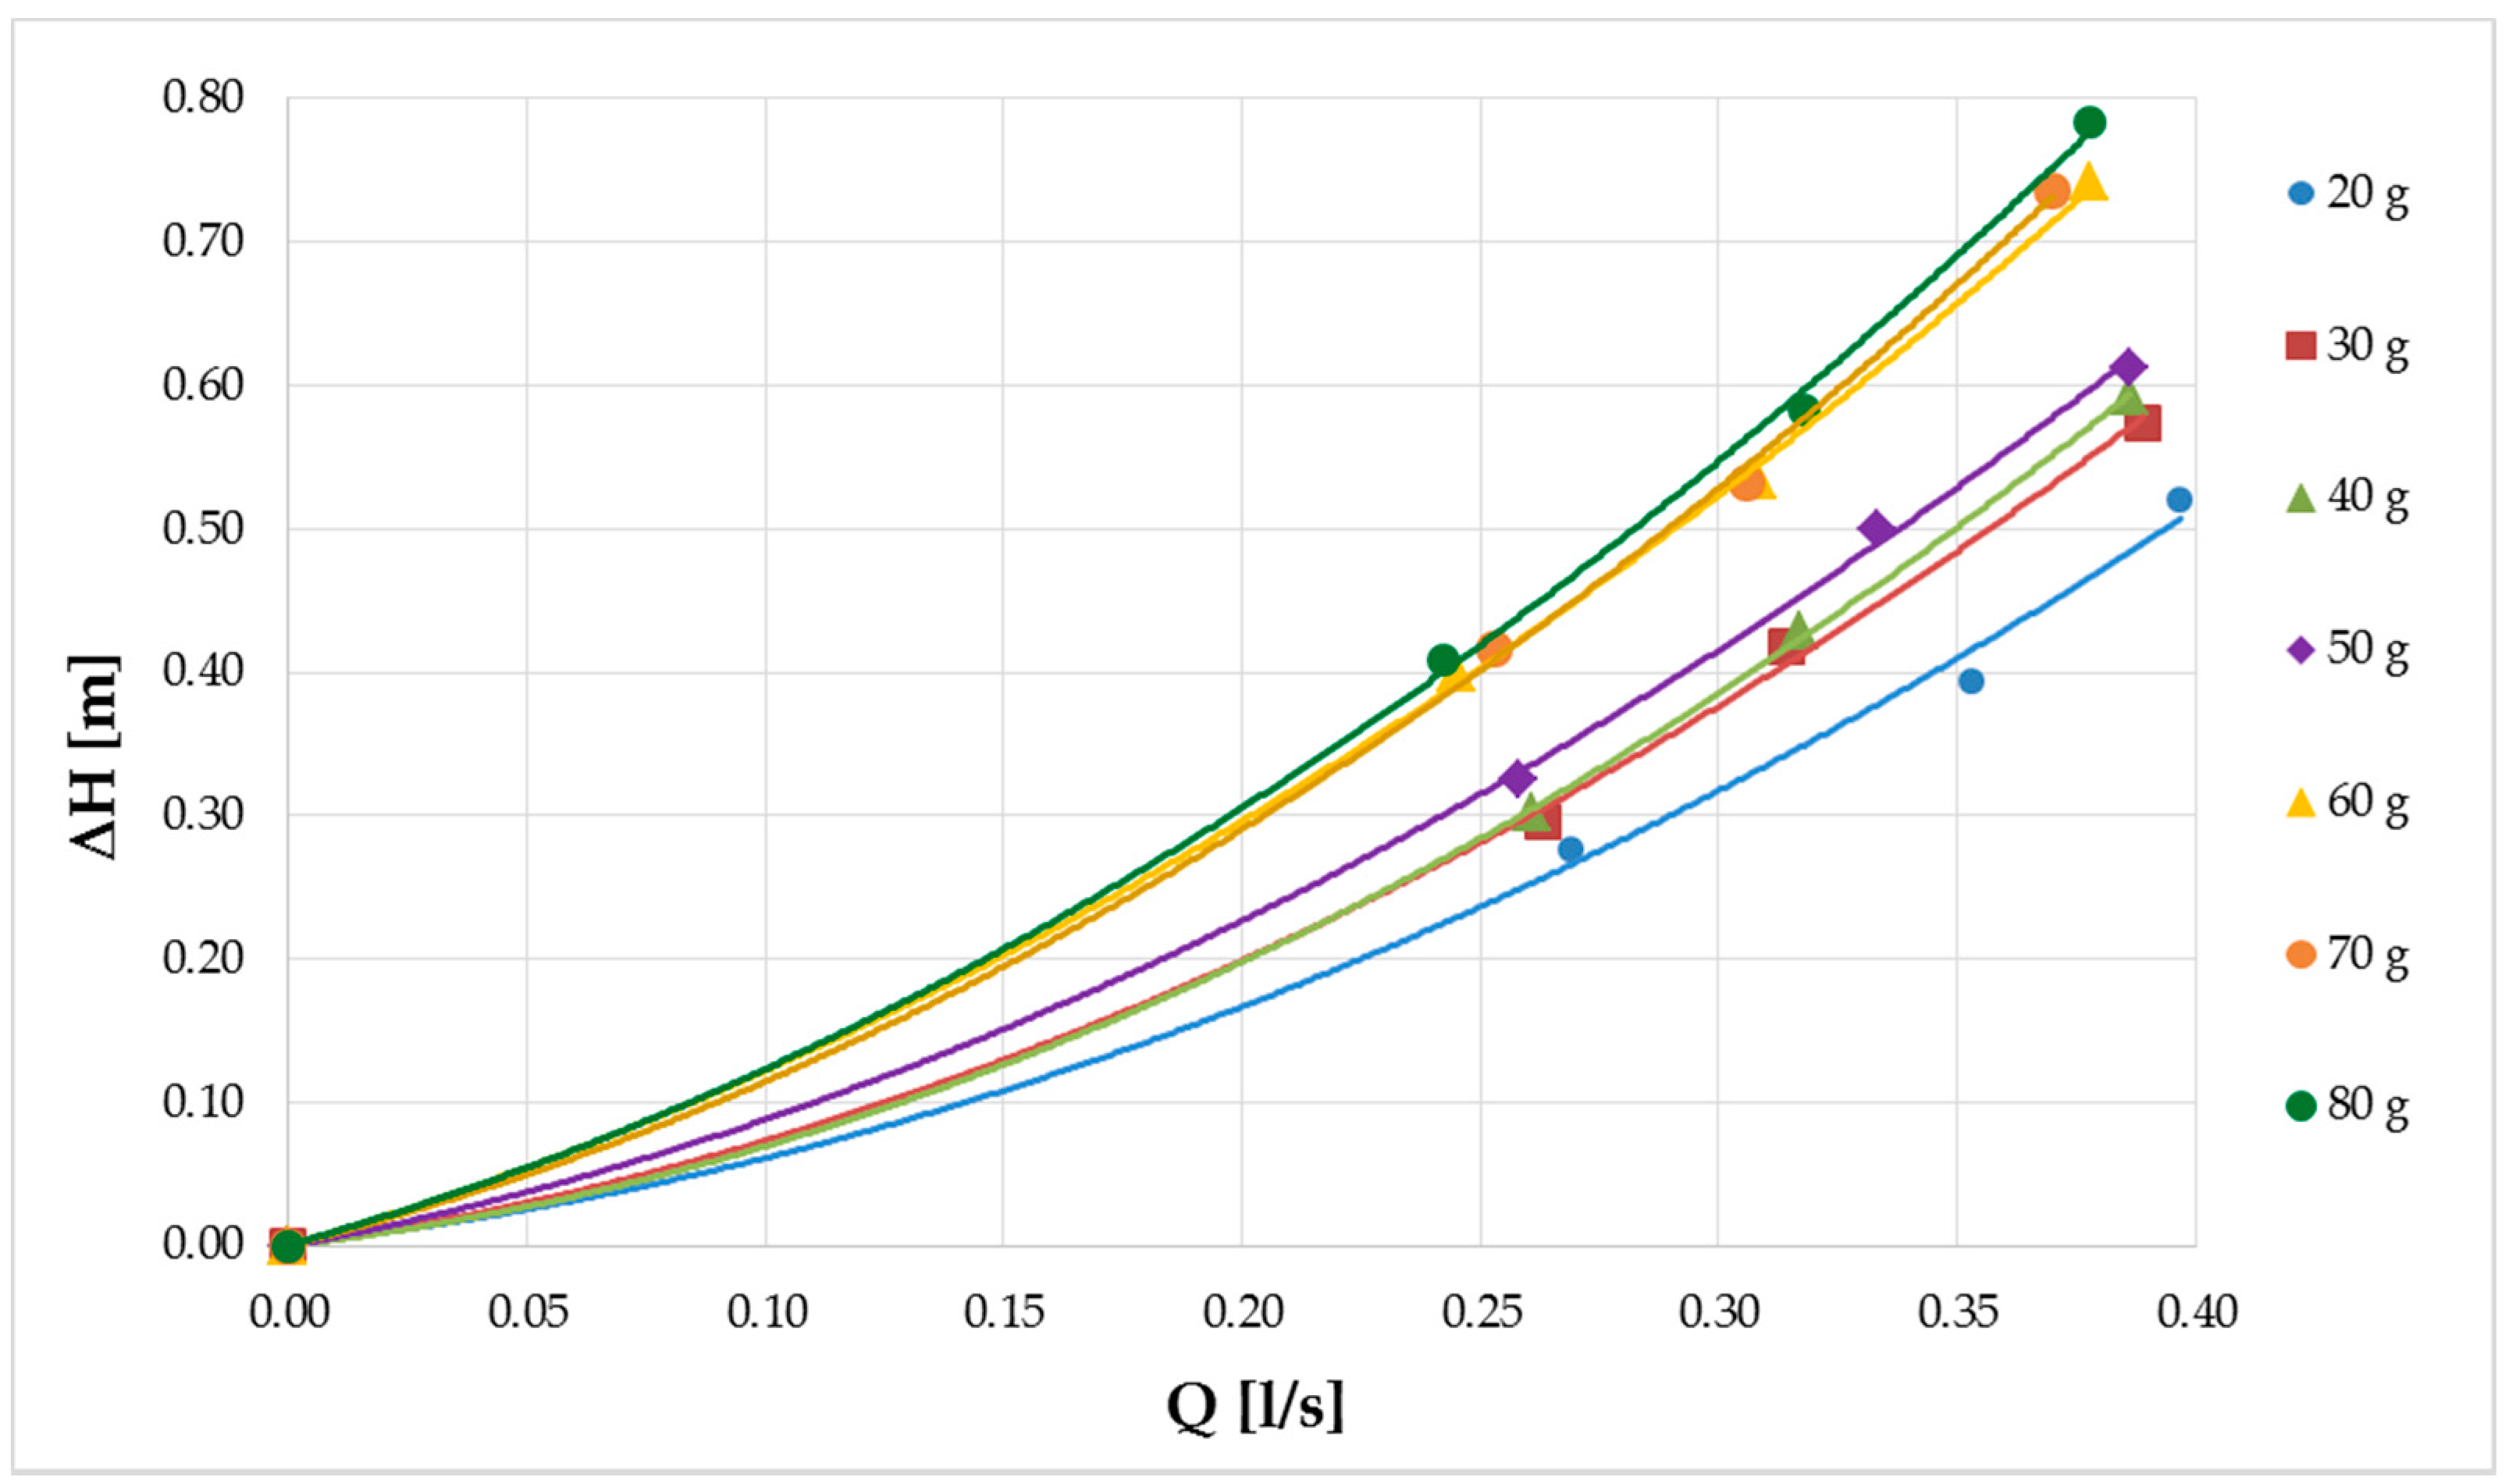
Figure 10.
Values of coefficients β as functions of the velocities for all tests of clogging with fine sand.
Figure 10.
Values of coefficients β as functions of the velocities for all tests of clogging with fine sand.

Figure 11.
β–V relations with trend lines highlighted as black bold broken lines.

Figure 12.
Pressure drop ∆p trend obtained by clogging filters with fine gravel.

Figure 13.
Pressure drop ∆p trend obtained by clogging filters with fine sand.

Table 1.
Experimental conditions for the filter clogging by fine gravel.
| Clogging Scenario | Particle Number N | Unit Clog Area | Total Clog Area | Clogging Rate |
|---|---|---|---|---|
| (n°) | (-) | (mm2) | (mm2) | |
| 1 | 57 | 0.64 | 36.48 | 0.08 |
| 2 | 112 | 0.64 | 71.68 | 0.15 |
| 3 | 225 | 0.64 | 144.00 | 0.30 |
Table 2.
Progressive clogging rates with fine sand.
| Clogging Scenario | Employed Sand (g) | Detached and Deposited Sand (g) | Effective Sand (g) |
|---|---|---|---|
| 1 | 20 | 0 | 20 |
| 2 | 40 | 5 | 35 |
| 3 | 60 | 15 | 45 |
| 4 | 80 | 20 | 60 |
Table 3.
Values of the head losses, discharges, velocities and β coefficients (the values in bold type are the averages) for progressive clogging rates with fine sand.
Table 3.
Values of the head losses, discharges, velocities and β coefficients (the values in bold type are the averages) for progressive clogging rates with fine sand.
| i | Q | ∆H | V | β |
|---|---|---|---|---|
| (g) | (L/s) | (m) | (m/s) | |
| 20 | 0.269 | 0.276 | 0.944 | 6.08 |
| 0.353 | 0.394 | 1.238 | 5.04 | |
| 0.397 | 0.520 | 1.393 | 5.25 | |
| 0.340 | 0.396 | 1.192 | 5.456 | |
| 30 | 0.263 | 0.296 | 0.923 | 6.82 |
| 0.314 | 0.418 | 1.102 | 6.76 | |
| 0.389 | 0.574 | 1.365 | 6.04 | |
| 0.322 | 0.429 | 1.130 | 6.541 | |
| 40 | 0.261 | 0.302 | 0.916 | 7.06 |
| 0.317 | 0.429 | 1.112 | 6.80 | |
| 0.386 | 0.592 | 1.354 | 6.33 | |
| 0.321 | 0.441 | 1.127 | 6.728 | |
| 50 | 0.258 | 0.324 | 0.905 | 7.77 |
| 0.333 | 0.500 | 1.168 | 7.19 | |
| 0.386 | 0.613 | 1.354 | 6.56 | |
| 0.326 | 0.479 | 1.143 | 7.172 | |
| 60 | 0.245 | 0.399 | 0.860 | 10.59 |
| 0.308 | 0.534 | 1.081 | 8.98 | |
| 0.378 | 0.742 | 1.326 | 8.27 | |
| 0.310 | 0.558 | 1.089 | 9.279 | |
| 70 | 0.253 | 0.417 | 0.888 | 10.39 |
| 0.306 | 0.533 | 1.074 | 9.07 | |
| 0.37 | 0.737 | 1.298 | 8.58 | |
| 0.310 | 0.562 | 1.086 | 9.343 | |
| 80 | 0.242 | 0.408 | 0.849 | 11.10 |
| 0.318 | 0.584 | 1.116 | 9.20 | |
| 0.378 | 0.784 | 1.326 | 8.74 | |
| 0.313 | 0.592 | 1.097 | 9.682 |
© 2018 by the authors. Licensee MDPI, Basel, Switzerland. This article is an open access article distributed under the terms and conditions of the Creative Commons Attribution (CC BY) license (http://creativecommons.org/licenses/by/4.0/).
Share and Cite
MDPI and ACS Style
Viccione, G.; Evangelista, S.; De Marinis, G. Experimental Analysis of the Hydraulic Performance of Wire-Wound Filter Cartridges in Domestic Plants. Water 2018, 10, 309. https://doi.org/10.3390/w10030309
AMA Style
Viccione G, Evangelista S, De Marinis G. Experimental Analysis of the Hydraulic Performance of Wire-Wound Filter Cartridges in Domestic Plants. Water. 2018; 10(3):309. https://doi.org/10.3390/w10030309
Chicago/Turabian StyleViccione, Giacomo, Stefania Evangelista, and Giovanni De Marinis. 2018. "Experimental Analysis of the Hydraulic Performance of Wire-Wound Filter Cartridges in Domestic Plants" Water 10, no. 3: 309. https://doi.org/10.3390/w10030309
Note that from the first issue of 2016, this journal uses article numbers instead of page numbers. See further details here.