Hydrogeochemical Evolution and Heavy Metal Contamination in Groundwater of a Reclaimed Land on Zhoushan Island
by

Xiaoying Zhang
1,2, 
Bill X. Hu
1,3,
Peng Wang
1,*,
Junbing Chen
4,
Lei Yang
4,
Kai Xiao
3 and
Xiaowei Zhang
3 1
Institute of Groundwater and Earth Sciences, Jinan University, Guangzhou 510632, China
2
Department of Ecology, Jinan University, Guangzhou 510632, China
3
School of Water Resources & Environment, China University of Geosciences, Beijing 100083, China
4
Zhejiang Institute of Hydrogeology and Engineering Geology, Ningbo 315012, China
*
Author to whom correspondence should be addressed.
Water 2018, 10(3), 316; https://doi.org/10.3390/w10030316
Submission received: 7 January 2018
/
Revised: 3 March 2018
/
Accepted: 8 March 2018
/
Published: 13 March 2018
Abstract
:The need for valuable land has encouraged reclamation in coastal areas worldwide in the past decades. Land reclamation can alter the groundwater quality in coastal aquifers. The purpose of this study is to identify the effect of land reclamation on groundwater chemistry, especially the major ions, and heavy metals on Zhoushan Island, China. The subsurface media on the island is composed of two layers, i.e., an upper infill layer and an underlain clay layer. The upper layer is previously ocean and filled with various materials. The clay layer is the original marine sediment. The dominated Na and Cl ions in groundwater illustrate high salinity sources of groundwater in the subsurface of the reclaimed land. A mixing trend between seawater and river water of the groundwater in infill layer is also detected based on the ratios of Cl and Br. Though the heavy metal concentrations (Cd, Cr, Zn and Hg) are high in marine sediments, no significant releasing trends in the groundwater are detected in a short-term after reclamation (based on standard GB18668). Meanwhile, Fe-III concentrations in the aquifer have a strong correlation with precipitation events. Column desorption experiments and simulations indicate the Cd and Cr release from the sediment would pose a health risk when the groundwater in the infill layer being gradually flushed by fresh water. These results provide a foundation for the prediction of groundwater quality and are helpful for the future water management in a newly reclaimed land.
1. Introduction
With the rapid urbanization, economic prosperity and demographic concentration in coastal regions, reclamation has become a widely used approach in the world to solve land shortage problem in coastal areas [1,2]. Many countries, such as Singapore, Netherlands, Australia, Japan, South Korea and China, have pushed their coastlines seaward for a variety of purposes, industrial, institutional, residential and even agricultural [3,4,5]. For example, South Korea has reclaimed more than 62,000 ha of its coastal area since the Second World War [5]. In HongKong, about a tenth of its developed area is reclaimed land [6]. This practice has been continued to increase rapidly in China [7]. According to an official report from State Oceanic Administration, People’s Republic of China, the authorized area of reclaimed land was 11,055.29 ha in 2015, which had increased 13.19% over the previous decade [8]. In Zhejiang province, a total of 230,000 ha of tidal lands have been reclaimed for agriculture, residence buildings, and industrial development during the past 65 years. Furthermore, an additional 175,000 ha of tidal flats are planned for reclamation by 2050 [9].
Land reclamation is carried out by dumping fill materials such as decomposed granite rock from nearby hills onto the seabed of marine sediment [10,11]. In contrast to the natural environment, the coastal lands in this region have been substantially modified by the man-made materials [9,12]. The conversion of the sea to land permanently changes the natural characteristics of the ocean and coastal environment and causes considerable variations to the marine ecosystems upon which human-kind depends [13,14,15,16,17]. Boruvka and Kozak reported that spatial heterogeneity of coastal plain soils differed greatly from that of natural soils due to their anthropogenic origin [18]. Huang et al. found that the pH, EC, and salinity in soil were reduced after reclamation for the precipitation and oxidation in soils [19]. Yang et al. indicated the salinization condition of topsoil is more serious from the broken/hindered groundwater flow path to the ocean [20]. Meanwhile, coastal sediments were widely believed to act as the final destination of heavy metals and refractory pollutants [21]. The high concentration of heavy metals in marine sediment could be easily rushed out with precipitation and act as potential hazards to human health via the food chain [22,23,24,25]. All these facts indicate that reclamation could generate serious environmental problems in coastal zones [26,27]. Interpretation of the hydrochemical parameters in groundwater can help to understand hydrogeological conditions and used to determine water usage as the composition changes [28]. Therefore, a detailed chemistry evaluation is necessary for reasonable and scientific coastal groundwater contaminant evaluation and water management.
Taking the reclamation on Zhoushan Island as an example, this study aims to identify the anthropogenic influences on groundwater hydrogeochemical evolution, nitrogen and heavy metal contamination in the reclaimed aquifer. Fourteen boreholes were drilled to collect groundwater samples. Major ions, pH, total dissolved solids (TDS), and chemical oxygen demand (COD) were measured every two weeks continuously to support the analysis of temporal chemical variation pattern. In addition, two metals, Fe and Mn, along with toxic trace metals (Cd and Cr) were investigated to examine the potential enrichment and mobility mechanisms of heavy metals within the reclaimed aquifer.
2. Materials and Methods
2.1. Study Area
Zhoushan Island (ZSI) is the largest island of Zhoushan Archipelago’s 1390 embracing islands, which are located in the central part of China’s coastline in Zhejiang Province (Figure 1) [9,24]. As an island city, the rapid development of tourism, fish farming, ports, harbors, and urbanization has led to a sharp increase in the demand for usable land, which has resulted in the long history of coastal land reclamation [29]. The reclamation started in the 2000s. This study focuses on the reclamation region that locates on the southeast side of ZSI.
The study region is in a typical northern subtropical monsoon zone, with a mean annual temperature of 15.8–16.7 °C. The coldest month is January with an average temperature around 5 °C, while the hottest month is August, at about 27 °C. The annual precipitation is 921.6–1318.8 mm, and annual average evaporation is 1225.9–1374.2 mm, which is larger than precipitation. The tide in the reclamation area is a semidiurnal tide. The long-term measured average tidal range is 1.91–3.31 m and the maximum tidal range is up to 4.96 m [30].
2.2. Geological Condition
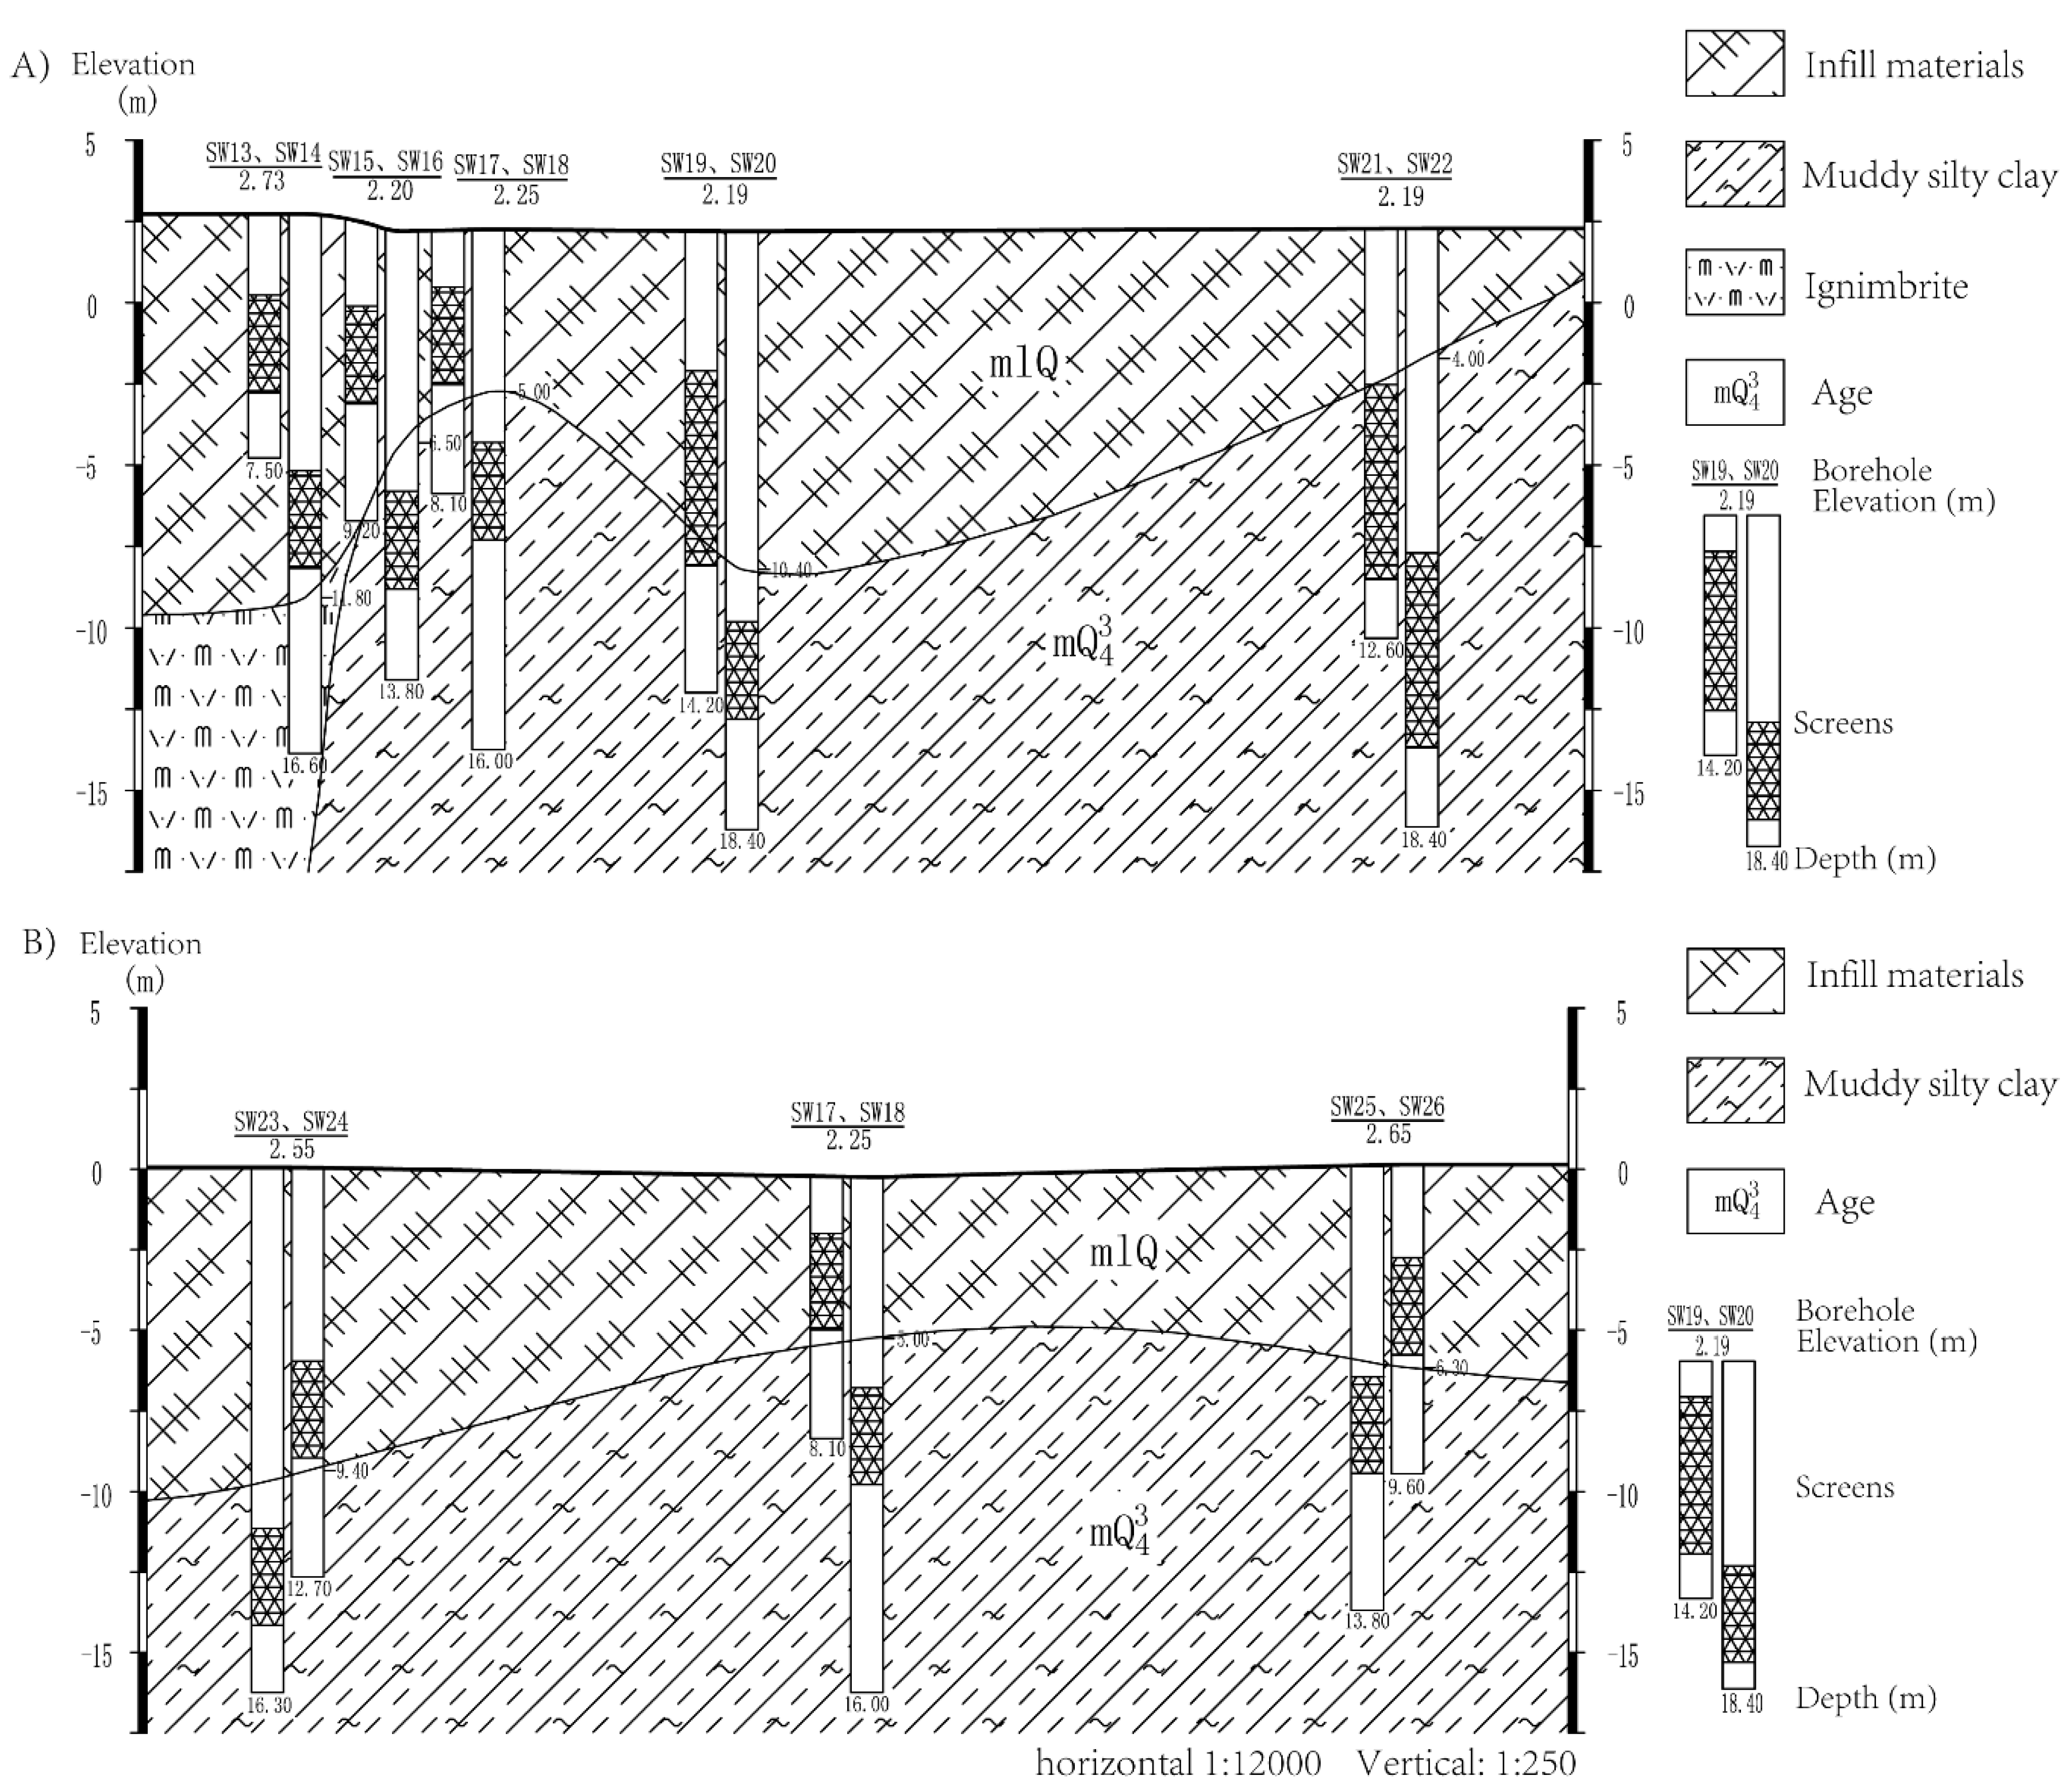
The preliminary investigation indicates the reclamation area has a shallow strata structure. The reclamation thickness ranges 0–11.8 m, and becomes thinner from west hilly area to the reclamation dike, as shown in Figure 2. The filled materials in the upper anthropogenic layer are mainly composed of granite stone blocks and gravels from the nearby mountains. The stone blocks are generally 20–50 cm in diameter, part up to 80–100 cm and occupy about 50–80% of the volume. The gravel diameters are 5–20 cm and take up 25% of the volume. The gaps between the stone blocks and gravels are filled with clay and sand. Thus, the infill layer has a high porosity. The underlain layer is marine sediment and consists mainly of muddy silty clay with silt aggregate and visible shells. The clay is even, plastic and viscous with gray color and displays thick-bedding. The dike is 1.2 m higher than the highest high tide level. Pipes with a diameter of 0.5 m are installed inside the dike every 100 m to drain water from the reclaimed region to the sea.
2.3. Borehole Design and Sampling
To investigate the changes of chemical properties of groundwater, 14 boreholes were drilled in the reclaimed region in 2014 using rotary drilling rigs, as shown in Figure 1. Five groups were set up from reclamation dike towards inland along a one-dimensional transect. The odd number boreholes, SW13, SW15, SW17, SW19, and SW21, were screened in the filled materials and the even number boreholes, SW14, SW16, SW18, SW20, SW22, were drilled to penetrate the underlying clay layer. However, no clay sediment existed next to the hill in the west side, as shown in Figure 2A. Therefore, SW14 was in the infill layer. For borehole SW21, the clay sediment was piled up from the borehole bottom to land surface, thus SW21 was in the shallower clay layer. Additionally, boreholes SW21 and SW22 were located in gardening lawns, subjected to regular irrigation with freshwater transported from the mainland. Two groups, SW23 and SW24, and SW25 and SW26 were designed as control points on the north and south side respectively as shown in Figure 1. Core samples were collected in the drilling process and sealed with PVC. The sediment samples were used for the determination of soil properties and laboratory column leaching experiments.
Prior to sampling, all wells were washed by pumping out two well volumes, leaving the well with groundwater representing the surrounding environment. Then, the groundwater was sampled in the middle of the water body with a manual pump in each well. Groundwater samples were collected about every two weeks as a spring-neap cycle at mean tide level from March 2015 to September 2016. River and seawater samples were collected simultaneously to provide hydrochemical background information. Water samples were first filtered through 0.45 μm membrane filters and analyzed within three days. Two samples were collected in each borehole. One was simply stored below 4 °C for measurement of conventional ions and physicochemical factors (Ca, Mg, Na, K, Cl, SO4, HCO3, NO2, NO3, NH4, F, Br, pH, COD, and TDS), while the other was acidified with 1:1 HNO3 for metal concentration analysis (Fe, Mn, Cr, Cu, Zn, As, Cd, Hg, and Pb).
In addition, nine marine samples were collected on the surface of marine sediments with grab sampler in the area outside the reclaimed land (locations labeled “D” in Figure 1). Heavy metals were analyzed in the marine samples including As, Cu, Zn, Pb, Cd, Cr, Zn, and Hg. Core samples in boreholes were collected in the drilling process and sealed with PVC for the determination of soil properties and laboratory column leaching experiment. The heavy metals in boreholes as in marine were also conducted for boreholes SW16, SW18, SW20, SW22, SW24, and SW26. The samples from the sediments in the clay layers could provide information on the changes of the metal concentrations in the sediment after it was buried. These samples, together with the groundwater samples from the same site, could provide information on the chemical exchange between the sediment and the pore water.
The major ions and metal concentrations (Ca, Mg, Na, K, Fe, Mn, Cr, Cu, and Zn) were analyzed using inductively coupled plasma analysis (ICP-OES). The concentrations of heavy metals (As, Cd, Hg, and Pb) and Br in groundwater were determined by inductively coupled plasma–mass spectrometry (ICP-MS). Ultraviolet-visible light detector was used to analyze SO4, NO3, NH4, and NO2. pH and F were analyzed with ion analyzer. The concentrations of Cl, HCO3, and COD were determined by titration method. The drifts of all elements analyzed were <5%. Two replicate analyses for each sample were performed and the mean values were adopted.
2.4. Column Experiments
The soils from borehole SW21 were mixed, air dried and sieved to particles smaller than 2 mm as a material to evaluate heavy metal desorption rate. The properties of soils were first analyzed before the experiment. The grain size distribution is illustrated in Table 1. The ratio between clay-slit to sand was about 1:3. The measured (CEC) was 8.58 cmol(+)/kg. The releasing properties of heavy metals Cr and Cd with high concentrations were tested. The contaminated soil is prepared by well mixing Cr(K2Cr2O7) and Cd(Cd(NO3)2) solution into the sediment. The concentrations in soil finally reached concentrations of 428 mg/kg and 15.2 mg/kg after examination, respectively. Then the fine-grained, Cr and Cd containing materials were packed in a column (30 cm long and 8 cm inner diameter) with a porosity of 0.41 and bulk density of 1.74 g/cm3. Column packing was performed in a small increment consisting of 2–3 cm thick layers. After each layer addition, the sediment was tamped with a plastic dowel and the exterior wall of the column was gently tapped with a plastic hammer to compact the sediment. Nylon nets (0.12 mm pore diameter) were used at the top and bottom of the column to confine the sediment and facilitate the distribution of influent and the collection of effluent solutions.
The Cr and Cd leaching experiments were performed in columns injected with synthetic groundwater solution (SGW) that mimics groundwater composition in the borehole. The major ion concentrations of K, Na, Ca, Mg, Fe-II, Fe-III, HCO3, SO4, and Cl were 202, 5880, 224, 672, 3.31, 3.86, 934, 630, and 10430 mg/L in SGW, respectively. The columns were saturated slowly by injecting the Cr and Cd contaminated solution from the bottom at a constant flow rate of 0.1 mL/min. The saturation process took approximately 75 h. After the saturation, the sediment was leached with the SGW at a constant flow rate of 0.1 mL/min. A high-performance liquid chromatography (HPLC) pump was used to control the flow rate. Effluent samples were collected in an automatic fraction collector. Twelve samples were collected every 2 h during the first 2 days of the experiment and the collecting interval increased after 2 days. The experiment ended when the Cr and Cd concentrations in the outflow became stable. Effluent total Cr and Cd were analyzed by inductively coupled plasma-optical emission spectrometer (ICP-OES) (Perkin-Elmer, Optima 2100DV).
2.5. Kinetic Modeling
Three kinetic models were applied to fit the desorption data to better understand the releasing properties of Cd and Cr. The selected best fit model would be used to predict Cd and Cr releasing to groundwater in future cases. By assuming qt is the amount of soil Cd or Cr desorbed in the solution (mg/g) at any time t, three kinetic equations are described as follows.
Pseudo second order equation [31]:
t/qt = A + B t
The constants can be determined by plotting t/qt against t.
Thus, a plot of qt versus lnt should give a linear relationship with the slope of B and intercept of A.
Two-constant rate Equation [34]:
lnqt = A + B lnt
The parameters A and B can be calculated from the intercept and slope, respectively, of the linear line. These equations have been widely applied in sorption and desorption studies in soils and soil components, even though, the equations are empirical and yield only apparent rate parameters [35,36]. Finding a meaningful model that can accurately describe these data is extremely difficult because of the heterogeneity of a natural soil [37]. Therefore, these models in this study are used only for qualitative evaluation of Cd and Cr desorption in the mixed filled materials. The equations thus obtained are tested for fit goodness by least-square regression analysis. To select the equation that best fit the release of Cd and Cr in soils, the standard error of estimate (SE) is calculated as follows [38].
where q and q’ are the measured and calculated amounts of heavy metals in solutions at time t, respectively, and N is the number of measurements. A relatively large coefficient of determination (r2) and small SE are used as criteria for the best fit [39].
SE = [∑(q − q′)2/(N − 2)]1/2
3. Results and Discussions
3.1. Physicochemical Characterization of Groundwater
The statistical results of pH, TDS, and conductivity are shown in Table 2. The pH values of the groundwater in the infill and clay layers ranged 6.95–8.08 and 7.21–8.31, respectively, indicating alkaline water composition. The river and seawater samples were alkaline with average pH of 7.29 and 7.95. The TDS values of the groundwater in the infill layer varied from 1.37 to 25.17 g/L with an average of 10.28 g/L. In the clay layer, TDS values ranged from 11.55 to 24.75 g/L with an average of 17.87 g/L. The data showed higher TDS value in the clay layer, indicating a saline water composition. According to water classifications in Winslow and Kister, the collected water samples ranged from saline to very saline water [40]. Among all the boreholes, the average TDS were smallest in the group SW13 and SW14. Meanwhile, the TDS of group SW23 and SW24 in the south were lower than that of group SW25 and SW26 in the north boundary, which suggested an inactive water exchange in the north since the north boundary was impermeable. The average TDS of river and seawater were 0.15 g/L and 24.1 g/L. The results reflected seepage from the river in the west boundary. The distribution of EC was similar to that of the TDS. The averaged sample conductivities in the clay layer were higher, with small variation than that in the infill layer. Both EC and TDS indicated saltier water in the clay layer than the infill layer.
3.2. Groundwater Hydrogeochemistry
3.2.1. Hydrogeochemical Facies
The measured concentrations of major ions are shown in Table 3. The anions in groundwater samples were dominated by Cl (up to 95% in three main anion concentrations including SO4 and HCO3, where the percent is proportion in molar). The cations in the groundwater were dominated by Na (up to 91%), which may be used to determine the causes of groundwater salinization for water with TDS higher than 2–3 g/L [41,42].
To determine the hydrogeochemical facies, the concentrations of major ionic constituents of groundwater and river samples were plotted in Piper trilinear diagram Figure 3 with classifications in Table 4 [43]. The anion and cation trends were toward Cl and Na as shown in the triangles. Water samples from both the infill and the clay layers were 100% fallen into Sections 1, 4 and 7 as a saline group with SO4 + Cl > HCO3 and Na + K > Mg + Ca. The results indicated that Na and Cl were the dominated ions in the groundwater at both the infill and clay layers under the reclamation region. The Na–Cl water type simply suggested the groundwater in the reclaimed land was mainly retention of seawater. This could be confirmed by the major ion concentration correlation (>0.99) between seawater and groundwater samples. On the other hand, the groundwater in the infill layer had slightly lower Cl concentration, as shown in the lower right square-shaped field of piper plot, which illustrated a possible mixing between seawater and freshwater source.
The chemical concentrations of river samples were plotted together as an indicator of end-member for surface water in the study region. The surface river water was fresher since it had lower Na and Cl concentrations and higher Ca and SO4 concentrations. However, Na and Cl were still dominant in water samples as shown in group 7. The ion concentrations of groundwater in SW13 on 20 March 2016 were noticeably different from other samples. The lower concentration proportions of Na and Cl indicated the adjacent salty groundwater is being flushed by fresh river water. The chemical analysis demonstrated that in a short-term after reclamation, the marine source groundwater was gradually mixed with fresh water recharge from inland. The freshwater-saltwater wedge interface was moving from inland in this period and would be gradually varied in a specified range in the reclaimed subsurface.
3.2.2. Major Ion Trends
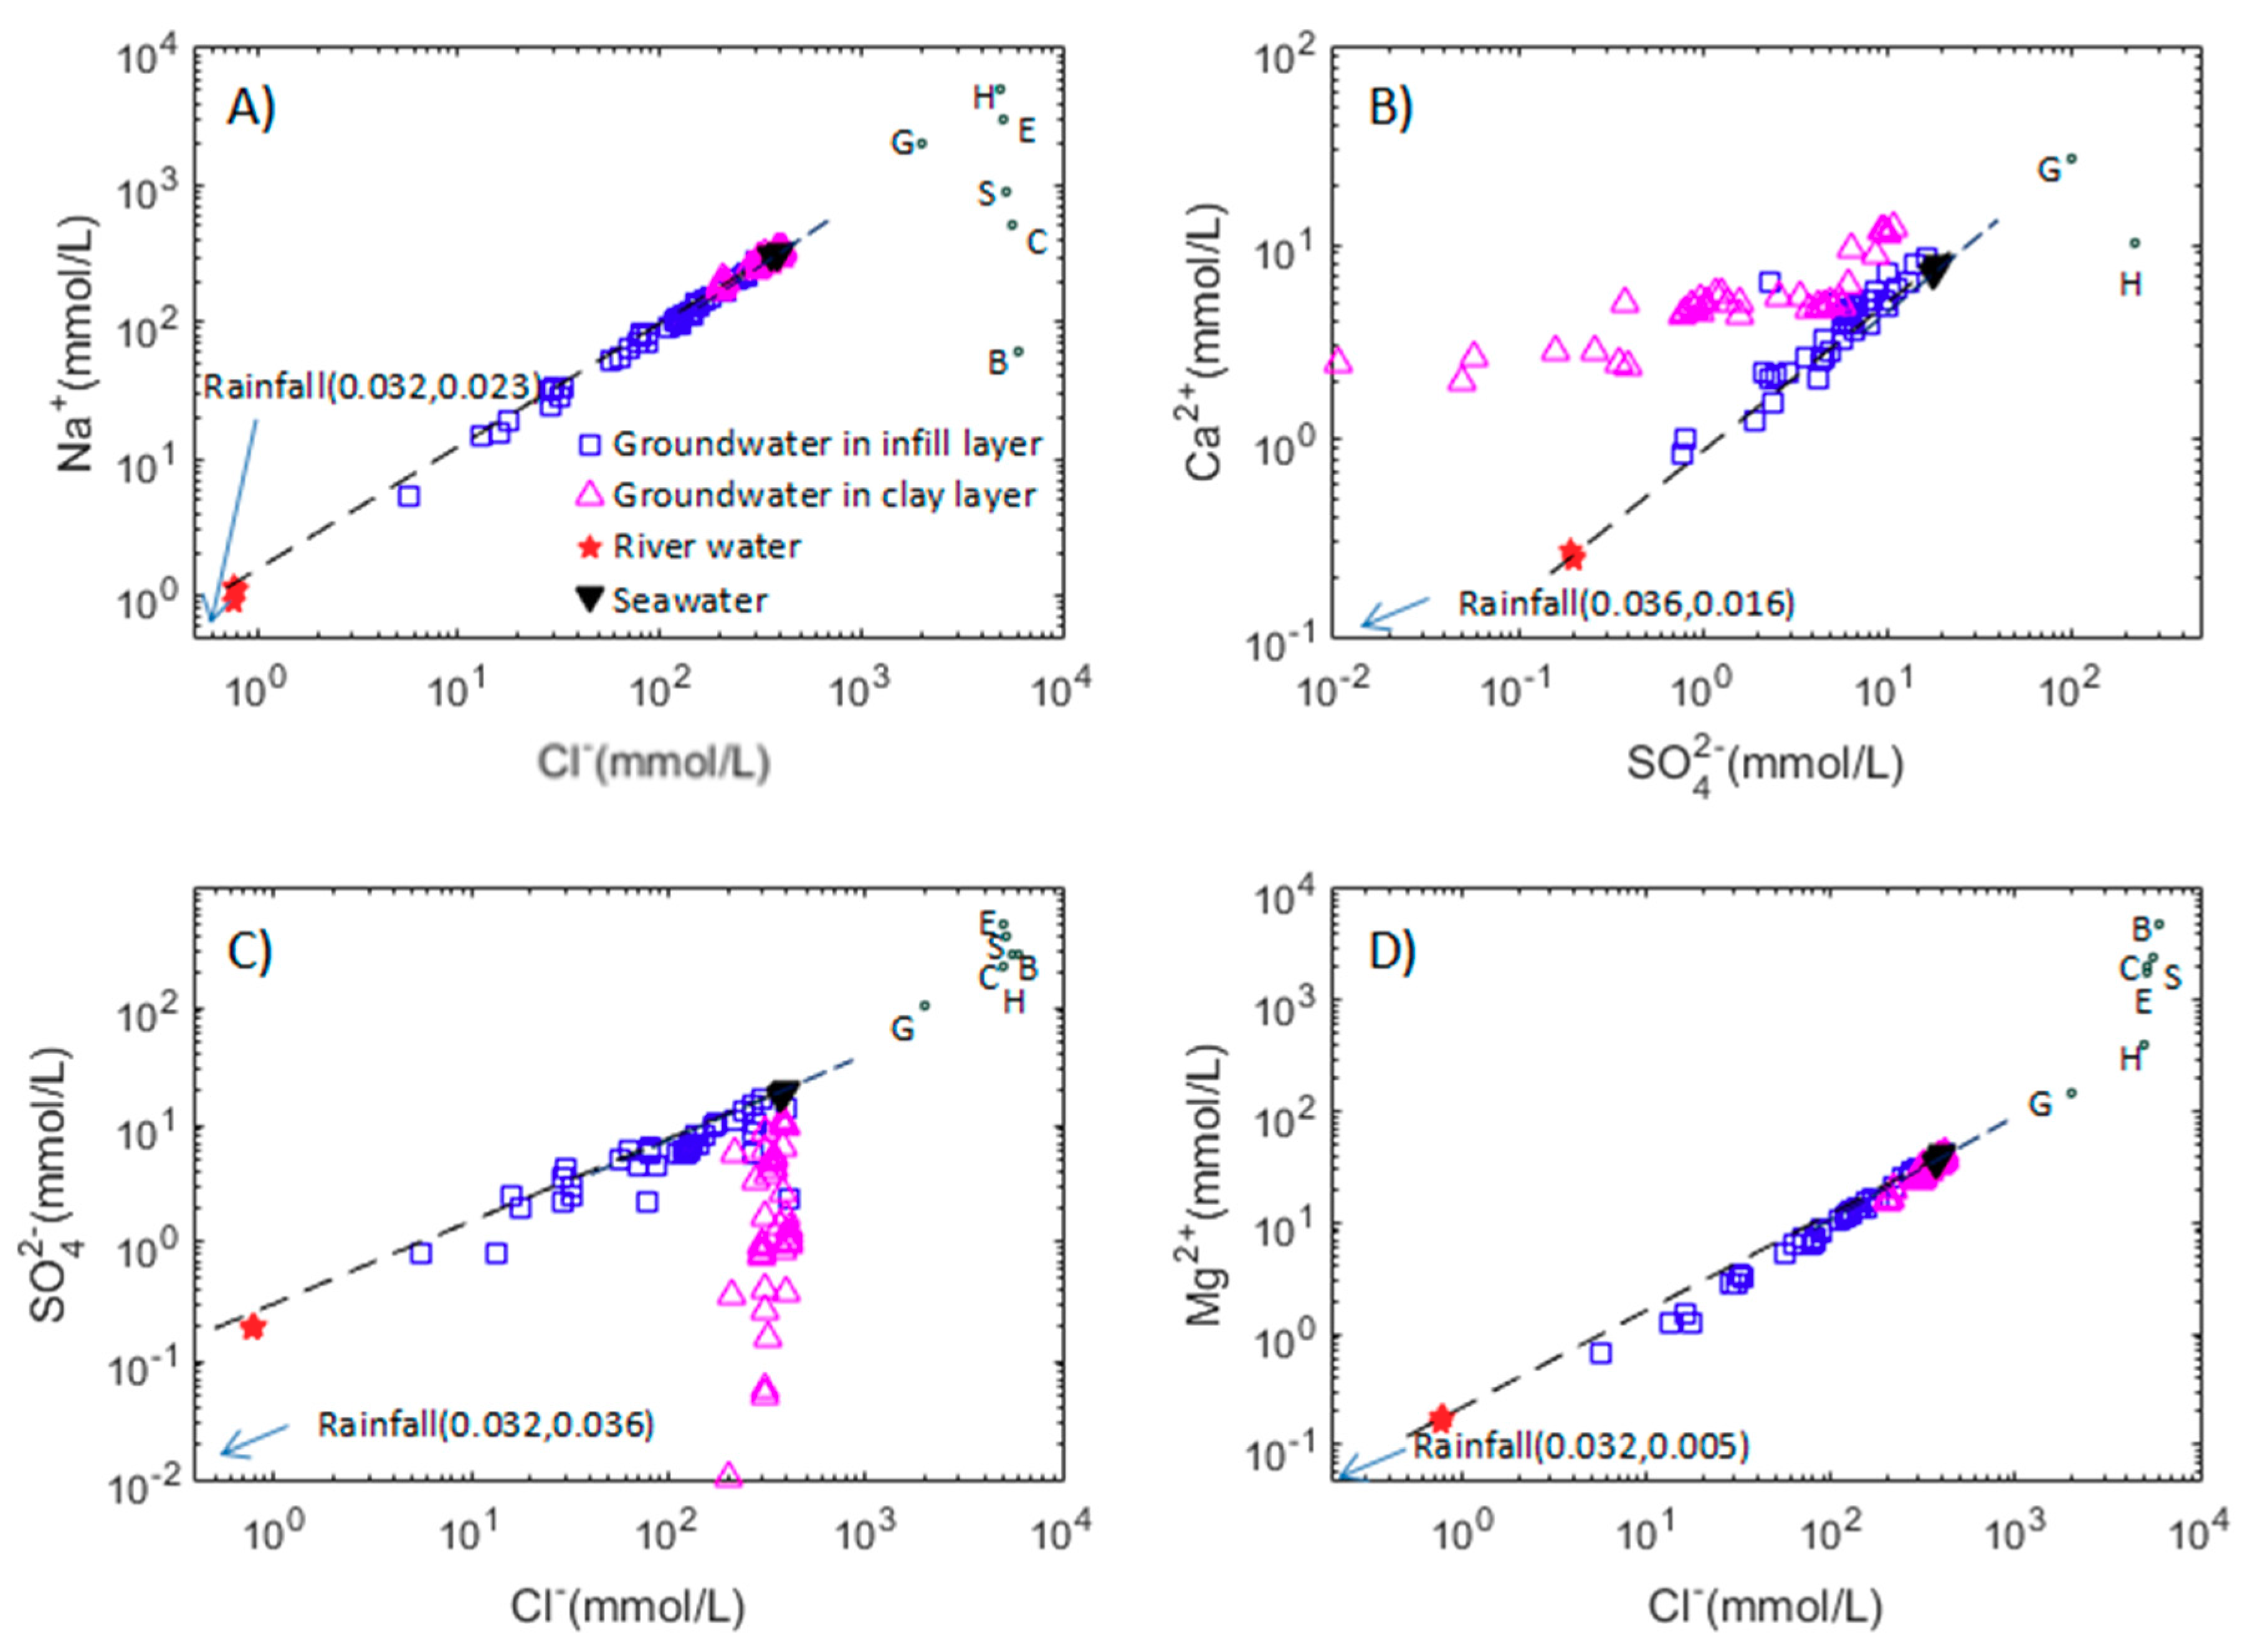
It is possible to separate the contributions of marine (sea-salt aerosols) and terrestrial (dry fall) atmospheric sources in rainwater by assuming that chloride is derived only from sea salt aerosols, and that other major ions are associated with chloride in definite ratios [44]. Chloride is often studied because it is extremely mobile, very soluble and chemically non-reactive [45]. The evolutions of major ions in groundwater were plotted in Figure 4. Towards the coastline, Na and Mg concentrations increased approximately linearly with chloride concentration in infill and clay layer water samples. The Na, K, Mg, and Cl concentrations varied by more than two orders of magnitude across the study site. Water samples in the clay layer had a higher concentration of these elements than those in infill layer. Meanwhile, the elements Na, K and Mg in all samples had the same ratio with respect to chloride as distributed in river water, sea water mixing line. Meanwhile, the Ca, SO4 and Cl concentrations in the infill layer also lay around the mixing line of the seawater and river water. The linear relationships showed relative constant molar ratios between the major ions. The results further illustrated the dominant influence on the variation of Na, K, Mg and Cl concentrations was the dilution of seawater by the freshwater influx, primarily of river water origin on the west.
An obvious lower Ca and SO4 concentrations were observed in the clay layer. It probably reflected precipitation of sulfate minerals such as gypsum and anhydrite, or a mixing of seawater with different sources like deeper groundwater. Cl and SO4 are typically conservative chemically except where redox processes are active within the aquifer. The linear variation between SO4 and Cl in the infill layer indicated perfect mixing between fresh river water (red star) and seawater (black inverted triangle), as shown in Figure 4. Different from the infill layer, the groundwater samples in the clay layer had conservative chloride but depleted SO4 sulfate, implying great impact from redox environment. The sediments in the clay layer had extremely low hydraulic conductivities, resulting in slow and small water exchange rate between seawater and groundwater, and leading to an anoxic condition at the depth of sampling even with tidal effects. In addition, the sediments were rich in organic materials and a variety of microorganisms. Under such conditions, the sulfate-reducing microorganisms can change SO4 into H2S, with the following sulfate removal process:
SO42− + 2C + 2H2O → 2HCO3− + H2S
This reaction was tended to decrease the concentration of SO42− in groundwater and relatively increase HCO3− and dissolved hydrogen sulfide [48]. This could be further confirmed by negative correlation (−0.71) between ions SO4 and HCO3.
3.2.3. Cl/Br Ratios in the Groundwater
Cl and Br are valuable tracers to determine the origin and evolution of groundwater, surface water and contaminant water for their conservative behavior and high solubility in natural water with low-to-moderate salinity [44]. The major reservoir of water, i.e., ocean, has relatively uniform Br and Cl concentrations and their Cl/Brmolar is around 650 [49,50]. The Cl/Br ratio in groundwater can be modified by natural and anthropogenic processes including atmospheric recharge [51], halite dissolution and precipitation, and the addition of Cl-bearing contaminants [41,52]. However, the physical processes occurring in soil/sediment (dilution, evaporation, and transpiration) can only change the absolute concentrations of Br and Cl, but not Br/Cl ratio of groundwater [53].
The Cl and Br concentrations of water samples from the infill layer, clay layer, river water, and seawater are illustrated in Figure 5. It could be seen that Cl/Br ratios in river water were similar to that in seawater. This could be due to the rainfall that had similar Cl/Br ratio as seawater in the coastal area [54]. A general linear relationship between the Br and Cl concentrations for groundwater in the infill layer is observed in Figure 5A. The sample ratios from infill layer were distributed around the seawater–river water mixing line, which further proved the groundwater in this layer was mixed water between seawater and river water. Compared to the seawater ratio line, most groundwater samples in clay layer were slightly enriched with bromide (Figure 5B). In many aspects, the geochemical characteristics of bromine were similar to those of chlorine [55]. However, some factors can still alter variations of Cl/Br ratios [52]. The most significant difference between bromine and chlorine was the difference in natural abundances. Consequently, relatively small changes in the total mass of bromine would significantly increase Cl/Br ratio when the total mass of chlorine remains relatively constant. Meanwhile, the decay and diagenesis of marine organic material tended to release more Br in the sediments since most living materials do not concentrate chlorine but bromine to some extent [56]. This was consistent with observations in clay layer and probably the main reason for higher bromine concentration in groundwater.
3.3. Nitrogen
The ammonia (NH4-N), nitrate (NO3-N), and nitrite (NO2-N) in groundwater samples of both infill and clay layers, as well as their relationship with COD, were inspected and shown in Figure 6. The boreholes were sequenced with an increasing distance to the dike. In natural groundwater, NH4, NO3, and NO2 are the main nitrogen compounds. Nitrate is the most general compound due to its good solubility and difficulty to be absorbed by soil.
In the infill layer, decreasing concentration trend of different nitrogen compounds could be observed. NO3 concentration was the highest in groundwater, followed by NO2 and NH4, which illustrated oxidizing environment for groundwater in the infill layer. Higher NO3 concentrations were as well as found in seawater and river water, which is consistent with the aerobic condition in the surface water body. The nitrogen compound compositions were different in the clay layer. Groundwater samples in the clay layer had an obvious higher percentage of NH4 than that in the infill materials, as shown with blue squares in Figure 6A,B. For example, the averaged values of NH4 were smaller than 5 mg/L in the infill layer samples, but the values were all larger than 10 mg/L in the clay layer samples. The higher concentration of NH4 suggested a reducing environment in the clay layer. The samples in the middle of profile presented high concentration of nitrite and nitrate. As stated above, the study area was a fish farming area and supplied a large amount of seafood to market. The nitrates/nitrites were likely to remain in the water until consumed by plants or other organisms because they do not evaporate [57]. Thus, the nitrate/nitrite contaminations were an important issue in reclaimed land.
Meanwhile, the nitrogen compositions were related to the COD concentrations in water samples. The COD can be used as an index of the organic matter concentration in water. As shown in Figure 6C, the COD was higher in clay layer and over twice amount of that in infill layer in coupled boreholes. COD was very important as it is found positively correlated to ammonia and negatively correlated with nitrate and nitrite. For example, the water samples in boreholes SW21 and SW22 had averaged values of 1.5 mg/L for COD, an indicator of anoxic condition. The ammonia usually cannot be nitrified in the environment that is deficient in oxygen. Conversely, the enrichment of oxygen was the reason that SW13 and SW14 had higher concentrations of nitrate and nitrite during monitoring period as well. The nitrogen compositions in river samples were highly consistent with samples in infill layer next to the river.
3.4. Heavy Metal
3.4.1. Fe and Mn
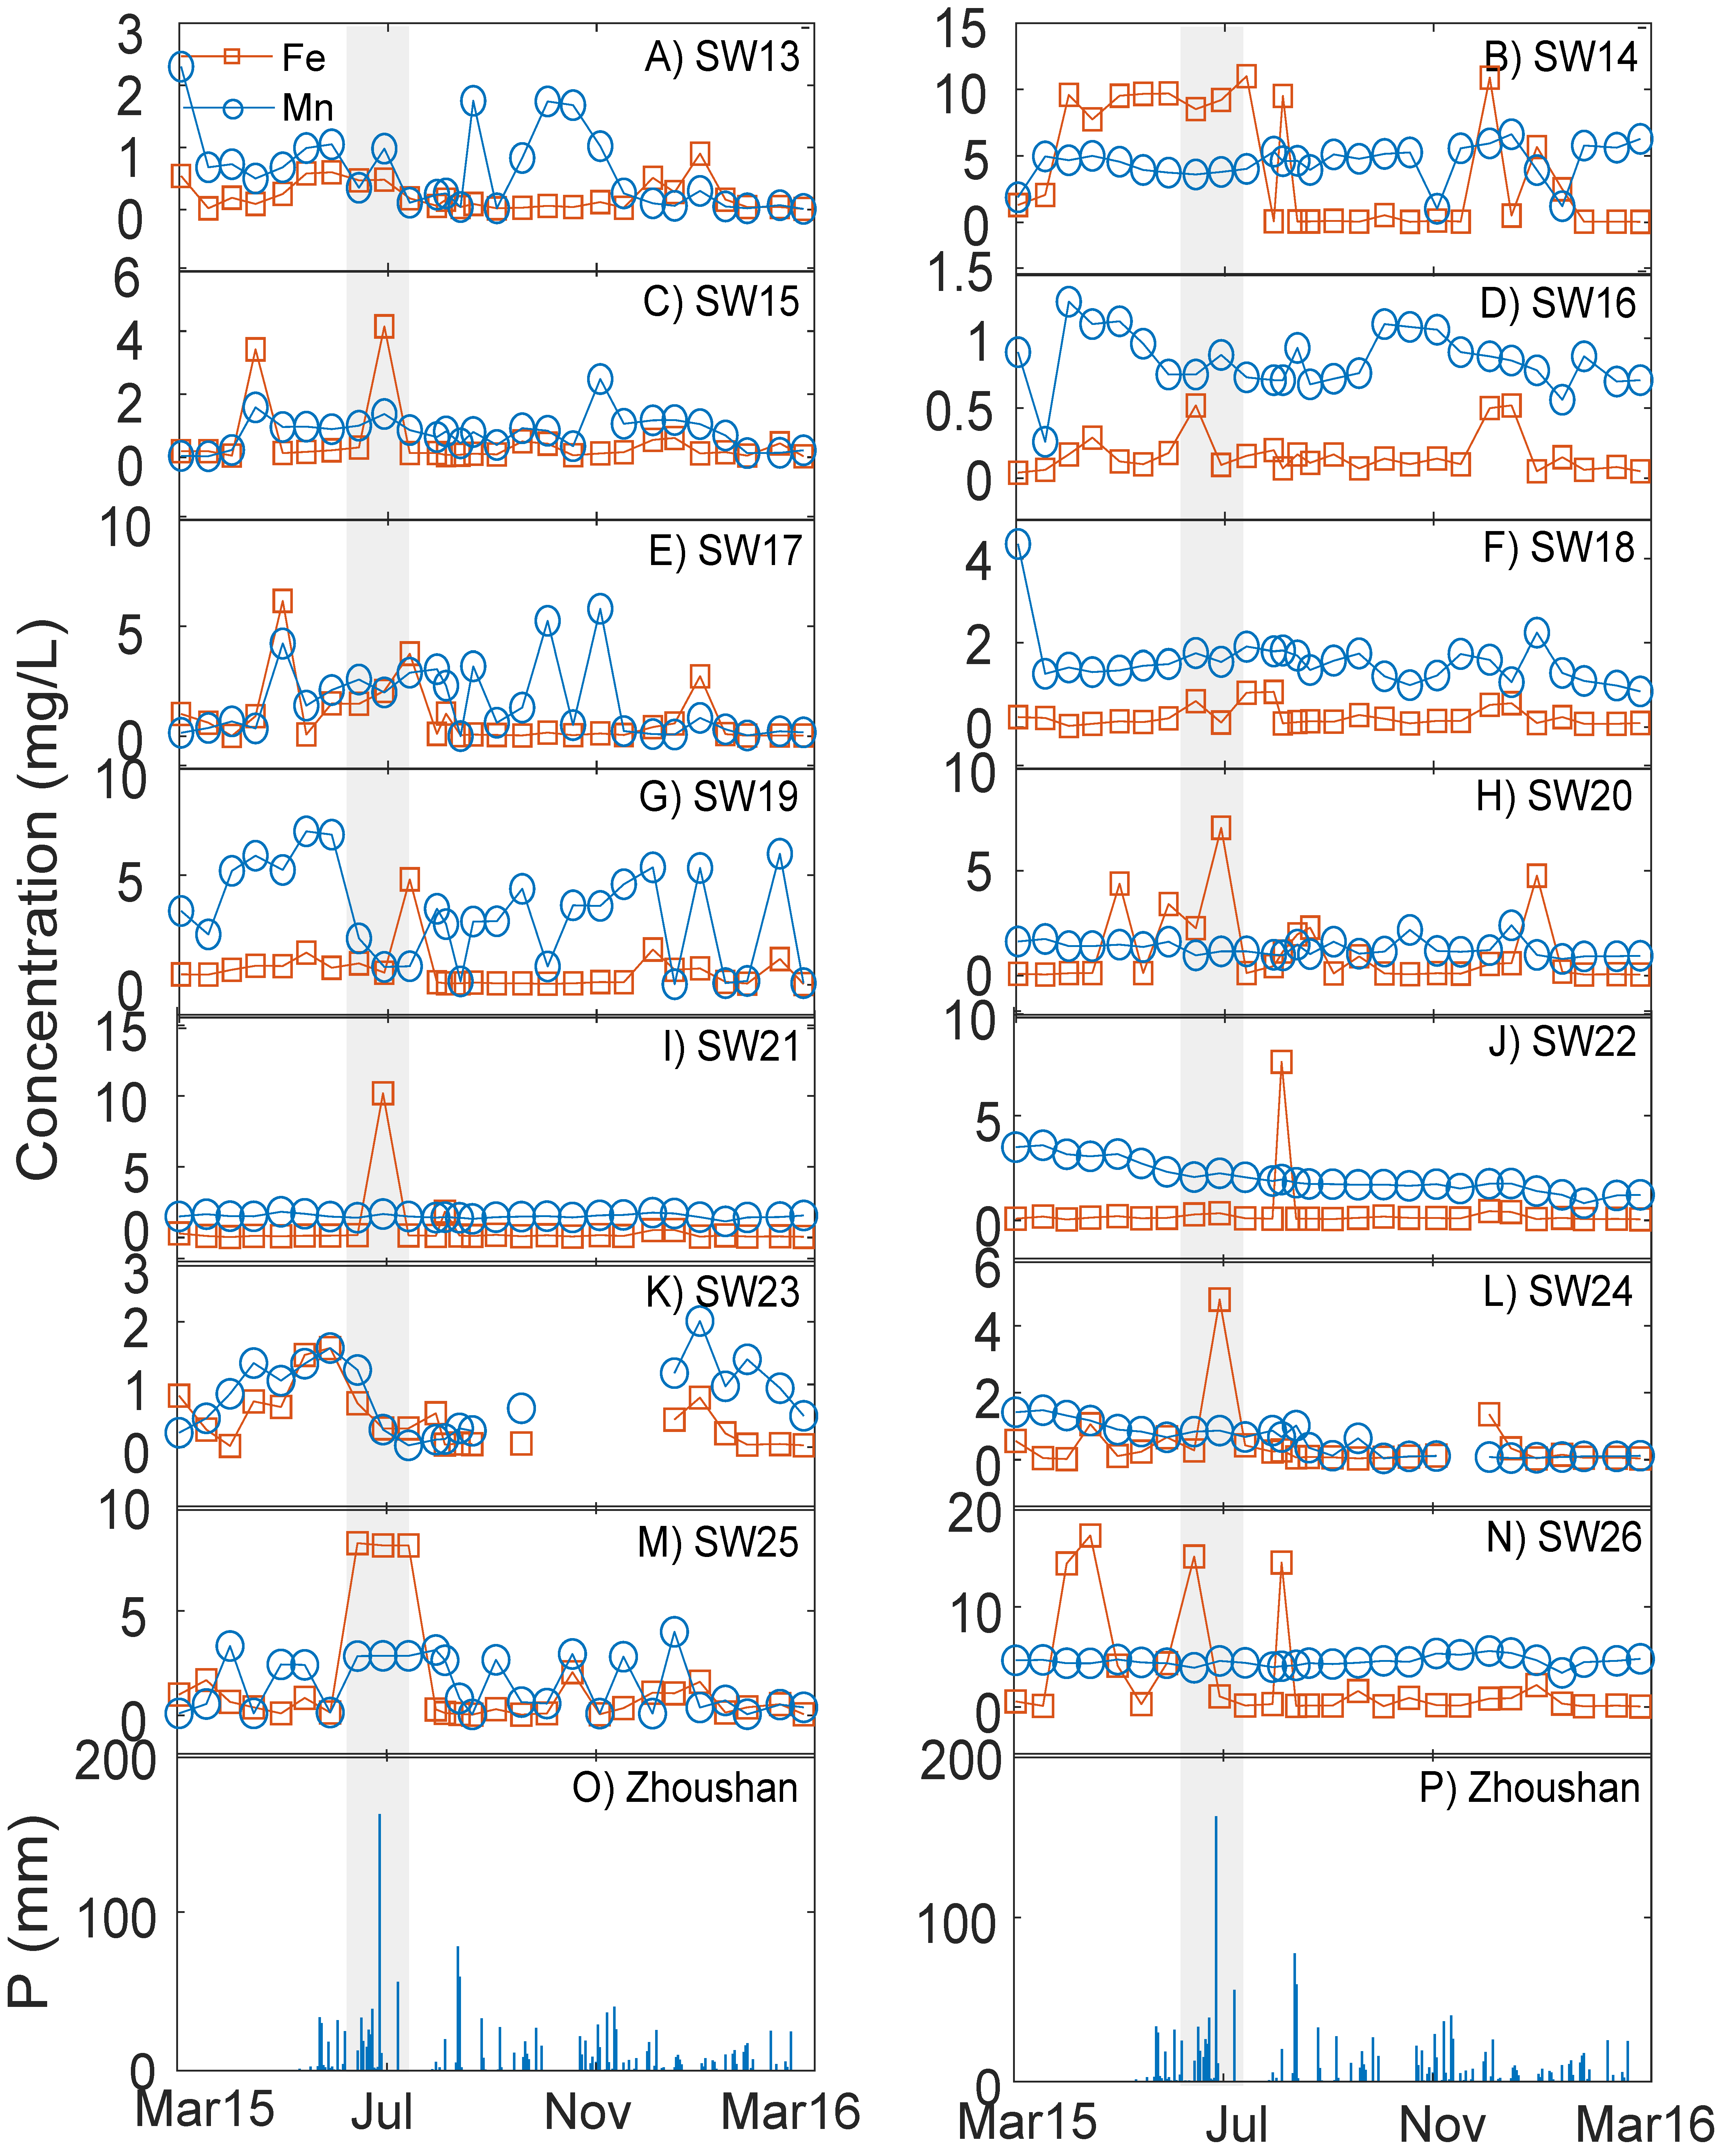
Iron (Fe) and Manganese (Mn) are metals that occur naturally in soils, rocks, minerals, and groundwater. In the aquifer, groundwater was in direct contact with these solid materials, dissolving them, releasing their constituents, including Fe (Fe-II and Fe-III) and Mn (Mn-II and Mn-IV), to the water. The concentrations of Fe-III and Mn are illustrated in Figure 7. The concentrations of Mn in most samples were higher than Fe-III, which was presented under conditions with precipitation less than 50 mm/day. This is because manganese has a weaker chemical affinity for oxygen than iron, and the dissolved Mn stability region is wider. Therefore, Mn was more likely to migrate and enrich in groundwater than Fe-III [58]. Meanwhile, the observed concentrations can be used as local reference background values for Fe and Mn in groundwater.
The amounts of Fe-III and Mn in groundwater varied temporally for a given well. Usually, this was associated with an influx of water during precipitation. During a precipitation event, Fe-III concentrations increased and dropped dramatically. The high concentrations reached 17 mg/L and 7 mg/L for Fe and Mn, respectively. The reasons were that the recharge freshwater enhanced oxygen content in groundwater. Fe-II was then quickly oxidized to Fe-III, and in turn combined with oxygen in the water and precipitated as insoluble hydroxide deposits. Different from Fe-III, concentration variation of Mn was not as sensitive to precipitation. In general, if the groundwater was short of oxygen, Fe (and Mn) dissolved more readily, particularly if the pH of the water was slightly acidic. However, dissolved oxygen content is typically low in deep aquifers, particularly if the aquifer contains organic matter. Decomposition of the organic matter depletes the oxygen in the water and the Fe dissolves as Fe-II. Under these conditions, the dissolved iron is often accompanied by dissolved manganese or hydrogen sulfide. In transitional and reduction environment, Mn exists mainly in the form of bivalent, and releases into groundwater. Moreover, clay or mild clay distributed in the delta plain and low-lying overlaying layer, contain rich organic matter, which made anaerobic reaction occur in reduction environment and generated H2S and CO2, prompted Mn4+ reducing into Mn2+.
3.4.2. As, Cd, Cr, Cu, Pb, Zn and Hg
Since the sediments could act as a pool for heavy metals and a potential source to the surrounded water body, metal concentrations in sediment and groundwater were measured and analyzed to evaluate the potential risk of reclamation to coastal environment. The concentrations in marine sediment (sites D in Figure 1), of seven heavy metals toxic to human health (As, Cd, Cr, Cu, Pb, Zn and Hg) are summarized in Table 5. The standard made by United States Environmental Protection Agency (EPA) [59] was often used to evaluate heavy metal pollution in reclamation land, but it is mainly for evaluating freshwater sediment quality and should not be used to assess the quality of coastal marine sediment [10]. Generally, marine sediment was widely believed to have higher metal concentrations since it acted as a filter for many metals passing from terrestrial to the marine setting and to accumulate some metals within marine water bodies [60,61,62]. Based on the marine sediment standard in China GB18668-2002 (AQSIQ), the As, Cu and Pb concentrations in ZSI coastal area were classified as unpolluted class I sediments. The Cd and Cr concentrations were relatively higher over class II standard. The concentrations of Zn and Hg were times higher in site D24 and D37, which indicate a potential pollution source of the two heavy metals that transported from island. Compared to the marine sediments, the average concentrations As, Cu and Zn were increased in clay layer samples and that of Cd, Cr and Hg were decreased (Table 6). The heavy metal concentrations in marine sediments often have varied profile with depth [63]. Since the sediments in clay layer were not all collected from surface, the vertical variation might be one reason for the difference. Meanwhile, the deposit rates of heavy metals are changed in the path from land to sea, which could result in concentration variation in different sites [64]. In addition, fine sediments adsorb heavy metals from water and have a significant capacity to retain heavy metals, thus the fine sediment percentage could contribute to heavy metal enrichment characteristics [65].
However, since heavy metals tend to be adsorbed by clay particles with a high concentration in sedimentary phase [66], if heavy metal released from sediment to groundwater after the water environment (such as pH and salinity) was changed, it could raise serious groundwater contamination [67,68]. To further evaluate heavy metal enrichment in groundwater after reclamation, a total of 59 water samples from 14 wells from March 2015 to March 2016 were analyzed and summarized in Figure 8.
The results in Figure 8 demonstrated heavy metal contents were quite similar in infill and clay layers. The shaded bars represent detection limit values for As, Cd, Cr, Cu, Pb, Zn and Hg, which were 0.004, 0.001, 0.01, 0.005, 0.001, 0.01 and 0.0001 mg/L, respectively. The sample values beyond the detection line were plotted above the bar labeled with the borehole numbers. As shown in plot, the absolute magnitudes of heavy metals followed the pattern: Zn > Cr > Cu > As > Cd = Pb > Hg. Most samples were located within the detecting line and smaller than the class II criteria in quality standard for groundwater in China [69]. The class II values represent natural chemical background in groundwater. Therefore, no severe heavy metals releasing in reclamation region were detected in the first two years after reclamation. These values could be treated as groundwater background values in this region. The only metal that was over safety groundwater limit was As, which was detected in SW22 (September 2015). Thus, attention should be paid to As contamination in groundwater management.
3.5. Column Experiment and Simulation
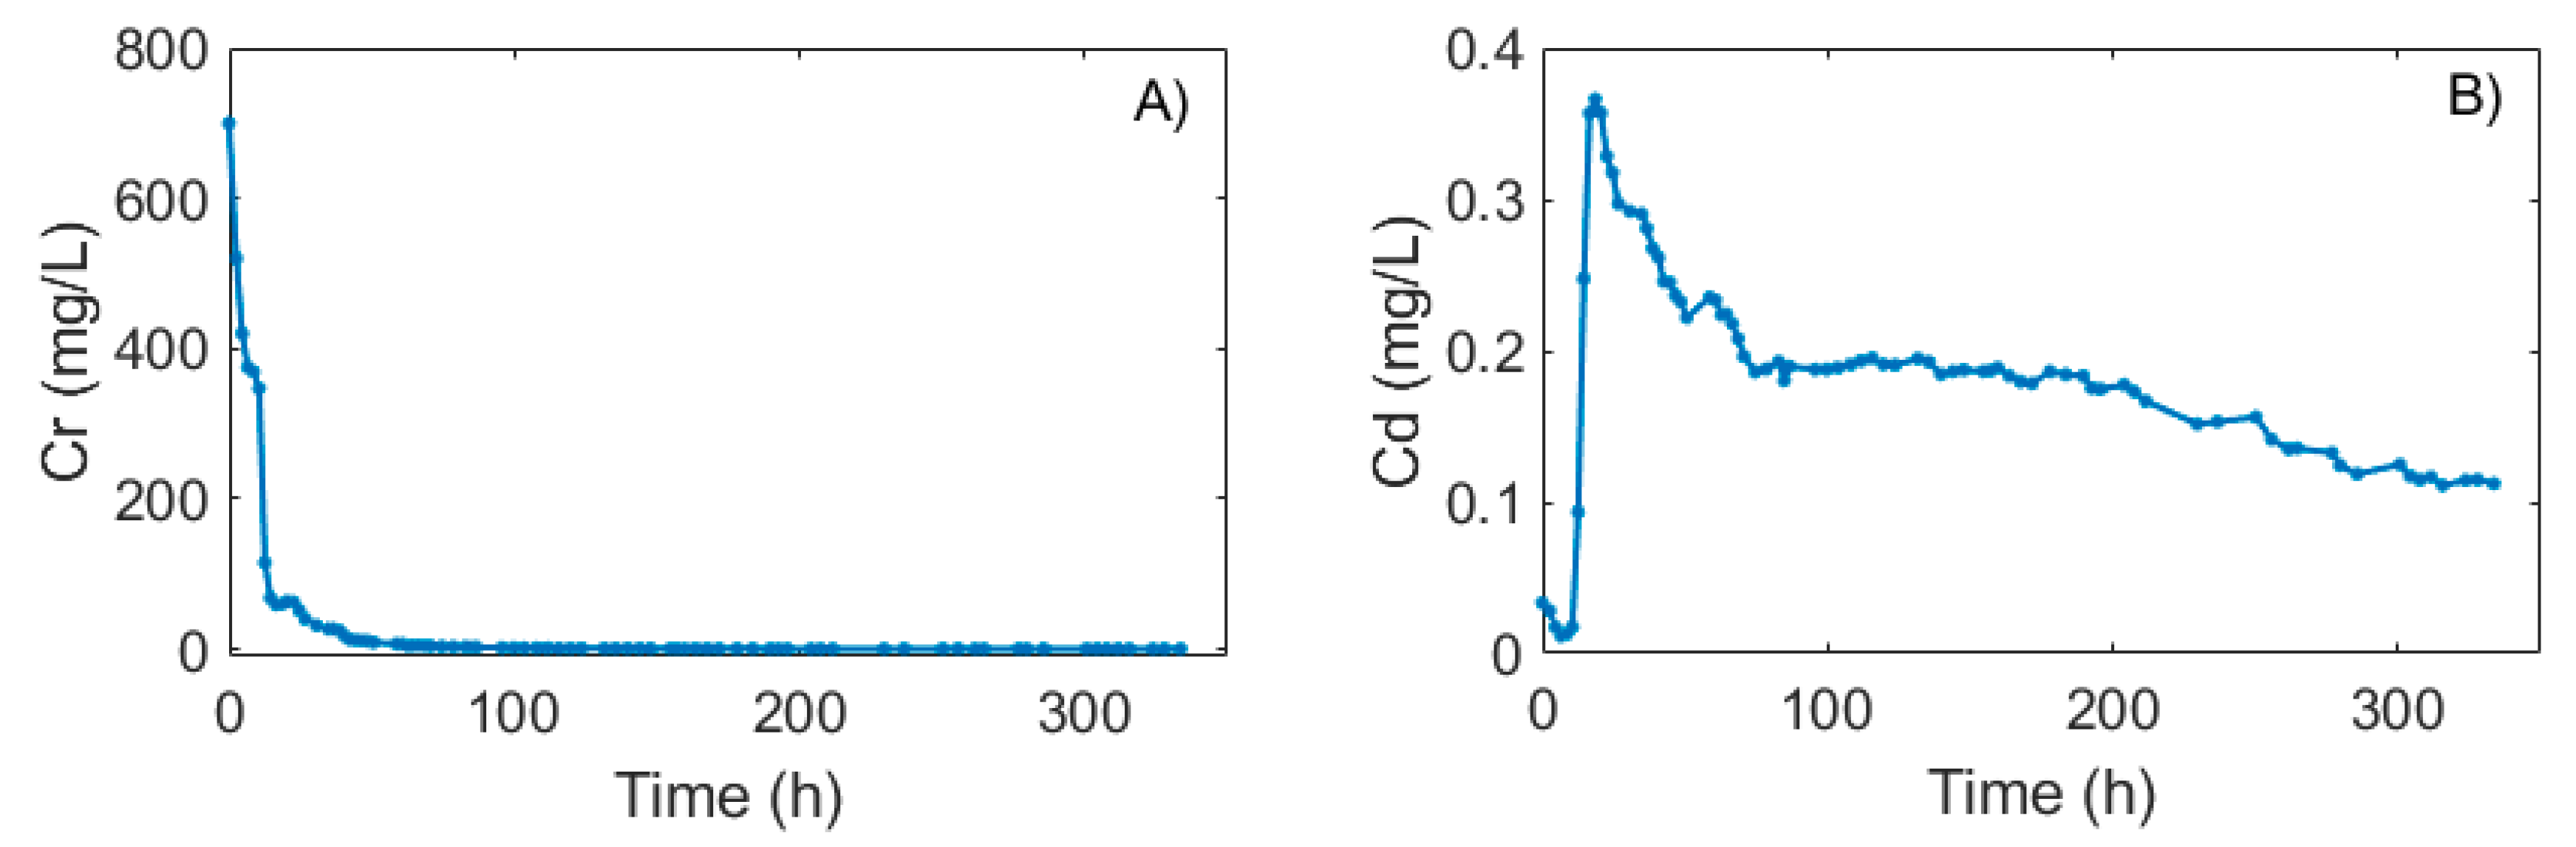
As illustrated in Table 5, the Cr and Cd concentrations were higher and above the class II or III sediment standard for marine sediment GB 18668-2002 [70]. The Cr was higher for sediment in clay layer. To further investigate the potential hazard of heavy metals with relatively higher concentrations in reclamation area, column experiments were conducted with the polluted Cr and Cd soils. The graphs for desorption of Cr and Cd with sediments from SW21 were plotted in Figure 9. The desorption processes of both Cr and Cd from sediments in infill material could be classified into two distinct phases; a fast desorption and a relatively slower desorption. The breakthrough curve of Cr indicated the effluent concentration dropped to 80 mg/L quickly within the first 20 h and gradually converged toward their influent levels 0.14 mg/L. The rapidly releasing of Cr illustrated large amount of Cr was loosely held on the soil surface. After a preliminary analysis, the reasons were as follows: (1) the concentration in laboratory saturated sediments were far beyond the adsorption capacity of the soil for Cr, resulting in fast initial flow of liquid with high concentration; and (2) the adsorption process of Cr was greatly affected by cation exchange, where Cr was displaced away by high concentrations of Na and Mg in leaching solution.
The concentration of Cd in the leaching solution had three phases: a fast increase in the initial 20 h, followed by fast desorption in later 80 h, and then slower desorption. The concentration of Cd effluent was quite low and gradually decreased to 0.11 mg/L, indicating that a large amount of Cd was adsorbed in the soil. Initial faster desorption of the heavy metals from soil indicated the release of these metals was from the water-soluble fraction and also from the adsorption sites of lower bonding energy (exchangeable fraction). Slower desorption of metals indicates the release of metals was from sites with relatively higher bonding energy than the exchangeable form and other chemical pools in dynamic equilibrium with the exchangeable form. Krishnamurti et al. also had been noticed the similar involvement of sites with different reactivity for Cd desorption from soils [71]. Considering the absolute desorbed concentrations of different heavy metals, the quick desorption was higher for Cr, and several orders lower for Cd. Among heavy metals, the higher desorption percentage of Cd from soil that receiving organic or inorganic sources indicated potential danger of Cd pollution to groundwater.
The Cr and Cd concentrations in column sediments after experiment were examined as shown in Table 7. The contaminant concentrations were higher in the upper layer and lower in the bottom. When the Cr or Cd concentrations gradually increased in the flowing water, the desorption amount of contaminants in the soil became smaller. Thus, more contaminants in soil were released in the bottom and increased in the water flow pathway to the top. On average, the Cr concentration had dropped to 94.2 mg/kg from 428 mg/kg. Seventy-seven percent of the total Cr amount had been released into water, which indicated a high desorption ability. For the Cd, the concentration decreased to 11.5 mg/kg from 15.2 mg/kg, i.e., 25% was released in the experiment. Referencing to the high concentration of Cr that had been examined in sediment samples, as shown in Table 6, the Cr contamination in groundwater is a serious potential risk in the study area.
The kinetic models were used for qualitative analysis of data sets. There were multiple models that can fit the same set of kinetic data [72]; therefore, we intended to investigate the efficiency of these models in simulating Cd and Cr releasing and pointed out their differences. Table 8 shows the fitting indicators of the three equations applied for analyzing the experimental data. In general, based on R-square and SE, three models gave better simulation results of Cd than Cr. The three R-square values which describe the fitting between model and Cd data were over 0.90. Among the three models, the two-constant model was successful in describing the kinetics of both Cr and Cd releasing processes from the filled material. Two-constant rate equation plotted adsorbate concentrations lnqt with lnt for Cd and Cr in filled sediments. The linear relationships indicated that desorption processes were diffusion controlled [73]. Elovich equation parameters were meanwhile determined from the slope and intercept of the linear plots between “q” and “lnt” and the results were worst among three models. Therefore, the Elovich equation appeared to be unsuccessful in describing the kinetics of Cr and Cd desorption, especially for Cr in the study site. The pseudo second order model was also useful in describing the kinetics of Cr and Cd release from the studied sediment, but not as good as the two-constant rate model. The results are useful to model the releasing of Cr and Cd when newly related contaminants input in the reclaimed area.
4. Conclusions
The regional hydrogeochemical and associated heavy metal pollution in groundwater shortly after reclamation were evaluated in ZSI. The groundwater in the study area was dominated by Na-Cl facies with clear seawater origin. The temporal variations of chemicals in groundwater were inactive due to the low permeability, gentle slope, and sluggish drainage conditions. The groundwater was flushed with fresher water from the inland boundary but the rate is quite low. Meanwhile, the heavy metals were enriched in marine sediment and clay layer, but much lower in groundwater. The lower heavy metal concentrations in groundwater were mainly because the chemical composition of groundwater and seawater were similar, therefore leading to stable contact of groundwater with the subsurface material. The current metal content in groundwater could be used as background values in the future. The variation of Fe and Mn concentrations were highly correlated to rainfall. With the freshwater recharge from river and precipitation, the groundwater chemicals of Na and Cl could be slowly reduced as observed in the infill layer borehole SW13 and lead to raised releasing rate of heavy metals. In that case, Cd and Cr would be two toxic metals that need attention for their high concentrations and large adsorption rates. The paper supplied a reference for groundwater quality research in the coastal reclaimed area. In addition, long-term monitoring would also be necessary to guarantee a safe coastal environment.
Acknowledgments
This work was supported by The National Key Research and Development Program of China (No.2016YFC0402805), Geological Survey Fund of Zhejiang Province and Zhoushan City Department of Finance (GZH201200506), National Natural Science Foundation of China (41702244) and China Postdoctoral Science Foundation (2015M582479). Thanks for the contribution of Peng Zhang and Ang Li for the preparation of Figure 1 and Figure 2. Special thanks to the reviewers for their thoughtful minds and constructive suggestions.
Author Contributions
The paper were written by Xiaoying Zhang; The data were analyzed and figures were prepared by Xiaoying Zhang; The literature review were conducted by Peng Wang and Bill X. Hu; The monitoring borehole design and data collection were conducted by Lei Yang and Junbing Chen; The laboratory experiments were performed by Xiaowei Zhang and Kai Xiao.
Conflicts of Interest
The authors declare no conflict of interest.
References
- Montenegro, L.O. Environmental Trade-Offs from Coastal Reclamation: The Case of Cebu, Philippines. In Marine and Coastal Ecosystem Valuation, Institutions, and Policy in Southeast Asia; Springer: Singapore, 2016; pp. 225–238. [Google Scholar]
- Tian, B.; Wu, W.; Yang, Z.; Zhou, Y. Drivers, trends, and potential impacts of long-term coastal reclamation in China from 1985 to 2010. Estuar. Coast. Shelf Sci. 2016, 170, 83–90. [Google Scholar] [CrossRef]
- Goh, B.P.L.; Chou, L.M. Heavy metal levels in marine sediments of Singapore. Environ. Monit. Assess. 1997, 44, 67–80. [Google Scholar] [CrossRef]
- Jickells, T.D.; Andrews, J.E.; Parkes, D.J. Direct and indirect effects of estuarine reclamation on nutrient and metal fluxes in the global coastal zone. Aquat. Geochem. 2016, 22, 337–348. [Google Scholar] [CrossRef]
- Kim, R.; Kim, J.; Ryu, J.; Chang, H.W. Salinization properties of a shallow groundwater in a coastal reclaimed area, Yeonggwang, Korea. Environ. Geol. 2006, 49, 1180–1194. [Google Scholar] [CrossRef]
- Jiao, J.J.; Wang, X.; Nandy, S. Preliminary assessment of the impacts of deep foundations and land reclamation on groundwater flow in a coastal area in Hong Kong, China. Hydrogeol. J. 2006, 14, 100–114. [Google Scholar] [CrossRef]
- Duan, H.; Zhang, H.; Huang, Q.; Zhang, Y.; Hu, M.; Niu, Y.; Zhu, J. Characterization and environmental impact analysis of sea land reclamation activities in China. Ocean Coast. Manag. 2016, 130, 128–137. [Google Scholar] [CrossRef]
- SOA (State Oceanic Administration, People’s Republic of China). Bulletin of China’s Marine Environment Status in 2015; SOA: Beijing, China, 2015. [Google Scholar]
- Wang, W.; Liu, H.; Li, Y.; Su, J. Development and management of land reclamation in China. Ocean Coast. Manag. 2014, 102, 415–425. [Google Scholar] [CrossRef]
- Chen, K.P.; Jiao, J.J. Metal concentrations and mobility in marine sediment and groundwater in coastal reclamation areas: A case study in Shenzhen. China Environ. Pollut. 2008, 151, 576–584. [Google Scholar] [CrossRef] [PubMed]
- Suzuki, T. Economic and geographic backgrounds of land reclamation in Japanese. Mar. Pollut. Bull. 2003, 47, 226–229. [Google Scholar] [CrossRef]
- Bao, K.; Shen, J.; Sapkota, A. High-resolution enrichment of trace metals in a west coastal wetland of the southern Yellow Sea over the last 150 years. J. Geochem. Explor. 2017, 176, 136–145. [Google Scholar] [CrossRef]
- Barbier, E.B.; Koch, E.W.; Silliman, B.R.; Hacker, S.D.; Wolanski, E.; Primavera, J.; Granek, E.F.; Polasky, S.; Aswani, S.; Cramer, L.A.; et al. Coastal ecosystem-based management with nonlinear ecological functions and values. Science 2008, 319, 321–323. [Google Scholar] [CrossRef] [PubMed]
- Kalnay, E.; Cai, M. Impact of urbanization and land-use change on climate. Nature 2003, 423, 528–531. [Google Scholar] [CrossRef] [PubMed]
- McKinney, M.L. Effects of urbanization on species richness: A review of plants and animals. Urban Ecosyst. 2008, 11, 161–176. [Google Scholar] [CrossRef]
- POC (Pew Oceans Commission). America’s Living Oceans: Charting a Course for Sea Change; A Report to the Nation—Recommendations for a New Ocean Policy; POC: Arlington, VA, USA, 2003. [Google Scholar]
- U.S. Commission on Ocean Policy. (USCOP). Preliminary Report of the U.S. Commission on Ocean Policy; Governor’s Draft; USCOP: Washington, DC, USA, 2004. [Google Scholar]
- Boruvka, L.; Kozak, J. Geostatistical investigation of a reclaimed dumpsite soil with emphasis on aluminum. Soil Tillage Res. 2001, 59, 115–126. [Google Scholar] [CrossRef]
- Huang, J.; Huang, R.; Jiao, J.J.; Chen, K. Speciation and mobility of heavy metals in mud in coastal reclamation areas in Shenzhen, China. Environ. Geol. 2007, 53, 221–228. [Google Scholar] [CrossRef]
- Yang, J.; Pei, Y.; Tian, L.; Yuan, H. The influence of land reclamation in Tianjin Binhai new area on the environment of shallow groundwater in coastal low land. Geol. Bull. China 2016, 35, 1653–1660, (In Chinese with English Abstract). [Google Scholar]
- Hosono, T.; Su, C.C.; Okamura, K.; Taniguchi, M. Historical record of heavy metal pollution deduced by lead isotope ratios in core sediments from the Osaka Bay, Japan. J. Geochem. Explor. 2010, 107, 1–8. [Google Scholar] [CrossRef]
- Albanese, S.; De Vivo, B.; Lima, A.; Cicchella, D.; Civitillo, D.; Cosenza, A. Geochemical baselines and risk assessment of the Bagnoli brownfield site coastal sea sediments (Naples, Italy). J. Geochem. Explor. 2010, 105, 19–33. [Google Scholar] [CrossRef]
- Huang, Z.; Pan, X.D.; Wu, P.G.; Han, J.L.; Chen, Q. Health risk assessment of heavy metals in rice to the population in Zhejiang, China. PLoS ONE 2013, 8, e75007. [Google Scholar] [CrossRef] [PubMed]
- Pan, X.D.; Wu, P.G.; Jiang, X. Levels and potential health risk of heavy metals in marketed vegetables in Zhejiang, China. Sci. Rep. 2016, 6, 20317. [Google Scholar] [CrossRef] [PubMed]
- Ohta, A.; Imai, N.; Tachibana, Y.; Ikehara, K. Statistical Analysis of the Spatial Distribution of Multi-Elements in an Island Arc Region: Complicating Factors and Transfer by Water Currents. Water 2017, 9, 37. [Google Scholar] [CrossRef]
- Bi, X.; Liu, F.; Pan, X. Coastal projects in China: From reclamation to restoration. Environ. Sci. Technol. 2012, 46, 4691–4692. [Google Scholar] [CrossRef] [PubMed]
- Lu, P.; Zhang, Z.; Feng, G.; Huang, M.; Shi, X. Experimental Study on the Potential Use of Bundled Crop Straws as Subsurface Drainage Material in the Newly Reclaimed Coastal Land in Eastern China. Water 2018, 10, 31. [Google Scholar] [CrossRef]
- Hiscock, K.M. Hydrogeology: Principles and Practice; Blackwell Publishing: Malden, MA, USA, 2005. [Google Scholar]
- Xu, C.; Yu, Y. Review: Enclose tideland development in Zhejiang province. Zhejiang Hydrotechnol. 2003, 1, 8–10. [Google Scholar]
- Lin, F. The Public Climate Report of Zhoushan in May, 2015; Zhoushan Meteorological Administration: Zhejiang, China, 2016. [Google Scholar]
- Ho, Y.S.; McKay, G. Pseudo-Second Order Model for Sorption Processes. Process Biochem. 1999, 34, 451–465. [Google Scholar] [CrossRef]
- Chien, S.H.; Clayton, W.R. Application of Elovich Equation to the Kinetics of Phosphate Release and Sorption in Soils. Soil Sci. Soc. Am. J. 1980, 44, 265–268. [Google Scholar] [CrossRef]
- Elkhatib, E.A.; Hern, J.L. Kinetics of phosphorus desorption from Appalachian soils. Soil Sci. 1988, 145, 222–229. [Google Scholar] [CrossRef]
- Kuo, S.; Lotse, E.G. Kinetics of phosphate adsorption and desorption by hematite and gibbsite1. Soil Sci. 1973, 116, 400–406. [Google Scholar] [CrossRef]
- Khan, T.A.; Chaudhry, S.A.; Ali, I. Equilibrium uptake, isotherm and kinetic studies of Cd (II) adsorption onto iron oxide activated red mud from aqueous solution. J. Mol. Liq. 2015, 202, 165–175. [Google Scholar] [CrossRef]
- Kandpal, G.; Srivastava, P.C.; Ram, B. Kinetics of desorption of heavy metals from polluted soils: Influence of soil type and metal source. Water Air Soil Pollut. 2005, 161, 353–363. [Google Scholar] [CrossRef]
- Rahman, M.; Sathasivam, K.V. Heavy metal adsorption onto Kappaphycus sp. from aqueous solutions: The use of error functions for validation of isotherm and kinetics models. BioMed Res. Int. 2015, 2015, 126298. [Google Scholar] [CrossRef] [PubMed]
- Reyhanitabar, A.; Karimian, N. Kinetics of copper desorption of selected calcareous soils from Iran. Am Eur. J. Agric. Environ. Sci. 2008, 4, 287–293. [Google Scholar]
- Dang, Y.P.; Dalal, R.C.; Edwards, D.G.; Tiller, K.G. Kinetics of Zinc desorption from vertisols. Soil Sci. Soc. Am. J. 1994, 58, 1392–1399. [Google Scholar] [CrossRef]
- Winslow, A.G.; Kister, L.R. Saline-Water Resources of Texas (No. 1365); US Government Printing Office: Washington, DC, USA, 1956. [Google Scholar]
- Cartwright, I.; Weaver, T.R.; Fifield, L.K. Cl/Br ratios and environmental isotopes as indicators of recharge variability and groundwater flow: An example from the southeast Murray Basin, Australia. Chem. Geol. 2006, 231, 38–56. [Google Scholar] [CrossRef]
- Alcalá, F.J.; Custodio, E. Using the Cl/Br ratio as a tracer to identify the origin of salinity in aquifers in Spain and Portugal. J. Hydrol. 2008, 359, 189–207. [Google Scholar] [CrossRef]
- Piper, A.M. A graphic procedure in the geochemical interpretation of water-analyses. Eos Trans. Am. Geophys. Union 1944, 25, 914–928. [Google Scholar] [CrossRef]
- Freeman, J.T. The use of bromide and chloride mass ratios to differentiate salt-dissolution and formation brines in shallow groundwaters of the Western Canadian Sedimentary Basin. Hydrogeol. J. 2007, 15, 1377–1385. [Google Scholar] [CrossRef]
- Berner, E.K.; Berner, R.A. Global Water Cycle: Geochemistry and Environment; Prentice-Hall, Inc.: Englewood Cliffs, NJ, USA, 1987; p. 397. [Google Scholar]
- Lin, Y.; Liu, S.; Lei, J.; Zhang, G.; Mao, X.; Zhang, J. Characteristic Analysis on the Anions and pH Profiles of Rainwater of Zhoushan Archipelago. Environ. Sci. 2005, 26, 49–54. (In Chinese) [Google Scholar]
- Lin, Y.; Liu, S.; Lei, J.; Bi, Y.; Zhang, J. Linear discriminate analysis on annual and seasonal characteristics of major cations’ profiles of rainwater at Zhoushan rain-sampling spot. Environ. Sci. 2006, 27, 1992–1997. (In Chinese) [Google Scholar]
- Muyzer, G.; Stams, A.J. The ecology and biotechnology of sulphate-reducing bacteria. Nat. Rev. Microbiol. 2008, 6, 441–454. [Google Scholar] [CrossRef] [PubMed]
- Siemann, M.G. Extensive and rapid changes in seawater chemistry during the Phanerozoic: Evidence from Br contents in basal halite. Terra Nova 2003, 15, 243–248. [Google Scholar] [CrossRef]
- Leybourne, M.I.; Goodfellow, W.D. Br/Cl ratios and O, H, C, and B isotopic constraints on the origin of saline waters from eastern Canada. Geochim. Cosmochim. Acta 2007, 71, 2209–2223. [Google Scholar] [CrossRef]
- Edmunds, W.M.; Ma, J.Z.; Aeschbach-Hertig, W.; Kipfer, R.; Darbyshire, D.P. Groundwater recharge history and hydrogeochemical evolution in the Minqin Basin, North West China. Appl. Geochem. 2006, 21, 2148–2170. [Google Scholar] [CrossRef]
- Davis, S.N.; Whittemore, D.O.; Fabryka-Martin, J. Uses of chloride/bromide ratios in studies of potable water. Groundwater 1998, 36, 338–350. [Google Scholar] [CrossRef]
- Custodio, E.; Herrera, C. Utilización de la relación Cl/Br como trazador hidroquímico en hidrología subterránea. Bol. Geol. Min. 2000, 111, 49–68. [Google Scholar]
- Edmunds, W.M.; Milne, C. (Eds.) Paleowaters in Coastal Europe: Evolution of Groundwater since the Late Pleistocene; Special Publications 189; Geological Society: London, UK, 2001; pp. 1–16. [Google Scholar]
- Fuge, R.; Power, G.M. Chlorine and fluorine in granitic rocks from SW England. Geochim. Cosmochim. Acta 1969, 33, 888–893. [Google Scholar] [CrossRef]
- Nissenbaum, A.; Magaritz, M. Bromine-rich groundwater in the Hula Valley, Israel. Naturwissenschaften 1991, 78, 217–218. [Google Scholar] [CrossRef]
- Bouchard, D.C.; Williams, M.K.; Surampallu, R.Y. Nitrate contamination of groundwater: Sources and potential health effects. J. Am. Water Works Assoc. 1992, 84, 85–90. [Google Scholar] [CrossRef]
- O’Connor, J.T. Iron and Manganese. In Water Quality and Treatment—A Handbook of Public Water Supplies; McGraw Hill Book Company: New York, NY, USA, 1971; Chapter 11; pp. 378–396. [Google Scholar]
- USEPA (United States Environmental Protection Agency). Prediction of Sediment Toxicity Using Consensus-Based Freshwater Sediment Quality Guidelines; EPA 905/R-00/007; Great Lakes National Program Office: Chicago, IL, USA, 2000.
- Morillo, J.; Usero, J.; Gracia, I. Heavy metal distribution in marine sediments from Southwest coast of Spain. Chemosphere 2004, 55, 431–442. [Google Scholar] [CrossRef] [PubMed]
- Rainbow, P.S. Biomonitoring of heavy metal availabity in the marine environment. Mar. Pollut. Bull. 1995, 31, 183–192. [Google Scholar] [CrossRef]
- Yu, K.T.; Lam, M.H.W.; Yen, Y.F.; Leung, A.P. Behavior of trace metals in the sediment pore waters of intertidal mudflats of a tropical wetlands. Environ. Toxicol. Chem. 2000, 19, 535–542. [Google Scholar] [CrossRef]
- Li, X.; Wai, O.W.H.; Li, Y.S.; Coles, B.J.; Ramsey, M.H.; Thornton, I. Heavy metal distribution in sediment profiles of the Pearl River estuary, South China Sea. Appl. Geochem. 2000, 15, 567–581. [Google Scholar] [CrossRef]
- Libes, S.M. Introduction to Marine Biogeochemistry; John Wiley and Sons: New York, NY, USA, 1992. [Google Scholar]
- Nduka, J.K.; Orisakwe, O.E. Water-quality issues in the Niger Delta of Nigeria: A look at heavy metal levels and some physicochemical properties. Environ. Sci. Pollut. Res. 2011, 18, 237–246. [Google Scholar] [CrossRef] [PubMed]
- Abrahim, G.M.; Parker, R.J. Assessment of heavy metal enrichment factors and the degree of contamination in marine sediments from Yamaki Estuary, Auckland, New Zealand. Environ. Monit. Assess. 2008, 136, 227–238. [Google Scholar] [CrossRef] [PubMed]
- Acosta, J.A.; Jansen, B.; Kalbitz, K.; Faz, A. Salinity increases mobility of heavy metals in soils. Chemosphere 2011, 85, 1318–1324. [Google Scholar] [CrossRef] [PubMed]
- Wang, L.; Coles, N.A.; Wu, C.; Wu, J. Spatial variability of heavy metals in the coastal soils under long-term reclamation. Estuar. Coast. Shelf Sci. 2014, 151, 310–317. [Google Scholar] [CrossRef]
- MLR (Ministry of Land and Resources of the People’s Republic of China). Quality Standard for Ground Water; GB/T 14848-2017; MLR: Beijing, China, 2017.
- AQSIQ (General Administration of Quality Supervision, Inspection and Quarantine of the People’s Republic of China). Marine Sediment Quality; GB 18668-2002; AQSIQ: Beijing, China, 2002.
- Krishnamurti, G.S.R.; Huang, P.M.; Kozak, L.M. Sorption and desorption kinetics of cadmium from soils: Influence of phosphate. Soil Sci. 1999, 164, 888–898. [Google Scholar] [CrossRef]
- Ogwada, R.A.; Sparks, D.L. A critical evaluation on the use of kinetics for determining thermodynamics of ion exchange in soils. Soil Sci. Soc. Am. J. 1986, 50, 300–305. [Google Scholar] [CrossRef]
- Toor, G.S.; Bahl, G.S. Kinetics of phosphate desorption from different soils as influenced by application of poultry manure and fertilizer phosphorus and its uptake by soybean. Bioresour. Technol. 1999, 69, 117–121. [Google Scholar] [CrossRef]
Figure 1.
Detailed geography location of the study area with monitoring wells distribution and hydrogeology boundary conditions.
Figure 1.
Detailed geography location of the study area with monitoring wells distribution and hydrogeology boundary conditions.
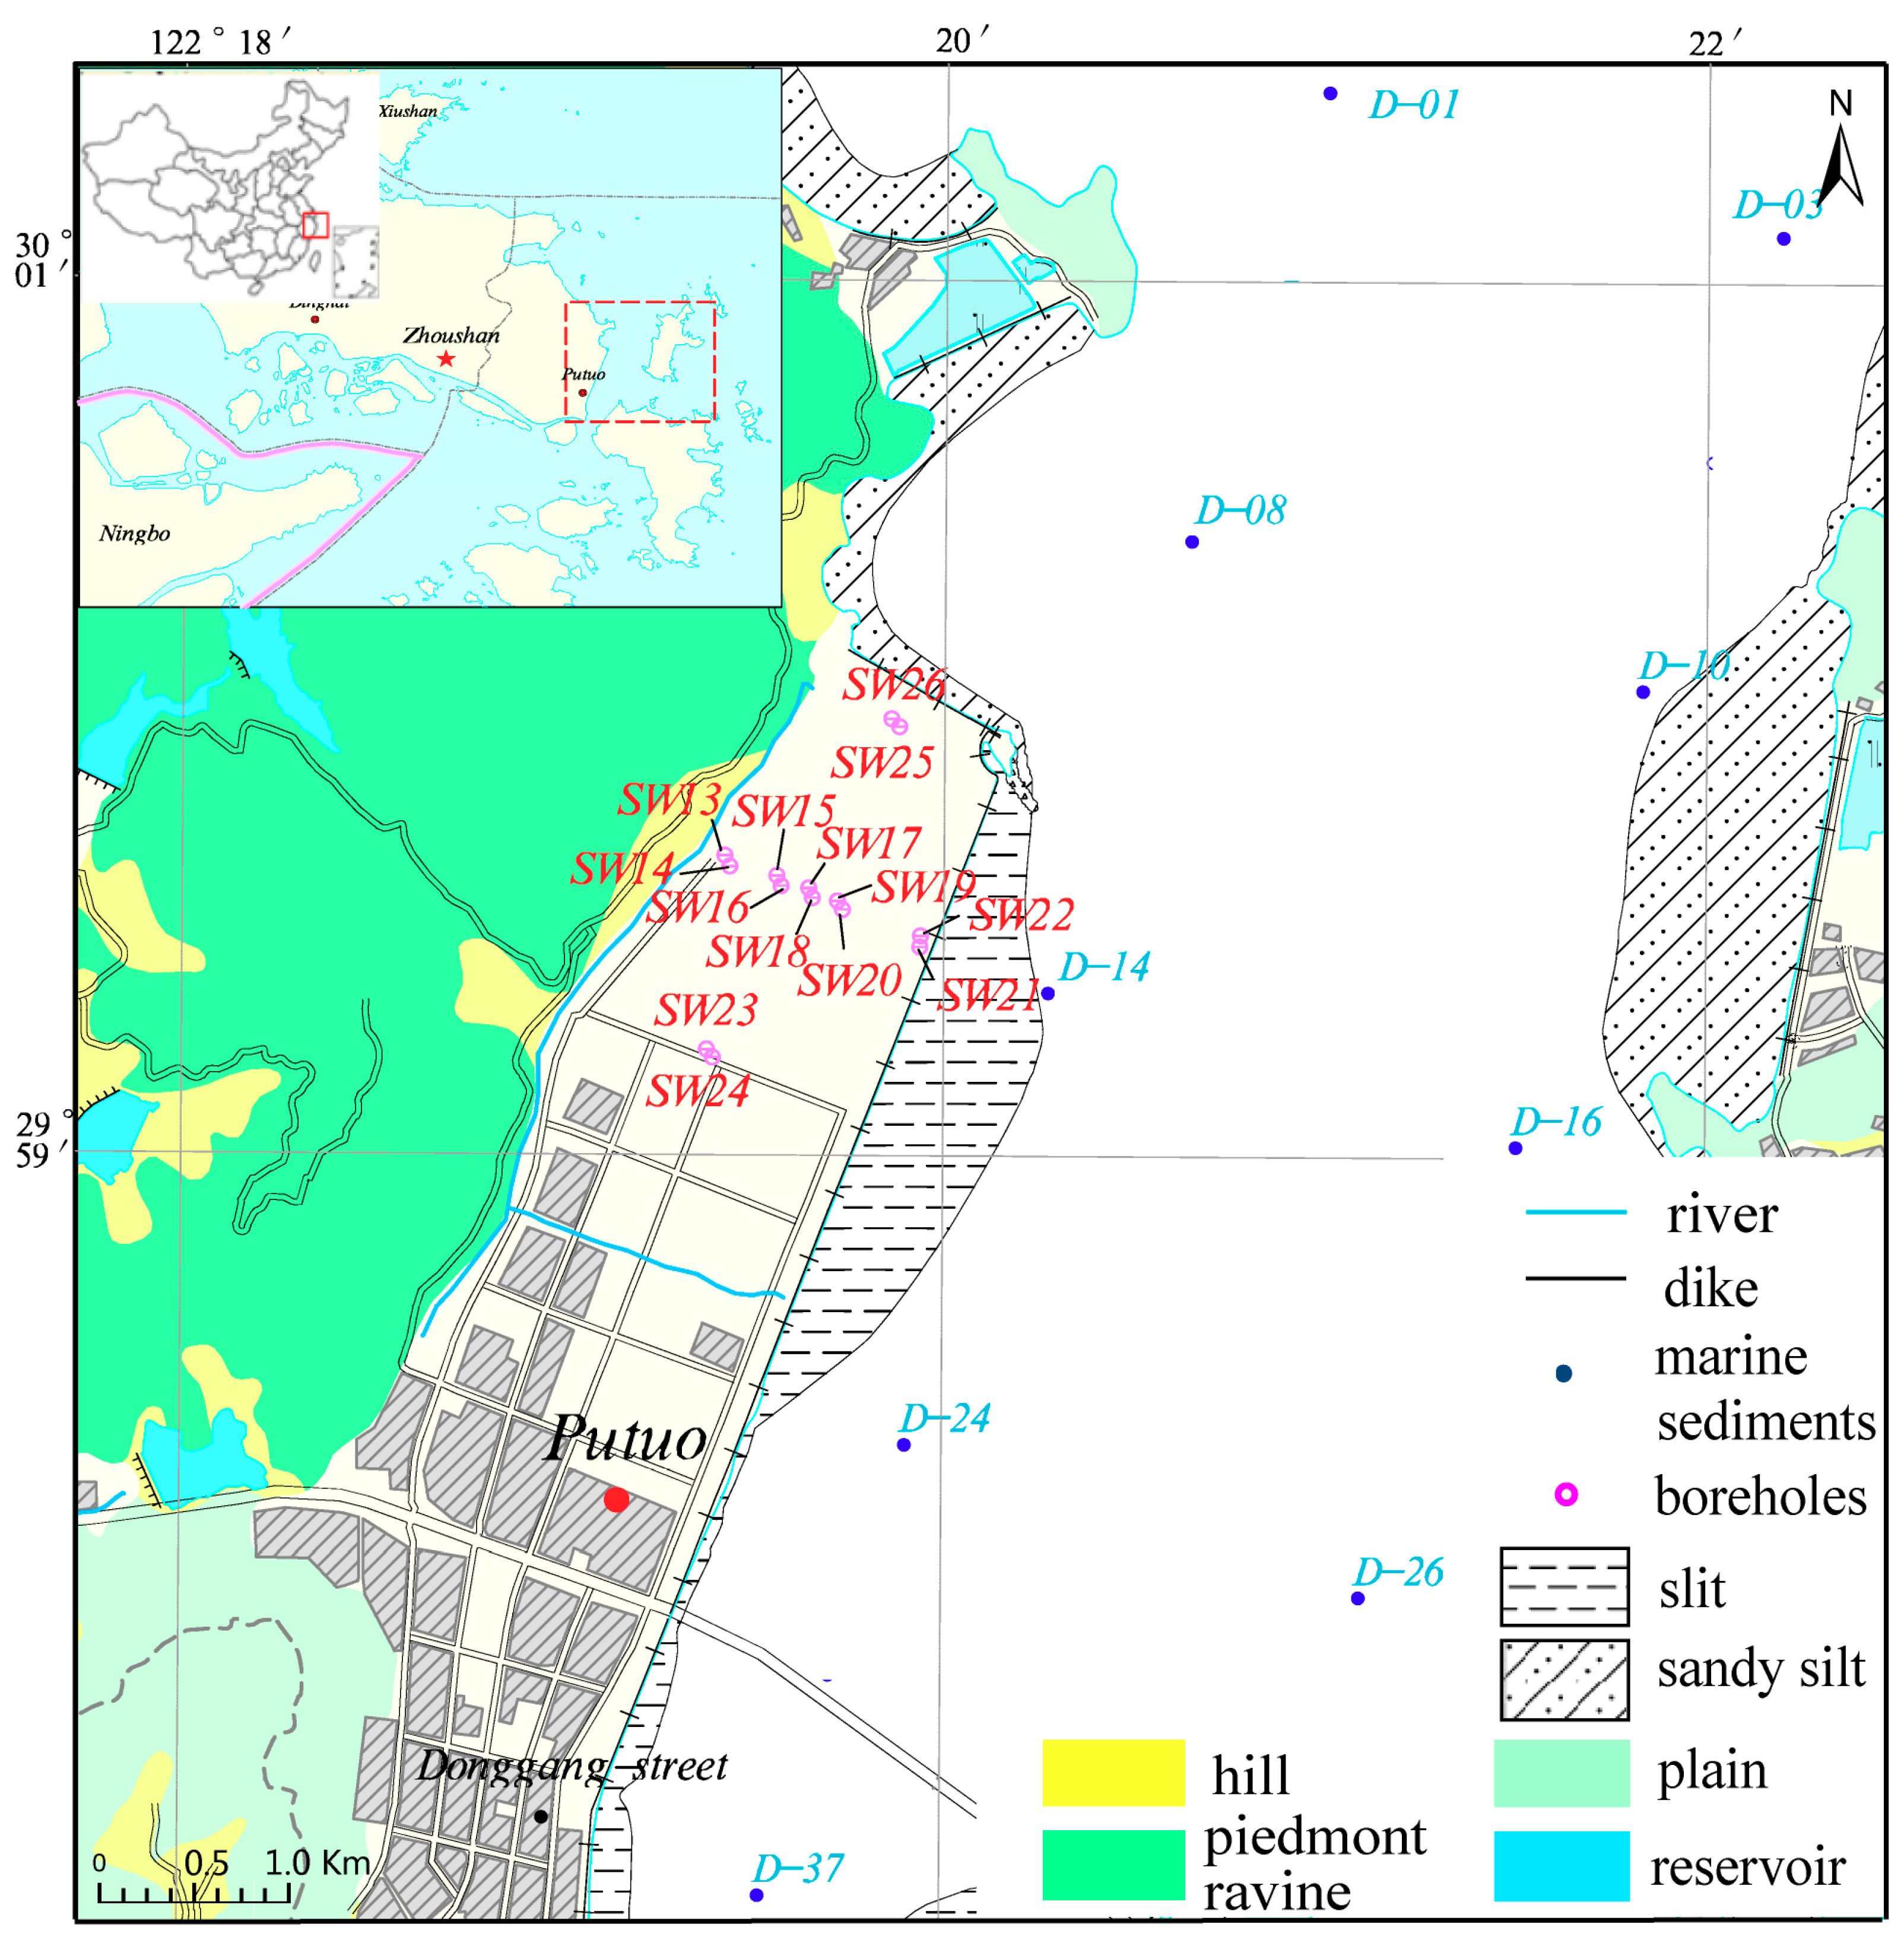
Figure 2.
Geologic cross section profiles of boreholes SW13–SW22 (A) and SW23–SW26 (B) on reclaimed land. The east boundary is where the dike located.
Figure 2.
Geologic cross section profiles of boreholes SW13–SW22 (A) and SW23–SW26 (B) on reclaimed land. The east boundary is where the dike located.
Figure 3.
Piper diagram of groundwater samples from the infill layer and clay layer; seawater and river water samples are included as references.
Figure 3.
Piper diagram of groundwater samples from the infill layer and clay layer; seawater and river water samples are included as references.
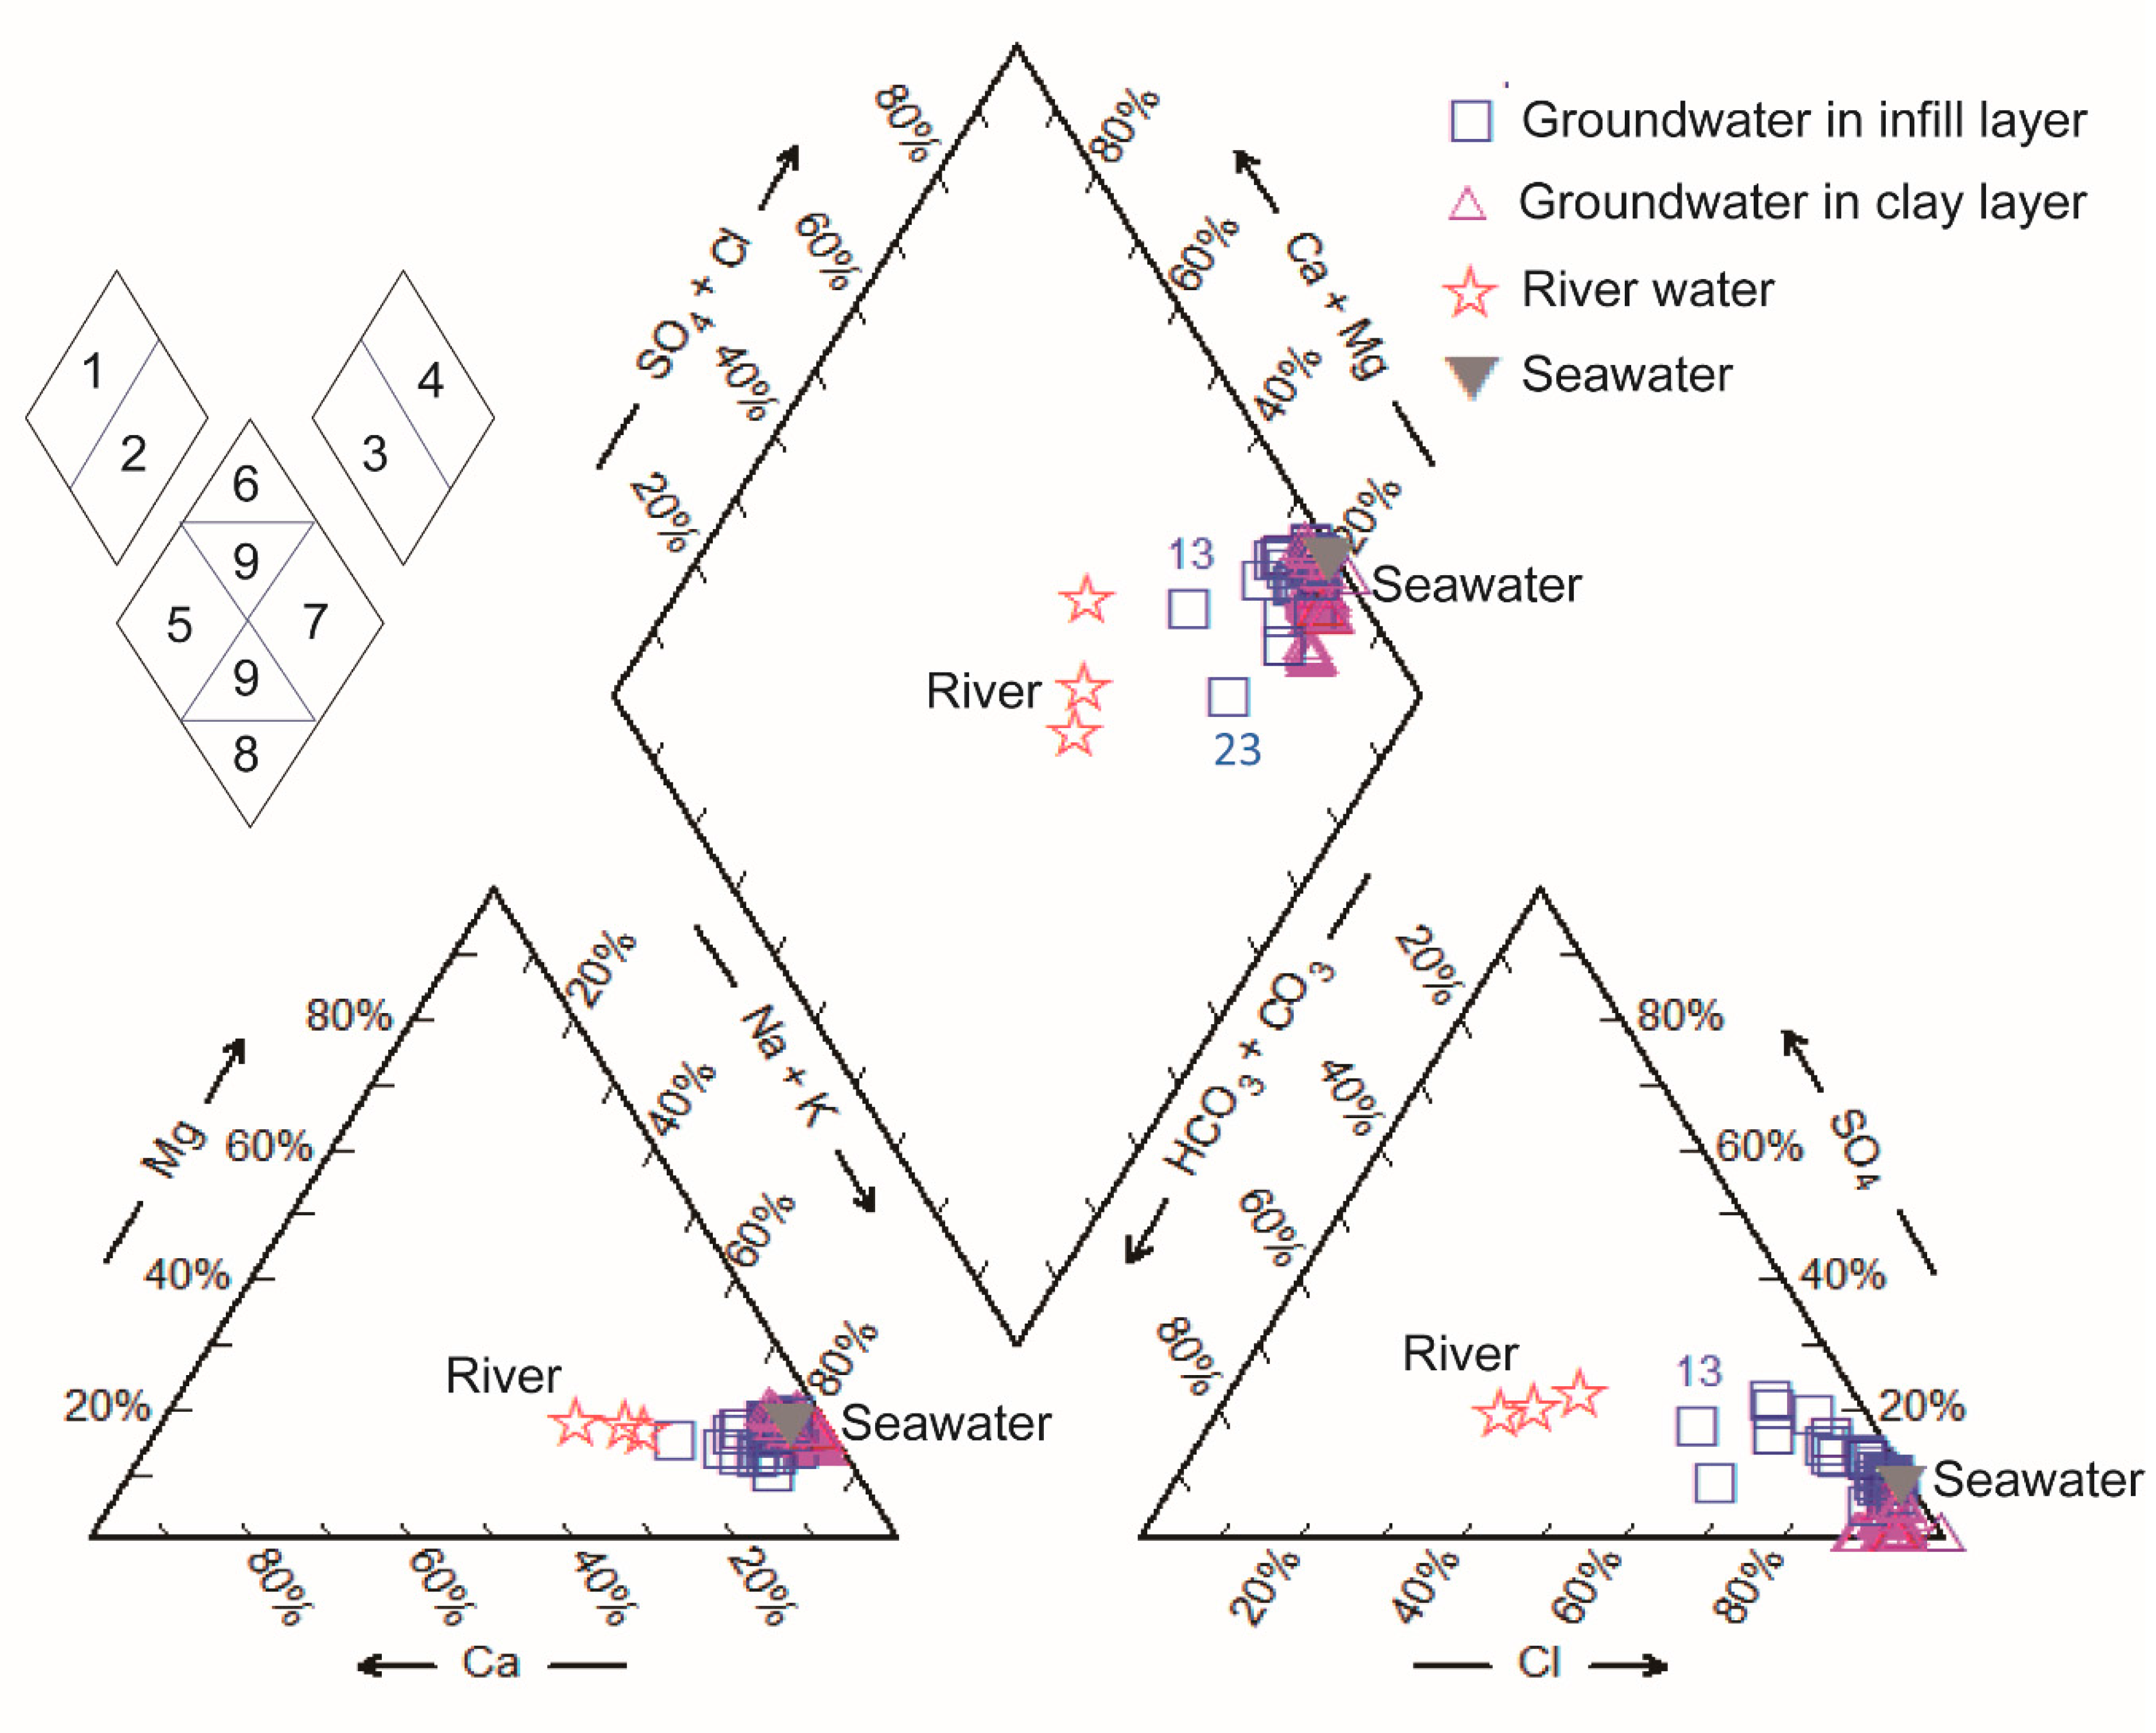
Figure 4.
Hydrochemical relationships between selected ions in groundwater: (A) sodium and chloride; (B) calcium and sulfate; (C) sulfate and chloride; (D) magnesium and chloride. Explanation: G, H, E, S, C, and B stand for point of precipitation of gypsum, halite, epsomite, sylvite, carnallite, and bischofite, respectively. The mean values for rainfall are referenced from references [46,47]. Mixing line between seawater and fresh river water is shown in dashed lines.

Figure 5.
Chloride versus bromide (A); and chloride versus corresponding elements to chloride molar ratios of groundwater (B). The dashed lines represent seawater Cl/Br ratio (Custodio and Herrera, 2000).
Figure 5.
Chloride versus bromide (A); and chloride versus corresponding elements to chloride molar ratios of groundwater (B). The dashed lines represent seawater Cl/Br ratio (Custodio and Herrera, 2000).
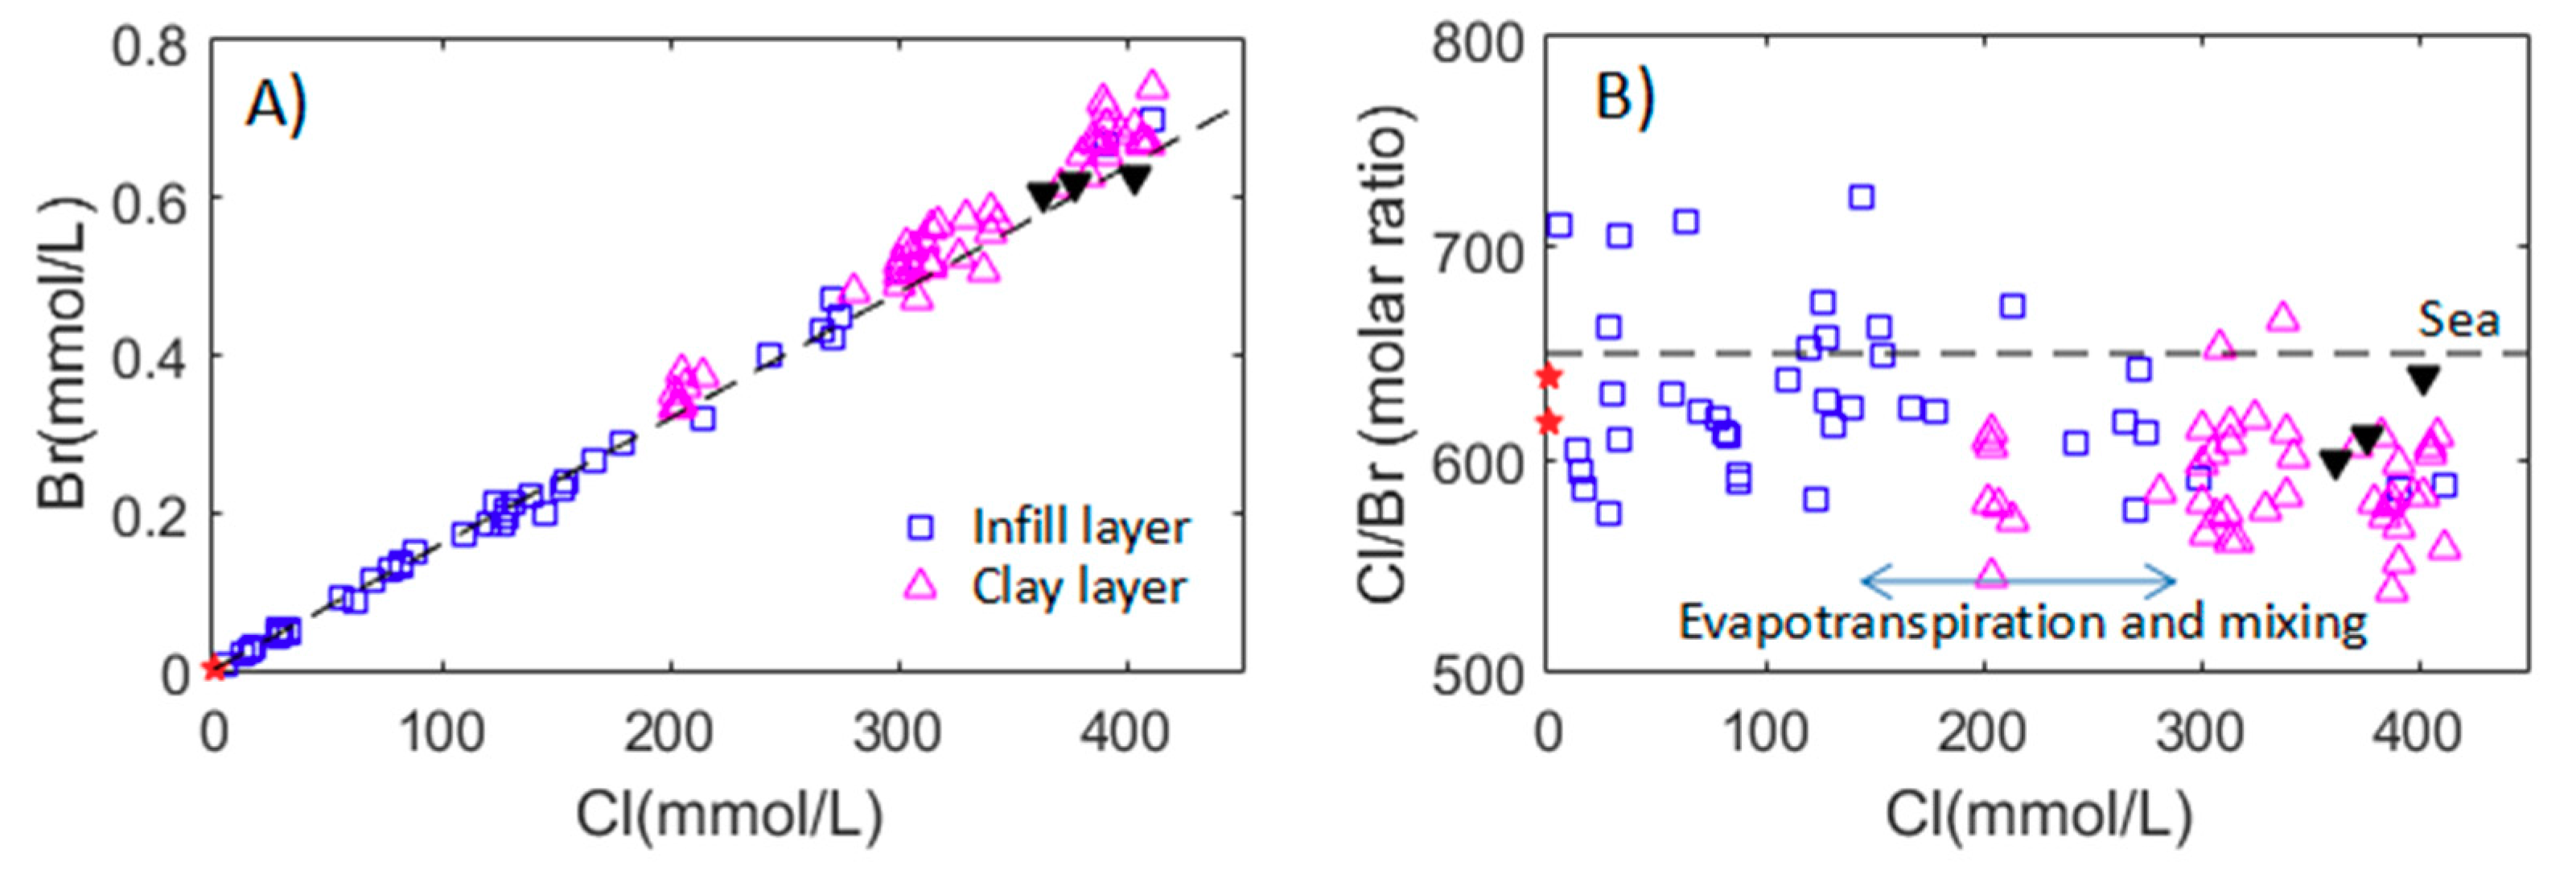
Figure 6.
The time-averaged NH4, NO3, and NO2 concentrations in groundwater, seawater and river water samples from infill layer (A), clay layer (B), and COD concentrations in groundwater samples (C) from March 2015 to March 2016
Figure 6.
The time-averaged NH4, NO3, and NO2 concentrations in groundwater, seawater and river water samples from infill layer (A), clay layer (B), and COD concentrations in groundwater samples (C) from March 2015 to March 2016
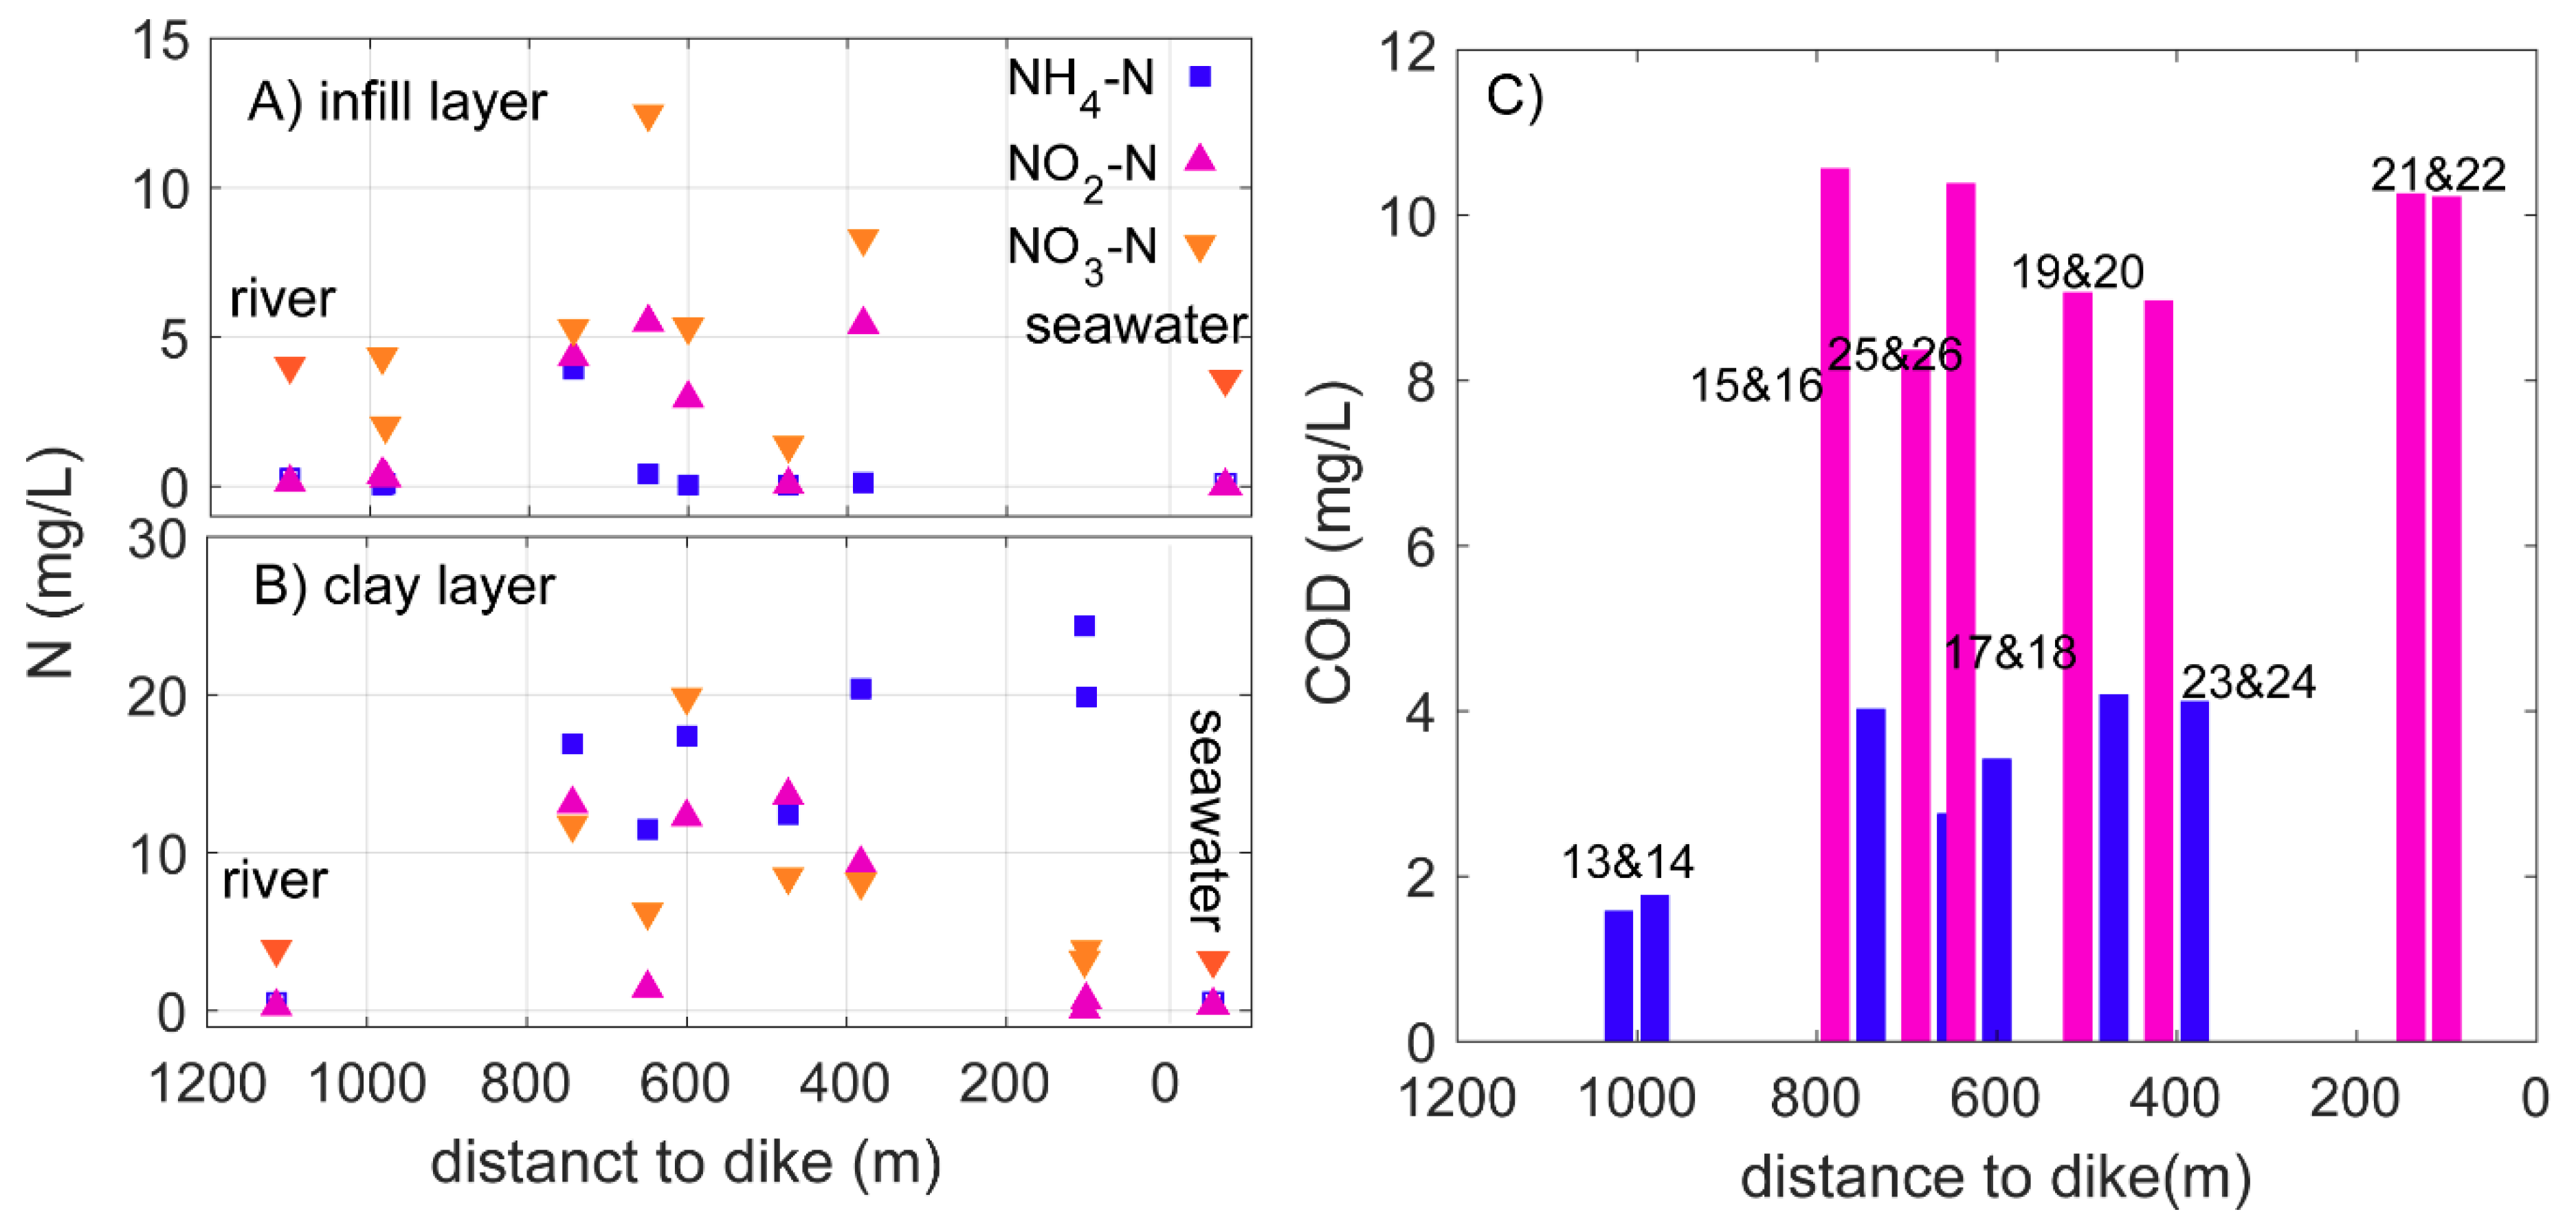
Figure 7.
Fe-III and Mn concentrations in all boreholes (A-N) and daily precipitation (O and P) in the monitoring period. The gray area represents extreme rain event (170 mm/day).
Figure 7.
Fe-III and Mn concentrations in all boreholes (A-N) and daily precipitation (O and P) in the monitoring period. The gray area represents extreme rain event (170 mm/day).

Figure 8.
Heavy metal concentrations in groundwater samples; the shaded bar represents detection limit; the concentrations are marked with plus signs, together with borehole names; the class II values represent natural chemical background in groundwater.
Figure 8.
Heavy metal concentrations in groundwater samples; the shaded bar represents detection limit; the concentrations are marked with plus signs, together with borehole names; the class II values represent natural chemical background in groundwater.
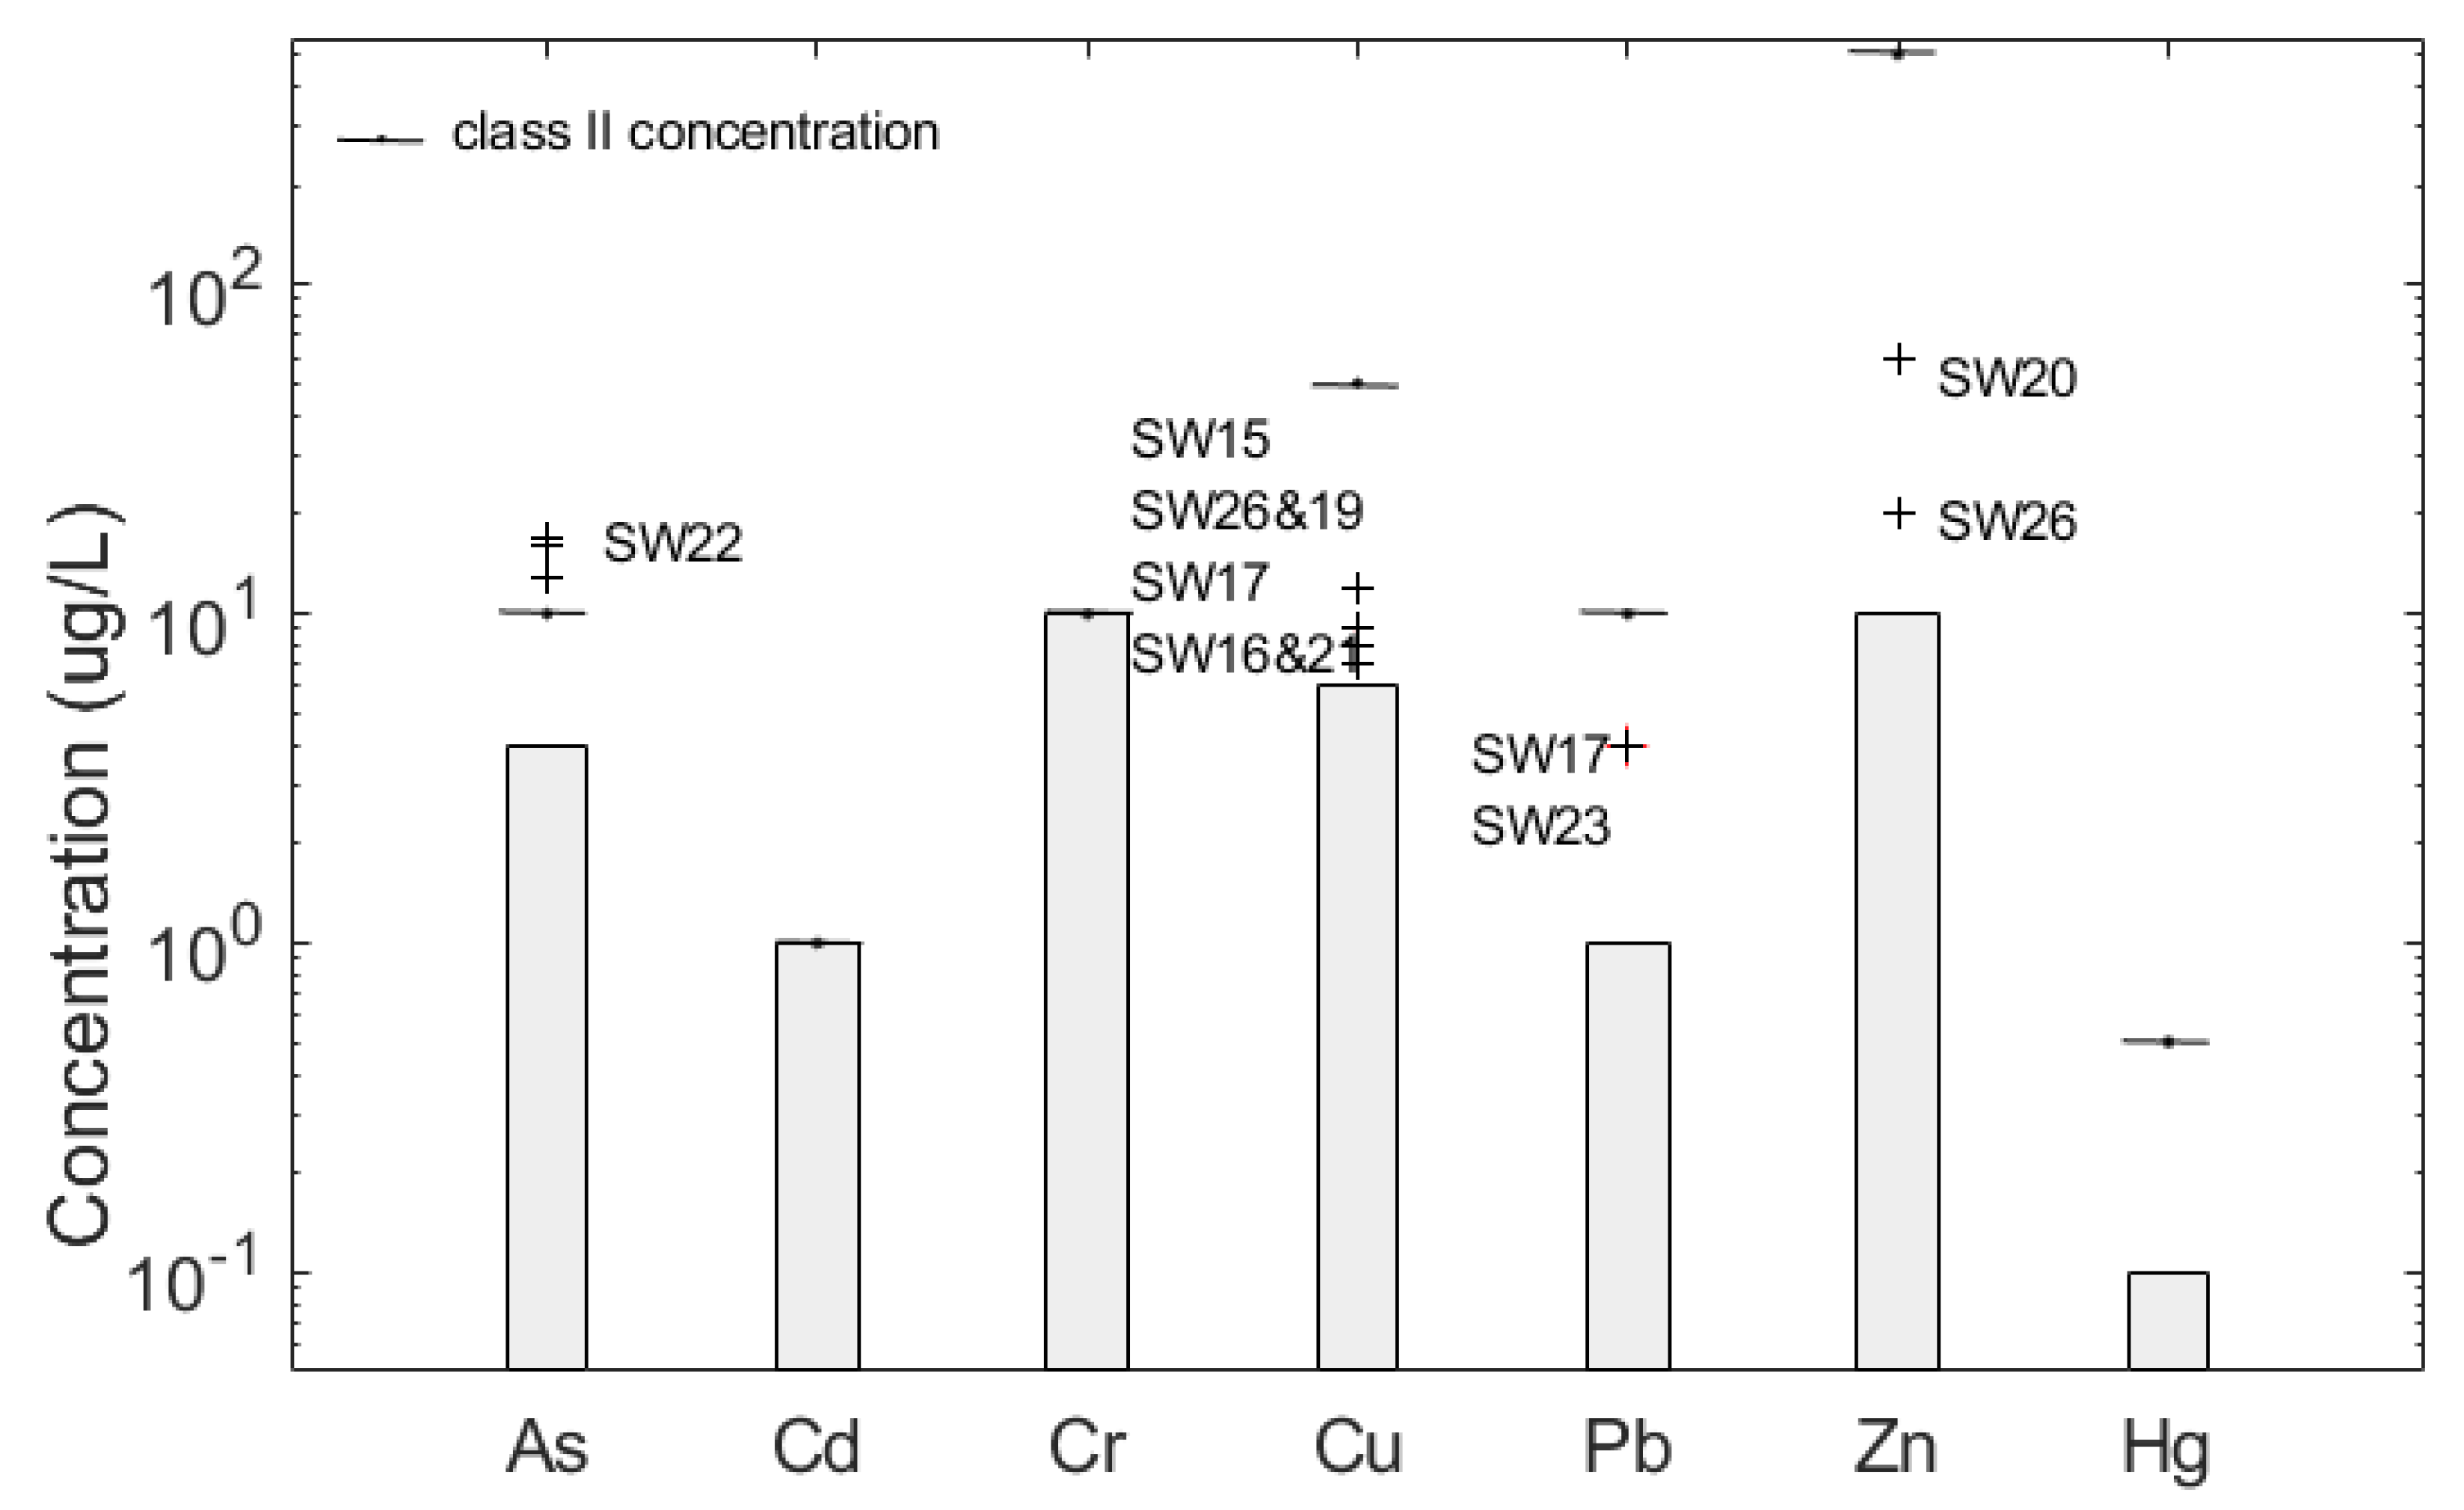
Figure 9.
The measured effluent concentrations of Cr (A) and Cd (B) in desorption column experiments.
Figure 9.
The measured effluent concentrations of Cr (A) and Cd (B) in desorption column experiments.


Table 1.
The grain size distribution of sediment in borehole SW21.
| Grain Size | 2–0.25 mm | 0.25–0.05 mm | 0.05–0.01 mm | 0.01–0.005 mm | 0.005–0.001 mm | <0.001 mm |
|---|---|---|---|---|---|---|
| Percentage (%) | 48.47 | 25.6 | 8.4 | 6.21 | 7.03 | 4.3 |
Table 2.
Statistics summary of pH, TDS, and EC for groundwater samples in 14 boreholes during the monitoring period.
Table 2.
Statistics summary of pH, TDS, and EC for groundwater samples in 14 boreholes during the monitoring period.
| Parameter | Statistics | SW13 | SW14 | SW15 | SW16 | SW17 | SW18 | SW19 | SW20 | SW21 | SW22 | SW23 | SW24 | SW25 | SW26 |
|---|---|---|---|---|---|---|---|---|---|---|---|---|---|---|---|
| pH | Max | 7.89 | 7.70 | 8.00 | 8.01 | 7.89 | 7.90 | 7.82 | 7.96 | 7.79 | 7.92 | 7.93 | 8.31 | 8.08 | 7.69 |
| Min | 7.37 | 6.95 | 7.35 | 7.66 | 7.51 | 7.60 | 7.52 | 7.50 | 7.51 | 7.70 | 7.55 | 7.63 | 7.37 | 7.21 | |
| Mean | 7.66 | 7.18 | 7.67 | 7.79 | 7.68 | 7.72 | 7.70 | 7.76 | 7.69 | 7.82 | 7.71 | 8.11 | 7.78 | 7.52 | |
| s.d. | 0.24 | 0.57 | 0.28 | 0.16 | 0.17 | 0.12 | 0.09 | 0.22 | 0.08 | 0.06 | 0.17 | 0.49 | 0.36 | 0.26 | |
| TDS | Max | 14.10 | 10.54 | 25.17 | 24.53 | 13.80 | 24.08 | 19.92 | 18.10 | 21.51 | 16.70 | 10.36 | 18.80 | 24.10 | 24.75 |
| Min | 2.58 | 5.96 | 5.88 | 2.08 | 3.99 | 13.38 | 7.35 | 17.20 | 11.55 | 11.87 | 2.57 | 12.05 | 1.37 | 22.90 | |
| Mean | 6.20 | 7.43 | 17.54 | 22.19 | 8.92 | 21.87 | 15.72 | 17.69 | 19.75 | 13.04 | 5.29 | 17.11 | 10.90 | 23.90 | |
| s.d. | 142.04 | 18.11 | 590.64 | 443.68 | 146.29 | 88.11 | 137.28 | 0.78 | 90.80 | 17.86 | 38.43 | 56.20 | 612.19 | 3.37 | |
| Conductivity | Max | 24.30 | 18.20 | 43.40 | 42.80 | 24.20 | 40.50 | 33.70 | 31.23 | 37.03 | 28.75 | 17.86 | 32.40 | 44.30 | 42.60 |
| Min | 4.47 | 8.31 | 9.71 | 40.85 | 6.88 | 35.70 | 12.69 | 29.15 | 28.90 | 20.50 | 4.44 | 21.00 | 2.28 | 39.50 | |
| Mean | 12.67 | 12.79 | 32.28 | 41.69 | 16.19 | 38.84 | 26.50 | 30.32 | 35.06 | 22.16 | 8.97 | 29.83 | 20.93 | 41.02 | |
| s.d. | 430.78 | 64.49 | 1439.77 | 3.51 | 430.37 | 20.33 | 337.03 | 3.55 | 46.53 | 50.40 | 113.76 | 134.05 | 2148.07 | 8.48 |
Table 3.
Major ion concentrations in groundwater, river and sea samples. The four sampling times are March 2015, September 2015, December 2015 and March 2016. * represents the sampling times are March 2015 and March 2016.
Table 3.
Major ion concentrations in groundwater, river and sea samples. The four sampling times are March 2015, September 2015, December 2015 and March 2016. * represents the sampling times are March 2015 and March 2016.
| Well Label | Ca2+ (mg/L) | Mg2+ (mg/L) | Na+ (mg/L) | K+ (mg/L) | HCO3− (mg/L) | SO42− (mg/L) | Cl− (mg/L) |
|---|---|---|---|---|---|---|---|
| SW13 | 89 | 75 | 756 | 34 | 196 | 280 | 1139 |
| 86 | 81 | 646 | 31 | 162 | 240 | 1130 | |
| 84 | 69 | 571 | 33 | 165 | 219 | 1009 | |
| 34 | 16 | 124 | 11 | 127 | 76 | 196 | |
| SW14 | 132 | 202 | 1861 | 61 | 144 | 432 | 3092 |
| 157 | 256 | 2080 | 66 | 165 | 550 | 3852 | |
| 180 | 299 | 2305 | 86 | 168 | 625 | 4497 | |
| 177 | 281 | 2235 | 82 | 184 | 592 | 4482 | |
| SW15 | 158 | 173 | 1812 | 68 | 184 | 605 | 2865 |
| 260 | 592 | 4740 | 176 | 186 | 1255 | 8502 | |
| 261 | 986 | 7523 | 301 | 1601 | 220 | 14,400 | |
| 144 | 320 | 2617 | 103 | 324 | 645 | 5065 | |
| SW16 | 246 | 768 | 6900 | 238 | 998 | 598 | 10,988 |
| 202 | 946 | 7720 | 268 | 1587 | 100 | 14,100 | |
| 211 | 974 | 7439 | 280 | 1544 | 95 | 14,300 | |
| 201 | 936 | 7436 | 282 | 1505 | 101 | 14,200 | |
| SW17 | 180 | 176 | 1845 | 65 | 187 | 580 | 2883 |
| 208 | 328 | 2700 | 95 | 276 | 768 | 4860 | |
| 154 | 156 | 1236 | 55 | 288 | 584 | 2202 | |
| 112 | 129 | 1182 | 52 | 284 | 479 | 1984 | |
| SW18 | 352 | 720 | 6540 | 212 | 714 | 830 | 10,735 |
| 218 | 878 | 7550 | 248 | 1475 | 248 | 13,500 | |
| 204 | 909 | 7208 | 269 | 1464 | 155 | 13,700 | |
| 194 | 841 | 7051 | 261 | 1607 | 83 | 13,300 | |
| SW19 | 343 | 733 | 6350 | 221 | 171 | 1590 | 10,499 |
| 210 | 392 | 3300 | 120 | 207 | 938 | 5848 | |
| 315 | 663 | 4906 | 191 | 194 | 1375 | 9485 | |
| 238 | 496 | 3928 | 154 | 191 | 1070 | 7504 | |
| SW20 | 216 | 578 | 5900 | 196 | 835 | 328 | 9828 |
| 173 | 608 | 5680 | 194 | 808 | 154 | 10,700 | |
| 181 | 610 | 5431 | 208 | 877 | 93 | 10,500 | |
| 175 | 604 | 5660 | 214 | 905 | 74 | 10,500 | |
| SW21 | 194 | 708 | 7060 | 232 | 1305 | 446 | 11,532 |
| 206 | 766 | 6510 | 230 | 1328 | 525 | 12,000 | |
| 201 | 748 | 6200 | 229 | 1261 | 475 | 11,900 | |
| 193 | 736 | 6442 | 238 | 1353 | 412 | 11,800 | |
| SW22 | 99 | 390 | 4620 | 153 | 1429 | 34 | 7253 |
| 98 | 383 | 4195 | 147 | 1432 | <1 | 7075 | |
| 98 | 380 | 3900 | 151 | 1384 | <1 | 7086 | |
| 97 | 390 | 4114 | 156 | 1438 | <1 | 7160 | |
| SW23 * | 175 | 168 | 1878 | 60 | 190 | 560 | 2865 |
| 41 | 30 | 333 | 24 | 299 | 79 | 463 | |
| SW24 | 193 | 472 | 4550 | 178 | 617 | 554 | 7489 |
| 105 | 640 | 6150 | 220 | 10 | 6 | 10,900 | |
| 80 | 628 | 5816 | 222 | 953 | 5 | 11,000 | |
| 115 | 620 | 5855 | 223 | 1023 | 25 | 10,800 | |
| SW25 | 107 | 68 | 705 | 36 | 154 | 346 | 1008 |
| 314 | 972 | 7500 | 264 | 667 | 1355 | 13,700 | |
| 63 | 37 | 349 | 25 | 149 | 235 | 556 | |
| 106 | 205 | 1634 | 67 | 248 | 434 | 3085 | |
| SW26 | 482 | 930 | 7740 | 212 | 726 | 1030 | 13,491 |
| 458 | 950 | 7290 | 210 | 631 | 965 | 13,600 | |
| 461 | 942 | 6701 | 214 | 667 | 938 | 13,900 | |
| 472 | 951 | 7030 | 219 | 680 | 910 | 13,600 | |
| River * | 10 | 4 | 25 | 5 | 54 | 19 | 28 |
| 11 | 4 | 20 | 2 | 41 | 18 | 27 | |
| Seawater * | 298 | 902 | 7270 | 282 | 112 | 1785 | 13,200 |
| 318 | 983 | 7528 | 326 | 133 | 1865 | 14,100 |
Table 4.
Classification of hydrochemical facies derived from Piper diagram.
| Area | Chemical Composition | Characteristics of Subdivision of Diamond Shaped Fields | % Sample |
|---|---|---|---|
| 1 | Ca + Mg > Na + K | Alkaline earths exceeds alkalies | - |
| 2 | Na + K > Ca + Mg | Alkalies exceed alkaline earths | 100 |
| 3 | CO3 + HCO3 > SO4 + Cl | Weak acids exceed strong acids | - |
| 4 | CO3 + HCO3 < SO4 + Cl | Strong acids exceed weak acids | 100 |
| 5 | Ca - Mg - HCO3 | Alkaline earths and weak acids are dominated over the alkalies and strong acids. Carbonate hardness exceeds 50% | - |
| 6 | Ca - Mg - SO4 | Non-carbonate hardness exceeds 50% | - |
| 7 | Na - Cl | Non-carbonate alkali exceeds 50% | 100 |
| 8 | Na - HCO3 | Carbonate alkali exceeds 50% | - |
| 9 | Mixed | None of the cation and anion pairs exceed 50% | - |
Table 5.
Heavy metal concentration in nine marine sediments taken from the lagoon east of the study area (sites D Figure 1); Roman numerals are sediment quality classification according to GB 18668-2002, I represents high quality with low concentration, vice versa for III.
Table 5.
Heavy metal concentration in nine marine sediments taken from the lagoon east of the study area (sites D Figure 1); Roman numerals are sediment quality classification according to GB 18668-2002, I represents high quality with low concentration, vice versa for III.
| Metal Concentrations (mg/kg) | D01 | D03 | D08 | D10 | D14 | D16 | D24 | D26 | D37 |
|---|---|---|---|---|---|---|---|---|---|
| As | 5.09(I) | 5.39(I) | 5.8(I) | 5.3(I) | 5.52(I) | 6.17(I) | 6.87(I) | 4.78(I) | 6.02(I) |
| Cd | 0.79(II) | 2.56(III) | 1.68(III) | 0.48(I) | 3.08(III) | 1.64(III) | 0.25(I) | 0.28(I) | 2.36(III) |
| Cr | 132(II) | 140(II) | 130(II) | 129(II) | 140(II) | 143(II) | 144(II) | 122(II) | 130(II) |
| Cu | 16(I) | 13(I) | 18(I) | 18(I) | 19(I) | 18(I) | 20(I) | 12(I) | 20(I) |
| Pb | 33(I) | 23(I) | 34(I) | 31(I) | 39(I) | 43(I) | 24(I) | 31(I) | 26(I) |
| Zn | 53(I) | 57(I) | 34(I) | 71(I) | 62(I) | 57(I) | 270(II) | 61(I) | 63(I) |
| Hg | 0.002(I) | 0.055(I) | 0.188(I) | 0.201(I) | 0.002(I) | 0.002(I) | 5.25(III) | 0.002(I) | 1.28(III) |
Table 6.
Metal concentration in the sediment of clay layer from six boreholes in the reclaimed land; Roman numerals are sediment quality classification according to GB 18668-2002, class I represents high quality with low concentration, vice versa for class III.
Table 6.
Metal concentration in the sediment of clay layer from six boreholes in the reclaimed land; Roman numerals are sediment quality classification according to GB 18668-2002, class I represents high quality with low concentration, vice versa for class III.
| Metal Concentrations (mg/kg) | SW16 | SW18 | SW20 | SW22 | SW24 | SW26 |
|---|---|---|---|---|---|---|
| Moisture content (%) | 27.2 | 26.6 | 30 | 31.7 | 28.6 | 23.8 |
| As | 8.0(I) | 9.0(I) | 14.0(I) | 17.0(I) | 10.0(I) | 10.0(I) |
| Cd | <0.3(I) | <0.3(I) | 0.3(I) | 0.4(I) | 0.4(I) | <0.3(I) |
| Cr | 83.1(II) | 80.3(II) | 89.4(II) | 92.6(II) | 92.4(II) | 65.7(I) |
| Cu | 22.2(I) | 21.6(I) | 30.6(I) | 30.0(I) | 30.5(I) | 26.3(I) |
| Pb | 23.1(I) | 24.6(I) | 28.5(I) | 28.8(I) | 32.0(I) | 32.5(I) |
| Zn | 91.9(I) | 93.4(I) | 102.0(I) | 111.0(I) | 110.0(I) | 102.0(I) |
| Hg | <0.05(I) | <0.05(I) | 0.05(I) | <0.05(I) | 0.05(I) | <0.05(I) |
Table 7.
The Cr and Cd concentrations in three column sediments layers after leaching.
| Layer | Cr (mg/kg) | Cd (mg/kg) |
|---|---|---|
| Upper (0–5 cm) | 109 | 14.6 |
| Middle (10–15 cm) | 90 | 13.8 |
| Lower (21–26 cm) | 92.8 | 6.01 |
Table 8.
R-square and standard error of estimate (SE) for Cr and Cd leaching experiments in three kinetics models.
Table 8.
R-square and standard error of estimate (SE) for Cr and Cd leaching experiments in three kinetics models.
| Metal | Peseudo Second Order | Evolch | Two Constant Rate | |||
|---|---|---|---|---|---|---|
| R2 | SE | R2 | SE | R2 | SE | |
| Cr | 0.85 | 0.11 | 0.59 | 0.06 | 0.89 | 0.03 |
| Cd | 0.95 | 6.30 × 10⁻³ | 0.91 | 1.30 × 10⁻⁴ | 0.98 | 3.18 × 10⁻⁵ |
© 2018 by the authors. Licensee MDPI, Basel, Switzerland. This article is an open access article distributed under the terms and conditions of the Creative Commons Attribution (CC BY) license (http://creativecommons.org/licenses/by/4.0/).
Share and Cite
MDPI and ACS Style
Zhang, X.; Hu, B.X.; Wang, P.; Chen, J.; Yang, L.; Xiao, K.; Zhang, X. Hydrogeochemical Evolution and Heavy Metal Contamination in Groundwater of a Reclaimed Land on Zhoushan Island. Water 2018, 10, 316. https://doi.org/10.3390/w10030316
AMA Style
Zhang X, Hu BX, Wang P, Chen J, Yang L, Xiao K, Zhang X. Hydrogeochemical Evolution and Heavy Metal Contamination in Groundwater of a Reclaimed Land on Zhoushan Island. Water. 2018; 10(3):316. https://doi.org/10.3390/w10030316
Chicago/Turabian StyleZhang, Xiaoying, Bill X. Hu, Peng Wang, Junbing Chen, Lei Yang, Kai Xiao, and Xiaowei Zhang. 2018. "Hydrogeochemical Evolution and Heavy Metal Contamination in Groundwater of a Reclaimed Land on Zhoushan Island" Water 10, no. 3: 316. https://doi.org/10.3390/w10030316
Note that from the first issue of 2016, this journal uses article numbers instead of page numbers. See further details here.