Trend and Variability in Droughts in Northeast China Based on the Reconnaissance Drought Index


1
Key Laboratory of Meteorological Disaster, Ministry of Education (KLME), Joint International Research Laboratory of Climate and Environment Change (ILCEC), Collaborative Innovation Center on Forecast and Evaluation of Meteorological Disasters (CIC-FEMD), Jiangsu Key Laboratory of Agricultural Meteorology, College of Applied Meteorology, Nanjing University of Information Science & Technology, Nanjing 210044, China
2
Institute of Meteorology Science of Jilin Province, Changchun 130062, China
*
Author to whom correspondence should be addressed.
Water 2018, 10(3), 318; https://doi.org/10.3390/w10030318
Submission received: 2 February 2018
/
Revised: 3 March 2018
/
Accepted: 12 March 2018
/
Published: 14 March 2018
Abstract
:Drought is a recurrent meteorological phenomenon that can be disastrous for humans; however, drought characteristics vary substantially in different regions. We use meteorological data from 140 stations in Northeast China for the period 1970–2014 to calculate the reconnaissance drought index (RDI) in order to examine droughts. We also analyze the strength of the relationships between the main large-scale atmospheric circulation patterns and RDI. Drought trends in the region are largely decreasing, but in the majority of cases, there is no statistical significance. Spatially, the pattern of droughts is a less frequent occurrence with greater severity and longer duration, mainly in the western part of the region. Severe droughts for the periods 1975–1979 and 2000–2004 were found, and most of these droughts occurred in the western part of Northeast China. The correlations between RDI and the atmospheric circulation indices POL, IAZC, and IEAT are negative, but the correlation between RDI and PDO is positive. The relationship between RDI and POL is stronger than the others, and the lagged effect is particularly obvious; thus POL can be recognized as the major driver of droughts over the period 1970–2014 in Northeast China.
1. Introduction
Droughts, natural hazards that are recognizable by a continuous period over which rainfall is less than the long-term average precipitation, usually occur during the warm season. Initially, drought is usually a period of high evapotranspiration, often accompanied by higher than normal temperatures. Drought is also characterized by long duration and wide-ranging effects. It can result in damage to industrial and agricultural production as well as to the natural environment and human society. Drought is considered to be a natural disaster that differs from other natural disasters, such as severe rainstorms, typhoons or hurricanes, or floods, because droughts have a gradual creeping feature in that they develop slowly, have prolonged effects that gradually increase in severity and which tend to persist over long periods of time even after they end [1]. As a complex disaster, drought is still lacking an effective and universal definition. Due to the creeping feature and lack of definition, it can be difficult to identify the onset and termination of a drought. Climate change has been recognized as one of the major factors that have great impacts on drought variation. The 5th IPCC [2] reported that the global temperature had an increasing tendency with an average increase of 0.85 °C for the period 1880–2012 and a fast warming trend of 0.12 °C/decade from 1951–2012. In the present period of climate change, droughts are expected to occur more frequently and to become more severe in most parts of the world, as are other extreme weather events [3,4,5,6]. The understanding of the spatial-temporal characteristics and the causes of droughts is important for the development of drought prediction models and also for protecting agricultural production.
Many indices have been developed to quantitively analyze the severity, duration, and frequency of a drought event. Major drought indices include the Palmer drought severity index (PDSI) [7], the standardized precipitation index (SPI) [8], the reconnaissance drought index (RDI) [9] and the standardized precipitation evapotranspiration index (SPEI) [10]. These indices are widely used for assessing drought conditions in many different parts of the world. They are calculated on the basis of many different meteorological variables, such as precipitation, temperature, and potential evapotranspiration. Long-term use of these indices has shown some disadvantages. SPI is calculated using only precipitation data and thus cannot take account of other meteorological variables that play important roles in the drought-causing process [11,12]. SPEI cannot distinguish between a heat wave and a drought sensitively. PDSI needs many input parameters, which can cause errors because they may not all be available at the same resolution or scale. In addition, PDSI has too large an inertial time. RDI is calculated as the ratio of precipitation to potential evapotranspiration, and some deviations will occur if RDI is used in arid zones. RDI has been used to characterize droughts in different regions with certain effects obtained [13,14,15]. As an improvement in SPI, RDI calculates the aggregated deficit between the evaporative demand of the atmosphere and precipitation. RDI has the following two main advantages over other indices: (1) RDI can be more effectively associated with agricultural drought; (2) RDI is directly linked to the climatic conditions of the region for which it is determined and it can be directly compared with the FAO aridity index [16]. The RDI index has been used for drought assessment in China in recent years [17,18,19]. RDI on a 3-month scale can be selected to describe droughts as it has a benefit of representing the seasonal droughts and the soil moisture [20,21]. Therefore, we choose RDI on a 3-month scale (RDI-3) to examine droughts that occurred in Northeast China.
Extreme climate events have frequently occurred over recent years because of global warming and anomalies in atmospheric circulation. Many scholars note that droughts in China have been increasing since the second half of the twentieth century, especially from the 1980s until the present [22,23,24,25,26,27]. Li et al. [28] (2009) investigated moisture variability across China in the period 1951–2005 using PDSI and found that mean moisture availability decreased. Yu et al. [29] (2014) examined characteristics of severe and extreme droughts across China from 1951 to 2010, using SPEI, and found an increase in extreme droughts since the late 1990s throughout all of China, and the area of China affected by drought had increased by an average of 3.72% per decade. Chen and Sun [30] (2015) calculated SPEI for droughts in China and found that droughts had become more frequent and more severe across China since the late 1990s, especially in northern China. Other research shows that droughts in China are certain to continue in the future [31] (Wang et al., 2014).
The occurrence and development of drought are complex processes, and the correlations between regional droughts and large-scale circulation patterns (which are represented by the circulation indices) such as the El Niño–Southern Oscillation (ENSO), the Atlantic Multidecadal Oscillation (AMO), the Pacific Decadal Oscillation (PDO), the Polar–Eurasian teleconnection pattern (POL), the East Asian Trough Position Index (IEAT), and the Asian Zonal Circulation Index (IAZC) have received significant attention [32,33,34,35,36]. Schoennagel et al. [37] pointed that the variation of ENSO and PDO could affect the drought and drought-induced fire in Rocky mountain subalpine forests. Ma [38] noted that warm or cold phases of PDO correlate with drought or wet conditions in North China. Wang et al. [39] investigated effects of large-scale climate patterns on hydrological drought at different time scales over Luanhe River basin, China, indicating significant linkages of ENSO and AMO to the drought conditions. Some research indicated that droughts in East Asia are often associated with large-scale atmospheric circulation rather than local climate systems [40,41,42].
The northeast of China is located between 120° and 135° N and 38° and 53° E. The region covers approximately 78,730,000 km2. Northeast China contains three provinces (Liaoning, Jilin, and Heilongjiang). The terrain is mainly plains and is mountainous. The climate is a typical temperate monsoon pattern with four distinct seasons. The climate zones change from humid to semi-arid from east to west. Major climate systems which influence the region are the East Asian monsoon system, which influences the central area, and the Mongolian high pressure which mainly affects the western area. These systems together cause irregular spatial and temporal precipitation. In addition, global warming was reported to increase the duration and severity of droughts in the region [43,44]. Northeast China is an important grain-producing area, and so drought poses a threat to agricultural development and puts future agricultural production at risk [45]. Analysis of the characteristics of drought, using RDI on 3-month scale and in relation to an atmospheric circulation index, can lead to improved management of water resources.
The objectives of this study are: (1) to examine the spatiotemporal characteristics and trends of drought events, including frequency, severity, and duration, in Northeast China using RDI; (2) to identify significant droughts that occurred during the last 45 years; and (3) to investigate the relationships between RDI and atmospheric circulation indices. The results of this study will contribute to our understanding of drought in Northeast China and provide valuable information for water use planning and management.
2. Data and Methodology
2.1. Data
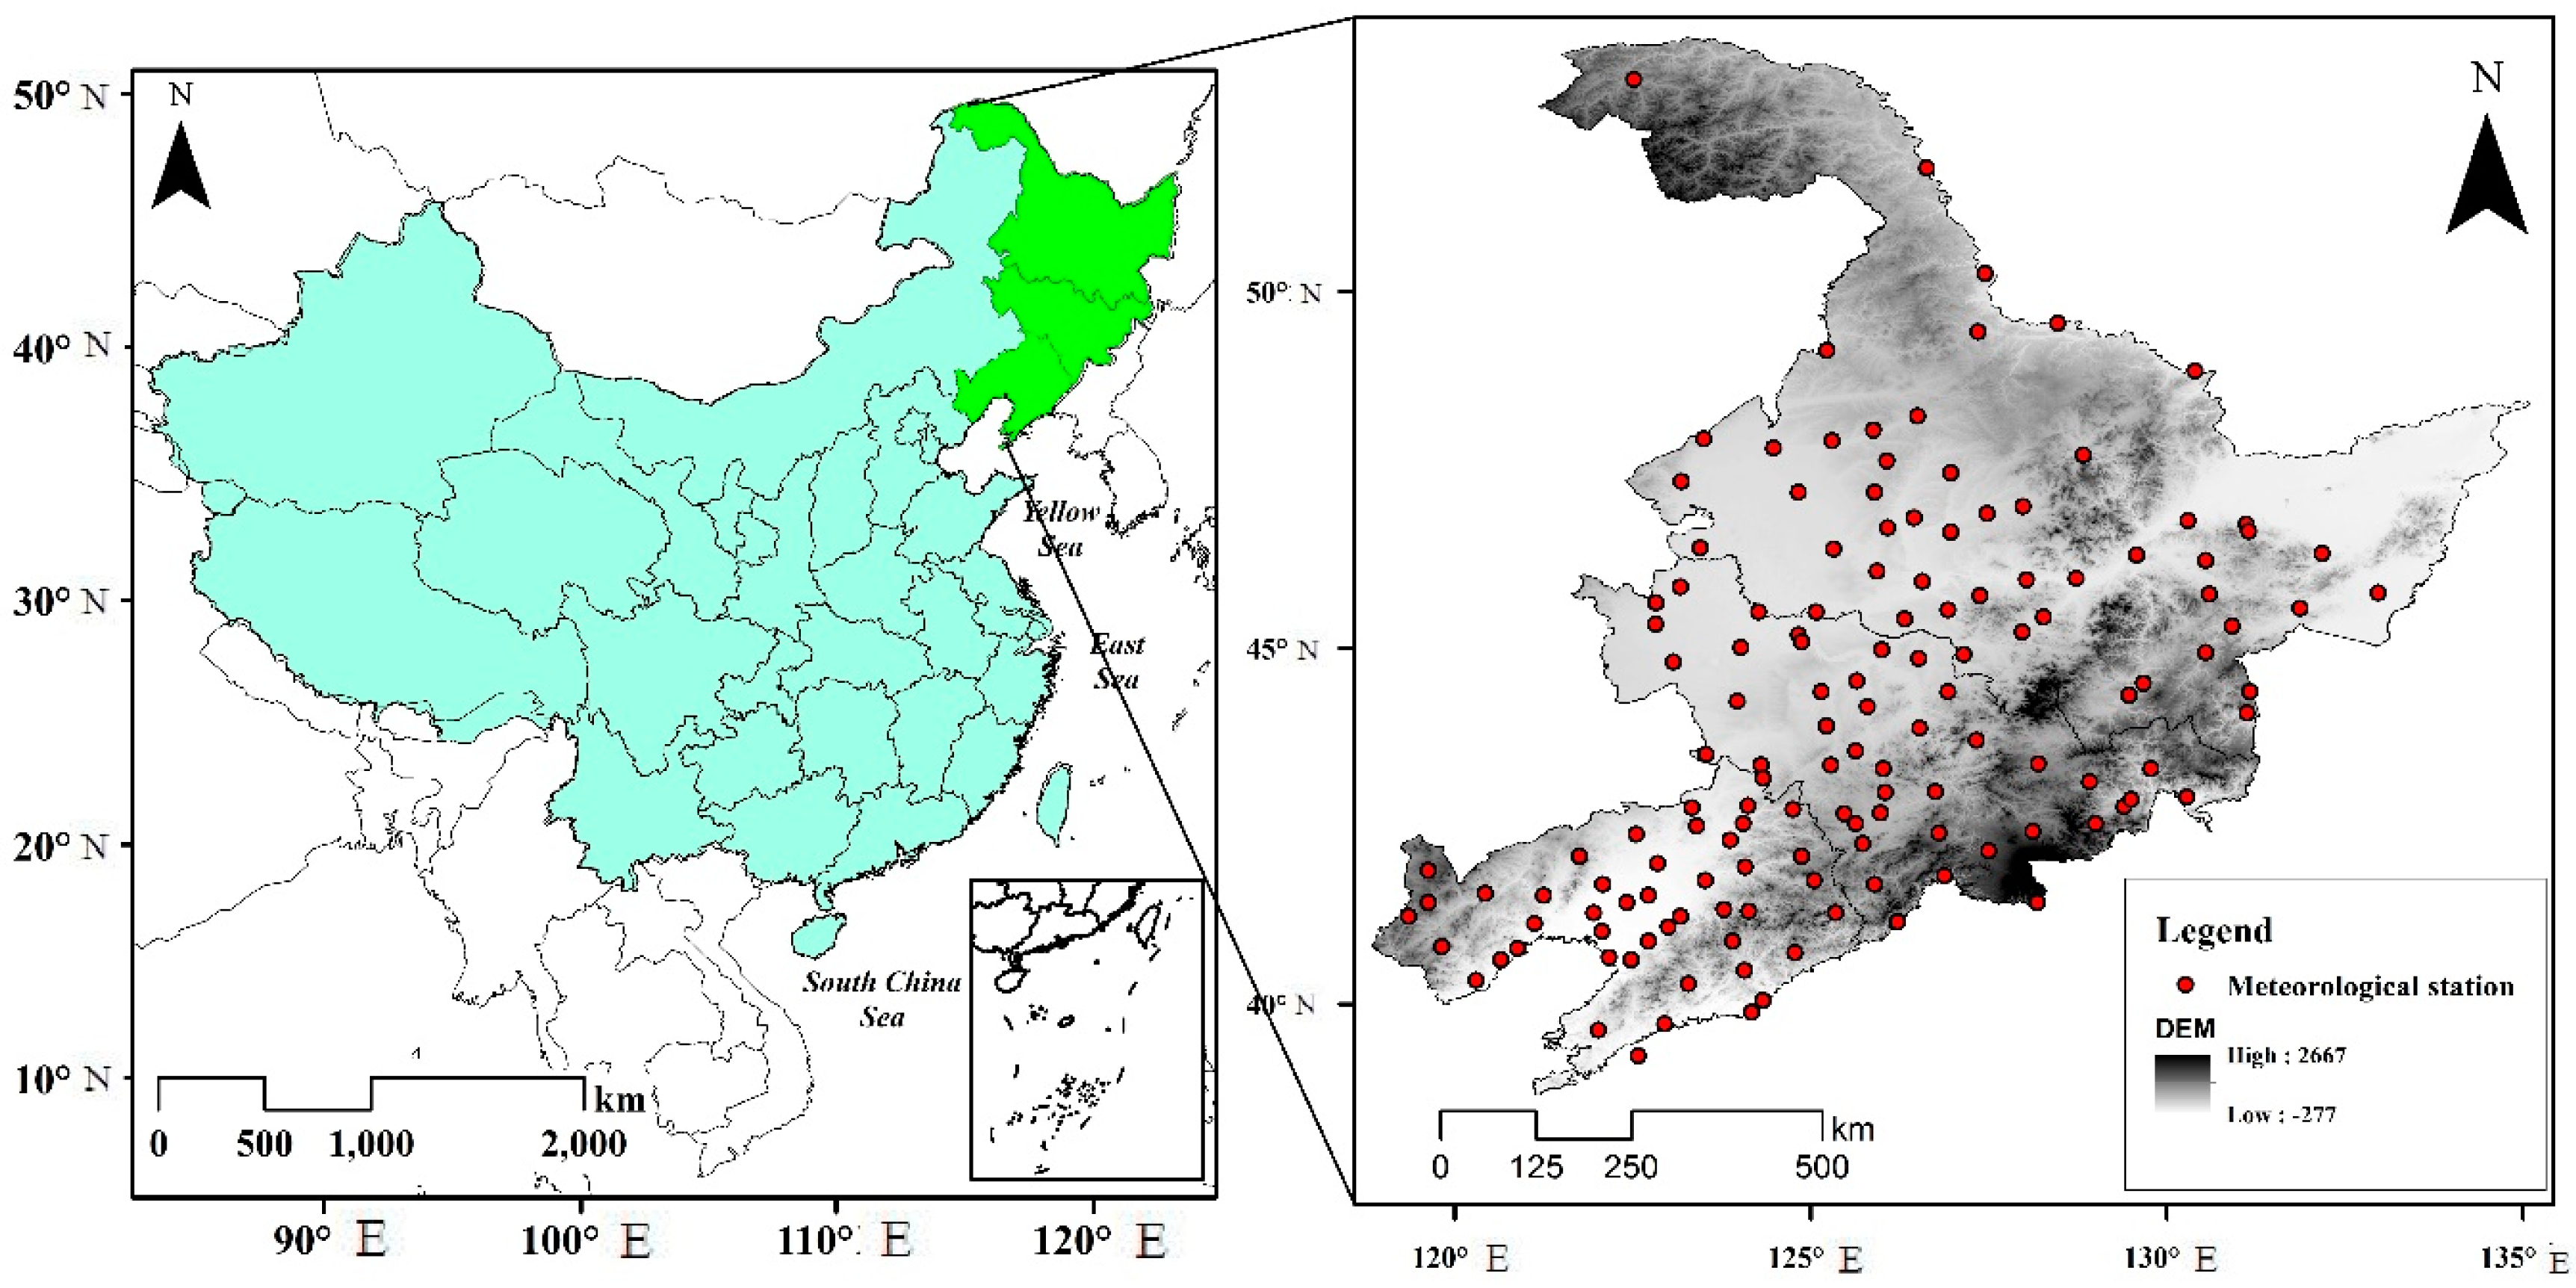
Data recorded at 140 meteorological stations during the 45-year period 1970–2014, including daily precipitation, average, maximum and minimum temperatures, wind speed, sunshine duration, and relative humidity, were provided by China Meteorological Data Sharing Service System [46]. The station locations are shown in Figure 1. The daily time series dataset is used to derive monthly values and to calculate potential evapotranspiration. The circulation indices include the Pacific decadal oscillation (PDO), Polar-Eurasia pattern index (POL), East Asian Trough Position Index (IEAT), and Asian Zonal Circulation Index (IAZC). PDO and POL were downloaded from the NOAA Climate Prediction Center; IEAT and IAZC were obtained from the Climate Diagnostics and Prediction Division of the National Climate Center of China.
2.2. Methodology
2.2.1. Potential Evapotranspiration
RDI is calculated from the precipitation and potential evapotranspiration data. The Penman equation is used to calculate potential evapotranspiration. The Penman-Monteith method (PM) is specified by FAO as being the only method for calculating potential evapotranspiration. Potential evapotranspiration (PET) was calculated using PM based on the data from the meteorological stations. The calculation is:
where PET is the potential evapotranspiration (mm·day−1), Δ is the slope of the curve representing saturation vapor pressure vs. temperature (kPa/°C), RN is the net radiation at the surface (MJ·m−2·day−1), G is the soil heat flux density (MJ·m−2·day−1), γ is the psychrometric constant (kPa/°C), T is the mean daily air temperature at a height of 2 m (°C), U2 is the wind speed at the 2 m height (m/s), es is the saturated vapor pressure (kPa), and ea is the observed vapor pressure (kPa).
2.2.2. Reconnaissance Drought Index (RDI)
The ratio of precipitation to potential evapotranspiration for a certain period can be used to reflect the climatic moisture deficiency. On this basis, Tsakiris et al. [16] constructed the reconnaissance drought index (RDI) using the ratio (ai) of precipitation and potential evapotranspiration for different time periods. First, ai is calculated using the equation:
where Pj and PETj are, respectively, precipitation and potential evapotranspiration for the jth month; i is the starting month, and ts is the aggregation time step.
Second, the gamma distribution is fitted to the time series of ai. The probability density function g(x) and the cumulative distribution function G(x) are calculated by the equations:
where x is the value of ai; α and β are shape and scale parameters, respectively, which are derived by maximum likelihood estimation. The precipitation data may contain zero precipitation, in which case ai may equal zero. The gamma distribution is undefined if ai is zero. To take account of a zero value of the probability, the cumulative probability can be calculated by the equation:
where q is the probability of a zero value and q = m/M, where m represents the numbers of zeros in the data sequence and M is the length of the whole data sequence. Finally, RDI values can be obtained by transforming H(x) to the standard normal distribution:
where is the standardized normal distribution. The threshold values of RDI are shown in Table 1.
2.2.3. Drought Event Identification
We introduce run theory [47] to define the drought-related variables we require in this study. First, we identify the start and end times of the drought, which enables us to calculate the duration of the drought as the difference between the end and start times. A drought event in this study starts when the RDI is smaller than −0.5 and ends with the value larger than −0.5 (Table 1). The severity of a drought is taken to be the sum of RDI values over the whole duration of the drought. The main benefit of run theory is that it can identify the drought-related variables of a drought event based on the truncation level from the time series of RDI, followed by investigation of their statistical properties and spatial-temporal distribution characteristics. Based on these calculations, the drought frequency (DF), the total drought duration (TDD), and the total drought severity (TDS) were calculated for each station for every year between 1970 and 2014. The drought-related variables of droughts occurring between 2010 and 2014 were also calculated.
In this study, the Kruskal–Wallis test [48] is used to examine if the differences in the DF, TDD, and TDM medians of respective periods are statistically significant. The Kruskal–Wallis test is a non-parametric method for comparing two or more independent samples of equal or different sample sizes. The test does not require the data to be normal, but instead uses the rank instead of the actual data values for the analysis.
2.2.4. Determining Regions with Homogeneous Precipitation and Potential Evapotranspiration Variability
Cluster analysis is widely used in climatology in order to divide a large region into homogeneous smaller regions based on various climate variables. Because there are different types of climate in the study region, we used the hierarchical clustering method to define different clusters of meteorological stations, based on annual precipitation and potential evapotranspiration. The combination of climate variables (precipitation and potential evapotranspiration) in each station is considered as a separate cluster and then clusters are compared. The clusters with the smallest between cluster dissimilarities are merged until the desired numbers of clusters is reached. Ward’s method with squared Euclidean distances measure is used to determine the clusters in this study.
2.2.5. Drought Trend Analysis and Correlation with Atmospheric Circulation
The Mann-Kendall (MK) test is carried out in this study for drought trend analysis. The advantage of the MK test is that the data series is not required to fit any particular sample distribution and the sample data are serially independent. Nonparametric MK has been widely used for climate trend analysis. The MK equation is:
where sign is the sign function, and is:
where n represents the number of data points, ei is the number of ties for the i tied value and m is the total number of tied values. The test statistic Z can be calculated by:
A positive or negative value of Z represents an increasing or a decreasing trend. If the Z-statistic reaches a value of 1.65, 1.96, or 2.58, then the trend passes the significant test at the 90%, 95%, or 99% significance level, respectively.
The coefficients of correlation between RDI and the atmospheric circulation index are calculated using the Spearman rank–order method. A relationship is considered to exist if the correlation coefficients are significant at the 95% level.
3. Results
3.1. Trends in DF, TDD, and TDS
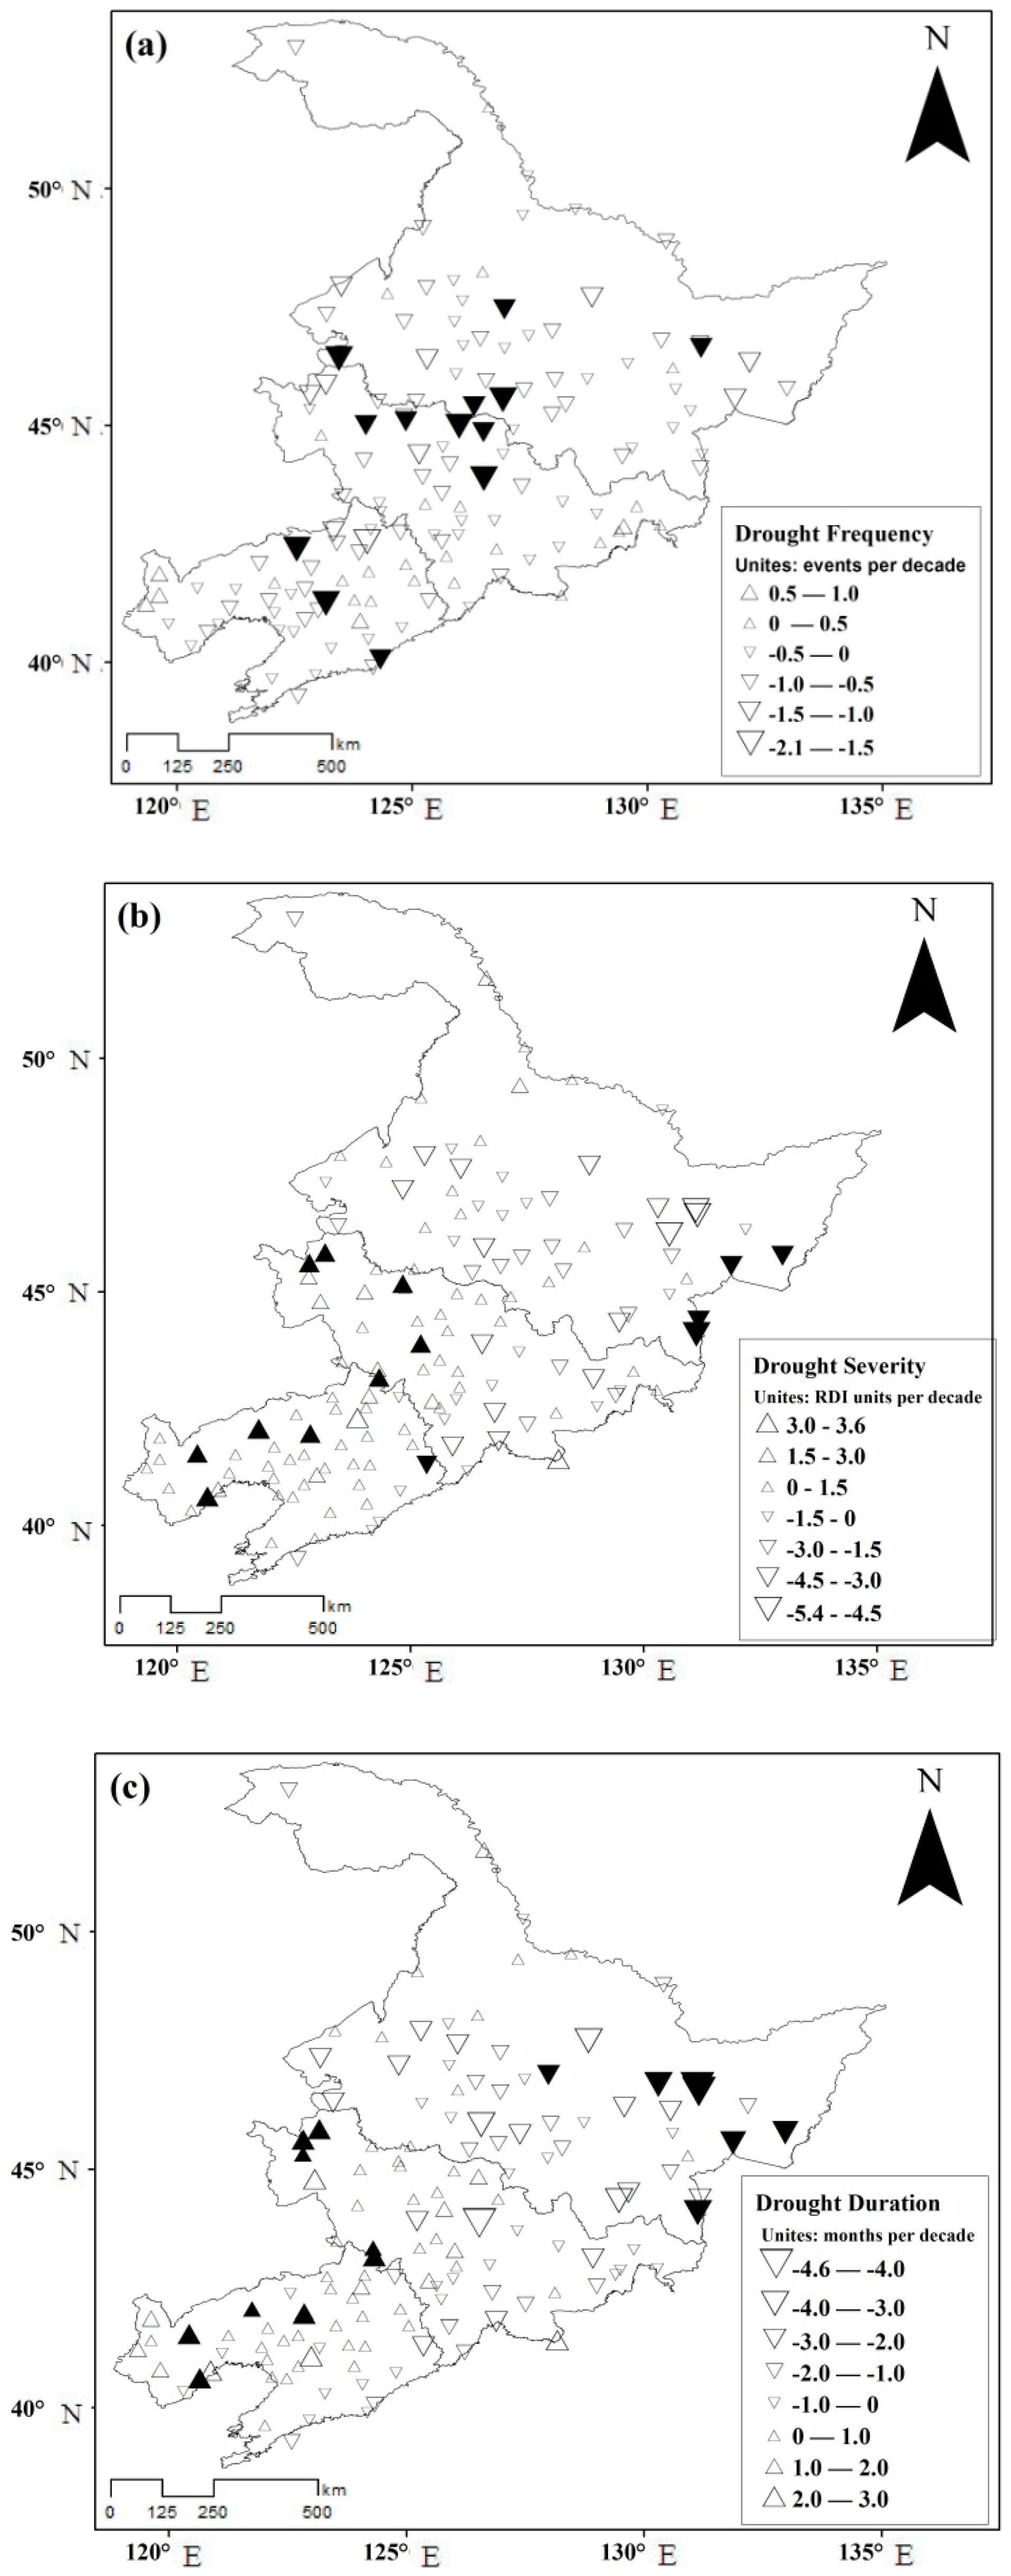
Drought frequency (DF) in Northeast China shows a slight downward trend (Figure 2a), but occurrences are spatially disparate and largely not statistically significant at the 95% level (113 of 140 stations). The lack of significance indicates that the DF trend fluctuated. There is some spatial inconsistency in the study region, where DF varied differently. The DF on the borders of Jilin and Heilongjiang provinces and three stations in Liaoning province shows a decreasing trend that is significant at the 95% level. The increasing DF trends are mainly in Jilin and Liaoning provinces and three meteorological stations in central Heilongjiang province, but these were not statistically significant at the 95% level.
Figure 2b,c show that the trends in total drought duration (TDD) and those in total drought severity (TDS) are similar, but they are different to the trends in DF. Increasing trends can be found in the western and southeastern parts of the study area. Compared to southeastern region, the western region has a stronger increasing trend.
A significant increasing trend can be identified in the nine stations in the western region, while the increasing trend in the southeastern region is not statistically significant. TDD and TDS both showed decreasing trends in northeast northern region; those that were statistically significant at the 95% level were mainly located in the eastern part of Heilongjiang province. On the whole, the trends of TDD and TDM in Northeast China over the last 45 years have been decreasing in the northern region but increasing in both western and southeastern regions.
We found both similarities and differences in drought patterns when we compared our results with those of previous study [49]. Yang et al. [49] found that the droughts in the northeast region are more severe than in the northwest and northeast of Northeast China. However, in contrast to other research, our results show largely nonsignificant trends for DF, TDD and TDS. Spatial analysis also suggest that droughts are less frequent in the study region but with greater severity and duration, mainly in the western and southeastern parts of the study area. The differences may be because the drought index (SPI) used by Yang et al. [49] cannot reflect the effect of temperature on drought. The SPI is based only on precipitation and cannot reflect the effect of temperature change on drought condition, whereas the RDI incorporates the two most important drought influencing factors, precipitation and evapotranspiration, at the same time. In addition, RDI is more representative of the deficient water balance conditions than SPI [50].
3.2. Difference in DF, TDD, and TDS Medians
In order to further analyze the changing trends in drought duration and severity, the 45-year data were partitioned into three periods. DF, TDD, and TDS medians for the periods 1970–1984, 1985–1999 and 2000–2014 are shown in Table 2, and the trend is compared by the Kruskal–Wallis test. Over the three periods, DF values show a small decreasing trend which is not significant at the 95% level but is significant at the 90% level. The 1985–1999 TDD and TDS medians are smaller than those for 1970–1984, but the 2000–2014 TDD and TDS medians are larger than those for 1985–1999. The TDD and TDS medians for 2000–2014 are similar to those for 1970–1984. The differences are not significant at the 95% level but are significant at the 90% level.
The above results show that droughts have been less frequent, longer and more severe since the 21st century. To further analyze the changing trends, the medians of DF, TDD, and TDS for every five years were calculated and compared using the Kruskal-Wallis test. The p value in Table 3 shows that there is no significant difference in drought frequency during the last 45 years. In the case of TDD and TDS, the medians during the two subdivisions of the 1975–1979 and 2005–2009 periods are greater than those for other periods and the differences are significant at the 90% level. It is worth noting that the DF, TDD and TDS median values in the 2010–2014 periods are smaller than those for the previous periods. Liu et al. [51] pointed out that increases occurred in the occurrence of the Warm-Humid climate type in the Northeast region in the 21th Century, and positive precipitation anomalies were observed in the Northeast region after 2010. The increase in precipitation could be the reason for the decrease of the DF, TDD and TDS median values during 2010–2014.
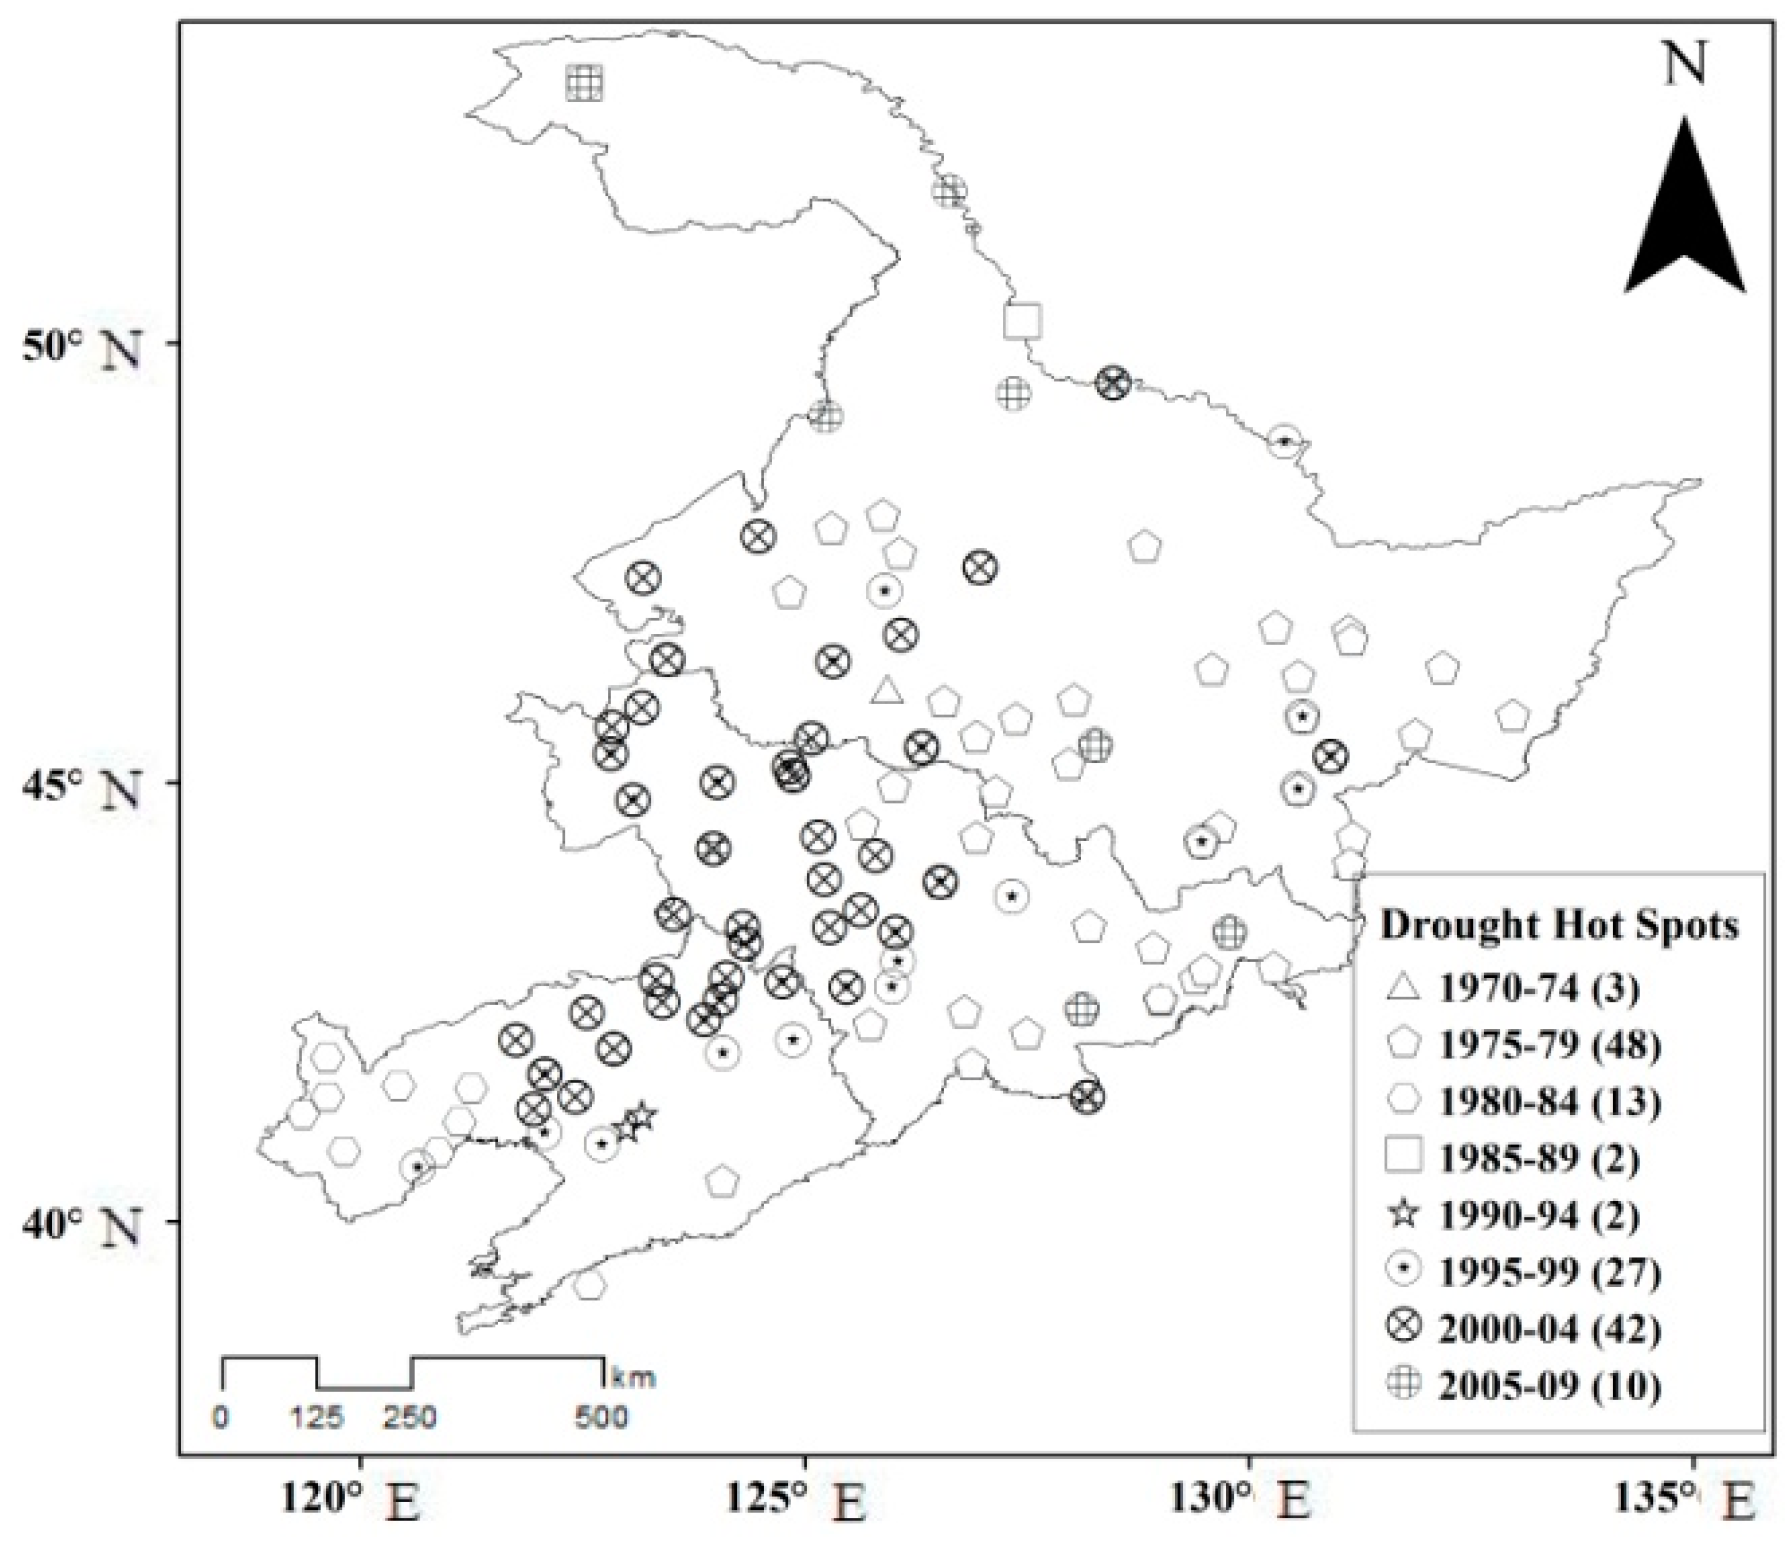
In order to display the occurrence of severe droughts in different five-year periods, drought hot spots are calculated and presented in the following figure (Figure 3). These hot spots are locations where TDS per the 5-year period is ≥30.50 (the 90th percentile for the whole region and period). As discussed above, TDS values for the 1975–1979 and 2000–2004 periods dominate. Most of the hot spots during the two phases are located in the western part of Northeast China. There are no drought hot spots during 2010 and 2014.
3.3. Homogeneous Regions of Precipitation and ET0 Variability and Association with Atmospheric Circulation
The hierarchical cluster analysis is applied to divide the study region into three subdivisions based on annual precipitation and potential evapotranspiration. These three subdivisions are the northeastern area of Northeast China (R1), the western area (R2), and the southeastern area (R3). The areas are shown in Figure 4. We now consider the results of the cluster analysis and monthly RDI values and four atmospheric circulation indices with different time lags (lag-0, lag-1, lag-2).
Examination of the coefficients of correlation between the four circulation indices reveals the different relationships between the different atmospheric circulations (Table 4). The results show that there is a nonsignificant negative correlation between POL and PDO. There are significant positive correlations between POL and IAZC, PDO and IEAT at the 99% significance level. The POL showed a significant positive correlation to IEAT at the 95% significance level. Significant negative correlations at the 95% significance level were observed among PDO and IAZC, IAZC and IEAT.
Examination of the coefficients of correlation between the lag-0 monthly RDI values in region R1 and the circulation indices reveals the different relationships between droughts and atmospheric circulation (Table 5). The results show that there is a significant negative correlation between RDI and both IEAT (East Asian trough position index) and POL (Polar-Eurasia pattern) at the 99% significance level. There is also a significant positive correlation between RDI and PDO (Pacific decadal oscillation index) at the 95% significance level. When RDI values are lagged by one month (lag-1), there is a weaker relationship between RDI and POL but a positive correlation between RDI and PDO at the 99% significance level. When RDI values are lagged by two months (lag-2), the results show a negative correlation between RDI and IAZC (Asian zonal circulation index), and between RDI and IEAT at the 95% significance level, and a negative correlation between RDI and POL at the 99% significance level. There is a positive correlation between RDI and PDO at 95% significance level.
In region R2, the lag-0 relationships between RDI and the circulation indices show a negative correlation between RDI and IAZC and a negative correlation between RDI and POL, both significant at the 95% significance level, and a negative correlation between RDI and IEAT at the 99% significance level. When RDI is lagged by one month, there is a stronger correlation between RDI and POL, which is statistically significant at the 95% level. When RDI is lagged by two months (lag-2), there is a negative correlation between RDI and IEAT and between RDI and POL, both of which are significant at the 95% significance level. The correlation between RDI and PDO is not significant. The droughts in region R2 are little affected by PDO compared with those in region R1.
The results of the analysis of the lag-0 correlation between RDI in region R3 and the circulation indices show there is no statistically significant relationship between droughts and atmospheric circulation; only the coefficient of correlation between POL and RDI is statistically significant at the 95% level. Analysis of the lag-1 relationship between RDI in region R3 and the circulation indices and of the lag-2 relationship between RDI in region R3 and the circulation indices gives results similar to those for regions R1 and R2; the only difference is that the coefficient of correlation for region R3 region is not statistically significant.
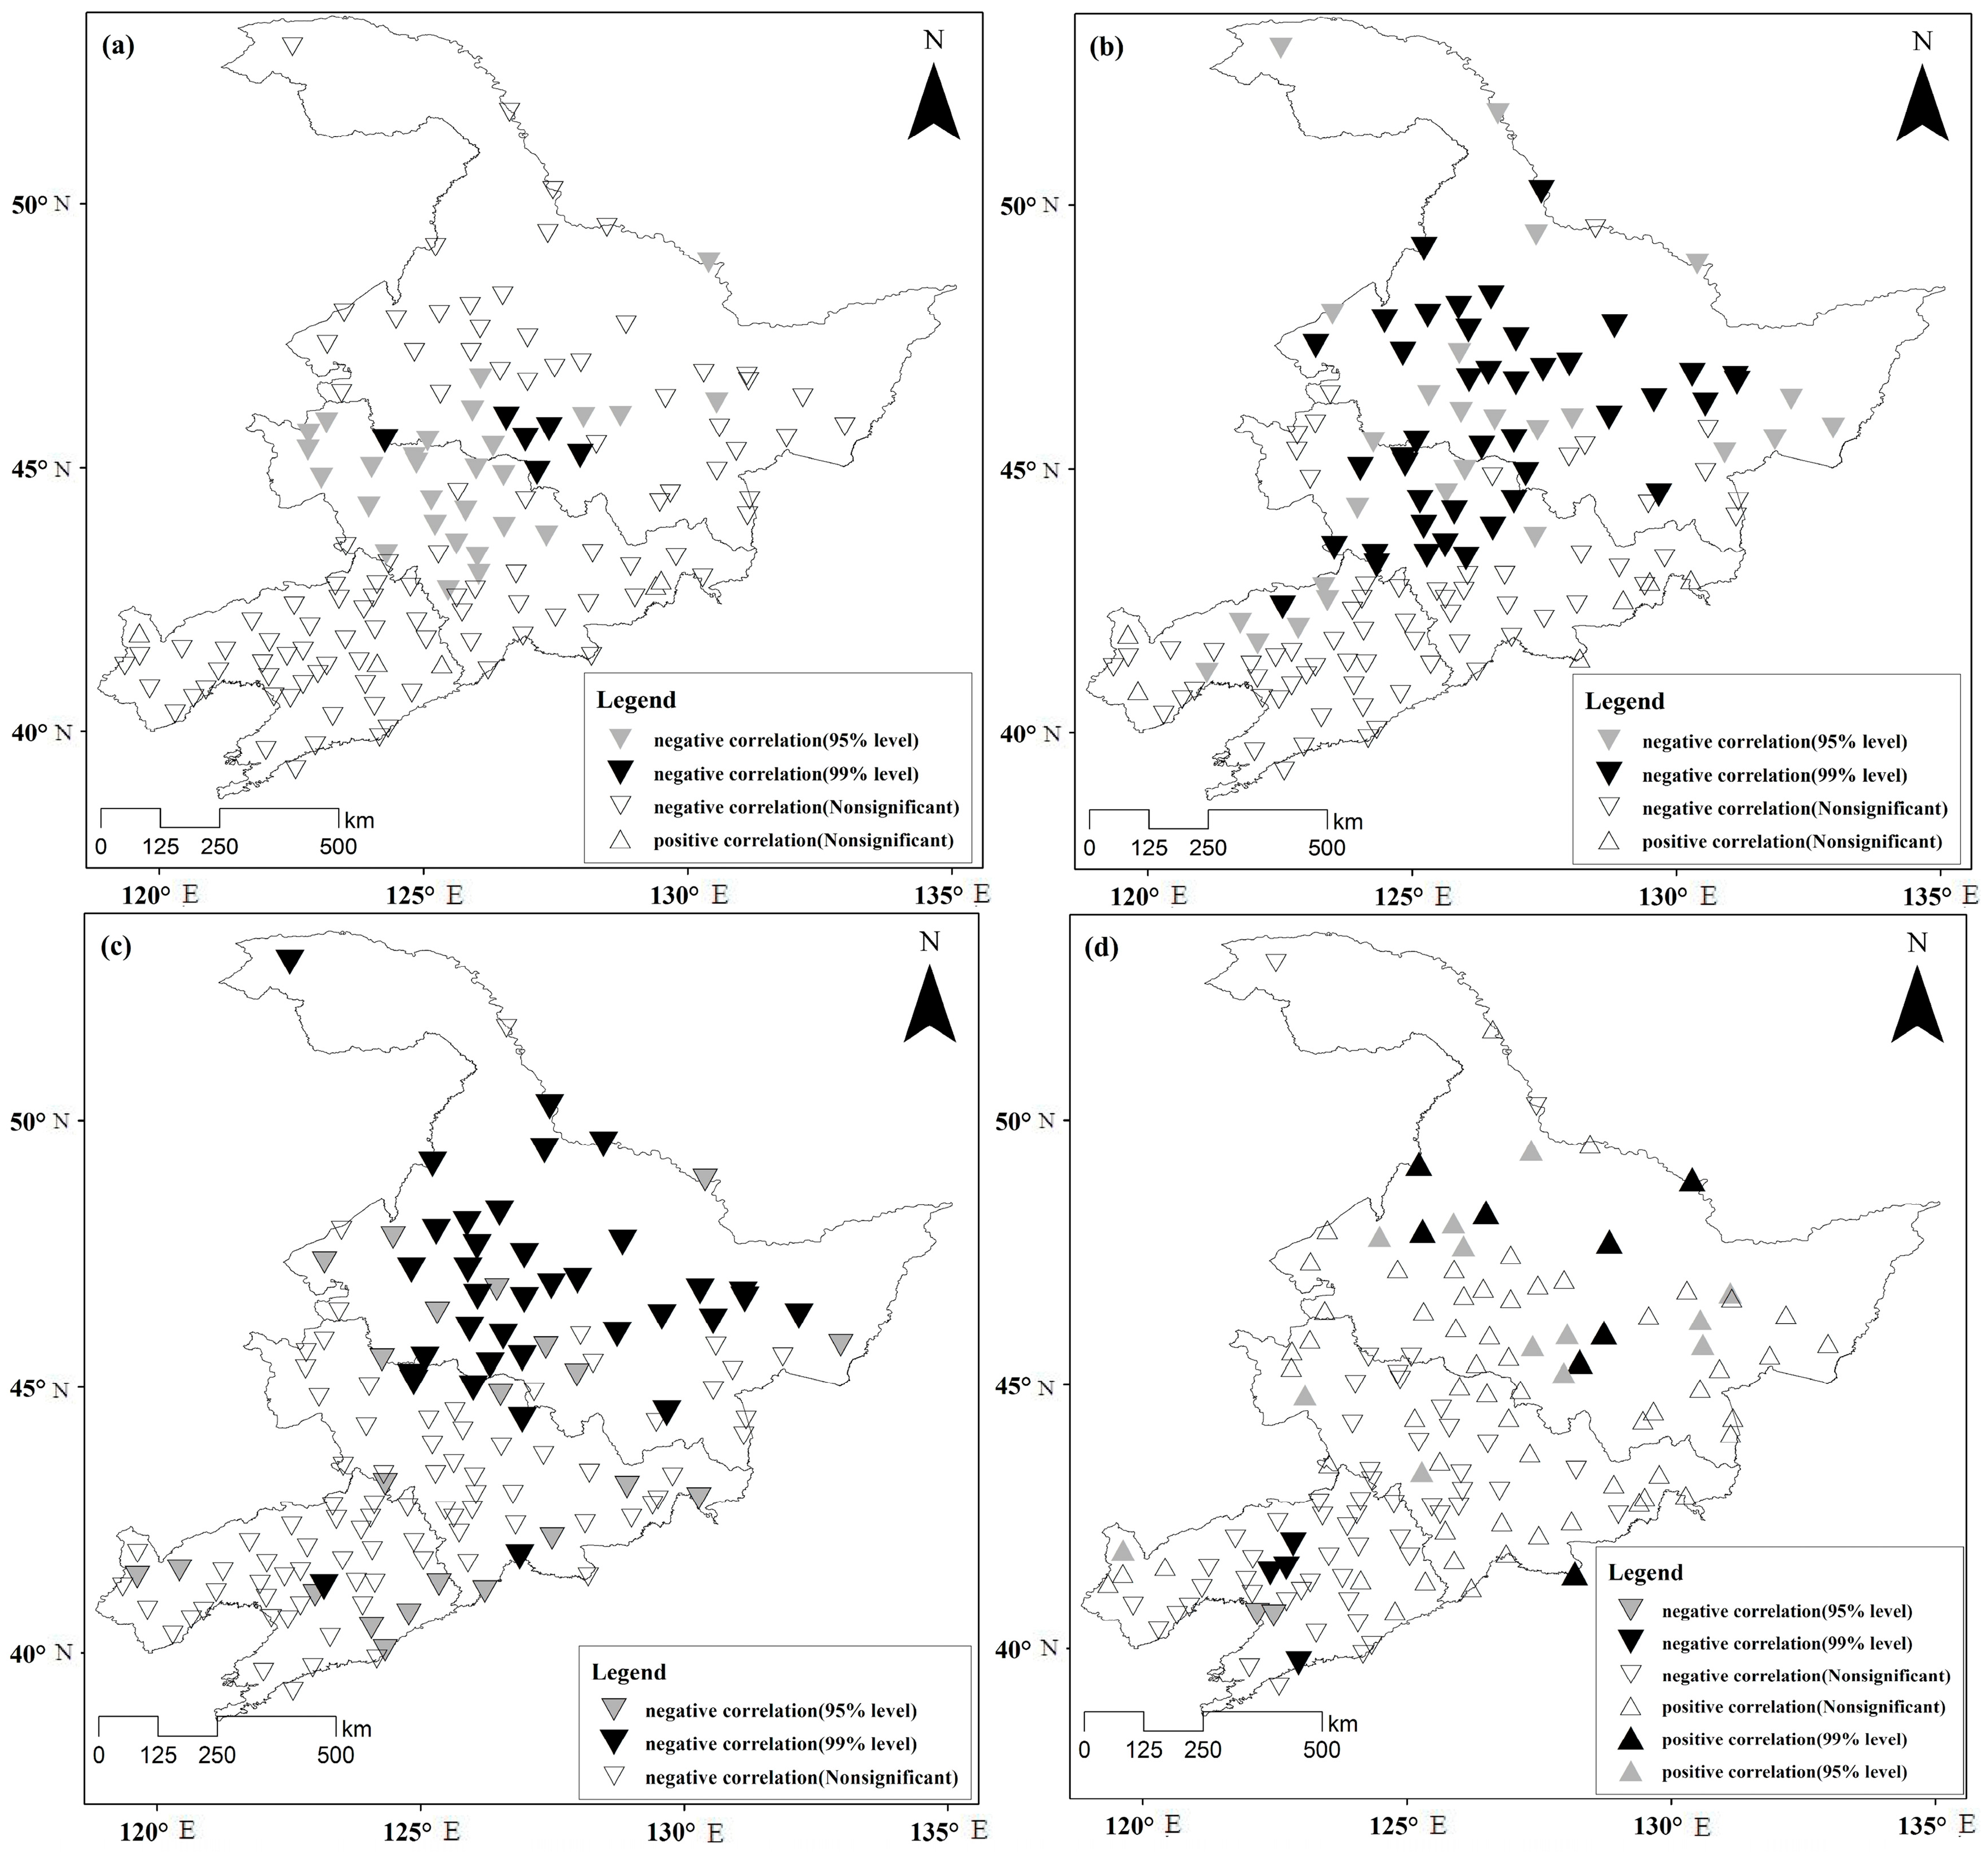
There are differences in the spatial distributions of the coefficients of correlation between lag-0 RDI and the circulation indices, as is shown in Figure 5. The coefficients of correlation between lag-0 RDI and the index IAZC (Figure 5a) are mostly negative. Of the meteorological stations, 34 (24.2% of the total) had RDI values that were negative, with significance at the 95% level or the 99% level. They are located mainly in region R2, and they are widely distributed in the western and central parts of Jilin province and the Songnen Plain in Heilongjiang province. Individual stations in the R3 region had RDI values that were positively correlated with the atmospheric indices, but the correlations were not statistically significant.
The coefficients of correlation between lag-0 RDI and the index IEAT (Figure 5b) are mainly negative throughout the whole study region except for some individual stations located in the Changbai Mountain district in region R1. The coefficient of correlation between lag-0 RDI and the index IEAT is negative for 68 stations (48.6% of the total), which is statistically significant at the 95% or the 99% level. These stations are mainly in regions R1 and R2 and are distributed over the western part of Northeast China.
The coefficients of correlation between lag-0 RDI and POL (Figure 5c) are negative over the whole study region. The correlations are statistically significant at the 95% level or the 99% level for 58 stations (41.4% of the total). These stations are mainly distributed over the northern part of the study area, in regions R1 and R2.
The coefficients of correlation between lag-0 RDI and PDO (Figure 5d) are positive in most parts of the study area. The correlations are statistically significant at the 95% level or the 99% level for 21 stations (15.0% of the total). These stations are mainly distributed in the northern part of the study area in region R1. The coefficients of correlation between lag-0 RDI and PDO are negative for stations in region R2, and for 6 of these, the correlation is statistically significant.
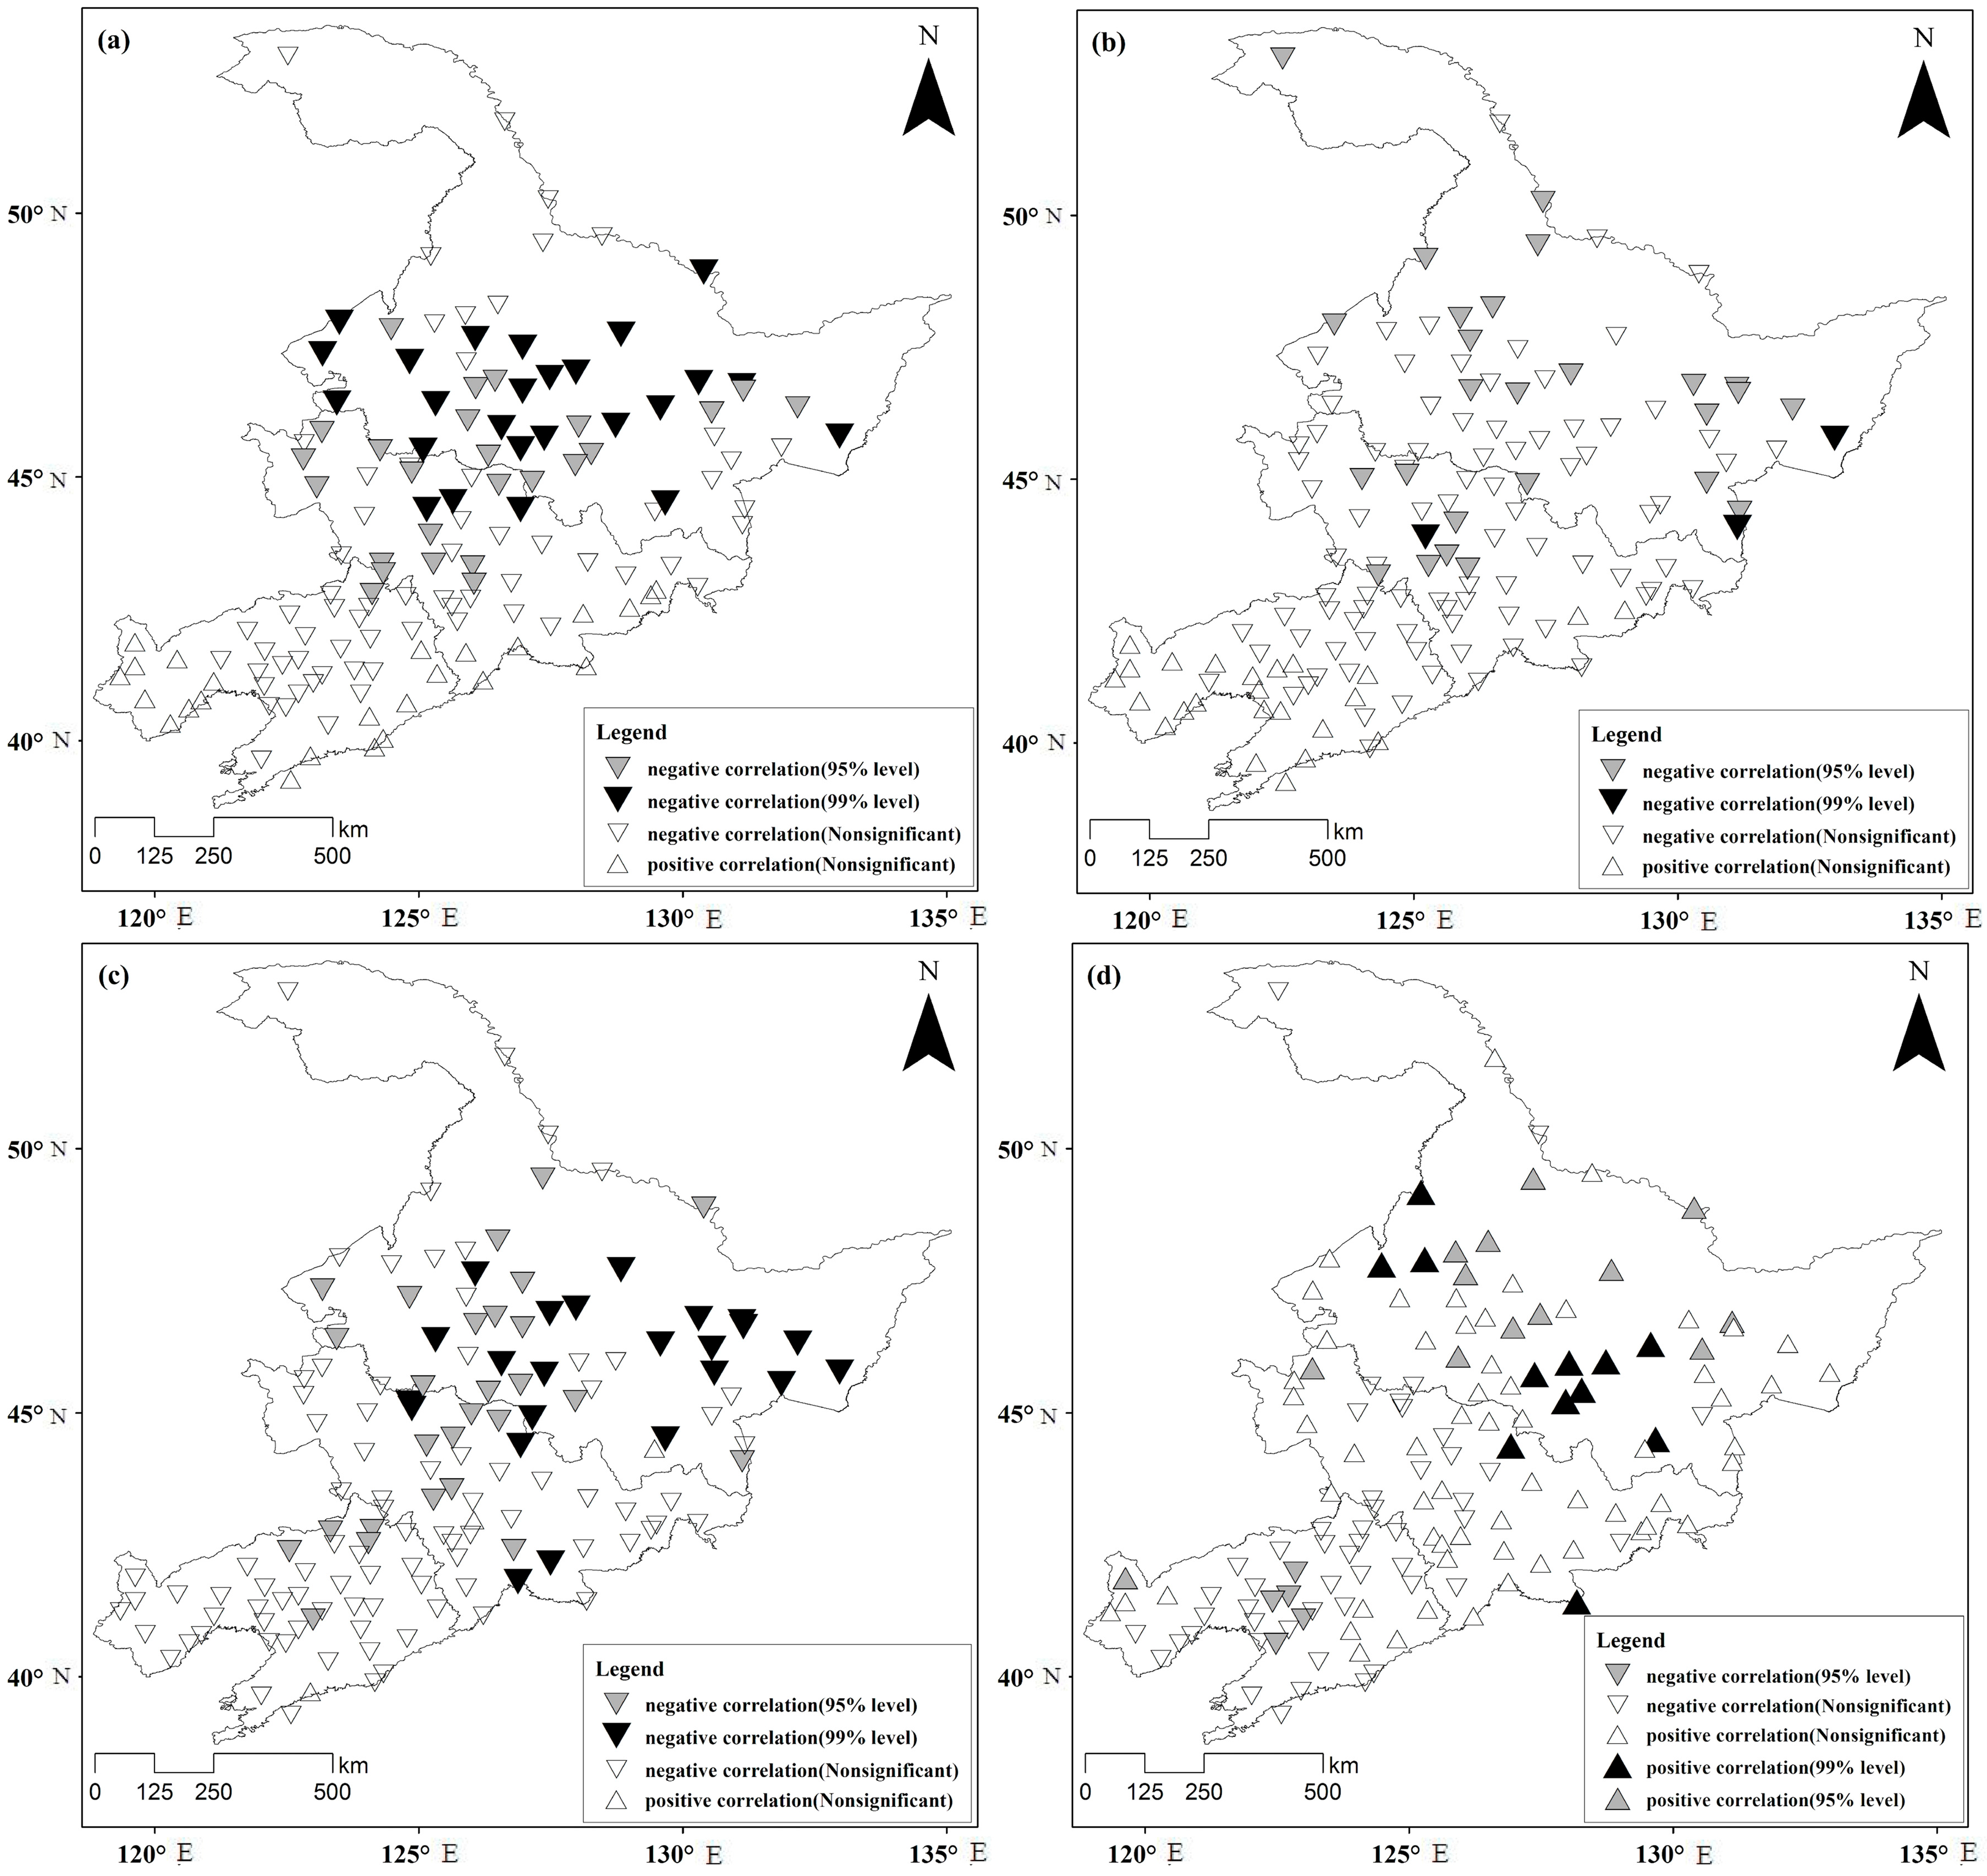
The distributions of the values of the coefficients of correlation between lag-1 RDI and the four circulation indices (Figure 6) are similar to those found in the distributions of the values of the coefficients of correlation between lag-0 RDI and the various atmospheric indices. The negative correlations between lag-1 RDI and IAZC and between lag-1RDI and IEAT are weaker, but the areas affected by these relationships are smaller. The degree of correlation between lag-1 RDI and POL and the area influenced by it are similar to those of the correlation between lag-0 RDI and POL. RDI is more strongly correlated with POL than it is with other atmospheric circulation indices. The correlation between lag-1 RDI and PDO shows an increasing trend, and the area over which lag-1 RDI and PDO are significantly correlated is larger than that for lag-0 RDI and PDO.
The distribution of the values of the coefficients of correlation between lag-2 RDI and the four circulation indices is shown in Figure 7. The degree of correlation between lag-2 RDI and IAZC, and the area influenced by it, are both greater than those compared to lag-1 RDI. The correlations between lag-2 RDI and the other three atmospheric circulation indices are similar to those found for lag-1 and lag-0 RDI. Stations for which the correlation is statistically significant are found mainly in regions R1 and R2. Lag-2 RDI is more strongly correlated with POL than it is with other indices.
4. Summary of Findings
We used the reconnaissance drought index (RDI on a 3-month scale) to explore the trends of drought frequency, duration and severity over the period 1970–2014 using data from 140 meteorological stations in Northeast China. We analyzed the relationships between RDI and certain climatological indices, the Asian zonal circulation index (IAZC), the East Asian trough position index (IEAT), the Polar-Eurasia pattern (POL), and the Pacific decadal oscillation index (PDO).
Based on the analysis of correlations between RDI values for particular stations and the circulation indices, we found a negative correlation between RDI and IAZC. IAZC is an indicator of variation in zonal circulation. At high values of IAZC, the zonal circulation prevails over the whole of Asia and cold air is confined to the polar region. The cold air is inactive and cannot spill southward. In response to this, precipitation is reduced in Northeast China, and the region is more vulnerable to drought. The RDI value is relatively small. When IAZC is small, the meridional circulation over Asia intensifies. It is conducive to cold air and warm air intermingling, which results in precipitation, and RDI becomes relatively large. Analysis of the spatial distribution showed that the stations having a statistically significant correlation are located between 43° N and 50° N, and 122° E and 133° E. Wang and Fan [52] reported that when the zonal circulation weakened, an anticyclonic wind dominated the Arctic basin to the East at 850 hPa, the north wind from the Arctic through Eastern Siberia southward to 45° N (between 110° E and 120° E), and the southwest wind on the East, resulting an increase trend in precipitation in Northeast China. Xu et al. [53] indicated that an anomalous zonal circulation led to a weak summer monsoon, resulting in the severe drought over northeast Asia in summer 2014. Rimkus et al. [54] reported that the general dry periods were determined by a decrease in zonal circulation and an increase in meridional circulation. These results are consistent with our findings, showing that there is a strong relationship between Asian zonal circulation and drought variation.
The coefficient of correlation between RDI and IEAT is negative. The value of IEAT represents the average meridional position of a trough line. A small value of IEAT means that the East Asian trough extends westward. This trough position places most of Northeast China in front of the trough, resulting in the area being subject to increased precipitation and thus lower incidence of drought. Other research [55] indicates that the IEAT can have an abnormally high value of 500 hPa north of 40° N but also be unusually low south of that latitude. The results of our analysis (Figure 5b, Figure 6b and Figure 7b) support this finding; significant negative correlations were found in areas north of 40° N. Sun et al. [56] indicated that the East Asian trough could influence the precipitation in China, leading to insufficient precipitation and causing drought. Consistency in the results of previous studies with our results strengthens the credibility of the impact of East Asian trough on the drought.
The correlation between RDI and POL is negative. The positive phase of POL activity consists of negative height anomalies over the polar region and positive height anomalies over northern China and Mongolia. POL is associated with fluctuations in the strength of circumpolar circulation, with the positive phase reflecting an enhanced circumpolar vortex and the negative phase reflecting a weaker than average polar vortex. With positive POL, an enhanced circumpolar vortex will not allow the cold air to spill southward, giving a positive height anomaly over northern China. Either of these conditions will reduce precipitation and increase the risk of drought in Northeast China. The number of stations that showed a significant correlation between RDI and POL at different time lags (lag-1, lag-2) is greatest in this area (Figure 6c and Figure 7c). The delayed effect of POL activity is greater than for the other circulation indices, especially in regions R1 and R2 (Table 5). Gao et al. [57] examined the relationship between the POL pattern and the atmospheric circulation conditions over Asia. The results show that the POL pattern exerts a considerable influence on the westerlies and the persistent vortex over Asia in summer, which could further result in precipitation anomalies over this area. Ying et al. [58] also suggested the POL pattern is strongly related to the precipitation in Northeast China by analysis the covariance of the anomalous atmospheric circulations associated with the predictable precipitation modes. The previous findings give further support to our findings.
We found a positive correlation between RDI and PDO in region R1 and a negative correlation between RDI and PDO in region R2. PDO activity mainly affects region R1. Other research [59,60] (Ouyang et al., 2014; Yang et al., 2016) suggests that the different phases of the Pacific decadal oscillation have different effects on regional temperatures and precipitation in China: the warm phase of PDO corresponds to high temperature and low precipitation in most parts of northern China, while the cold phase results in the opposite. Other studies [38,61] (Ma and Shao 2006; Ma 2007) show that change in PDO has little effect on drought in Northeast China. Our results also show that PDO has little influence on RDI in Northeast region.
The correlation between RDI and POL shows that it represents the strongest relationship between RDI and the atmospheric circulation indices, followed by IAZC, IEAT and PDO (Table 5). Thus, POL can be considered as a major driver of drought. However, drought in the study region is strongly correlated with polar circulation. When the cold air in the polar region is active, the study area can be affected by cold air coming down from the polar region which causes lower temperatures and a resultant decrease in ET0. As cold air spills southward, warm and cold drafts meet and increase precipitation, thus reducing the risk of drought.
5. Conclusions
We calculated the 3-month RDI time series using monthly precipitation and potential evapotranspiration data from 140 meteorological stations in Northeast China covering the period from 1970 to 2014. We used run theory to identify the characteristics and trends of droughts, including frequency, severity, and duration. We identified drought hot spots using the percentile threshold method. We calculated coefficients of correlation between RDI and four circulation indices to identify climate drivers.
From our analysis, we draw the following conclusions. First, there are generally slight downward trends in drought frequency (DF), total drought duration (TDD), and total drought severity (TDS) in Northeast China which are not statistically significant. Spatial analysis indicates that droughts in the study area are less frequent, but have greater severity and duration, mainly in the western and southeastern part. Second, intense droughts for the periods 1975–1979 and 2000–2004 dominated, and drought hot spots mainly occur in the western part of the study area. Third, the correlations between RDI and POL, IAZC, IEAT are negative, but the correlation between RDI and PDO is positive. The relationship between RDI and POL is, therefore, stronger than the rest, and the delayed effect is particularly noticeable. Therefore, POL index was the major driver of droughts over the period 1970–2014 in Northeast China.
Our results provide valuable information for understanding how drought characteristics vary and thus can supply a reference framework to guide agricultural production. In addition, we can use the finding of the delay in the effect of circulation indices on the drought index to make better predictions of future droughts using machine learning methods such as Support Vector Regression.
Acknowledgments
This research was supported by the China Special Fund for Meteorological Research in the Public Interest (No. GYHY201506001).
Author Contributions
Shuang-he Shen supervised the research. Yuan Yue analyzed the data, conceived, designed, and performed the research. Qi Wang proposed some constructive suggestions about the methods.
Conflicts of Interest
The authors declare no conflict of interest.
References
- Gillette, H.P. A Creeping Drought under Way. Water Sew. Works 1950, March, 104–105. [Google Scholar]
- IPCC. Working Group I Contribution to the IPCC Fifth Assessment Report, Climate Change 2013: The Physical Science Basis: Summary for Policymakers. 2013. Available online: http://www. Climatechange2013.org/images/report/WG1AR5_SPM_FINAL.pdf (accessed on 28 October 2013).
- Dai, A. Drought under global warming: A review. Wiley Interdiscip. Rev. Clim. Chang. 2011, 2, 45–65. [Google Scholar] [CrossRef]
- Mishra, A.K.; Singh, V.P. A review of drought concepts. J. Hydrol. 2010, 391, 204–216. [Google Scholar] [CrossRef]
- Mishra, A.K.; Singh, V.P. Drought modeling: A review. J. Hydrol. 2011, 403, 157–175. [Google Scholar] [CrossRef]
- Wang, Q.F.; Wu, J.J.F.; Lei, T.J.; He, B.; Wu, Z.T.; Liu, M.; Mo, X.Y.; Geng, G.P.; Li, X.H.; Zhou, H.K.; et al. Temporal-spatial characteristics of severe drought events and their impact on agriculture on a global scale. Quat. Int. 2014, 349, 10–21. [Google Scholar] [CrossRef]
- Palmer, W.C. Meteorologic Drought; Research Paper No. 45; US Department of Commerce, Weather Bureau: Washington, DC, USA, 1965; p. 58.
- McKee, T.B.; Doesken, N.J.; Kleist, J. The relationship of drought frequency and duration to time scale. In Proceedings of the Eighth Conference on Applied Climatology, Anaheim, CA, USA, 17–22 January 1993; AMS: Providence, RI, USA, 1993; pp. 179–184. [Google Scholar]
- Tsakiris, G. Meteorological Drought Assessment. In Proceedings of the European Research Program MEDROPLAN (Mediterranean Drought Preparedness and Mitigation Planning), Zaragoza, Spain, 2 April 2004. [Google Scholar]
- Vicente-Serrano, S.M.; Begueria, S.; Lopez-Moreno, J.I. A Multiscalar Drought Index Sensitive to Global Warming: The Standardized Precipitation Evapotranspiration Index. J. Clim. 2010, 23, 1696–1718. [Google Scholar] [CrossRef] [Green Version]
- Taylor, C.M.; de Jeu, R.A.; Guichard, F.; Harris, P.P.; Dorigo, W.A. Afternoon rain more likely over drier soils. Nature 2012, 489, 423–426. [Google Scholar] [CrossRef] [PubMed] [Green Version]
- Teuling, A.J.; van Loon, A.F.; Seneviratne, S.I.; Lehner, I.; Aubinet, M.; Heinesch, B.; Bernhofer, C.; Grunwald, T.; Prasse, H.; Spank, U. Evapotranspiration amplifies European summer drought. Geophys. Res. Lett. 2013, 40, 2071–2075. [Google Scholar] [CrossRef]
- Anli, A.S. Temporal Variation of Reference Evapotranspiration (ET0) in Southeastern Anatolia Region and Meteorological Drought Analysis through RDI (Reconnaissance Drought Index) Method. Tarim Bilim Derg. 2014, 20, 248–260. [Google Scholar] [CrossRef]
- Abdol, R.Z.; Mohammad, M.M.; Mohammad, R.M. Analysis of Changes in Spatial Pattern of Drought Using RDI Index in south of Iran. Water Resour. Manag. 2016, 30, 3723–3743. [Google Scholar] [CrossRef]
- Kopsiaftis, G.; Tigkas, D.; Christelis, V.; Vangelis, H. Assessment of drought impacts on semi-arid coastal aquifers of the Mediterranean. J. Arid Environ. 2017, 137, 7–15. [Google Scholar] [CrossRef]
- Tsakiris, G.; Pangalou, D.; Vangelis, H. Regional drought assessment based on the reconnaissance drought index (RDI). Water Resour. Manag. 2007, 21, 821–833. [Google Scholar] [CrossRef]
- Khan, M.I.; Liu, D.; Fu, Q.; Saddique, Q.; Faiz, M.A.; Li, T.X.; Uzair, M.; Cui, S.; Cheng, C. Projected Changes of Future Extreme Drought Events under Numerous Drought Indices in the Heilongjiang Province of China. Water Resour. Manag. 2017, 31, 3921–3937. [Google Scholar] [CrossRef]
- Liu, S.H.; Yan, D.H.; Wang, H.; Li, C.Z.; Weng, B.S.; Qin, T.L. Standardized Water Budget Index and Validation in Drought Estimation of Haihe River Basin, North China. Adv. Meteorol. 2016, 2016, 1–10. [Google Scholar] [CrossRef]
- Khan, M.I.; Liu, D.; Fu, Q.; Dong, S.H.; Liaqat, U.W.; Faiz, A.M.; Hu, Y.X.; Saddique, Q. Recent Climate Trends and Drought Behavioral Assessment Based on Precipitation and Temperature Data Series in the Songhua River Basin of China. Water Resour. Manag. 2016, 30, 4839–4859. [Google Scholar] [CrossRef]
- Xu, K.; Yang, D.W.; Yang, H.B.; Li, Z.; Qin, Y.; Shen, Y. Spatio-temporal variation of drought in China during 1961–2012: A climatic perspective. J. Hydrol. 2015, 526, 253–264. [Google Scholar] [CrossRef]
- Zarch, M.A.A.; Malekinezhad, H.; Mobin, M.H.; Dastorani, M.T.; Kousari, M.R. Drought Monitoring by Reconnaissance Drought Index (RDI) in Iran. Water Resour. Manag. 2011, 25, 3485–3504. [Google Scholar] [CrossRef]
- Zou, X.; Zhai, P.; Zhang, Q. Variations in droughts over China: 1951–2003. Geophys. Res. Lett. 2005, 32, 353–368. [Google Scholar] [CrossRef]
- Xin, X.; Yu, R.; Zhou, T.; Wang, B. Drought in late spring of south China in recent decades. J. Clim. 2006, 19, 3197–3206. [Google Scholar] [CrossRef]
- Lu, E.; Luo, Y.; Zhang, R.; Wu, Q.; Liu, L. Regional atmospheric anomalies responsible for the 2009–2010 severe drought in China. J. Geophys. Res. 2011, 116, 2145–2159. [Google Scholar] [CrossRef]
- Yan, Z.W.; Xia, J.J.; Qian, C.; Zhou, W. Changes in seasonal cycle and extremes in China during the period 1960–2008. Adv. Atmos. Sci. 2011, 28, 269–283. [Google Scholar] [CrossRef]
- Yang, J.; Gong, D.; Wang, W.; Hu, M.; Mao, R. Extreme drought event of 2009/2010 over southwestern China. Meteorol. Atmos. Phys. 2012, 115, 173–184. [Google Scholar] [CrossRef]
- Sun, J.Q. Record-breaking SST over mid-North Atlantic and extreme high temperature over the Jianghuai–Jiangnan region of China in 2013. Chin. Sci. Bull. 2014, 59, 3465–3470. [Google Scholar] [CrossRef]
- Li, J.; Cook, E.R.; D’arrigo, R.; Chen, F.; Gou, X.H. Moisture variability across China and Mongolia: 1951–2005. Clim. Dyn. 2009, 32, 1173–1186. [Google Scholar] [CrossRef]
- Yu, M.; Li, Q.; Hayes, M.J.; Svoboda, M.D.; Heim, R.R. Are droughts becoming more frequent or severe in China based on the standardized precipitation evapotranspiration index: 1951–2010? Int. J. Climatol. 2014, 34, 545–558. [Google Scholar] [CrossRef]
- Chen, H.P.; Sun, J.Q. Changes in Drought Characteristics over China Using the Standardized Precipitation Evapotranspiration Index. J. Clim. 2015, 28, 5430–5447. [Google Scholar] [CrossRef]
- Wang, H.J.; He, S.P. The North China/Northeastern Asia Severe Summer Drought in 2014. J. Clim. 2015, 28, 6667–6681. [Google Scholar] [CrossRef]
- Yin, Y.; Xu, Y.; Chen, Y. Relationship between flood/drought disasters and ENSO from 1857 to 2003 in the Taihu Lake basin, China. Quat. Int. 2009, 208, 93–101. [Google Scholar] [CrossRef]
- Oglesby, R.; Feng, S.; Hu, Q.; Rowe, C. The role of the Atlantic Multidecadal Oscillation on medieval drought in North America: Synthesizing results from proxy data and climate models. Glob. Planet. Chang. 2012, 84, 56–65. [Google Scholar] [CrossRef]
- Zhang, J.; Li, D.L.; Li, L.; Deng, W.T. Decadal variability of droughts and floods in the Yellow River basin during the last five centuries and relations with the North Atlantic SST. Int. J. Climatol. 2013, 33, 3217–3228. [Google Scholar] [CrossRef]
- Wang, Y.X.; Zhang, T.; Chen, X.; Li, J.; Feng, P. Spatial and temporal characteristics of droughts in Luanhe River basin, China. Theor. Appl. Climatol. 2017, 131, 1369–1385. [Google Scholar] [CrossRef]
- Deng, S.L.; Chen, T.; Yang, N.; Qu, L.A.; Li, M.C.; Chen, D. Spatial and temporal distribution of rainfall and drought characteristics across the Pearl River basin. Sci. Total Environ. 2017, 619–620, 28–41. [Google Scholar] [CrossRef] [PubMed]
- Schoennagel, T.; Veblen, T.T.; Romme, W.H.; Sibold, J.S.; Cook, E.R. ENSO and PDO variability affect drought–introduce fire coourrence in Rocky mountain subalpine forests. Ecol. Appl. 2005, 15, 2000–2014. [Google Scholar] [CrossRef]
- Ma, Z.G. The interdecadal trend and shift of dry/wet over the central part of north China and their relationship to the Pacific decadal oscillation (PDO). Chin. Sci. Bull. 2007, 52, 2130–2139. [Google Scholar] [CrossRef]
- Wang, Y.X.; Li, J.Z.; Feng, P.; Chen, F.L. Effects of large-scale climate patterns and human activities on hydrological drought: A case study in the Luanhe River basin, China. Nat. Hazards 2015, 76, 1687–1710. [Google Scholar] [CrossRef]
- Park, C.K.; Schubert, S.D. On the Nature of the 1994 East Asian Summer Drought. J. Clim. 1997, 10, 1056–1070. [Google Scholar] [CrossRef]
- Min, S.K.; Kwon, W.T.; Park, E.H.; Choi, Y.G. Spatial and temporal comparisons of droughts over Korea with East Asia. Int. J. Climatol. 2003, 23, 223–233. [Google Scholar] [CrossRef]
- Kim, S.; Park, C.K.; Kim, M.K. The regime shift of northern hemisphere circulation r responsible for the spring drought in Korea. J. Korean Meteorol. Soc. 2005, 41, 571–585. [Google Scholar]
- Wang, P.W.; Wang, G.Q.; Yang, S. An analysis of dry climatological feature in the west of Jinlin province. J. Jilin Agric. Sci. 1991, 4, 90–94. [Google Scholar]
- Zhong, C.; Jiang, B. Study on genesis and occurrence regularity of drought in Jilin Province. China Flood Drought Manag. 2013, 29–30. [Google Scholar] [CrossRef]
- Zhang, Q.; Lu, W.X.; Chen, S.M.; Liang, X.J. Using multifractal and wavelet analyses to determine drought characteristics: A case study of Jilin province, China. Theor. Appl. Climatol. 2016, 125, 829–840. [Google Scholar] [CrossRef]
- Sun, F.F. Chinese Climate and Vernacular Dwellings. Buildings 2013, 3, 143–172. [Google Scholar] [CrossRef]
- Yevjevich, V.; Ingenieur, J. An objective approach to definitions and investigations of continental hydrologic droughts. J. Hydrol. 1969, 7, 353. [Google Scholar] [CrossRef]
- Kruskal, W.H.; Wallis, W.A. Use of ranks in onecriterion variance analysis. J. Am. Stat. Assoc. 1952, 47, 583–621. [Google Scholar] [CrossRef]
- Yang, G.Y.; Shao, W.W.; Wang, H.; Han, D.M. Drought Evolution Characteristics and Attribution Analysis in Northeast China. Procedia Eng. 2016, 154, 749–756. [Google Scholar] [CrossRef]
- Tsakiris, G.; Vangelis, H. Establishing a drought index incorporating evapotranspiration. Eur. Water 2005, 9–10, 3–11. [Google Scholar]
- Liu, J.; Du, H.B.; Wu, Z.F.; He, H.S.; Wang, L.; Zong, S.W. Recent and future changes in the combination of annual temperature and precipitation throughout China. Int. J. Climatol. 2016, 37, 821–833. [Google Scholar] [CrossRef]
- Wang, H.J.; Fan, K. Southern Hemisphere mean zonal wind in upper troposphere and East Asian summer monsoon circulation. Chin. Sci. Bull. 2006, 51, 1508–1514. [Google Scholar] [CrossRef]
- Xu, Z.Q.; Fan, K.; Wang, H.J. Role of sea surface temperature anomalies in the tropical Indo-Pacific region in the northeast Asia severe drought in summer 2014: Month-to-month perspective. Clim. Dyn. 2017, 49, 1631–1650. [Google Scholar] [CrossRef]
- Rimkus, E.; Kažys, J.; Valiukas, D.; Stankūnavičius, G. The atmospheric circulation patterns during dry periods in Lithuania. Oceanologia 2014, 56, 223–239. [Google Scholar] [CrossRef]
- Wang, L. Stationary Wave Activity Associated with the East Asian Winter Monsoon Pathway. Atmos. Ocean. Sci. Lett. 2014, 7, 7–10. [Google Scholar] [CrossRef]
- Sun, C.H.; Yang, S. Persistent severe drought in southern China during winter–spring 2011: Large-scale circulation patterns and possible impacting factors. J. Geophys. Res. 2012, 117, D10112. [Google Scholar] [CrossRef]
- Gao, T.; Yu, J.; Paek, H. Impacts of four northern-hemisphere teleconnection patterns on atmospheric circulations over Eurasia and the Pacifc. Theor. Appl. Climatol. 2016, 129, 815–831. [Google Scholar] [CrossRef]
- Ying, K.; Frederiksen, C.S.; Zhao, T.B.; Zheng, X.G.; Xiong, Z.; Yi, X.; Li, C.X. Predictable and unpredictable modes of seasonal mean precipitation over Northeast China. Clim. Dyn. 2017, 1–15. [Google Scholar] [CrossRef]
- Ouyang, R.L.; Liu, W.; Fu, G.; Liu, C.; Hu, L.; Wang, H. Linkages between ENSO/PDO signals and precipitation, streamflow in China during the last 100 years. Hydrol. Earth Syst. Sci. 2014, 11, 3651–3661. [Google Scholar] [CrossRef]
- Yang, Q.; Ma, Z.; Xu, B. Modulation of monthly precipitation patterns over East China by the Pacific Decadal Oscillation. Clim. Chang. 2016, 144, 405–417. [Google Scholar] [CrossRef]
- Ma, Z.G.; Shao, L.J. Relationship between dry /wet variation and the Pacific decade Oscillation (PDO) in northern China during the last 100 years. Chin. J. Atmos. Sci. 2006, 30, 464–474. [Google Scholar]
Figure 1.
Map of the study region and locations of meteorological stations.

Figure 2.
Linear drought trends: (a) drought frequency, (b) drought severity, (c) drought duration; a solid triangle means that the trend is significant at the 95% level.
Figure 2.
Linear drought trends: (a) drought frequency, (b) drought severity, (c) drought duration; a solid triangle means that the trend is significant at the 95% level.

Figure 3.
Drought hot spots occurrences at 5-year intervals from 1970–2014.

Figure 4.
Partitioned results of cluster analysis.
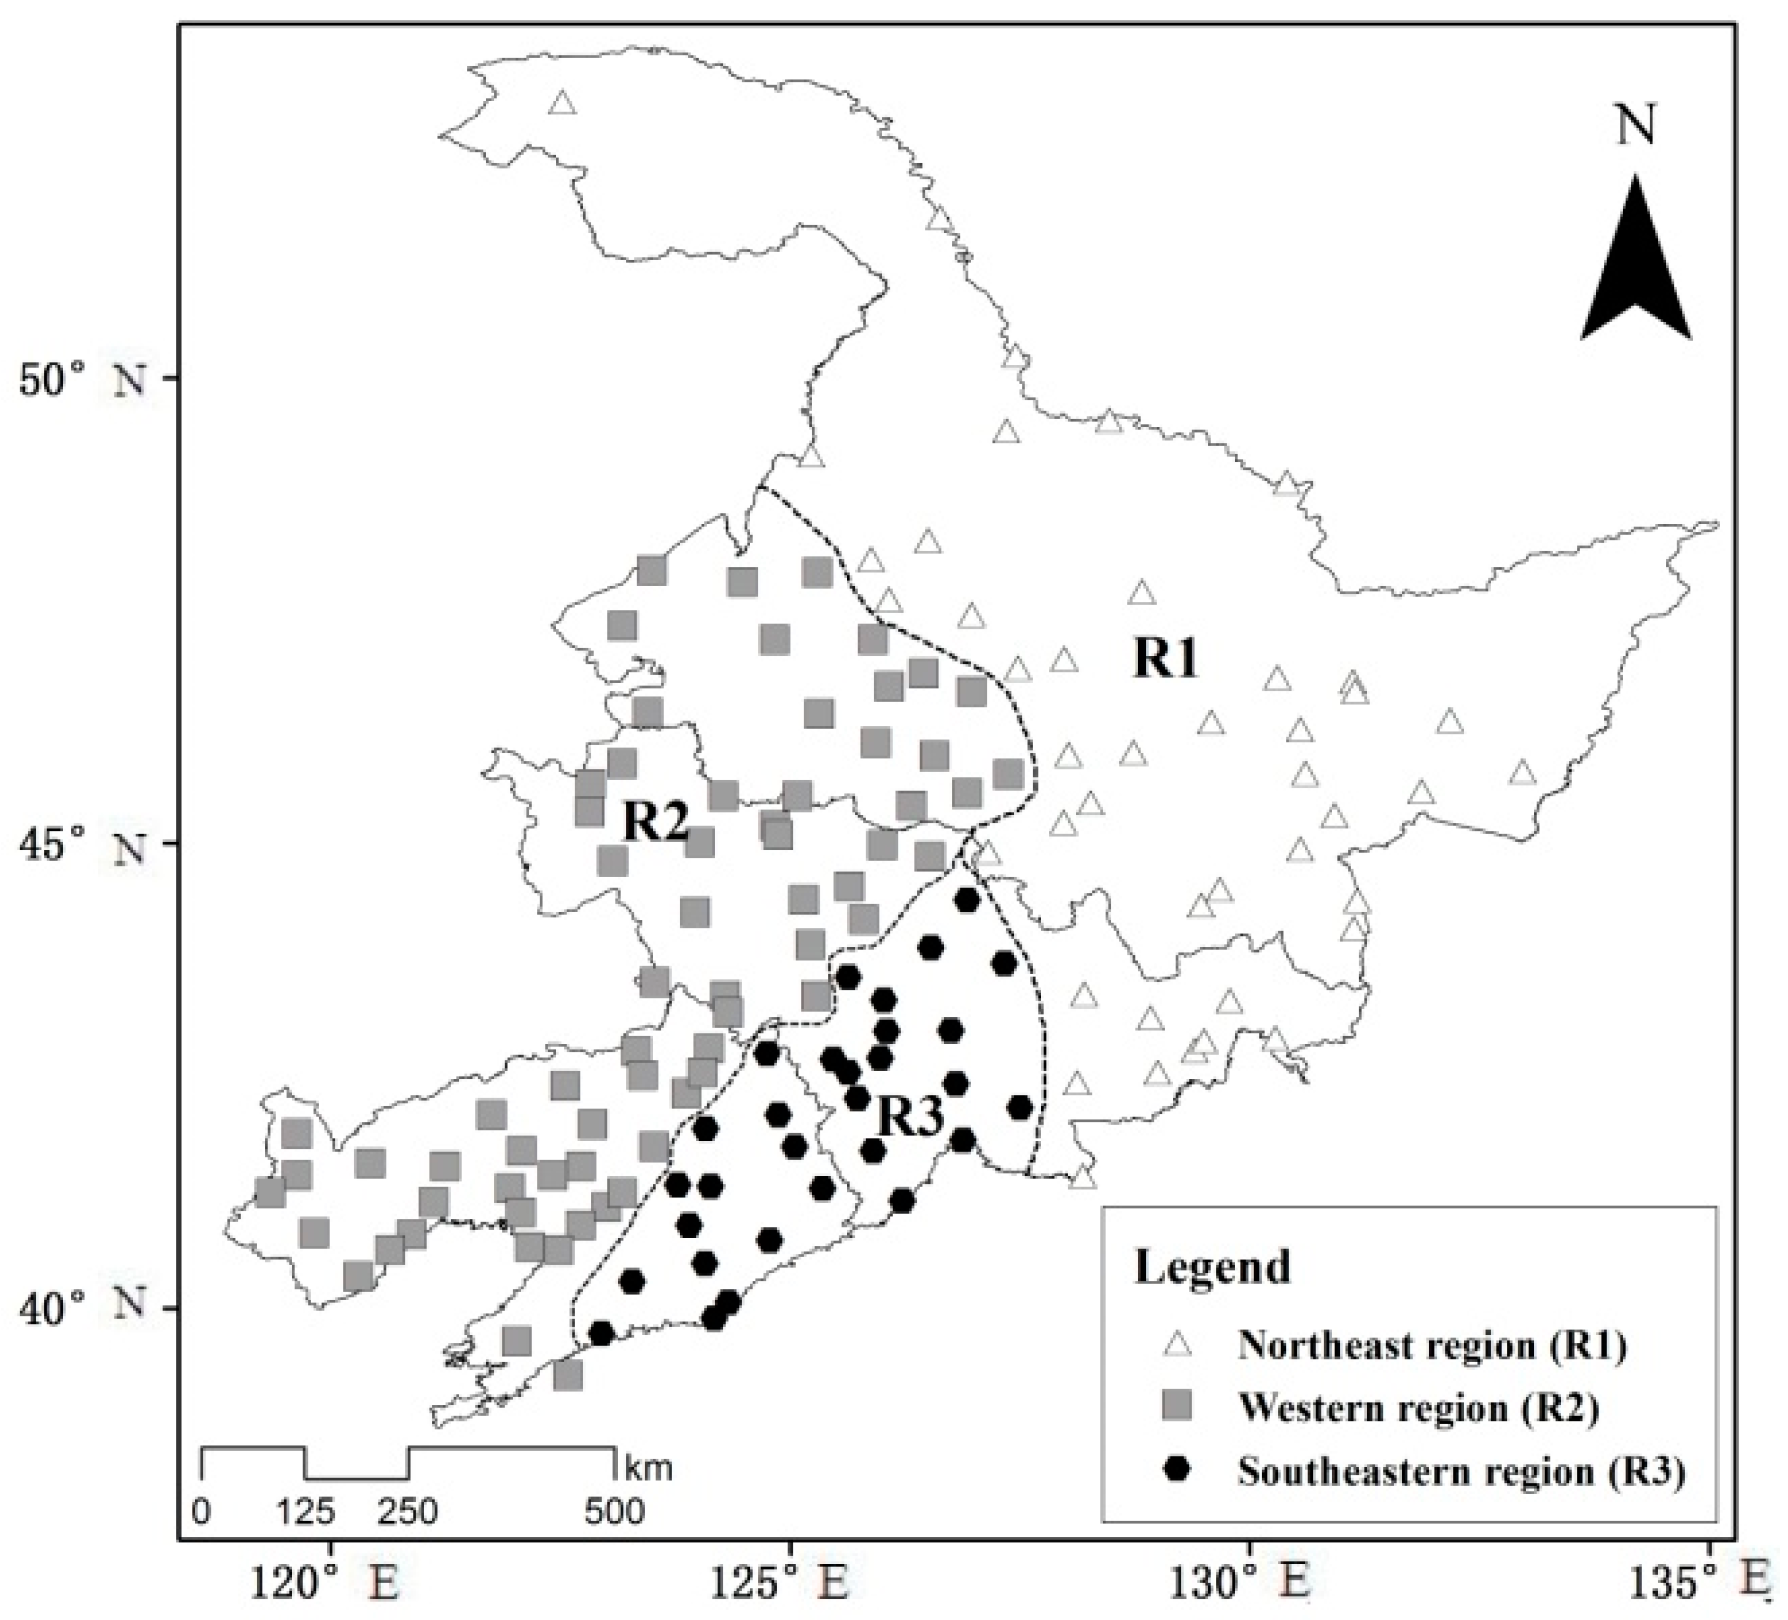
Figure 5.
Distribution of coefficients of correlation between lag-0 RDI and circulation indices; (a): IAZC; (b): IEAT; (c): POL; (d): PDO.
Figure 5.
Distribution of coefficients of correlation between lag-0 RDI and circulation indices; (a): IAZC; (b): IEAT; (c): POL; (d): PDO.

Figure 6.
Distribution of coefficients of correlation between lag-1 RDI and circulation indices; (a): IAZC; (b): IEAT; (c): POL; (d): PDO.
Figure 6.
Distribution of coefficients of correlation between lag-1 RDI and circulation indices; (a): IAZC; (b): IEAT; (c): POL; (d): PDO.
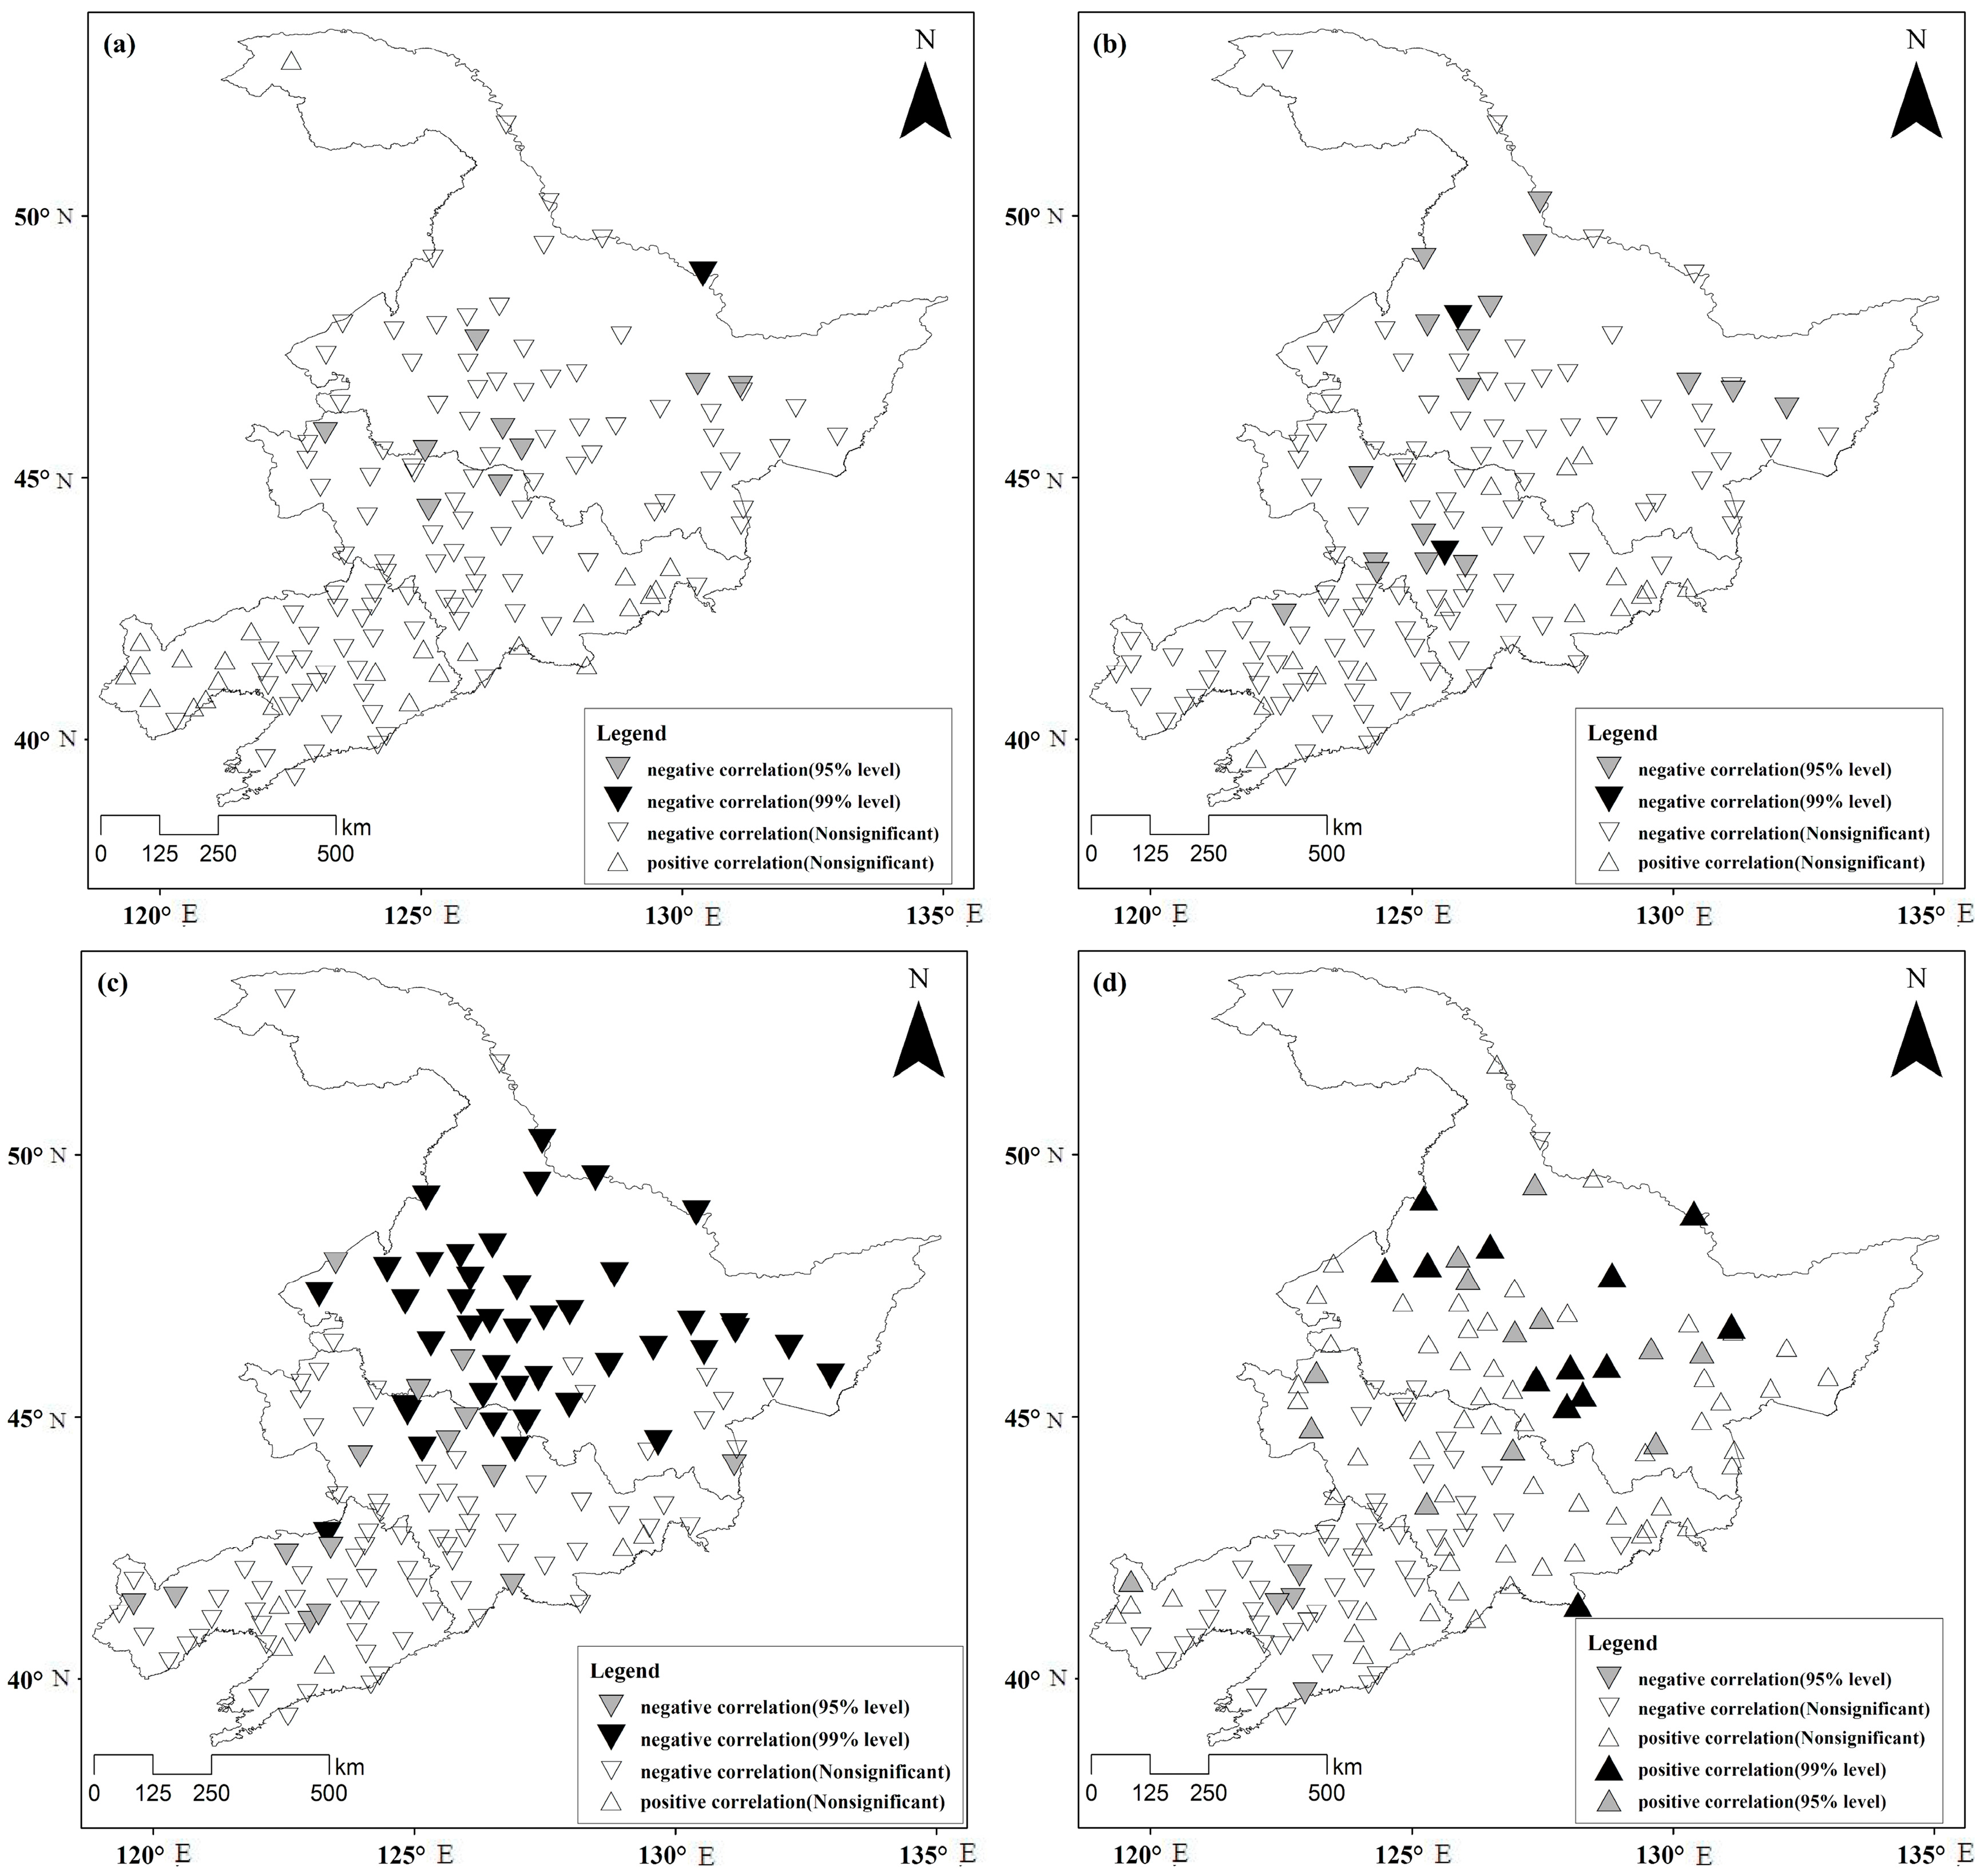
Figure 7.
Distribution of coefficients of correlation between lag-2 RDI and circulation indices; (a): IAZC; (b): IEAT; (c): POL; (d): PDO.
Figure 7.
Distribution of coefficients of correlation between lag-2 RDI and circulation indices; (a): IAZC; (b): IEAT; (c): POL; (d): PDO.


Table 1.
Drought classification according to RDI values.
| RDI Values | Drought Classification |
|---|---|
| −0.5 < RDI | No drought |
| −1.0 < RDI ≤ −0.5 | Light drought |
| −1.5 < RDI ≤ −1.0 | Moderate drought |
| −2.0 < RDI ≤−1.5 | Severe drought |
| RDI ≤ −2.0 | Extreme drought |
Table 2.
Median DF, TDD, and TDS in 1970–1984, 1985–1999, and 2000–2014.
| 1970–1984 | 1985–1999 | 2000–2014 | p Value | |
|---|---|---|---|---|
| DF | 8 | 8 | 7 | 0.088 |
| TDD | 19.55 | 17.06 | 19.14 | 0.056 |
| TDS | 21.84 | 17.77 | 20.93 | 0.067 |
Table 3.
Median DF, TDD, and TDS for five-year periods between 1970 and 2014.
| 1970–1974 | 1975–1979 | 1980–1984 | 1985–1989 | 1990–1994 | 1995–1999 | 2000–2004 | 2005–2009 | 2010–2014 | p | |
|---|---|---|---|---|---|---|---|---|---|---|
| DF | 1.69 | 1.70 | 1.63 | 1.62 | 1.54 | 1.64 | 1.54 | 1.62 | 1.01 | 0.602 |
| TDD | 4.26 | 5.09 | 3.59 | 2.84 | 2.94 | 4.22 | 4.29 | 4.34 | 1.98 | 0.088 |
| TDS | 4.75 | 5.48 | 3.59 | 2.94 | 3.11 | 4.62 | 5.08 | 4.99 | 2.26 | 0.082 |
Table 4.
The relationships between circulation indices.
| POL | PDO | IAZC | IEAT | |
|---|---|---|---|---|
| POL | 1 | −0.081 | 0.242 ** | 0.087 * |
| PDO | −0.081 | 1 | −0.092 * | 0.175 ** |
| IAZC | 0.242 ** | −0.092 * | 1 | −0.085 * |
| IEAT | 0.087 * | 0.175 ** | −0.085 * | 1 |
* p < 0.05; ** p < 0.01.
Table 5.
The relationships between circulation indices and RDI for different lag times (lag-0, lag-1, lag-2).
Table 5.
The relationships between circulation indices and RDI for different lag times (lag-0, lag-1, lag-2).
| R1 | R2 | R3 | |||||||
|---|---|---|---|---|---|---|---|---|---|
| lag-0 | lag-1 | lag-2 | lag-0 | lag-1 | lag-2 | lag-0 | lag-1 | lag-2 | |
| IAZC | −0.081 | −0.063 | −0.111 * | −0.090 * | −0.061 | −0.094 * | −0.056 | −0.035 | −0.037 |
| IEAT | −0.125 ** | −0.060 | −0.088 * | −0.133 ** | −0.044 | −0.059 | −0.074 | −0.036 | −0.040 |
| POL | −0.155 ** | −0.150 ** | −0.119 ** | −0.099 * | −0.106 * | −0.096 * | −0.089 * | −0.053 | −0.060 |
| PDO | 0.104 * | 0.114 ** | 0.105 * | −0.016 | 0.003 | −0.007 | 0.005 | 0.017 | 0.029 |
* p < 0.05; ** p < 0.01.
© 2018 by the authors. Licensee MDPI, Basel, Switzerland. This article is an open access article distributed under the terms and conditions of the Creative Commons Attribution (CC BY) license (http://creativecommons.org/licenses/by/4.0/).
Share and Cite
MDPI and ACS Style
Yue, Y.; Shen, S.-h.; Wang, Q. Trend and Variability in Droughts in Northeast China Based on the Reconnaissance Drought Index. Water 2018, 10, 318. https://doi.org/10.3390/w10030318
AMA Style
Yue Y, Shen S-h, Wang Q. Trend and Variability in Droughts in Northeast China Based on the Reconnaissance Drought Index. Water. 2018; 10(3):318. https://doi.org/10.3390/w10030318
Chicago/Turabian StyleYue, Yuan, Shuang-he Shen, and Qi Wang. 2018. "Trend and Variability in Droughts in Northeast China Based on the Reconnaissance Drought Index" Water 10, no. 3: 318. https://doi.org/10.3390/w10030318
Note that from the first issue of 2016, this journal uses article numbers instead of page numbers. See further details here.