Effect of Meteorological Patterns on the Intensity of Streambank Erosion in a Proglacial Gravel-Bed River (Spitsbergen)


Faculty of Earth Sciences and SpatialManagement, Maria Curie-Sklodowska University in Lublin, Aleja Krasnicka 2D, 20-718 Lublin, Poland
*
Author to whom correspondence should be addressed.
Water 2018, 10(3), 320; https://doi.org/10.3390/w10030320
Submission received: 16 February 2018
/
Revised: 9 March 2018
/
Accepted: 12 March 2018
/
Published: 14 March 2018
(This article belongs to the Special Issue Streambank Erosion: Monitoring, Modeling and Management)
Abstract
:Lower parts of proglacial rivers are commonly assumed to be characterised by a multiannual aggradation trend, and streambank erosion is considered to occur rarely and locally. In the years 2009–2013, detailed measurements of channel processes were performed in the Scott River (SW Spitsbergen). More than 60% of its surface area (10 km2) occupies non-glaciated valleys. Since the end of the Little Ice Age, the Scott Glacier has been subject to intensive retreat, resulting in the expansion of the terminoglacial and paraglacial zones. In this area, the Scott River develops an alluvial valley with a proglacial river, which has led to a comparatively low rate of fluvial transport, dominance of suspension over bedload, and the occurrence of various channel patterns. Measurements, performed in the lower course of the valley in two fixed cross-sections of the Scott River channel, document variable annual tendencies with a prevalence of scour over deposition processes in the channel bottom. The balance of scour and fill also differs in particular measurement cross-sections and during the summer season. The maximum erosion indices (1.7 m2) were related to single periods of floods with snow-glacier melt and rainfall origin. The contribution of streambank erosion was usually lower than that of deep erosion both in the annual cycle and during extreme events. The channel-widening index also suggests variable annual (from −1 m to +1 m) and inter-annual tendencies. During a three-day flood from August 2013, in a measurement profile at the mouth of the river, the NNW bank was laterally shifted by as much as 3 m. Annual and inter-seasonal indices of total channel erosion, however, show that changes in the channel-bottom morphology are equalised relatively fast, and in terms of balance the changes usually do not exceed 0.5% of a cross section’s area.
1. Introduction
In the cold alpine and polar climate zones, intensive cryosphere degradation processes are currently being observed [1]. The processes are particularly evident in the proglacial zone, where rapid glacier retreat results in the development of transitional conditions, frequently described as the paraglacial zone [2,3,4,5]. The transition is well visible in all sedimentation environments both in the terminoglacial and extraglacial zone. As a result of deglaciation, a number of directional changes are also observed in the fluvial system, related to an increase in coupling between the slope and channel subsystems and changes in the supply/delivery of water and sediments to the river [6,7,8]. In catchments of proglacial rivers, new sources of sediment delivery are activated, or the activity of particular fluvial processes changes [9,10,11]. This results in changes in the rate of sediment transport, which can be locally accompanied by both lateral migration and/or deepening of the channel [12,13,14].
The literature also frequently emphasises meteorological conditions on the intensity of fluvial processes in the polar zone [15,16,17,18,19,20]. This results in high variability of erosion and denudation indices during particular seasons [9,21,22,23,24,25,26,27,28,29,30,31]. Moreover, lack of standardisation of research on channel processes, differences in applied measurement strategies, and variable duration of the measurement period are certain obstacles in the comparison of obtained results [13,22,27,32,33,34,35,36,37].
The problems also concern the determination of streambank erosion in proglacial gravel bed rivers that can function both as single-thread channel braids, winding or meandering rivers, as well as complex multiple channel systems [10,11,38,39,40]. Moreover, streambank erosion processes are determined by sediment lithology changing with the course of the river (e.g., in zones of gorges or bank rampart dissections), and hydrodynamic conditions of bankfull discharges during snowmelt and precipitation floods [41,42]. The morphological role of ground ice is also an important factor. Ice slumps on the banks contribute to intensive lateral scour during the initiation of outflow in the beginning of the melt season [43]. Ground (fibrous) ice occurring after melting of snow ice covers in the valley floor effectively degrades the high bank of the channel and facilitates its undercutting, consequently accelerating the lateral migration of the channel [44,45,46,47].
Streambank erosion is generally associated with the rate of retreat of its edges. The rate of streambank erosion is usually monitored by means of survey markers, or geodesic measurements of changes in the course of bank edges with the application of the Global Positioning System (GPS) [48,49]. The obtained indices accurately illustrate the rate and directions of lateral migration of the channel for the particular section of the river; however, they provide no information on bank degradation in the vertical profile [42,50,51]. Estimation of changes in gently inclined banks is also problematic. The objective of this paper is the estimation of the annual and multiannual rate of streambank erosion and its comparison to deep scour processes using detailed Global Navigation Satellite System (GNSS) measurements in fixed cross-sections. The applied method permits the comparison of results obtained from different climatic zones, and constitutes a proposal of unification and standardisation of measurements of channel processes in monitoring research.
2. Study Area
The experimental field study was conducted in the gravel-bed Scott River located in the NW part of Wedel-Jarlsberg Land (SW Spitsbergen) (Figure 1). The first-order catchment area, with a glacial-nival alimentation regime, is approximately 10 km2, with almost 40% occupied by the valley-type Scott Glacier (3.1 km length). The marginal zone of the glacier includes a typical group of glacial (moraines, kames) and glaciofluvial landforms (outwash fans). The main subglacial stream is located in the southern part of the glacier snout, with water discharged through a multiple-channel system into a small flow-through lake. The lake concentrates the outflow in a single-thread channel for the entire gorge section of the valley. The glacier-free part of the catchment is elevated up to 92.5 m a.s.l., with a mean slope inclination of 0.028 m·m−1. The average elevation of the catchment is 267 m a.s.l. and the average slope is 0.1 m·m−1 [30,39]. In the wider part of the glacier-free valley (3.3 km), below the upper gorge cut into the complex frontal- and push-moraine, the Scott River develops an extensive multiple-channel system fed by small tributaries. In the lower part, the alluvial valley bottom is narrower, and the river forms another gorge cut into the marine terrace at 17–25 m a.s.l. In this part of the valley, multiple-channel streams are concentrated into a single-thread channel. Between the lower gorge and the river mouth to the fjord, the Scott River develops an alluvial fan with a system of distribution channels [28,52,53].
The dominant alimentation source of the Scott River is ablation of the Scott Glacier (90%). At the beginning of the melt season (June and July), nival waters have an insubstantial contribution in fluvial discharge (approx. 4%). Precipitation shows a similar contribution in alimentation throughout the season, while permafrost alimentation amounts to approx. 2% [54]. The Scott River discharges approx. 900 mm of water annually, with a mean discharge of 0.98 m3·s−1 and a unit discharge of 0.1 m3·s−1·km−2 [55]. High temporal variability of water stages and discharges is typical of the river. Maximum discharges (Qmax) of 6–12.0 m3·s−1 are registered during ablation–precipitation flood flows [52,54,55]. For the lower river course, the average bankful width is 9.4 m, the bankful depth in the thalweg is 0.32 m, the longitudinal water-surface slope is 0.018 m·m−1, and the bankful discharge is 3.5 m3·s−1 [27]. The occurrence of weather extremes can substantially modify discharge conditions, as reflected in a high variability of fluvial transport [31,35,53].
Rapid changes in the position of the glacier terminus have been observed since the end of the Little Ice Age. Since the 1930s, after a rapid surge of the glacier, retreat and downwearing of the glacier terminus has been observed. From 1990–2013, the retreat of the glacier snout ranged from 10 m·y−1 to 20 m·y−1 [40,56].
3. Survey Strategy and Methods
3.1. Location and Choice of Measurement Site
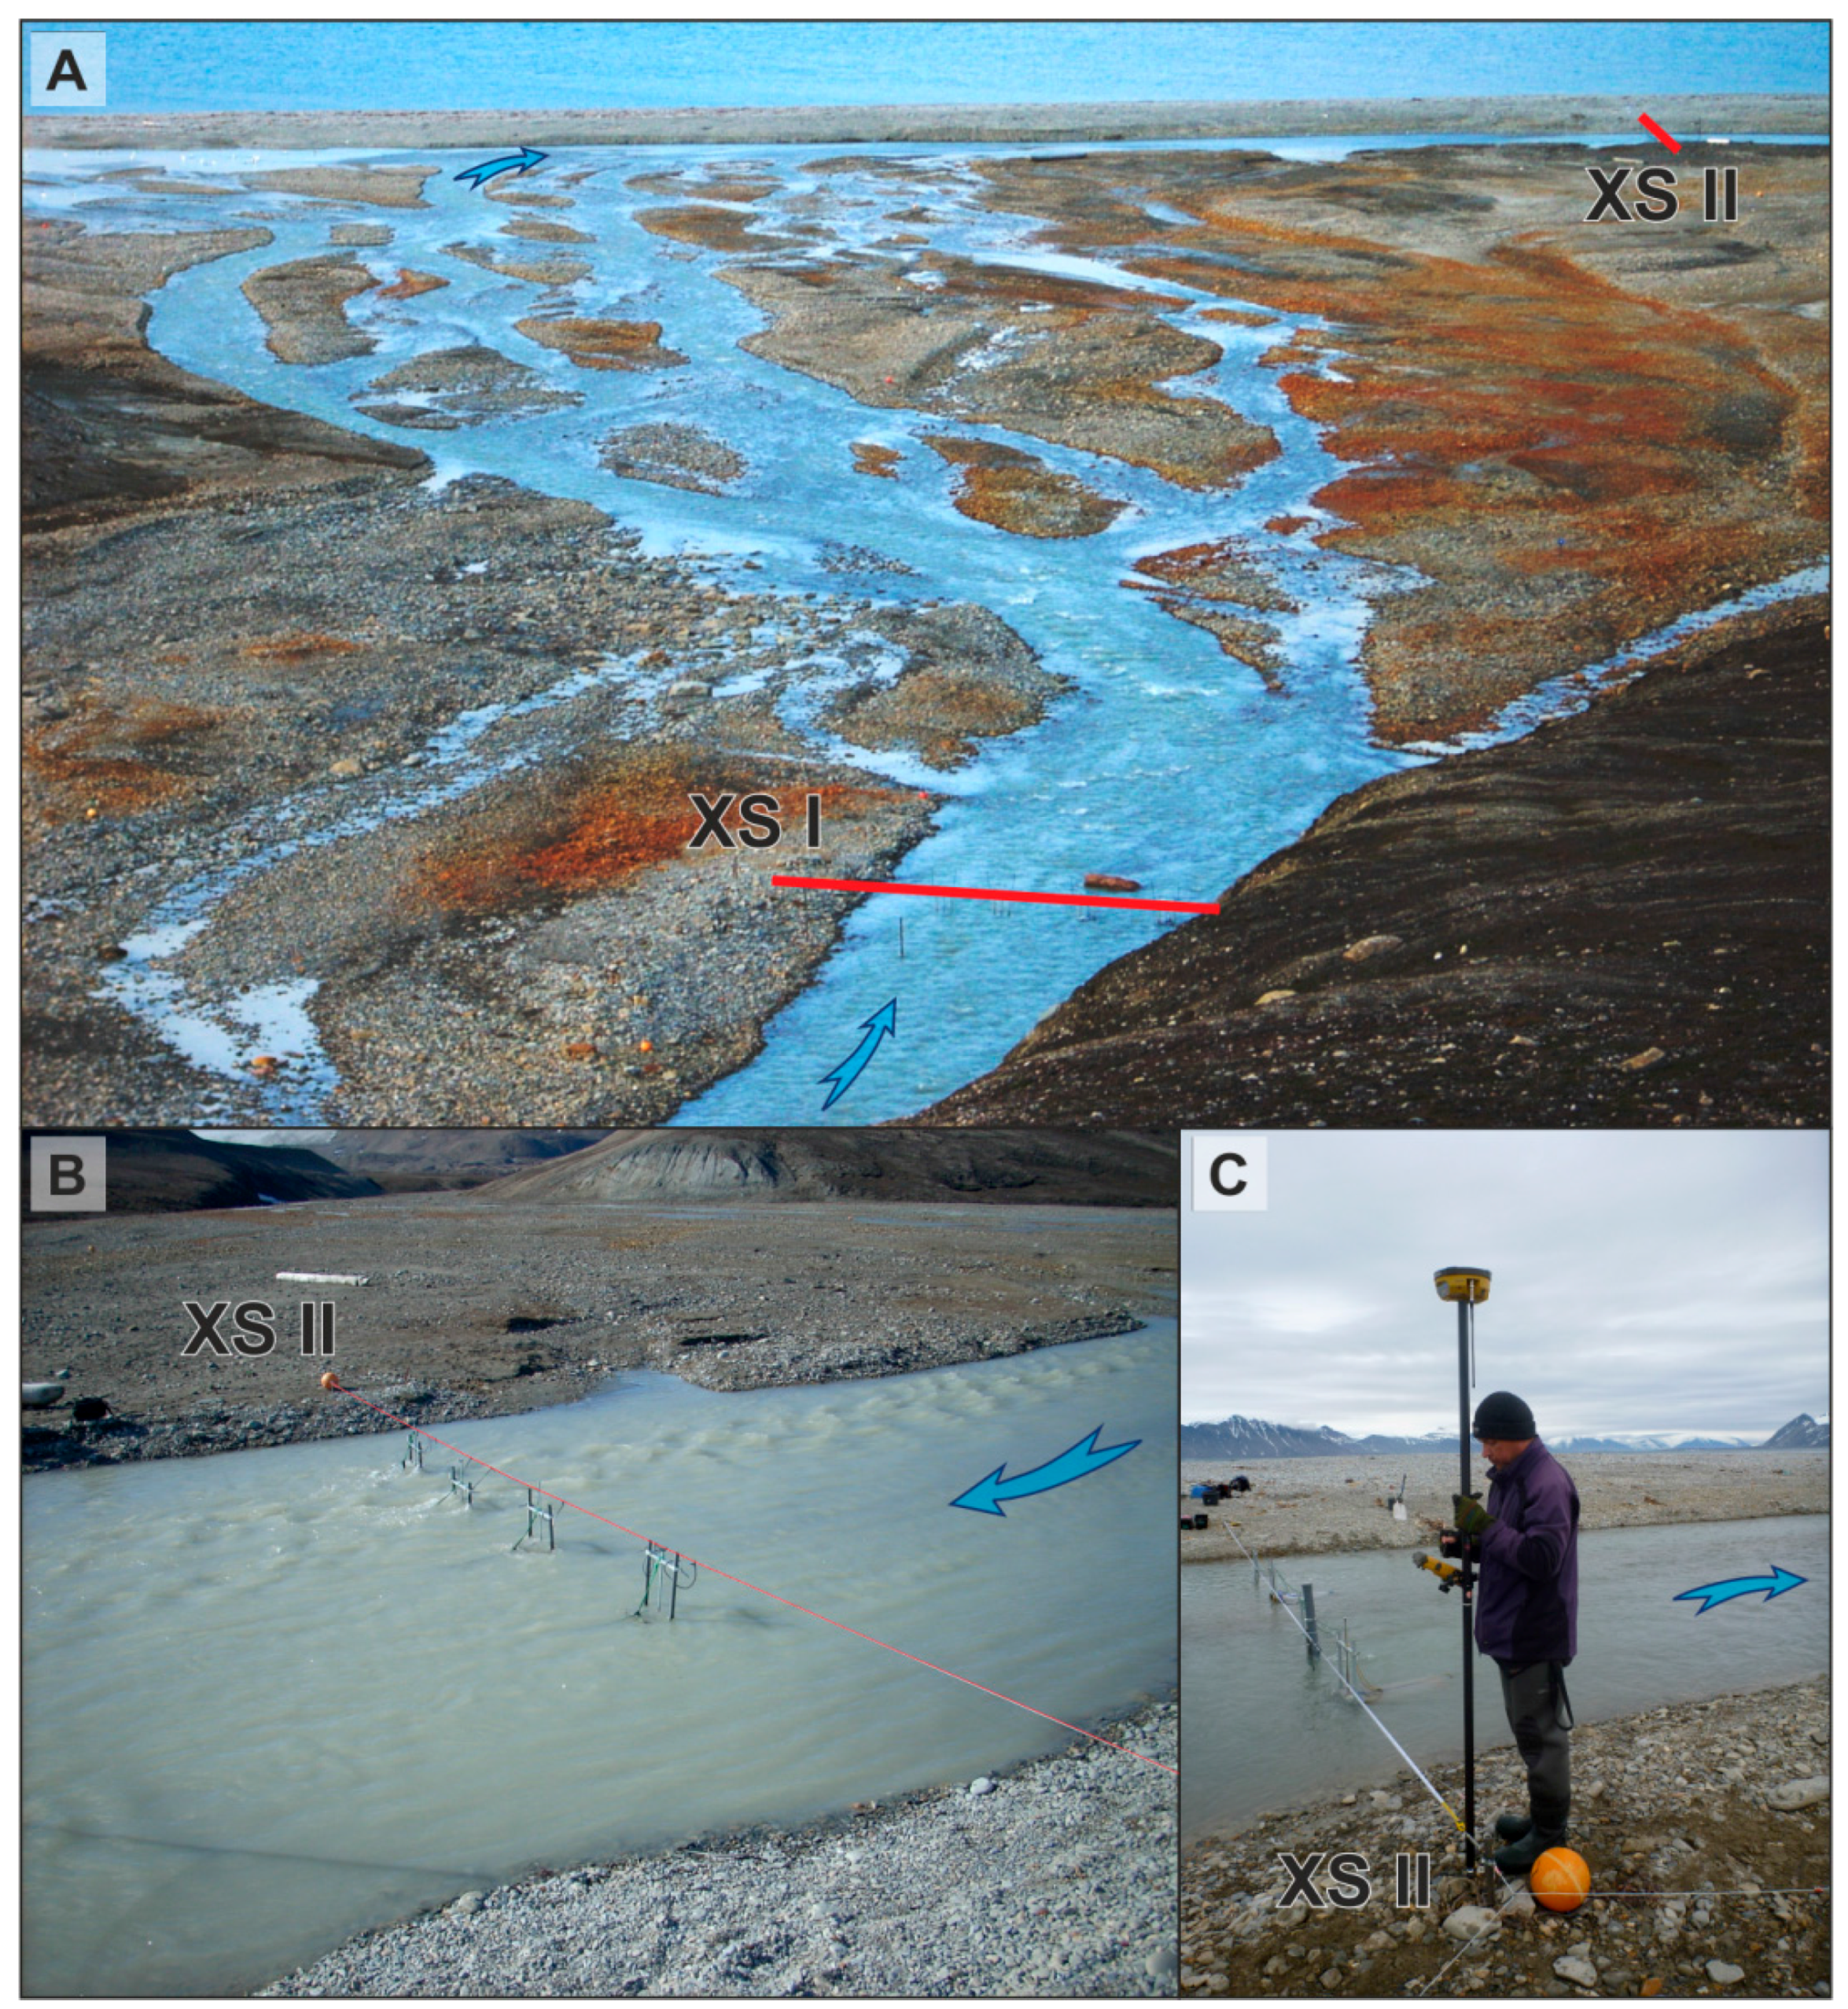
Research on streambank erosion processes in the Scott River channel was conducted in the years 2009–2013, and included geodesic and hydrometric measurements of selected sections of the Scott River valley. Detailed research covered two measurement sites in the lower course of the river. The determination of the rate of channel processes involved measurements of changes in the channel morphology. These were performed in two fixed-measurement cross-sections. The first measurement cross-section (XS I) was established in 2009 in the gorge of the Scott River through elevated marine terraces, approximately 2.5 km below the outflow from the glacier and 350 m from the mouth of the river to the Gulf of Bellsund (Figure 1B). The location of the measurement site in the narrowing of the gorge section of the valley was justified by the fact that at average and low-water stages, the Scott River concentrates its flow within a single-thread channel. The second measurement cross-section (XS II) was established in 2010 in the middle course of the wide channel that concentrates waters flowing from the alluvial fan, approx. 180 m above the crevasse channel dissecting the bank rampart at the mouth of the river to the fjord (Figure 1B). Measurements of depth and flow speed were performed at equal intervals (every 2 weeks) and after the occurrence of a flood. Every week in both cross-sections, the flow velocities were recorded by portable acoustic digital current meters and propeller current meters. Moreover, day-to-day changes in flow speed and discharge were also continuously measured by an acoustic flowmeter in XS II.
3.2. Geodesic Measurements of Changes in the Channel Cross-Sections
External geodesic benchmarks in the form of 6-inch steel pipes were mounted in the valley floor at a distance of approx. 1 m from the range of average water stage in the Scott River channel, and a measuring tape was stretched between them. In the summer season in the years 2009–2011, changes in the shape of the channel were measured every two weeks by means of a calibrated hydrometric rod every 0.1 m with a vertical accuracy of 1 cm. Additional measurements were performed when the occurrence of rapid floods resulted in changes in the morphology of the channel and valley floor. In the years 2012–2013, measurements of changes in channel shape in the same cross-sections were performed by means of GNSS (Figure 2).
Field surveys were performed by means of two receivers in the EPP TopCon Hipper II Base/Rover system. The generation of GNSS receivers employed in the measurements uses all available satellite signals of the GPS and GLONASS (Global Navigation Satellite System, Russia) positioning systems. High accuracy with very short time of measurements was possible by means of built-in code division multiple access (CDMA) radio modems. In the measurement period, the base station was permanently located at a site with specified coordinates in direct vicinity to the Maria Curie–Sklodowska University (MCSU) scientific station in Calypsobyen (Figure 2A). The mobile receiver (Rover) communicated with the base station by receiving radio corrections in real time (Figure 2B). Such a configuration of receivers and the use of a high number of satellite signals (from 8 to 11 GPS satellites + from 4 to 7 GLONASS satellites) provided an accuracy of 3D point locations of ±2 cm.
In the years 2012–2013, changes in the shape of the river channel bottom were determined at least four times during the measurement season at intervals from 5 to 14 days. The use of external benchmarks mounted in previous years (2009/2010) in each measurement cross-section permitted the determination of the height ordinate for measurements during 2012–1013 and comparison of changes during 2009–2011.
3.3. Determination of Streambank Erosion Indices and Widening of the Channel
The obtained measurement data were transferred to Surfer® (version 13) by Golden Software [57], where all the planimetric measurements of the cross-sectional areas of the channel were performed. Streambank erosion indices [in m2] were determined through comparison of the cross-sectional area of the base and final channel bottom. Then, the obtained indices were compared for both banks, the channel bottom, and the entire channel. The maximum width of the channel [m] for the specified water stage was also determined for particular measurement periods. The analysis of the parameter permitted tracing changes in lateral migration of the channel. A new channel geometry index was also proposed, namely ‘changes of bedrock top’ [m2; %], covering the cross-sectional area between the profile of the channel bottom and ordinates of the rectangular coordinate system. After the normalisation of ordinates, the discussed index permits quantitative and qualitative comparison of the balance of the scour or aggradation of the channel bottom, which indirectly allows for the determination of the trend of changes in the channel-bottom morphology.
The applied methodology permitted the determination of streambank erosion for particular measurement seasons from 2009–2013 at both cross-sections and for single flood periods (inter-seasonal changes) in 2012 and 2013 for cross-section XS I and in 2013 for cross-section XS II.
4. Results
4.1. Hydro-Meteorological Conditions during the Measurement Period
In the analysed measurement period 2009–2013, evident differences occurred in the course of the main hydro-meteorological parameters in the Scott River catchment, although the values of particular parameters did not significantly deviate from data registered from 1986 (Table 1). The thermal-humidity conditions oscillated within the range of average values, and air temperature variability was low (max. 1.3 °C). Examination of precipitation patterns, however, permits the identification of exceptionally wet (2013) or exceptionally dry seasons (2010).
From 2009–2013, daily precipitation totals rarely exceeded 5 mm, and their maximum values varied from 5 mm (2010) to 14.9 mm (2013). As a result, the total accumulated precipitation over the study period was sensitive to the few instances of high daily precipitation, which also caused high water stages and floods in the Scott River during which maximum daily discharges were recorded (2.2–2.7 m3·s−1).
Maximum discharges (Qmax) of 5–6.0 m3·s−1 were registered during ablation-precipitation flood flows; however, they did not exceed the highest recorded discharge from 1986–1993 [54,55]. The occurrence of above-average discharges considerably changed the course and intensity of channel processes, and effectively contributed to changes in the relief of the channel bottom and its spatial development. During short floods (1–3 days), the geometric parameters of the channel were subject to substantial changes based on the hydrodynamic conditions (Table 1). Usually in July, and more seldom in August, one or two floods were recorded during the measurement period. Throughout the measurement period, only one flood occurred from 20 July 2013, whose results were comparable to those of the flood from 1993 [55].
4.2. Annual Intensity of Channel Processes in the Scott River
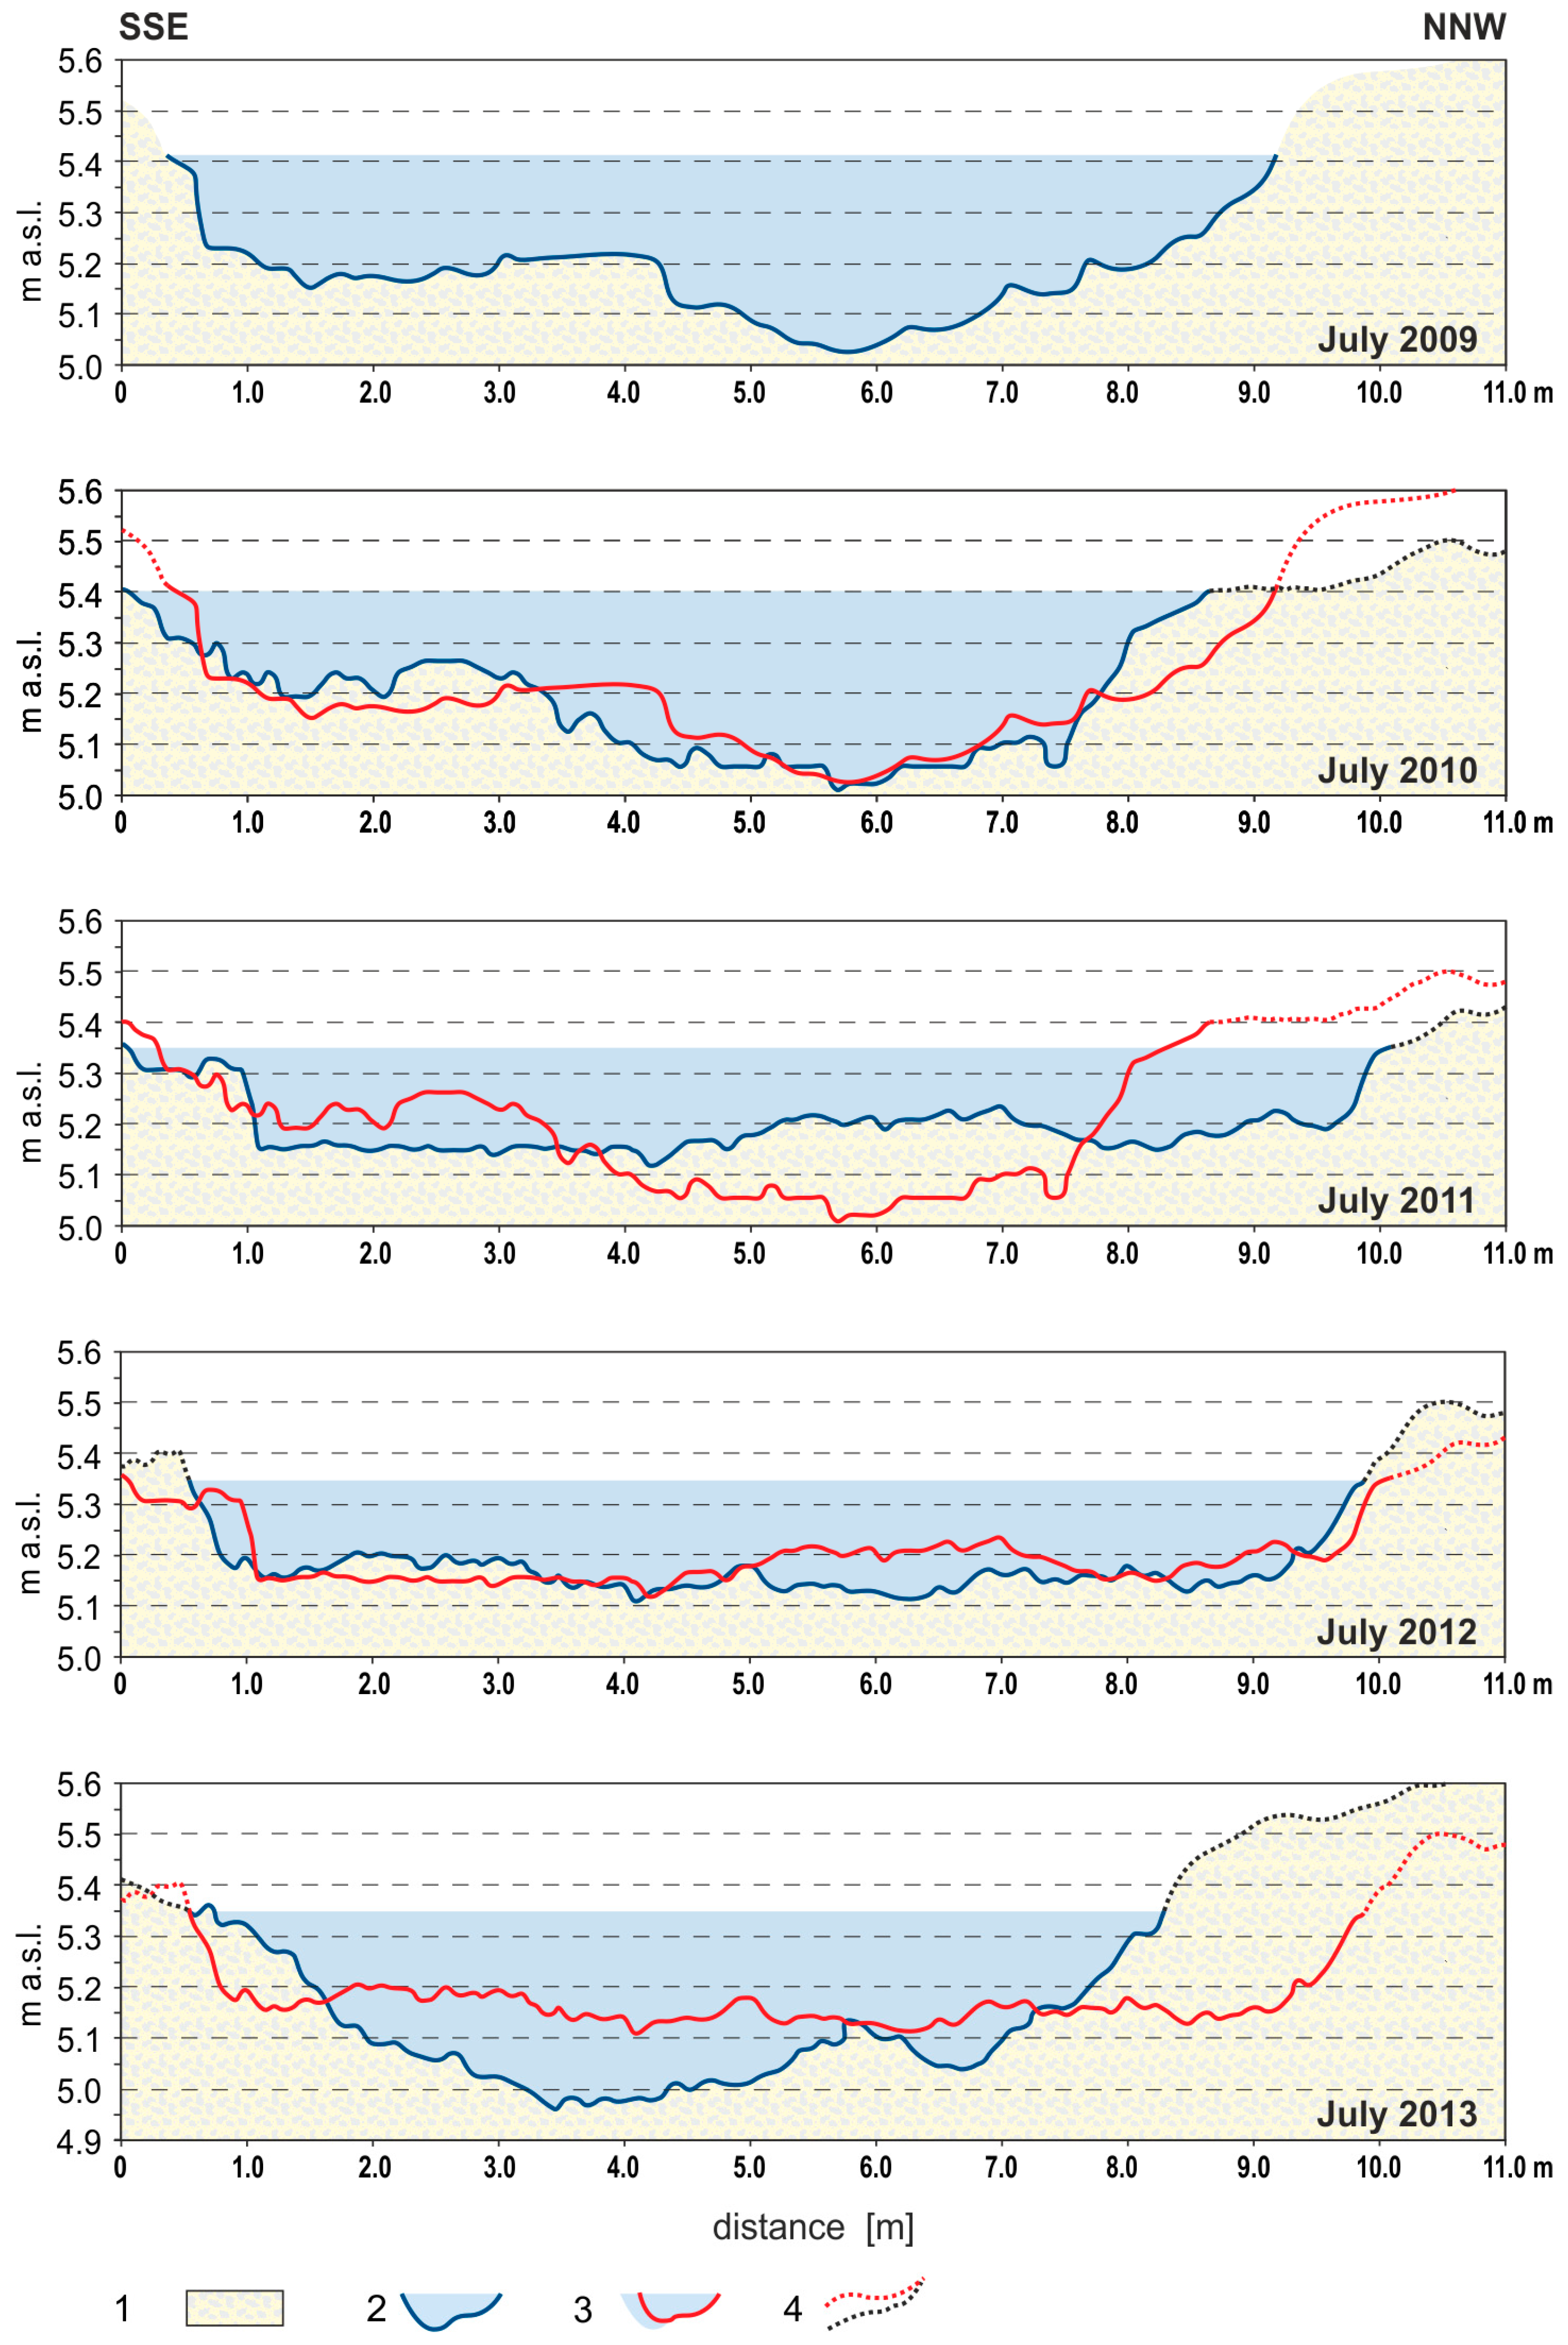
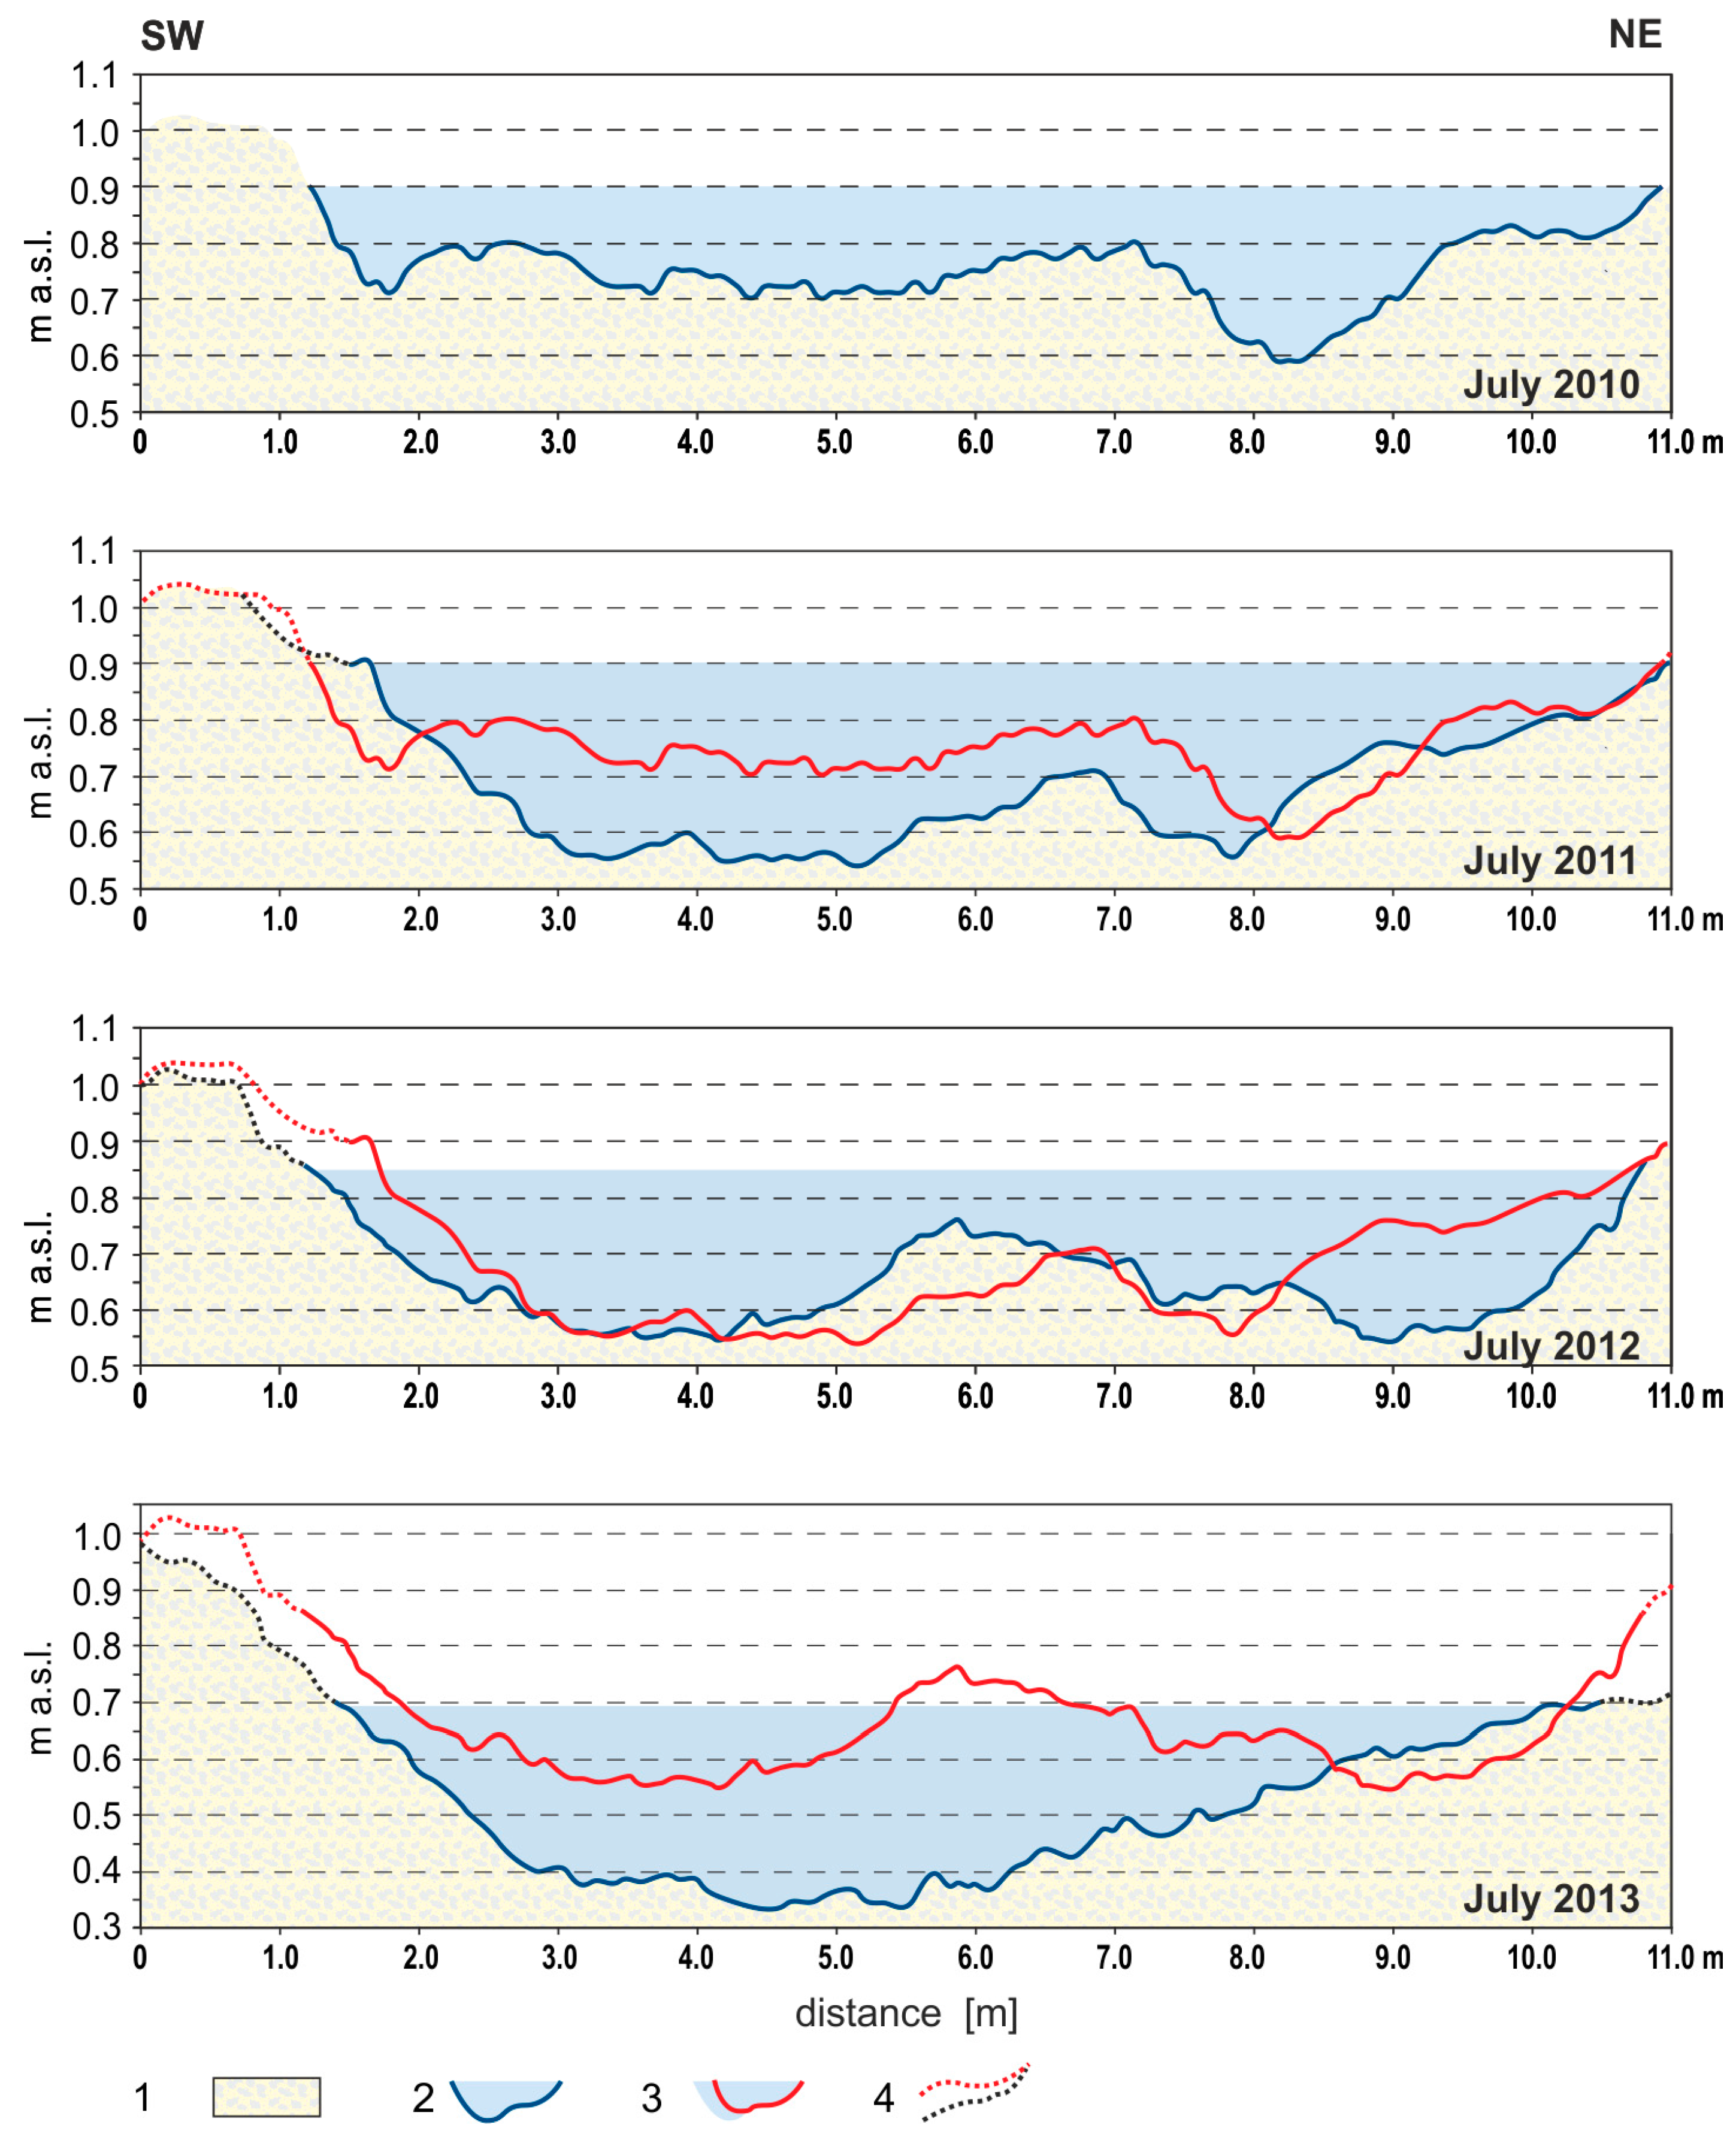
From 2009–2013 in the Scott River, scour processes were generally dominant both in the gorge (XS I) and river mouth cross-section (XS II). Figure 3 presents changes in the channel morphology. Data were collected for culminations of the melt season, i.e., mid-July. In 2009, the channel bottom was of an erosional character, and an evident thalweg occurred within it on the NNW side. Both banks were stabilised, whereas the SSE (high) bank was undercut in its lower part, and the NNW (low/accumulation bank) was aggradated. In the following year, the tendencies were maintained. The SSE bank was degraded (−0.05 m2) and the NNW bank aggradated, although in total after consideration of the degradation of the dry bank, scour was dominant (Table 2). The thalweg was considerably incised and widened, whereas on the SSE side the channel bottom was aggradated by a small longitudinal bar. The exceptionally dry summer period of 2010 and the corresponding lack of substantial precipitation events (>5 mm 24 h−1) did not favour the occurrence of channel-forming flows. This allowed for the maintenance of the tendency from the previous melt season. The morphology of the cross-section of the Scott River in the mouth section (XS II), i.e., thalweg on the NE side and prevalence of scour of the SW bank, as well as the aggradation of the NE bank suggest a similar course of processes in 2010. Both banks were rather stable, and no streambank erosion was observed. The width of the channel was relatively constant during the measurement period (Figure 4).
In the dry summer season of 2011, two floods occurred that changed the morphology of the channel bottom in both measurement cross-sections, whereas their development tendencies were reversed (Figure 3 and Figure 4). In the gorge the channel was considerably widened towards the NNW, and scour predominated along the entire length of the cross-section (−0.24 m2). Loss of the SSE bank by 0.25 m was recorded, and the NNW bank by 1.8 m (Figure 3, Table 2). In the middle part of the channel bottom a bar was deposited with a maximum thickness of 0.2 m, which led to a positive balance. Even more substantial changes were observed in XS II, where the SW bank was aggradated (+0.07 m2). The lower part of the NE bank was aggradated and the upper part eroded; however, the final balance was positive. The channel bottom was considerably lowered (−0.82 m2), which led to a negative balance for the entire channel cross-section (−0.73 m2).
The summer season of 2012 was wetter, resulting in the occurrence of bankfull discharge; however, in the first cross-section the scour balance was almost even (−0.05 m2) (Table 2). The channel bottom was slightly widened and planated (flattened), and on the SSE side of the bank a small bar was maintained (Figure 3).
The lower part of the SSE bank was eroded and the upper aggradated, leading to an overall net balance of sediment. The NNW bank was aggradated (+0.11 m2). In the second measurement cross-section, the channel bottom was considerably aggradated (+0.2 m2). A bar was deposited in its axis, separating two evident thalwegs (Figure 4). Both banks eroded in the lower part. The channel width and banks were not subject to substantial changes. The scour-fill balance for this section was dominated by scour (−0.33 m2).
The exceptionally wet summer of 2013 with high precipitation in July led to the acceleration of channel-forming processes and transformations in the Scott River channel bottom (Figure 3 and Figure 4). In the gorge, the main current of the river was shifted towards the SSE bank, resulting in the development of a large thalweg in the channel (max. depth 0.12 m). In the channel bed, separated by a small ridge from the main thalweg, a smaller second thalweg also developed (Figure 3). Deposition was dominant along both banks (Table 2), resulting in aggradation of both banks and a decrease in the width of the channel (maks. 7.4 m). The balance of scour and fill was positive for both banks and for the entire channel (+0.69 m2). The channel bottom had a negative (−0.57 m2) scour-fill balance. It was also substantially incised in the second cross-section (−1.25 m2), and the SW bank was eroded (−0.32 m2). The lower part of the NE bank was aggradated and the upper part eroded (Table 2). The channel width did not change, as no streambank erosion was observed in the channel (Figure 4). The balance of material for the entire channel bottom was negative (−1.82 m2).
The presented results provide no information on the rate of channel processes in the period from August to September, i.e., until the discontinuation of flow in the Scott River. Usually, however, except for the July culmination of the melt season, no bankfull discharge occurred in the Scott River. Relatively high floods can sometimes occur in August or even in the beginning of September [52,54,55]; therefore, the analysis of the rate and balance of channel processes in short periods during particular ablation seasons seems justified.
4.3. Inter-Seasonal Intensity of Channel Processes in the Scott River during the 2012–2013 Ablation Seasons
The year-to-year (2009–2013) intensity of channel processes and tendencies of development of the channel bottom morphology in both analysed cross-sections in the same period (July) remain in evident relation to the observed high seasonal variability of weather conditions [27,29,30,31,53,55,58]. The intensity of scour processes was largely determined by the occurrence of floods, particularly of ablation–precipitation origin [27,29,30,31,53]. A detailed analysis of the effect of this type of event on channel processes was only possible for two seasons (2012 and 2013), which included detailed monitoring of changes in channel bottom morphology before and after each event.
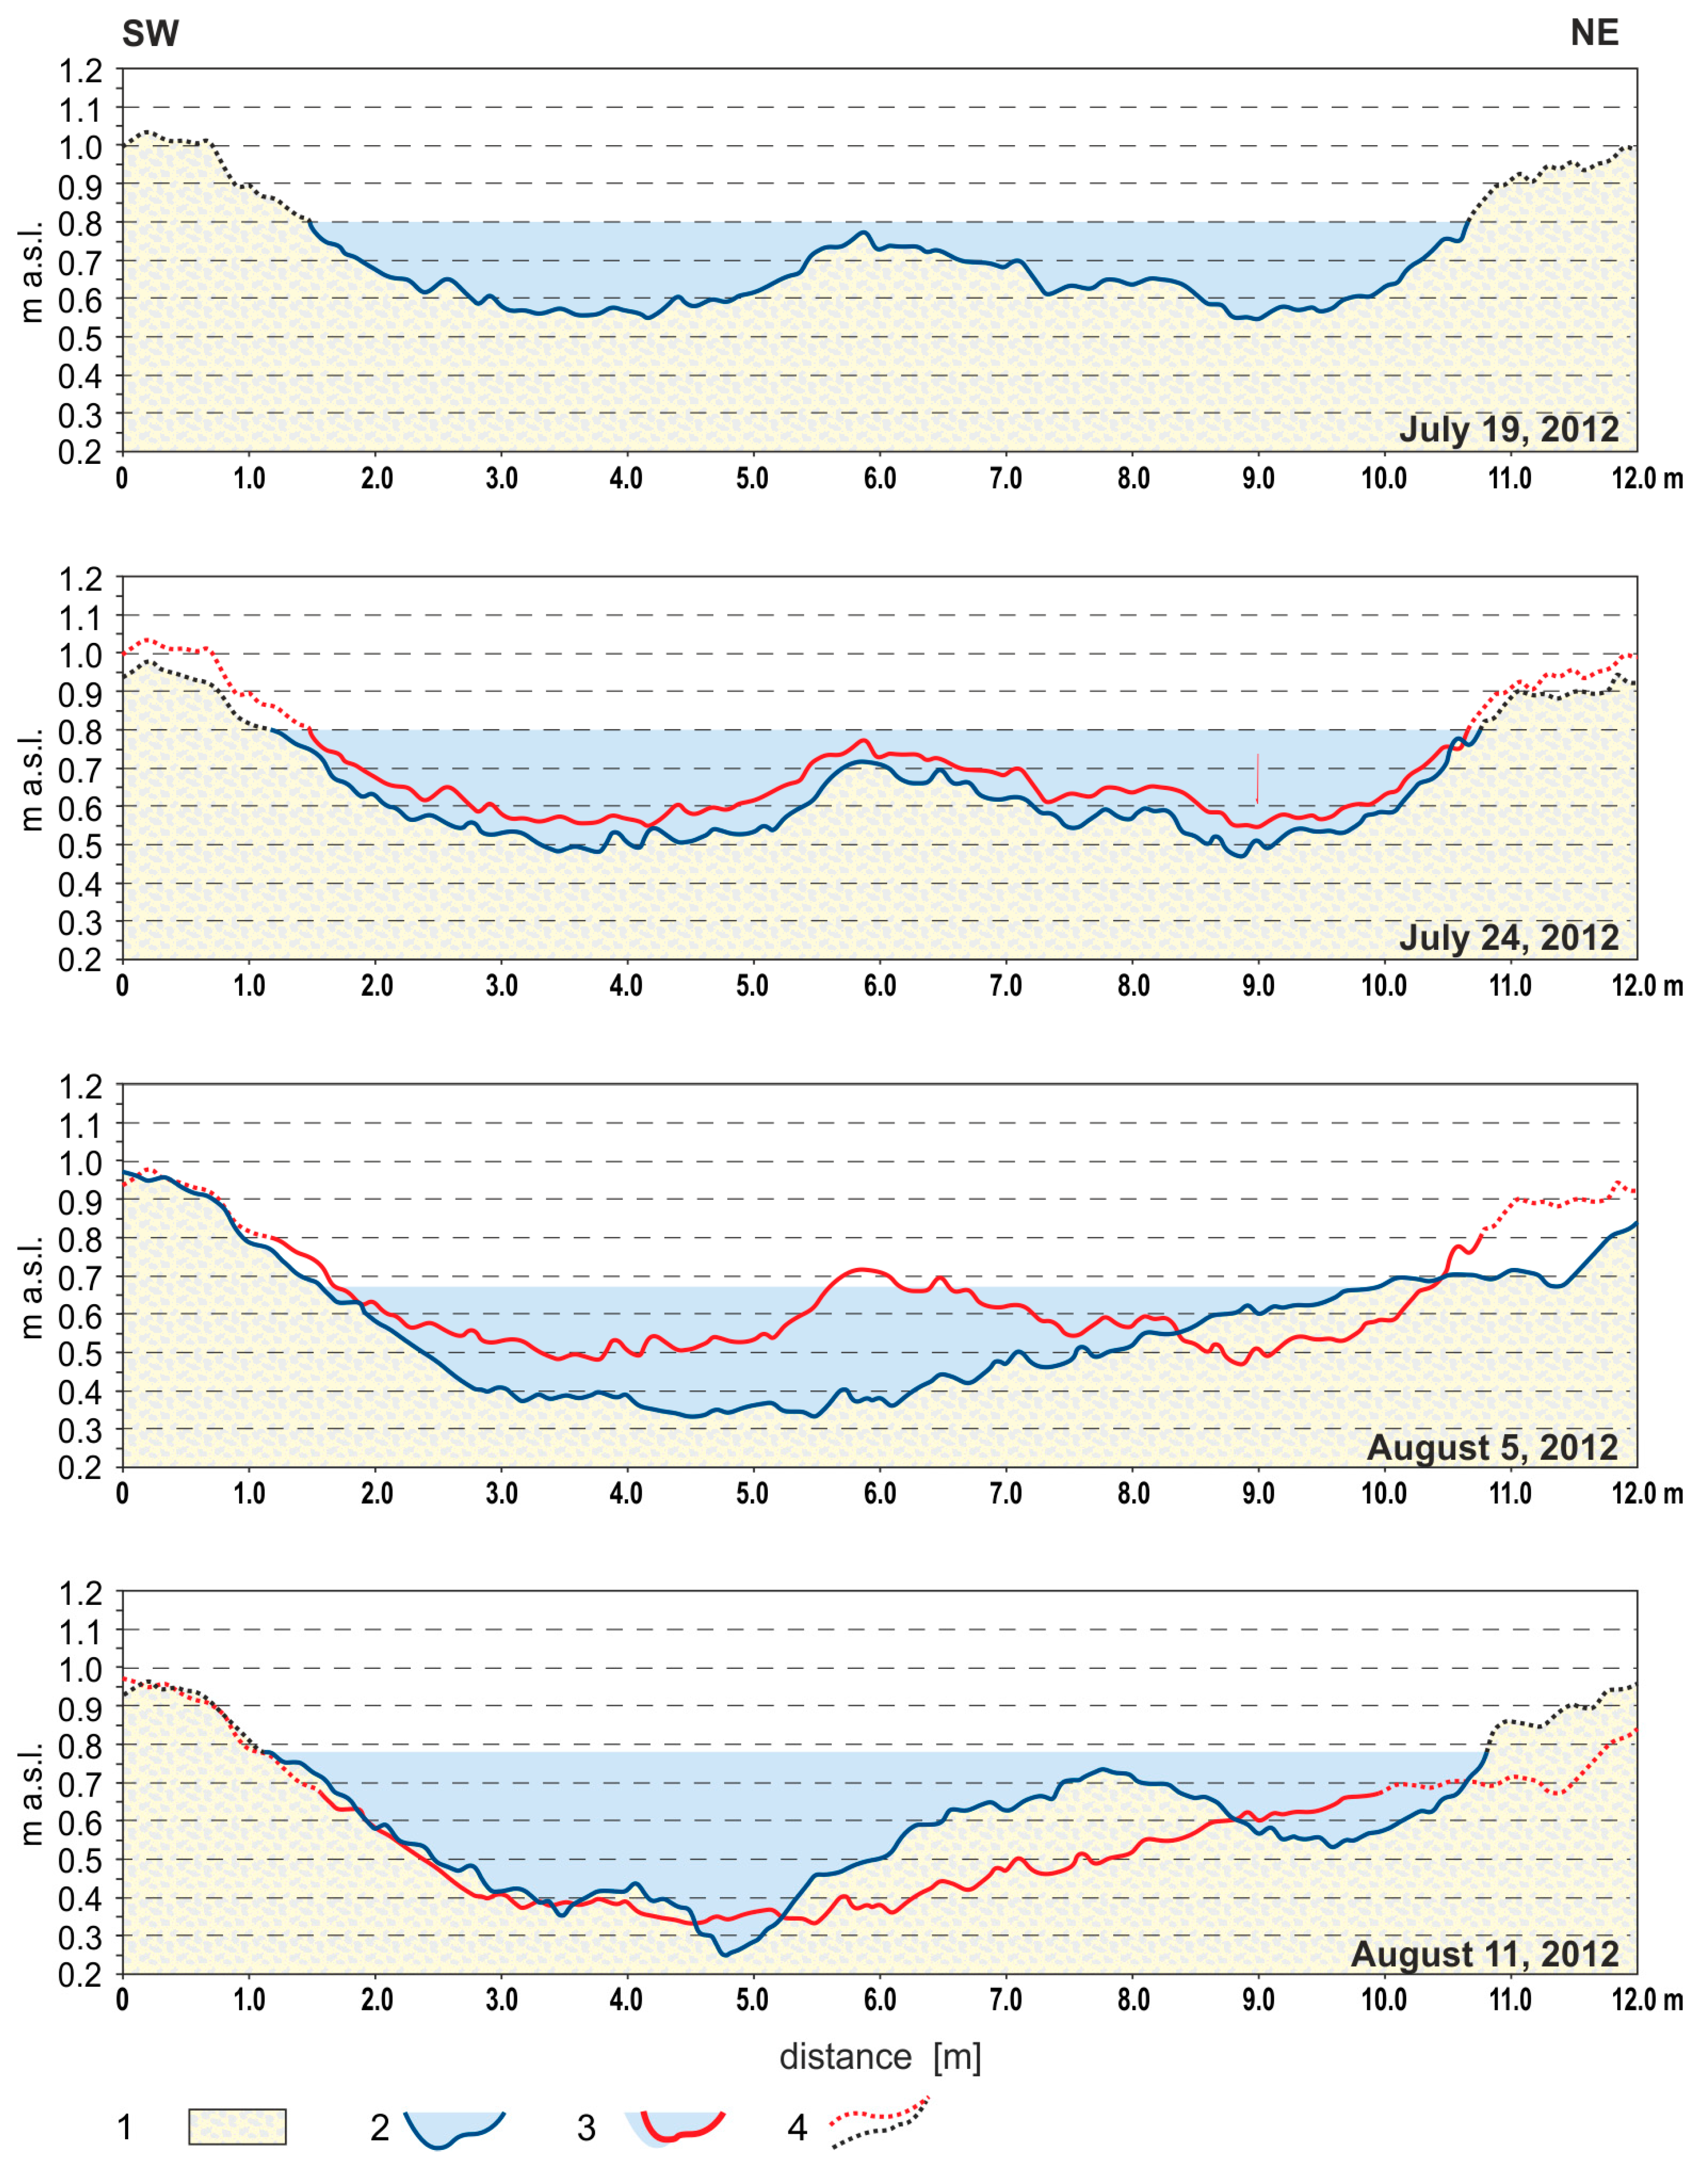
During summer of 2012, the first ablation–precipitation flood was recorded on 22 July. The daily discharges reached 1.5 m3·s−1 [55]. Daily precipitation from 22 July reached 11.3 mm, constituting 50% of the total precipitation for the entire season. On that day, a high daily air temperature was also recorded (7.1 °C). As a result of the event, considerable changes were observed in the channel bottom morphology in both measurement cross-sections (Figure 5 and Figure 6). In the gorge, scour processes were dominant within the entire channel cross-section (−1.07 m2), its bottom was quite evenly deepened over its entire length (−0.75 m2), and both banks eroded (Table 3). In both cases, scour processes covered both the lower and upper parts of the bank, resulting in widening of the channel (Figure 5). Erosion was also dominant in the second measurement cross-section (XS II), (−0.7 m2). At XS II, the channel bottom with two symmetrical thalwegs was incised by −0.35 m2 and −0.07 m2, respectively (Table 3). Scour also covered both the lower and upper part of both banks, causing a slight widening of the channel (Figure 6).
In the inter-flood period (until 8 July), the morphology of the channel bed in the gorge was not subject to considerable transformations (Figure 5). In that period, the channel bottom was selectively washed, and material deposition was low (Table 3). Within both banks, the intensity of channel processes was low, and as a consequence the channel width and bank line were not subject to considerable changes (Figure 5). Different tendencies were recorded in the second cross-section in the mouth section, where a considerable transformation of the channel occurred (Figure 6). A ridge in the channel bottom separating the thalwegs was eroded such that they became connected, resulting in the lowering of the channel bottom (−0.73 m2). The NE side of the bottom was aggradated, and the NE and SW banks were eroded (Figure 6).
Another large flood with ablation origin had a culmination on 10 August, and the discharge exceeded 2 m3·s−1 [55]. In the gorge (XS I), changes in the channel bottom morphology were inconsiderable (Figure 5). The main current of the river was shifted towards the SSE bank, where a shallow thalweg developed. Material was deposited on the opposite side, and the channel bottom was aggradated (Table 3). Neither of the banks was subject to substantial transformations, and the width of the channel did not change (Figure 5). Deposition was dominant in XS II, and a point bar developed in the channel axis (Figure 6). The thalweg was slightly incised and the lower part of the NE bank was eroded, whereas the upper part was aggradated, similar to the lower part of the SW bank (Table 3). The channel width decreased to its approximate state from the end of July (Figure 6).
In the exceptionally wet year 2013, a total of four precipitation events with a daily total of 10 mm were recorded, one on 19 July (14.2 mm) and three in August (13–16) with a total amount of 46.9 mm, constituting 50% of total annual precipitation. As a result, high discharges were maintained almost throughout the measurement period (approximately 2 m3·s−1), with a culmination on 16 August (4.6 m3·s−1) [55]. This resulted in a different tendency of development of the mouth section of the channel (Figure 7 and Figure 8). In July, in the gorge of the valley, a channel with an erosional bottom developed without an evident thalweg zone and with stabilised banks (Figure 7). The channel bottom after the first culmination of the ablation-precipitation flood in July was only insignificantly transformed, and the balance was almost even, with no clear tendencies (Table 3). Similar tendencies occurred after the flood within the channel bottom. The NNW bank was aggradated in its lower part and eroded in its upper part, while the balance of the SSE bank was negative (Table 3).
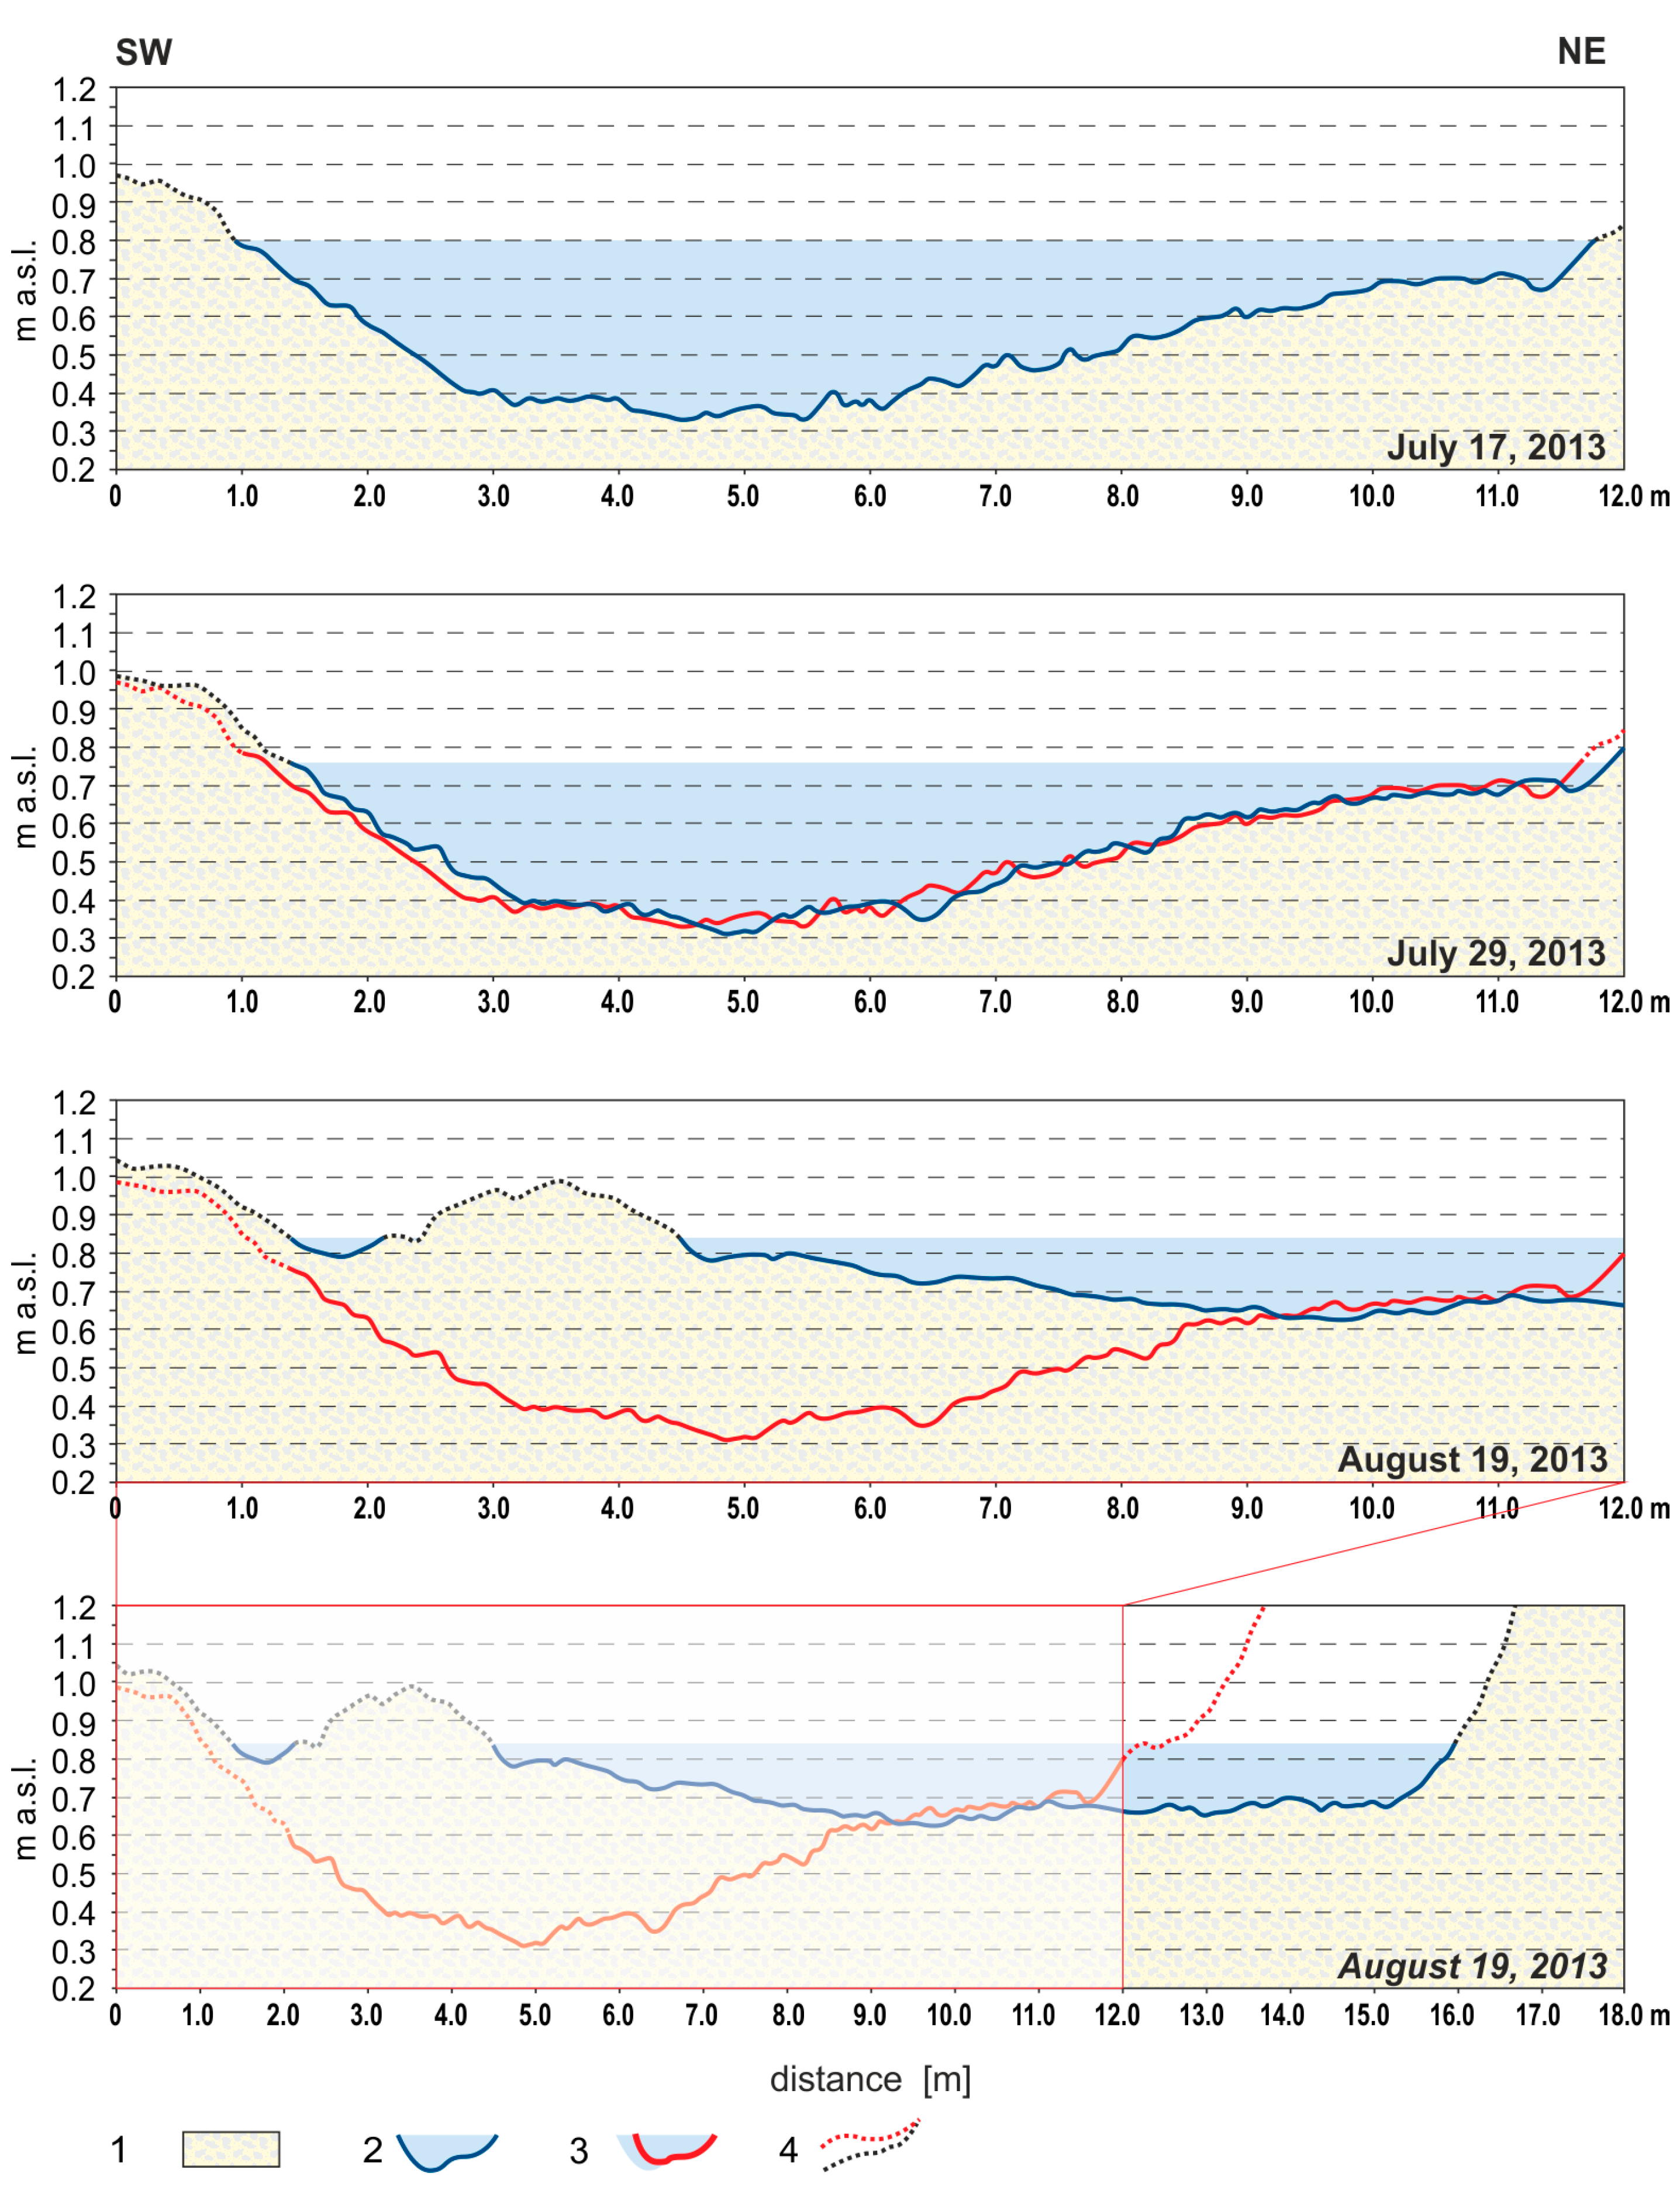
Similar processes and tendencies were observed at the end of July in the second measurement cross-section in the mouth section of the river (Figure 8). Here, the SW bank was slightly aggradated, and the width of the channel did not substantially change. In August, after another flood, the channel bottom in the gorge was aggradated (+0.8 m2). Similar processes occurred along both banks (Table 3), such that the channel width did not change substantially (Figure 7). A radical transformation of the channel bottom occurred in the mouth section, where in the SW part a large longitudinal bar developed, cutting off a fragment of the channel (Figure 8). On the opposite side, intensive scour of the NW bank occurred, followed by a streambank shift by 3.5 m. The scour and fill erosion within the entire cross-section, however, was positive (+0.79 m2). The main current of the river was shifted under the NW bank, and the bottom part of the channel was planated (Figure 8).
5. Discussion
In the period 2009–2013, detailed measurements of changes in the morphology of the Scott River channel bottom were performed in the lower course of the valley, where a rapid retreat of the Scott Glacier has been observed since the early 20th century [34,52,54,59,60,61,62]. The deglaciation of the valley changed the conditions of the proglacial river catchment, and consequently the intensity of fluvial processes and changes in the valley morphology [27,28,29,30,31,53]. Quasi-continuous monitoring of hydrodynamic conditions and the fluvial transport rate showed relatively low indices of sediment discharge, associated with a decrease in the supply of material from ablation of the retreating Scott Glacier [27] and an increase in the water capacity with an increase in the thickness of the active permafrost layer [31,34]. An exceptionally low rate of bedload transport in the gravel-bed river during the summer of 2009, also determined by meteorological conditions, was surprising [27,28,29,53].
Measurements of fluvial transport after 2009 confirmed low sediment transport indices, and the evident predominance of suspension and solutions over bedload [30,34]. In the Scott River catchment, meteorological conditions and the occurrence of floods determines sediment transport as well as associated changes in channel and valley floor morphology. During large floods, particularly ablation-precipitation events, total bedload flux was from 59% to 77% [31,34]. The effect of weather and extreme events on the modern development of the relief of the valley floor and channel was also repeatedly emphasised for proglacial rivers [7,8,9,13,17,20,22,23,24,25,38,63,64,65,66].
The cited papers periodically present results concerning the intensity of channel processes in catchments of gravel-bed rivers, particularly including bedload transport. According to Froehlich [44,45], this results from the lack of an effective measurement methodology. Detailed research conducted by Ashworth and Ferguson [64] revealed high variability and differentiation of channel processes in braided rivers. The authors emphasised the role of hydrodynamic conditions (discharge regime) and availability of sources of supply of material transported in the channel [65]. In synthetic studies, the predominance of bottom incision over streambank erosion is usually assumed for gravel-bed rivers and bedload channel patterns [67,68,69,70,71]. Moreover, deposition is usually dominant in beds of gravel-bed rivers, and the channel is characterised by high instability and frequent changes (channel shift) along the course of the streambank. The channel is dominated by relatively shallow discharges, and the morphology of its bottom by longitudinal bars. The rivers can develop complex multiple channel patterns, often at a transitional stage [10,11,38]. Scarce detailed research also showed the importance of local factors on the spatial distribution, extent, and temporal frequency of streambank erosion, which as a consequence causes problems in the comparison of obtained results [8,13,22,64,71]. According to Palmer et al. [72], large variations at individual sites and in annual rates suggest that between the banks, erosion rates may be confounded by the timing and magnitude of discharge events, storage of sediments within the channel system, and the remobilization of eroded material.
Quasi-continuous measurements of the intensity of streambank erosion conducted in the Scott River catchment from 2009–2013 also showed high variability. At the seasonal temporal scale, the intensity of erosion of the channel banks in cross-section XS I varied from 0 m2 to 0.5 m2. Similar values were obtained for cross-section XS II: from 0 m2 to 0.35 m2. In reality, scour or fill processes periodically dominated along both banks, and their balance showed different values, from −0.35 m2 to +1.2 m2. The channel-widening index also showed a broad range from −1.7 m to +4 m (Table 4), suggesting relatively high instability along the course of the streambank, and lateral migration of the analysed channels. The presented data, however, suggest a lack of a permanent development tendency, and remain in an evident relation to the occurrence (or lack) of extreme events. The development tendencies of the channel bottom are usually inherited from extreme events, and meteorological conditions determine the direction of development of the channel at a large temporal scale (>1 year). Annual and inter-seasonal changes in the channel are subject to fluctuations depending on the temporal scale, but also show spatial variability; therefore, the term and location of measurement of the intensity of streambank erosion is of strategic importance, particularly if the analysis concerns long-term changes [72]. An optimal solution involves continuous measurements with an appropriate spatial distribution along the cascade system of the catchment, and especially homogenous and low-order catchments [9,13,22,32,33,36,73,74].
The problem in the determination of the intensity of streamline erosion in gravel-bed rivers also concerns the selection of the measurement technique, which further determines the measurement unit. Different methods usually generate incomparable indices, and their interpretation can be ambiguous or false in the case of a lack of continuous measurements. The streambank erosion rate is usually expressed as m·y−1, estimated by means of geodesic benchmarks, or increasingly frequently by means of GPS techniques [72]. The channel-widening index is determined in a similar way (m·y−1 or m·event−1). In the case of both measurements, however, incomplete information is provided on the actual processes occurring within the submerged part of the bank. The indices, rather, illustrate the shift of the channel and/or its lateral migration, but in such a case, the comparability of results requires their reference to the length of a relevant section/sector of the channel (i.e., m·m−1). Moreover, measurements performed in the Scott River catchment show variable streambank erosion processes and their intensity in the lower and upper part of the bank. The bank is also often degraded or aggradated along a relatively stable course of a streambank. Similar methodological problems occur in the case of the determination of total scour/fill for a particular channel cross-section; therefore, the authors propose broader consideration of the scour-rate index in the channel cross-section, accurately describing both the scour/fill balance and dynamics of channel processes throughout the channel bottom (Table 4). Moreover, measurements in cross-sections with a cascade distribution will facilitate the conversion of the obtained results to streambank erosion rate in m·y−1.
The selection of two measurement cross-sections in the Scott River catchment was also aimed at the determination of the tendencies of development of the relief of the channel bottom and determination of the effect of the alluvial fan on the intensity of channel processes, particularly streambank erosion. The obtained results confirmed high variability of the processes depending on meteorological conditions and the occurrence of extreme events [27,28,30,31,53]. In the mouth section during floods, but also in the presence of sources of material within the channel itself (particularly bars), the rate of fluvial transport and channel processes was usually higher than in the gorge. The results confirm the thesis stating that the alluvial fan can be an area of supply of material transported in the river channel [27,30,31]. Research by Kociuba [30] with the application of TLS also showed multidirectional tendencies of the zone, where surface erosion can periodically predominate. Hodgkings et al. [17] also pointed to the alluvial bottom of the proglacial river as a potential and important source of supply of material transported in the river channel.
6. Conclusions
1. Detailed research on streambank erosion conducted in the years 2009–2013 in selected cross-sections of the Scott River channel confirmed a high variability and spatial distribution of erosion. In cold climate zones, high seasonal variability of hydro-meteorological conditions is observed. The primary factor regulating the intensity of streambank erosion in the melt season was meteorological conditions associated with the rate of glacier ablation, constituting the main source of alimentation. The value of streambank erosion depended on the frequency and magnitude of ablation–precipitation floods, accounting for 50–80% of total sediment discharge flux [31]. Extreme weather events resulted in the retreat of the bank with a maximum annual streambank erosion index of 1.77 m2. The streambank erosion index, however, rarely exceeded 0.3 m2. The contribution of streambank erosion was usually lower than bottom incision, both in the seasonal cycle and during extreme events. Seasonal indices of total scour in the channel bottom, however, show that changes in the morphology of the gravel-bed river channel are relatively rapidly equalised at the end of the season, and in terms of balance they usually do not exceed 0.5% of cross-sectional area. As a result, on a short time scale the stabilisation of the course and morphology of the channel and its development pattern is observed. The Scott River seems to adjust to the current alimentation regime. On the other hand, within the valley floor in the gorge zone, erosion processes were prevalent over the five-year study period. In the zone of the alluvial fan, alternating prevalence of erosion or deposition was observed in particular years. Such tendencies also confirm the importance of local factors related to geology and slope of the valley, which modify the effect of regional and, particularly, climatic factors. In the case of a rapid retreat of the Scott Glacier, the regime of the river changes. Its channel is in the transition phase, which is characterised by a decrease in the intensity of erosion and deposition processes. The occurrence of extreme hydrometeorological phenomena, however, causes considerable transformation of the channel and valley floor, and determines the direction of its further development.
2. High variability of the annual intensity of streambank erosion was also determined by local factors related to the location of measurement cross-sections. The Scott River channel, both in the gorge (XS I) and the outlet (XS II), is characterised by different bed morphology and development tendencies. As a result, the channel-widening index documents variable seasonal (from −1 m to +1 m) and inter-seasonal tendencies. Exceptionally large (up to 3.5 m) lateral NNW streambank shift was recorded during a 3-day flood from August 2013 in the outlet of the river (XS II). The inter-seasonal analysis of the scour/fill balance in the cross-sections suggests an important role for the availability of local sources of material (longitudinal and point bars). Tendencies of changes in channel morphology, recorded in bank widening and incision, are of episodic character. The term, frequency, and duration of the measurement periods can affect the results obtained considerably and make their comparison difficult; therefore, standardisation of measurement methods is advisable. It is also of key importance to investigate the river regime and the course of deposit transport in the channel from source to sink thoroughly [7,13,22,32,33,35,36,73].
Acknowledgments
The study was carried out in the summer seasons of 2009–2013 in the Scott River catchment with the participation of the team of the Maria Curie–Skłodowska University Polar Expeditions. The study was supported by the following scientific projects: Polish Ministry of Science N N306 525738; National Science Centre 2011/01/B/ST10/06996 ‘Mechanisms of fluvial transport and sediment supply to channels of Arctic rivers with various hydrological regimes (SW Spitsbergen)’, and the statutory research of FESSM MCSU ‘Application of TLS in geomorphological research’. The paper was prepared in the scope of promotion of project POIG.01.03.02-00-082/10. The authors are grateful for the field and technical assistance provided by Andrzej Gluza, Krzysztof Siwek, Grzegorz Gajek, Łukasz Franczak, Bartosz Skrzypek, Grzegorz Iwanicki, and Piotr Demczuk. The helpful comments of two anonymous reviewers and English-language proofreading by Jamie Dyer are greatly acknowledged.
Author Contributions
The authors conceptualised the study design together. W.K. conducted the field survey and data analysis, and authored the Results and Conclusions sections of the paper. G.J. co-authored the Introduction, and Materials and Methods sections. W.K. performed final editing of the paper.
Conflicts of Interest
The authors declare no conflict of interest.
References
- Hagen, J.O.; Kohler, J.; Melvold, K.; Winther, J.G. Glaciers in Svalbard: Mass balance, runoff and freshwater flux. Polar Res. 2003, 22, 145–159. [Google Scholar] [CrossRef]
- Ballantyne, C.K. A general model of paraglacial landscape response. Holocene 2002, 12, 371–376. [Google Scholar] [CrossRef]
- Ballantyne, C.K. Paraglacial geomorphology. Quat. Sci. Rev. 2002, 21, 1935–2017. [Google Scholar] [CrossRef]
- Ballantyne, C.K. Paraglacial landform succession and sediment storage in deglaciated mountain valleys: Theory and approaches to calibration. Z. Geomorphol. Suppl. 2003, 132, 1–18. [Google Scholar]
- Mercier, D. Paraglacial and paraperiglacial landsystems: Concepts, temporal scales and spatial distribution. Géomorphologie 2008, 14, 223–233. [Google Scholar] [CrossRef]
- Warburton, J. An alpinie proglacial fluvial sediment budget. Geogr. Ann. A 1990, 72, 261–272. [Google Scholar] [CrossRef]
- Warburton, J. Sediment budgets and rates of sediment transfer across cold environments in Europe: A commentary. Geogr. Ann. A 2007, 89, 95–100. [Google Scholar] [CrossRef]
- Lane, S.N.; Bakker, M.; Gabbud, C.; Micheletti, N.; Saugy, J.N. Sediment export, transient landscape response and catchment-scale connectivity following rapid climate warming and Alpine glacier recession. Geomorphology 2017, 277, 210–227. [Google Scholar] [CrossRef]
- Kostrzewski, A.; Kaniecki, A.; Kapuściński, J.; Klimaczak, R.; Stach, A.; Zwoliński, Z. The dynamics and rate of denudation of glaciated and non-glaciated catchments, central Spitsbergen. Pol. Polar Res. 1989, 10, 317–367. [Google Scholar]
- Marren, P.M.; Toomath, S.C. Fluvial adjustments in response to glacier retreat: Skaftafellsjökull, Iceland. Boreas 2013, 42, 57–70. [Google Scholar] [CrossRef]
- Marren, P.M.; Toomath, S.C. Channel pattern of proglacial rivers: Topographic forcing due to glacier retreat. Earth Surf. Proc. Landf. 2014, 39, 943–951. [Google Scholar] [CrossRef]
- Owczarek, P.; Nawrot, A.; Migała, K.; Malik, I.; Korabiewski, B. Flood-plain responses to contemporary climate change in small high-Arctic basins (Svalbard, Norway). Boreas 2014, 43, 384–402. [Google Scholar] [CrossRef]
- Beylich, A.; Laute, K. Sedimet sources, spatiotemporal variability and rates of fluvial bedload transport in glacier-connected steep mountain valleys in western Norway (Erdalen and Bødalen drainage basins). Geomorphology 2015, 228, 552–567. [Google Scholar] [CrossRef]
- Carrvick, J.L.; Heckmann, T. Short-term geomorphological evolution of proglacial systems. Geomorphology 2017, 287, 3–28. [Google Scholar] [CrossRef]
- Hasholt, B. Hydrology and Transport of Material in the Sermilik Area 1972. Geogr. Tidsskr. Den. 1976, 75, 30–39. [Google Scholar] [CrossRef]
- Hodgkins, R. Glacier hydrology in Svalbard, Norwegian high arctic. Quat. Sci. Rev. 1997, 16, 957–973. [Google Scholar] [CrossRef]
- Hodgkings, R.; Cooper, R.; Wadham, J.; Tranter, M. Suspended sediment fluxes in a high-Arctic glacierised catchment: Implications for fluvial sediment storage. Sediment. Geol. 2003, 162, 105–117. [Google Scholar] [CrossRef]
- Hodgkins, R.; Cooper, R.; Wadham, J.; Tranter, M. The hydrology of the proglacial zone of high-Arctic glacier (Finsterwalderbreen, Svalbard). Atmospheric and surface water fluxes. J. Hydrol. (Amst.) 2009, 378, 150–160. [Google Scholar] [CrossRef] [Green Version]
- Hodgkins, R.; Tranter, M.; Dowdeswell, M.A. The characteristics and formation of a high-arctic proglacial icing. Geogr. Ann. A 2004, 86, 265–275. [Google Scholar] [CrossRef]
- Hodson, A.; Tranter, M.; Gurnell, A.; Clark, M.; Hagen, J.O. The hydrochemistry of Bayelva, a high Artic progalcial stream in Svalbard. J. Hydrol. (Amst.) 2002, 257, 91–114. [Google Scholar] [CrossRef]
- Maizels, J.K. Channel changes, paleohydrology and deglaciation: Evidence from some Late Galcial sandur deposits of Northeast Scotland. Quat. Study Pol. 1983, 4, 171–187. [Google Scholar] [CrossRef]
- Orwin, J.F.; Lamoureux, S.F.; Warburton, J.; Beylich, A.A. A framework for characterizing fluvial sediment fluxes from source to sink in cold environments. Geogr. Ann. A 2010, 92, 155–176. [Google Scholar] [CrossRef]
- Rachlewicz, G. Floods in high Arctic Valley systems and their geomorfologic effects (examples from Billefjorden, Central Spitsbergen). Landf. Anal. 2007, 5, 66–70. [Google Scholar]
- Rachlewicz, G. Contemporary Sediment Fluxes and Relief Changes in High Arctic Glacierized Valley Systems (Billefjorden, Central Spitsbergen); sec. Geografia, No. 87; Adam Mickiewicz University Press: Poznań, Poland, 2009; p. 213. [Google Scholar]
- Rachlewicz, G. River floods in glacier-covered catchments of the high Arctic: Billefjorden- Wijdefjorden, Svalbard. Nor. Geogr. Tidsskr. 2009, 63, 115–122. [Google Scholar] [CrossRef]
- Sobota, I.; Nowak, M.; Weckwerth, P. Long-term changes of glaciers in north-western Spitsbergen. Glob. Planet. Chang. 2016, 144, 182–197. [Google Scholar] [CrossRef]
- Kociuba, W.; Janicki, G. Continuous measurements of bedload transport rates in a small glacial river catchment in the summer season (Spitsbergen). Geomorphology 2014, 212, 58–71. [Google Scholar] [CrossRef]
- Kociuba, W.; Janicki, G.; Siwek, K. Dynamics of changes the bed load outflow from a small glacial catchment (West Spitsbergen). In Monitoring, Simulation, Prevention and Remediation of Dense Debris Flow III; de Wrachien, D., Brebbia, C.A., Eds.; WITPress: Southampton, UK, 2010; pp. 261–270. [Google Scholar]
- Kociuba, W.; Janicki, G.; Siwek, K. Variability of sediment transport in the Scott River catchment (Svalbard) during the hydrologically active season of 2009. Quaest. Geogr. 2014, 33, 39–49. [Google Scholar] [CrossRef]
- Kociuba, W. Assessment of sediment sources throughout the proglacial area of a small Arctic catchment based on high-resolution digital elevation models. Geomorphology 2017, 287, 73–89. [Google Scholar] [CrossRef]
- Kociuba, W. Determination of the bedload transport rate in a small proglacial High Arctic stream using direct, semi-continuous measurement. Geomorphology 2017, 287, 10–115. [Google Scholar] [CrossRef]
- Beylich, A.A. Mass Transfers and Sedimentary Budgets in Geomorphologic Drainage Basin Studies. In Advanced Topics in Mass Transfer; El-Amin, M., Ed.; InTech: Rijeka, Croatia, 2011; pp. 399–422. ISBN 978-953-307-333-0. [Google Scholar]
- Zwolinski, Z. Hydrological polar monitoring–methodical proposition. Monit. Nat. Environ. 2007, 8, 29–39. (In Polish) [Google Scholar]
- Kociuba, W. The Mechanism and Dynamics of Sediment Supply and Fluvial Transport in a Glacial Catchment; Maria Curie-Sklodowska University Press: Lublin, Poland, 2015. (In Polish) [Google Scholar]
- Kociuba, W. Measurements of bedload flux in a high Arctic environment. In Source-to-Sink-Fluxes in Undisturbed Cold Environments; Beylich, A.A., Dixon, J.C., Zwoliński, Z., Eds.; Cambridge University Press: Cambridge, UK, 2016; pp. 116–132. [Google Scholar]
- Beylich, A.A. Quantitative studies on sediment fluxes and sediment budgets in changing cold environments–potential and expected benefit of coordinated data exchange and the unification of methods. Landf. Anal. 2007, 5, 9–10. [Google Scholar]
- Rachlewicz, G.; Zwoliński, Z.; Kociuba, W.; Stawska, M. Field testing of three bedload samplers’ efficiency in a gravel-bed river, Spitsbergen. Geomorphology 2017, 287, 90–100. [Google Scholar] [CrossRef]
- Marren, P.M. Magnitude and frequency in proglacial rivers: A geomorphological and sedimentological perspective. Earth Sci. Rev. 2005, 70, 203–251. [Google Scholar] [CrossRef]
- Kociuba, W.; Janicki, G. Spatiotemporal variability of the channel pattern of high Arctic proglacial rivers. In Fluvial Geomorphology and Riparian Vegetation: Environmental Importance, Functions and Effects on Climate Change; Duncan, N., Ed.; Nova Science Publishers, Inc.: New York, NY, USA, 2015; pp. 53–80. [Google Scholar]
- Kociuba, W.; Janicki, G.; Dyer, J.L. A multi-dimensional analysis of channel patterns of the proglacial Scott River reflected in environment catchment change. Land. Degrad. Dev. 2018, in press. [Google Scholar]
- Midgley, T.L.; Fox, G.A.; Heeren, D.M. Evaluation of the bank stability and toe erosion model (BSTEM) for predicting lateral streambank retreat on composite streambanks. Geomorphology 2012, 145–146, 107–114. [Google Scholar] [CrossRef]
- Daly, E.R.; Miller, R.B.; Fox, G.A. Modeling streambank erosion and failure along protected and unprotected composite streambanks. Adv. Water Res. 2015, 81, 114–127. [Google Scholar] [CrossRef]
- Lotsari, E.; Wang, Y.; Kaartinen, H.; Jaakkola, A.; Kukko, A.; Vaaja, M.; Hyyppä, A.; Hyyppä, J.; Alho, P. Gravel transport by ice in a subarctic river from accurate laser scanning. Geomorphology 2015, 246, 113–122. [Google Scholar] [CrossRef]
- Froehlich, W. Dynamics of fluvial transport in the Kamienica Nawojowska. Geogr. Stud. 1975, 114, 1–122. (In Polish) [Google Scholar]
- Froehlich, W. The mechanism of fluvial transport and waste supply into the stream channel in a mountainous flysch catchment. Geogr. Stud. 1982, 143, 1–144. (In Polish) [Google Scholar]
- Trucotte, B.; Brian Morse, B.; Bergeron, N.E.; Roy, A.G. Sediment transport in ice-affected rivers. J. Hydrol. 2011, 409, 561–577. [Google Scholar] [CrossRef]
- Tremblay, P.; Robert Leconte, R.; Lacey, R.W.J.; Bergeron, N. Multi-day anchor ice cycles and bedload transport in a gravel-bed stream. J. Hydrol. 2014, 519, 364–375. [Google Scholar] [CrossRef]
- Requena, P.; Weichert, R.B.; Minor, H.E. Self widening by lateral erosion in gravel bed rivers. In River Flow; Ferreira, R.M.L., Alves, E.C.T.L., Leal, J.G.A.B., Cardoso, A.H., Eds.; Taylor & Francis Group: London, UK, 2006; pp. 1801–1809. ISBN 0-415-40815-6. [Google Scholar]
- Picco, L.; Tonon, A.; Rainato, R.; Lenzi, M. Bank erosion and large wood recruitment along a gravel bed river. J. Agric. Eng. 2016, 47, 72–81. [Google Scholar] [CrossRef]
- Fox, G.A.; Sheshukov, A.; Cruse, R.; Kolar, R.L.; Guertault, L.; Gesch, K.R.; Dutnell, R.C. Reservoir sedimentation and upstream sediment sources: Perspectives and future research needs on streambank and gully erosion. Environ. Manag. 2016, 57, 945–955. [Google Scholar] [CrossRef] [PubMed]
- Fox, G.A.; Wilson, G.V. The role of subsurface flow in hillslope and stream bank erosion: A review. Soil Sci. Soc. Am. J. 2010, 74, 717–733. [Google Scholar] [CrossRef]
- Bartoszewski, S.; Gluza, A.; Siwek, K.; Zagórski, P. Temperature and rainfall control of outflow from the Scott Glacier catchment (Svalbard) in the summers of 2005 and 2006. Nor. Geogr. Tidsskr. 2009, 63, 107–114. [Google Scholar] [CrossRef]
- Kociuba, W.; Janicki, G.; Siwek, K.; Gluza, A. Bedload transport as an indicator of contemporary transformations of arctic fluvial systems. In Monitoring, Simulation, Prevention and Remediation of Dense and Debris Flows IV; de Wrachien, D., Brebbia, C.A., Mambretti, S., Eds.; WIT Press: Boston, UK, 2012; pp. 125–135. [Google Scholar]
- Bartoszewski, S. Regime of outflow of the Wedel Jarlsberg’s Land rivers (Spitsbergen). In Faculty of Biology and Earth Sciences Maria Curie-Sklodowska University in Lublin; Habilitation Dissertations 40; Maria Curie-Skłodowska University Press: Lublin, Poland, 1998. (In Polish) [Google Scholar]
- Franczak, L.; Kociuba, W.; Gajek, G. Runoff Variability in the Scott River (SW Spitsbergen) in Summer Seasons 2012–2013 in Comparison with the Period 1986–200. Quaest. Geogr. 2016, 35, 39–50. [Google Scholar] [CrossRef]
- Kociuba, W.; Janicki, G. Changeability of movable bed-surface particles in natural, gravel-bed channels and its relation to bedload grain size distribution (Scott River, Svalbard). Geogr. Ann. A 2015, 97, 507–521. [Google Scholar] [CrossRef]
- Surfer® User’s Guide. Contouring and 3D Surface Mapping for Scientists and Engineers; Golden Software, LLC: Golden, CO, USA, 2015. [Google Scholar]
- Medrak, K.; Gluza, A.; Siwek, K.; Zagórski, P. The meteorological conditions on the Calypsobyen in summer 2014 on the background of multiyear 1986–2011. Probl. Klimatol. Polarnej 2014, 24, 37–50. (In Polish) [Google Scholar]
- Bartoszewski, S.; Gluza, A.; Siwek, K.; Zagórski, P. The functioning of Scott Glacier in conditions of climate global changes. Landf. Anal. 2007, 5, 5–8. [Google Scholar]
- Zagórski, P.; Siwek, K.; Gluza, A.; Bartoszewski, S. Changes in the extent and geometry of the Scott Glacier, Spitsbergen. Pol. Polar Res. 2008, 29, 163–185. [Google Scholar]
- Rodzik, J.; Gajek, G.; Reder, J.; Zagórski, P. Glacial Geomorphology. In Geographical Environment of NW Part of Wedel Jarlsberg Land (Spitsbergen, Svalbard); Zagórski, P., Harasimiuk, M., Rodzik, J., Eds.; Maria Curie-Sklodowska University Press: Lublin, Poland, 2013; pp. 36–165. [Google Scholar]
- Østrem, G.; Bridg, C.W.; Rannie, W.F. Glacio-hydrology, discharge and sediment transport in the Decade Glacier area, Baffin Island, N.W.T. Geogr. Ann. A 1967, 49A, 268–282. [Google Scholar] [CrossRef]
- Hammer, K.M.; Smith, N.D. Sediment production and transport in proglacial stream: Hilda Glacier, Alberta, Canada. Boreas 1983, 12, 91–106. [Google Scholar] [CrossRef]
- Ashworth, P.J.; Ferguson, R.I. Interrelationships of channel processes, changes and sediments in a proglacial braided river. Geogr. Ann. A 1986, 68, 361–371. [Google Scholar] [CrossRef]
- Ferguson, R.I.; Ashworth, P.J. Spatial patterns of bedload transport and channel change in braided and near-braided rivers. In Dynamics of Gravel-Bed Rivers; Billi, P., Hey, R.D., Thorne, C.R., Tacconi, P., Eds.; John Wiley: Chichester, UK, 1992; pp. 477–496. [Google Scholar]
- Pearce, J.T.; Pazzaglia, F.J.; Evenson, E.B.; Lawson, D.E.; Alley, R.B.; Germanoski, D.; Denner, J.D. Bedload component of glacially discharged sediment: Insights from the Matanuska Glacier, Alaska. Geology 2003, 31, 7–10. [Google Scholar] [CrossRef]
- Leopold, L.B.; Wolman, M.G.; Miller, J.P. Fluvial Processes in Geomorphology; W.H. Fremann & Co.: San Francisco, CA, USA, 1964; pp. 1–522. [Google Scholar]
- Montgomery, D.R.; Buffington, J.M. Channel processes, classification and response. In River Ecology and Management; Naiman, R., Biłby, R., Eds.; Springer: New York, NY, USA, 1988; pp. 13–42. [Google Scholar]
- Teisseyre, A.K. River classification in the light of analysis of the fluvial system and hydraulic geometry. Prace Geol. Mineral. 1991, 22, 1–204. (In Polish) [Google Scholar]
- Bisson, A.; Montgomery, D.R.; Buffington, J.M. Valley Segments, Stream eaches, and Channel Units. In Methods in Stream Ecology; Elsevier: Amsterdam, The Netherlands, 2017. [Google Scholar]
- Beylich, A.A.; Laute, K. Combining impact sensor field and laboratory flume measurements with other techniques for studying fluvial bedload transport in steep mountain streams. Geomorphology 2014, 218, 72–87. [Google Scholar] [CrossRef]
- Palmer, J.A.; Schilling, K.E.; Isenhartc, T.M.; Schultz, R.C.; Tomerd, M.D. Streambank erosion rates and loads within a single watershed: Bridging the gap between temporal and spatial scales. Geomorphology 2014, 209, 66–78. [Google Scholar] [CrossRef]
- Analysis of Source-To-Sink Fluxes and Sediment Budgets in Changing High-Latitude and High-Altitude Cold Environments, 1st ed.; Beylich, A.A.; Warburton, J. (Eds.) SEDIFLUX Manual; Norwegian Geological Survey Report: Oslo, Norway, 2007; pp. 1–158. [Google Scholar]
- Szpikowski, J.; Szpikowsk, G.; Zwolińskia, Z.; Rachlewicz, G.; Kostrzewski, A.; Marciniak, M.; Dragon, K. Character and rate of denudation in a High Arctic glacierized catchment (Ebbaelva, Central Spitsbergen). Geomorphology 2014, 218, 52–62. [Google Scholar] [CrossRef]
Figure 1.
Location of the study site: (A) on the Svalbard Archipelago and NW part of Wedel-Jarlsberg Land: 1. valley glaciers, 2. glacial accumulation zones/terminoglacial zones, 3. rivers and water bodies, 4. catchment border; (B) on the lower part of the Scott River catchment with marked measurement cross sections XS I and XS II (background aerial photo by NPI (2011; Available online: http://toposvalbard.npolar.no/flyfoto.html?id=25163523; accessed on 9 March 2018).
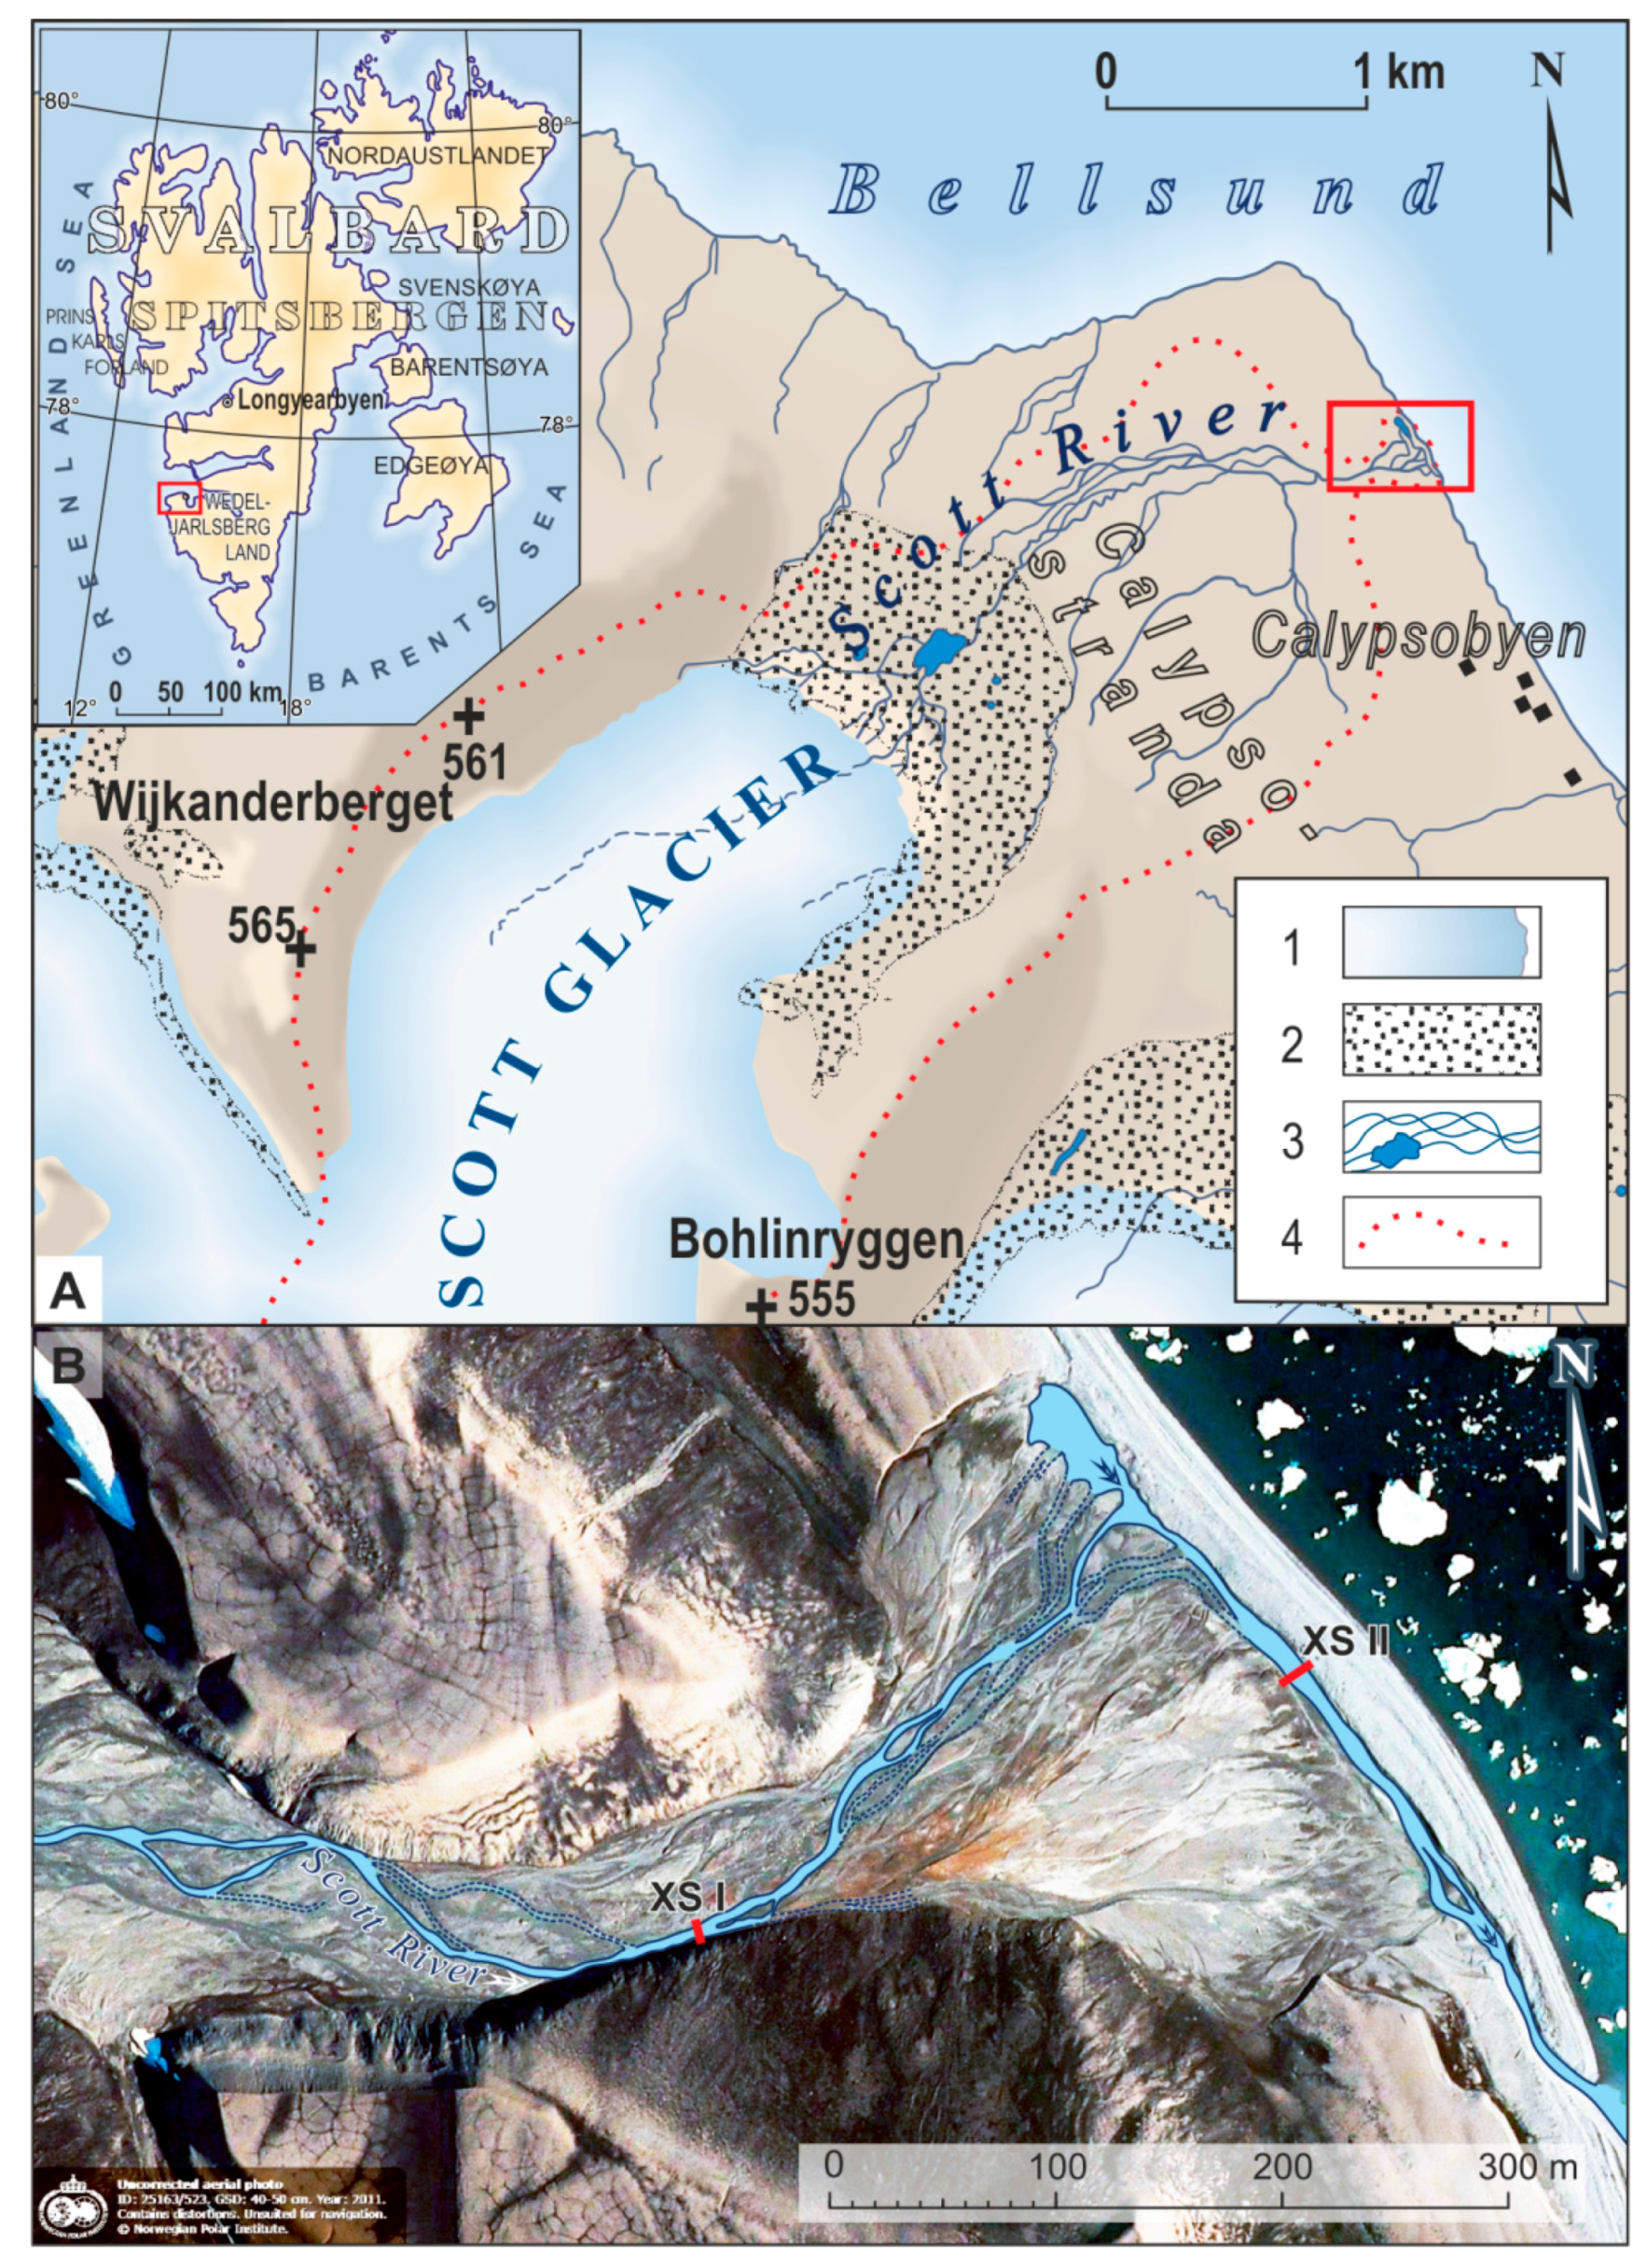
Figure 2.
(A) Downstream view of the lower part of the Scott River valley (in the foreground is the location of cross-section—XS I where the gorge is cutting through lifted marine terraces); (B) upstream view of the second cross-section—XS II; (C) an example of the GNSS survey in the Scott River cross-sections (XS II).

Figure 3.
Changes in the channel bottom in XS I between 2009 and 2013: 1. Bedrock, 2. Current stage, 3. Previous stage (last season), 4. Dry streambank.
Figure 3.
Changes in the channel bottom in XS I between 2009 and 2013: 1. Bedrock, 2. Current stage, 3. Previous stage (last season), 4. Dry streambank.

Figure 4.
Changes in the channel bottom in XS II between 2009 and 2013: 1. Bedrock, 2. Current stage, 3. Previous stage (last season), 4. Dry streambank.
Figure 4.
Changes in the channel bottom in XS II between 2009 and 2013: 1. Bedrock, 2. Current stage, 3. Previous stage (last season), 4. Dry streambank.

Figure 5.
Changes in the channel bottom in XS I in 2012: 1. Bedrock, 2. Current stage, 3. Previous stage, 4. Dry streambank.
Figure 5.
Changes in the channel bottom in XS I in 2012: 1. Bedrock, 2. Current stage, 3. Previous stage, 4. Dry streambank.
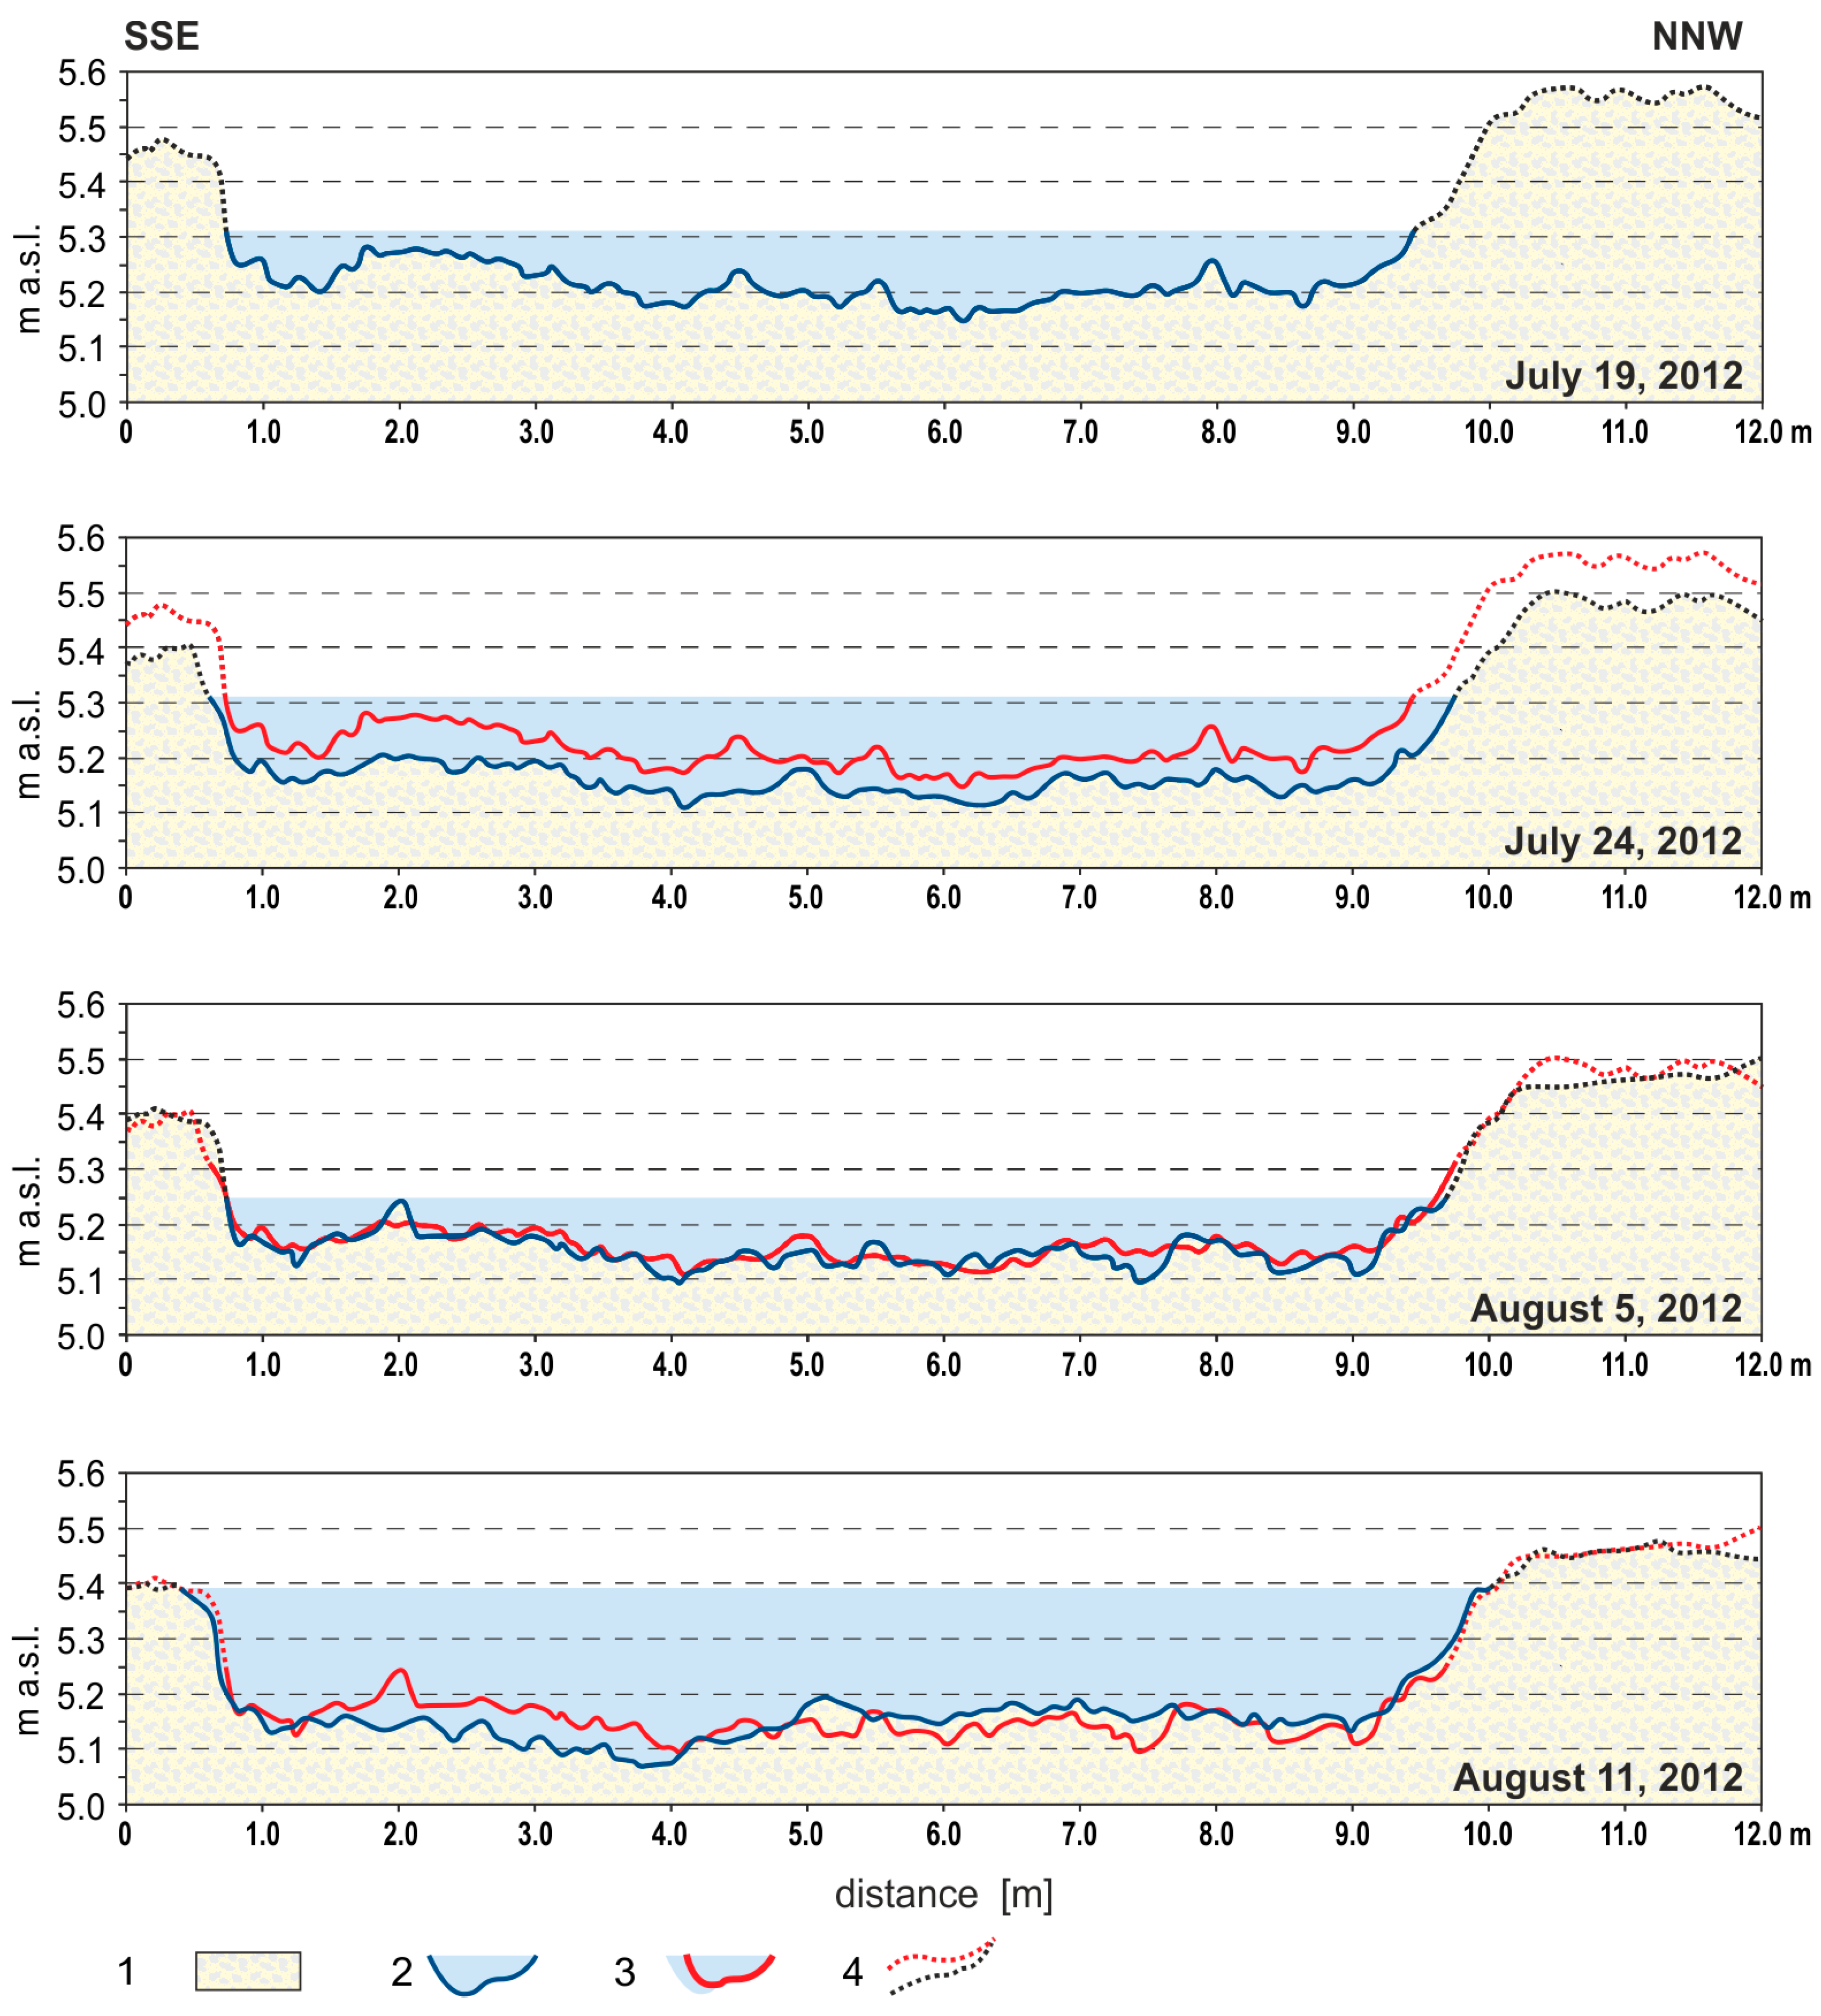
Figure 6.
Changes in the channel bottom in XS II in 2012: 1. Bedrock, 2. Current stage, 3. Previous stage, 4. Dry streambank.
Figure 6.
Changes in the channel bottom in XS II in 2012: 1. Bedrock, 2. Current stage, 3. Previous stage, 4. Dry streambank.

Figure 7.
Changes in the channel bottom in XS I in 2013: 1. Bedrock, 2. Current stage, 3. Previous stage, 4. Dry streambank.
Figure 7.
Changes in the channel bottom in XS I in 2013: 1. Bedrock, 2. Current stage, 3. Previous stage, 4. Dry streambank.
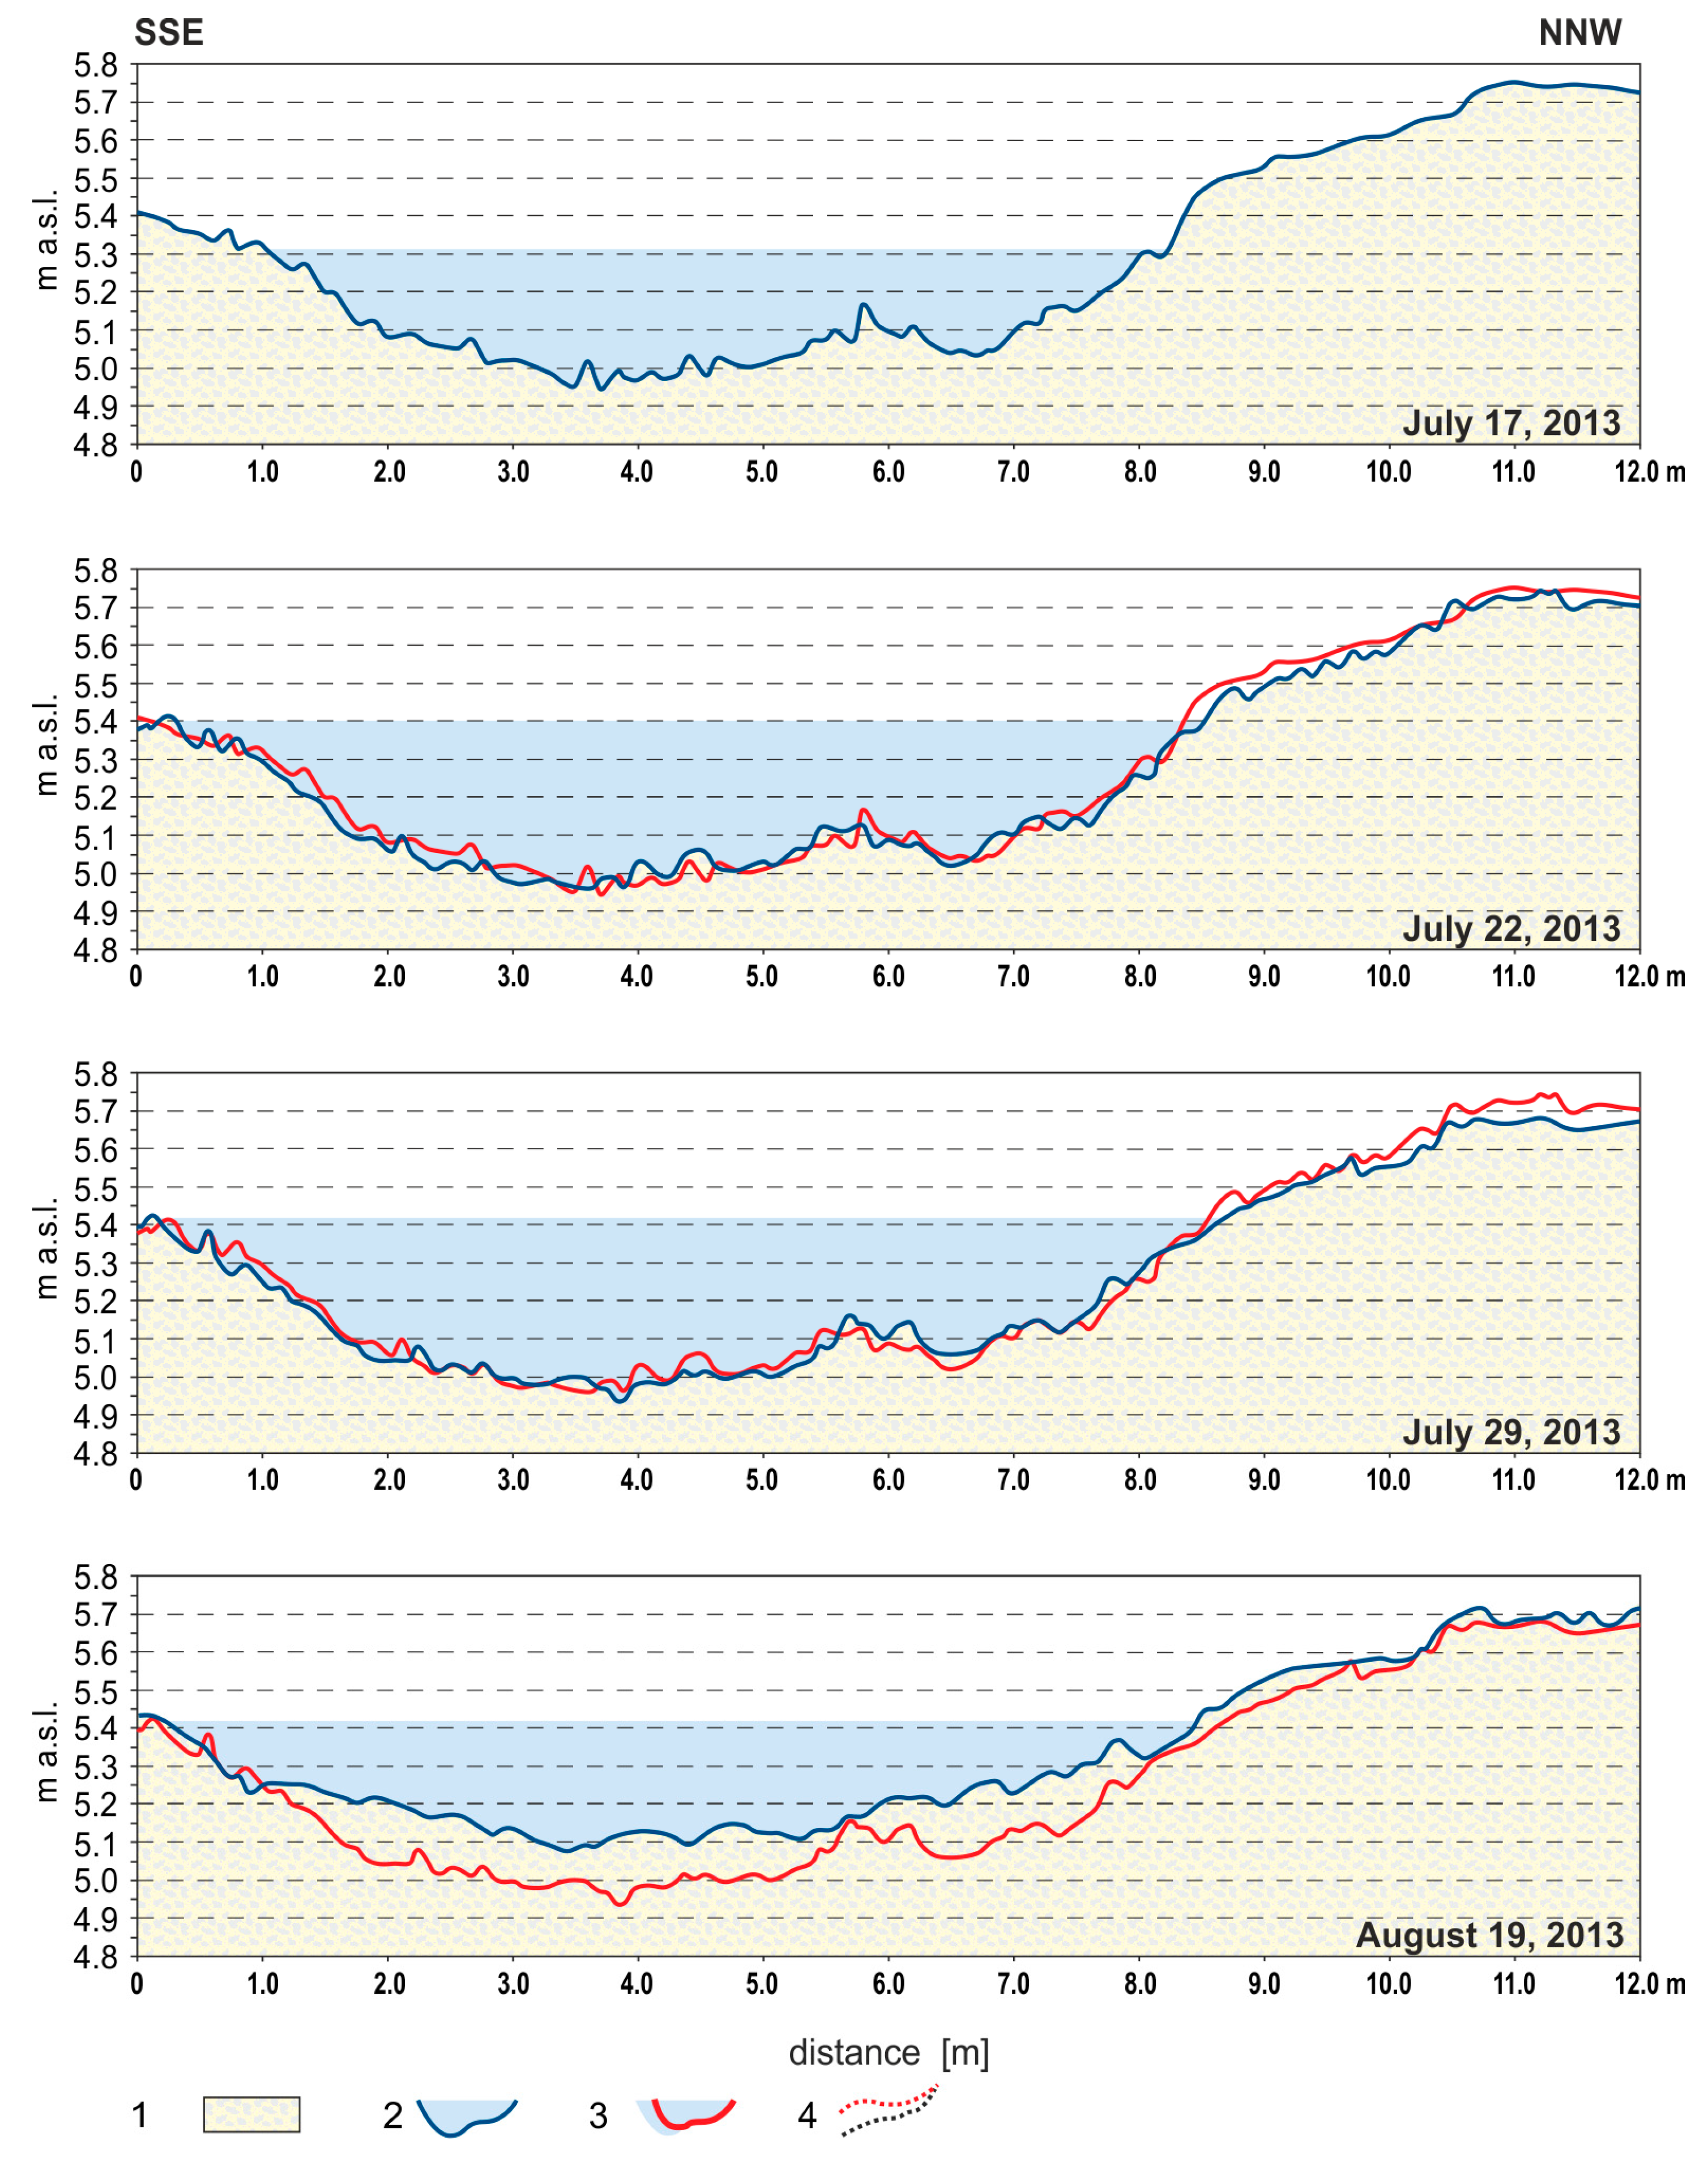
Figure 8.
Changes in the channel bottom in cross-section II in 2013: 1. Bedrock, 2. Current stage, 3. Previous stage, 4. Dry streambank.
Figure 8.
Changes in the channel bottom in cross-section II in 2013: 1. Bedrock, 2. Current stage, 3. Previous stage, 4. Dry streambank.

Table 1.
Variability of selected hydro-meteorological components in the Scott River catchment in the years 2009–2013 relative to the multiannual averages. The data are presented by different sources: Kociuba, Janicki [27,56]; Kociuba et al. [29]; Medrak [58]; Franczak et al. [55]; Kociuba [34].
| Season | Air Temperature (°C) | Precipitation Sum Total (mm) | Water Temperature (°C) | Channel Wide (m) | Water Velocity (m·s−1) | Water Discharge (m3·s−1) |
|---|---|---|---|---|---|---|
| 2009 10.07–06.09 | 2.0–7.0 (4.9) * | 18.1 | - | 7–11 | - | 1.3–2.4 (2.0) |
| 2010 27.06–10.08 | 1.9–6.2 (4.5) | 8.6 | - | 9.2–10.4 (10.0) | 0.58–1.13 (0.71) | 0.7–1.8 (1.19) |
| 2011 09.07–23.08 | 1.5–7.2 (3.7) | 12.0 | - | - | - | - |
| 2012 12.07–23.08 | 2.0–7.1 (4.6) | 23.5 | 1.6–4.4 (3.2) | - | - | 0.3–2.2 (0.9) |
| 2013 10.07–18.08 | 2.7–7.9 (5.7) | 98.9 ** | 2.0–3.0 (2.8) | - | - | 0.74–2.7 (1.8) |
| 2009–2013 | 1.5–6.2 (4.7) | (32.2) | 1.6–4.4 (3.0) | - | - | 0.3–2.7 (1.5) |
| 1986–2011 | 0.2–10.2 (5.0) | (32.4) | - | - | - | 0.8–2.4 (0.96) * |
Notes: * minimum and maximum daily values of the parameters, mean value for the measurement period in brackets; ** according to Franczak et al. [55]. The measurements of discharge parameters were performed in a stationary mode at both cross-sections. Changes in water level were recorded at 10-min time intervals with the use of diver dataloggers. Discharge was calculated based on rating curves generated from water depth and flow velocity measured every week by propeller current meters and portable acoustic digital current meters.
Table 2.
Inter-annual variability of channel processes and intensity of streambank erosion in the Scott River channel.
Table 2.
Inter-annual variability of channel processes and intensity of streambank erosion in the Scott River channel.
| Channel Processes | ||||||||||||
|---|---|---|---|---|---|---|---|---|---|---|---|---|
| SSE Streambank | Channel Bottom | NNW Stream Bank | Channel Total | |||||||||
| Time | S (m2) | F (m2) | B (m2) | S (m2) | F (m2) | B (m2) | S (m2) | F (m2) | B (m2) | S (m2) | F (m2) | B (m2) |
| A. Cross-section I (XS I) | ||||||||||||
| July, 2009 | - | - | - | - | - | - | - | - | - | - | - | - |
| July, 2010 | 0.06 | 0.01 | −0.05 | 0.18 | 0.01 | −0.17 | 0.22 | 0.13 | −0.08 | 0.45 | 0.15 | −0.31 |
| July, 2011 | 0.06 | 0.02 | −0.04 | 0.18 | 0.47 | +0.29 | 0.49 | 0 | −0.49 | 0.73 | 0.49 | −0.24 |
| July, 2012 | 0.04 | 0.04 | 0 | 0.23 | 0.07 | −0.16 | 0 | 0.11 | +0.11 | 0.27 | 0.22 | −0.05 |
| July, 2013 | 0.01 | 0.11 | +0.1 | 0.57 | 0.0 | −0.57 | 0 | 1.16 | +1.16 | 0.58 | 1.27 | +0.69 |
| B. Cross-section II (XS II) | ||||||||||||
| July, 2010 | - | - | - | - | - | - | - | - | - | - | - | - |
| July, 2011 | 0 | 0.07 | +0.07 | 0.82 | 0 | −0.82 | 0.05 | 0.07 | +0.02 | 0.87 | 0.14 | −0.73 |
| July, 2012 | 0.18 | 0 | −0.18 | 0.02 | 0.22 | +0.20 | 0.35 | 0 | −0.35 | 0.55 | 0.22 | −0.33 |
| July, 2013 | 0.32 | 0 | −0.32 | 1.25 | 0.0 | −1.25 | 0.34 | 0.09 | −0.25 | 1.91 | 0.09 | −1.82 |
Notes: S—scour, F—fill, B—balance.
Table 3.
Variability of channel processes and intensity of streambank erosion in the Scott River catchment outlet in the years 2012 and 2013.
Table 3.
Variability of channel processes and intensity of streambank erosion in the Scott River catchment outlet in the years 2012 and 2013.
| Channel Processes | ||||||||||||
|---|---|---|---|---|---|---|---|---|---|---|---|---|
| Time | SSE Streambank | Channel Bottom | NNW Stream Bank | Channel Total | ||||||||
| S (m2) | F (m2) | B (m2) | S (m2) | F (m2) | B (m2) | S (m2) | F (m2) | B (m2) | S (m2) | F (m2) | B (m2) | |
| A. Cross-section I (XS I) | ||||||||||||
| 2012 year | ||||||||||||
| 19 July | - | - | - | - | - | - | - | - | - | - | - | - |
| 24 July | 0.08 | 0 | −0.08 | 0.75 | 0 | −0.75 | 0.24 | 0 | −0.24 | 1.07 | 0 | −1.07 |
| 5 August | 0.01 | 0.02 | +0.01 | 0.07 | 0.06 | −0.01 | 0.05 | 0.01 | −0.04 | 0.13 | 0.09 | −0.04 |
| 11 August | 0.02 | 0 | −0.02 | 0.28 | 0.11 | −0.17 | 0.02 | 0.02 | 0 | 0.32 | 0.13 | −0.19 |
| 2013 year | ||||||||||||
| 17 July | - | - | - | - | - | - | - | - | - | - | - | - |
| 22 July | 0.04 | 0.01 | −0.03 | 0.08 | 0.06 | −0.02 | 0.10 | 0.01 | −0.09 | 0.22 | 0.08 | −0.14 |
| 29 July | 0.06 | 0.01 | −0.05 | 0.05 | 0.05 | 0 | 0.13 | 0.03 | −0.10 | 0.24 | 0.09 | −0.15 |
| 19 August | 0.01 | 0.01 | 0 | 0 | 0.8 | +0.8 | 0 | 0.13 | +0.13 | 0.01 | 0.94 | +0.93 |
| B. Cross-section II (XS II) | ||||||||||||
| 2012 year | ||||||||||||
| 19 July | - | - | - | - | - | - | - | - | - | - | - | - |
| 24 July | 0.19 | 0 | −0.19 | 0.45 | 0 | −0.45 | 0.06 | 0 | −0.06 | 0.70 | 0 | −0.70 |
| 5 August | 0.13 | 0 | −0.13 | 0.91 | 0.18 | −0.73 | 0.22 | 0 | −0.22 | 1.26 | 0.18 | −1.08 |
| 11 August | 0 | 0.04 | +0.04 | 0.08 | 0.63 | +0.55 | 0.12 | 0.20 | +0.08 | 0.20 | 0.76 | +0.50 |
| 2013 year | ||||||||||||
| 17 July | - | - | - | - | - | - | - | - | - | - | - | - |
| 29 July | 0.14 | 0 | +0.14 | 0.13 | 0.04 | −0.09 | 0.05 | 0.03 | −0.02 | 0.32 | 0.07 | −0.25 |
| 19 August | 0 | 0.09 | +0.09 | 0.08 | 2.55 | +2.47 | 1.77 | 0 | −1.77 | 1.85 | 2.64 | +0.79 |
Notes: S—scour, F—fill, B—balance.
Table 4.
Comparison of selected scour indices for the Scott River channel cross-sections.
| I.d. | Period | Wetted Area (m2) | Changes of Bedrock Top | Maximal Channel Width * (m) | Channel Widening (m) | |
|---|---|---|---|---|---|---|
| Area (m2) | Index (m2) | |||||
| Cross-section I (XS I) | ||||||
| 1 | VII 2009 | 2.14 | 3.88 | - | 8.74 | - |
| 2 | VII 2010 | 1.96 | 3.69 | −0.19 | 6.0 | −1.74 |
| 3 | VII 2011 | 1.58 | 3.48 | −0.21 | 10.03 | +4.03 |
| 4 | VII 2012 | 1.70 | 3.44 | −0.04 | 9.58 | −0.45 |
| 5 | VII 2013 | 1.90 | 3.60 | +0.16 | 7.77 | −1.81 |
| Cross-section II (XS II) | ||||||
| 1 | VII 2010 | 1.48 | 4.19 | - | 9.75 | - |
| 2 | VII 2011 | 2.20 | 3.48 | −0.71 | 9.51 | −0.24 |
| 3 | VII 2012 | 1.99 | 3.16 | −0.32 | 9.97 | +0.46 |
| 4 | VII 2013 | 1.98 | 2.71 | −0.44 | 11.42 | +1.45 |
Notes: * for XS I the parameter was determined for the water stage in the channel: H1 = 5.4 m a.s.l., and for XS II for water stage: H2 = 0.9 m a.s.l.
© 2018 by the authors. Licensee MDPI, Basel, Switzerland. This article is an open access article distributed under the terms and conditions of the Creative Commons Attribution (CC BY) license (http://creativecommons.org/licenses/by/4.0/).
Share and Cite
MDPI and ACS Style
Kociuba, W.; Janicki, G. Effect of Meteorological Patterns on the Intensity of Streambank Erosion in a Proglacial Gravel-Bed River (Spitsbergen). Water 2018, 10, 320. https://doi.org/10.3390/w10030320
AMA Style
Kociuba W, Janicki G. Effect of Meteorological Patterns on the Intensity of Streambank Erosion in a Proglacial Gravel-Bed River (Spitsbergen). Water. 2018; 10(3):320. https://doi.org/10.3390/w10030320
Chicago/Turabian StyleKociuba, Waldemar, and Grzegorz Janicki. 2018. "Effect of Meteorological Patterns on the Intensity of Streambank Erosion in a Proglacial Gravel-Bed River (Spitsbergen)" Water 10, no. 3: 320. https://doi.org/10.3390/w10030320
Note that from the first issue of 2016, this journal uses article numbers instead of page numbers. See further details here.