Grain Size Distribution of Bedload Transport in a Glaciated Catchment (Baranowski Glacier, King George Island, Western Antarctica)


1
Institute of Geophysics, Polish Academy of Sciences, 01-452 Warsaw, Poland
2
Institute of Biochemistry and Biophysics, Polish Academy of Sciences, 02-106 Warsaw, Poland
*
Author to whom correspondence should be addressed.
Water 2018, 10(4), 360; https://doi.org/10.3390/w10040360
Submission received: 20 February 2018
/
Revised: 11 March 2018
/
Accepted: 20 March 2018
/
Published: 23 March 2018
(This article belongs to the Special Issue Modeling and Practice of Erosion and Sediment Transport under Change)
Abstract
:The relationships among grain size distribution (GSD), water discharge, and GSD parameters are investigated to identify regularities in the evolution of two gravel-bed proglacial troughs: Fosa Creek and Siodło Creek. In addition, the potential application of certain parameters obtained from the GSD analysis for the assessment of the formation stage of both creeks is comprehensively discussed. To achieve these goals, River Bedload Traps (RBTs) were used to collect the bedload, and a sieving method for dry material was applied to obtain the GSDs. Statistical comparisons between both streams showed significant differences in flow velocity; however, the lack of significant differences in bedload transport clearly indicated that meteorological conditions are among the most important factors in the erosive process for this catchment. In particular, the instability of flow conditions during high water discharge resulted in an increase in the proportion of medium and coarse gravels. The poorly sorted fine and very fine gravels observed in Siodło Creek suggest that this trough is more susceptible to erosion and less stabilized than Fosa Creek. The results suggest that GSD analyses can be used to define the stage of development of riverbeds relative to that of other riverbeds in polar regions.
1. Introduction
One of the most important challenges in studies of bedload transport is investigating the differences between mobile and bottom particle sizes and taking these relations into account in new transport models [1,2,3,4]. This problem is mostly based on the lack of complex datasets for flow velocity, transport, and grain size distribution (GSD) of the bedload and bottom particles [2]. The lack of sufficient field observations and datasets collected during high flows when active transport is observed [5,6] is not the only problem associated with model development and geomorphological process assessments in Arctic or Antarctic catchments. The limited application of current models to natural gravel-bed rivers [7], and methods of predicting the sediment flux to the global ocean from small rivers [8] represent other problems that remain to be resolved.
Bedload transport is one of the main factors associated with changes in the morphology of troughs [9,10,11,12,13,14], and the difficulty describing the relationships among water flow conditions, GSD, and deposition processes was identified decades ago (e.g., [15,16,17,18]). Although a substantial amount of progress has been made in this field because of research conducted in laboratory channels (e.g., [19,20,21]) and field studies (e.g., [22,23,24,25,26]) and with the use of bedload transport models (e.g., [1,2,27,28,29,30]), the relationships among the factors associated with bedload transport are poorly understood in natural gravel-bed channels in general and in those located in polar regions in particular [31].
Ghoshal et al. [32] claimed that the bedload has a large influence on the GSD and determines the concentration of each size fraction of noncohesive particles under changing hydrological conditions. GSD analyses have frequently been used as indicators of the threshold for the initiation of particle motion, and shear stress dictates the specific role of particles in this process [10,33,34,35,36,37]. Johnson [38] suggested that the geomorphology of the bed as well as the sediment transport rate should be considered because of their relationship with grain size and shape. Moreover, the distribution of particles also depends on the mechanism of fluvial transport and can be used to define the influence of flow conditions on the geomorphology of the channel, as stated by Kociuba and Janicki [31] or Lisle [23]. Although the coarser fraction is entrained with greater discharge [39], because of protrusion and hiding effects, particles larger than the mean grain size are easier to move than smaller ones [40,41,42]. The above-mentioned situation may be understood by using the GSD for the analysis of selective bedload transport in natural gravel-bed channels [43] or by performing a direct analysis of certain parameters, such as the mean grain size, sorting, or skewness, which can be used to predict the direction of sediment transport [27,44]. These parameters allow us to obtain information about the predominant size of the transported particles, their dispersal during this process, and their symmetry or preferential dispersal to one side of the average. Ashworth et al. [45] concluded that sediment sorting can occur during entrainment, transport, or deposition. In this research, sediment sorting is calculated based on the sediment caught in traps during bedload transport.
The objective of this study is to answer the following questions: (1) How is GSD modified during the times of peak discharge in a polar catchment? (2) What is the relationship between the GSD and GSD parameters and the amount of transported material in gravel-bed rivers? (3) Does the modification of GSDs during efficient bedload transport events allow for the identification of the development stage of river troughs during changing meteorological conditions?
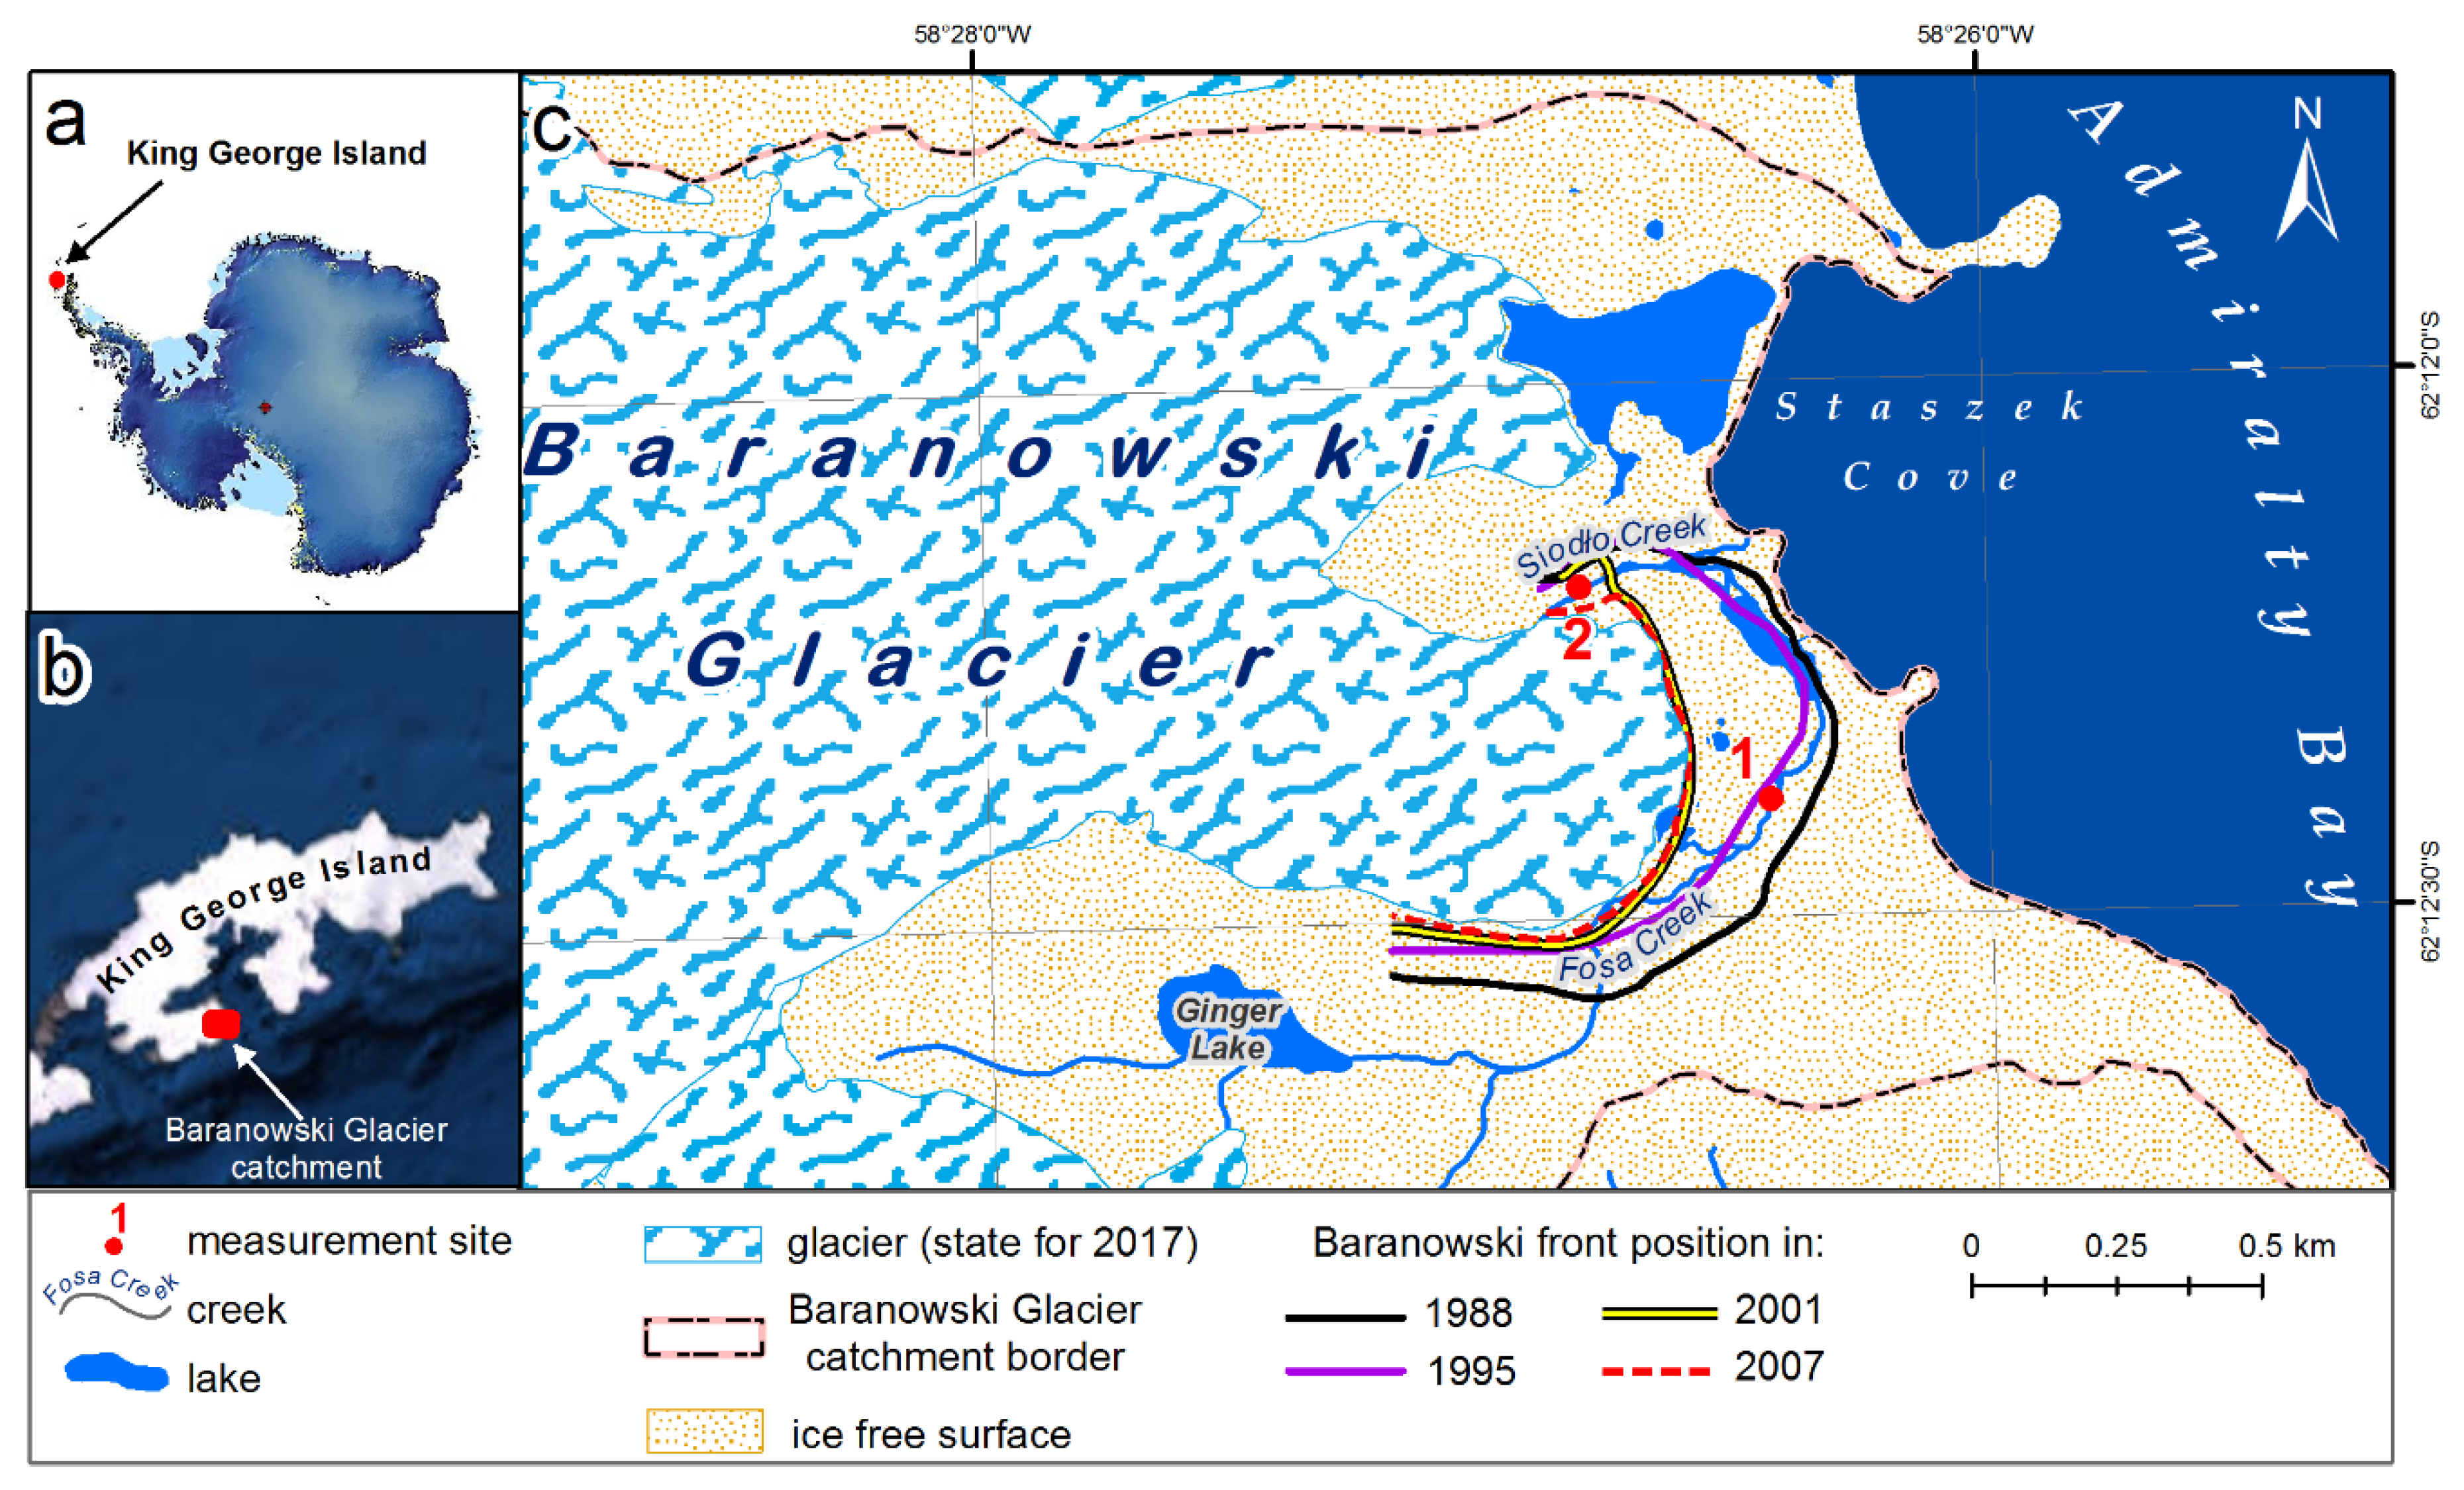
To answer these questions, insightful measurements have been performed in Fosa and Siodło creeks, two proglacial gravel-bed channels located on the forefield of the Baranowski Glacier on King George Island in Western Antarctica (Figure 1). This study is a continuation and development of the results presented by Sziło and Bialik [46], who identified the relationship between bedload transport and rapid outflow and high water discharge in the form of eight-loop hysteresis for these creeks.
2. Materials and Methods
The field campaign was conducted at two sites established in Fosa and Siodło creeks from 9 January to 11 February 2016 (Figure 1). Data on the bedload transport associated with water flow conditions measurements were collected at 24 h intervals over 35 days in both creeks. However, the measurements in Fosa Creek were extended to 2 March, and during those additional 14 days, bedload transport was not observed.
2.1. Study Site
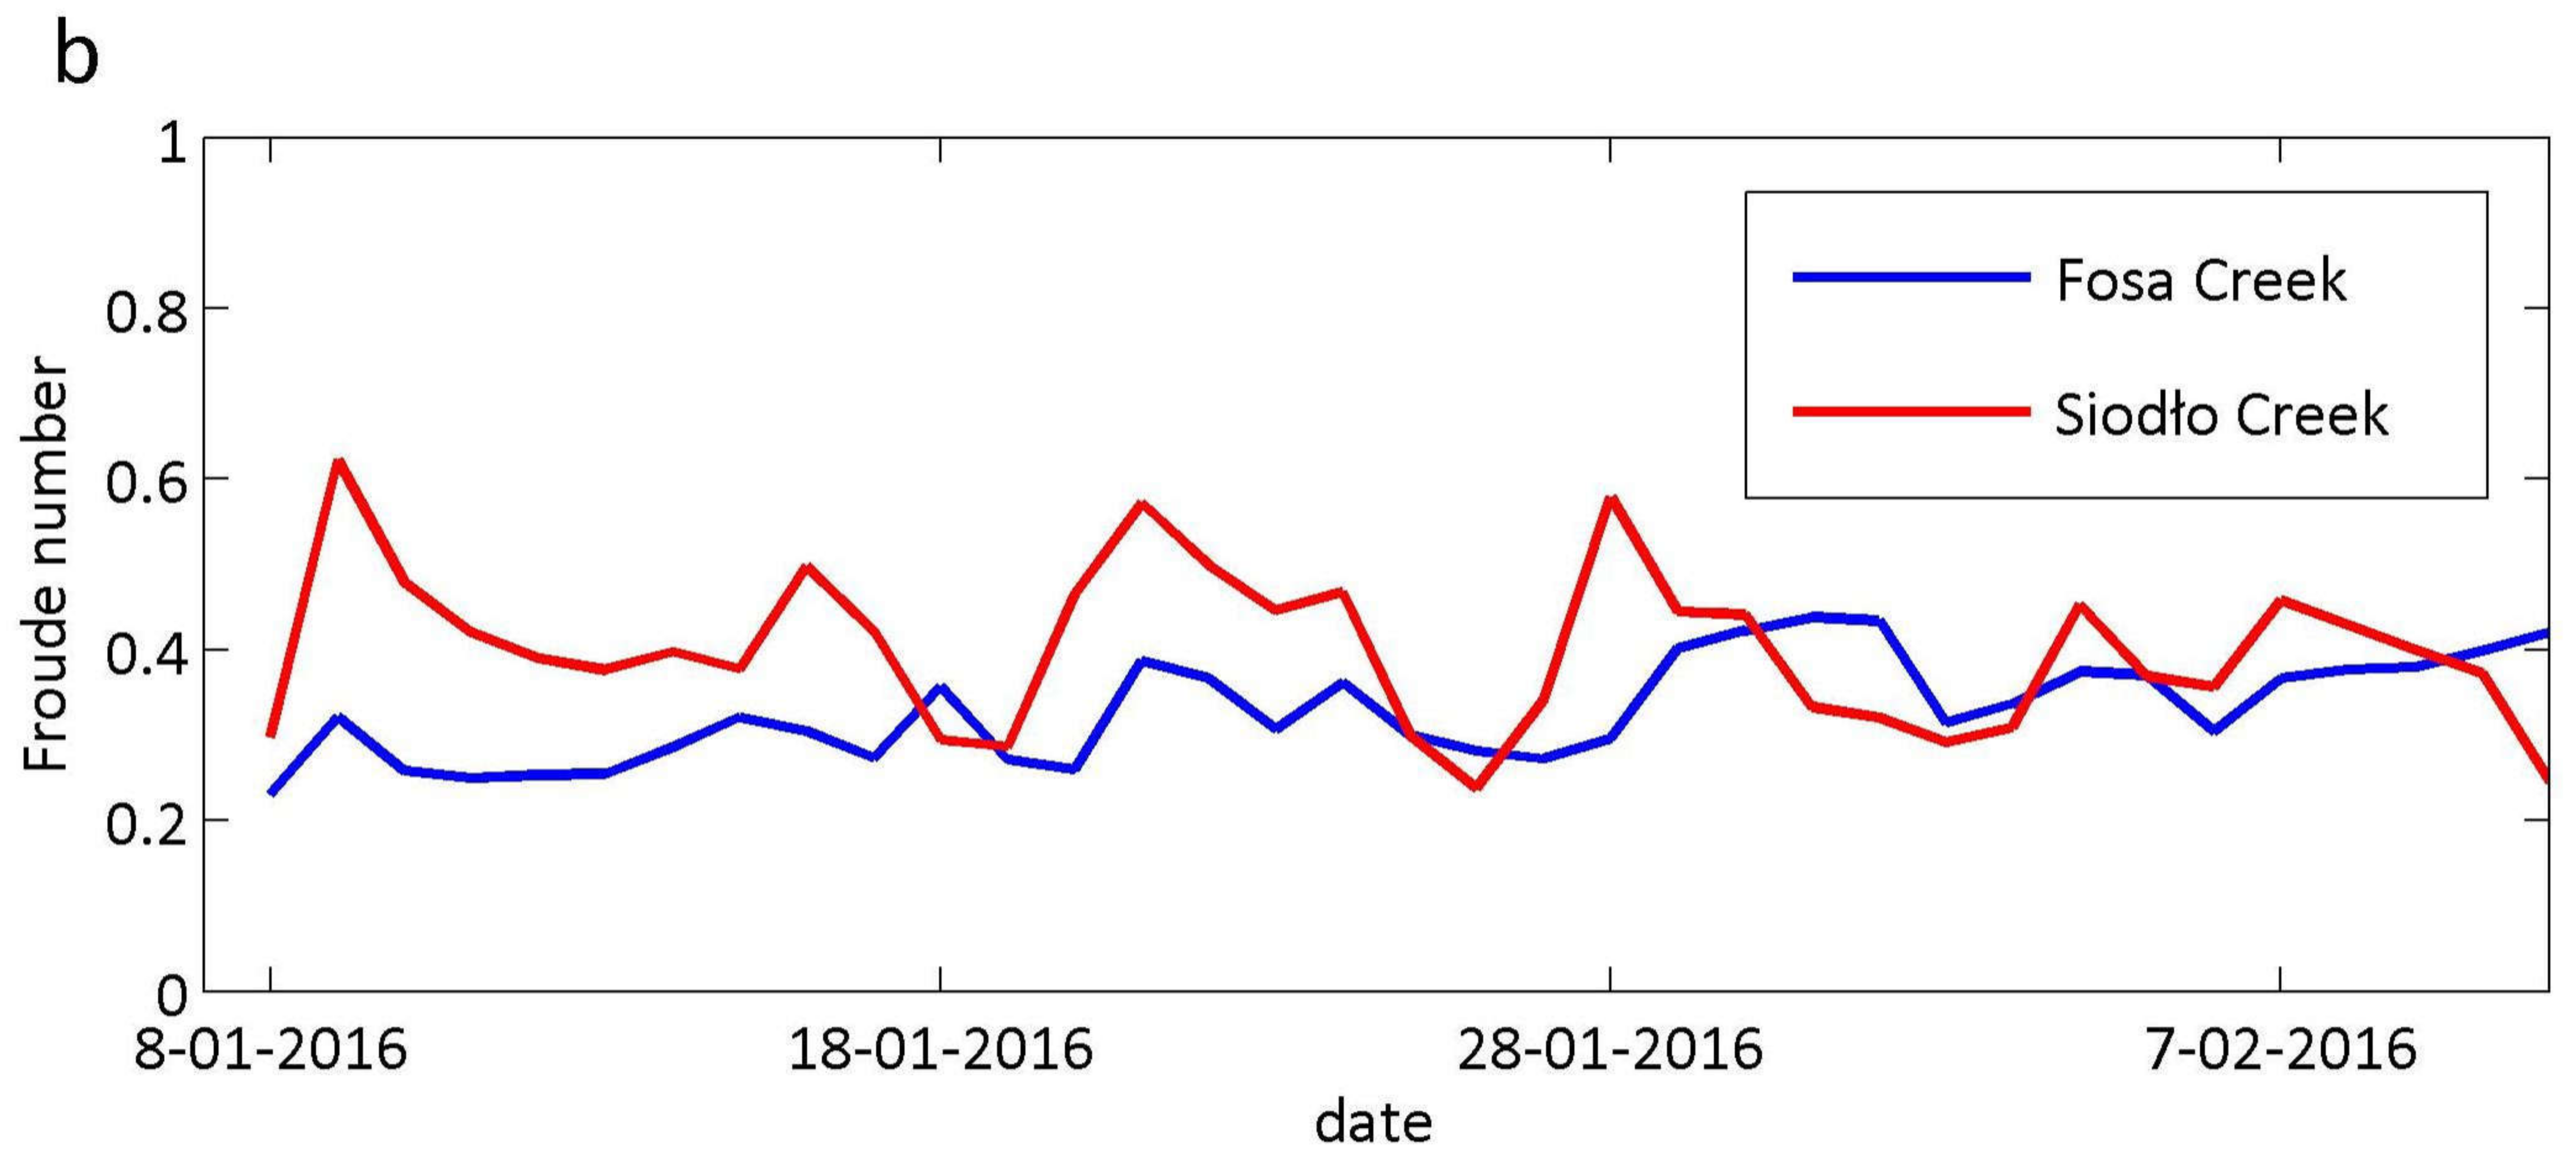
The Antarctic Peninsula region, where the study site is located, is prone to climatic fluctuations [47,48,49,50,51,52]. The total catchment area of the creeks is 6.8 km2 of which 69.1% (4.7 km2) is covered by the glacier (including Windy Glacier). The area of the forefield is 2.1 km2 and is expanding yearly (status for 2017). The frontal part of the glacier is divided into two tongues: Northern and Southern. The Northern tongue is currently terminating on a narrow strip of land close to the shallow lagoon, and the Southern tongue presents several creeks flowing through the forefield. All measurements were initiated in two gravel-bed troughs of the Fosa and Siodło proglacial creeks, which were selected because of their continuous and dynamic water flows during the entire summer season. Fosa Creek receives water mainly from Ginger Lake and the Baranowski Glacier, whereas Siodło Creek is a subglacial outflow from the Baranowski Glacier. Both creeks are fed by meltwater from the glacier in the ablation season (which may represent the primary source of water) and intensive rainfalls. The measurement site in Fosa Creek was established in a location where ablation water cut the trough into moraine cover between 1988 and 1995, whereas in Siodło Creek, this trough was cut between 2001 and 2005. The total lengths (L) of Fosa and Siodło creeks are 1.40 km and 0.42 km, respectively; the longitudinal water surface slopes (S) are 0.07 mm−1 and 0.08 mm−1 for Fosa Creek and Siodło Creek, respectively (Table 1). Furthermore, Reynolds and Froude numbers are also presented for both creeks (Figure 2a,b).
The period of the field campaign was characterized by higher air temperatures relative to other summer months over the last decade [49,50,53]. The mean monthly air temperature was +1.0 °C in January and +1.1 °C in February for the period from 2007 to 2016 [54]. However, the mean air temperature during the field campaign was +1.8 °C, with a maximum of +5.9 °C on 29 January. On the same day, the highest precipitation of 8.8 mm was recorded. During the 35 days of continuous measurements, 16 days were without precipitation and 12 days had precipitation >1.0 mm. The total precipitation over the whole period was 47.7 mm. Meteorological conditions that contributed to greater water discharge were observed 2 days after intense rainfall (Figure 3) [46].
2.2. Bedload Transport Measurements
To collect the transported material, River Bedload Traps (RBT) [55,56] were anchored at the bottoms of the troughs in two cross sections (Figure 4). In Fosa Creek, a set of two RBT modules at a distance of 300 m from the forehead of the glacier was installed, and in Siodło Creek, a set of three RBT modules at a distance of 15 m from the front of the glacier was installed. One additional module was established in Siodło Creek because less rinsing of the bottom of the trough occurred in this creek compared with in Fosa Creek and a finer bedload was visible at the beginning of the measurements. The assumption was that the bedload can move more easily in a trough in an early stage of development (Siodło Creek) than in a later stage of development [46]. The locations of the modules in the profiles were chosen based on the most intense currents.
2.3. Sieve Method and GSD Analysis
To obtain the GSD, each of the collected samples of the bedload was transported, drained, sieved, and weighed in the laboratory of the Henryk Arctowski Polish Antarctic Station. Furthermore, a comparison of the dry and wet sample weights was performed to determine the most reliable method of preparing the data for further analysis. Each sample that had a greater than 1% proportion of grain size <2 mm was truncated to exclude sediment that was predominantly suspended and because of limitations of the mesh diameter of the net. The upper limit to remove the samples because of the selective rejection of particles by the sample was set up at 32 mm [23]. Furthermore, for the GSD analysis, average weight values lower than 3% (chosen arbitrarily) for all collected data were rejected as not statistically important. To obtain information on the sedimentary environment, such as the sediment provenance, transport, and deposition conditions (e.g., [15,18,24]), the GSD parameters were evaluated. The Folk and Ward [15] method was employed to obtain the GSD parameters of mean grain size (Mz), standard variation (σϕ), sorting (σ), skewness (Skl), and kurtosis (KG), which according to Blot and Pye [57] describe (a) the average size of grains (Mz); (b) the spread of the sizes around the average (σ); (c) the preferential spread to one side of the average (Skl); and (d) the degree of concentration of the grains relative to the average (KG). As suggested by Blot and Pye [57], the Folk and Ward [15] method provides the most robust basis for routine comparisons of compositionally variable sediments in the cases when the skewness or kurtosis of grain sizes are calculated. It should be noted that besides the presentation of grain diameters in metric units, according to standard procedure [15,57], data will be also shown and analyzed in phi (φ) units, which is the negative log to base 2 of the diameter in mm.
2.4. Bedload Transport Rate
The bedload transport rate (qb) was calculated from the weighted arithmetic mean formula [46] given in Equation (1):
where Gs represents the bedload material (kg), Sw represents the width of the module inlet (m), Wt represents the width of the trough (m), and t represents the measurement time (day). In addition, the water velocity was measured with an Electromagnetic Open Channel Flow Meter (manufactured by Valeport, model 801). For details, see Sziło and Bialik [46]. The average water velocity was measured at least two times [46] at each measurement section for 30 seconds [58]. If the standard deviation of the measurement values was higher than 10%, the measurements were repeated until an acceptable standard deviation was obtained. Based on the values of creek bathymetry and water velocities for each section, the water discharge was calculated following the standard procedure [58]. The accuracy of equipment employed for measurements was ±0.5% of reading values plus 5 mm/s.
2.5. Statistical Analysis
An analysis of variance (ANOVA) test was performed to determine whether or not the two investigated creeks had statistically significant differences in terms of bedload transport and hydrological conditions. The Anderson–Darling test was used to check for normality, and Bartlett’s test was used to check for the homogeneity of variance to meet the assumptions of the ANOVA. To provide a better description of the changes that occurred in the channels of both creeks, sediment samples from the individual traps were analyzed independently even when collected from the same creek.
3. Results
3.1. Statistical Analysis: Water Discharge, Flow Velocity, and Bedload Transport
Figure 5 shows the bedload transport, water discharge, and flow velocity data for Fosa and Siodło creeks. Unfortunately, the assumptions of normality and homogeneity of variance were not observed for all presented data. When a variable does not fit the assumptions required for the ANOVA test, the data are usually transformed (log or square root) [59]. The square root transformation was used for water discharge and flow velocity, and the double square root transformation was used for bedload transport; the transformed variables met the above assumptions. A comparison of the results of all transformed data indicated only one of the variables (flow velocity) between the creeks presented statistically significant differences (p-value < 0.05).
3.2. Sieving Procedure Comparison (Wet and Dry)
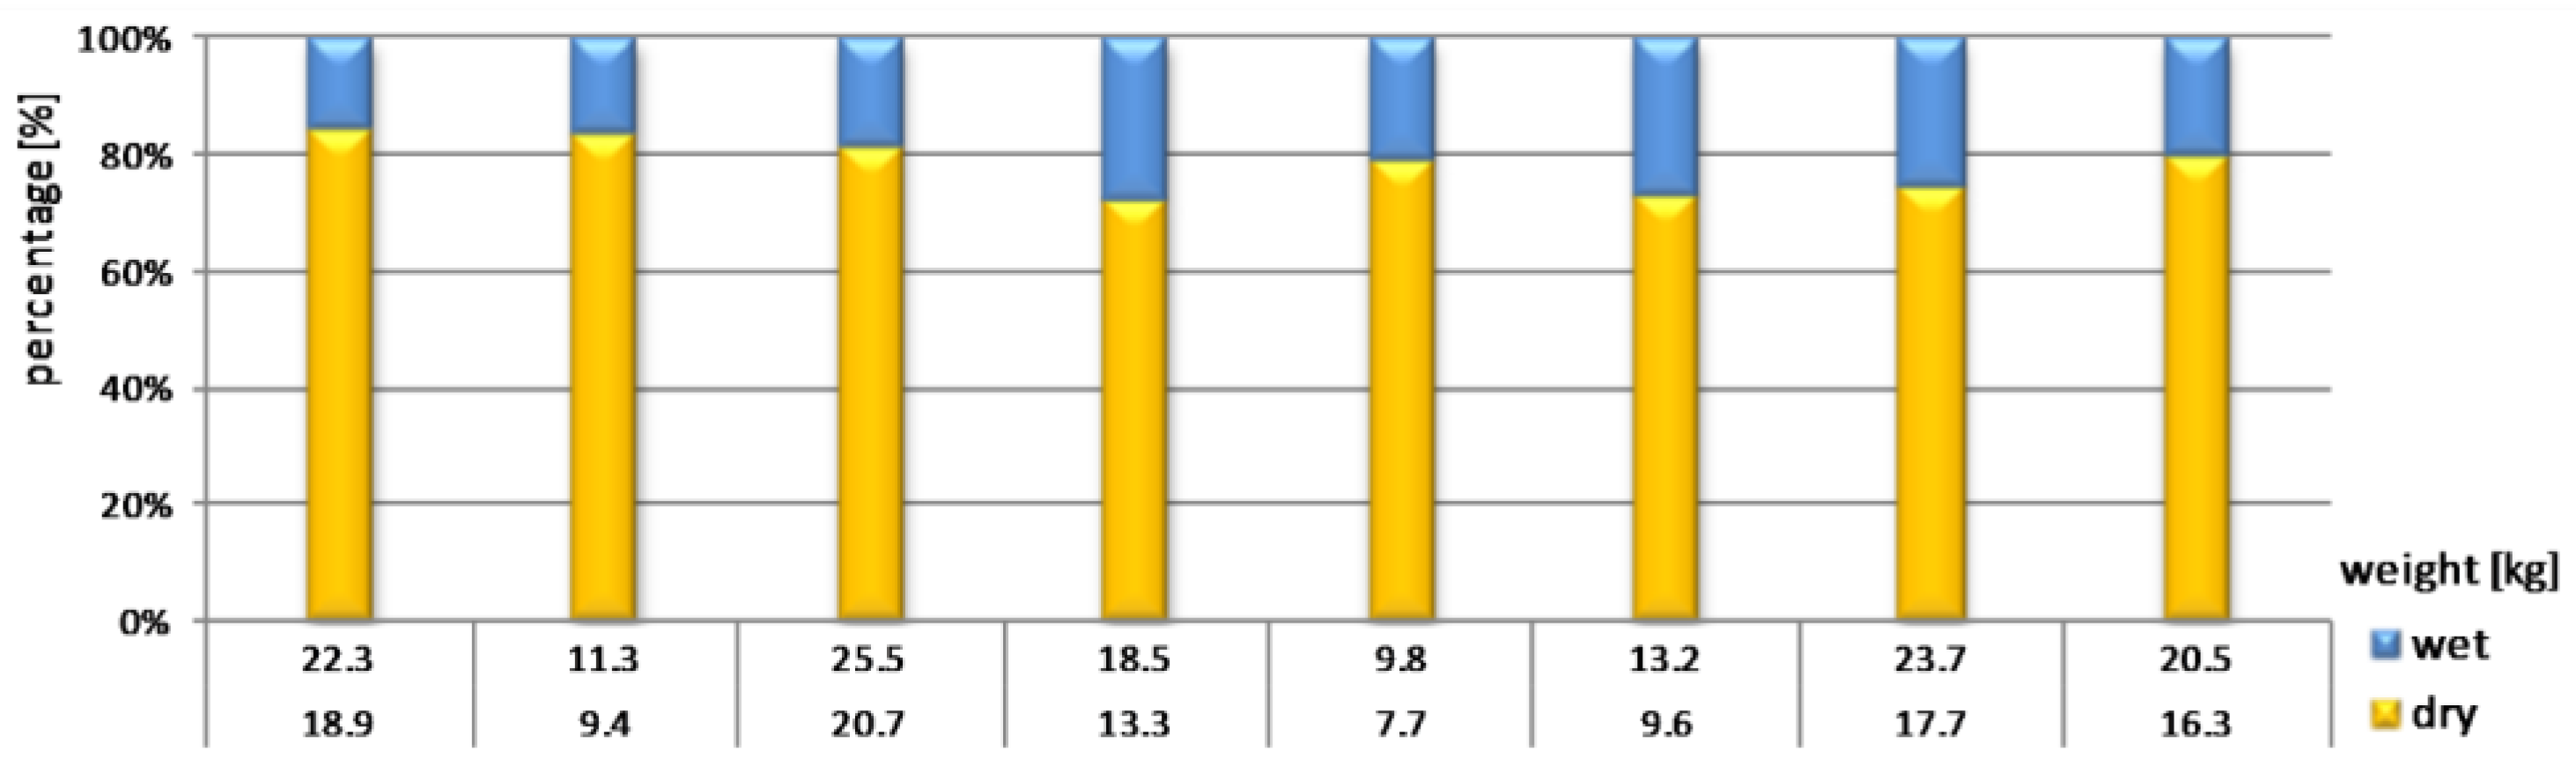
Although standard procedures for wet sieving are acceptable for determining the GSD (e.g., [31]), the form of sieving (wet or dry) may influence the particle distribution [60,61]. To investigate how the drying process can influence the GSD, the weights of randomly chosen wet and dry bedloads not lower than 10 kg were compared (Figure 6). The results of the analysis revealed that the difference between the weights ranged from 15% to 28% (Figure 6). Hence, in this research, only the dried bedload was considered in further analyses.
3.3. GSD Parameters and Variation of Characteristic Diameters (D) of the Bedload Transport Rate
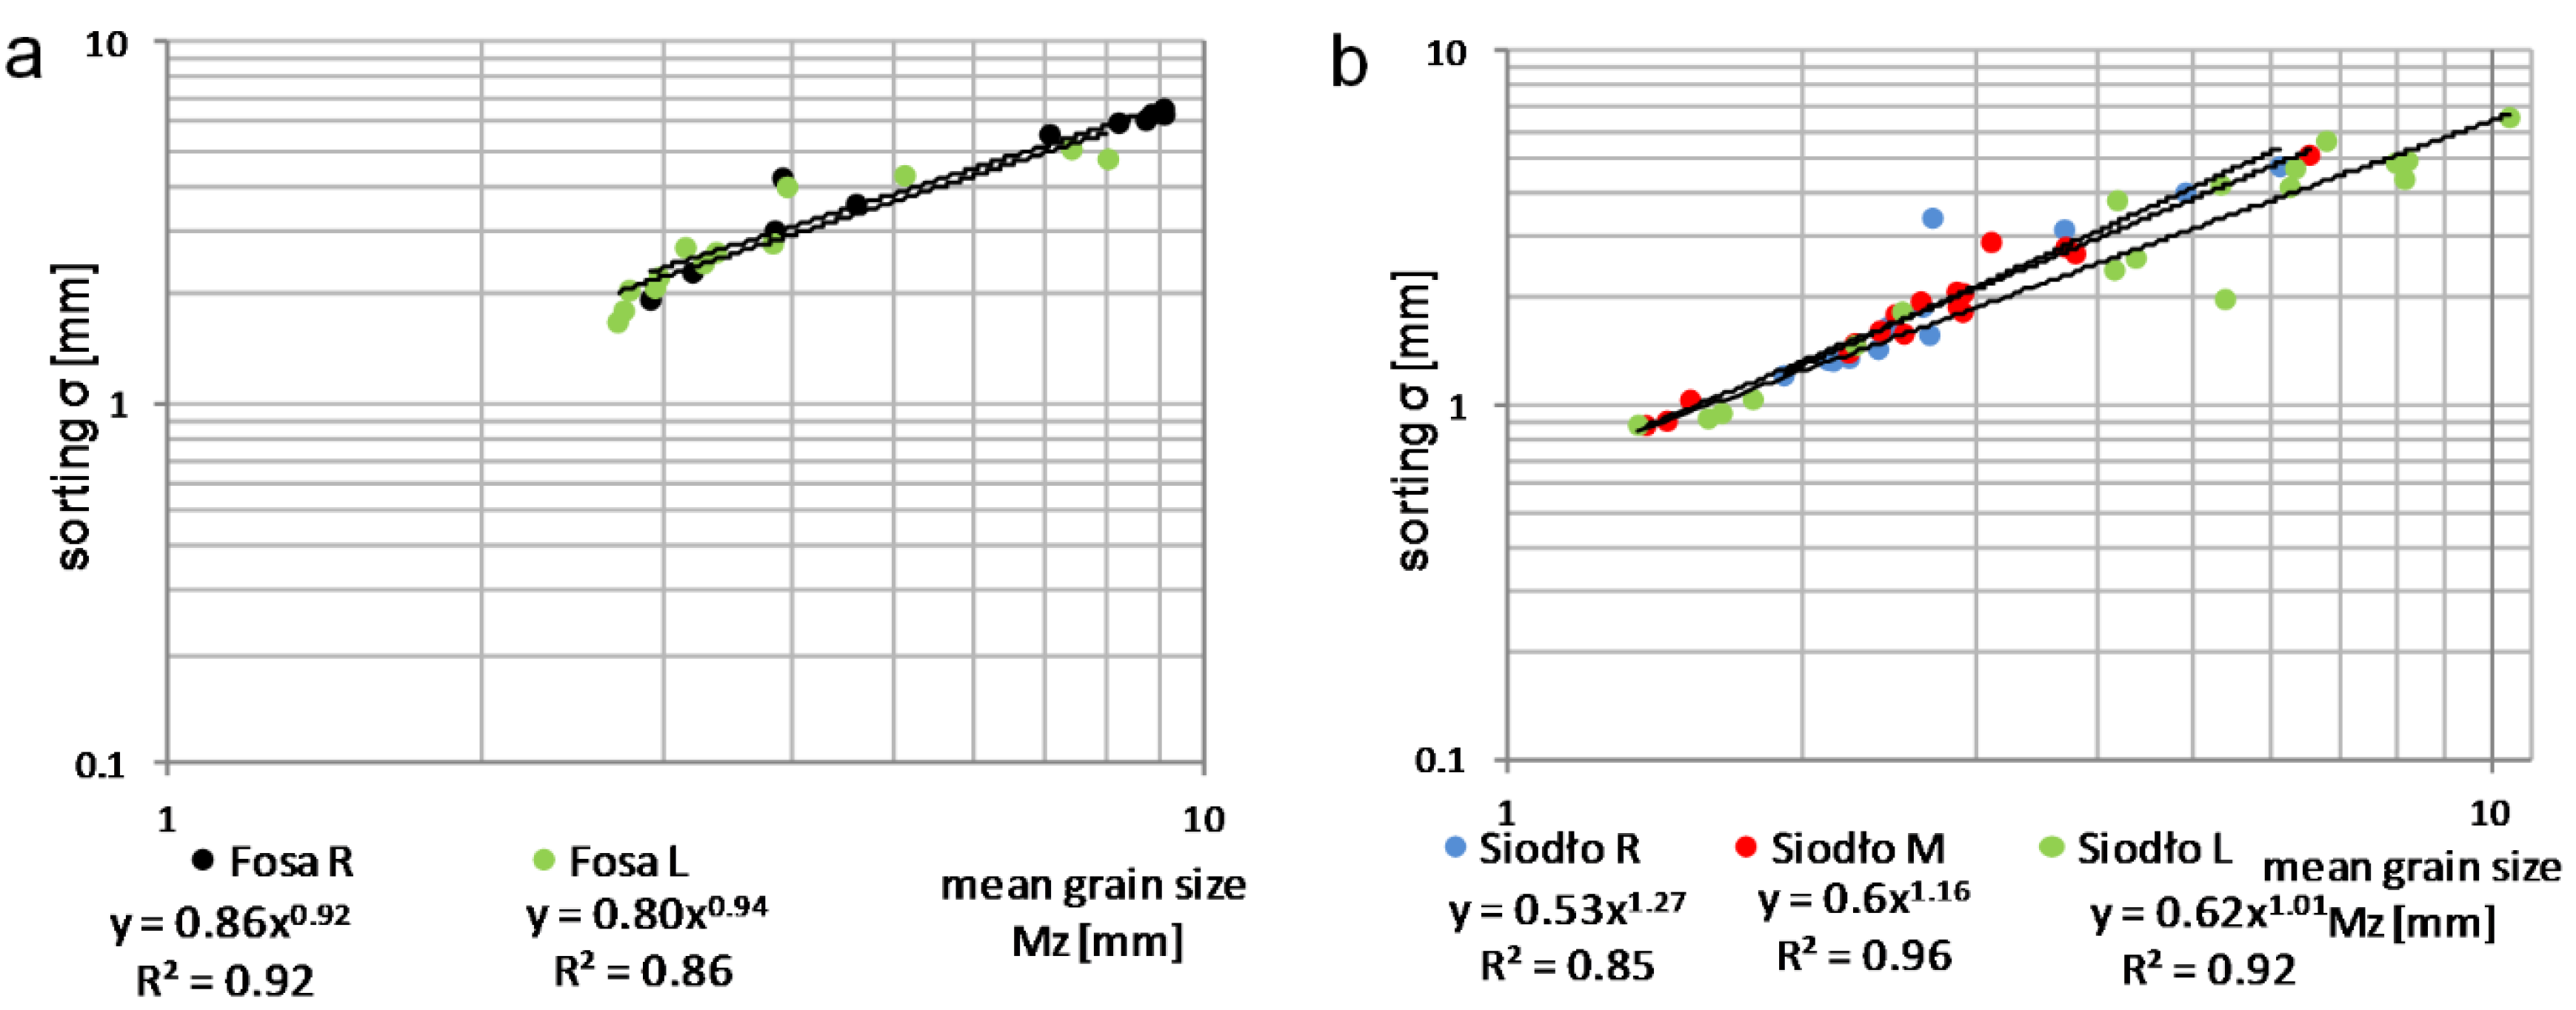
Figure 7 and Figure 8 show the relationship between σ and Mz for all data, for both creeks separately, and for the individual traps. The analysis of the σ and Mz in the profiles established in the Fosa and the Siodło troughs suggested that linear correlations occurred with those indicators, and the correlation coefficients (R2) were 0.82–0.92 (Figure 7). Moreover, an increase in Mz presents a corresponding increase in grain variability. The mean diameter of sediment from Fosa Creek for all measurement days varied from 2.9 mm to 6.2 mm and was higher than that in Siodło Creek, which varied from 1.5 mm to 3.6 mm. Furthermore, larger ranges of Mz values were observed for the individual traps in Siodło Creek than for those in Fosa Creek, and a maximum of 10.4 mm was observed on 6 February (Figure 8a,b). The strongest correlation for the material collected in the trap occurred in the Siodło middle (M) at R2 = 0.96 (Figure 8b), for which 77% of the data ranged from 2.3 to 3.9 mm, whereas for the Siodło left (L), 80% of the data were in the interval from 4.1 to 8.9 mm.
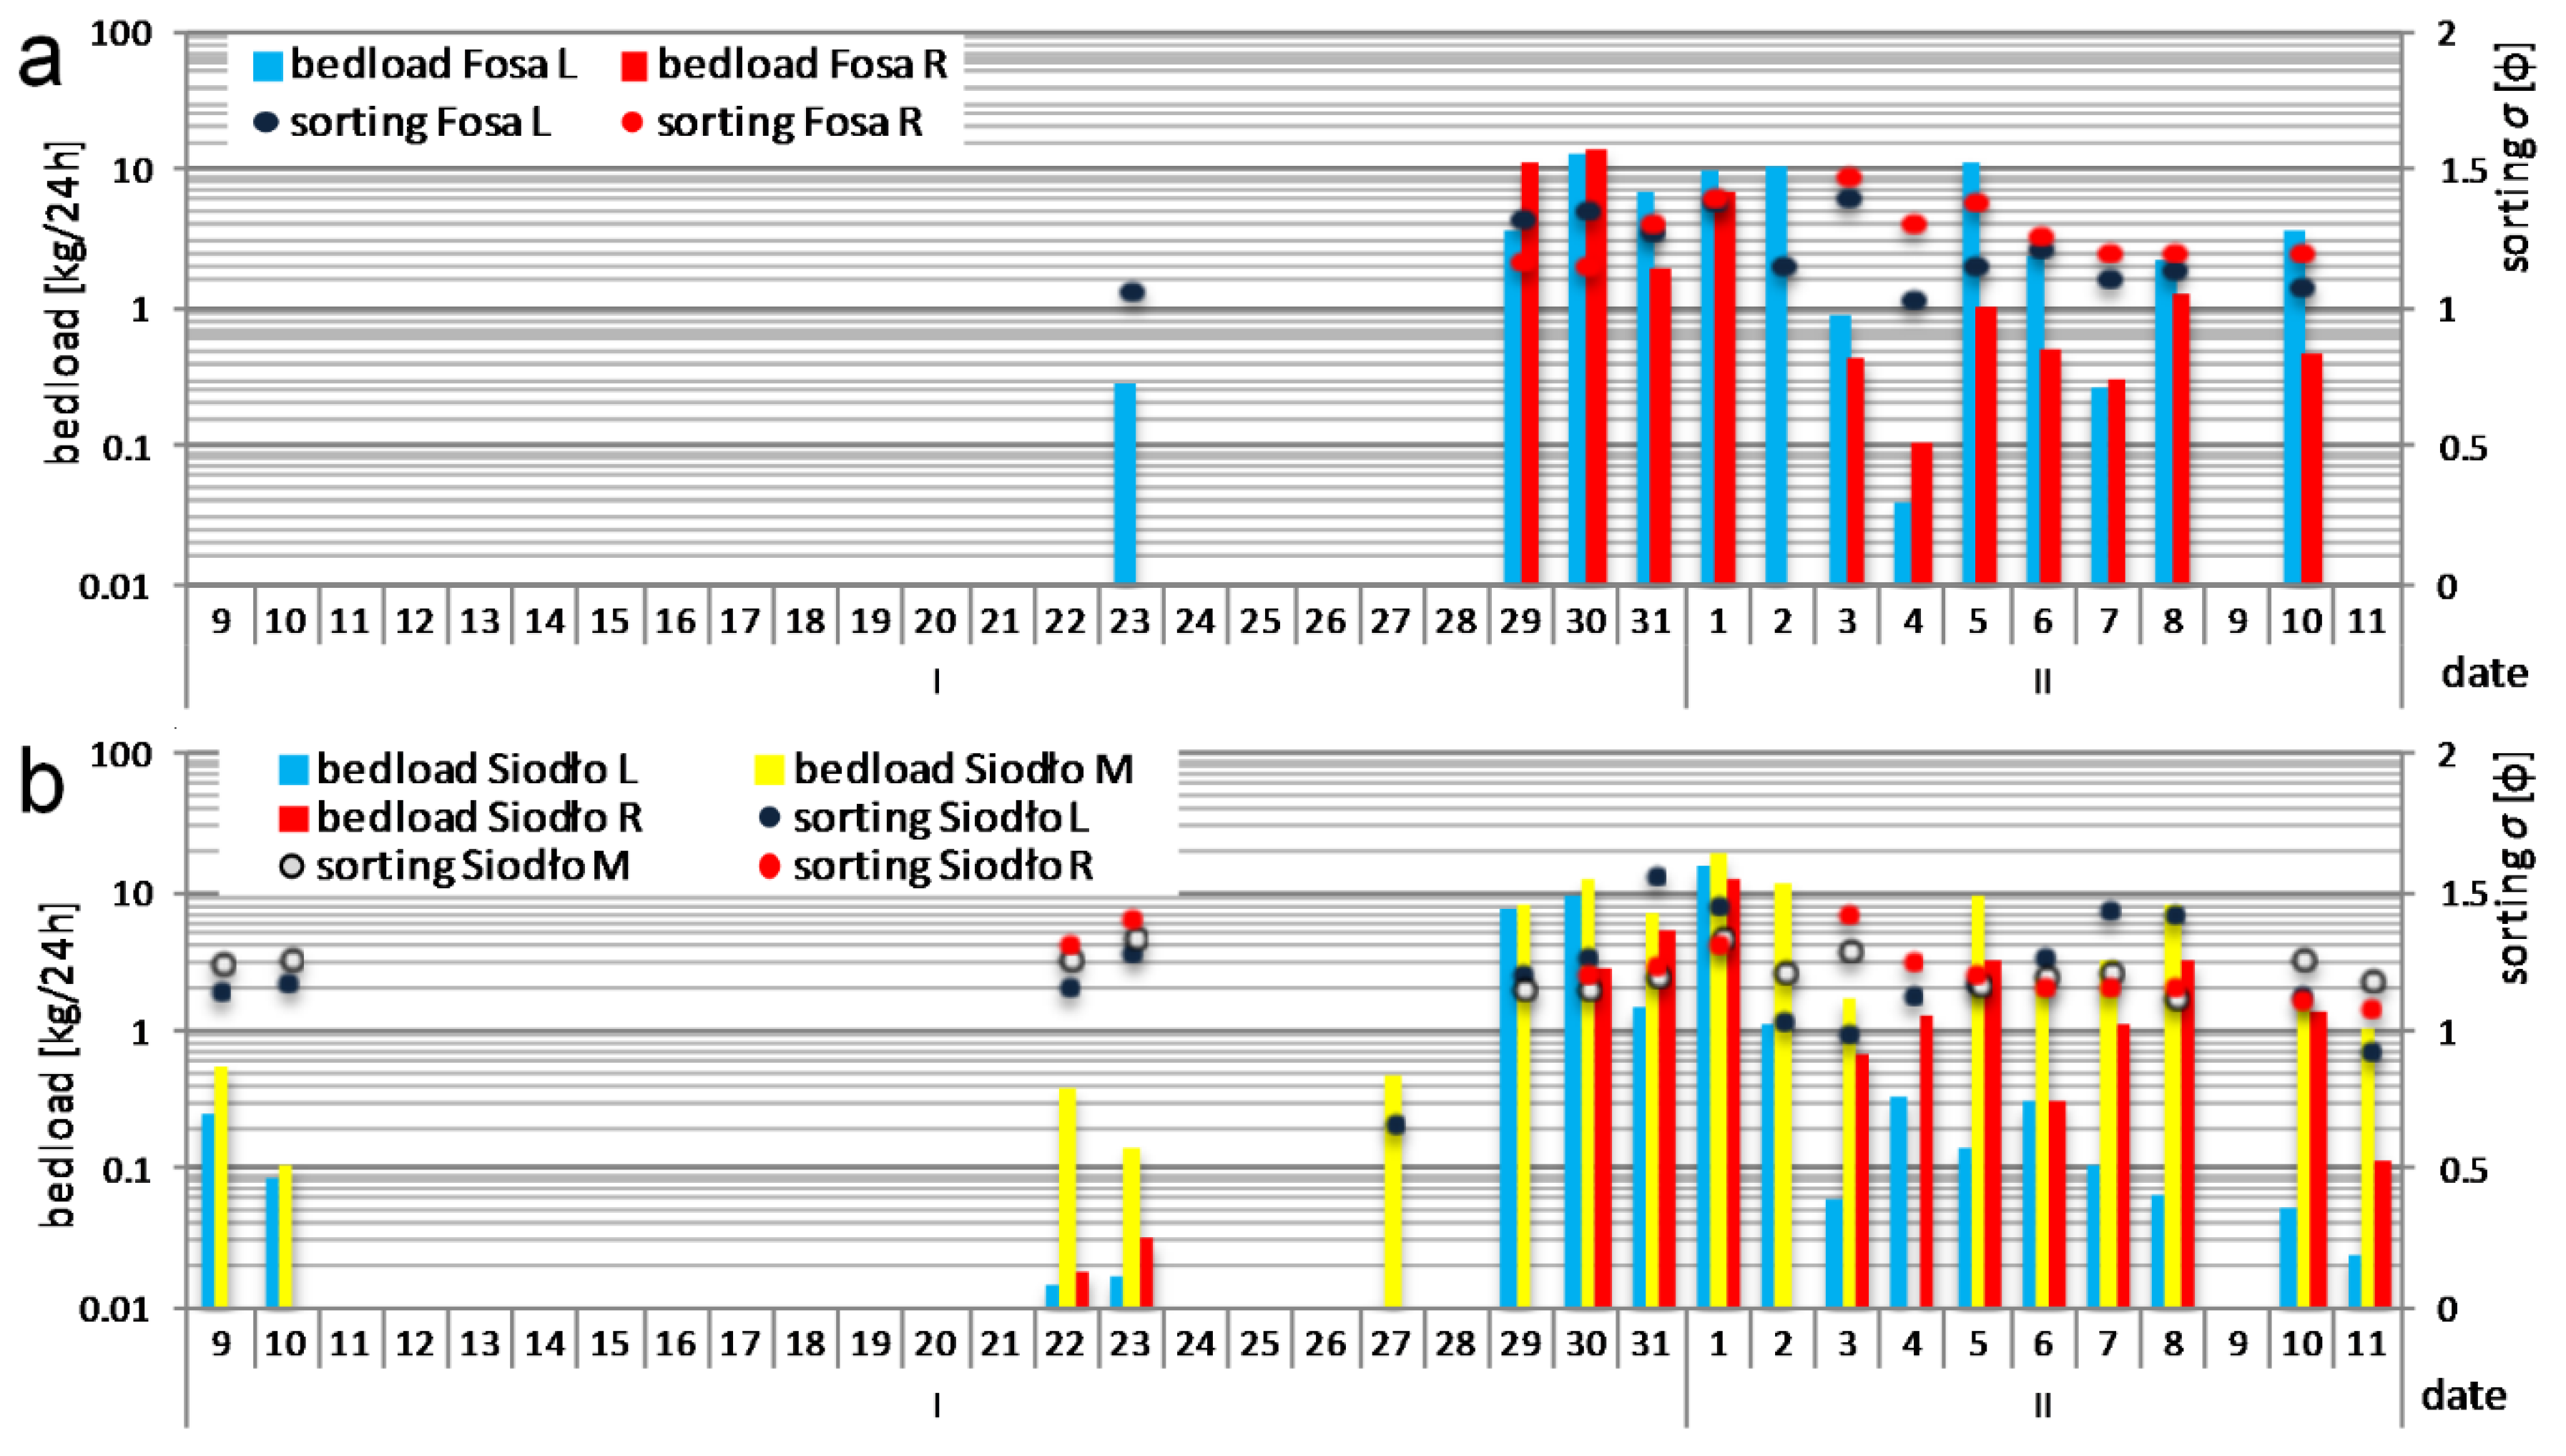
The temporal changes in bedload transport and σ for the studied creeks are presented in Figure 9. The σ in individual traps varied from 1 mm to 1.5 mm in 93% of the samples, which means that the collected sediments in both cross sections were poorly sorted (Figure 9a,b). Furthermore, after the peak bedload transport, which appeared from 29 to 30 January, an inversion of σ occurred from lower values in the Fosa right (R) section compared with in the Fosa left (L) section, where higher values were observed (Figure 9a). A similar situation occurred in the Siodło trough: after both of the bedload transport peaks (on 1 and 5 February), inversions of σ in the left trap from highest to lowest and then to highest values again were noticed (Figure 9b). Furthermore, the results suggest that better σ occurred in both troughs after each peak in bedload transport (Figure 9a,b).
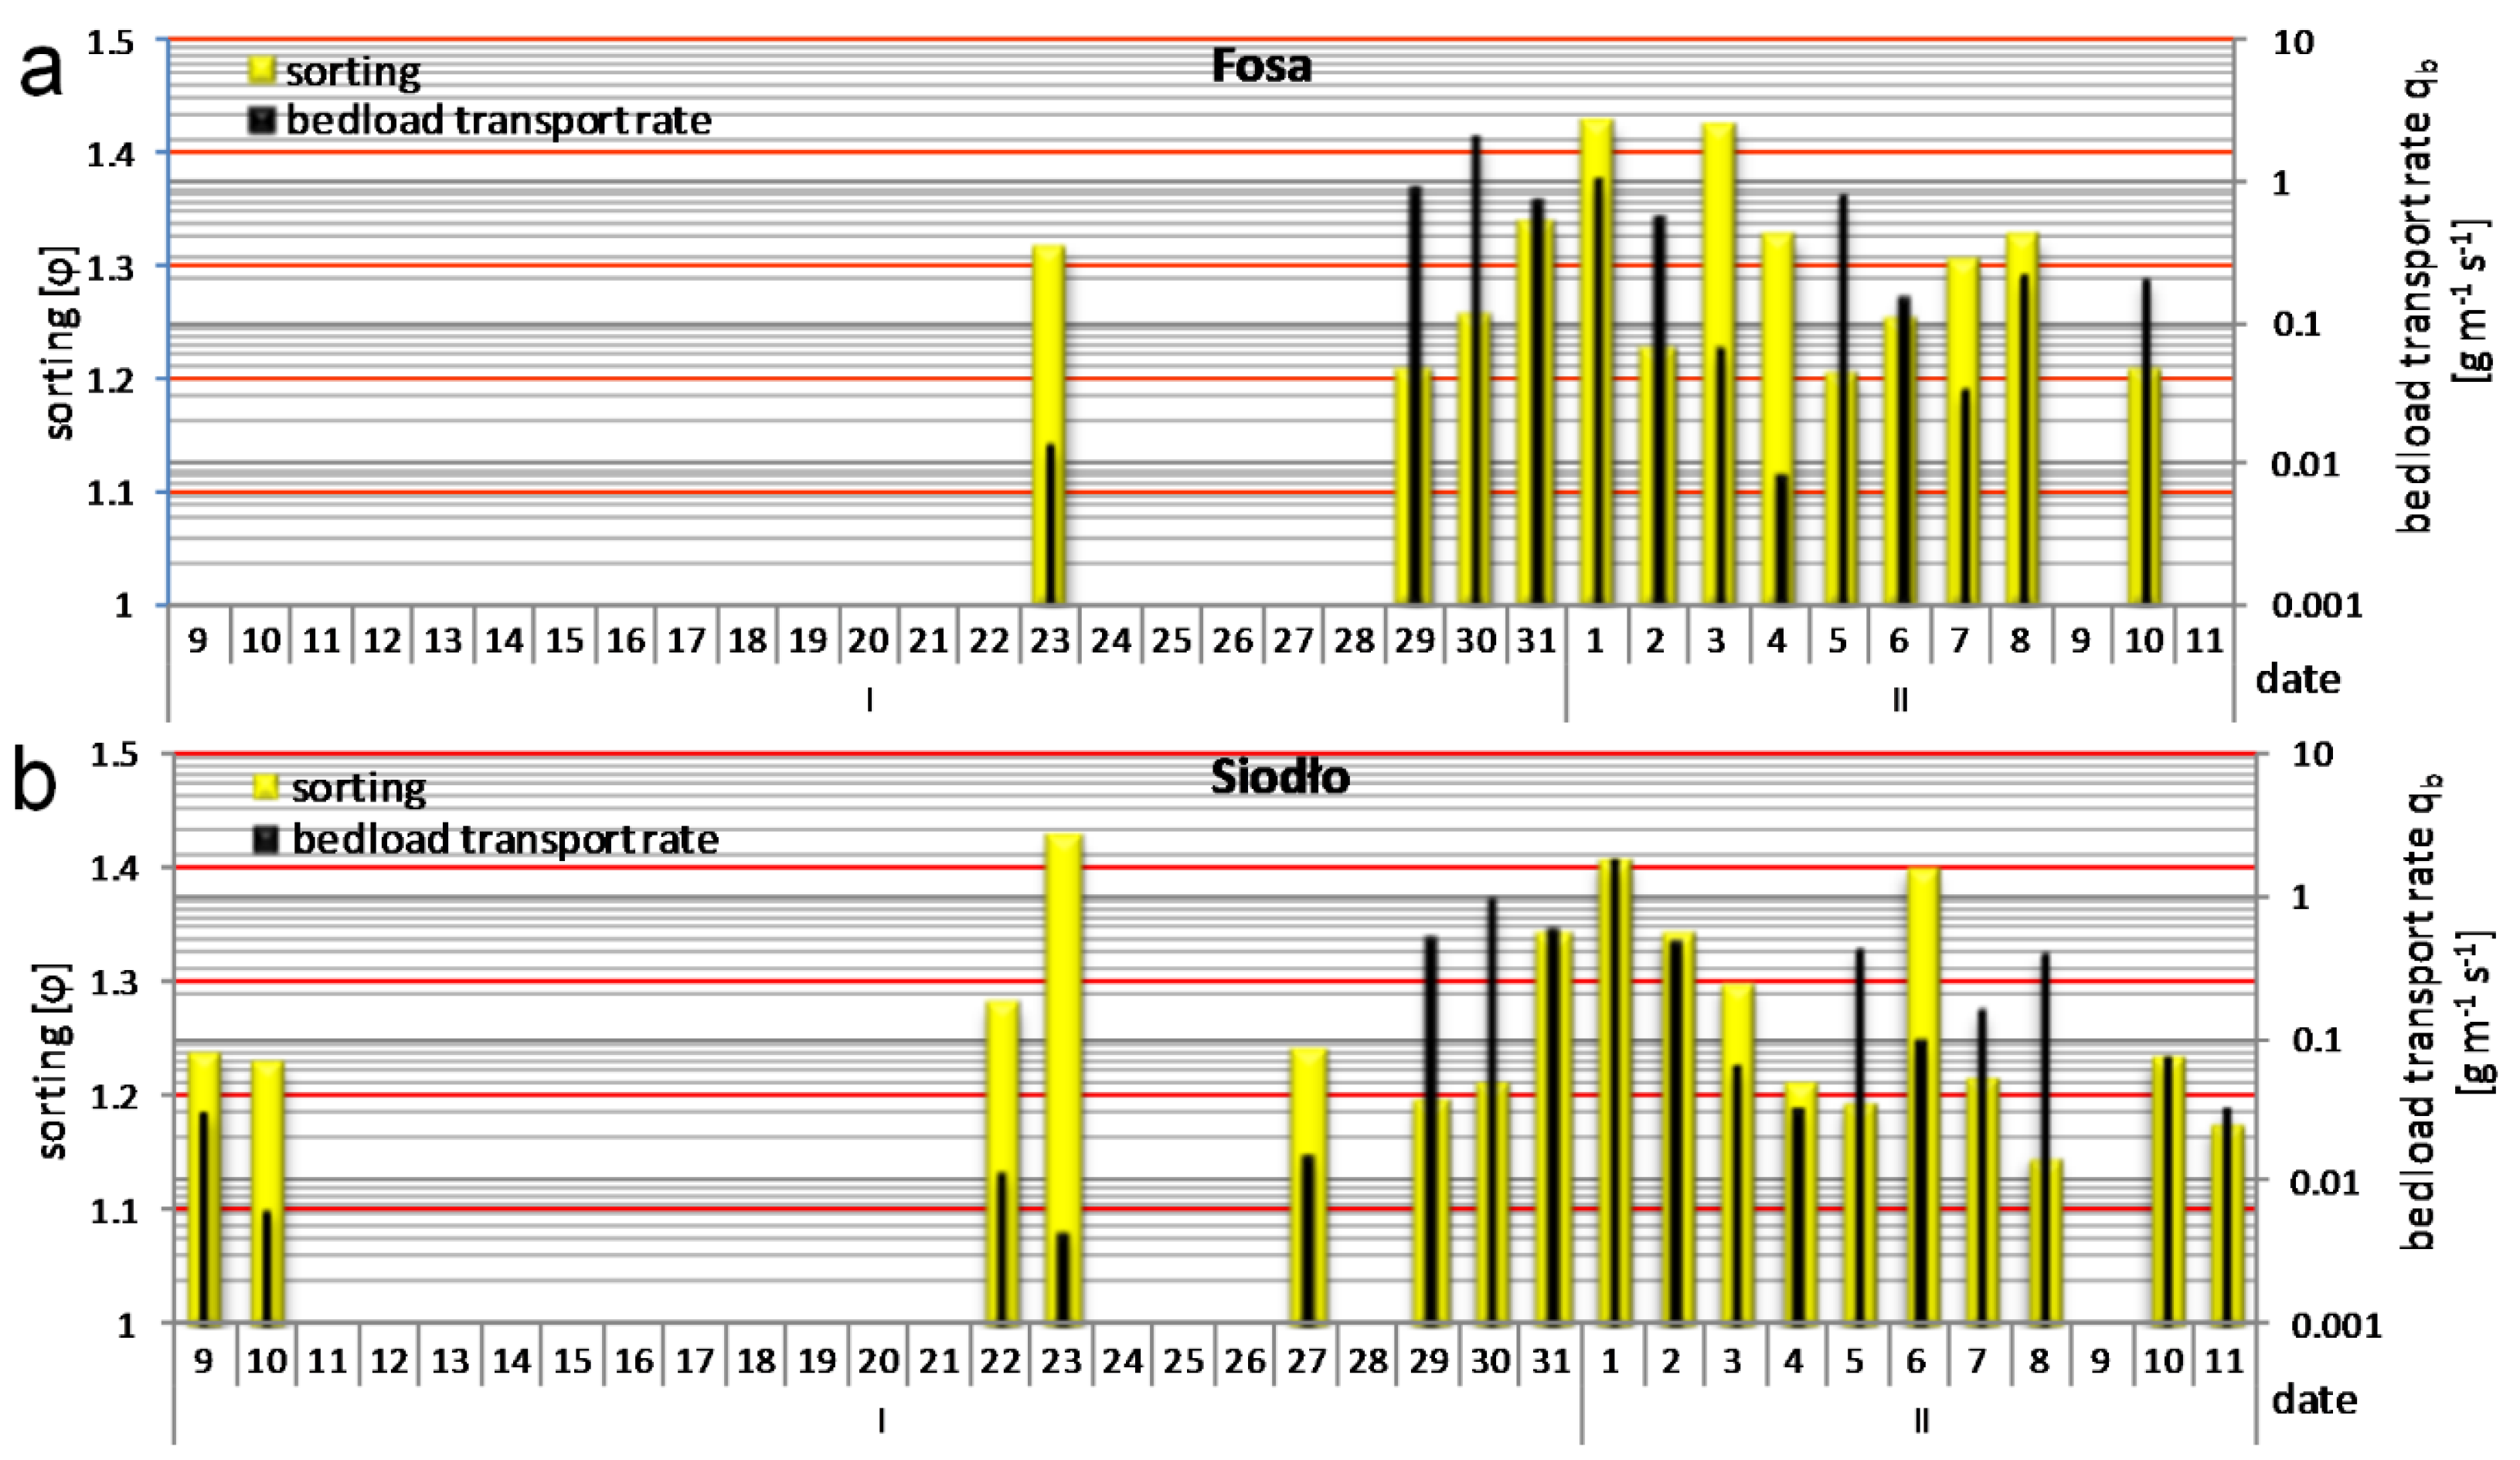
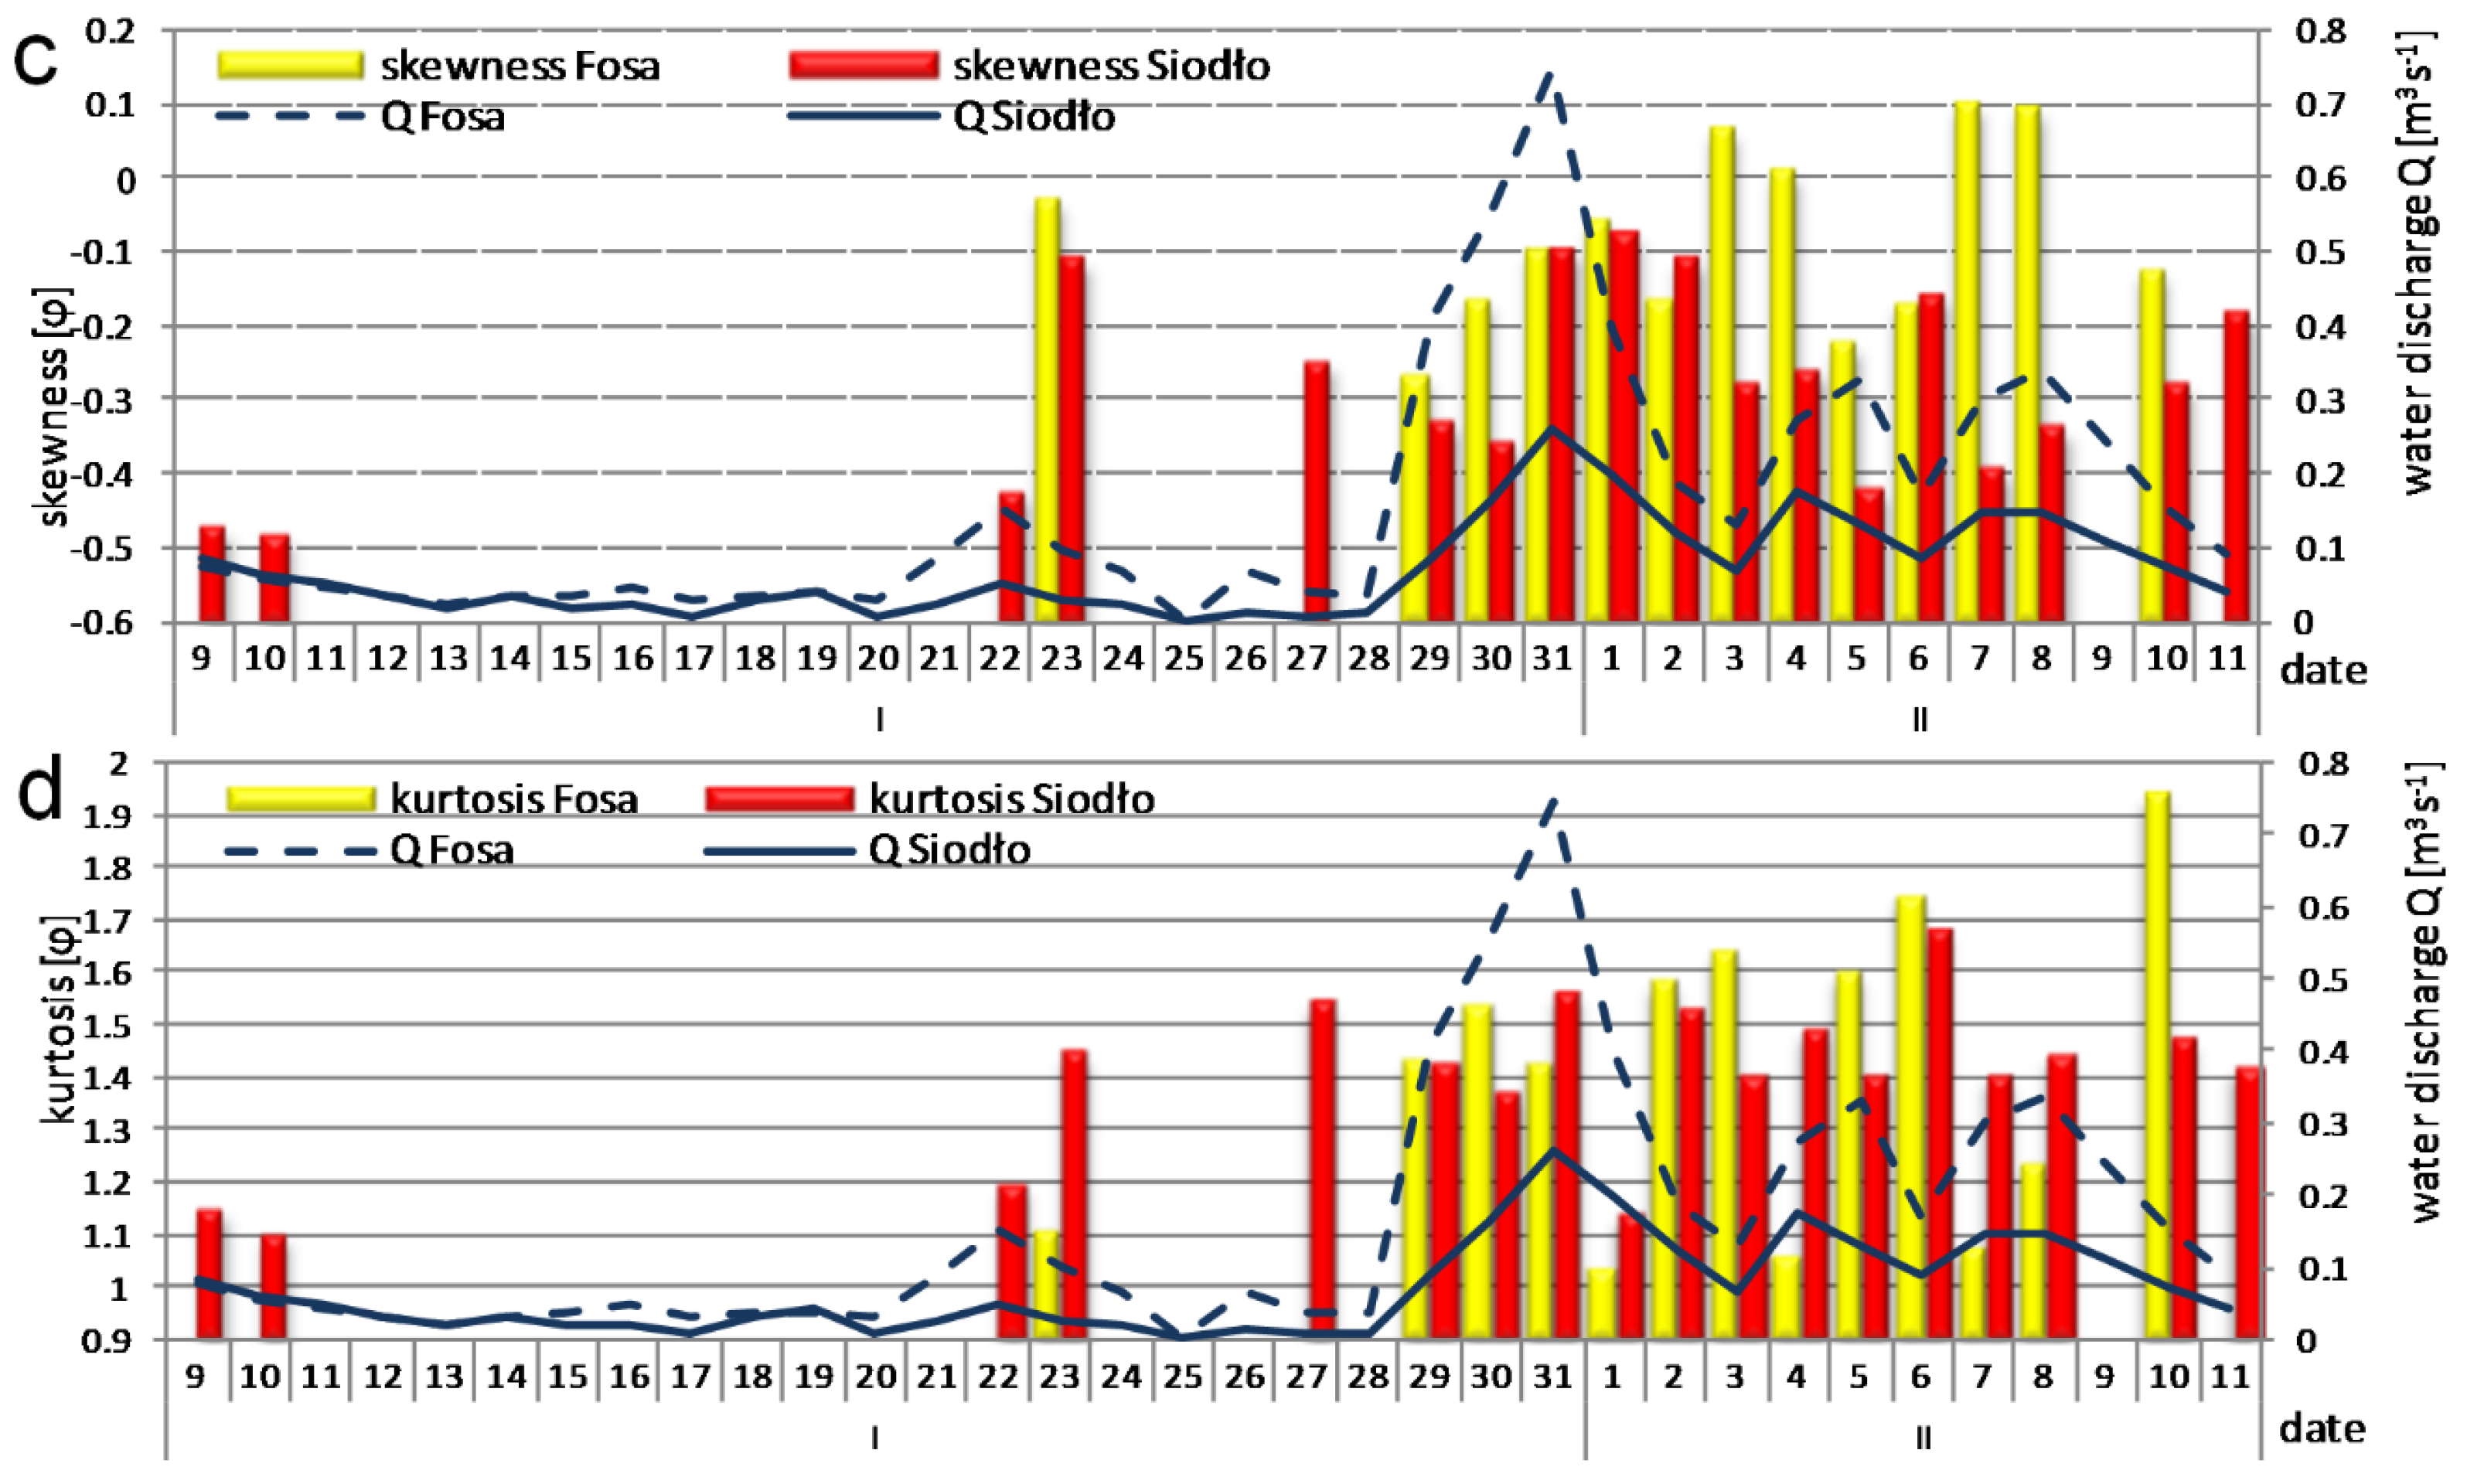
The relation between bedload transport and σ was inversely proportional before and directly proportional after the peaks in bedload transport (Figure 10a,b). All bedload transport data from Siodło Creek were negatively skewed, which means that a large proportion of coarse sediment occurred (Figure 10c), and this finding is also confirmed based on the percentage of gravels in the collected material (Figure 11a,b). An increase in water discharge and a consequential increase in bedload transport resulted in symmetrical Skl and leptokurtic KG (Figure 10c,d). Before 31 January and after 4 February, when the maximum discharge was observed, strongly negative Skl was observed in Siodło (Figure 10c). Under low discharge conditions, leptokurtic KG was observed.
The bedload transport rate and grain size variation analyses indicate that an inverse correlation occurred for both creeks. In Fosa Creek, the grain size variations decrease when the bedload transport rate increases, whereas in Siodło Creek, the grain size variations are directly proportional to increases in bedload transport rate. Furthermore, in Fosa Creek, the D-value correlations increase from 0.15 for D50 to 0.26 for D95, which is inconsistent with the data from Siodło Creek, where the correlation for D50 of 0.29 decreases to 0.11 for D95 (Figure 11a,b).
3.4. Selective Transport and Bedload Transport versus Water Discharge and Water Velocity
Fine (4–8 mm) and very fine (2–4 mm) gravel accounted for 40 to 99% of the total sample weight in the troughs for each day of the measurement campaign. Nevertheless, a higher proportion of these gravels (2–8 mm) was observed in Siodło Creek, with the value reaching at least 63%. This increase was especially clear before the peaks of water discharge on 19 and 29 January, when the fine and very fine gravel constituted almost the entirety of the Siodło Creek samples. Furthermore, because of the increase in water discharge, the proportion of medium (8–6 mm) and coarse (16–22 mm) gravel also increased in both creeks, particularly on 29 to 31 January and 4 to 5 February (Figure 12a,b), when the highest water discharge occurred. In addition to the previously mentioned periods when the low water discharge was observed, certain coarse sediment samples were identified. Nonetheless, these samples had insignificant weight fractions and were disrupted by the presence of a few coarse pebbles. A similar situation was observed when the water discharge peaked. At that time, several boulders were caught in the Siodło trough, which contributed more than 50% of the sample in certain cases, although the water discharge was two times lower than that in Fosa Creek.
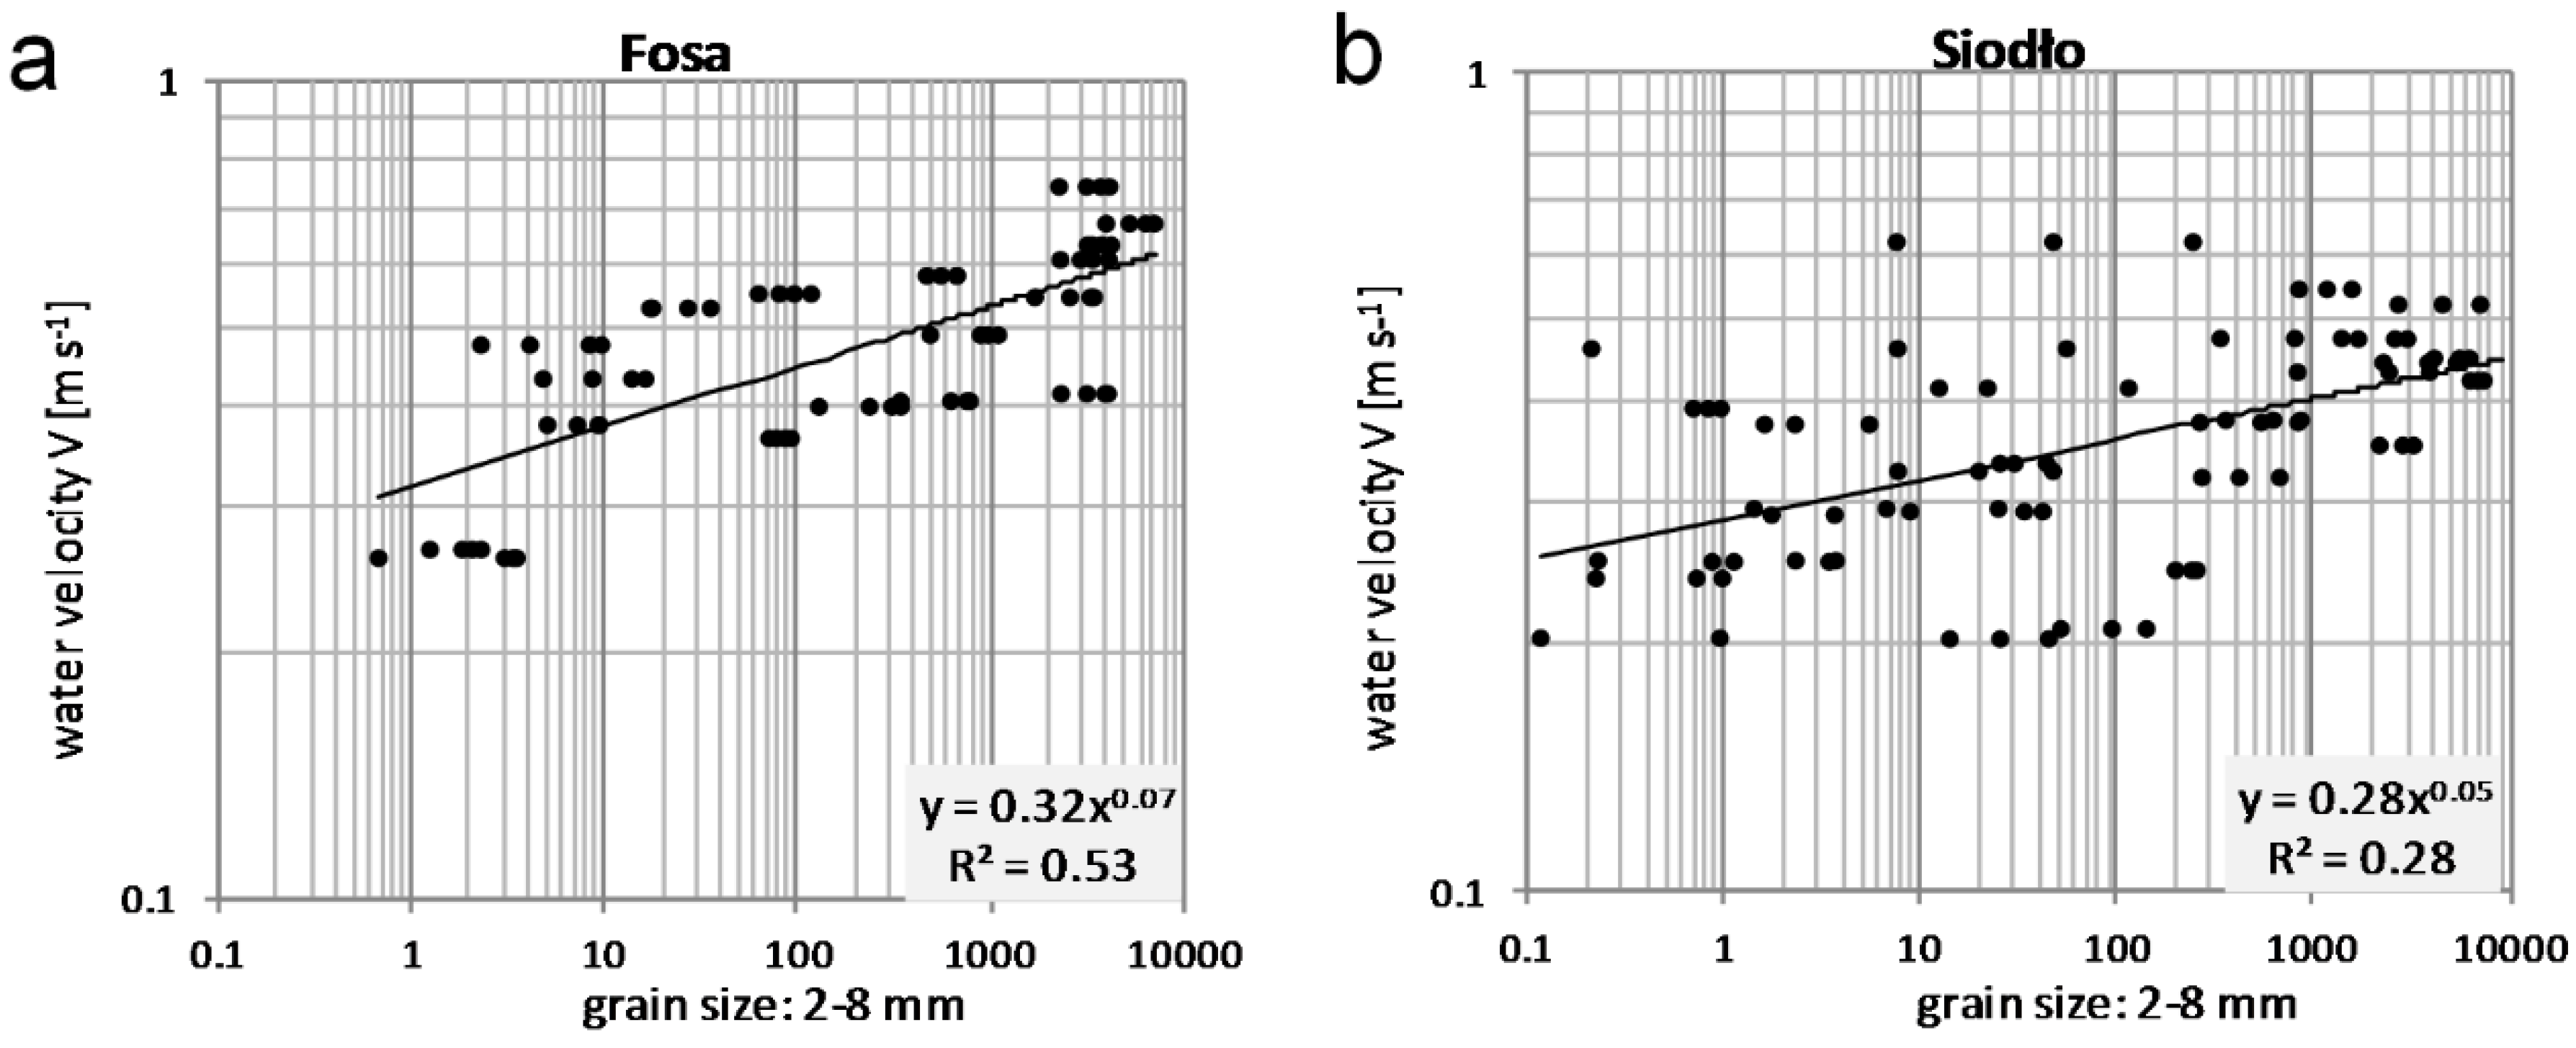
Because of the high proportions of fine and very fine gravel in each sample, those grain sizes have been chosen for our examination of the correlation between bedload transport and water discharge or water velocity (Figure 13 and Figure 14). The correlation between water discharge and bedload transport was equal to 0.65 in the Fosa and 0.55 in the Siodło, and these correlations were stronger than those between bedload transport and water velocity, which were 0.53 in Fosa and 0.28 in Siodło; this is likely due to the changes of the creek beds and shapes, due to the existence of scouring effects [56] and because only grains with diameter lower than 22 mm were taken into account for the analysis. Thus, the increase in water discharge was observable with the simultaneous increase in bedload transport, and the intensity or correlation in the relations between water velocity and bedload transport was lower.
4. Discussion
The weights of the wet and dry samples differ significantly—by as much as 28% and by an average of 21.5%. These results are inconsistent with those of Kociuba and Janicki [31], who reported that the average water amount in a natural gravel-bed channel was 6%. In this situation, the error in the calculation can reach maximum values of 20.1–21.3 kg d−1 for the mean transport rate [31] and 33.3–67.8 kg d−1 for the mean daily bedload flux [62] based on exemplary data from the Scott River (Svalbard).
The flow velocity analysis for both creeks suggests that a statistically significant difference (p-value < 0.05) occurred in the hydraulic conditions. A stronger correlation with bedload transport was revealed for water discharge than for water velocity, which was estimated based on the measured values of the water velocity. This result explained the previously reported findings of Sziło and Bialik [46], who suggested that a similar relationship occurred between water discharge and bedload transport for Fosa and Siodło creeks. Moreover, the lack of significant differences in bedload transport clearly indicated that this catchment process was strongly associated with meteorological conditions, as presented in Figure 2. Certain differences noted by the authors in their previous work were likely caused by differences in the geomorphological features of the analyzed troughs, which could be explained based on the GSD analysis.
The detailed GSD analysis has shown that σ is inversely proportional to Mz, which is consistent with the results of studies in the Scott River performed by Kociuba and Janicki [31]. Kociuba and Janicki suggested that the bed material was poorly sorted, which is similar to the results from the Fosa and Siodło creeks (Figure 8a,b). Moreover, grains in the investigated troughs were finer (3 mm) than those in the Scott River (10 mm) [31]), which is likely because both creeks in this study are in the earlier stages of formation and more sensitive to morphological changes (especially Siodło Creek, as suggested by Sziło and Bialik [46]) in relation to the Scott River. These troughs were cut down into moraine cover later (in recent decades, Figure 1) than was the trough of the Scott River [63]. Poorly sorted bedload (Figure 9a,b) suggests high energetic differentiation of the particles and rapid changes in the geomorphology of both troughs. Significant bedload transport rates based on the definition of Batalla et al. [36] of 1 gm−1s−1 were observed on 30 January and 1 February in the troughs. Nevertheless, the bedload transport peak was defined as qb > 0.1 gm−1s−1. As a consequence, the sizes of movable grains are more variable and present a larger proportion of finer grains compared with that in the bed channels, where they could have already been rinsed. This finding could be related to the higher transport of the bedload and faster changes in the morphology of the troughs. Other GSD parameters, e.g., negative Skl, are typical for natural gravel-bed channels [23,31,64,65]. The investigation of the correlation between grain size variations and bedload transport rate revealed that both troughs were characterized by an inverse correlation. In Fosa Creek, this correlation increased proportionally to the D values and was strongest for D95, which is more sensitive to water flow as concluded by Batalla et al. [36]. This result is similar to findings for the Salty River [36] and the Scott River [31]. Nevertheless, for Siodło Creek, a higher value was observed for D50 than for D95.
For both creeks, finer bedload is transported before the peak of water discharge than that transported during and after this phenomenon, which is consistent with findings of the previous studies (e.g., [23]). Generally, two phases of selective transport can be distinguished in both creeks (Figure 11). In the first phase, very fine gravel was predominantly entrained; this was followed by the second phase, where gravel dominated. Similar observations of two-phase selective transport have been reported in previous studies of other natural gravel-bed channels [31,36,66,67]. Furthermore, the higher proportions of fine and very fine gravel in Siodło Creek compared with those in Fosa Creek over the entire field campaign confirm the previous hypothesis posed by Sziło and Bialik [46], who assumed that the Siodło trough may be in an earlier stage of formation than the Fosa trough and thus exhibit a more obvious erosive process. In addition, fine material collected from the Siodło, which constituted at least 63% in each sample, can also provide evidence that the channel is not yet armored and paved like the Fosa trough, and bottom erosion may occur faster [33]. Moreover, the presence of boulders (>64 mm) during the peaks of water discharge not exceeding even one-fourth bankfull, mostly in the Siodło trough [46], may suggest that the greater part of the sediment was entrained rather than laterally eroded, as has been observed in other gravel-bed channels during near-bankfull discharge [23,31].
5. Conclusions
According to the aims of this study, the analysis confirmed that the variability and modification of GSDs are strongly related to the daily variability of bedload transport dynamics, which was suggested for the first time for polar catchments by Kociuba and Janicki [31]. During the measurement period, i.e., the ablation period, the weather conditions played a significant role in the processes observed in the bed channels of streams, especially when low water discharge occurred. In addition, the increased proportion of medium and coarse gravel was strictly proportional to the increases in water discharge. The simultaneous measurements performed in two creeks that are located in the same catchment but present partial differences in the sources of the material (i.e., Fosa Creek was also fed with lake material) indicated the processes occurring in both troughs. The bedload material from Siodło Creek consisted mostly of fine and very fine gravels, suggesting an early stage of formation and an efficient erosive process, which is confirmed by the general conditions of both streams. Fosa Creek has been free of ice cover for more than 30 years and is at a more stable development stage in which water discharge is the predominant control mechanism for the channel geometry. However, the GSD analysis showed that bedload transport can also significantly influence this process.
Acknowledgments
This publication has been partially financed by funds from the Leading National Research Centre (KNOW) received by the Centre for Polar Studies for the period 2014–2018.
Author Contributions
J.S. and R.J.B. designed the study and conducted the field campaign and laboratory analysis. J.S. conducted the majority of the data analysis and wrote the majority of the paper. J.S. and R.J.B. both contributed to the final version of the manuscript.
Conflicts of Interest
The authors declare no conflicts of interest.
References
- Wu, W.; Wang, S.S.; Jia, Y. Nonuniform sediment transport in alluvial rivers. J. Hydraul. Res. 2000, 38, 427–434. [Google Scholar] [CrossRef]
- Wilcock, P.R.; Crowe, J.C. Surface-based transport model for mixed-size sediment. J. Hydraul. Eng. 2003, 129, 120–128. [Google Scholar] [CrossRef]
- Lukerchenko, N.; Chara, Z.; Vlasak, P. 2D Numerical model of particle–bed collision in fluid-particle flows over bed. J. Hydraul. Res. 2006, 44, 70–78. [Google Scholar] [CrossRef]
- Bialik, R.J. Numerical study of saltation of non-uniform grains. J. Hydraul. Res. 2011, 49, 697–701. [Google Scholar] [CrossRef]
- Andrews, E.D.; Erman, D.C. Persistence in the size distribution of surficial bed material during an extreme snowmelt flood. Water Resour. Res. 1986, 22, 191–197. [Google Scholar] [CrossRef]
- Powell, D.M.; Reid, I.; Laronne, J.B. Evolution of bed load grain size distribution with increasing flow strength and the effect of flow duration on the caliber of bed load sediment yield in ephemeral gravel bed rivers. Water Resour. Res. 2001, 37, 1463–1474. [Google Scholar] [CrossRef]
- Török, G.T.; Baranya, S.; Rüther, N. 3D CFD modeling of local scouring, bed armoring and sediment deposition. Water 2017, 9, 56. [Google Scholar]
- Syvitski, J.P.; Peckham, S.D.; Hilberman, R.; Mulder, T. Predicting the terrestrial flux of sediment to the global ocean: A planetary perspective. Sediment. Geol. 2003, 162, 5–24. [Google Scholar] [CrossRef]
- Ashworth, P.J.; Ferguson, R.I. Interrelationships of channel processes, changes and sediments in a proglacial braided river. Geogr. Ann. Ser. Phys. Geogr. 1986, 68, 361–371. [Google Scholar] [CrossRef]
- Carson, M.A.; Griffiths, G.A. Bedload transport in gravel channels. J. Hydrol. N. Z. 1987, 26, 1–151. [Google Scholar]
- Ferguson, R.I.; Ashmore, P.E.; Ashworth, P.J.; Paola, C.; Prestegaard, K.L. Measurements in a braided river chute and lobe: 1. Flow pattern, sediment transport, and channel change. Water Resour. Res. 1992, 28, 1877–1886. [Google Scholar] [CrossRef]
- Goff, J.R.; Ashmore, P. Gravel transport and morphological change in braided Sunwapta River, Alberta, Canada. Earth Surf. Process. Landf. 1994, 19, 195–212. [Google Scholar] [CrossRef]
- Hassan, M.A.; Church, M.; Lisle, T.E.; Brardinoni, F.; Benda, L.; Grant, G.E. Sediment transport and channel morphology of small, forested streams. JAWRA J. Am. Water Resour. Assoc. 2005, 41, 853–876. [Google Scholar] [CrossRef]
- Kociuba, W.; Janicki, G.; Siwek, K.; Gluza, A. Bedload transport as an indicator of contemporary transformations of arctic fluvial systems. In Monitoring Simulation Prevention and Remediation of Dense and Debris Flows IV; WIT Press: Boston, MA, USA, 2012; pp. 125–135. [Google Scholar]
- Folk, R.L.; Ward, W.C. Brazos River bar: A study in the significance of grain size parameters. J. Sediment. Petrol. 1957, 27, 3–26. [Google Scholar] [CrossRef]
- Visher, G.S. Grain size distributions and depositional processes. J. Sediment. Res. 1969, 39, 1074–1106. [Google Scholar]
- Bagnold, R.A. Bed load transport by natural rivers. Water Resour. Res. 1977, 13, 303–312. [Google Scholar] [CrossRef]
- Friedman, G.M. Differences in size distributions of populations of particles among sands of various origins: addendum to IAS Presidential Address. Sedimentology 1979, 26, 859–862. [Google Scholar] [CrossRef]
- Proffitt, G.T.; Sutherland, A.J. Transport of non-uniform sediments. J. Hydraul. Res. 1983, 21, 33–43. [Google Scholar] [CrossRef]
- Wilcock, P.R.; McArdell, B.W. Surface-based fractional transport rates: Mobilization thresholds and partial transport of a sand-gravel sediment. Water Resour. Res. 1993, 29, 1297–1312. [Google Scholar] [CrossRef]
- Wilcock, P.R.; McArdell, B.W. Partial transport of a sand/gravel sediment. Water Resour. Res. 1997, 33, 235–245. [Google Scholar] [CrossRef]
- Reid, I.; Frostick, L.E.; Layman, J.T. The incidence and nature of bedload transport during flood flows in coarse-grained alluvial channels. Earth Surf. Process. Landf. 1985, 10, 33–44. [Google Scholar] [CrossRef]
- Lisle, T.E. Particle size variations between bed load and bed material in natural gravel bed channels. Water Resour. Res. 1995, 31, 1107–1118. [Google Scholar] [CrossRef]
- Bui, E.N.; Mazzullo, J.M.; Wilding, L.P. Using quartz grain size and shape analysis to distinguish between aeolian and fluvial deposits in the Dallol Bosso of Niger (West Africa). Earth Surf. Process. Landf. 1989, 14, 157–166. [Google Scholar] [CrossRef]
- Ashworth, P.J.; Ferguson, R.I.; Ashmore, P.E.; Paola, C.; Powell, D.M.; Prestegaards, K.L. Measurements in a braided river chute and lobe: 2. Sorting of bed load during entrainment, transport, and deposition. Water Resour. Res. 1992, 28, 1887–1896. [Google Scholar] [CrossRef]
- Schneider, J.M.; Turowski, J.M.; Rickenmann, D.; Hegglin, R.; Arrigo, S.; Mao, L.; Kirchner, J.W. Scaling relationships between bed load volumes, transport distances, and stream power in steep mountain channels. J. Geophys. Res. Earth Surf. 2014, 119, 533–549. [Google Scholar] [CrossRef]
- McLaren, P.; Bowles, D. The effects of sediment transport on grain-size distributions. J. Sediment. Petrol. 1985, 55, 457–470. [Google Scholar]
- Bialik, R.J.; Nikora, V.I.; Rowiński, P.M. 3D Lagrangian modelling of saltating particles diffusion in turbulent water flow. Acta Geophys. 2012, 60, 1639–1660. [Google Scholar] [CrossRef]
- Bialik, R.J.; Nikora, V.I.; Karpiński, M.; Rowiński, P.M. Diffusion of bedload particles in open-channel flows: Distribution of travel times and second-order statistics of particle trajectories. Environ. Fluid Mech. 2015, 15, 1281–1292. [Google Scholar] [CrossRef] [Green Version]
- Bakke, P.D.; Sklar, L.S.; Dawdy, D.R.; Wang, W.C. The Design of a Site-Calibrated Parker–Klingeman Gravel Transport Model. Water 2017, 9, 441. [Google Scholar] [CrossRef]
- Kociuba, W.; Janicki, G. Changeability of movable bed-surface particles in natural, gravel-bed channels and its relation to bedload grain size distribution (scott river, svalbard). Geogr. Ann. Ser. Phys. Geogr. 2015, 97, 507–521. [Google Scholar] [CrossRef]
- Ghoshal, K.; Mazumder, B.S.; Purkait, B. Grain-size distributions of bed load: Inferences from flume experiments using heterogeneous sediment beds. Sediment. Geol. 2010, 223, 1–14. [Google Scholar] [CrossRef]
- Parker, G.; Klingeman, P.C. On Why Gravel Bed Streams Are Paved. Water Resour. Res. 1982, 18, 1409–1423. [Google Scholar] [CrossRef]
- Buffington, J.M.; Montgomery, D.R. A systematic analysis of eight decades of incipient motion studies, with special reference to gravel-bedded rivers. Water Resour. Res. 1997, 33, 1993–2029. [Google Scholar] [CrossRef]
- Church, M.; Hassan, M.A. Mobility of bed material in Harris Creek. Water Resour. Res. 2002, 38. [Google Scholar] [CrossRef]
- Batalla, R.J.; Vericat, D.; Gibbins, C.N.; Garcia, C. Incipient bed-material motion in a gravel-bed river: Field observations and measurements. U. S. Geol. Surv. Sci. Investig. Rep. 2010, 5091, 15. [Google Scholar]
- Turowski, J.M.; Badoux, A.; Rickenmann, D. Start and end of bedload transport in gravel-bed streams. Geophys. Res. Lett. 2011, 38. [Google Scholar] [CrossRef]
- Johnson, J.P. Gravel threshold of motion: A state function of sediment transport disequilibrium? Earth Surf. Dyn. 2016, 4, 685. [Google Scholar] [CrossRef]
- Ferguson, R.I.; Prestegaard, K.L.; Ashworth, P.J. Influence of sand on hydraulics and gravel transport in a braided gravel bed river. Water Resour. Res. 1989, 25, 635–643. [Google Scholar] [CrossRef]
- Komar, P.D.; Li, Z. Pivoting analyses of the selective entrainment of sediments by shape and size with application to gravel threshold. Sedimentology 1986, 33, 425–436. [Google Scholar] [CrossRef]
- Naden, P. An erosion criterion for gravel-bed rivers. Earth Surf. Process. Landf. 1987, 12, 83–93. [Google Scholar] [CrossRef]
- Wiberg, P.L.; Smith, J.D. Calculations of the critical shear stress for motion of uniform and heterogeneous sediments. Water Resour. Res. 1987, 23, 1471–1480. [Google Scholar] [CrossRef]
- Duan, J.G.; Scott, S. Selective bed-load transport in Las Vegas Wash, a gravel-bed stream. J. Hydrol. 2007, 342, 320–330. [Google Scholar] [CrossRef]
- Ashworth, P.J.; Ferguson, R.I. Size-selective entrainment of bed load in gravel bed streams. Water Resour. Res. 1989, 25, 627–634. [Google Scholar] [CrossRef]
- Ashworth, P.J.; Ferguson, R.I.; Powell, D.M. Bedload transport and sorting in braided channels. In Dynamics of Gravel-Bed Rivers; Bili, P., Hey, R.D., Thorne, C.R., Tacconi, P., Eds.; John Wiley: Hoboken, NJ, USA, 1992; pp. 497–513. [Google Scholar]
- Sziło, J.; Bialik, R.J. Bedload transport in two creeks at the ice-free area of the Baranowski Glacier, King George Island, West Antarctica. Pol. Polar Res. 2017, 38, 21–39. [Google Scholar] [CrossRef]
- Doran, P.T.; Priscu, J.C.; Lyons, W.B.; Walsh, J.E.; Fountain, A.G.; McKnight, D.M.; Moorhead, D.L.; Virginia, R.A.; Wall, D.H.; Clow, G.D. Antarctic climate cooling and terrestrial ecosystem response. Nature 2002, 415, 517–520. [Google Scholar] [CrossRef] [PubMed]
- Ferron, F.A.; Simões, J.C.; Aquino, F.E.; Setzer, A.W. Air temperature time series for King George Island, Antarctica. Pesqui. Antártica Bras. 2004, 4, 155–169. [Google Scholar]
- Kejna, M. Air temperature on King George Island, South Shetland Islands, Antarctica. Pol. Polar Res. 1999, 20, 183–201. [Google Scholar]
- Kejna, M. Trends of air temperature of the Antarctic during the period 1958–2000. Pol. Polar Res. 2003, 24, 99–126. [Google Scholar]
- Kejna, M.; Araźny, A.; Sobota, I. Climatic change on King George Island in the years 1948–2011. Pol. Polar Res. 2013, 34, 213–235. [Google Scholar] [CrossRef]
- Van den Broeke, M.R. On the interpretation of Antarctic temperature trends. J. Clim. 2000, 13, 3885–3889. [Google Scholar] [CrossRef]
- Pętlicki, M.; Sziło, J.; MacDonell, S.; Vivero, S.; Bialik, R. Recent Deceleration of the Ice Elevation Change of Ecology Glacier (King George Island, Antarctica). Remote Sens. 2017, 9, 520. [Google Scholar] [CrossRef]
- Arctic and Antarctic Research Institute, St. Petersburg. Available online: http://www.aari.aq/data/data.php?lang=1&station=0 (accessed on 11 January 2018).
- Kociuba, W.; Janicki, G. Continuous measurements of bedload transport rates in a small glacial river catchment in the summer season (Spitsbergen). Geomorphology 2014, 212, 58–71. [Google Scholar] [CrossRef]
- Kociuba, W. Determination of the bedload transport rate in a small proglacial High Arctic stream using direct, semi-continuous measurement. Geomorphology 2017, 287, 101–115. [Google Scholar] [CrossRef]
- Blott, S.J.; Pye, K. GRADISTAT: A grain size distribution and statistics package for the analysis of unconsolidated sediments. Earth Surf. Process. Landf. 2001, 26, 1237–1248. [Google Scholar] [CrossRef]
- Bialik, R.J.; Karpiński, M.; Rajwa, A. Discharge measurements in lowland rivers: Field comparison between an electromagnetic open channel flow meter (EOCFM) and an acoustic Doppler current profiler (ADCP). In Achievements, History and Challenges in Geophysics; Springer: New York, NY, USA, 2014; pp. 213–222. [Google Scholar]
- Feng, C.; Wang, H.; Lu, N.; Tu, X.M. Log transformation: Application and interpretation in biomedical research. Stat. Med. 2013, 32, 230–239. [Google Scholar] [CrossRef] [PubMed]
- Robertson, J.; Thomas, C.J.; Caddy, B.; Lewis, A.J. Particle size analysis of soils—A comparison of dry and wet sieving techniques. Forensic Sci. Int. 1984, 24, 209–217. [Google Scholar] [CrossRef]
- Kemper, W.D.; Rosenau, R.C. Aggregate stability and size distribution. In Methods of Soil Analysis. Part 1. Physical and Mineralogical Methods—Agronomy Monography; Soil Science Society of America: Madison, WI, USA, 1986; Volume 1, pp. 425–442. [Google Scholar]
- Kociuba, W. Bedload transport in a High Arctic gravel-bed river (Scott River, Svalbard SW). In New Perspectives in Polar Research; Institute of Geography and Regional Development, University of Wroclaw: Wrocław, Poland, 2014; pp. 231–246. [Google Scholar]
- Zagórski, P.; Siwek, K.; Gluza, A.; Bartoszewski, S.A. Changes in the extent and geometry of the Scott Glacier, Spitsbergen. Pol. Polar Res. 2008, 2, 163–185. [Google Scholar]
- Kondolf, G.M.; Wolman, M.G. The sizes of salmonid spawning gravels. Water Resour. Res. 1993, 29, 2275–2285. [Google Scholar] [CrossRef]
- Komar, P.D.; Carling, P.A. Grain sorting in gravel-bed streams and the choice of particle sizes for flow-competence evaluations. Sedimentology 1991, 38, 489–502. [Google Scholar] [CrossRef]
- Wathen, S.J.; Ferguson, R.I.; Hoey, T.B.; Werritty, A. Unequal mobility of gravel and sand in weakly bimodal river sediments. Water Resour. Res. 1995, 31, 2087–2096. [Google Scholar] [CrossRef]
- Church, M.; Hassan, M.A. Upland gravel-bed rivers with low sediment transport. Dev. Earth Surf. Process. 2005, 7, 141–168. [Google Scholar] [CrossRef]
Figure 1.
Location of the study site: (a) King George Island; (b) Baranowski Glacier catchment; (c) forefield of the glacier and measurement sites. Reference system: WGS 1984, UTM zone 21S, geoid EGM96.
Figure 1.
Location of the study site: (a) King George Island; (b) Baranowski Glacier catchment; (c) forefield of the glacier and measurement sites. Reference system: WGS 1984, UTM zone 21S, geoid EGM96.

Figure 2.
Temporal changes in (a) Reynolds number and (b) Froude number for both creeks.
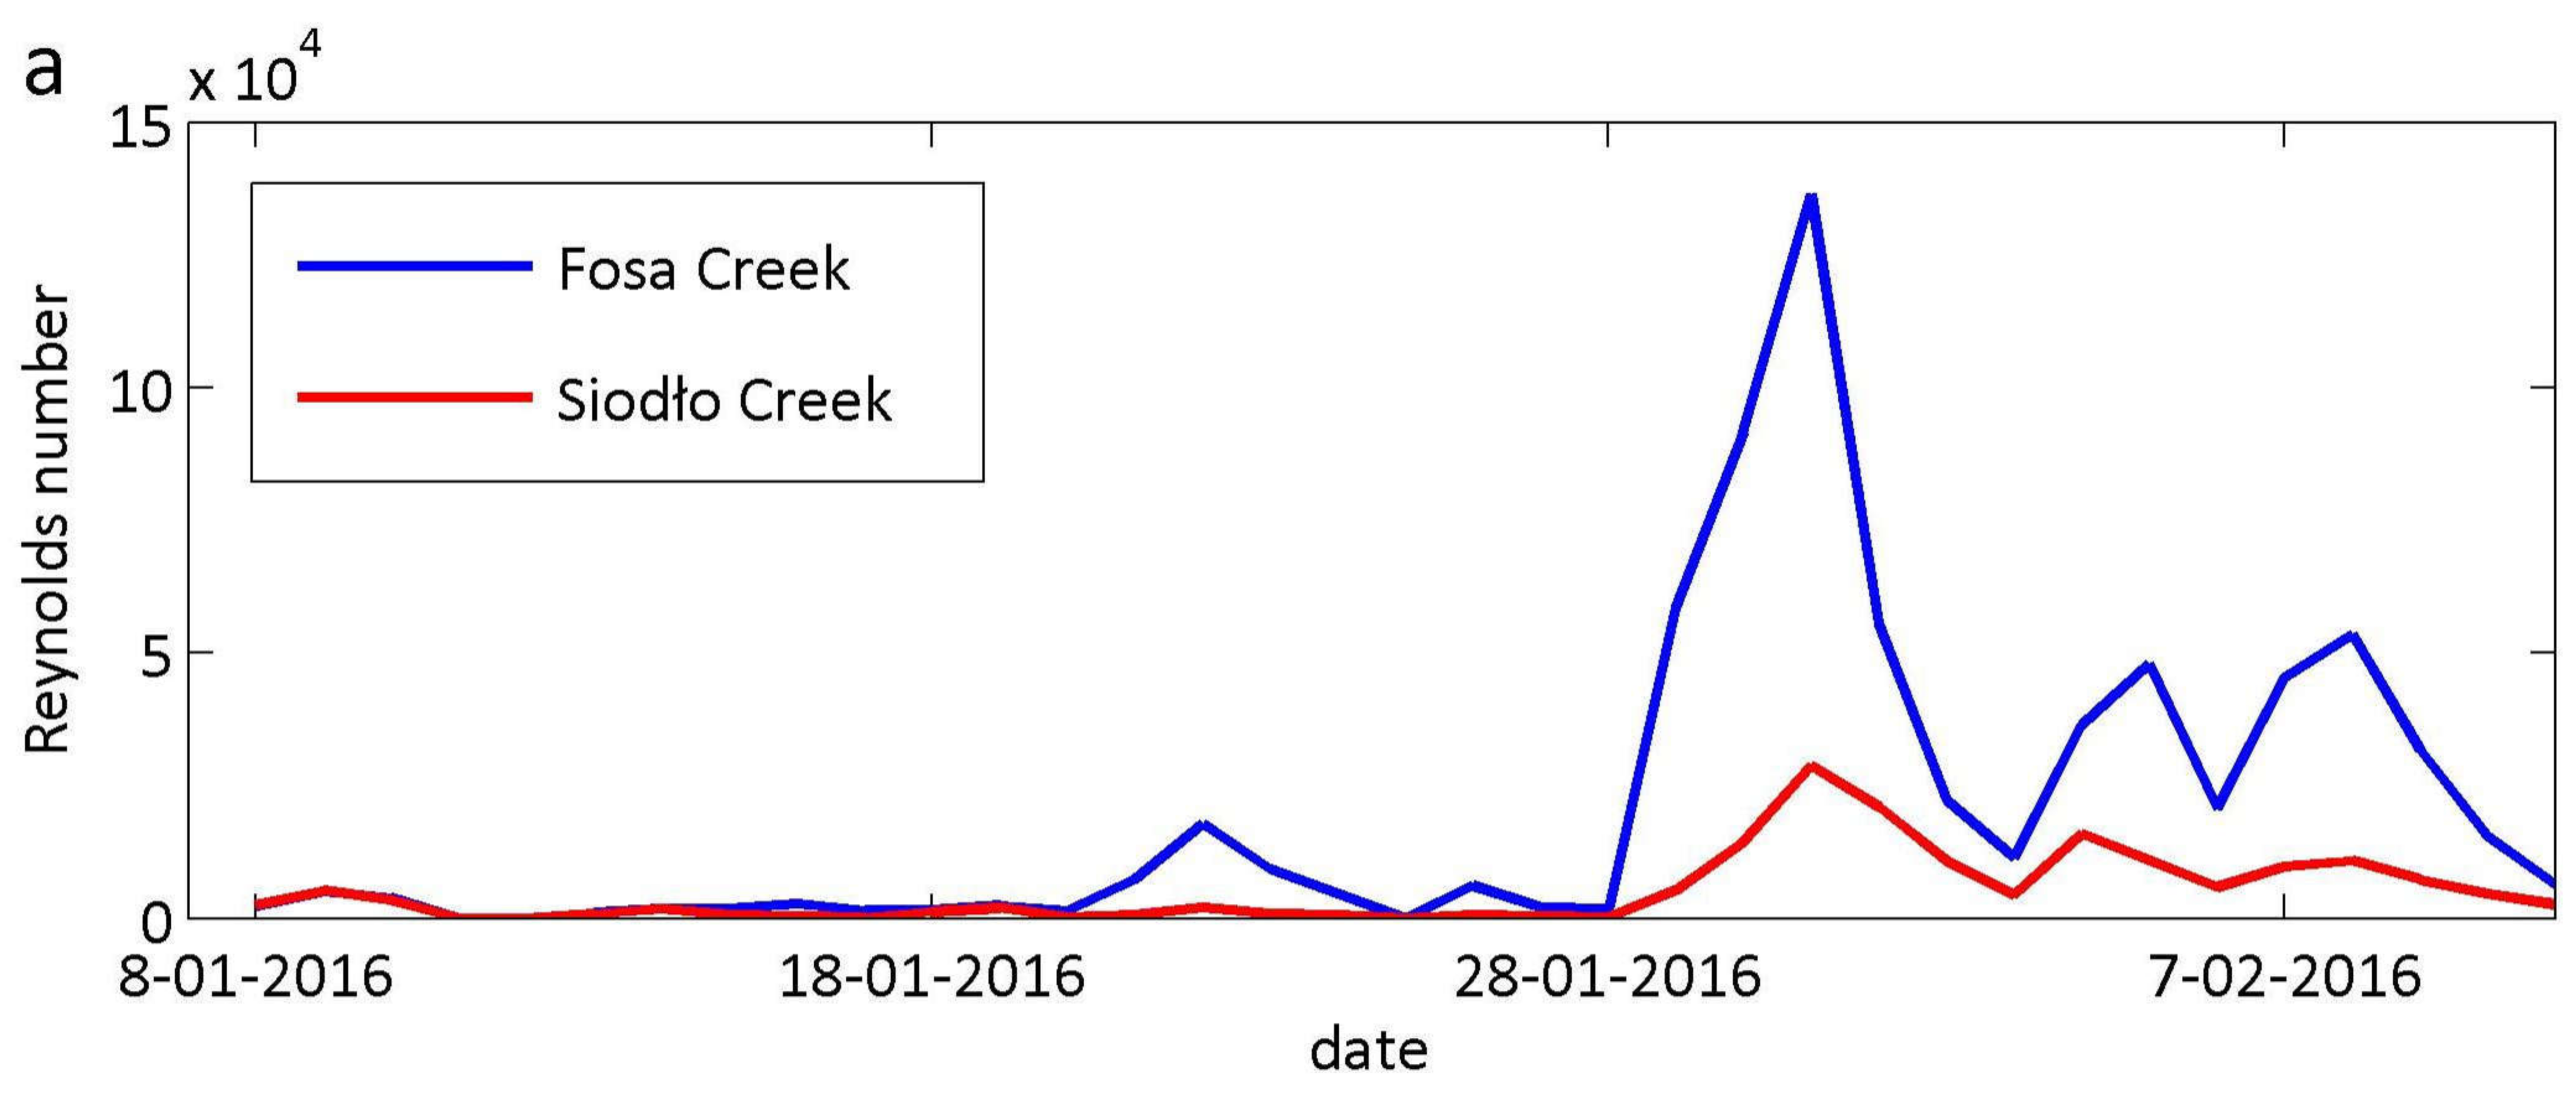

Figure 3.
Mean daily air temperature, precipitation, and discharge during the field campaign in 2016 from Bellingshausen Station.
Figure 3.
Mean daily air temperature, precipitation, and discharge during the field campaign in 2016 from Bellingshausen Station.
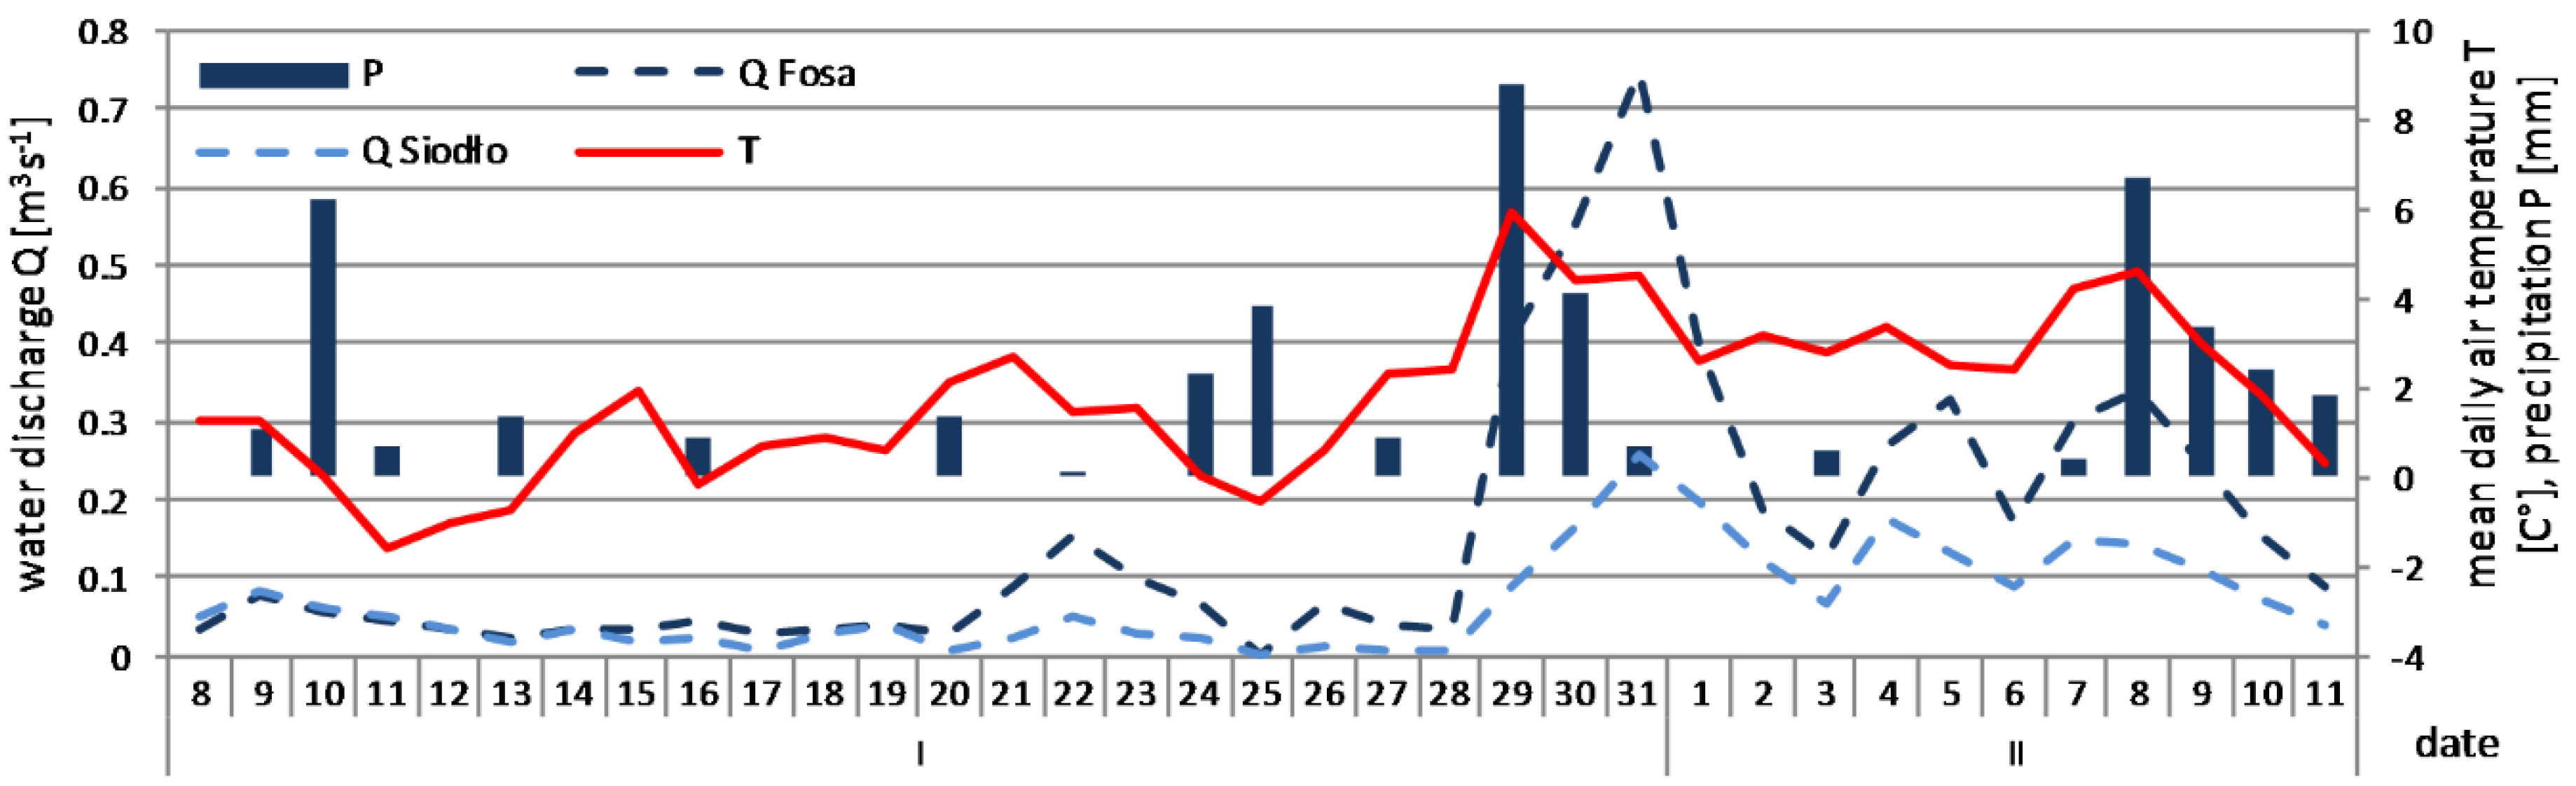
Figure 4.
River Bedload Traps (RBT) in (a) Fosa Creek and (b) Siodło Creek (modified from Sziło and Bialik [46]); (c) schematic diagram for the bedload transport technique (Kociuba [56]).
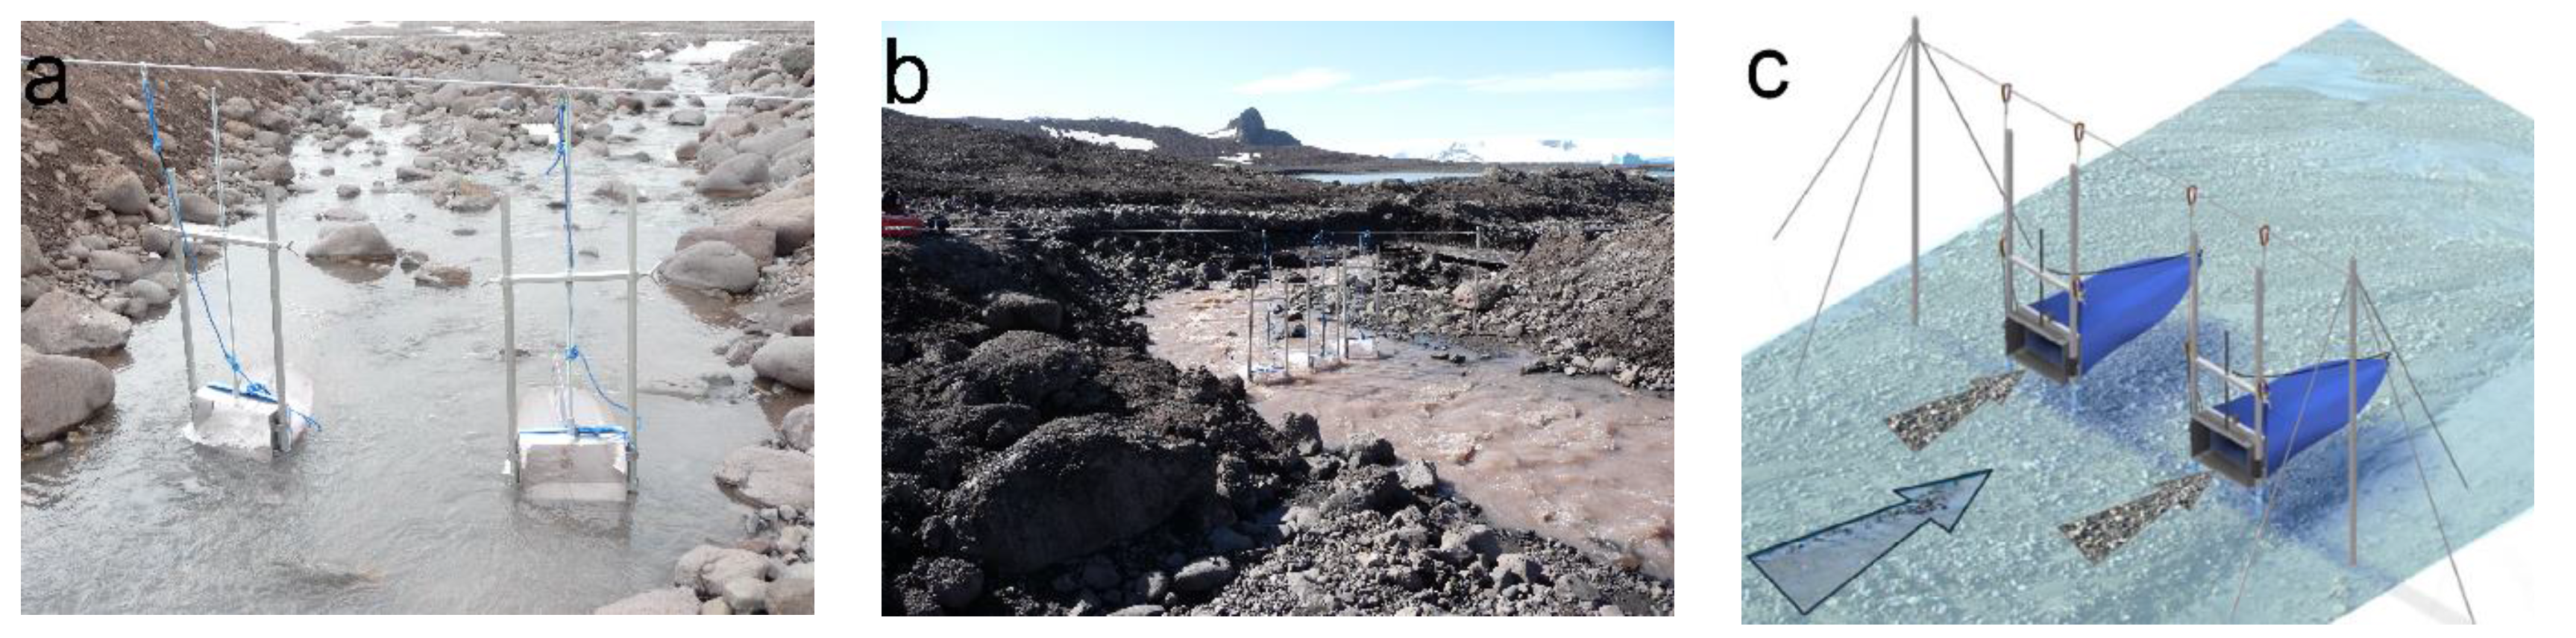
Figure 5.
Bedload transport (a), water discharge (b), and flow velocity (c) data for Fosa Creek (1) and Siodło Creek (2).
Figure 5.
Bedload transport (a), water discharge (b), and flow velocity (c) data for Fosa Creek (1) and Siodło Creek (2).
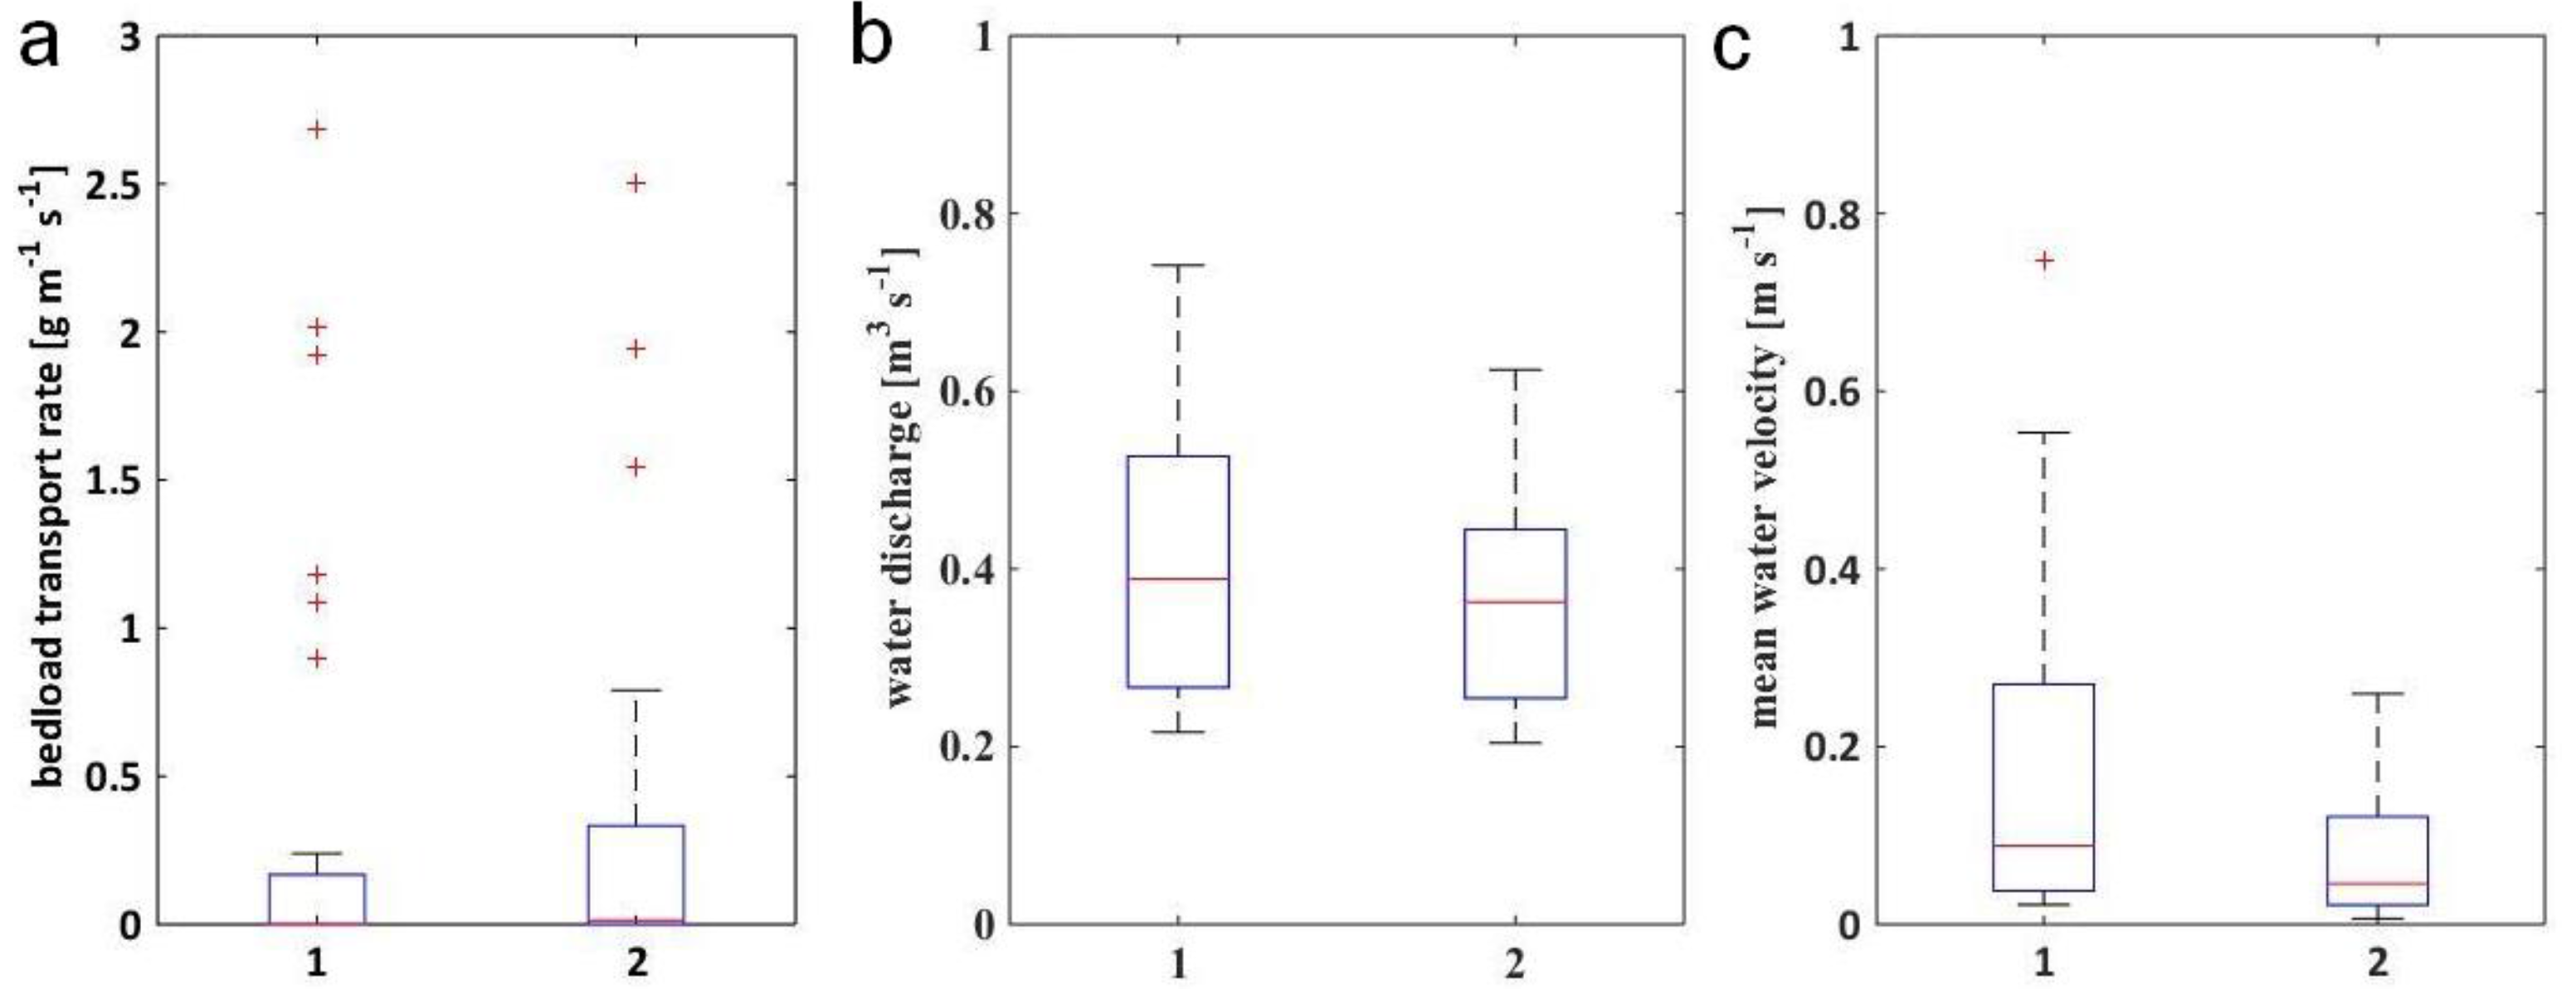
Figure 6.
Weight fractions of the wet and dry samples.

Figure 7.
Relation between sorting (σ) and mean grain size (Mz) in Fosa and Siodło creeks in all profiles.
Figure 7.
Relation between sorting (σ) and mean grain size (Mz) in Fosa and Siodło creeks in all profiles.
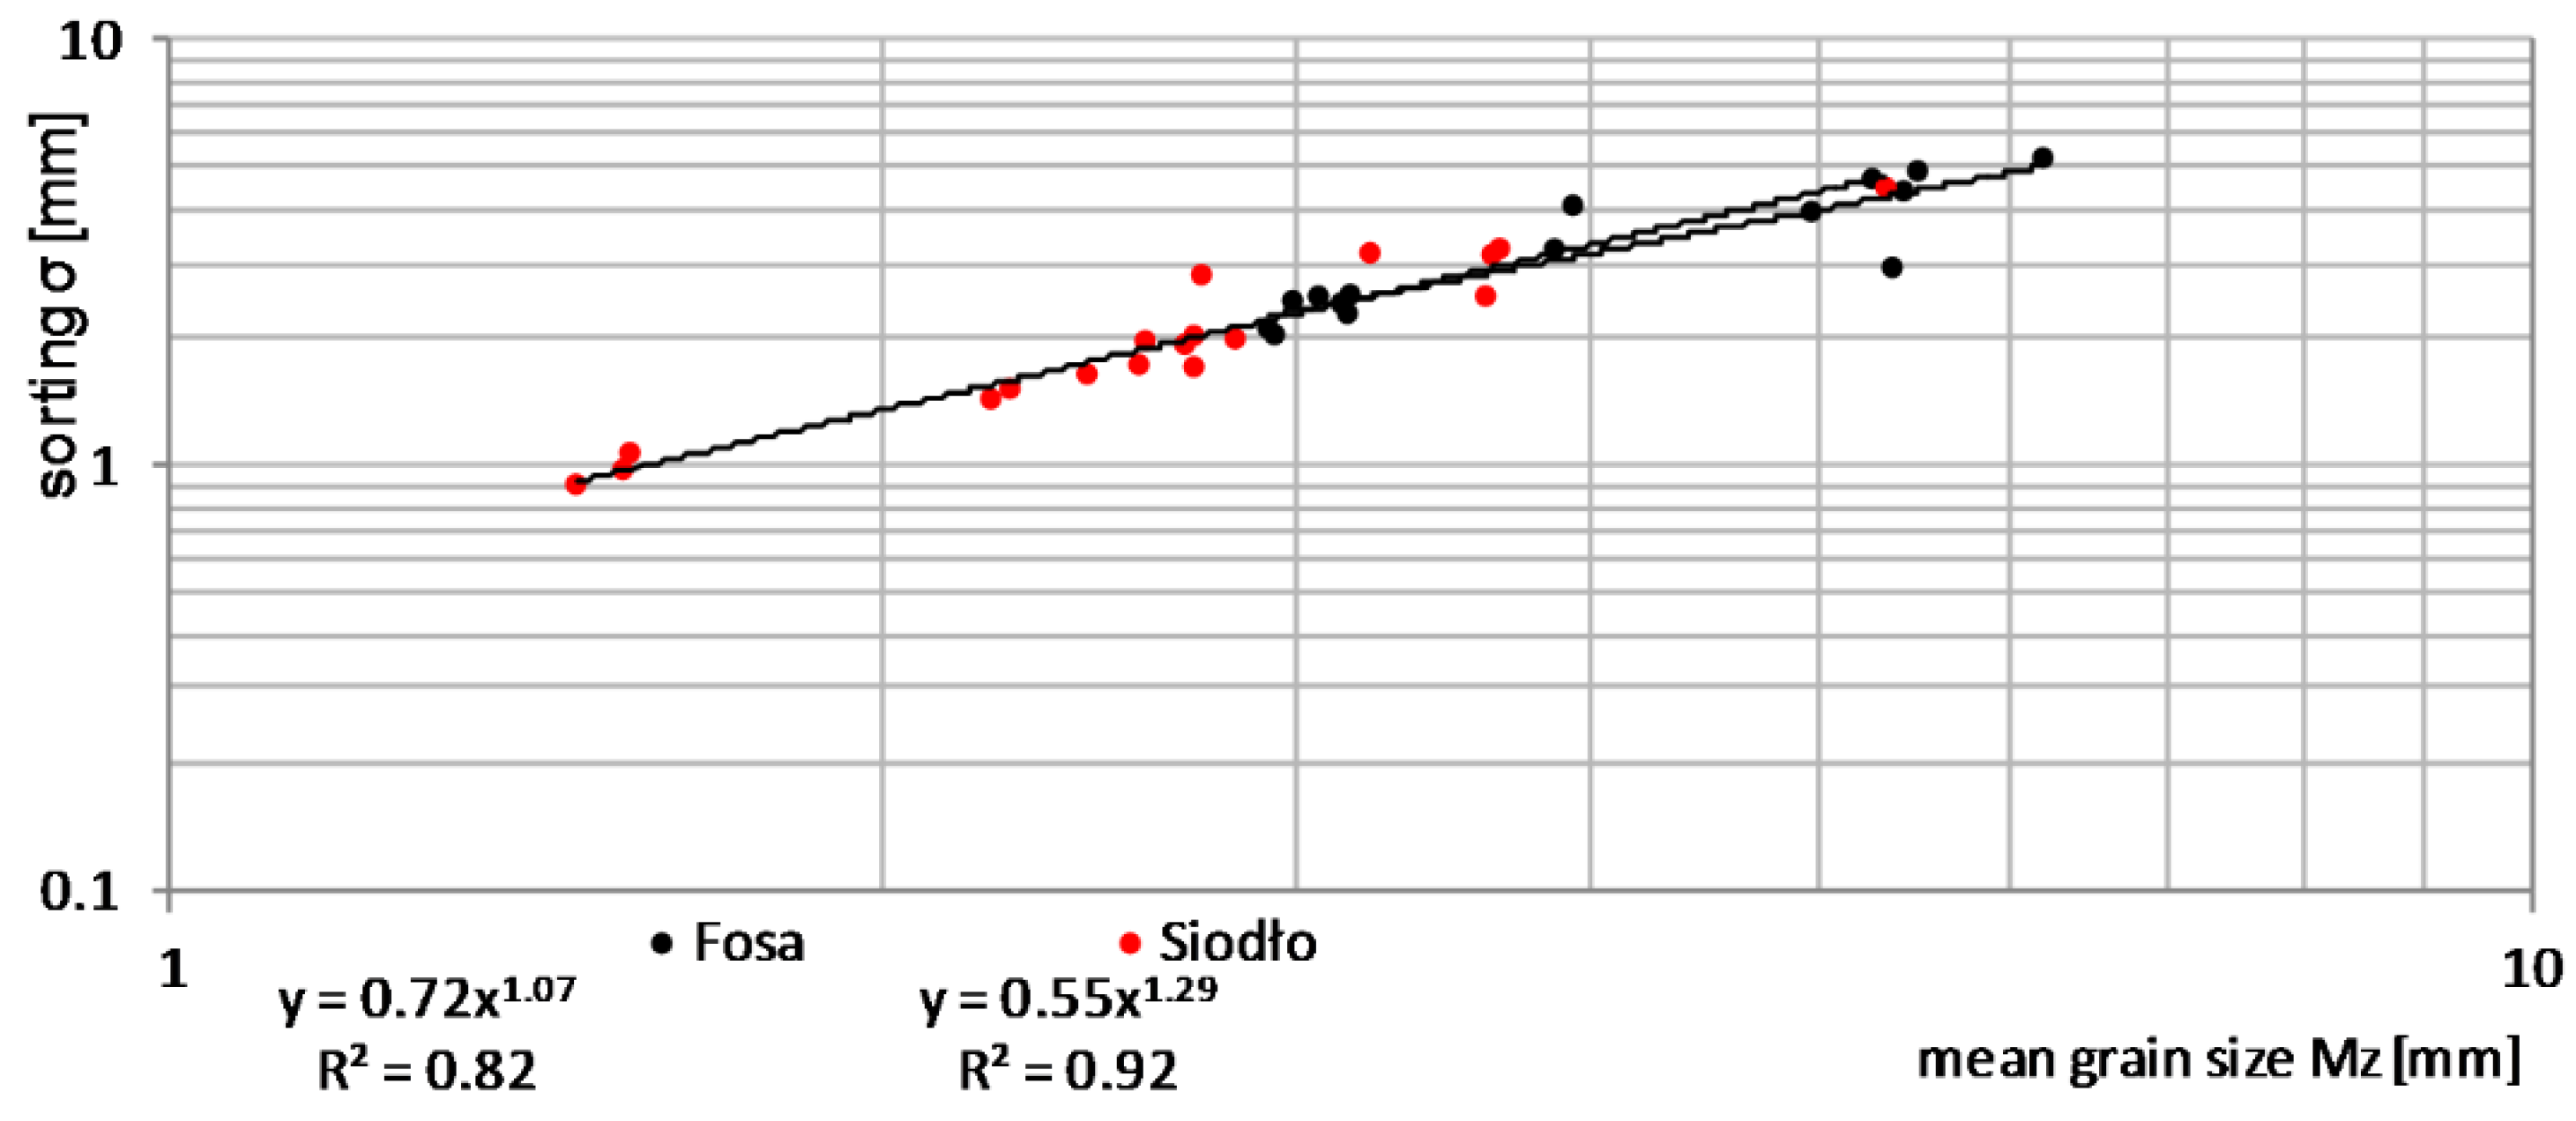
Figure 8.
Relation between sorting (σ) and mean grain size (Mz) in Fosa (a) and Siodło (b) creeks in individual traps.
Figure 8.
Relation between sorting (σ) and mean grain size (Mz) in Fosa (a) and Siodło (b) creeks in individual traps.

Figure 9.
Bedload transport and sorting in individual traps in the Fosa (a) and Siodło (b) creeks.

Figure 10.
Grain size parameters (by Folk and Ward, 1957) for Fosa and Siodło Creeks: bedload transport rate and sorting for Fosa (a) and Siodło (b); skewness (c); and kurtosis (d).
Figure 10.
Grain size parameters (by Folk and Ward, 1957) for Fosa and Siodło Creeks: bedload transport rate and sorting for Fosa (a) and Siodło (b); skewness (c); and kurtosis (d).


Figure 11.
Correlation between bedload transport rate and characteristic diameters Db for Fosa (a) and Siodło (b) creeks, where b stands for the percentage of the weight of the sample finer than this value.
Figure 11.
Correlation between bedload transport rate and characteristic diameters Db for Fosa (a) and Siodło (b) creeks, where b stands for the percentage of the weight of the sample finer than this value.
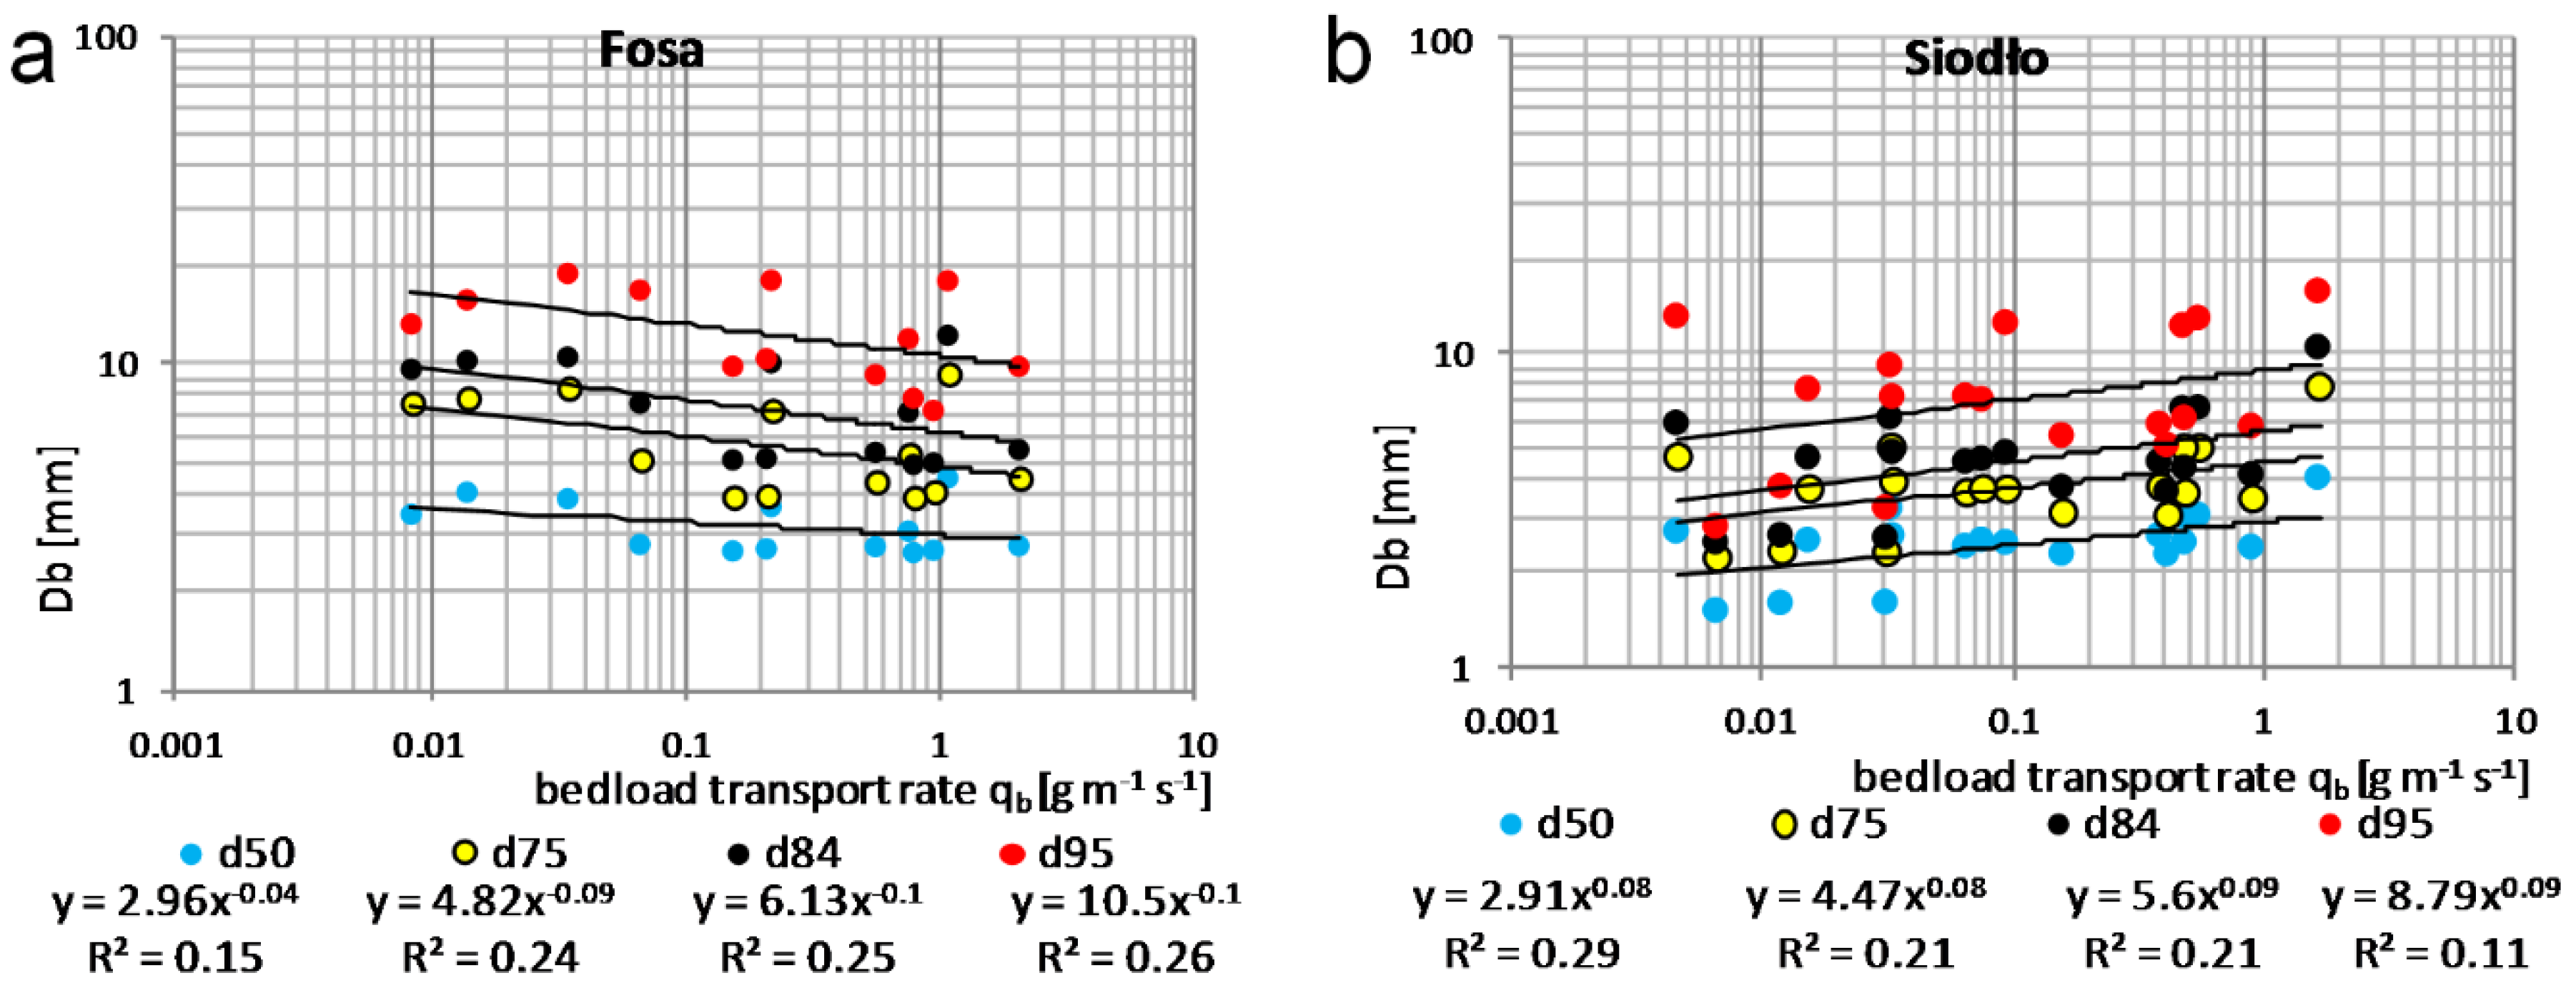
Figure 12.
Percentage of bedload vs water discharge for Fosa (a) and Siodło (b) creeks.
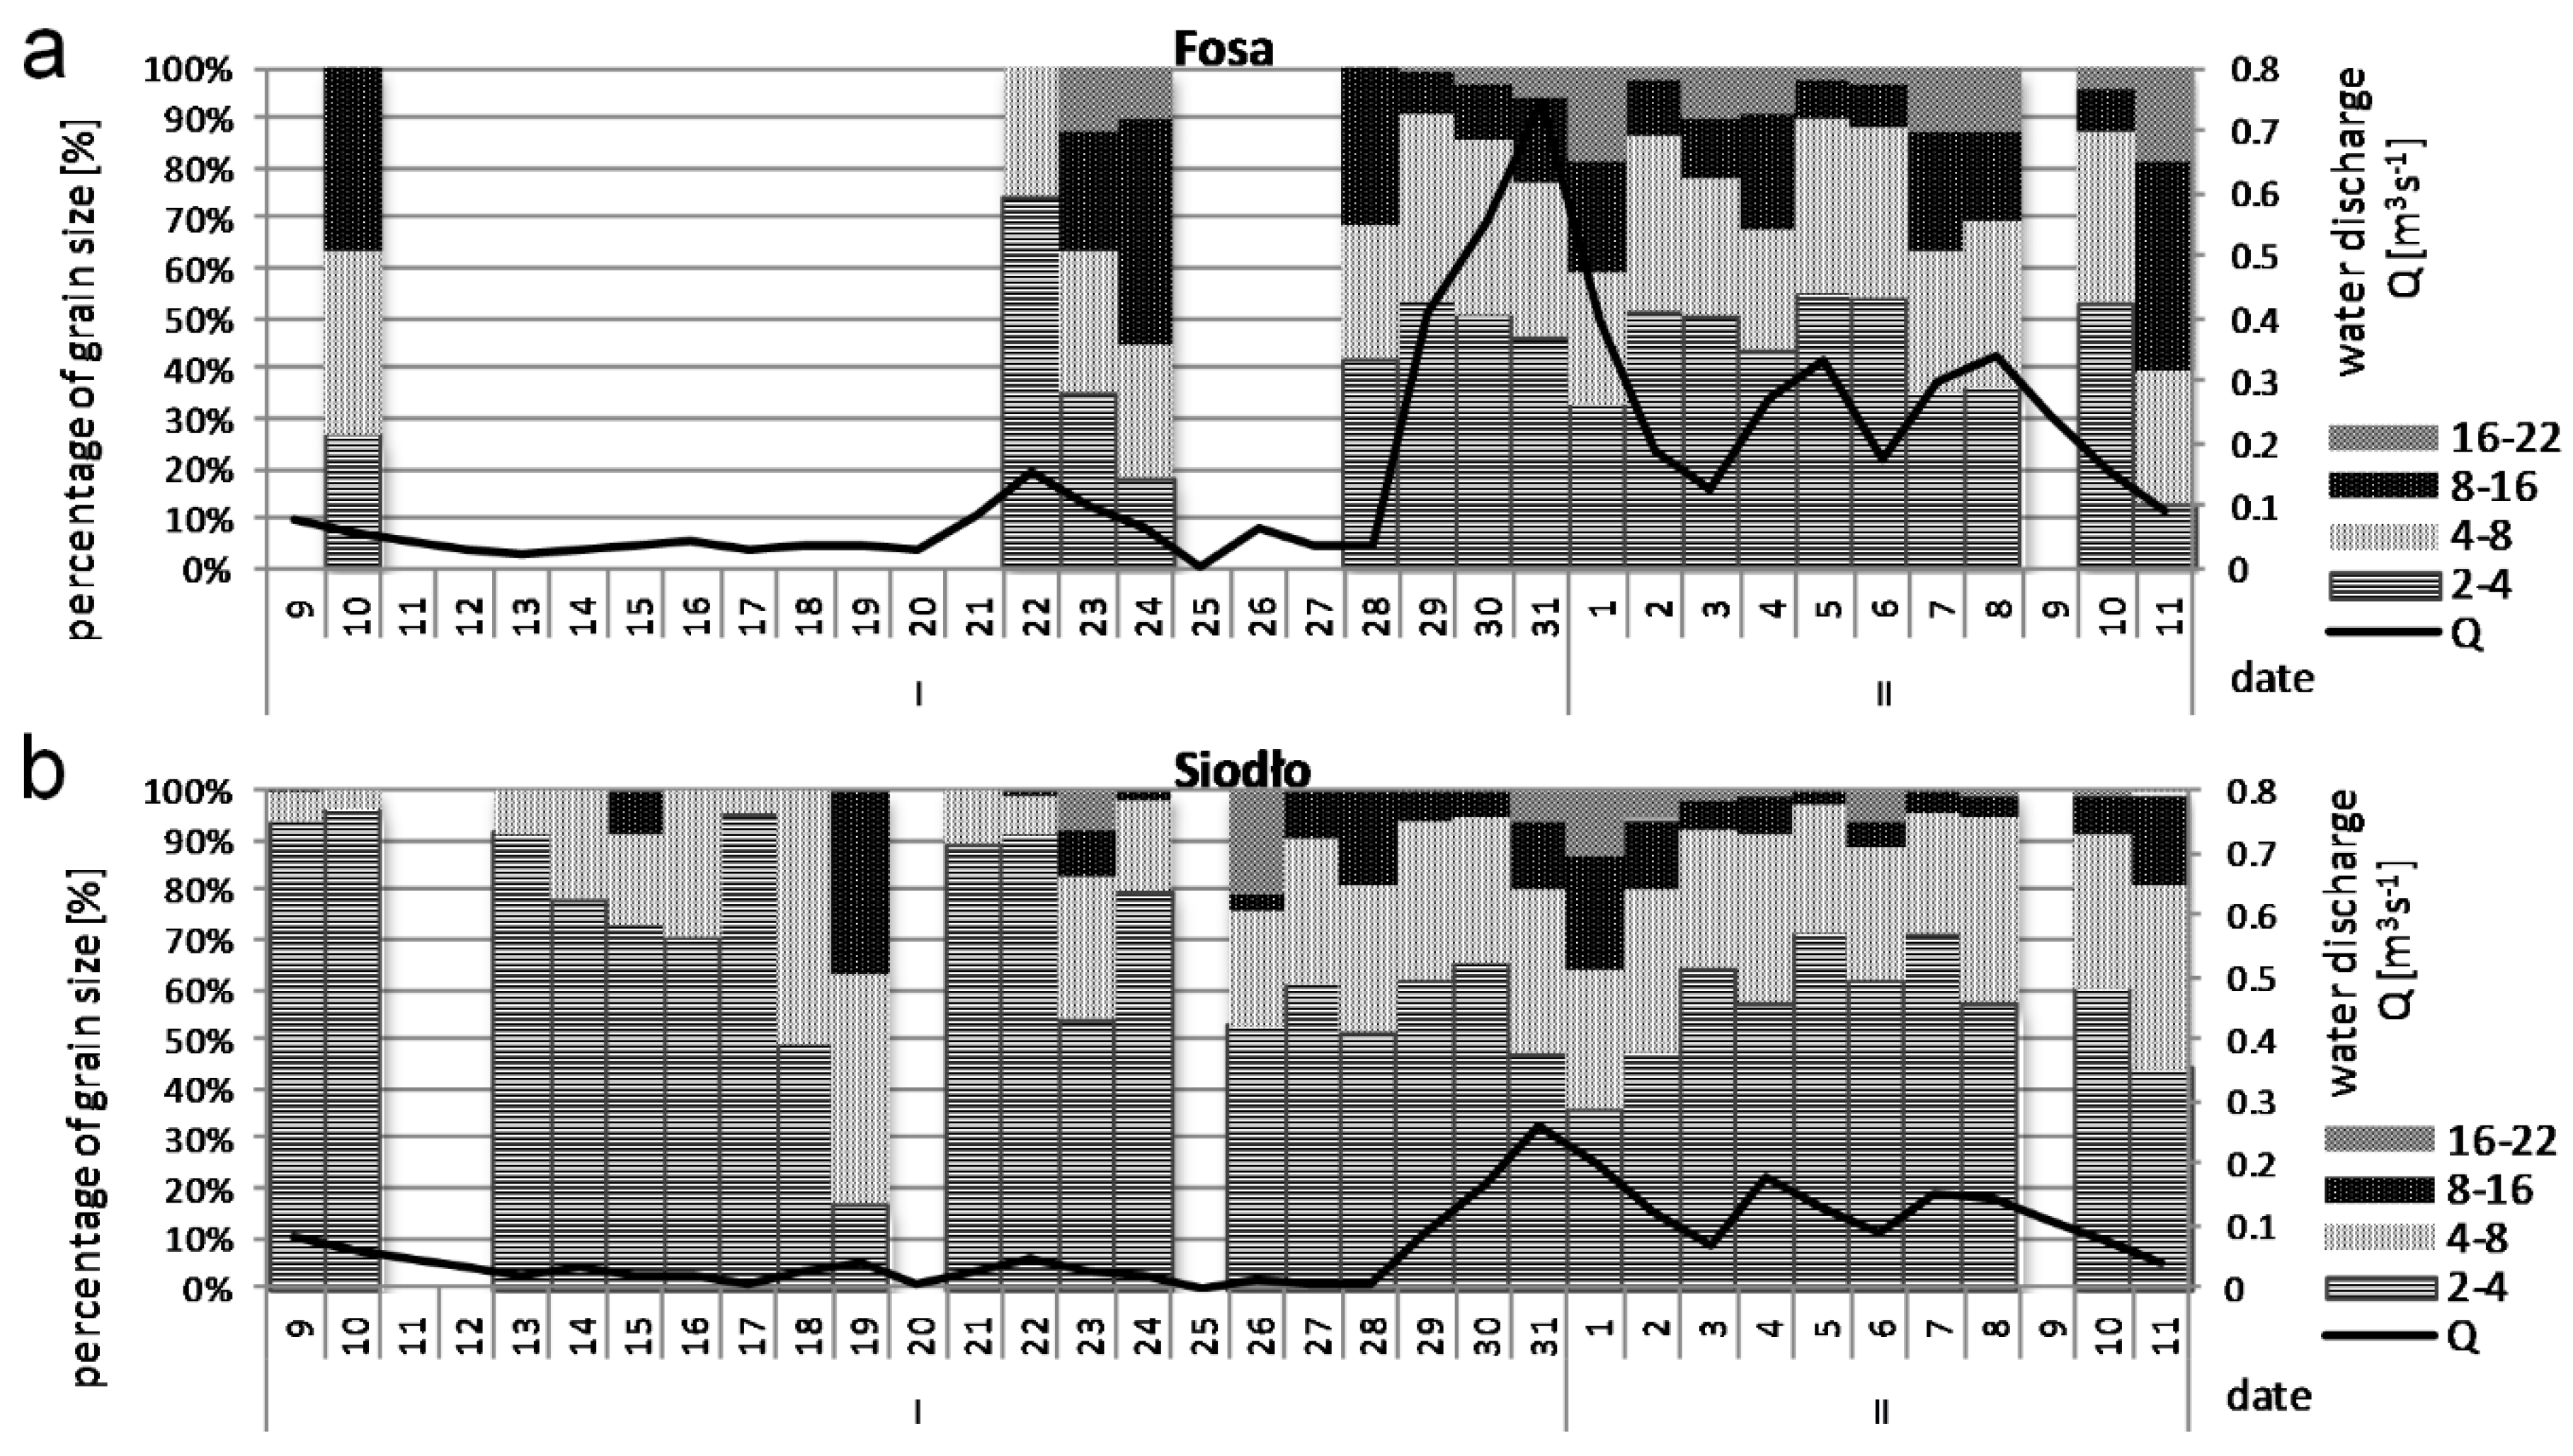
Figure 13.
Relationship between water discharge and quantity of fine and very fine gravel in Fosa (a) and Siodło (b) creeks.
Figure 13.
Relationship between water discharge and quantity of fine and very fine gravel in Fosa (a) and Siodło (b) creeks.
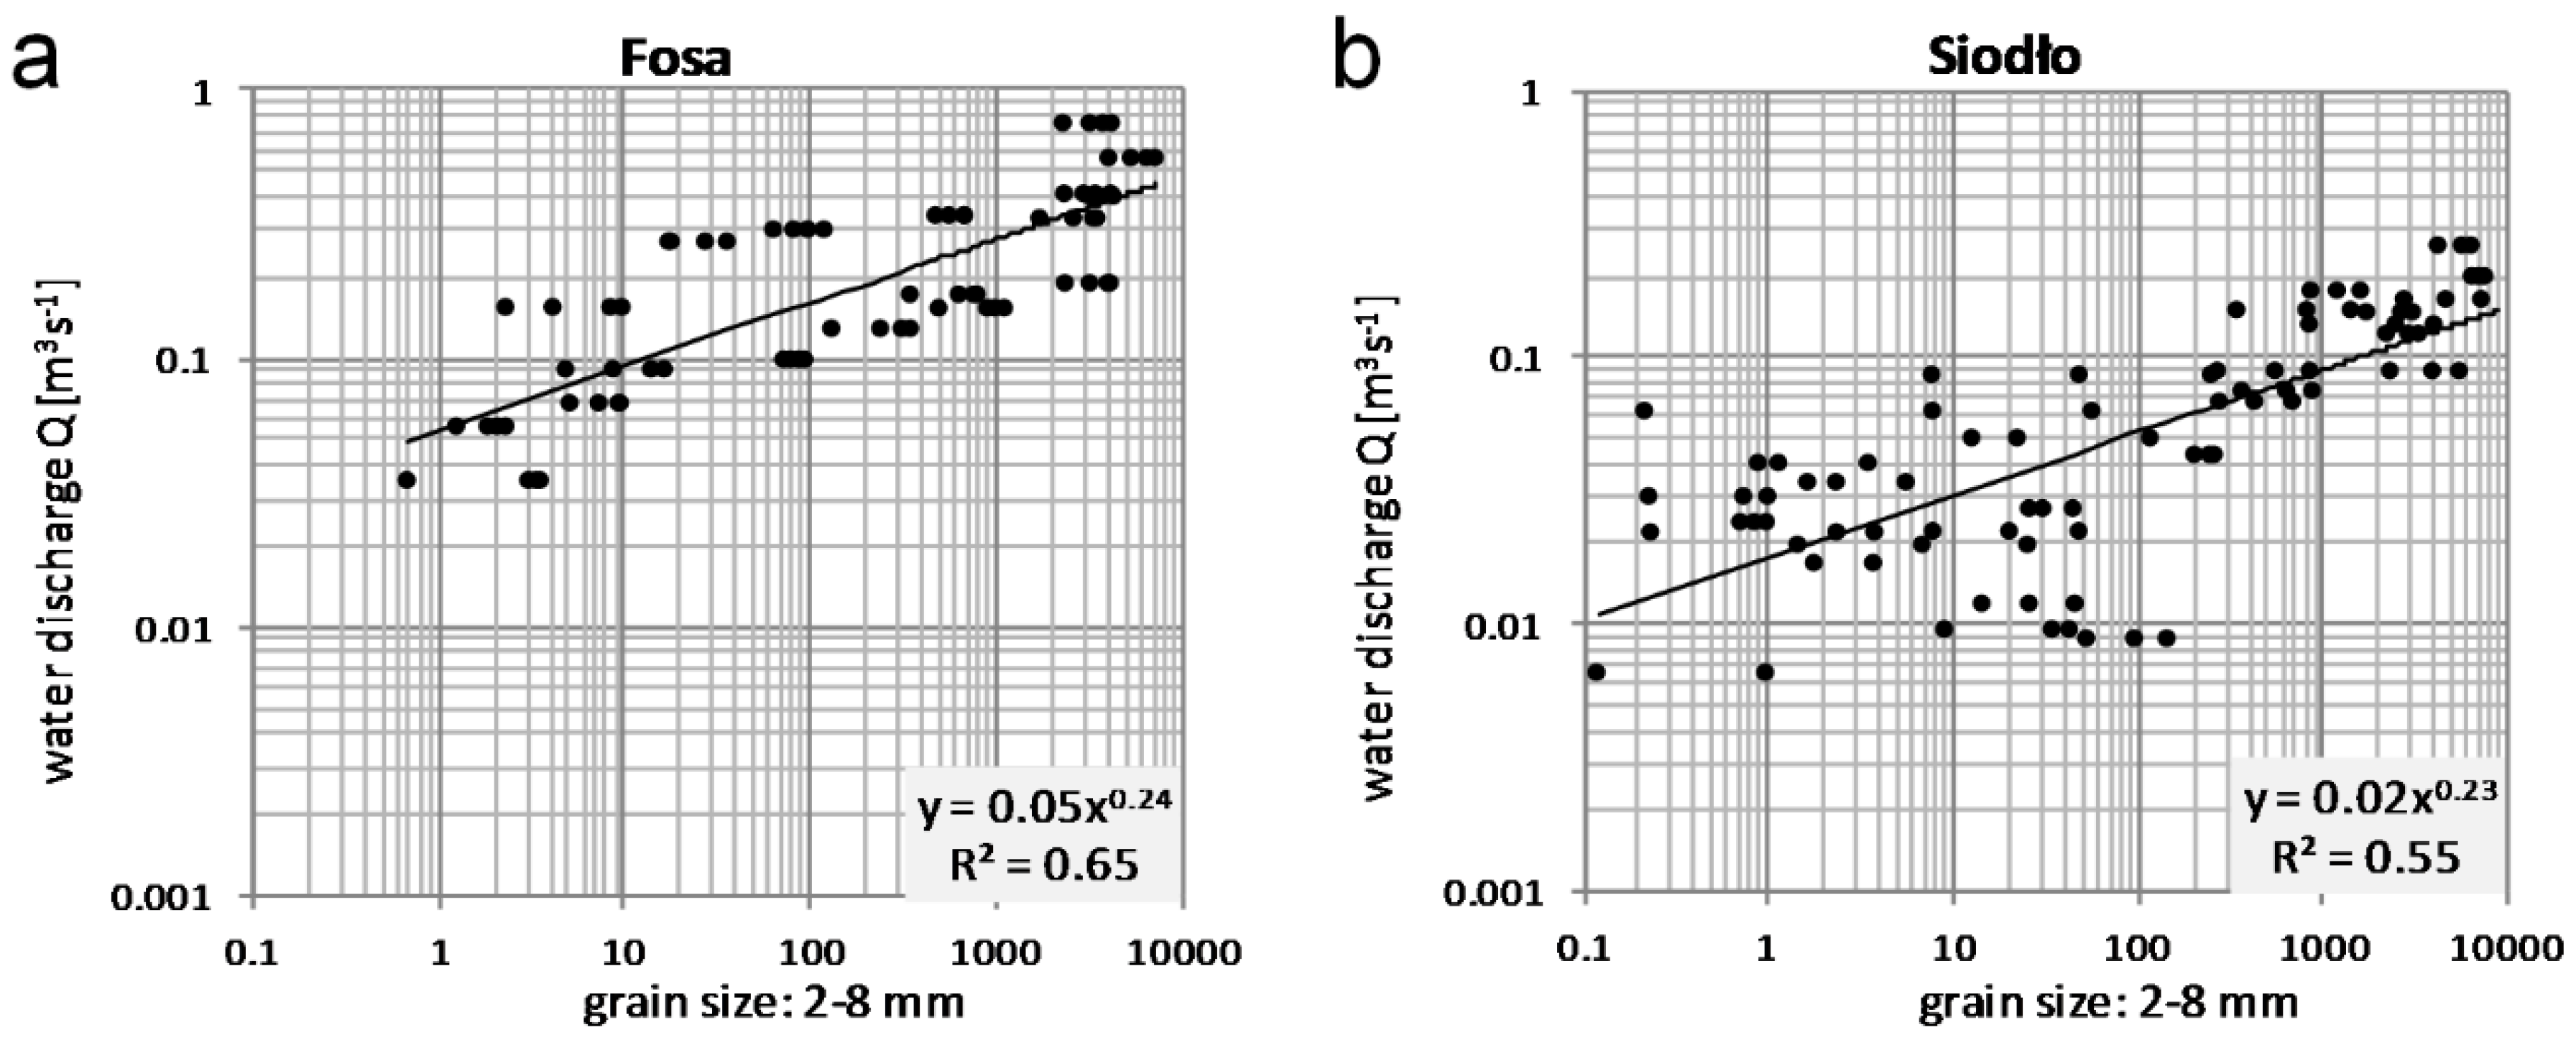
Figure 14.
Relationship between water velocity and quantity of fine and very fine gravel in Fosa (a) and Siodło (b) creeks.
Figure 14.
Relationship between water velocity and quantity of fine and very fine gravel in Fosa (a) and Siodło (b) creeks.


Table 1.
Basic hydraulic parameters of Fosa and Siodło creeks.
| Parameter | Total Length (L) [km] | Average Bankfull Width (w) [m] | Average Bankfull Depth (d) [m] | Longitudinal Water Surface Slope (S) [mm−1] | Maximum Discharge (Qmax) [m3 s−1] 1 | Maximum Velocity (Vmax) [ms−1] 2 |
|---|---|---|---|---|---|---|
| Fosa Creek | 1.40 | 2.82 | 0.14 | 0.07 | 0.75 | 0.91 |
| Siodło Creek | 0.42 | 2.15 | 0.09 | 0.08 | 0.26 | 1.25 |
Note: 1 Qmax: maximum water discharge measured at one day during field campaign; 2 Vmax: maximum water velocity measured at one point during field campaign.
© 2018 by the authors. Licensee MDPI, Basel, Switzerland. This article is an open access article distributed under the terms and conditions of the Creative Commons Attribution (CC BY) license (http://creativecommons.org/licenses/by/4.0/).
Share and Cite
MDPI and ACS Style
Sziło, J.; Bialik, R.J. Grain Size Distribution of Bedload Transport in a Glaciated Catchment (Baranowski Glacier, King George Island, Western Antarctica). Water 2018, 10, 360. https://doi.org/10.3390/w10040360
AMA Style
Sziło J, Bialik RJ. Grain Size Distribution of Bedload Transport in a Glaciated Catchment (Baranowski Glacier, King George Island, Western Antarctica). Water. 2018; 10(4):360. https://doi.org/10.3390/w10040360
Chicago/Turabian StyleSziło, Joanna, and Robert Józef Bialik. 2018. "Grain Size Distribution of Bedload Transport in a Glaciated Catchment (Baranowski Glacier, King George Island, Western Antarctica)" Water 10, no. 4: 360. https://doi.org/10.3390/w10040360
Note that from the first issue of 2016, this journal uses article numbers instead of page numbers. See further details here.