Spatiotemporal Variation of Nutrient Concentrations in the Upper Shule River Basin, the Qinghai-Tibetan Plateau, China

1
Key Laboratory of Ecohydrology of Inland River Basin, Northwest Institute of Eco-Environment and Resources, Chinese Academy of Sciences, Lanzhou 730000, China
2
University of Chinese Academy of Sciences, Beijing 100049, China
3
State Key Laboratory of Cryospheric Sciences, Northwest Institute of Eco-Environment and Resources, Chinese Academy of Sciences, Lanzhou 730000, China
4
School of Forest Resources and Environmental Science, Michigan Technological University, Houghton, MI 49931, USA
*
Author to whom correspondence should be addressed.
Water 2018, 10(4), 366; https://doi.org/10.3390/w10040366
Submission received: 8 February 2018
/
Revised: 9 March 2018
/
Accepted: 22 March 2018
/
Published: 23 March 2018
Abstract
:This study aimed to understand the spatiotemporal variation of nutrient concentrations in stream water, using analyses of total nitrogen (TN), NO3−-N, NH4+-N and total phosphorus (TP) concentrations from April to October in 2016 in the upper Shule River basin in the northeastern margin of the Qinghai-Tibetan Plateau. Dissolved inorganic nitrogen (DIN; NO3−-N + NH4+-N) concentrations in both groundwater and stream water were the predominant form of TN, accounting for about 88%. Median concentrations in stream water were 815 μg L−1 for TN, 459 μg L−1 for NO3−-N, 253 μg L−1 for NH4+-N, and 25 μg L−1 for TP. Great spatiotemporal variations of nitrogen and phosphorus concentrations in stream water were observed, which likely resulted from varying recharge sources (snow and groundwater) and biogeochemical processes. Monthly variations in nutrient concentrations in stream water had a reciprocal pattern between nitrogen and phosphorus concentrations. Our results demonstrated that the quality of steam water in the upper reach of Shule River basin was basically good for drinking purposes according to the environmental quality standards for surface water, China. The results also improved our understanding of how nutrient concentrations varied in stream water and provided baseline information for future studies on nutrients in the Qinghai-Tibetan Plateau.
1. Introduction
Nitrogen (N) and phosphorus (P) are essential elements in freshwater, marine and terrestrial environments for a variety of life forms [1,2]. Headwater streams are important sources of nutrients, particularly nitrogen and phosphorous, to rivers and lakes [3,4], and have affected the aquatic ecosystem productivity, water quality and utilization of water resources in the downstream reaches [3,5,6,7]. Concentrations of nitrogen and phosphorous in rivers have been influenced by a variety of natural and anthropogenic factors, the relative influences of which vary spatially and temporally [8]. Recently, an increasing number of studies have shown that eutrophication has intensified in coastal waters and downstream estuarine [9,10]. The problem has usually been characterized by increased supplies of nutrients, particularly nitrogen and phosphorous, to aquatic systems when exceeding the assimilation capacity of receiving water [11].
However, very little has been known about the nutrient concentrations of headwater streams in high-elevations of the Qinghai-Tibetan Plateau. The Qinghai-Tibetan Plateau, characterized as the earth’s for Third Pole’ (average elevation 4000 m a.s.l.), is covered by a vast area of glaciers and unique permafrost [12,13,14]. The transport of nutrients by river may be influenced by the leaching of nutrients from glaciers, seasonal snow cover and permafrost thawing with climate warming [15,16,17]. It was demonstrated elsewhere that riverine nitrogen levels and phosphorus dynamics were affected by the extent of deglaciation [7]. Supraglacial environments may promote NH4+-N assimilation and nitrification, but subglacial anoxic conditions appear to promote denitrification [15]. Seasonal snow is also a dynamic nutrient source. Atmospheric nitrogen deposition has increased inputs to global ecosystems in the past few decades [18,19]. In addition, the amount of nitrogen loss from soil is controlled by soil processes that may serve either as a sink or as a source for nitrogen [20]. Permafrost thaw appears to amplify the nitrogen and phosphorous leaching with climate warming as well [17]. Groundwater may be another major source of nutrients for surface water. It has been reported that groundwater provides a large amount of nutrients into river export in the River Thames [21,22]. Furthermore, changes in the recharge proportions of various source waters to total discharge will potentially shift the stream nutrients [23].
In the high-elevation basins of the Qinghai-Tibetan Plateau, nutrient concentrations are usually considered to be indicative of a pristine environment. The upper Shule River basin is one of those basins with little impact from human activities and receives little nitrogen and phosphorous inputs from anthropogenic sources. Evaluation of the spatial and temporal variation of nutrient concentrations in the upper Shule River basin helps establish the baseline of nutrient concentrations and provide key information for understanding the importance of the Qinghai-Tibetan Plateau in the biogeochemical cycle. This study aims to clearly examine the spatial and temporal variation of nutrient concentrations by investigating nutrient concentrations in stream water and exploring the factors that influence the spatial and temporal variation of nutrient concentrations by analyzing nutrient concentrations in soil, precipitation, groundwater and stream water in the upper Shule River basin.
2. Data and Methods
2.1. Study Site
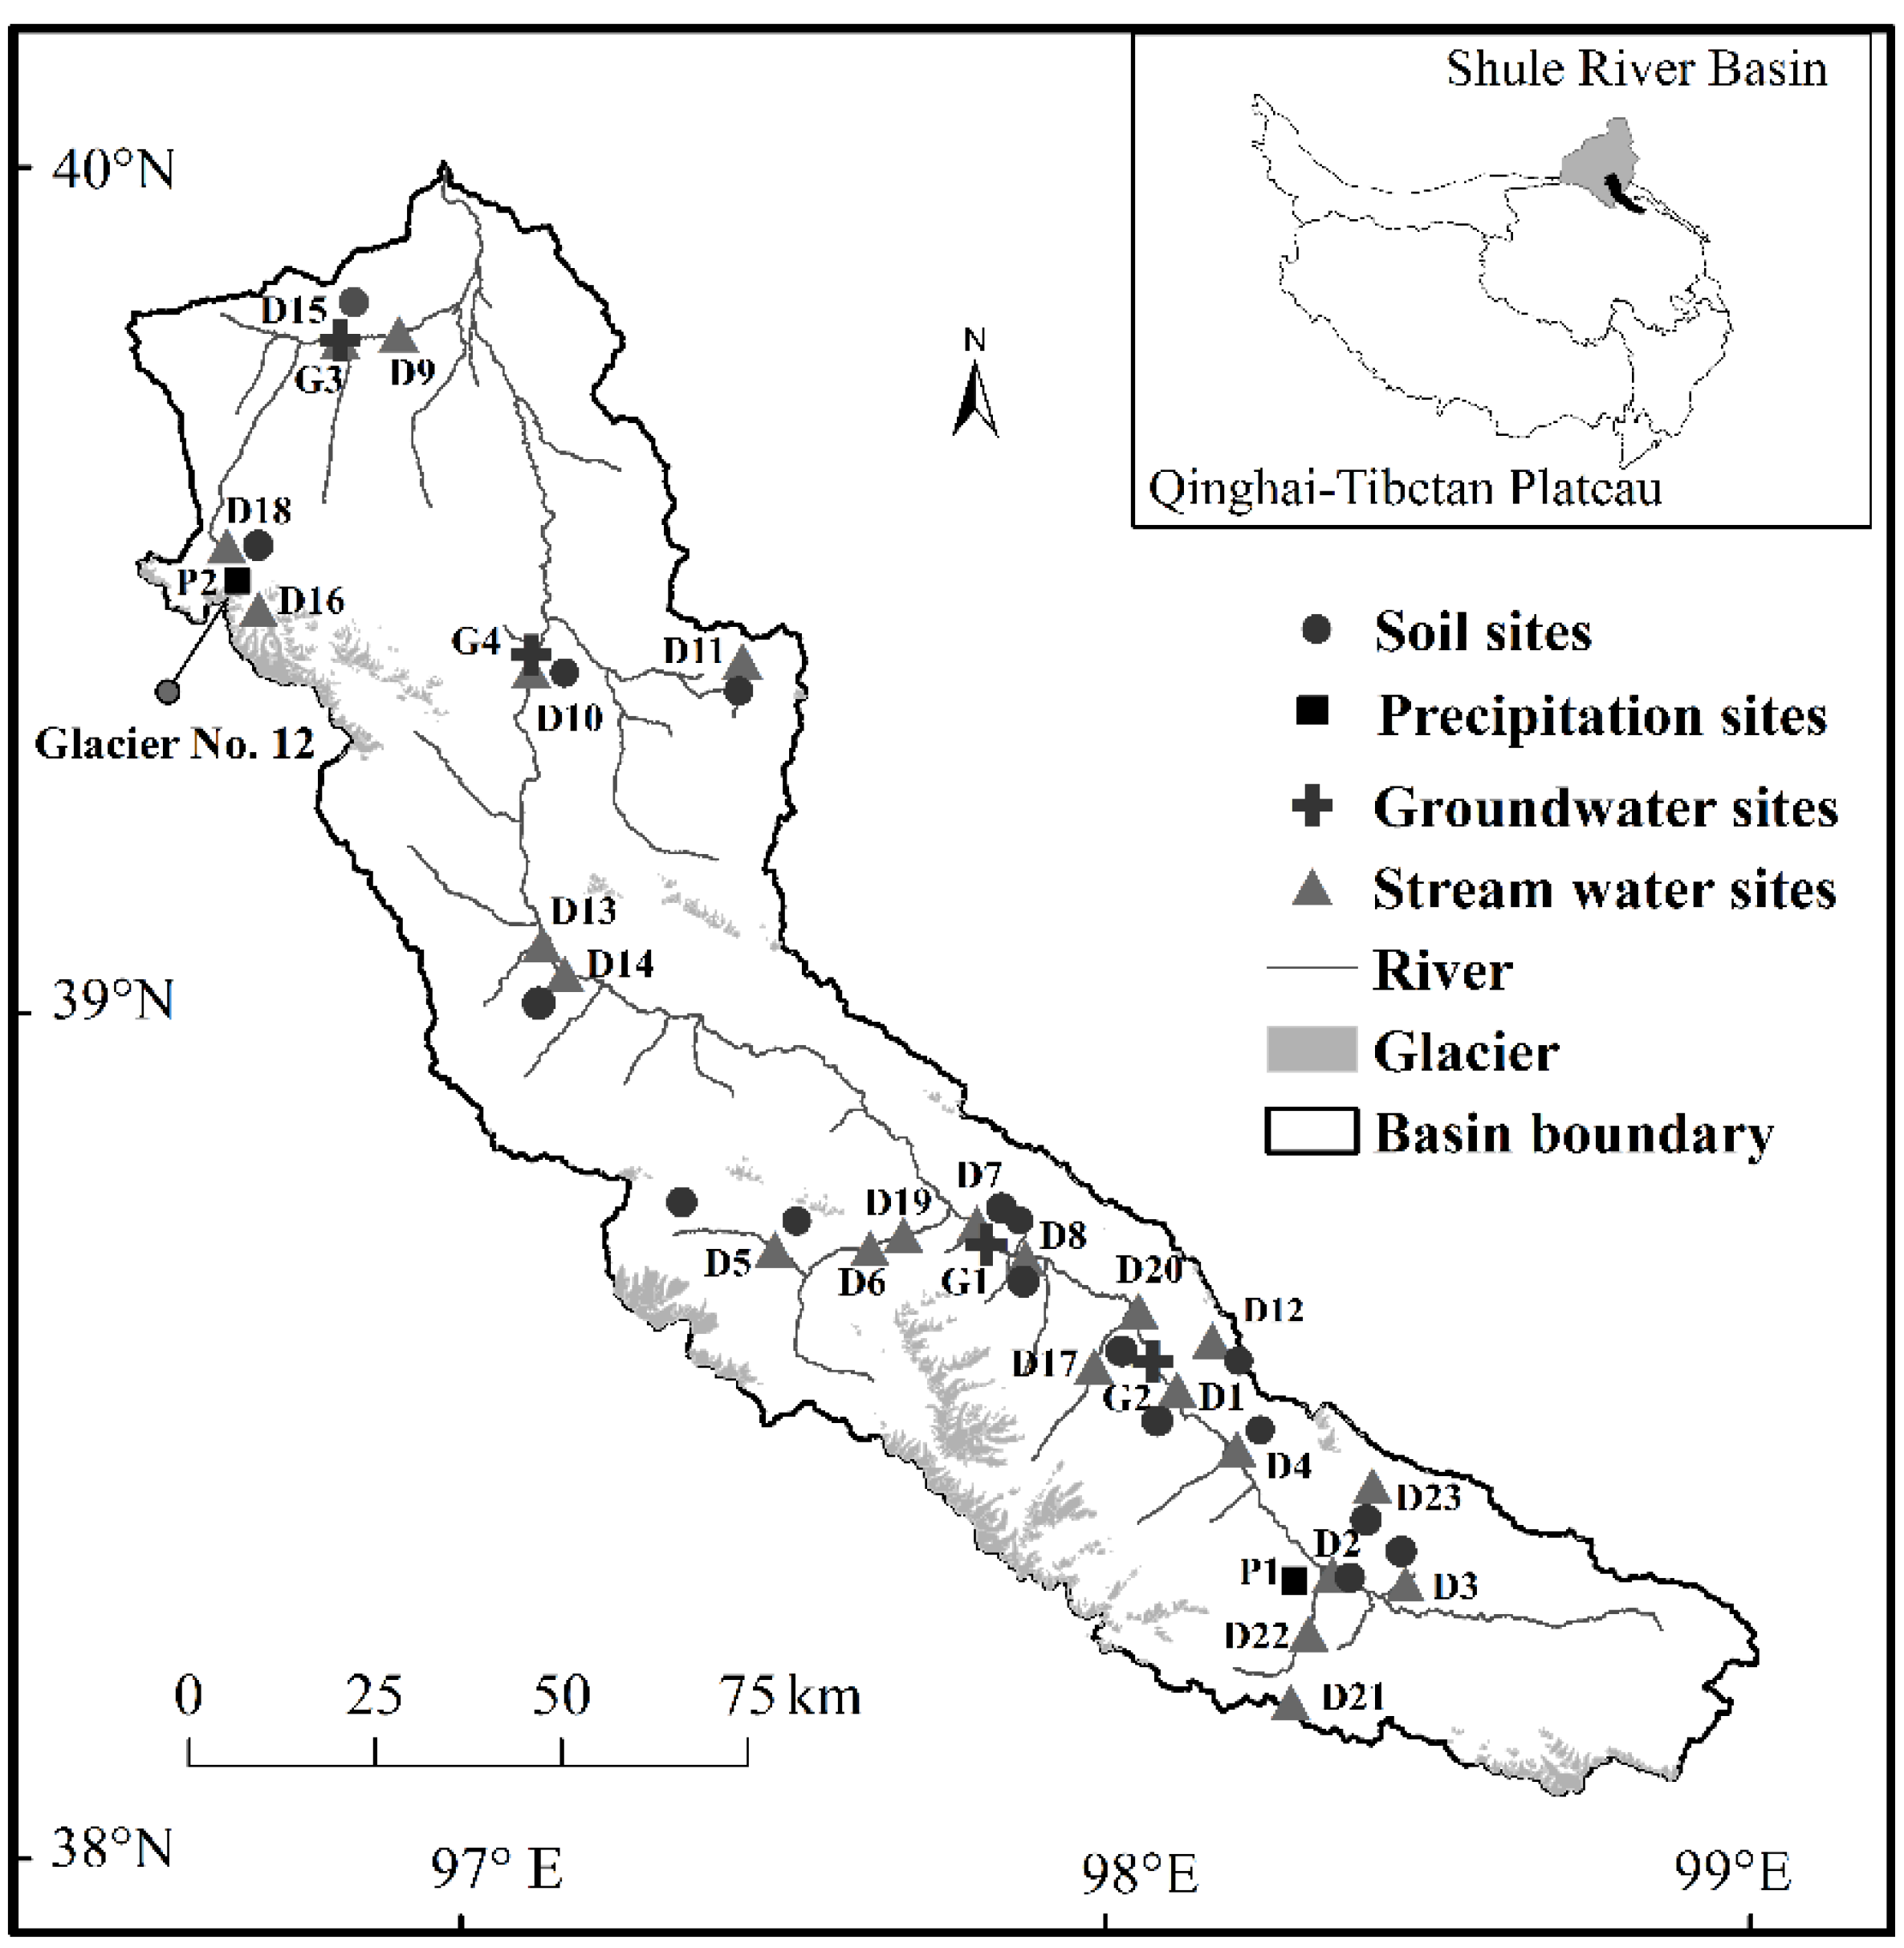
The Shule River is located in the western Qilian Mountains on the northeastern margin of the Qinghai-Tibetan Plateau (QTP) [24]. Its drainage area is approximately 1.42 × 10⁵ km2, and the length of the river is 670 km [25,26]. The Shule River basin is one of the three biggest inland river basins in the Hexi Corridor of Gansu Province, which flow into and eventually dissipates in the Gobi deserts [27]. The Shule River is recharged by direct runoff from precipitation, groundwater and melt water from snow and glacier [27]. This study was conducted in the upper Shule River basin (USLR), which is located between 96.6° E and 99.0° E and 38.2° N and 44.0° N, with an area of 1.14 × 10⁴ km2 and altitudes ranging from 1855 to 5807 m a.s.l. (Figure 1). The glacier and continuous permafrost covered areas are 3.4% and 83% of the study area, respectively.
The study region is mostly controlled by westerly winds and belongs to a continental arid climate, with broad variations in the annual mean air temperature and annual precipitation. The annual mean air temperature ranged from −4 to −19 °C over the period of 1960–2010. The annual precipitation record ranges from 200 to 400 mm, with most abundant occurring from May to September in summer. The soil types mainly include frigid calcic soil, frigid frozen soils, cold calcic soils, bog soils and felty soils, according to the Chinese soil classification system [28]. The dominant vegetation types are alpine meadow and alpine steppe [29].
The Qilian Shan Station of Glaciology and Ecologic Environment is located in the Laohugou (Tiger Gully by English translation) Glacier (LHG, site D16 on Figure 1) basin on the northern slope of the western Qilian Mountains, in the northeastern Qinghai-Tibetan Plateau [30]. The observation station is the largest and most important station for monitoring meteorological, hydrological and glacier variation in the upper Shule River basin. Glacier No. 12 is the largest glacier with an area of 21 km2 in the LHG basin [31].
2.2. Materials and Methods
Sampling of streams of the upper Shule River basin was carried out monthly from April to October 2016 (Figure 1). At the site D2 (headwaters) stream water was sampled weekly from June to end of August 2016. A total of 88 stream samples were collected (Table 1). Groundwater samples from four spring sites were also collected monthly from April to October 2016 in the upper Shule River (Figure 1). In addition, 3 groundwater samples were collected in October of 2015 from the Upper Shule River. Water samples were stored in clean high-density polyethylene bottles. Samples were kept at 4 °C until analysis and shipped to the State Key Laboratory of Grassland Agro-Ecosystems, College of Pastoral Agriculture Science and Technology, Lanzhou University. The samples were analyzed for total nitrogen (TN), total phosphorus (TP), nitrate nitrogen (NO3−-N) and ammonium nitrogen (NH4+-N). TN concentrations were determined by alkaline potassium persulfate oxidation-ultraviolet spectrophotometry with precision of less than 5%, TP by microwave digestion-photometry method with precision of less than 1%, NO3−-N by ultraviolet spectrophotometry with precision of 1% and NH4+-N by Nessler’s reagent spectrophotometry with precision of less than 1%. Dissolved inorganic nitrogen (DIN) was calculated as NO3−-N plus NH4+-N.
Twenty-four rainfall samples (site P1) were collected near the Shimita gauge (98.31° E, 38.46° N, altitude 3833 m a.s.l., site D2) during the ablation period of July to mid-August 2016 and analyzed for NO3−-N and NH4+-N. In order to complement snow chemical data, 31 snow samples (site P2) were collected from January to September 2015 from LHG. Snowfall were collected in non-ablation period (January to March). Surface snow samples were also collected at seven snow sites with altitudes ranging from 4350 to 4800 m a.s.l. on Glacier No. 12 during the ablation period (June to September). Surface snow samples in 10–15-cm sections were collected using a pre-cleaned stainless-steel shovel and polyethylene gloves. Snow samples were kept at −18 °C until analysis and shipped to the State Key Laboratory of Grassland Agro-Ecosystems, then melted in room temperature. These samples were analyzed for TN, TP, NO3−-N and NH4+-N (Table 1).
In order to understand soil mechanical composition (SMC) and nutrients in the study area, surface soil samples were collected in 25 cm sections at 18 sites in the upper Shule River basin (Figure 1). Three 60 × 60 cm quadrats were selected randomly in each site. Soil samples were collected from each quadrat by combing five soil cores in an X-shaped pattern, packed in plastic bags and then stored in refrigerator and transported to the Key Laboratory of Ecohydrology of Inland River Basin, Chinese Academy of Science in Lanzhou, Gansu. Soil samples were air-dried at room temperature and were initially sieved with a 2-mm screen to remove coarser skeleton remains and roots. Then one aliquot was ground to pass a 1-mm sieve and analyzed for soil salt, and a subsample was further ground to pass a 0.25-mm sieve and analyzed for soil organic carbon (SOC), total nitrogen (STN), total phosphorus (STP), total carbon (STC). Fresh soil samples were analyzed for NO3−-N and NH4+-N. Contents were determined by the Walkley–Black procedure for SOC with precision of 1%, the micro-Kjeldhal procedure for STN with precision of 1%, the molybdenum-antimony anti-spectrophoto-metric method for STP with precision of less than 1%, the dry combustion method for STC with precision of 1%, indophenol blue colorimetry after KCl extraction for NH4+-N with precision of less than 1%, ultraviolet spectrophotometry after CaCl2 extraction for NO3−-N with precision of 1%, and Malvern laser particle size analyzer for SMC. Significances of the linear correlation coefficients were tested by using t tests (SPSS, 2011). The tested series were indicated as statistically significant at the 5% (p < 0.05) significance level. Daily air temperature data was obtained from Shimita automatic meteorological station (site P1). Daily precipitation data was measured using the Geonor T-200B weighing gauge (sensitivity 0.1 mm) near Shimita automatic meteorological station, which has been running since July 2008.
3. Results
3.1. Soil Nutrients
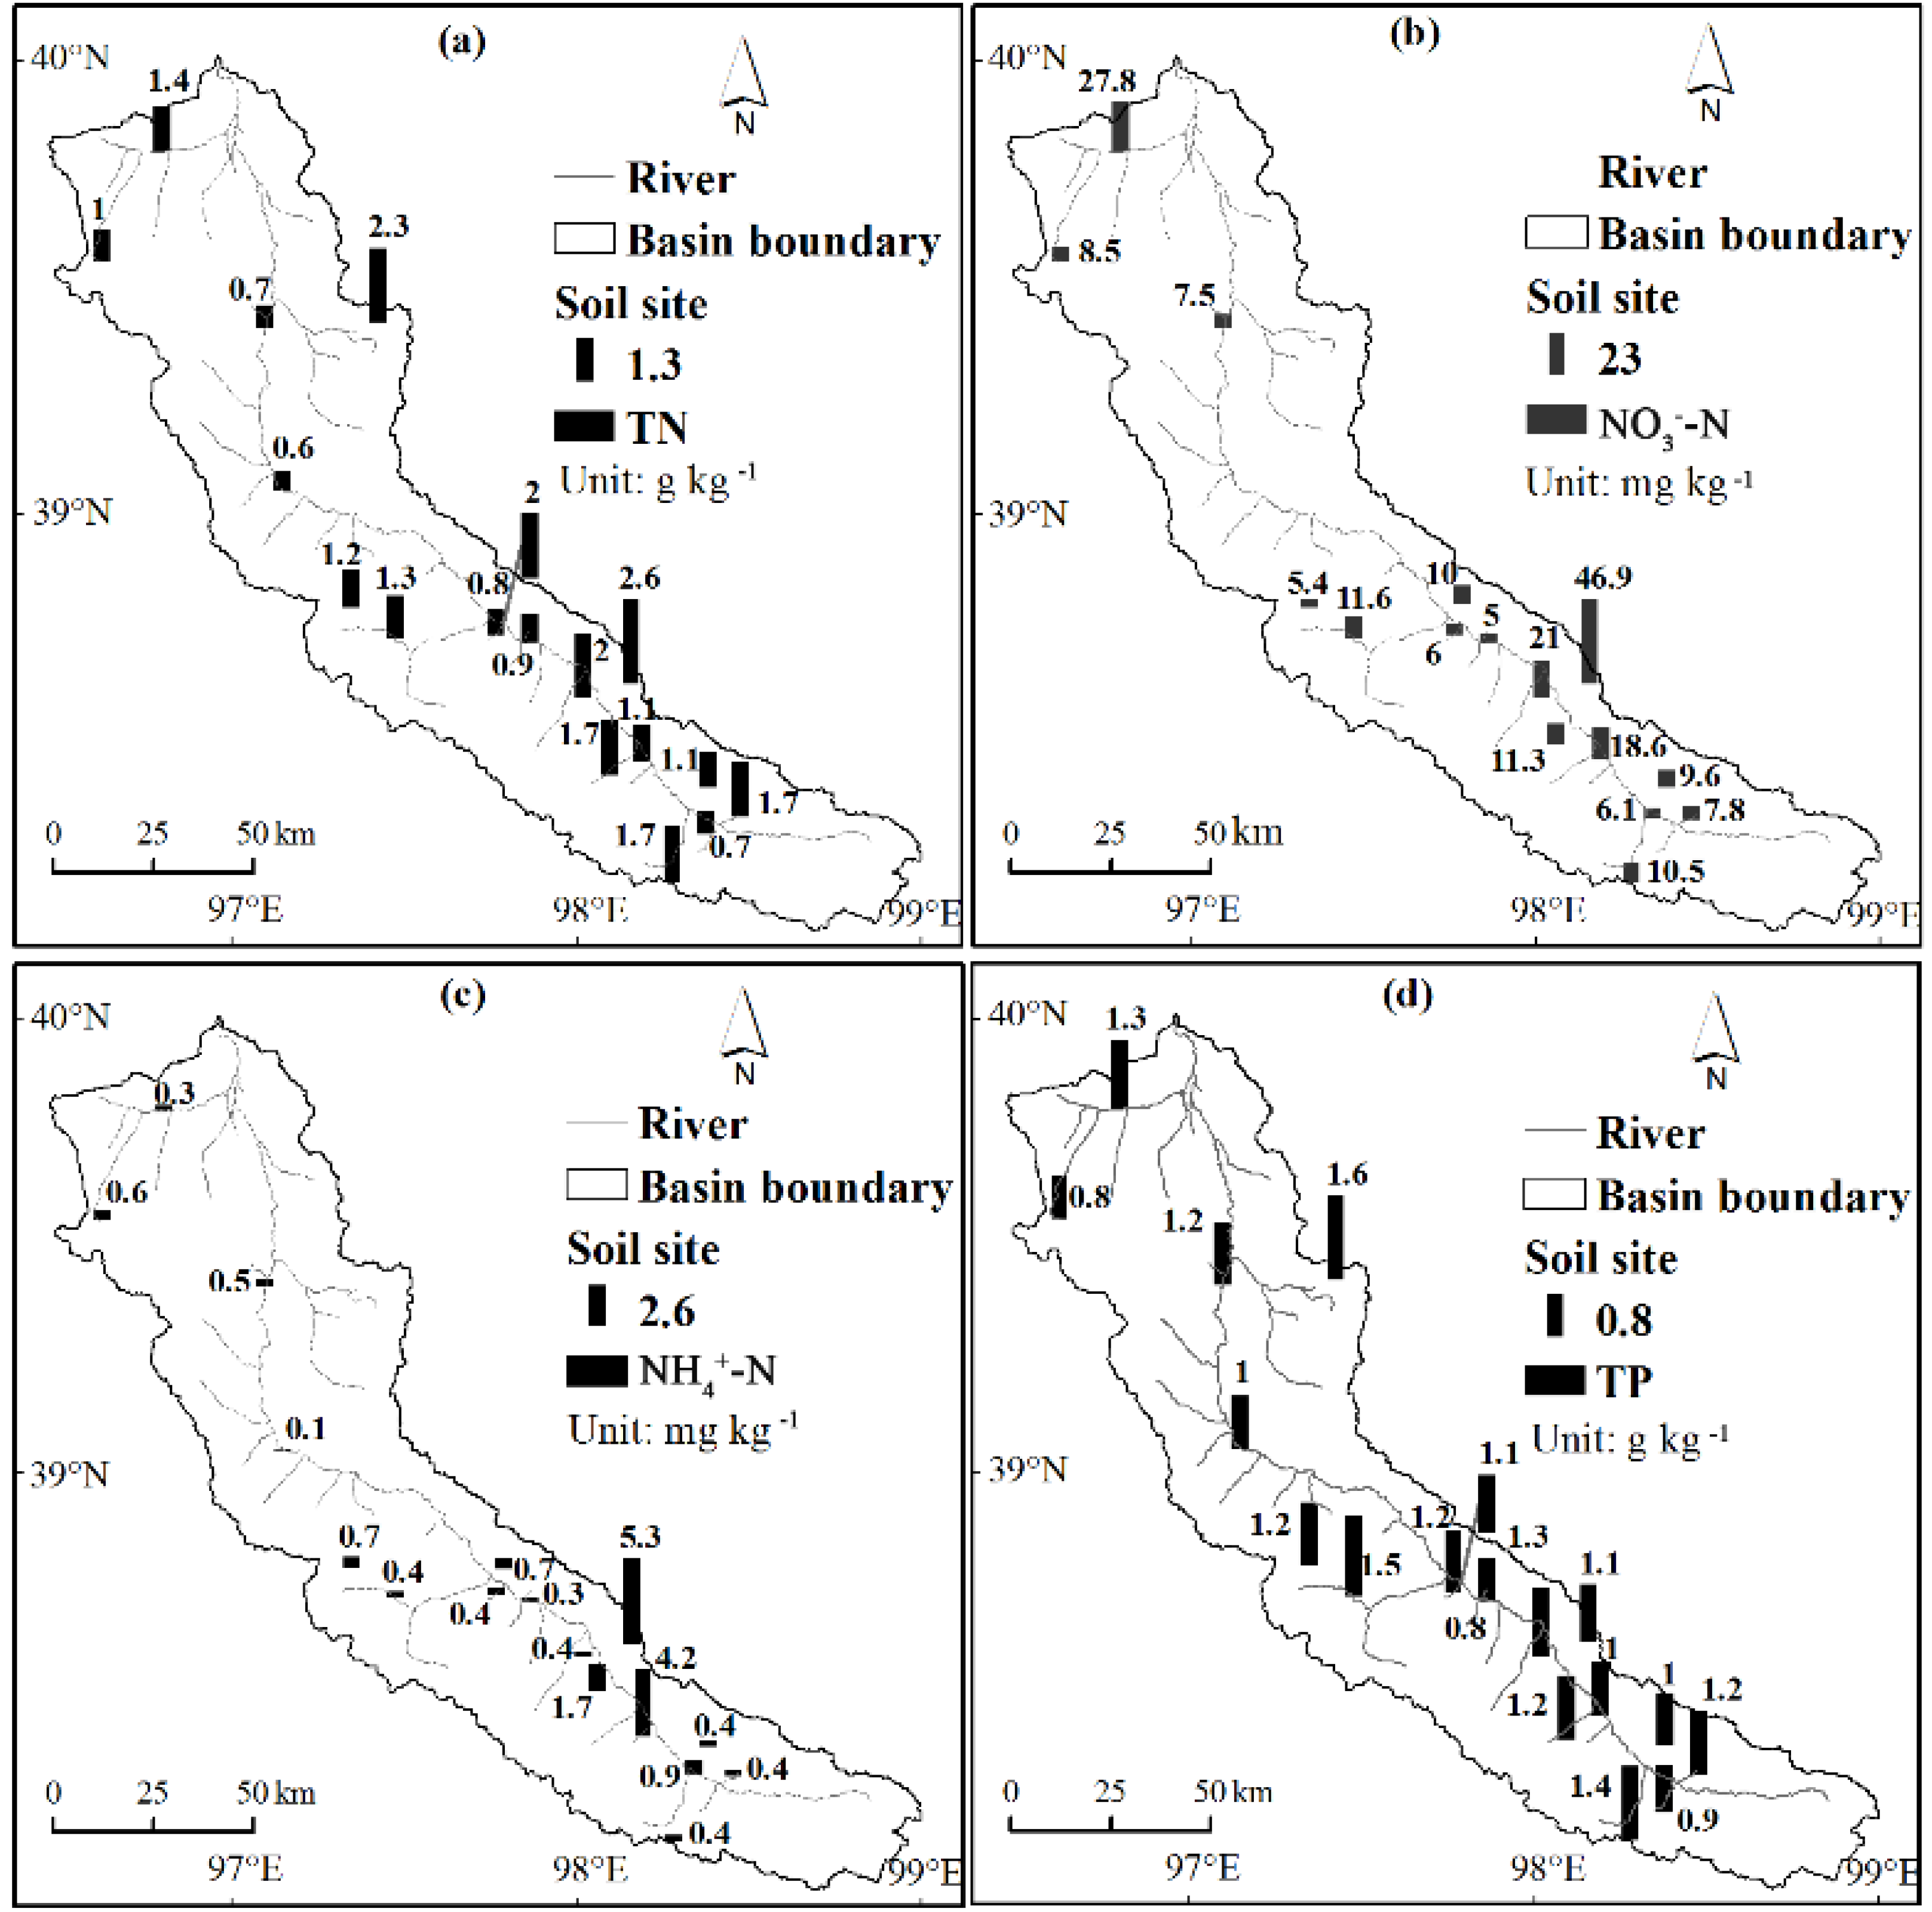
The major characteristics of soil texture, salt and nutrient content for the surface 25-cm soil samples were analyzed. The results showed that most soil textures range from sandy to loam soils. Ca2+ and Na+ and SO42− were the dominant cationic and anionic concentrations of these soils, respectively. Median STN and STP concentrations in 2016 were 1272.2 mg kg−1 and 1165.1 mg kg−1, respectively, at least two orders of magnitude higher than soil NO3−-N and NH4+-N contents (10 mg kg−1 and 0.4 mg kg−1, respectively). STN, STP, NO3−-N and NH4+-N concentrations in soil samples varied spatially in the upper Shule River basin in 2016 (Figure 2). Soil inorganic N (NO3−-N + NH4+-N) is a very small part of STN. Soil NO3−-N were predominant form of soil inorganic N. Soil organic carbon, STN and NH4+-N tend to increase with altitude, whereas STP and STC trend to decrease with altitude (Figure 2; Table 2). STN and STP exhibited a significant positive correlation (r = 0.50, p < 0.05) and so was NO3−-N and NH4+-N (r = 0.72, p < 0.01). Also, there was a significant positive correlation between STN and NO3−-N (Table 2).
3.2. Nutrient Concentrations in Precipitation
The median TN, NO3−-N, NH4+-N and TP concentrations in the snow samples at the LHG glacier No. 12 in 2015 were 800, 305, 377, 26 μg L−1, respectively (Table 3). TN concentrations ranged from 261.8 to 2576.2 μg L−1, NO3−-N from 17 to 2108 μg L−1, NH4+-N from 198 to 977.7 μg L−1, and TP from 12 to 61 μg L−1. The correlation between TN and NO3−-N concentrations in snow was significant (p < 0.01; n = 33; R2 = 0.91). Of the TN species, NO3−-N (38% of TN) and NH4+-N (46% of TN) constituted the major components. TN concentrations were nearly 34 times higher than those of TP. Figure 3 showed the variations of TN, NO3−-N, NH4+-N and TP concentrations in snow between non-ablation and ablation periods. TN and NO3−-N concentrations were clearly higher at the non-ablation period (January to March) (846 and 328 μg L−1, respectively) than the ablation period (from June to September) (678 and 157 μg L−1, respectively). However, NH4+-N concentrations was lower at the non-ablation period (334 μg L−1) than the ablation period (390 μg L−1). Dissolved inorganic nitrogen (DIN, i.e., NO3−-N + NH4+-N) to TN ratios were nevertheless similar (about 85%) during the two periods. TP concentrations differed little between the two periods. From the non-ablation to ablation period, the TN:TP ratio in the snow samples decreased from 47 to 26, the NO3−-N:TN decreased from 0.46 to 0.22, and the NH4+-N:TN ratio increased from 0.38 to 0.54.
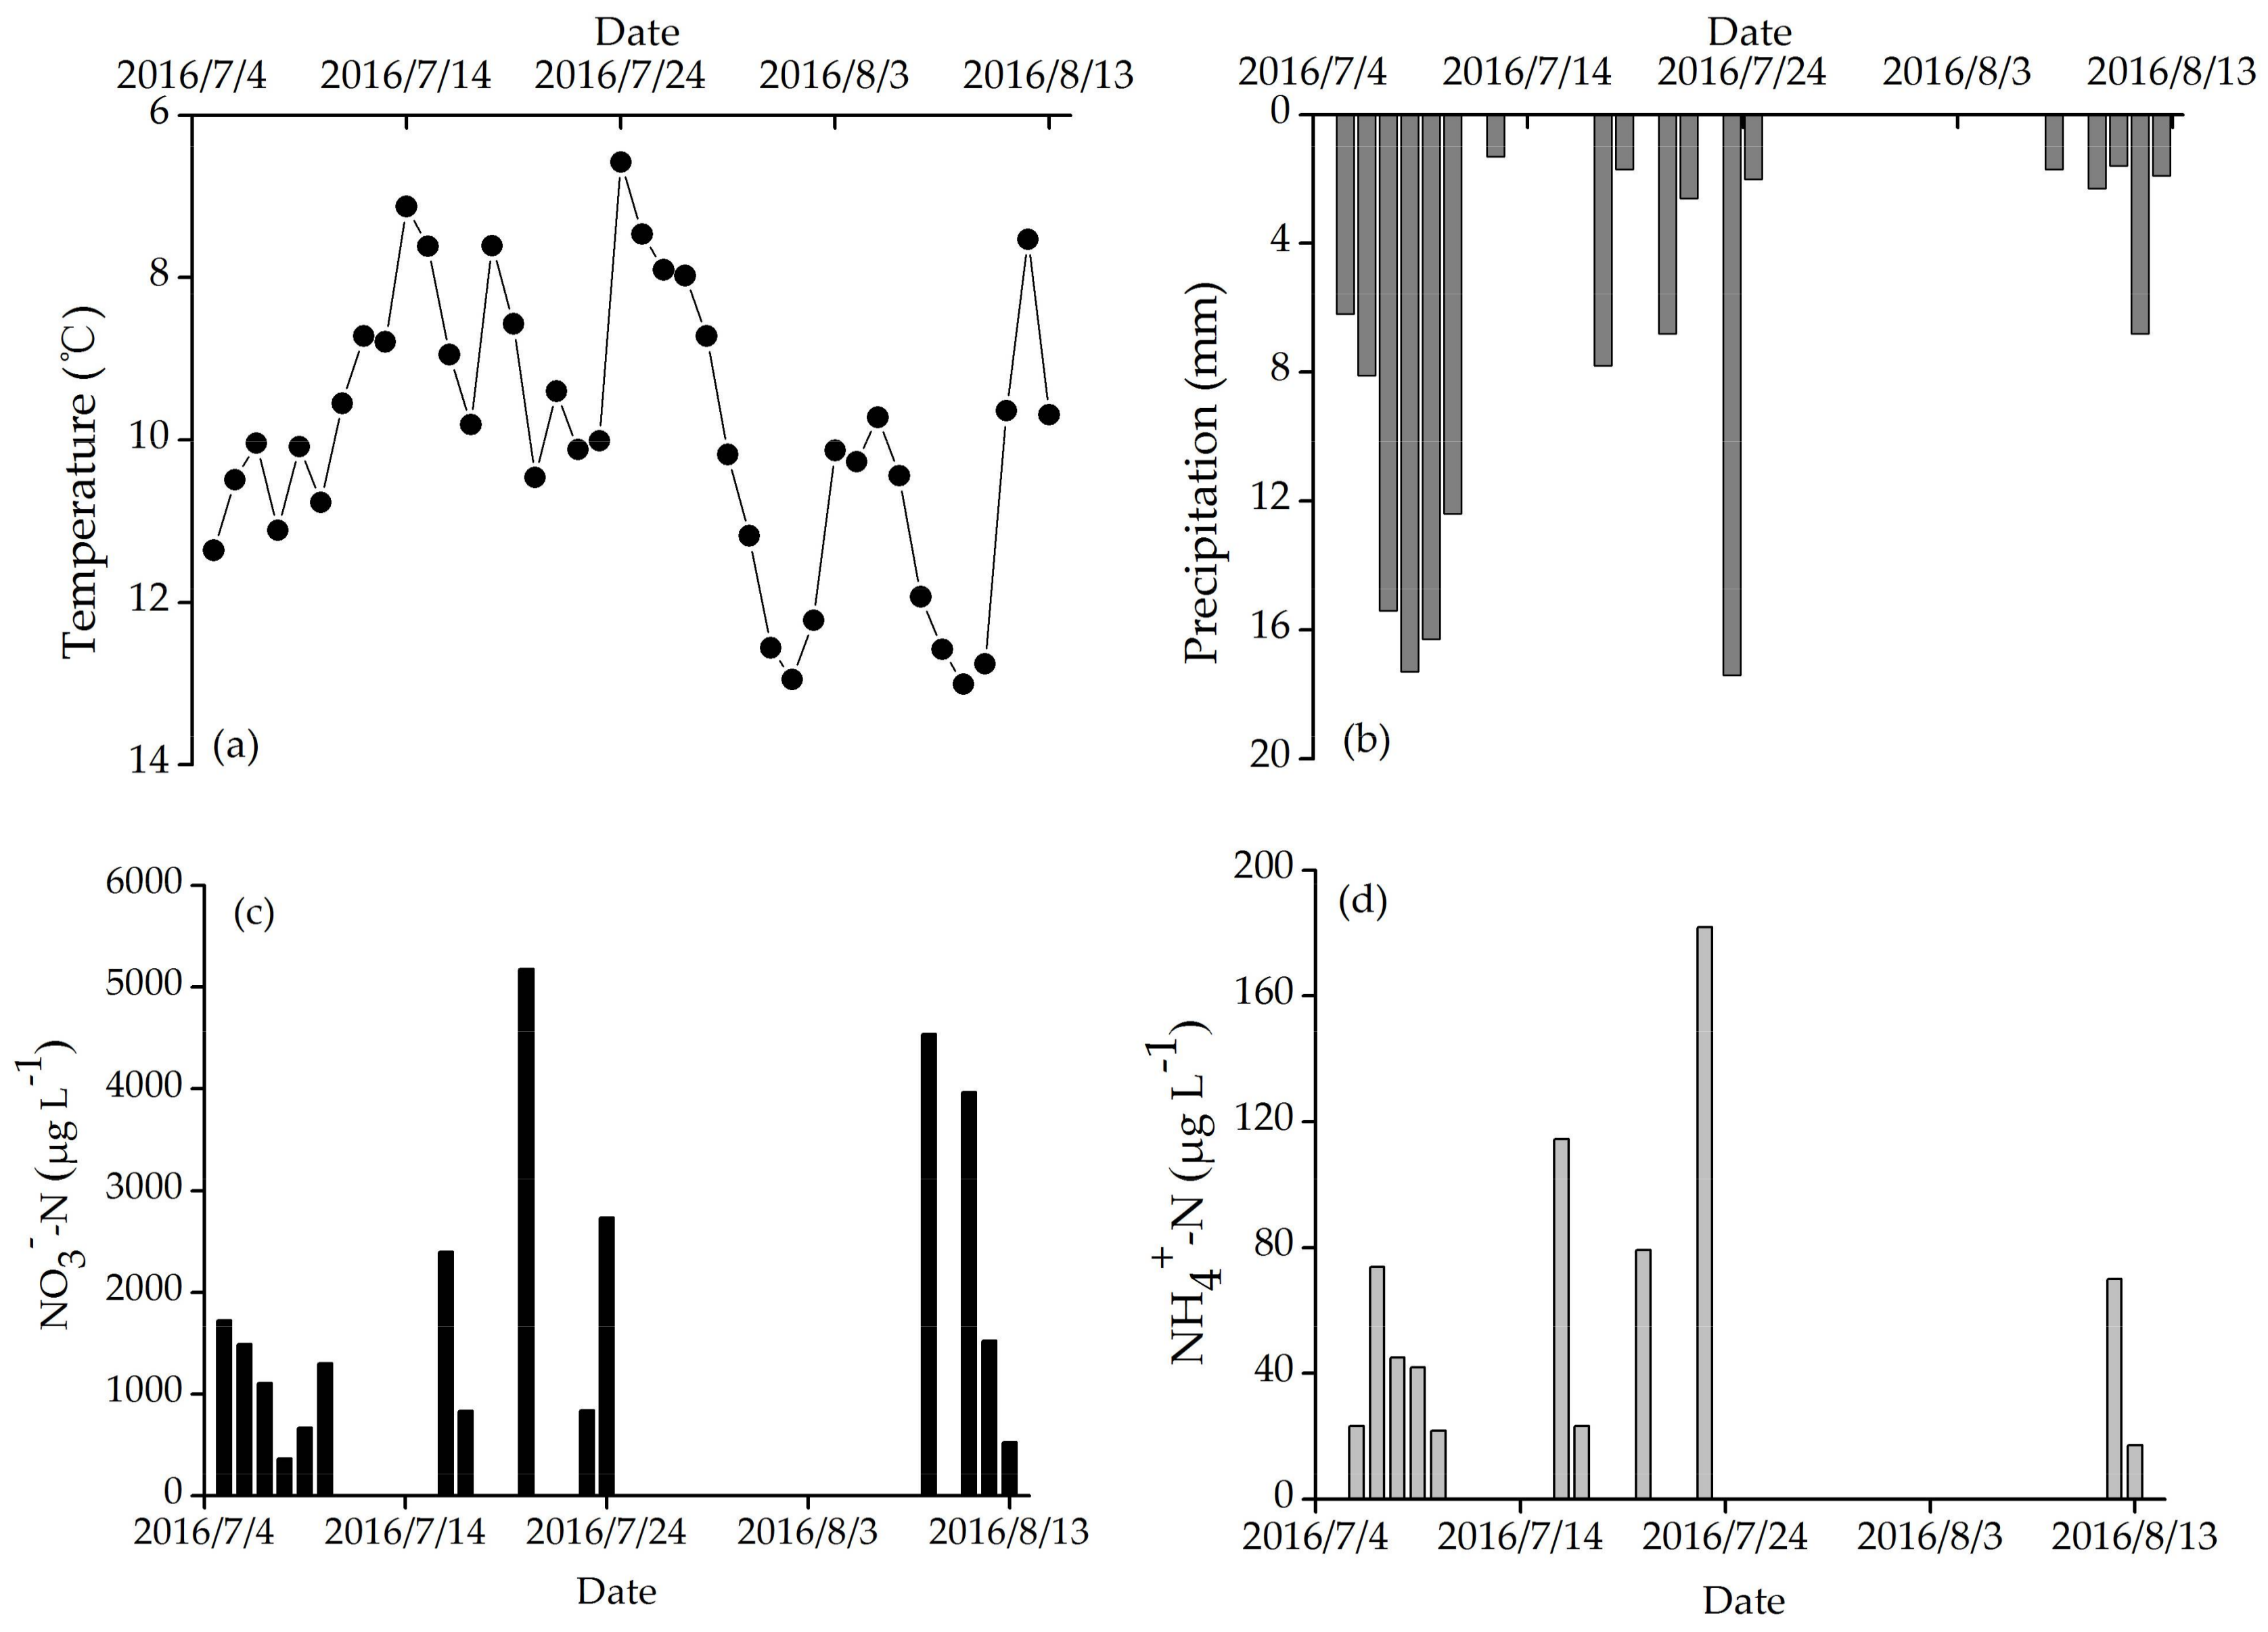
Median NO3−-N concentrations in rainfall (1490 μg L−1) were remarkably higher than that in snow samples (305 μg L−1), while rainfall NH4+-N concentrations (45 μg L−1) were evidently lower than those of snow (377 μg L−1) (Table 3). Concentrations of NO3−-N and NH4+-N appeared to be higher in mid and late July (Figure 4). Average air temperature was 10 °C and precipitation (main form was rainfall) 130 mm during rainfall sampling time (Figure 4).
3.3. Nutrient Concentrations in Groundwater
The median TN, NO3−-N, NH4+-N and TP concentrations in groundwater in 2016 were 746, 511, 176, 25 μg L−1, respectively (Table 3). Median monthly TN values presented a significant linear upward trend (p < 0.01) from April to October in 2016 (Figure 5). NO3−-N also appeared to increase significantly (p < 0.05) from May to October in 2016. NH4+-N exhibited an increase of concentration from April to May, gradually a decrease to July and then an increase to October. The maximum and minimum values of NH4+-N concentration occurred in May and July, respectively. Median monthly TP concentrations, however, showed a declining trend from April to July, an increase toward August and then a decrease toward October. The maximum and minimum values of TP concentrations occurred in April and July, respectively. DIN accounted for about 89% of TN content in groundwater, of which NO3−-N constituted the majority (61% of TN). The highest monthly ratio of DIN:TN occurred during low flow period in October in 2016, which was consistent with the very high ratio on the corresponding period in 2015 (Figure 6). Furthermore, TN concentrations were almost 33 times higher than those of TP.
3.4. Nutrient Concentrations in Stream Water
3.4.1. Site D2
At the sampling site D2, the median TN, NO3−-N, NH4+-N and TP concentrations in 2016 were 726, 303, 284, 32 μg L−1, respectively (Table 3). The concentrations of TN were more than 20-fold that of TP. DIN accounted for about 88% of the TN content, with slightly higher NO3−-N concentrations than NH4+-N concentrations. Significant positive correlations occurred between NO3−-N and NH4+-N and TN (Figure 7). All forms of nutrient N exhibited an increasing trend from Mid-July to end of August in sampling site D2 (Figure 8). NO3−-N:TN ratio was 0.71 in August, which was close to that in the corresponding period in groundwater. However, the highest concentrations of TP occurred in mid-July. TN and NO3−-N exhibited a significant linear increasing trend (p < 0.05) from April to October, while linear trends of NH4+-N and TP were not statistically significant in sampling site D2 (Figure 8). It was found that DIN:TN ratio was lower during the high runoff month from June to August. TP concentrations in stream water at the sampling site D2 were positively related to air temperature (n = 22, r = 0.45, p < 0.05) and precipitation (n = 11, r = 0.71, p < 0.05), respectively. However, a significant relationship was not found between N and air temperature/precipitation on the corresponding period.
3.4.2. Temporal Variation over All Sites
Temporal variation of N and P concentrations in stream water from all sampling sites is shown in Figure 9. Median TN, NO3−-N, NH4+-N and TP concentrations in stream water were 815, 459, 253, 25 μg L−1, respectively, in the upper Shule River basin in 2016 (Table 3). TN and NO3−-N concentrations decreased from April to June and then increased to October. NH4+-N concentrations exhibited a slightly different pattern, decreasing from May to July and then increasing to October. The minimum NH4+-N concentration occurred in April. Unlike TN, however, TP concentrations increased from April to July and then decreased from August and October. The highest TP concentration occurred in July, but with the highest standard errors, suggesting that TP variation within all sites was high. The TN:TP ratio was 32. DIN accounted for about 89% of TN content in stream water, with the proportion of NO3−-N up to 57%.
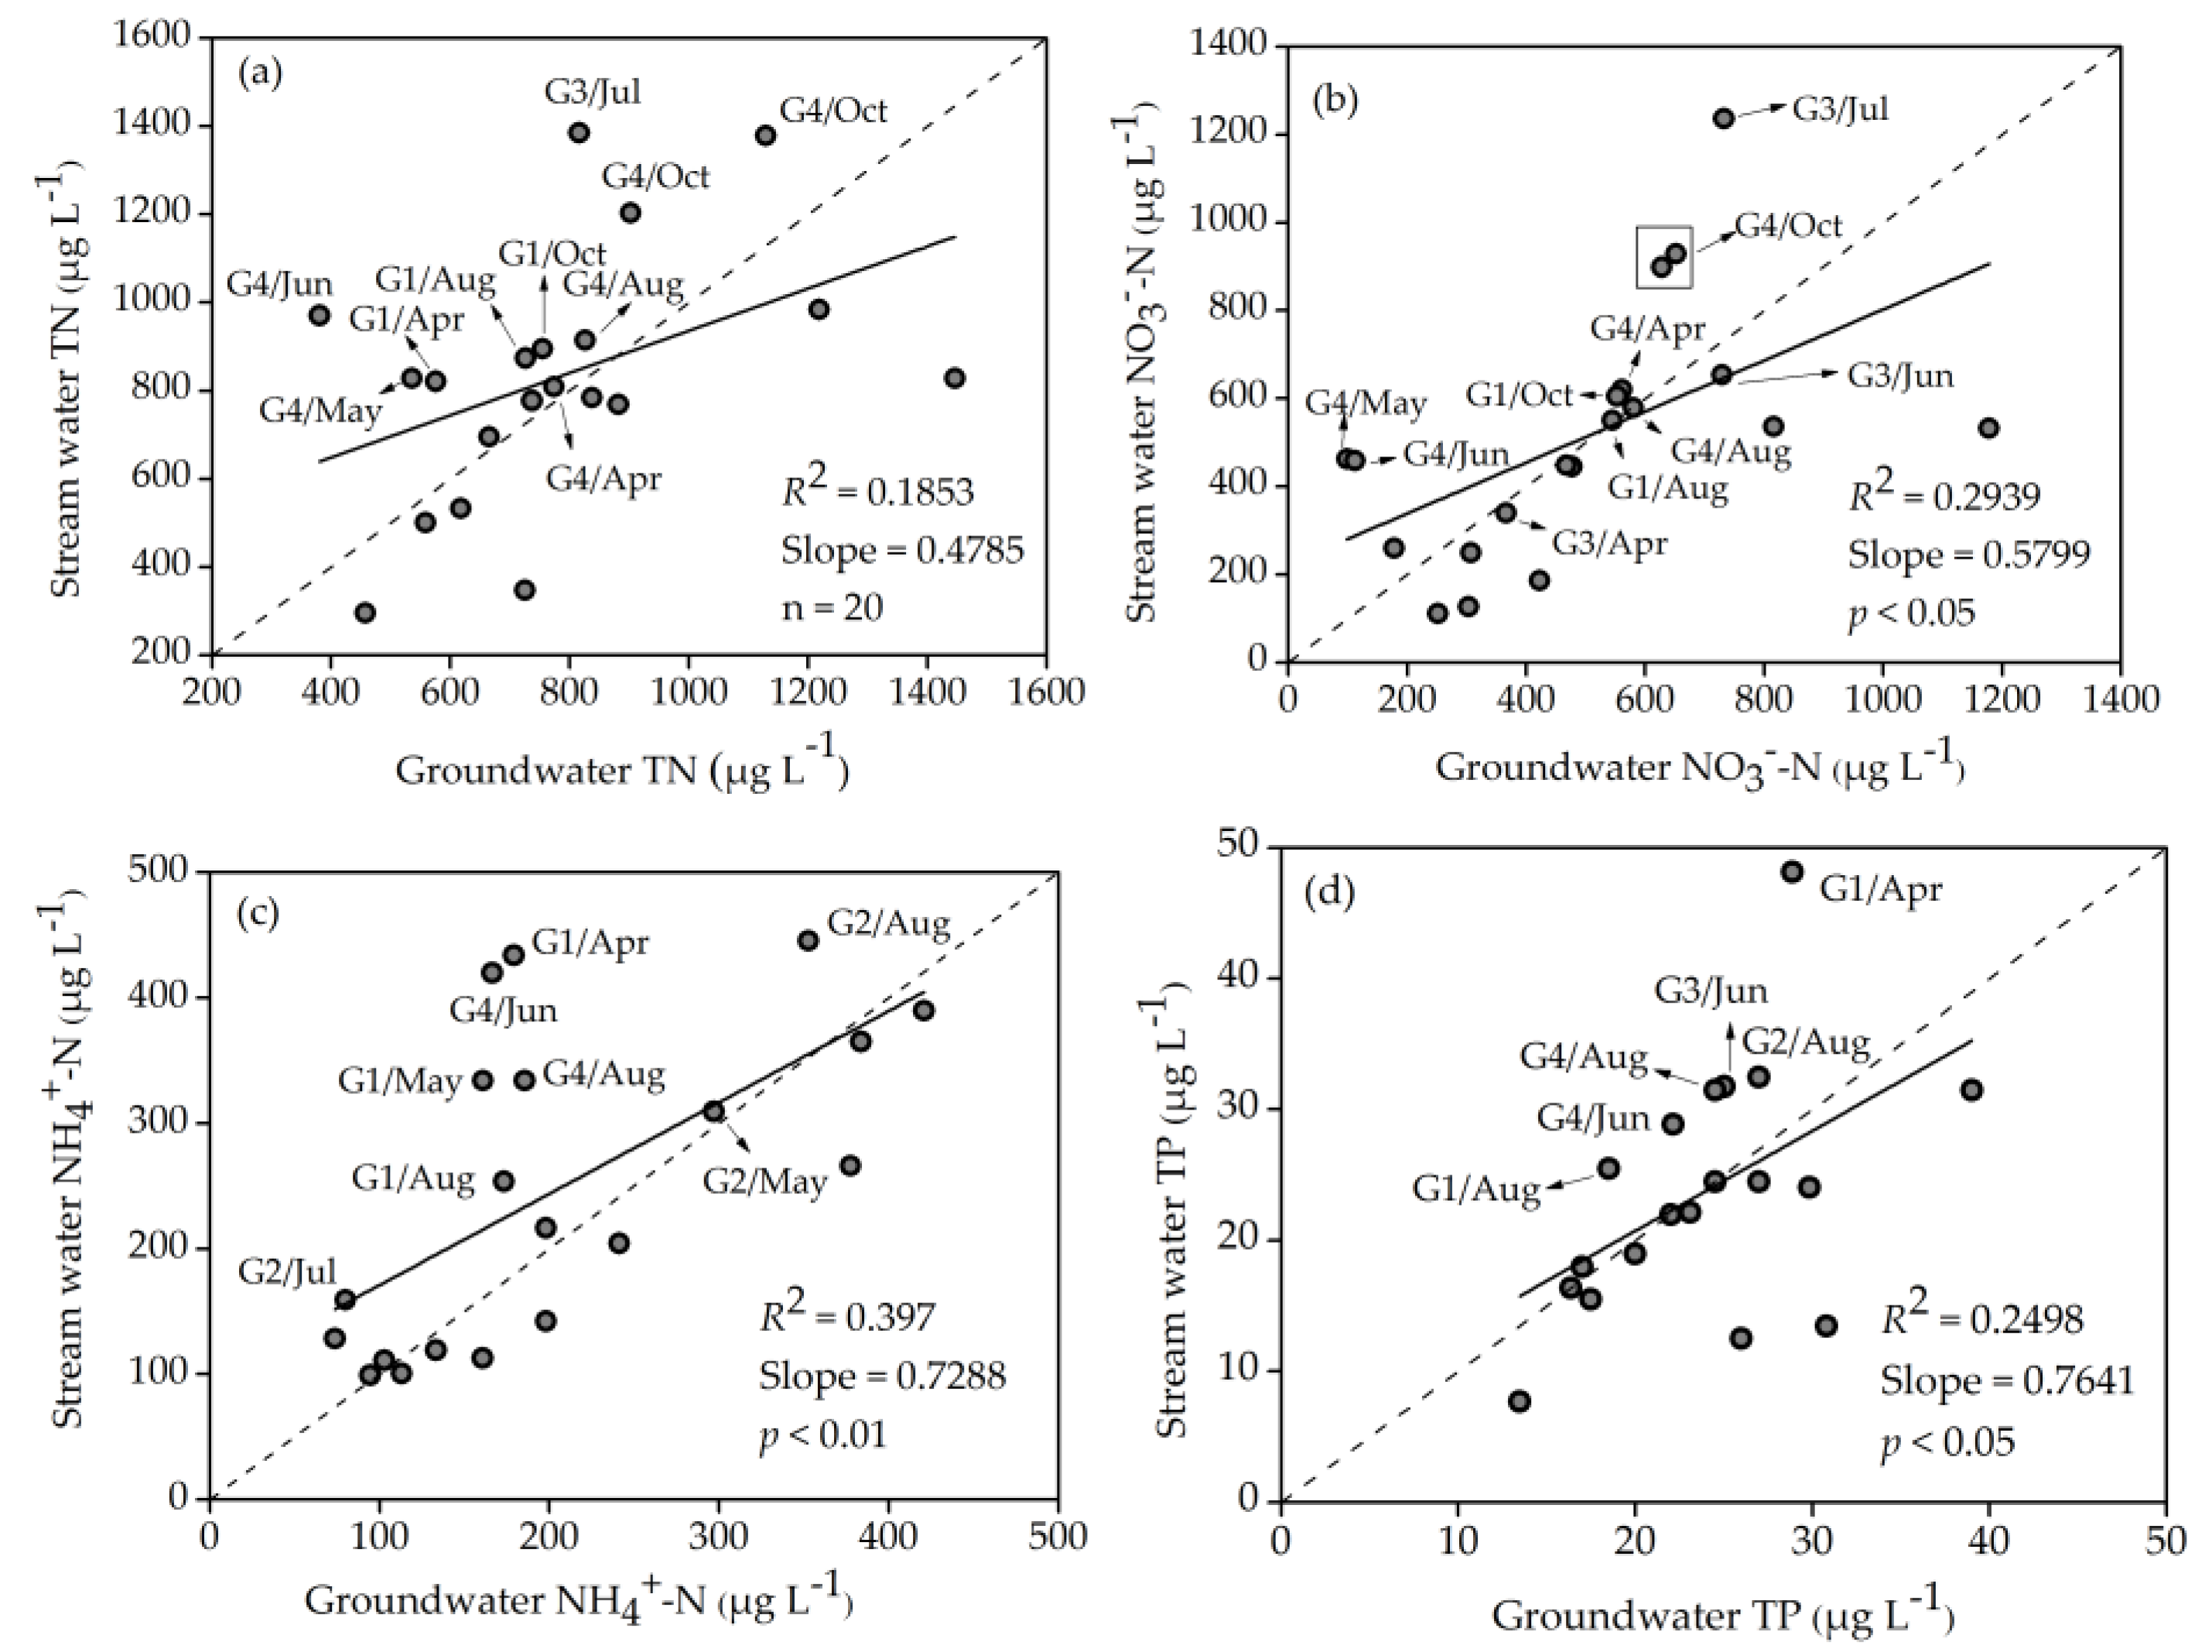
TN concentrations in stream water and soil showed a significant positive correlation in August, though the sampling locations are close to each other (Figure 10). NO3−-N concentrations in stream water and soil were also positively correlated in April and August. There was a significant negative correlation of TP concentrations in stream water and soil in April. However, their relationships turned to positive in August and October (Figure 10). For NH4+-N, there were no significant correlations between stream water and soil. Significant positive correlations were presented for NO3−-N, NH4+-N and TP concentrations between stream water and groundwater (r = 0.542, n = 20, p < 0.05; r = 0.63, n = 20, p < 0.01; r = 0.499, n = 20, p < 0.05, respectively) (Figure 11).
3.4.3. Spatial Variation over All Sites
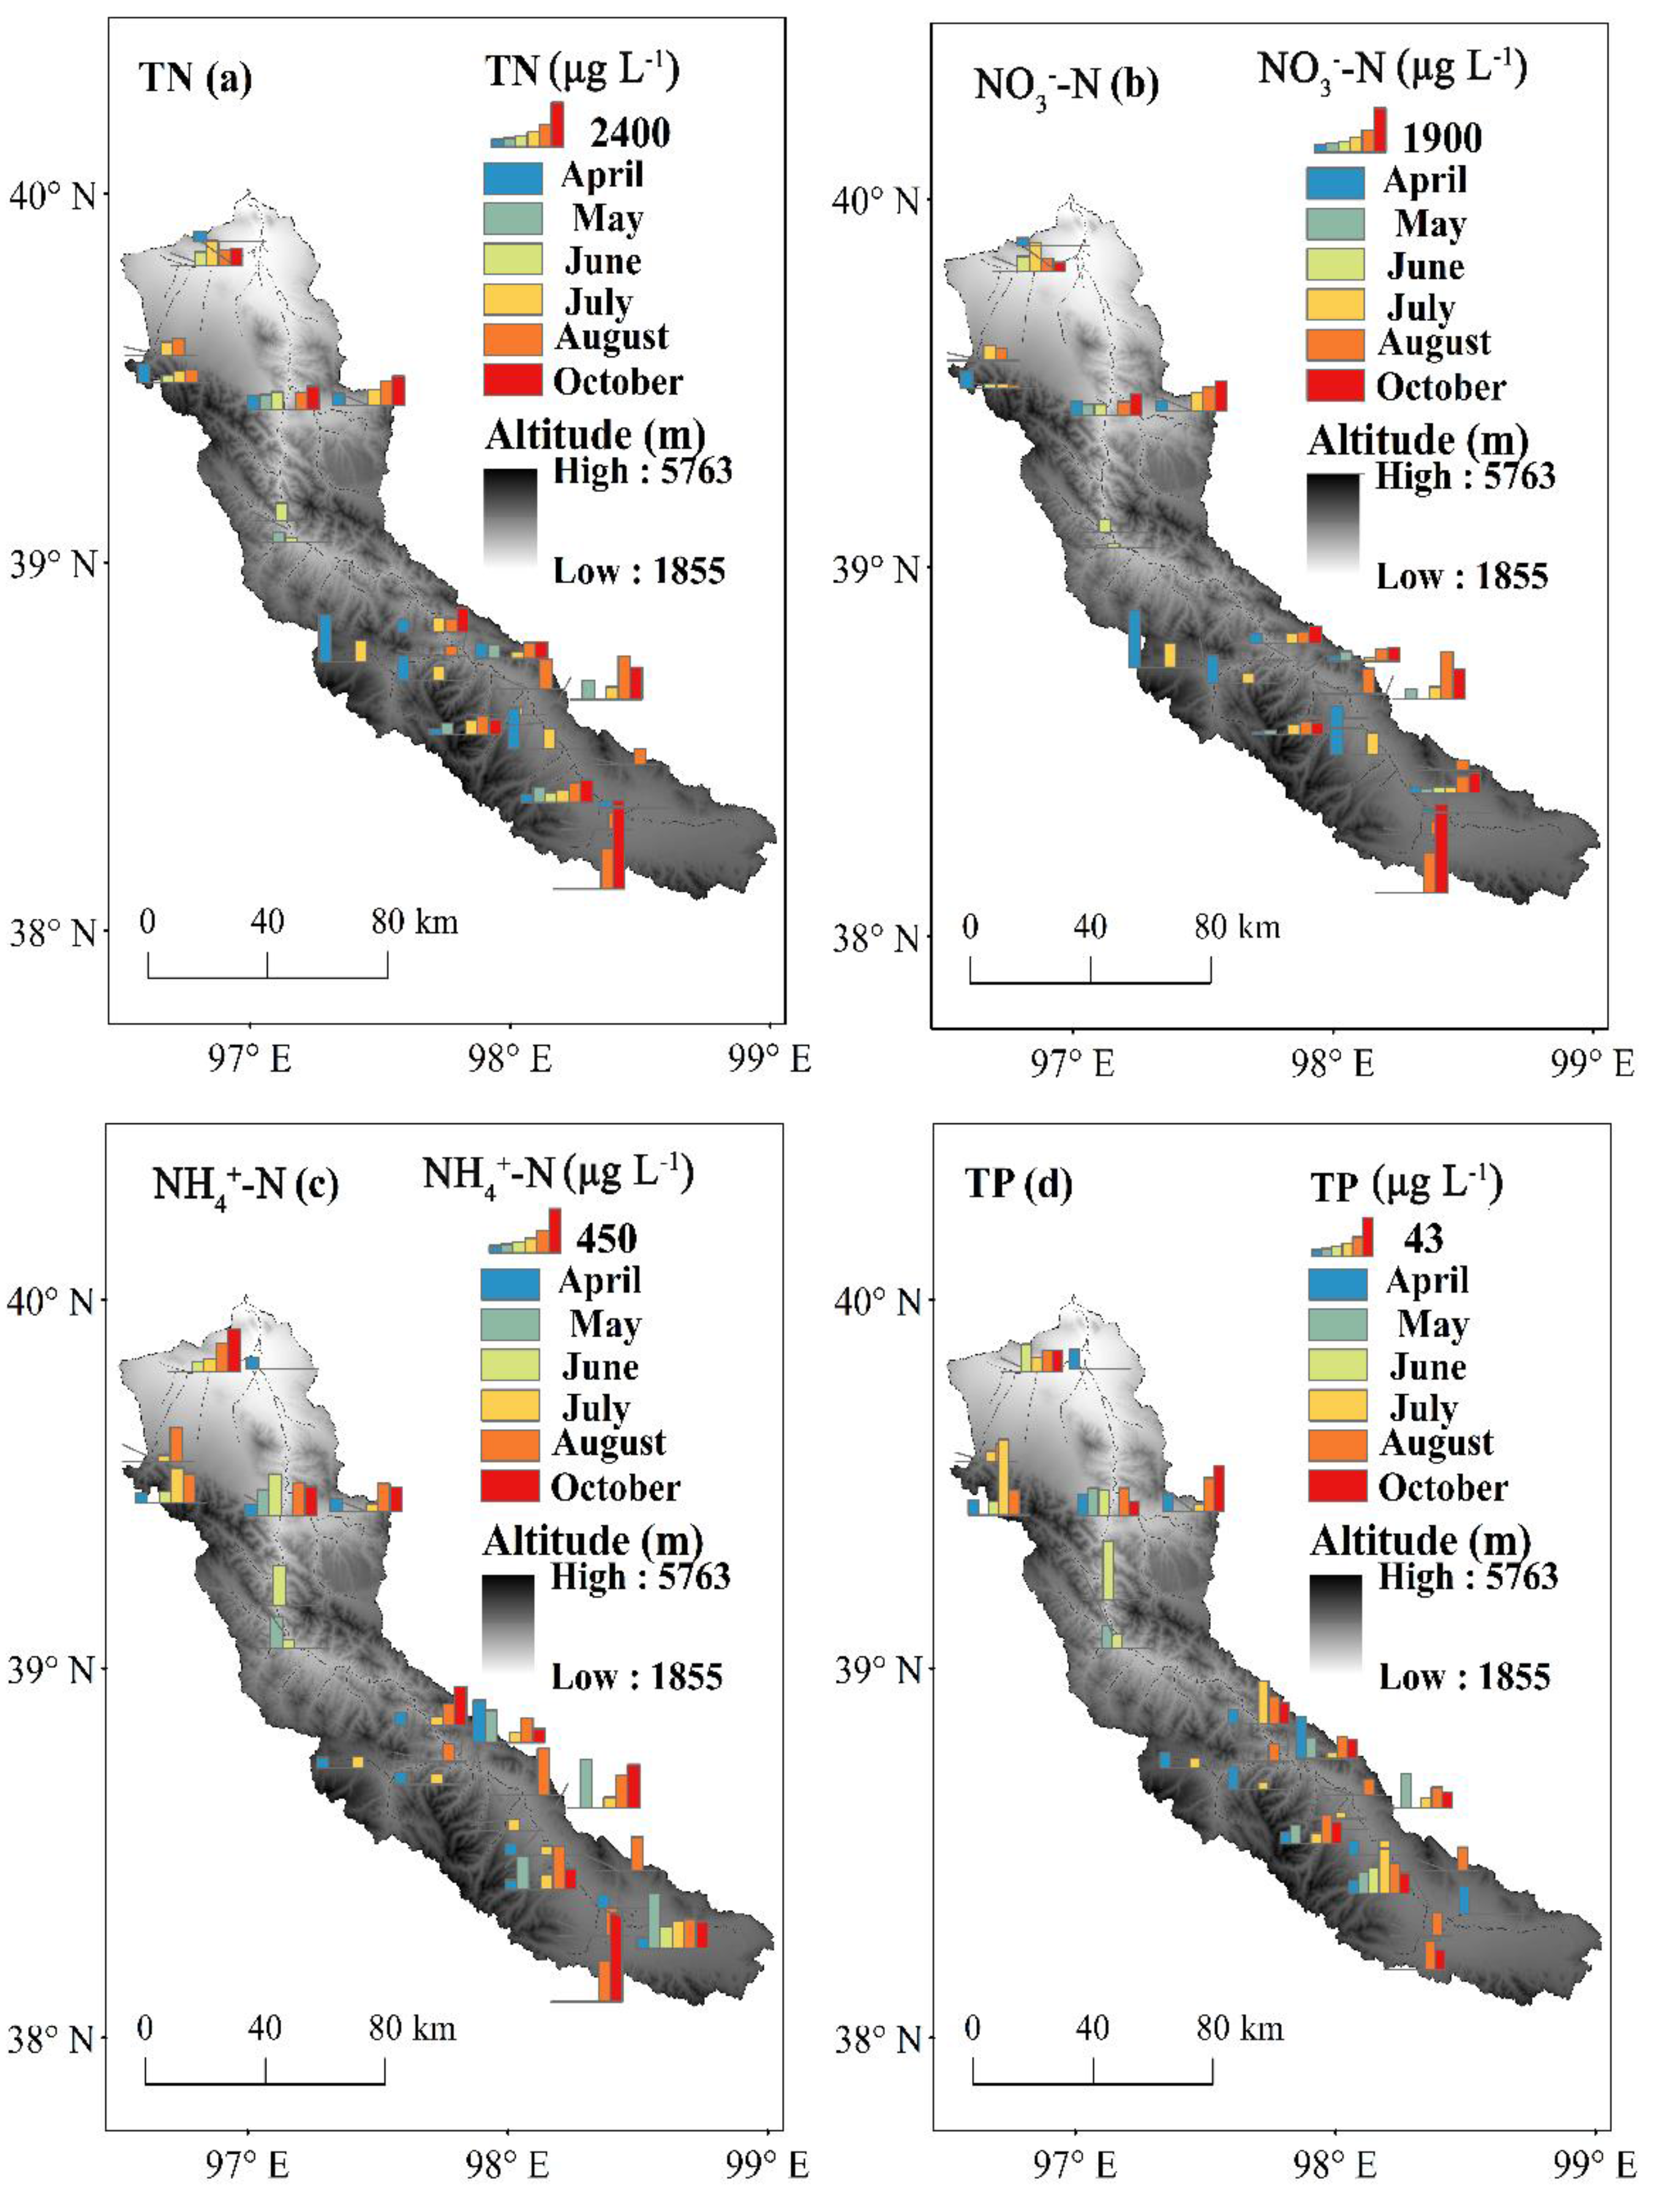
Spatial variation of N and P concentrations in stream water are presented in Figure 12. On a monthly basis, N and P concentrations in stream water exhibited obvious spatial variation. The spatial patterns of TN and NO3−-N concentrations were generally similar from April to October. The TN and NO3−-N concentrations in April and May changed significantly across sampling sites and were generally higher in the glacier snout or near watershed divide. In June and July during the snowmelt and glacier melt season, TN and NO3−-N concentrations were higher at lower elevations (below 3400 m a.s.l.) than those at higher elevations. Meanwhile, TN and NO3−-N concentrations were intermediate in the glacier snout or close to the watershed divide, which were consistent with the low concentrations found in snow samples during the ablation season. However, in late August and October, TN and NO3−-N concentrations differed little across the main stream sampling sites and were remarkably higher near the watershed divide.
Significant variation of NH4+-N concentrations was found over all sampling sites in the mainstream in April. However, the lowest NH4+-N concentrations was observed in the glacier snout. In May, NH4+-N concentrations decreased significantly at the main stream sampling sites. NH4+-N concentrations near watershed divide were considerably higher than median concentrations over all sampling sites in May. The NH4+-N concentrations in June were lower at higher elevations (above 3400 m a.s.l.) than those at lower elevations. The NH4+-N concentrations in July near glacier snout were at the peak value. In August and October, NH4+-N concentrations differed clearly among the sampling sites and were relatively higher near the watershed divide.
On monthly timescales, TP concentrations in April were consistently lower in the main stream sample sites of the higher elevations (above 3400 m a.s.l.), except for sampling site D8, than those at the lower elevations. Generally, TP concentrations of mainstream flow in May gradually increased. Meanwhile, TP concentrations near the watershed divide were at a peak value. In June, TP concentrations varied widely across all sampled sites, ranging from 15.4 to 67.4 μg L−1, and the lowest concentrations were found in glacier front stream sampling sites. However, TP concentrations in July also varied widely across all sampled sites, ranging from 7.7 to 86.6 μg L−1, and the highest concentrations occurred in glacier front stream sampling sites. TP concentrations differed little across sampling sites in August and were generally quite stable in October.
4. Discussion
4.1. Comparison of Nutrients Concentrations with Adjacent Regions and Evaluation of Surface Water and Groundwater Quality
Our results showed higher STN and STP concentrations in the upper Shule River basin than in the Beiluhe basin in the central Qinghai-Tibetan Plateau (1.0 g kg−1 for STN, 0.3 g kg−1 for STP, n = 120) [32]. Snow NO3−-N and NH4+-N concentrations were lower than those in central and northern Qinghai-Tibetan Plateau (533.5 μg L−1 for NO3−-N, 393 μg L−1 for NH4+-N, n = 15) [33]. In rain samples, NO3−-N (NH4+-N) concentrations were higher (lower) than those in the southern and northeastern Qinghai-Tibetan Plateau [34,35]. Rainfall NO3−-N was the predominant form of N ions, surpassing ammonium, which is consistent with the nitrogen deposition in rain found in alpine areas in the Central Alps [36]. Groundwater NO3−-N and TP concentrations in the Shule River were similar to those in the adjacent Heihe River basin, but NH4+-N concentrations were higher [37].
Analytical results showed that NO3−-N concentrations in all of groundwater samples were lower than the limit of China’s quality standard, Criterion I 2 mg L−1, for ground water’s natural low background content (the National Standard of the People’s Republic of China, Quality Standards for Ground Water, GB14848-93). However, of the groundwater samples, 30% in NH4+-N exceeded the limit of China’s quality standard for ground water Criterion III, 0.2 mg L−1 based on human health. In general, elevated levels of NH4+-N in wells are a common indicator of anthropogenic influence (such as agricultural activity or waste disposal activities). NH4+-N also occurs in groundwater through the decay of natural organic material [38]. It is unclear which sources were primarily responsible for the elevated NH4+-N concentrations in groundwater.
TN and TP concentrations in stream water were lower than those in the upper Yangtze River on the southern Qinghai-Tibetan Plateau [39]. Analytical results showed that the NH4+-N and TP concentrations in stream water were lower than water quality criteria (criterion II, 0.5 mg L−1 for NH4+-N and 0.1 mg L−1 for TP) (National Standard of the People’s Republic of China, Environmental Quality Standards for Surface Water, GB3838-2002). NO3−-N concentrations in stream water also fell within China’s standards for drinking water limit (10 mg L−1). However, of the stream water samples, 27.6% in TN exceeded the limit of China’s quality standard for surface water Criterion III, 1 mg L−1 based on Secondary protection zone of surface water source. Our results show that the surface water quality in the upper Shule River basin is generally good, which meets the demand standard for downstream water supply for drinking purposes. The groundwater quality is worth watching, particularly for NH4+-N concentrations.
4.2. Stream Water Nutrients as a Complex Mixing of Water Sources and Biogeochemical Transformations
4.2.1. Spatial Variability: The Impact of Soils
Permafrost dominates the upper Shule River basin, with alpine steppe and alpine meadow being the dominant vegetation [29]. Soil inorganic N was a small proportion of STN and there were no significant correlations in both TN and NH4+-N concentrations between stream water and soil except for August. It is suggested that in high elevation areas, N mineralization rates was very low and N retention in soil was high, which is consistent with Hiltbrunner et al. [36]. The nutrient contents in stream water does not appear to be significantly affected by those in soils. As permafrost degradation with temperature increasing thaws previously frozen soils and changes the flow paths of waters, however, the impact may be enhanced [40]. Significant positive correlation of stream water N (except NH4+-N) and P in August (temperature about 10 °C) with corresponding nutrients in soil indicated that stream water nutrients were influenced by soil nutrients with a warm temperature. Stream water TP concentrations exhibited an inverse relationship with N. STP may be controlled by soil texture and parent material [32]. Stream water TP concentrations were indicative of a pristine environment, suggesting that P derived from rock weathering [41] and was connected with suspend sediment. Suspend sediment concentrations are typically high during high flow conditions but low during low flow conditions [42]. High flow in rainy season is prone to bank erosion and soil erosion, contributing to increases in suspended sediment [43].
4.2.2. Temporal Variability: The Role of Water Sources and Biogeochemical Transformation
Snow and Rainfall Effect on Stream Nutrients
The TN and NO3−-N concentrations in stream water at the glacier snout in June and July were consistent with the low concentrations found in snow samples. The higher NH4+-N concentration in stream water near the glacier snout in July were also consistent with the high concentrations in snow samples as the ablation season progresses. It is indicated that nutrient concentrations in stream water were strongly influenced by glacial melt and snow melt. Our results showed that snow TN concentrations was lower in ablation period than those in non-ablation period. N loss from snow was obvious in ablation period revealing that snow cover was an important dynamic source of stream water N. The dominant characteristic of LHG glacier basin with typical continental climatic conditions is a long, harsh winter following by a short summer [31]. Half of the year N deposition is stored in the snow pack [36] and the presence of ice and a seasonal snow appear to affect the storage and release of inorganic and organic nitrogen [44]. Consequently, seasonal snow cover may be a source of hydrologic nitrogen export in the early ablation season [45]. At the very beginning of the sampling in April, the stream water N concentrations were high (Figure 9); this may also be caused by ionic pulse of preferably released N at the initial snowmelt [46,47]. On the other hand, we found that the approximately similar value in snow inorganic N:total N ratio between the ablation period and non-ablation period. However, the snow NO3−-N and NH4+-N concentrations did not remain stable during the two periods. Higher NO3−-N concentrations in snow samples in non-ablation period showed NO3−-N tended to leach with increasing air temperature. Elevated NH4+-N contents suggested N mineralization rate was high in ablation period. Particularly, snow NO3−-N:TN ratio tended to decline from non-ablation period (ratio 0.46) to ablation period (ratio 0.22), and at the same time increased NH4+-N:TN ratio was observed (from 0.38 to 0.54). NO3−-N and NH4+-N could be potential sources fueling bacterial metabolism in the sow/ice environment [48]. The differences between ratios of NO3−-N and NH4+-N in snow indicate different N mineralization rates and N leaching. In addition, snow TP concentrations differed little between the two periods, suggesting that snow P mainly derived from atmospheric dust. Although P become available by decomposition of organic matter [41], no difference in TP concentrations indicates that snow microbial activity has little influence on TP concentration.
In general, rain events had higher N concentration in spring/early summer than subsequent rain events [36]. Since we lost a few rain samples in May, however, there was no apparent rain event during the monitoring period in June. The dynamic of NO3−-N and NH4+-N concentrations in sequential samples of all rainfall events at Site D2 in July and August were monitored, which was helpful in identifying characteristic inorganic N compounds in the atmosphere by wet deposition [49]. Anthropogenic sources contribute to atmospheric N deposition [50]. Our findings showed that the increase of NO3−-N and NH4+-N in mid- and late-July collected at the rainy seasons may be explained by more intense agricultural activities in the lower regions and increased atmospheric mixing during this time associated with low-elevation rain events frequency [36]. Several studies have identified that the growing season is an important period for nitrogen deposition [51]. Our findings showed that rainfall inorganic N concentrations were higher at the growing season, however, site D2 stream water NO3−-N concentrations were lower than those of rainfall during rainfall collection period, indicating that stream water nutrients were less directly affected by the rainfall as a source of river recharge in arid and semi-arid region. In addition, it agreed with the results that the contributions of precipitation were about 19% by applying end member mixing analysis to quantify the runoff generating sources and contributions in the upstream regions of the Shule River basin [25].
Groundwater Effect on Stream Nutrients
This study showed that an upward trend in NO3−-N concentrations in groundwater was consistent with increasing TN concentrations in groundwater samples. The NO3−-N concentrations in groundwater increased markedly over time, indicating that nitrification processes was a predominantly controlling factor [52]. It is noted that the groundwater NO3−-N concentrations in low precipitation month (April–June) were apparently lower than those in the rainy month, implying that precipitation may result in soil NO3−-N leaching and influence on groundwater NO3−-N levels. Moreover, NO3−-N comprised the bulk of TN in groundwater, and the trend was similar between NO3−-N and TN. Groundwater NH4+-N concentrations fluctuate over time. For NH4+-N, sorption as a result of biological degradation and cation exchange is an key reactive processes controlling groundwater transport [53]. TP concentrations in groundwater ranged from 13~39 μg L−1, mean value and median value about 24 μg L−1, which can represent natural background levels, implying that naturally occurring geological P sources were likely to explain these differences.
At the middle of the sampling in June and July, lower stream water N concentrations can be explained by N being primarily immobilized in aquatic heterotrophic biomass [3], resulting in reduced N concentration. In the summer time, permafrost thawing allows for increased infiltration with deepening the active layer, which would lead to more groundwater contribution to flow [23]. Moreover, applying hydrograph separation have shown that groundwater as a source of river recharge dominated runoff in the headwater of Shule River basin [25]. Our data showed that the ratio of inorganic N:TN is approximately the same and N trend is also similar from June to October between groundwater and stream water, clearly indicating that groundwater dominated runoff and groundwater N have an influence on stream water N.
Comparison of NO3−-N concentrations between groundwater and stream water (Figure 11) indicates that groundwater nutrients were higher than those of stream water. At site G2, stream water TN and NO3−-N concentrations were almost below the 1:1 line, suggesting that concentrations were less than the groundwater. This sampling site was the farthest from the watershed outlet and low stream water nutrients results from dilution, which means that stream water is not solely comprised of groundwater but a mixture of groundwater and other water sources, such as abundant meltwater. In fact, two-thirds of site G3 samples stream water nutrients were lower than groundwater nutrients, which stream water at site G3 were recharge by LHG glacier in the upper Shule River basin. However, at site G4 TN and NO3−-N concentrations of almost month’s samples were above the line. In particular, May and June’ stream water NO3−-N concentrations were clearly lower than April’ and a part of NH4+-N concentrations of month’s samples in summer were above line, indicating that stream water nutrients were controlled by different ratios of water sources and biogeochemical processes (e.g., biological assimilation and denitrification and nitrification processes). The significant positive correlations of groundwater with stream water further suggested stream water nutrients were primarily influenced by groundwater nutrient concentrations.
5. Conclusions
Spatiotemporal variations of nitrogen and phosphorous constituents, including dissolved inorganic and total nitrogen, have been examined in the upper Shule River basin. Concentrations of both nitrogen and phosphorus in stream water varied greatly in space and over time, with TN and TP concentrations having a reverse correlation. The monthly trend of TN in stream water was similar to those of NO3−-N. In addition, the concentrations of N species in stream water declined from April to June and then increased from July to October. At the early ablation season, stream water N is strongly influenced by glacier melt/snow melt. During summer months, biogeochemical processes, including biological assimilation, and soil nutrient leaching may have affected the stream water nutrients. Rainfall in July and August, with highest N concentrations compared to both snow and stream water, did not seem to significantly affect stream water N concentrations. Instead, stream water nutrients were primarily impacted by groundwater contents at the end of the ablation period. Our data strongly suggest the quality of water in terms of nutrients is generally good in the upper reach of Shule River basin. In general, inorganic nitrogen was the dominant form of total nitrogen in groundwater and stream water, suggesting the importance of quantifying inorganic components in assessing the N availability and water quality in these aquatic ecosystems.
Acknowledgments
Funding for this work was primarily provided by the National Natural Science Foundation of China (Nos. 41730751; 41771040; 91647102 and 41671053) and partially by Fengjing Liu’s start-up fund at Michigan Technological University. We thank Jinkui Wu and Shiwei Liu for sharing sample from LHG; Chuancheng Zhao, Qingfeng Li, Yu Qin for site selection, field assistance and sample collection; Rui Xu for sample analysis.
Author Contributions
Yongjian Ding designed the study. Tianding Han participated in and guided the field sampling campaigns. Fengjing Liu helped to shape the manuscript and on writing. Hongzheng Pu participated in the field sampling campaigns, carried out data analysis and wrote the manuscript.
Conflicts of Interest
The authors declare no conflict of interest.
References
- Correll, D.L. The role of phosphorus in the eutrophication of receiving waters: A review. J. Environ. Qual. 1998, 27, 261–266. [Google Scholar] [CrossRef]
- Elser, J.J.; Bracken, M.E.; Cleland, E.E.; Gruner, D.S.; Harpole, W.S.; Hillebrand, H.; Ngai, J.T.; Seabloom, E.W.; Shurin, J.B.; Smith, J.E. Global analysis of nitrogen and phosphorus limitation of primary producers in freshwater, marine and terrestrial ecosystems. Ecol. Lett. 2007, 10, 1135–1142. [Google Scholar] [CrossRef] [PubMed]
- Peterson, B.J.; Wollheim, W.M.; Mulholland, P.J.; Webster, J.R.; Meyer, J.L.; Tank, J.L.; Martí, E.; Bowden, W.B.; Valett, H.M.; Hershey, A.E. Control of nitrogen export from watersheds by headwater streams. Science 2001, 292, 86–90. [Google Scholar] [CrossRef] [PubMed]
- Houser, J.N.; Mulholland, P.J.; Maloney, K.O. Upland disturbance affects headwater stream nutrients and suspended sediments during baseflow and stormflow. J. Environ. Qual. 2006, 35, 352–365. [Google Scholar] [CrossRef] [PubMed]
- Pringle, C.M. Nutrient spatial heterogeneity: Effects on community structure, physiognomy, and diversity of stream algae. Ecology 1990, 71, 905–920. [Google Scholar] [CrossRef]
- McClelland, J.W.; Stieglitz, M.; Pan, F.; Holmes, R.M.; Peterson, B.J. Recent changes in nitrate and dissolved organic carbon export from the upper Kuparuk River, North Slope, Alaska. J. Geophys. Res. Biogeosci. 2007, 112. [Google Scholar] [CrossRef]
- Hood, E.; Scott, D. Riverine organic matter and nutrients in southeast Alaska affected by glacial coverage. Nat. Geosci. 2008, 1, 583–587. [Google Scholar] [CrossRef]
- Mouri, G.; Takizawa, S.; Oki, T. Spatial and temporal variation in nutrient parameters in stream water in a rural-urban catchment, Shikoku, Japan: Effects of land cover and human impact. J. Environ. Manag. 2011, 92, 1837–1848. [Google Scholar] [CrossRef] [PubMed]
- Howarth, R.W.; Marino, R. Nitrogen as the limiting nutrient for eutrophication in coastal marine ecosystems: Evolving views over three decades. Limnol. Oceanogr. 2006, 51, 364–376. [Google Scholar] [CrossRef]
- Rabalais, N.N.; Turner, R.E.; Díaz, R.J.; Justić, D. Global change and eutrophication of coastal waters. ICES J. Mar. Sci. 2009, 66, 1528–1537. [Google Scholar] [CrossRef]
- Soo, C.-L.; Ling, T.-Y.; Lee, N.; Apun, K. Assessment of the characteristic of nutrients, total metals, and fecal coliform in Sibu Laut River, Sarawak, Malaysia. Appl. Water Sci. 2016, 6, 77–96. [Google Scholar] [CrossRef]
- Liu, Z.X.; Su, Z.; Yao, T.D.; Wang, W.T.; Shao, W.Z. Resources and distribution of glaciers on the Tibetan Plateau. Resour. Sci. 2000, 22, 49–52. (In Chinese) [Google Scholar]
- Yang, M.; Nelson, F.E.; Shiklomanov, N.I.; Guo, D.; Wan, G. Permafrost degradation and its environmental effects on the Tibetan Plateau: A review of recent research. Earth-Sci. Rev. 2010, 103, 31–44. [Google Scholar] [CrossRef]
- Qin, Y.H.; Wu, T.H.; Li, R.; Yu, W.J.; Wang, T.Y.; Zhu, X.F.; Wang, W.H.; Hu, G.J.; Tian, L.M. Using ERA-Interim reanalysis dataset to assess the changes of ground surface freezing and thawing condition on the Qinghai–Tibet Plateau. Environ. Earth Sci. 2016, 75, 826. [Google Scholar] [CrossRef]
- Hodson, A.J.; Mumford, P.N.; Kohler, J.; Wynn, P.M. The High Arctic glacial ecosystem: New insights from nutrient budgets. Biogeochemistry 2005, 72, 233–256. [Google Scholar] [CrossRef]
- Petrone, K.C.; Jones, J.B.; Hinzman, L.D.; Boone, R.D. Seasonal export of carbon, nitrogen, and major solutes from Alaskan catchments with discontinuous permafrost. J. Geophys. Res. Biogeosci. 2006, 111. [Google Scholar] [CrossRef]
- Frey, K.E.; McClelland, J.W.; Holmes, R.M.; Smith, L.C. Impacts of climate warming and permafrost thaw on the riverine transport of nitrogen and phosphorus to the Kara Sea. J. Geophys. Res. Biogeosci. 2007, 112. [Google Scholar] [CrossRef]
- Matson, P.; Lohse, K.A.; Hall, S.J. The globalization of nitrogen deposition: Consequences for terrestrial ecosystems. AMBIO J. Hum. Environ. 2002, 31, 113–119. [Google Scholar] [CrossRef]
- Dentener, F.; Drevet, J.; Lamarque, J.F.; Bey, I.; Eickhout, B.; Fiore, A.M.; Hauglustaine, D.; Horowitz, L.W.; Krol, M.; Kulshrestha, U.C.; et al. Nitrogen and sulfur deposition on regional and global scales: A multimodel evaluation. Glob. Biogeochem. Cycles 2006, 20. [Google Scholar] [CrossRef] [Green Version]
- Brooks, P.D.; Campbell, D.H.; Tonnessen, K.A.; Heuer, K. Natural variability in N export from headwater catchments: Snow cover controls on ecosystem N retention. Hydrol. Processes 1999, 13, 2191–2201. [Google Scholar] [CrossRef]
- Holman, I.P.; Whelan, M.J.; Howden, N.J.; Bellamy, P.H.; Willby, N.; Rivas-Casado, M.; McConvey, P. Phosphorus in groundwater—An overlooked contributor to eutrophication? Hydrol. Processes 2008, 22, 5121–5127. [Google Scholar] [CrossRef]
- Wakida, F.T.; Lerner, D.N. Non-agricultural sources of groundwater nitrate: A review and case study. Water Res. 2005, 39, 3–16. [Google Scholar] [CrossRef] [PubMed]
- Walvoord, M.A.; Striegl, R.G. Increased groundwater to stream discharge from permafrost thawing in the Yukon River basin: Potential impacts on lateral export of carbon and nitrogen. Geophys. Res. Lett. 2007, 34. [Google Scholar] [CrossRef]
- Chen, S.Y.; Liu, W.J.; Qin, X.; Liu, Y.S.; Zhang, T.Z.; Chen, K.L.; Hu, F.Z.; Ren, J.W.; Qin, D.H. Response characteristics of vegetation and soil environment to permafrost degradation in the upstream regions of the Shule River Basin. Environ. Res. Lett. 2012, 7, 189–190. [Google Scholar] [CrossRef]
- Zhou, J.X.; Wu, J.K.; Liu, S.W.; Zeng, G.X.; Jia, Q.; Wang, X.N.; Zhao, Q.D. Hydrograph Separation in the Headwaters of the Shule River Basin: Combining Water Chemistry and Stable Isotopes. Adv. Meteorol. 2015, 2015, 1–10. [Google Scholar] [CrossRef]
- Xie, X.; Yang, G.J.; Wang, Z.R.; Wang, J. Landscape pattern change in mountainous areas along an altitude gradient in the upper reaches of Shule River. Chin. J. Ecol. 2010, 29, 1420–1426. (In Chinese) [Google Scholar]
- Guo, X.Y.; Feng, Q.; Liu, W.; Li, Z.X.; Wen, X.H.; Si, J.H.; Xi, H.Y.; Guo, R.; Jia, B. Stable isotopic and geochemical identification of groundwater evolution and recharge sources in the arid Shule River Basin of Northwestern China. Hydrol. Processes 2015, 29, 4703–4718. [Google Scholar] [CrossRef]
- Liu, W.J.; Chen, S.Y.; Qin, X.; Baumann, F.; Scholten, T.; Zhou, Z.Y.; Sun, W.J.; Zhang, T.Z.; Ren, J.W.; Qin, D.H. Storage, patterns, and control of soil organic carbon and nitrogen in the northeastern margin of the Qinghai–Tibetan Plateau. Environ. Res. Lett. 2012, 7, 35401–35412. [Google Scholar] [CrossRef]
- Yi, S.H.; Zhou, Z.Y.; Ren, S.L.; Xu, M.; Qin, Y.; Chen, S.Y.; Ye, B.S. Effects of permafrost degradation on alpine grassland in a semi-arid basin on the Qinghai–Tibetan Plateau. Environ. Res. Lett. 2011, 6, 045403. [Google Scholar] [CrossRef]
- Dong, Z.W.; Kang, S.C.; Qin, D.H.; Qin, X.; Yan, F.P.; Du, W.T.; Wei, T. Temporal and diurnal analysis of trace elements in the Cryospheric water at remote Laohugou basin in northeast Tibetan Plateau. Chemosphere 2017, 171, 386–398. [Google Scholar] [CrossRef] [PubMed]
- Dong, Z.W.; Qin, D.H.; Chen, J.Z.; Qin, X.; Ren, J.W.; Cui, X.Q.; Du, Z.H.; Kang, S.C. Physicochemical impacts of dust particles on alpine glacier meltwater at the Laohugou Glacier basin in western Qilian Mountains, China. Sci. Total Environ. 2014, 493, 930–942. [Google Scholar] [CrossRef] [PubMed]
- Liu, W.J.; Chen, S.Y.; Zhao, Q.; Sun, Z.Z.; Ren, J.W.; Qin, D.H. Variation and control of soil organic carbon and other nutrients in permafrost regions on central Qinghai-Tibetan Plateau. Environ. Res. Lett. 2014, 9, 114013. [Google Scholar] [CrossRef]
- Wu, X.B.; Li, Q.L.; Wang, N.; Pu, J.C.; He, J.Q.; Zhang, C.W. Regional characteristics of ion concentration in glacial snowpits over the Tibetan Plateau and source analysis. Environ. Sci. 2011, 32, 971–975. (In Chinese) [Google Scholar]
- Jia, J.Y.; Zhang, Y.; Cai, X.B.; Liu, X.J. A dynamic changes of wet deposition of nitrogen in southeast Tibet: Taking Linzhi experiment station as an example. Acta Ecol. Sin. 2009, 29, 1907–1913. (In Chinese) [Google Scholar]
- Zhu, J.B.; Li, H.Q.; He, H.D.; Mao, S.J.; Li, Y.N. A dynamic changes of wet deposition of nitrogen at Haibei alpine meadow ecosystem of Qilian Mountains. J. Arid Land Resour. Environ. 2016, 3, 127–132. (In Chinese) [Google Scholar]
- Hiltbrunner, E.; Schwikowski, M.; Körner, C. Inorganic nitrogen storage in alpine snow pack in the Central Alps (Switzerland). Atmos. Environ. 2005, 39, 2249–2259. [Google Scholar] [CrossRef]
- Chang, J.; Wang, G.X. The figures of content and dynamical changes of N and P under different forms of land use in the Heihe River Basin. J. Lanzhou Univ. 2005, 41, 1–7. (In Chinese) [Google Scholar]
- Hinkle, S.R.; Böhlke, J.K.; Duff, J.H.; Morgan, D.S.; Weick, R.J. Aquifer-scale controls on the distribution of nitrate and ammonium in ground water near La Pine, Oregon, USA. J. Hydrol. 2007, 333, 486–503. [Google Scholar] [CrossRef]
- Tong, Y.; Bu, X.; Chen, J.; Zhou, F.; Chen, L.; Liu, M.; Tan, X.; Yu, T.; Zhang, W.; Mi, Z. Estimation of nutrient discharge from the Yangtze River to the east china sea and the identification of nutrient sources. J. Hazard. Mater. 2017, 321, 728–736. [Google Scholar] [CrossRef] [PubMed]
- Frey, K.E.; McClelland, J.W. Impacts of permafrost degradation on arctic river biogeochemistry. Hydrol. Processes 2009, 23, 169–182. [Google Scholar] [CrossRef]
- Yano, Y.; Brookshire, E.N.J.; Holsinger, J.; Weaver, T. Long-term snowpack manipulation promotes large loss of bioavailable nitrogen and phosphorus in a subalpine grassland. Biogeochemistry 2015, 124, 319–333. [Google Scholar] [CrossRef]
- Haritashya, U.K.; Singh, P.; Kumar, N.; Gupta, R.P. Suspended sediment from the Gangotri Glacier: Quantification, variability and associations with discharge and air temperature. J. Hydrol. 2006, 321, 116–130. [Google Scholar] [CrossRef]
- Gao, W.; Gao, S.; Li, Z.; Lu, X.X.; Zhang, M.; Wang, S. Suspended sediment and total dissolved solid yield patterns at the headwaters of Urumqi River, northwestern China: A comparison between glacial and non-glacial catchments. Hydrol. Processes 2014, 28, 5034–5047. [Google Scholar] [CrossRef]
- Williams, M.W.; Eran, H.; Nel, C. Role of organic nitrogen in the nitrogen cycle of a high-elevation catchment, Colorado Front Range. Water Resour. Res. 2001, 37, 2569–2582. [Google Scholar] [CrossRef]
- Brooks, P.D.; Williams, M.W.; Schmidt, S.K. Inorganic nitrogen and microbial biomass dynamics before and during spring snowmelt. Biogeochemistry 1998, 43, 1–15. [Google Scholar] [CrossRef]
- Williams, M.W.; Bales, R.C.; Brown, A.D.; Melack, J.M. Fluxes and transformations of nitrogen in a high-elevation catchment, Sierra Nevada. Biogeochemistry 1995, 28, 1–31. [Google Scholar] [CrossRef]
- Liu, F.J.; Williams, M.W.; Caine, N. Source waters and flow paths in an alpine catchment, Colorado Front Range, United States. Water Resour. Res. 2004, 40. [Google Scholar] [CrossRef]
- Antony, R.; Krishnan, K.P.; Laluraj, C.M.; Thamban, M.; Dhakephalkar, P.K.; Engineer, A.S.; Shivaji, S. Diversity and physiology of culturable bacteria associated with a coastal Antarctic ice core. Microbiol. Res. 2012, 167, 372–380. [Google Scholar] [CrossRef] [PubMed]
- Zhang, Y.; Liu, X.J.; Fangmeier, A.; Goulding, K.T.W.; Zhang, F.S. Nitrogen inputs and isotopes in precipitation in the North China Plain. Atmos. Environ. 2008, 42, 1436–1448. [Google Scholar] [CrossRef]
- Jia, Y.; Yu, G.; He, N.; Zhan, X.; Fang, H.; Sheng, W.; Yao, Z.; Zhang, D.; Wang, Q. Spatial and decadal variations in inorganic nitrogen wet deposition in China induced by human activity. Sci. Rep. 2014, 4, 3763. [Google Scholar] [CrossRef] [PubMed]
- Sun, Z.G.; Liu, J.S.; Wang, J.D. Dynamics of nitrogen in the atmospheric wet deposition and its ecological effects in typical wetland ecosystem of Sanjiang plain. Adv. Water Sci. 2007, 18, 182–192. (In Chinese) [Google Scholar]
- Yang, J.M.; Liu, J.H.; Xiao-Bin, Y.U.; Yang, W.B.; Zhou, M.P. Variation of Nitrogen Resource in Groundwater and River Water in Changchun Region. J. Soil Water Conserv. 2010, 24, 255–257. [Google Scholar]
- Buss, S.; Herbert, A.; Morgan, P.; Thornton, S.; Smith, J. A review of ammonium attenuation in soil and groundwater. Q. J. Eng. Geol. Hydrogeol. 2004, 37, 347–359. [Google Scholar] [CrossRef]
Figure 1.
The upper Shule River basin and sampling locations of stream water (D), groundwater (G), precipitation (P, snowfall and rainfall) and top soils along with river network and distribution of glaciers.
Figure 1.
The upper Shule River basin and sampling locations of stream water (D), groundwater (G), precipitation (P, snowfall and rainfall) and top soils along with river network and distribution of glaciers.

Figure 2.
Spatial variation of concentrations of TN (a), NO3−-N (b), NH4+-N (c) ant TP (d) in soil in 2016 in the upper Shule River basin.
Figure 2.
Spatial variation of concentrations of TN (a), NO3−-N (b), NH4+-N (c) ant TP (d) in soil in 2016 in the upper Shule River basin.

Figure 3.
Median nutrient concentrations in surface snow sample, with one standard deviation, during the ablation period (from June to September) and non-ablation period (January to March) in 2015 at the Laohugou (LHG) glacier No. 12.
Figure 3.
Median nutrient concentrations in surface snow sample, with one standard deviation, during the ablation period (from June to September) and non-ablation period (January to March) in 2015 at the Laohugou (LHG) glacier No. 12.
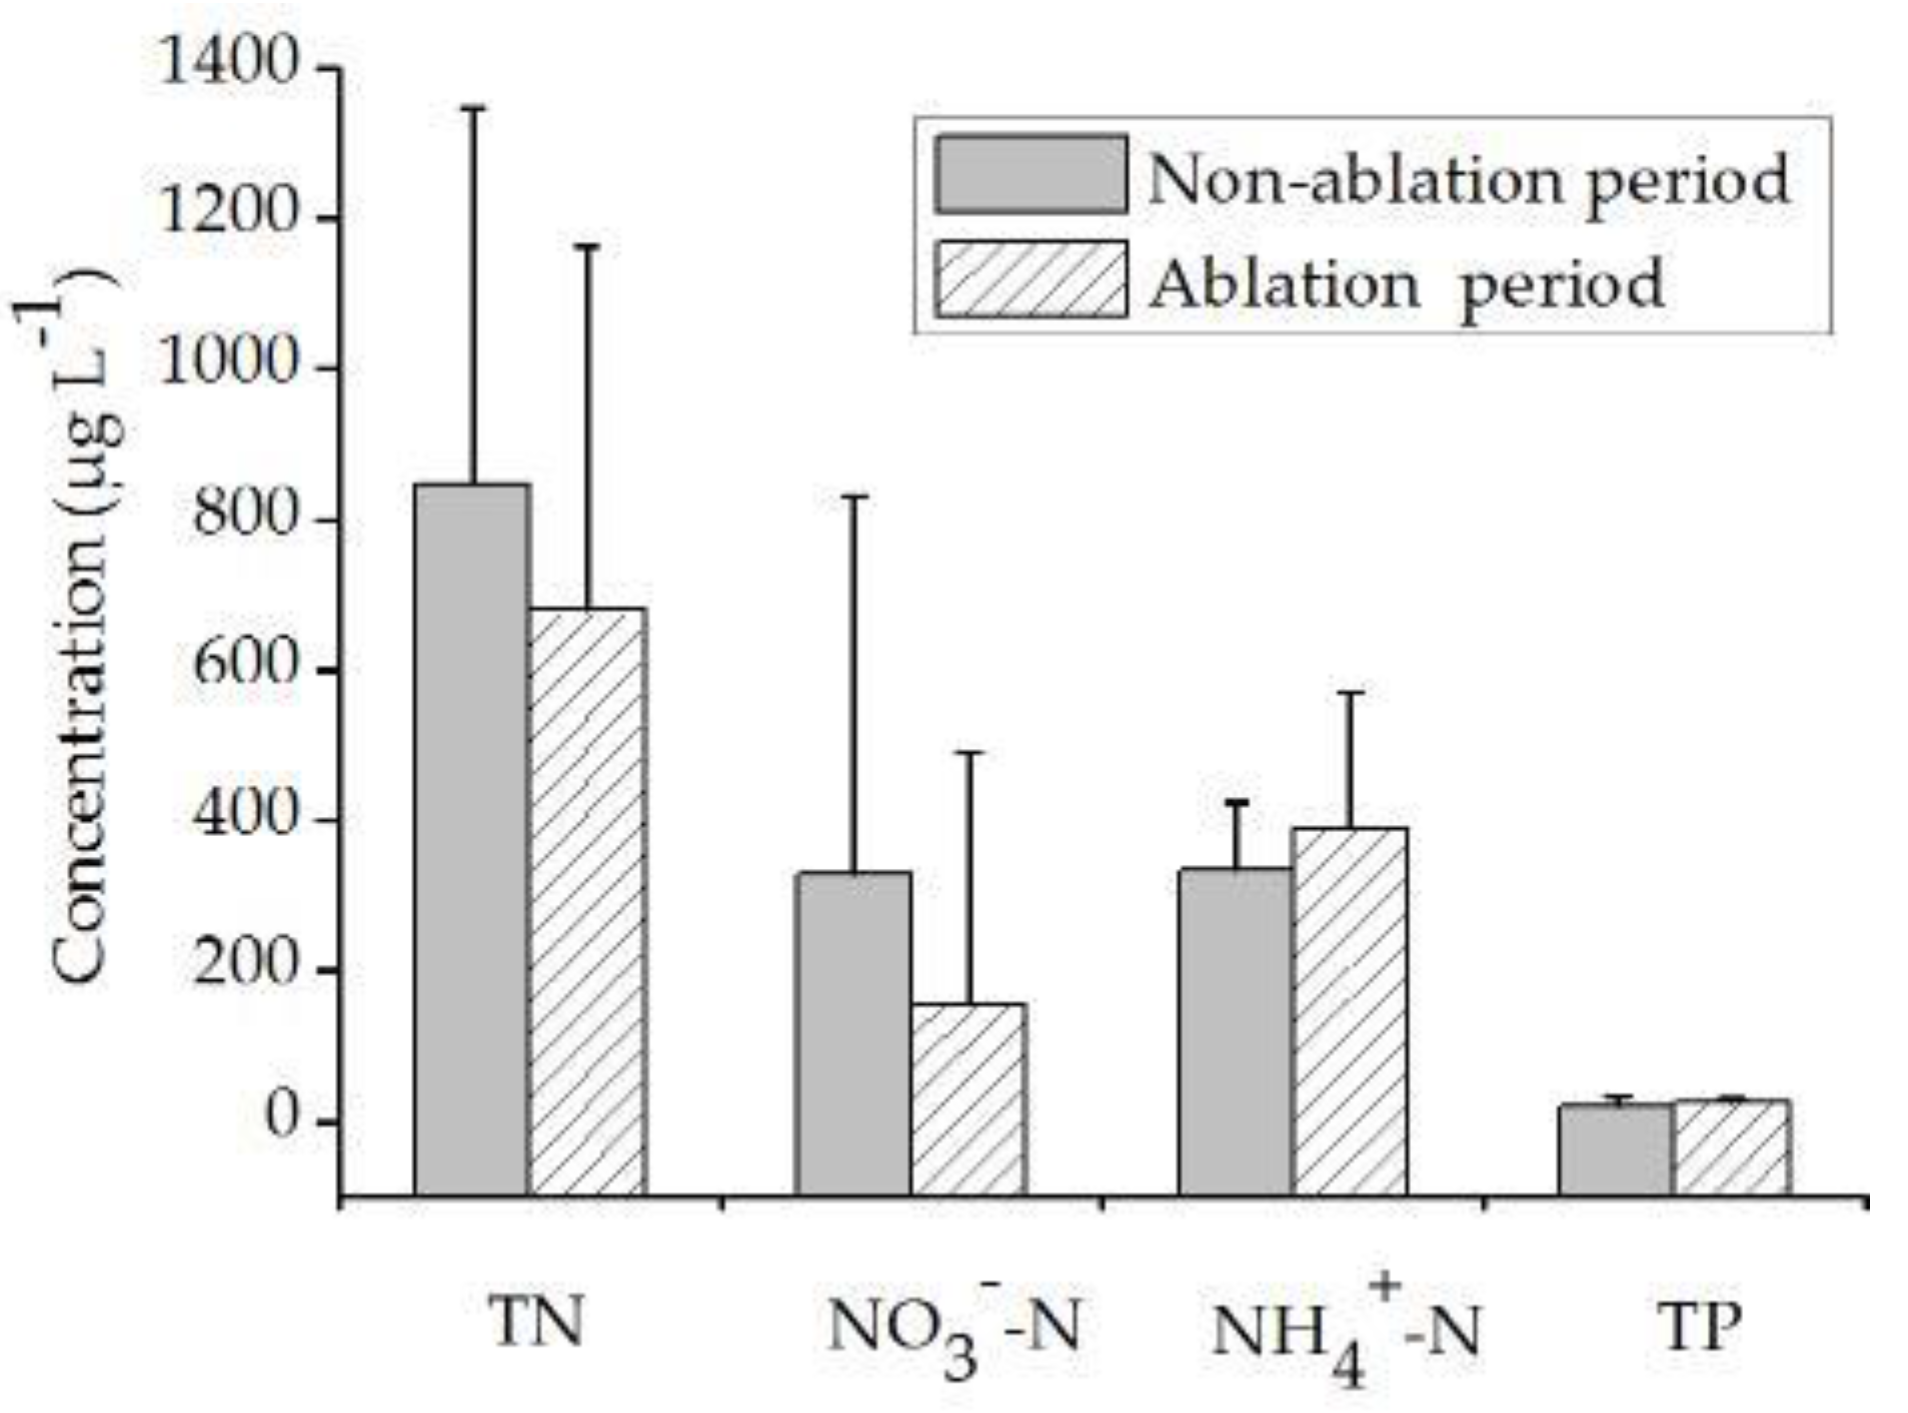
Figure 4.
Variation of air temperature (a) and precipitation (b) from July to August in 2016 and temporal variation of NO3−-N (c) and NH4+-N (d) concentrations in rainfall from July to August in 2016.
Figure 4.
Variation of air temperature (a) and precipitation (b) from July to August in 2016 and temporal variation of NO3−-N (c) and NH4+-N (d) concentrations in rainfall from July to August in 2016.

Figure 5.
Temporal variation of total nitrogen (TN) (a), NO3−-N (b), NH4+-N (c) and total phosphorous (TP) (d) concentrations in groundwater from April to October (no data for September) in 2016 in the upper Shule River basin.
Figure 5.
Temporal variation of total nitrogen (TN) (a), NO3−-N (b), NH4+-N (c) and total phosphorous (TP) (d) concentrations in groundwater from April to October (no data for September) in 2016 in the upper Shule River basin.
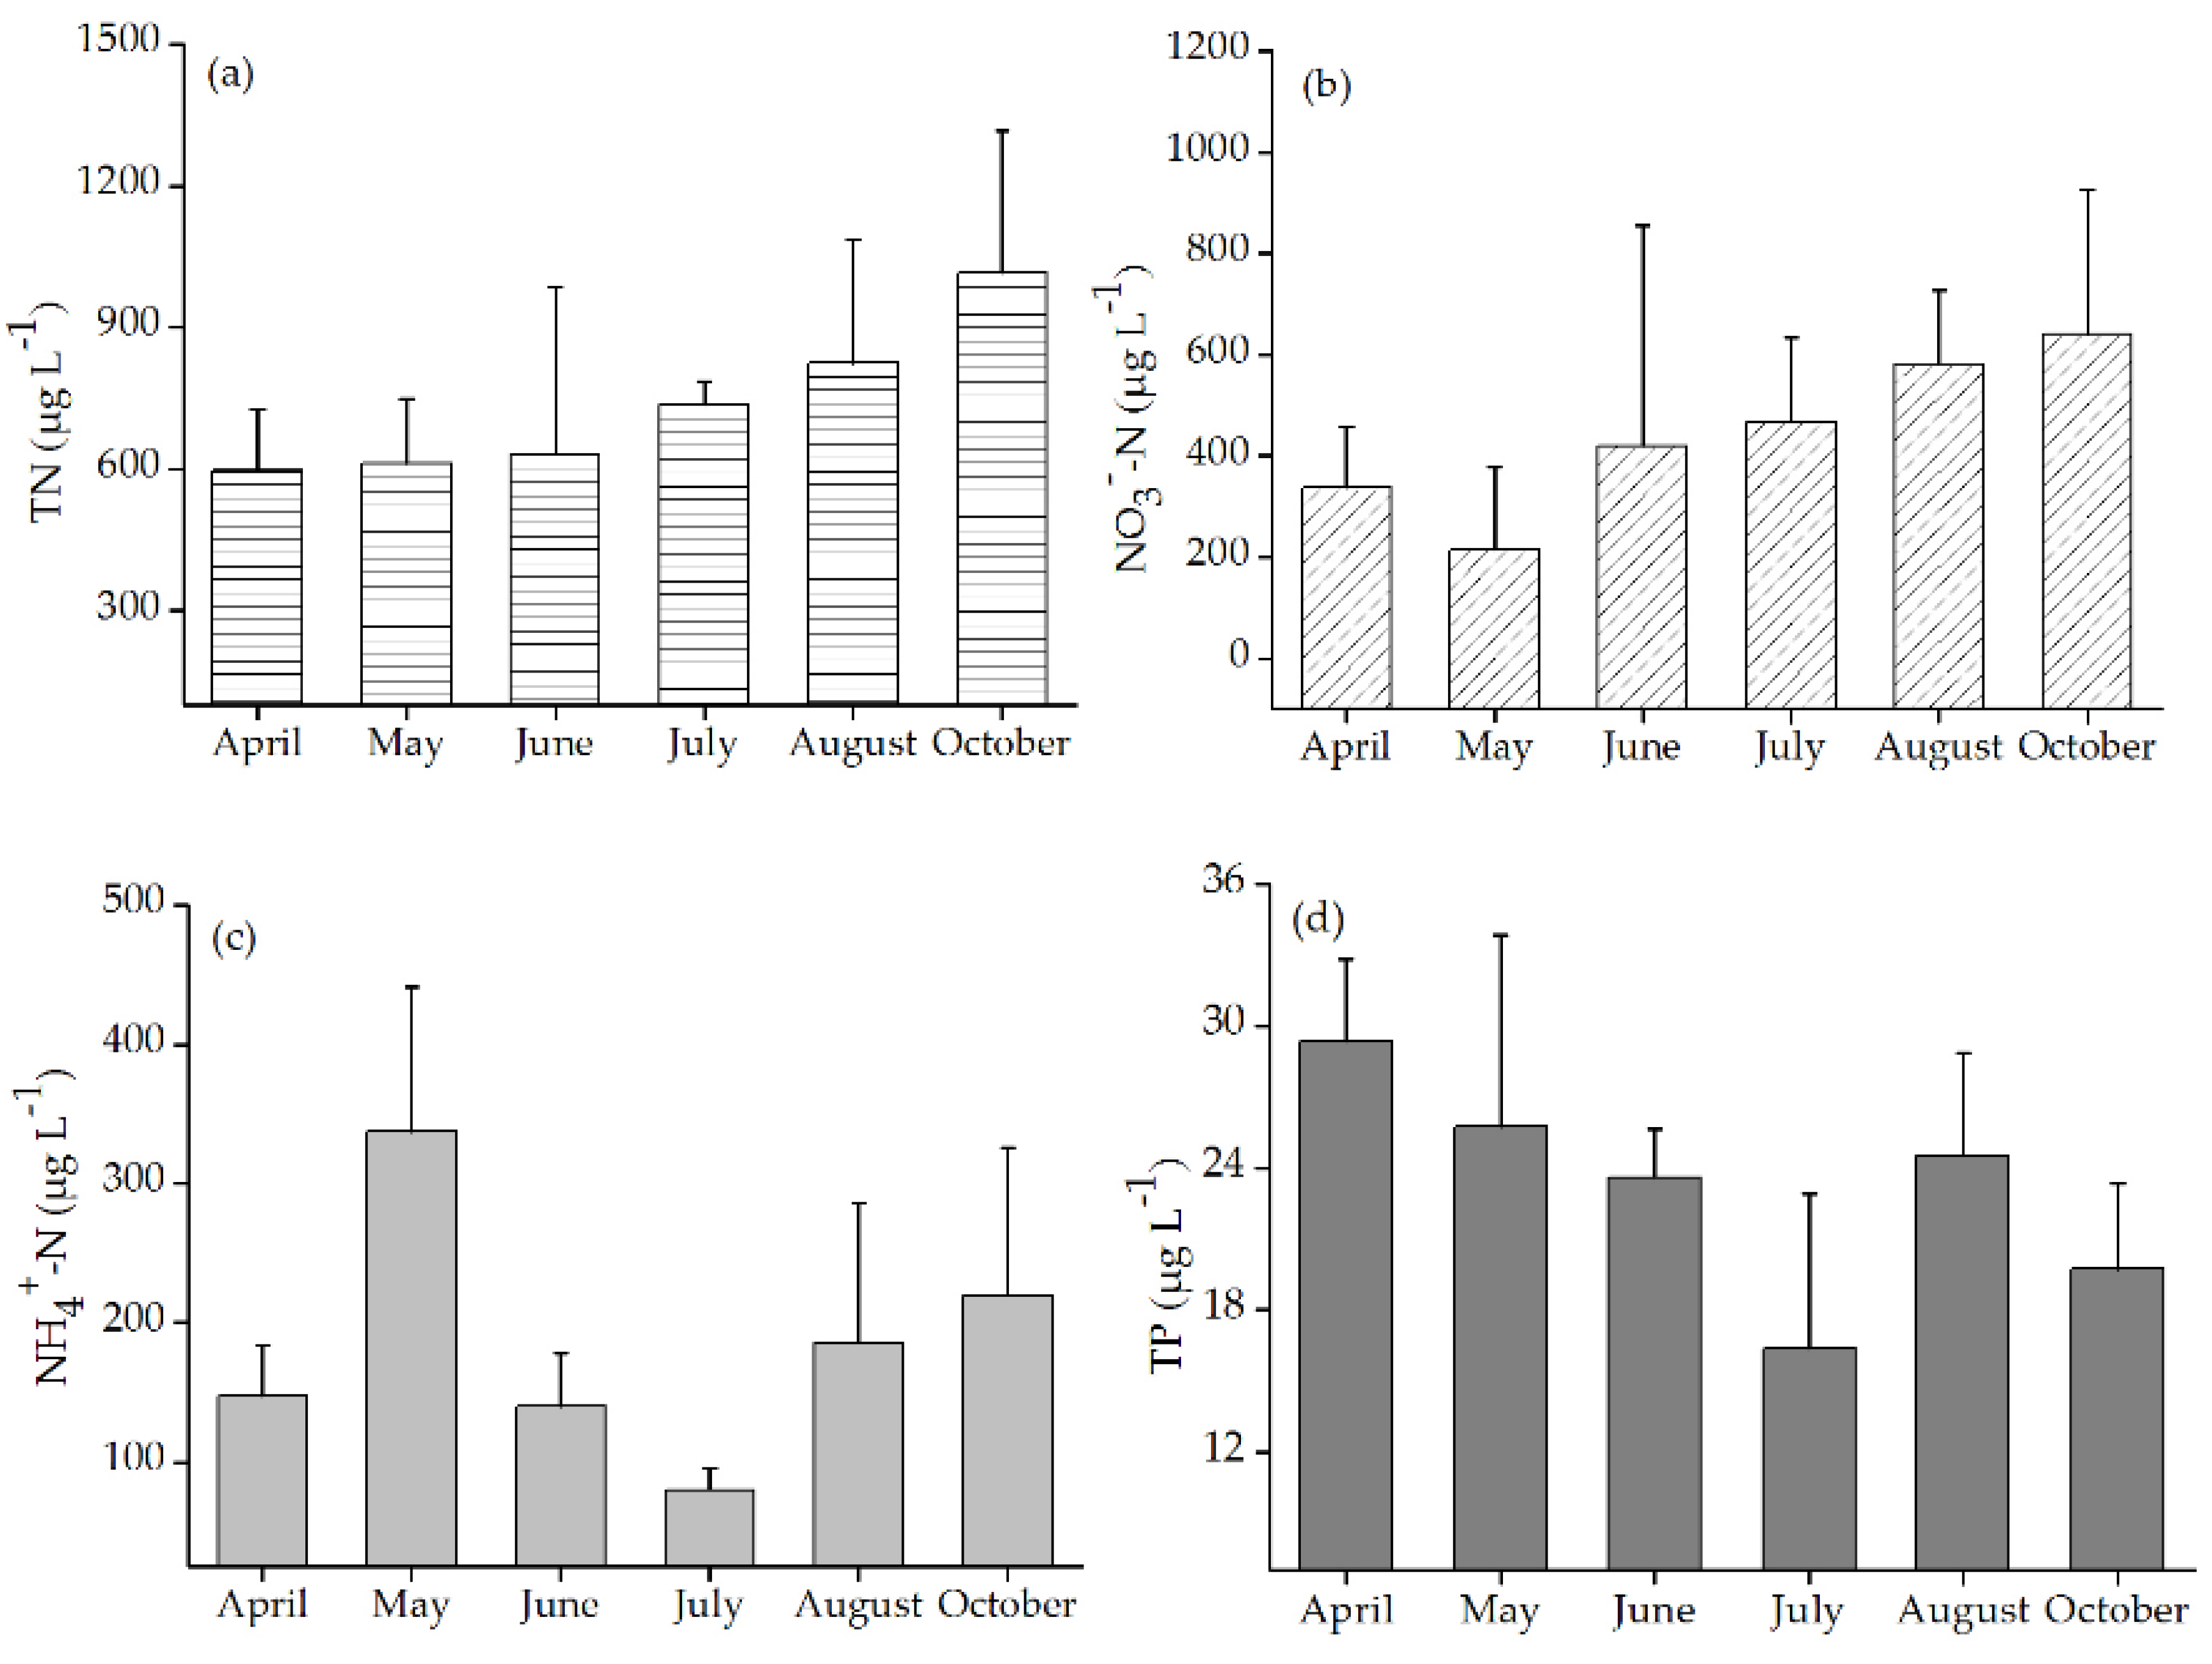
Figure 6.
The ratio of dissolved inorganic nitrogen (DIN):TN in groundwater from April to October (no data for September) in 2016 and in October 2015 in the upper Shule River basin.
Figure 6.
The ratio of dissolved inorganic nitrogen (DIN):TN in groundwater from April to October (no data for September) in 2016 and in October 2015 in the upper Shule River basin.
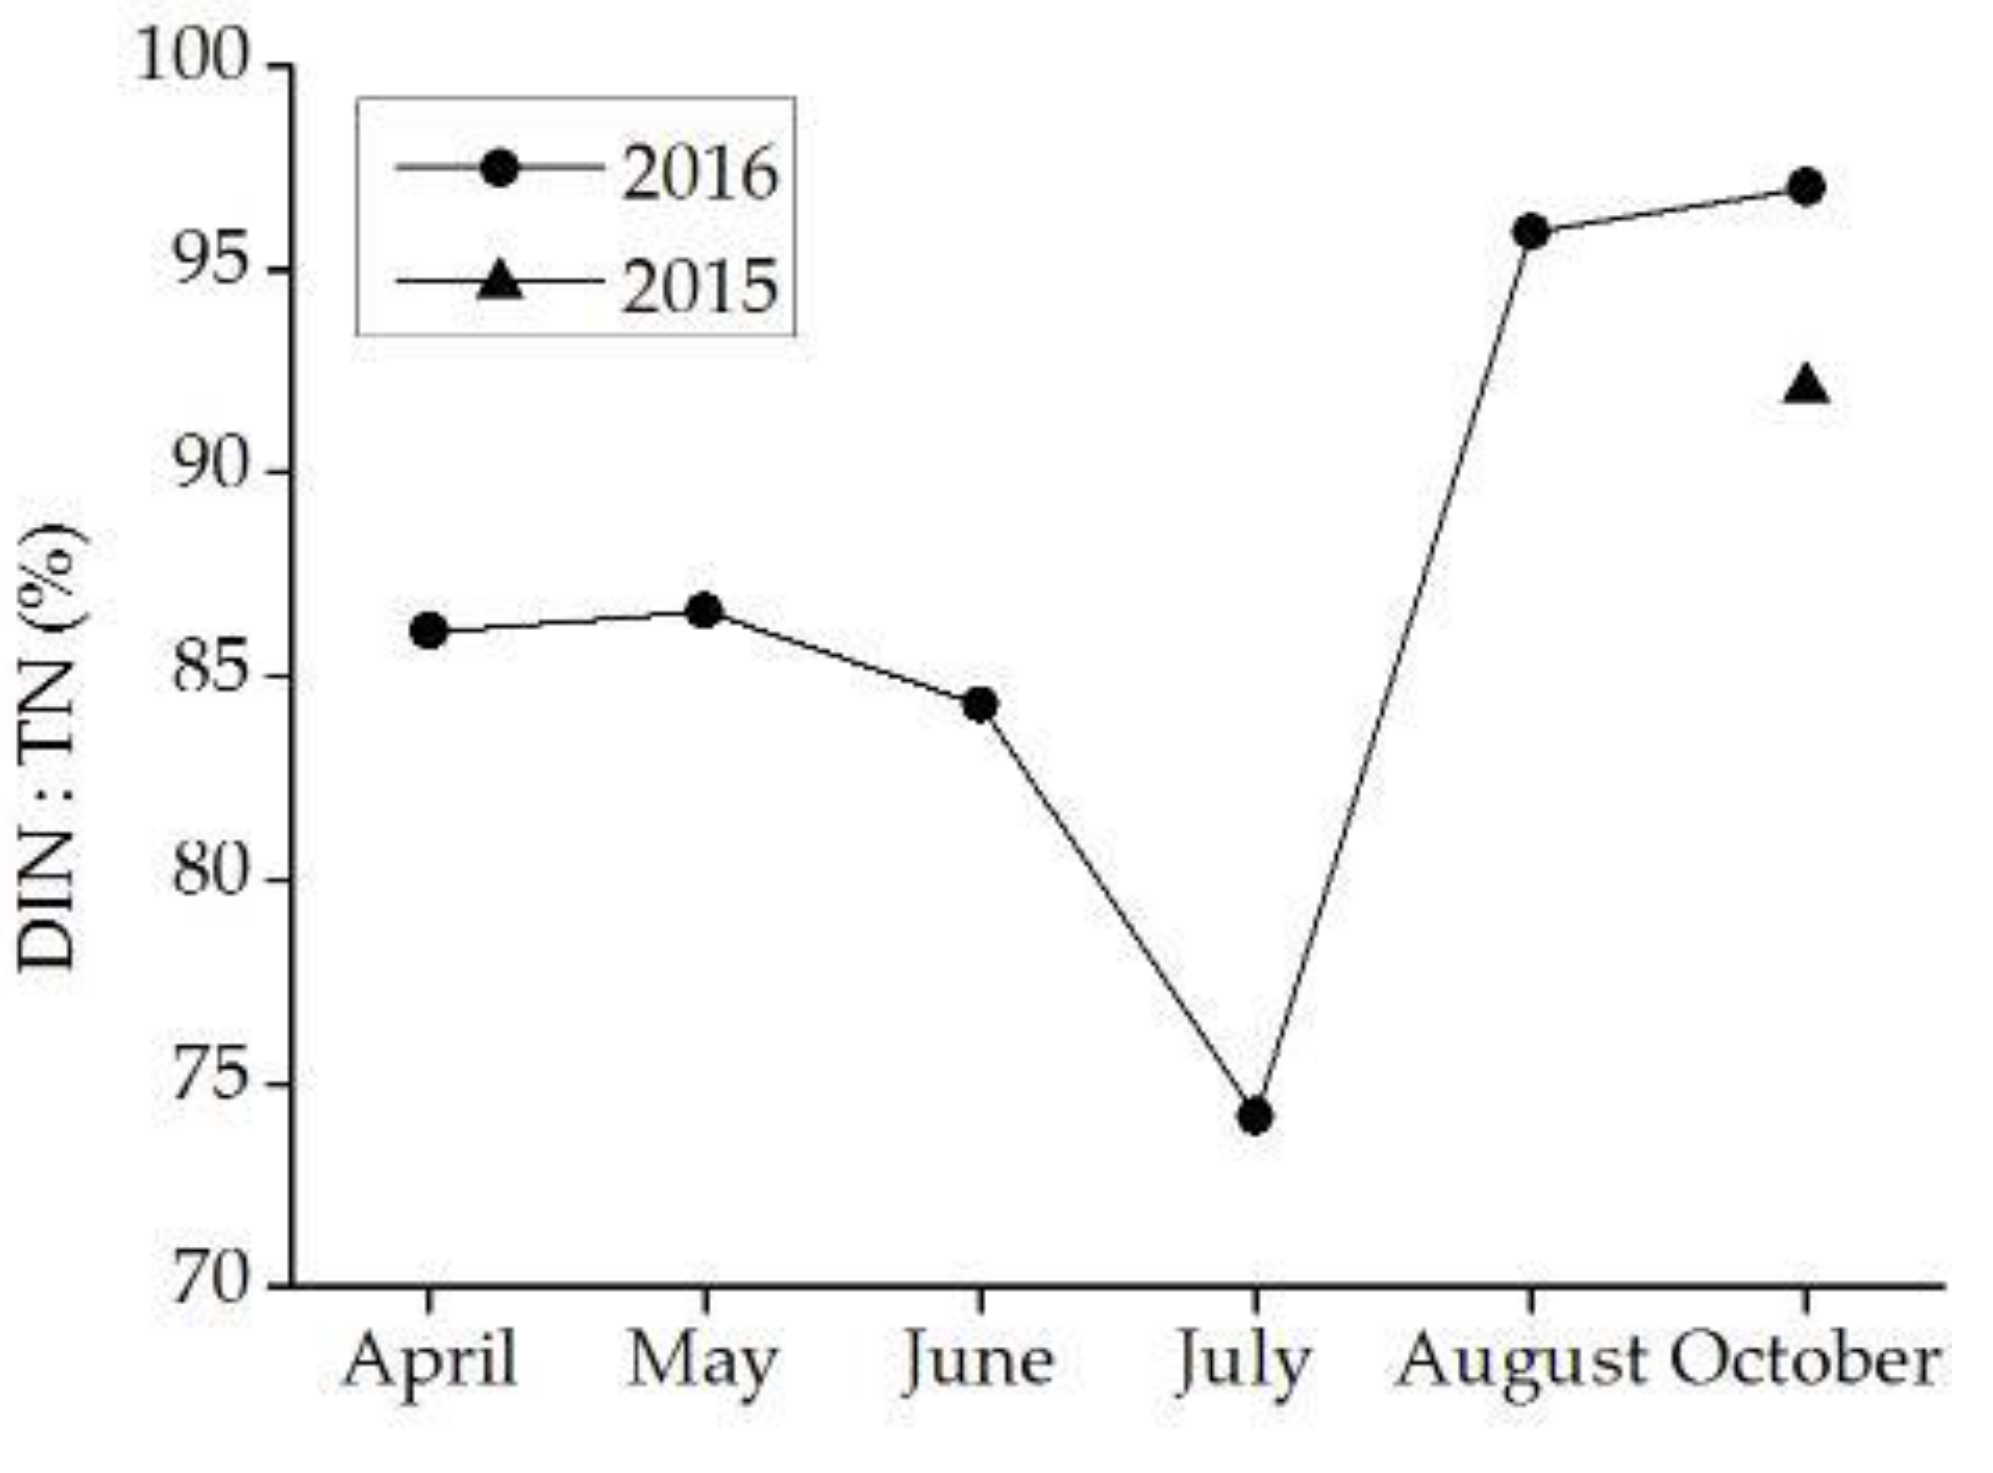
Figure 7.
Variation of TN-NO3−-N (a) and TN-NH4+-N (b) concentrations in stream water in 2016 at the sampling site D2.
Figure 7.
Variation of TN-NO3−-N (a) and TN-NH4+-N (b) concentrations in stream water in 2016 at the sampling site D2.
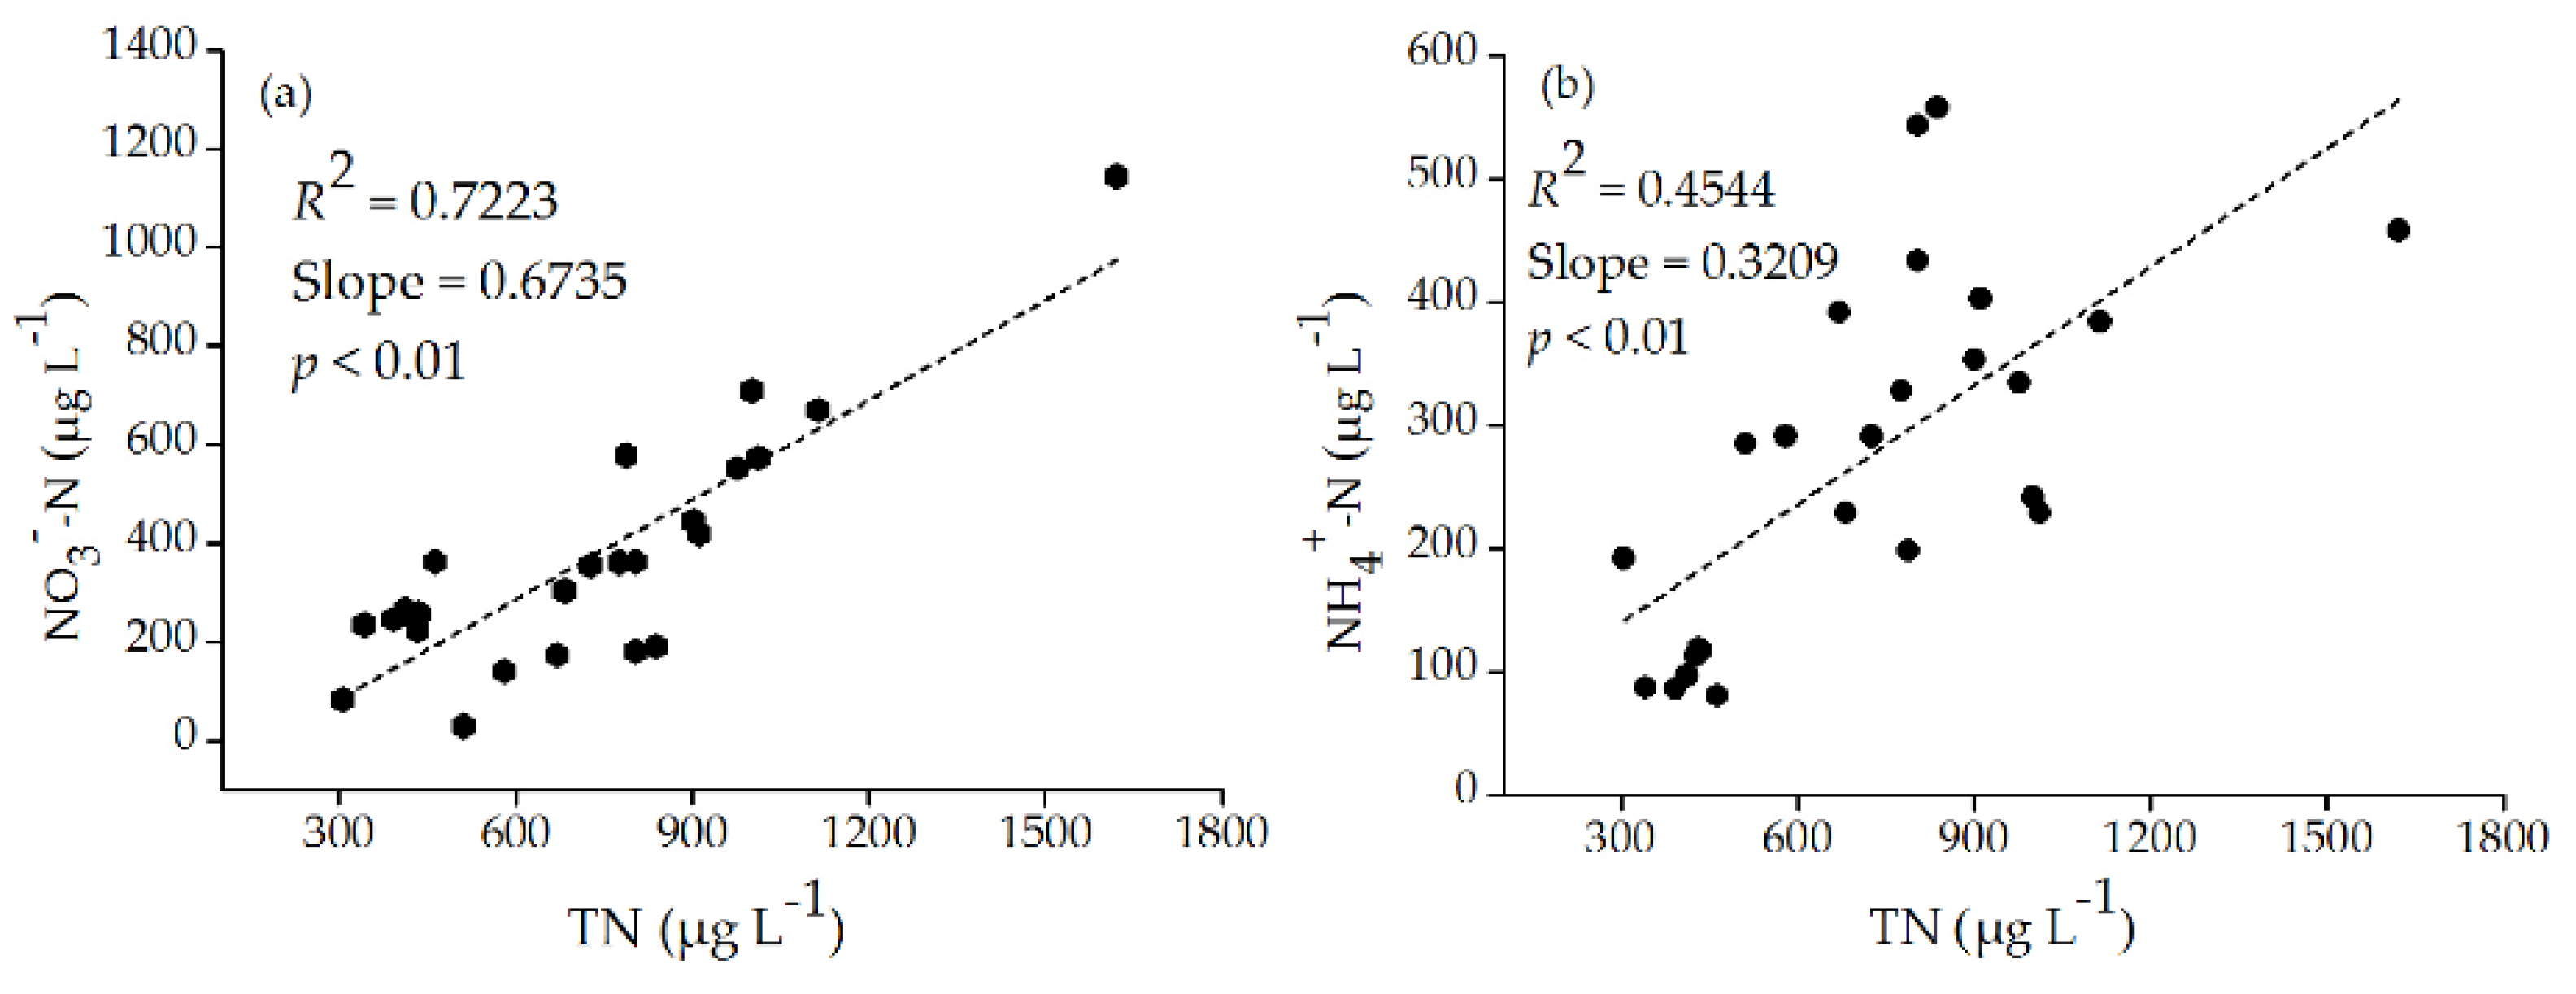
Figure 8.
Variation of TN (a), NO3−-N (b), NH4+-N (c) and TP (d) concentrations in stream water in 2016 at the sampling site D2 from April to October (no data for September) in the upper Shule River basin.
Figure 8.
Variation of TN (a), NO3−-N (b), NH4+-N (c) and TP (d) concentrations in stream water in 2016 at the sampling site D2 from April to October (no data for September) in the upper Shule River basin.
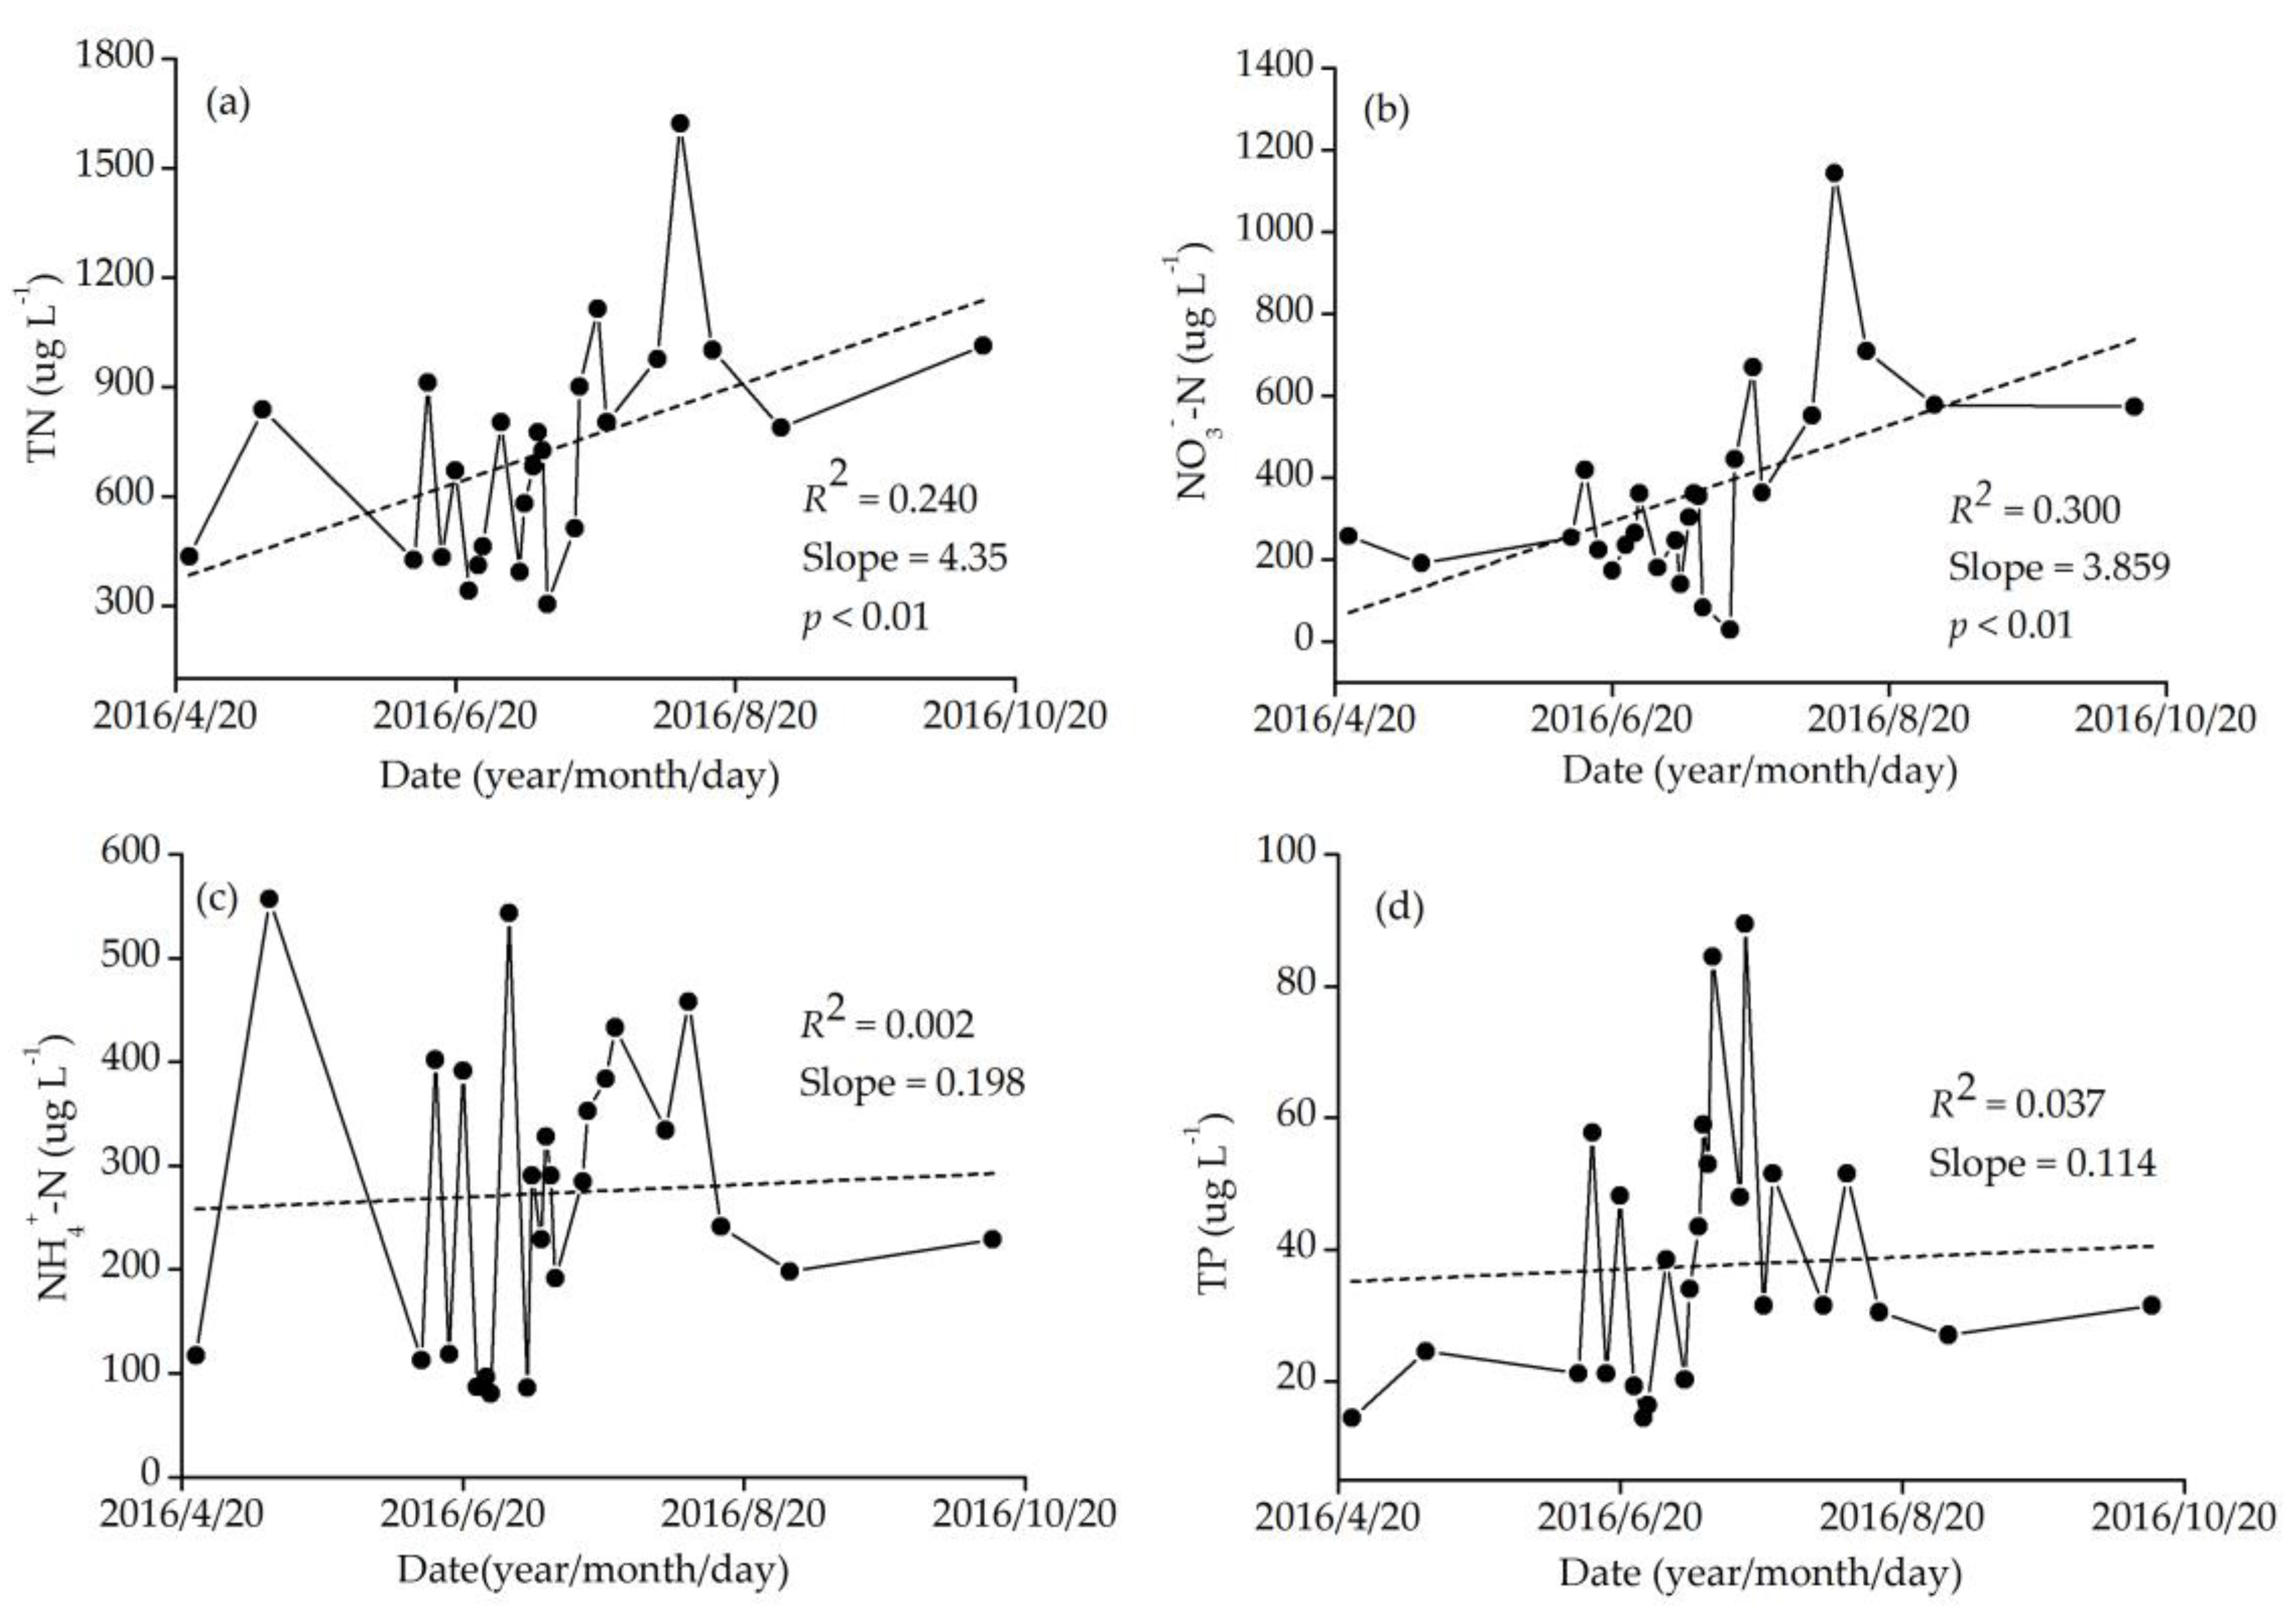
Figure 9.
The Box-whisker plots of monthly TN (a), NO3−-N (b), NH4+-N (c) and TP (d) concentrations in stream water from April to October (no data for September) in 2016 in the upper Shule River basin. The cross represents maximum value. If the cross is not in the whisker, it is an outlier. Triangle is an outlier.
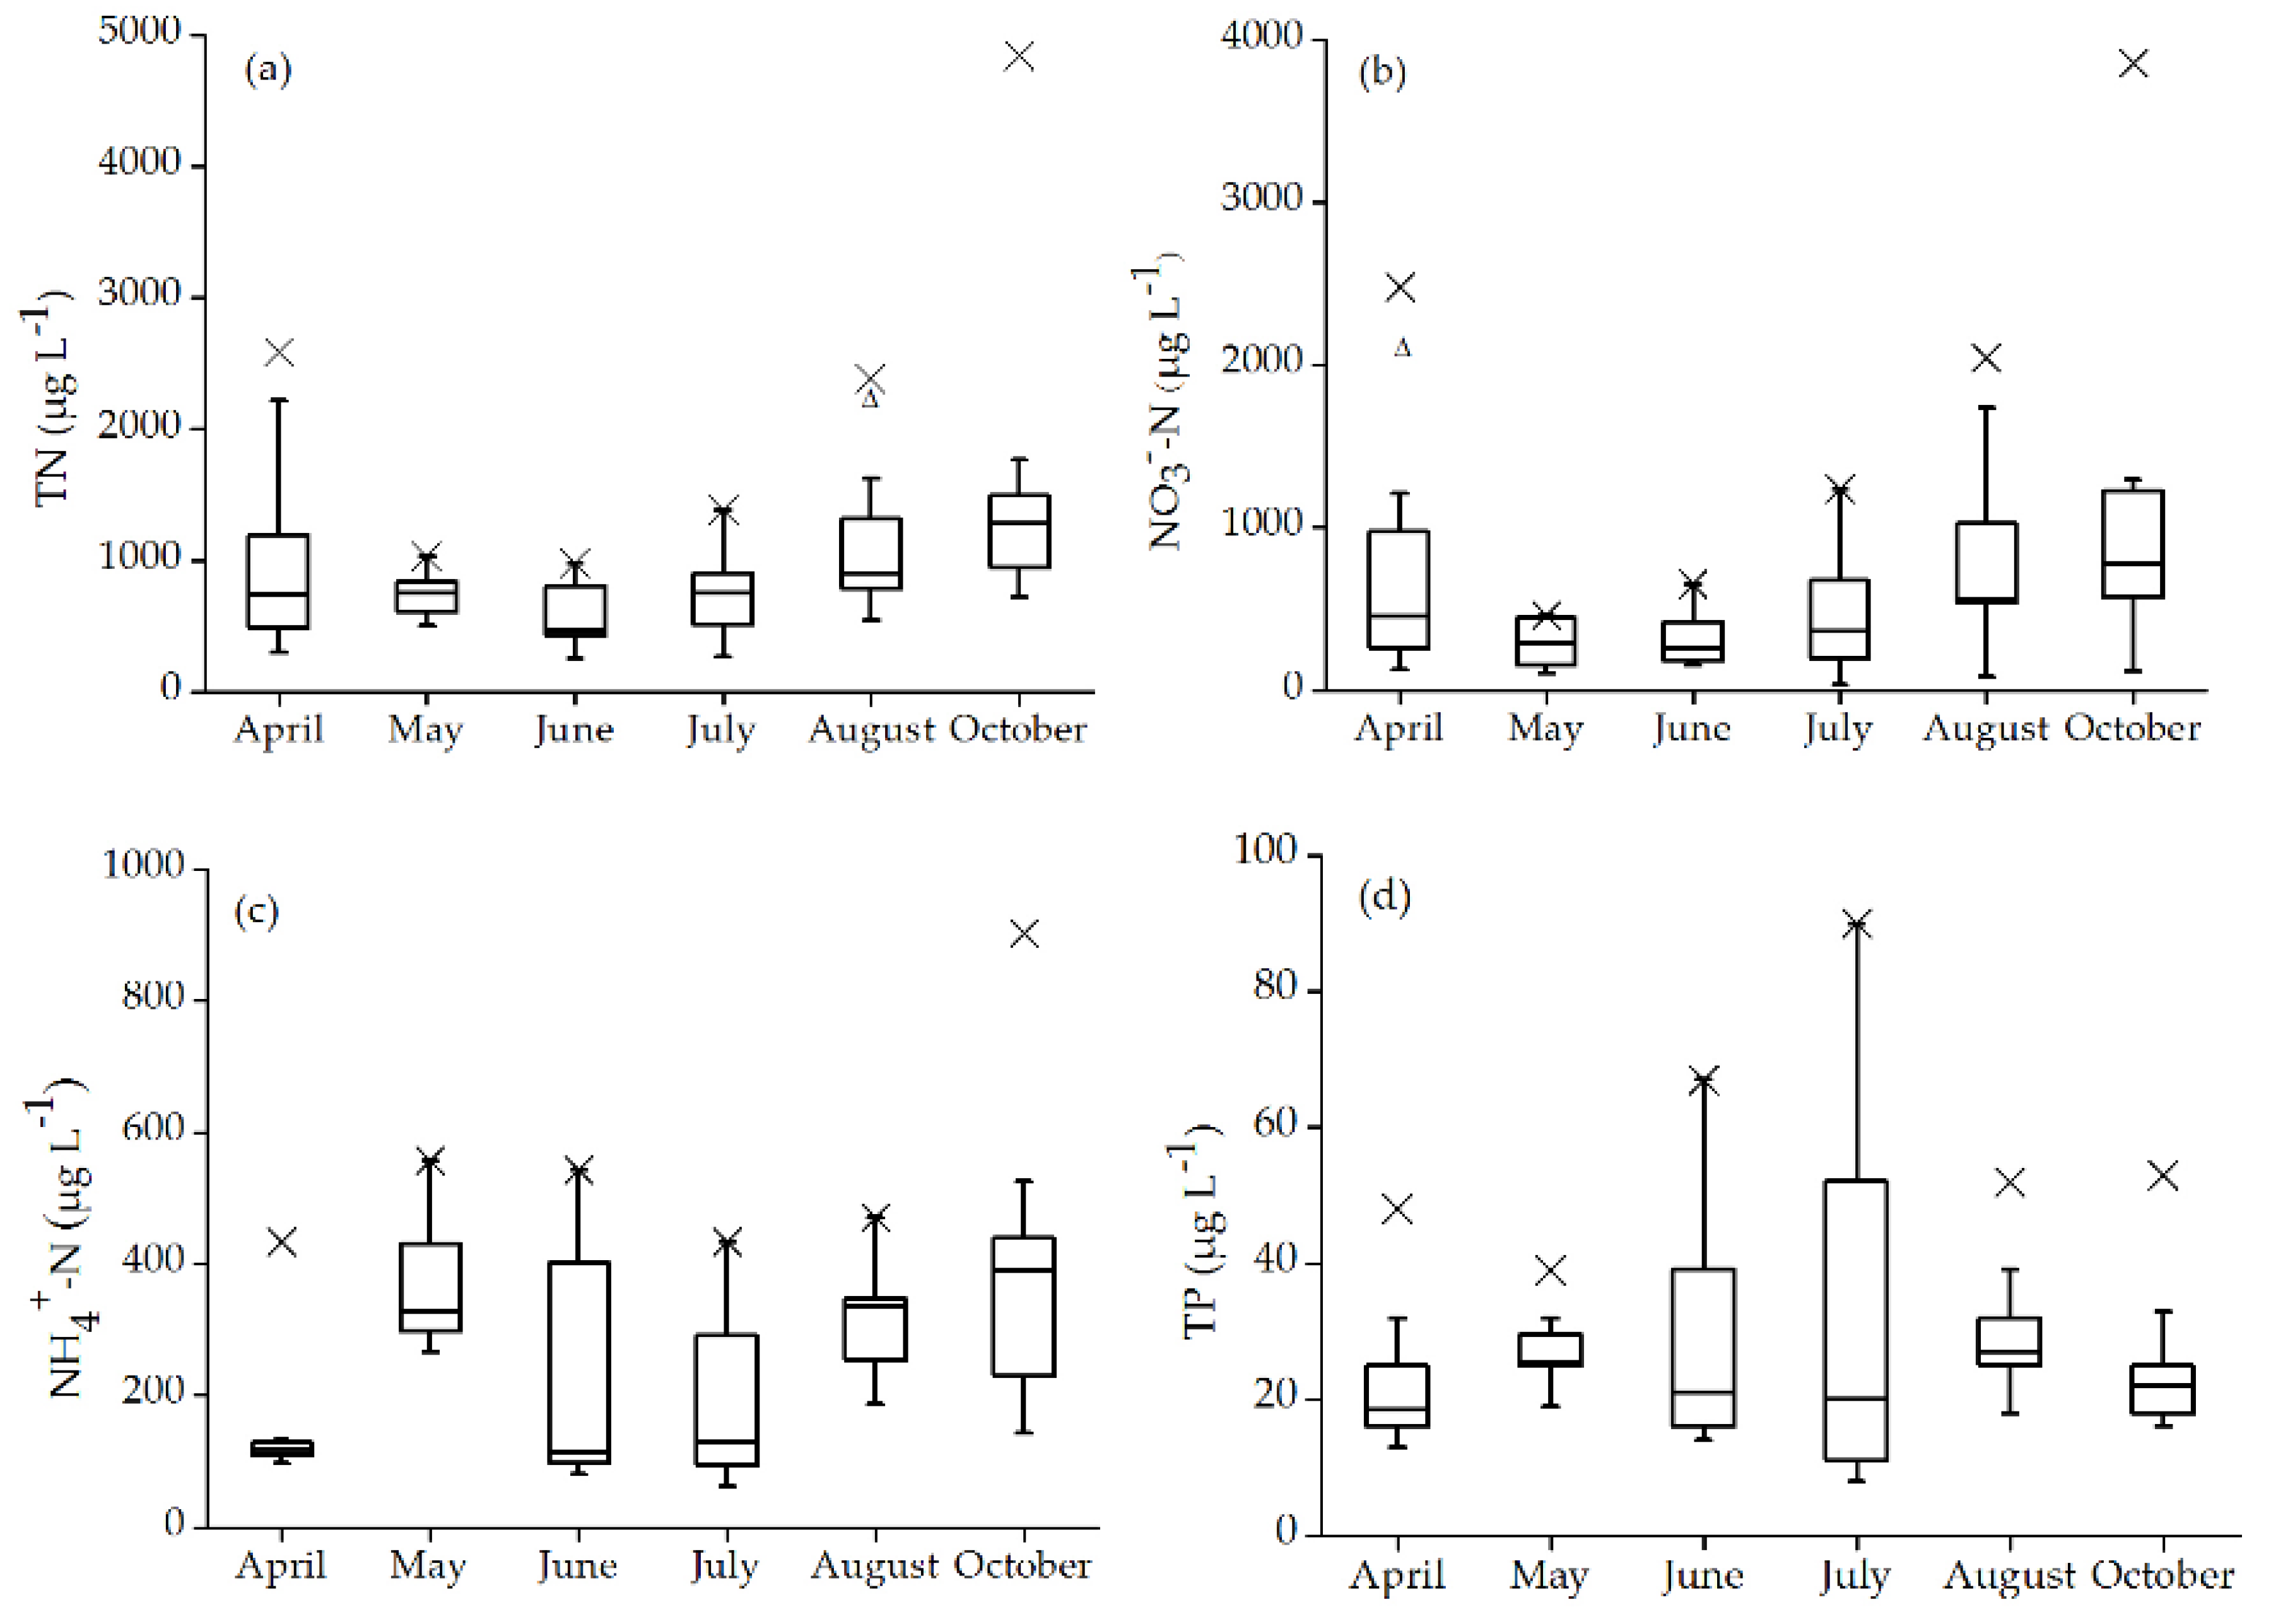
Figure 10.
The relationship between soil nutrients and stream water nutrients though the sampling locations are close to each other in 2016 in the upper Shule River basin.
Figure 10.
The relationship between soil nutrients and stream water nutrients though the sampling locations are close to each other in 2016 in the upper Shule River basin.
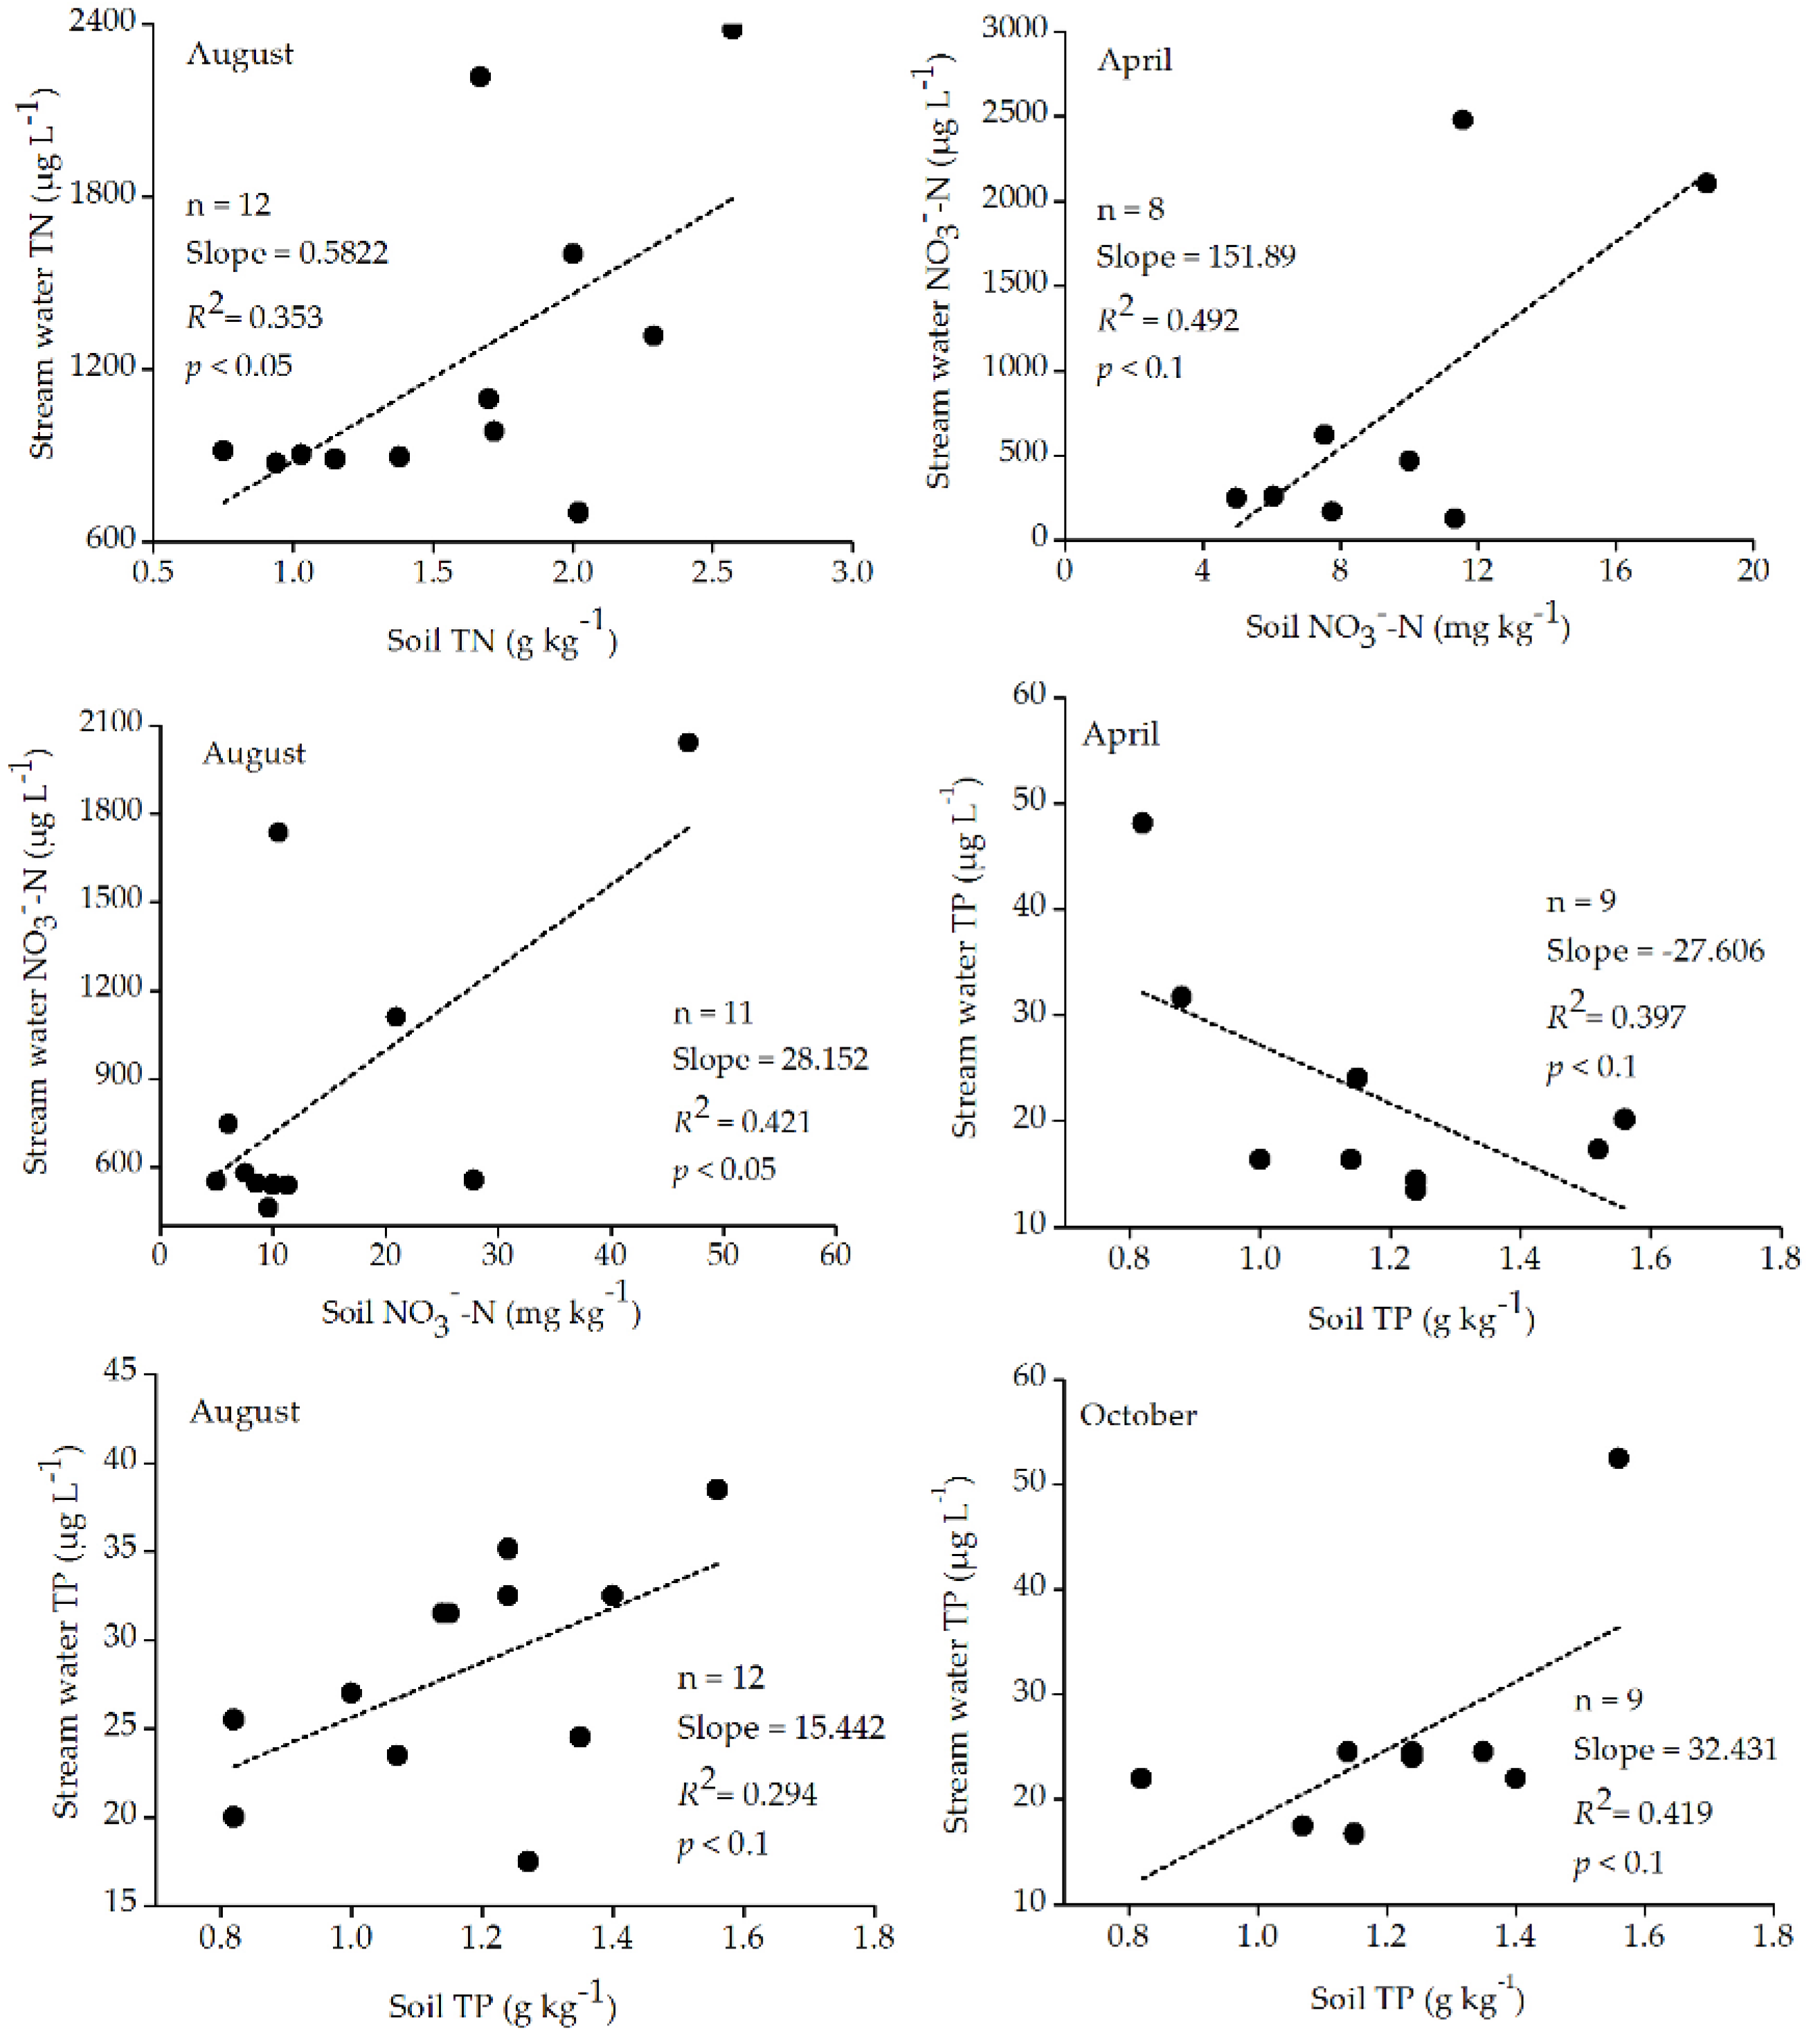
Figure 11.
The liner correlation of TN (a), NO3−-N (b), NH4+-N (c) and TP (d) between stream water and groundwater in 2016. The dash line is the 1:1 line, and the solid line is the fit linear. (G1/Jun: G1 is sampling location, and June is observed month).
Figure 11.
The liner correlation of TN (a), NO3−-N (b), NH4+-N (c) and TP (d) between stream water and groundwater in 2016. The dash line is the 1:1 line, and the solid line is the fit linear. (G1/Jun: G1 is sampling location, and June is observed month).

Figure 12.
Spatial distribution of monthly TN (a), NO3−-N (b), NH4+-N (c) and TP (d) concentrations in stream water from April to October (no data for September) in 2016.
Figure 12.
Spatial distribution of monthly TN (a), NO3−-N (b), NH4+-N (c) and TP (d) concentrations in stream water from April to October (no data for September) in 2016.

Table 1.
Summary of samples collected in the upper Shule River basin.
| Sample Type | Number of Samples | Sampling Time | Analyzed Species |
|---|---|---|---|
| Stream water | 88 | 23/4/2016–17/10/2016 | TN, TP, NO3−-N and NH4+-N |
| Groundwater | 20 | 23/4/2016–17/10/2016 | TN, TP, NO3−-N and NH4+-N |
| Groundwater | 3 | October 2015 | TN, TP, NO3−-N and NH4+-N |
| Rainfall | 24 | 5/7/2016–3/8/2016 | NO3−-N and NH4+-N |
| Surface snow | 31 | January–September 2015 | TN, TP, NO3−-N and NH4+-N |
| Soil | 18 | April–May 2016 | Soil mechanical composition (SMC) and nutrients |
Table 2.
Pearson correlation coefficient matrices of soil nutrients (soil organic carbon (SOC), total nitrogen (STN), total phosphorus (STP), total carbon (STC)) and altitude in 2016 in the upper Shule River basin.
Table 2.
Pearson correlation coefficient matrices of soil nutrients (soil organic carbon (SOC), total nitrogen (STN), total phosphorus (STP), total carbon (STC)) and altitude in 2016 in the upper Shule River basin.
| SOC | STN | STP | STC | NH4+-N | NO3−-N | Altitude | |
|---|---|---|---|---|---|---|---|
| N = 18 | |||||||
| SOC | 1 | ||||||
| STN | 0.954 ** | 1 | |||||
| STP | 0.442 | 0.496 * | 1 | ||||
| STC | 0.322 | 0.442 | 0.257 | 1 | |||
| NH4+-N | 0.483 * | 0.446 | −0.199 | 0.189 | 1 | ||
| NO3−-N | 0.715 ** | 0.708 ** | 0.167 | 0.536 * | 0.717 ** | 1 | |
| Altitude | 0.334 | 0.249 | −0.128 | −0.476 * | 0.289 | 0.042 | 1 |
Note: ** indicates a significant correlation at the 0.01 level; * indicates a significant correlation at the 0.05 level. Soil organic carbon (SOC), total nitrogen (STN), total phosphorus (STP), total carbon (STC).
Table 3.
Median and standard deviation nutrient concentrations in surface snow, rainfall, groundwater and stream water in 2016 in the upper Shule River basin.
Table 3.
Median and standard deviation nutrient concentrations in surface snow, rainfall, groundwater and stream water in 2016 in the upper Shule River basin.
| Sample Type | TN | NO3−-N | NH4+-N | TP |
|---|---|---|---|---|
| μg L−1 | μg L−1 | μg L−1 | μg L−1 | |
| Surface snow | 800 ± 491 | 305 ± 439 | 377 ± 145 | 26 ± 9 |
| Rainfall | 1490 ± 1517 | 45 ± 49 | ||
| Groundwater | 746 ± 257 | 511 ± 261 | 176 ± 107 | 25 ± 6 |
| Stream water (D2) | 726 ± 327 | 303 ± 287 | 284 ± 140 | 32 ± 20 |
| Stream water | 815 ± 623 | 459 ± 582 | 253 ± 152 | 25 ± 16 |
© 2018 by the authors. Licensee MDPI, Basel, Switzerland. This article is an open access article distributed under the terms and conditions of the Creative Commons Attribution (CC BY) license (http://creativecommons.org/licenses/by/4.0/).
Share and Cite
MDPI and ACS Style
Pu, H.; Ding, Y.; Han, T.; Liu, F. Spatiotemporal Variation of Nutrient Concentrations in the Upper Shule River Basin, the Qinghai-Tibetan Plateau, China. Water 2018, 10, 366. https://doi.org/10.3390/w10040366
AMA Style
Pu H, Ding Y, Han T, Liu F. Spatiotemporal Variation of Nutrient Concentrations in the Upper Shule River Basin, the Qinghai-Tibetan Plateau, China. Water. 2018; 10(4):366. https://doi.org/10.3390/w10040366
Chicago/Turabian StylePu, Hongzheng, Yongjian Ding, Tianding Han, and Fengjing Liu. 2018. "Spatiotemporal Variation of Nutrient Concentrations in the Upper Shule River Basin, the Qinghai-Tibetan Plateau, China" Water 10, no. 4: 366. https://doi.org/10.3390/w10040366
Note that from the first issue of 2016, this journal uses article numbers instead of page numbers. See further details here.