1. Introduction
Districted metered areas (DMAs) play an essential role in water distribution system (WDS) management, such as pressure management, leakage reduction, and water quality incident control [
1,
2,
3,
4]. Many partitioning methods are available to divide the water distribution network into isolated DMAs, whose inlets and outlets can be monitored with flow and pressure meters. However, there is a lack of understanding in the performance of various partitioning methods, which will be investigated in this paper.
The partitioning methods have stemmed from, and advanced, the field of complex networks [
5,
6]. The water distribution network—a typical complex network—is usually constructed under the ground and along the road and provides drinking water to communities and cities. The network layouts are usually shaped by the community characteristics, such as geography and building distribution. The more developed the community is, the denser the connections (pipes) are in a community. The early research regarding network partitioning focuses on detecting the community structures [
7,
8]. This type of method is based on the modularity index, which is maximized using an optimization algorithm (e.g., greedy algorithm [
9]) and able to quantify the network partitioning performance by the number of links and the degree of nodes [
10].
Recent research has focused on the development of topology-based partitioning methods (e.g., graph theory, Metis, and Random Walk) to consider more network attributes. Most recently, Perelman et al. [
3] developed a network partitioning approach from a practical perspective, in which the distribution network is partitioned based on the backbone transmission pipes identified in the first step. The Metis partitioning method [
11] was used to divide the network topology into DMAs. Moreover, the water sources should be regarded as the main control elements for network partitioning [
12] so that the source supply areas have the least influence on the hydraulic performance of the isolated zones and the finer communities are further divided by a graph partitioning method. Wright et al. [
13] introduced the concept of dynamically-controlled DMAs for burst identification and leakage estimation, and it can be used to improve system resilience to permanent valve closures. The Walktrap algorithm, which is also referred to as Random Walk [
14,
15], was used to trap the walker in the dense cluster, and partition the water distribution network accordingly [
16]. The aforementioned studies are the straightforward applications to network partitioning, however, the mechanism, characteristic, and applicability of the graphical partitioning methods (i.e., Metis, Random Walk) are not properly addressed. Moreover, there is no comprehensive comparison of the various topology partitioning algorithms and, therefore, it is difficult to determine which algorithm is more suitable and, thus, should be used for WDS partitioning in practice.
Network partitioning can be assessed using hydraulic indicators and topological indicators. Additionally, economic criteria can also be used to consider the costs and benefits involved by the reconstruction and installation of partitioning but the difficulty lies in data availability. The hydraulic indicators used in the literature include resilience index, water age, entropy, and pressure-related performance index [
12], however, this involves the use of a hydraulic model for assessment [
17]. Topological indicators are normally easy for computation and use, thus, a spectrum of topological indicators are used in this study, including the most commonly used modularity index.
This paper aims to compare three widely used partitioning methods, including Fast Greedy [
9], Random Walk [
15], and Metis [
18], using a spectrum of topology-based indicators. Note that heuristic partitioning methods are also popular in water network partitioning [
19], however, they are not investigated in this study since they are more customized for specific water networks with problem domain knowledge required. In comparison, graphical partitioning methods (i.e., Fast Greedy, Random Walk, and Metis), developed from fundamental graphical theories, are easier to use and can be applied to any WDS networks, thus, they are investigated in this study for network partitioning. A water distribution network, EXNET [
20], is investigated with two cases: weighted and unweighted graphs. The advantage and disadvantage of the partitioning algorithms are discussed to support their application to the water distribution network.
2. Partitioning Methods
A complex network can be represented by an undirected graph , where V is a set of vertices which indicates the nodes in the network, and E notes a set of edges, representing pipes and other link elements in a hydraulic model, such as valves and pumps. Cluster, which represents a group of edges and vertices, is commonly used in the graph analysis, while community in the water distribution network is the cluster of pipes and nodes. In this paper, the terms—cluster and community—are used interchangeably.
2.1. Fast Greedy
The Fast Greedy partitioning method, developed by Clauset et al. [
9], is a modularity-based topology analysis method. The modularity is a measure of the strength of the network partitioning to clusters (i.e., communities). It is based on a modularity function, which is optimized to find the best cluster of a water distribution network. The modularity function is formulated as:
where
M is the modularity value;
m is the number of edges in the graph;
Avw is an element of adjacency matrix of the network,
Avw = 1 when vertices
v and
w are connected, otherwise
Avw = 0;
kv is the degree of a vertex
v and is defined as the number of edges connected to it,
.
cv and
cw are the identifiers of a network cluster.
δ is the function of the summation of the same clusters (if
cv =
cw, then
δ = 1, and otherwise
δ = 0). Maximizing
M implies maximization of the intra-links in a community and minimization of the inter-links between communities. The higher value of the modularity, the better the solution of the partitioning in the network.
The Fast Greedy partitioning method uses a greedy optimization approach to maximize the modularity function, as shown in
Figure 1. Each vertex represents a single community at the initial step. Then it attempts to combine any two linking communities together, with an aim to maximizing the modularity value. The combination process is repeated until the network merges to one community. The Fast Greedy partitioning method improves its computational efficiency through storing only those pairs of communities that are linked by one or more edges, instead of manipulating the entire sparse matrix. The new matrix with the efficient data structure tracks the linking communities that can potentially increase in the modularity value. Therefore, the computational time and memory can be substantially reduced. A more detailed description with respect to the Fast Greedy method can be found in the studies by Clauset et al. [
9], Vincent et al. [
5], and Fortunato [
21].
2.2. Random Walk
The Random Walk partitioning method relies on the fact that the walker can be retained in a part of densely-connected networks (i.e., a cluster) as much as possible before leaving for another cluster. An infinite random walk is quantified by the map equation, which is the average number of bits per step in the clusters of the network [
14]:
where
represents the probability of the walker switching the clusters per step,
.
is the probability of the walk running out of the cluster
i per step.
is calculated to weight the movements within cluster
i,
, where
α is the node in the cluster
i and
is the visit frequency at node
α.
and
are the probability-weighted average length of the walk in the network and in the cluster
i, respectively.
and
are quantified by Shannon’ entropy [
22].
is the entropy of movements between the clusters:
The entropy of movements within cluster
i is:
The random walk presents that the walker (i.e., a random moving point) is able to linger in a relatively isolated area (i.e., with dense links) longer than the sparse network. That is because, in dense communities, there are fewer routes to move outside of the communities, which matches the concept of the network partitioning. The map equation (Equation (2)) has two terms to represent the average numbers of bits to quantify the movements in the clusters and between clusters, respectively. The variables of node visit probability
pα and the leaving probability
in the map equation are updated in each step during an optimization process. The smaller value of the map equation is desirable and, thus, the minimization problem associated with map equation is formulated. The problem is solved by a deterministic greedy search algorithm and then the solutions are refined (i.e., the description length of the walk in the clusters) by the simulated annealing algorithm. More details regarding the random walk method can be found in the follow studies [
15,
23,
24].
2.3. Metis
The Metis partitioning method [
18] uses a k-way (i.e., k clusters) partitioning method to minimize the number of cuts (i.e., links between two clusters), while maintaining the balance of the clusters. The partitioning process consists of coarsening, partitioning, and uncoarsening phases, as explained below.
- (1)
Coarsening Phase. The coarsening phase is to combine the incident vertices and form an updated graph that includes a smaller number of vertices. The modified Heavy Edge Matching (mHEM) method [
18] is implemented to decrease the average degree of coarser graphs by finding the edges with the maximum weights. Hence, the total weight of the edges in a coarser graph is reduced by the maximal matching.
- (2)
Partitioning Phase. This phase is realized by a high-quality bisection process in which the graph is divided into two parts of approximately equal weights. The Kernighan-Lin algorithm [
25] is used in the partitioning phase. In the Kernighan-Lin algorithm, the vertices on the boundary of either partitions attempting to be swapped to obtain a smaller number of edge cuts. If the swapping is accepted, the new clusters are formed and this process continues until no more improvement on the uniformity of clusters. Since the partitioning is implemented in a lumped graph after the coarsening phase, the time consumed by the partitioning is much less than in the original graph.
- (3)
Uncoarsening Phase. Based on the partitioning results obtained from the second phase, the coarser clusters are gradually projected back to the original graph. Due to the relative good partitioning results derived, the refinement phase is only implemented on the small number of vertices that link the different clusters. The modified Global Kernighan-Lin Refinement is proposed by Karypis and Kumar [
18], which enhances the capability of the partitioning refinement in order to escape the local optima.
The Metis method uses several heuristic approaches (i.e., swapping vertices and bisection method) to deal with the graph partitioning in a three-phase process. The heuristic that swaps the vertices at the rim of the clusters can save the computational time and is able to derive the good clusters. The swapping action is beneficial for balancing the adjacent the clusters in a straightforward way. These heuristics can improve the computational efficiency, avoiding manipulating a large scale matrix. The heuristic (swapping boundary nodes) is not a global search approach, hence, the resulting partitioning is not necessarily the global optimal solution. The detailed description of Metis can be found in the following studies [
18,
26].
3. Evaluation Indicators
The clusters derived from the topological partitioning methods above need to be evaluated to determine which method can derive a better WDS partitioning solution. Perelman et al. [
27] recommended to visually show the graphics of partitioning solutions, since the partitioning results and the linkage between communities can be seen intuitively. This helps the decision maker to understand the partitioning schemes and thus make an informed decision. Additionally, quantitative evaluation is usually conducted to examine the effect of the partitioning [
12,
28,
29]. In this paper, several indicators in the context of topological analysis are proposed to quantify the performance of partitioning methods.
Modularity is commonly used for DMA partitioning [
2,
30,
31], which gives a measure of the strength of network partitioning into modules (i.e., communities). The modularity indicator indicates the density of pipes in a community and the linkage between the communities. Therefore, the greater the modularity value, the more community-like the network. The modularity value is calculated using Equation (1).
Conductance represents the fraction of the total pipes that link to other pipes outside the community. The formula of the conductance indicator is given as:
where
cs is the number of edges on the boundary of a cluster, and
ms is the number of edges inside the cluster
S. These two variables are calculated as:
The conductance indicator for a given DMA is calculated for the incident pipes that link to other DMAs. The smaller the conductance value, the fewer the pipes link outside, thus, network partitions are more community-like.
Density is defined as the intra-cluster density, where ns is the number of nodes in S, . The density indicator delivers the information of the pipes’ sparseness in a cluster. It is the ratio of the number of edges in the cluster to maximal number of possible edges. The greater the density value, the higher the density of pipes inside the cluster, thus, the better the partitioning method.
Expansion measures the number of pipes per node that link outside the cluster. The expansion indicator is given as , where ns is the number of nodes in S. The smaller the expansion value, the less links expand to the outside clusters, thus, the network partitioning is preferred.
Cuts indicates the average number of pipes by which a cluster links to the other. This indicator denotes the number of valves or meters need to be installed for partitioning. The fewer number of cuts, the partitioning retrofit is more cost-saving.
Communication volume (CV) is a measure of the communication complexity amongst the clusters. Vb is the nodes at the cluster boundary, i.e., linking to other cluster(s). For each node , CV is the number of outside clusters that v is adjacent to. The CV value is smaller, the communication cost is lower, thus, the partitioning method is better.
4. Case Study
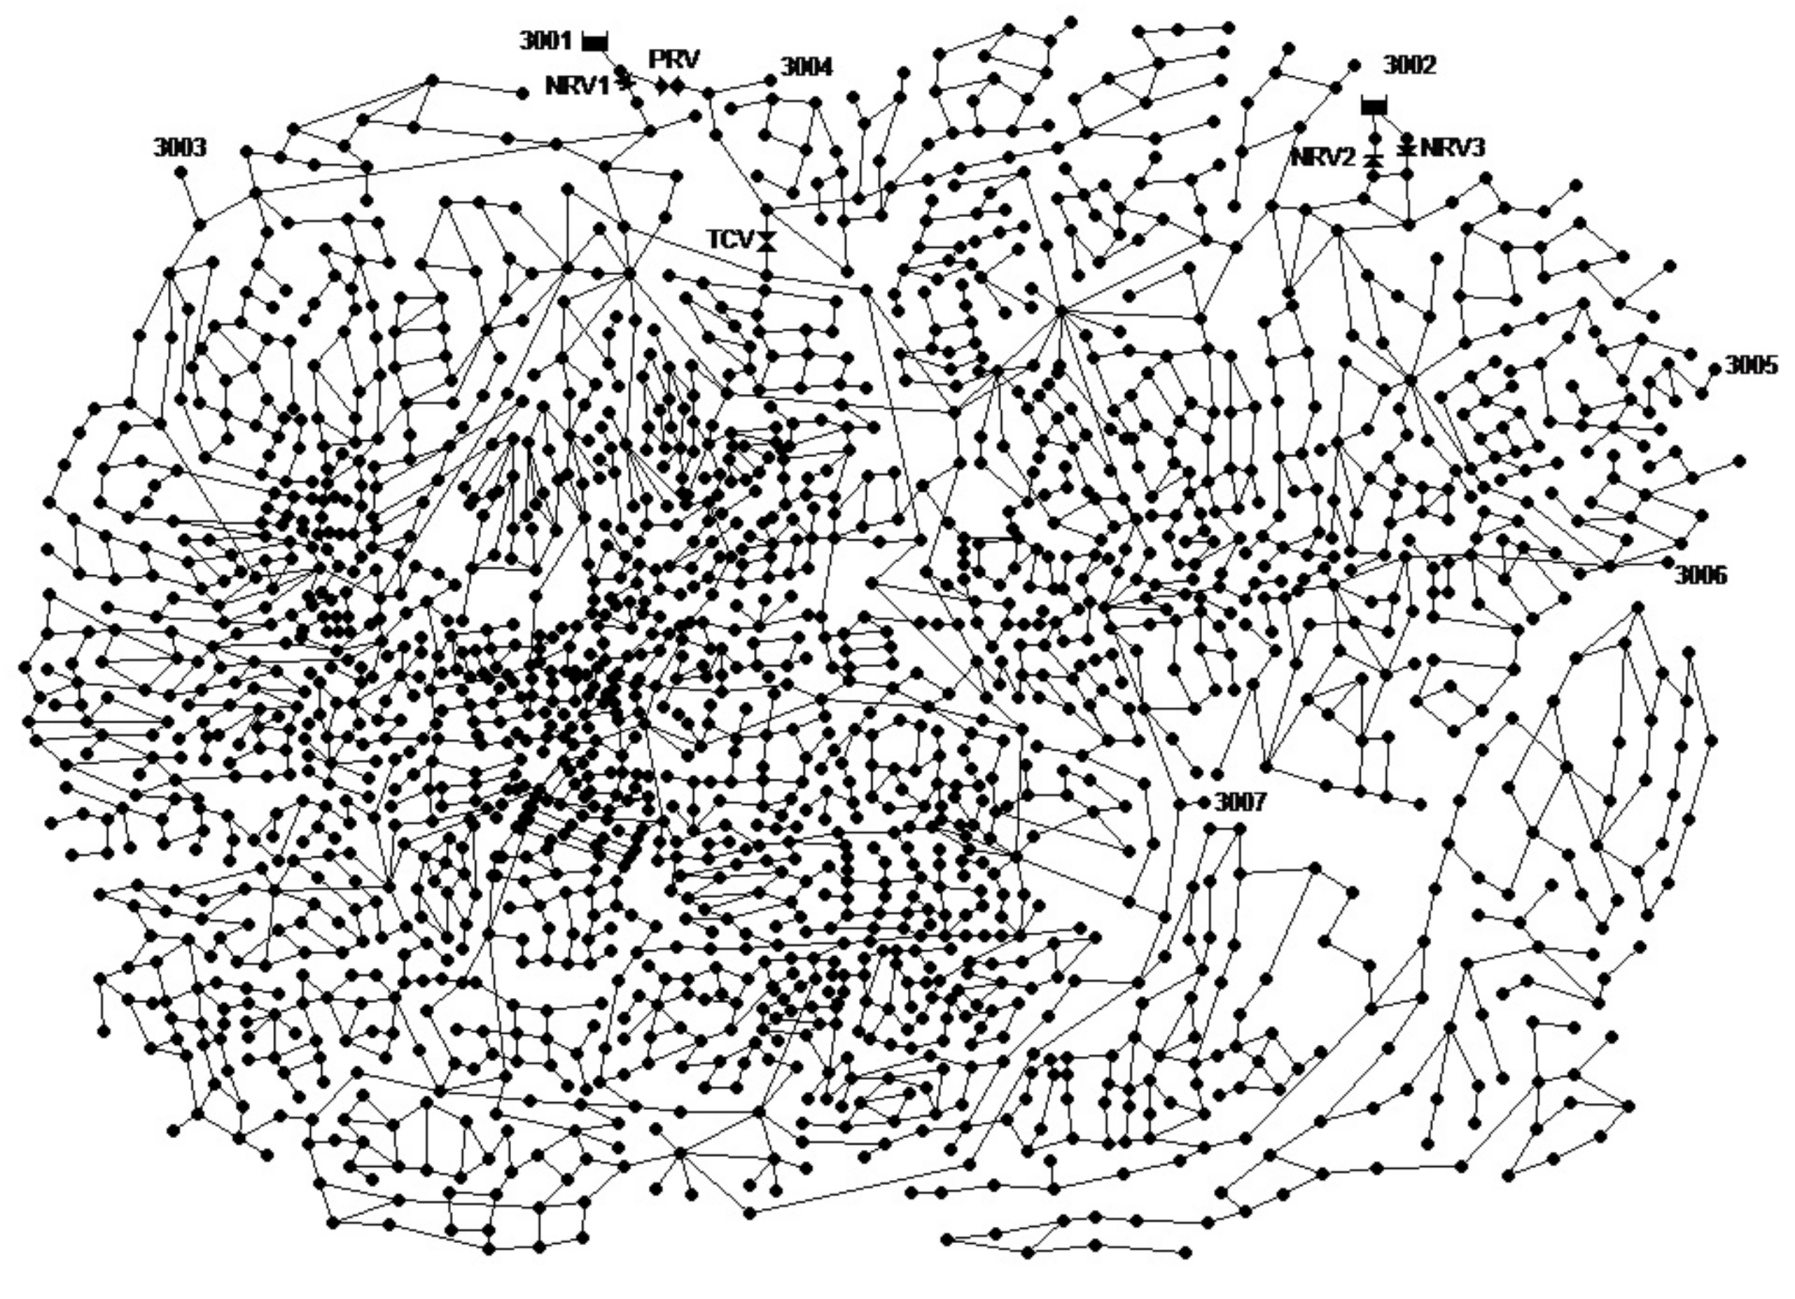
The topological partition methods are applied to a large-scale water network: EXNET, as shown in
Figure 2. The network serves a population of 400,000. The network system consists of 2416 pipes and 1891 nodes. The elevated reservoirs provide the energy to the entire system.
The weights could be allocated to edges or vertices for graph partitioning. In this paper, the demand distributed along a pipe is regarded as the edge weight, since the demand is highly related to the community scale. The distribution demand of a pipe is calculated: , where Di is the demand at node i, ni is the number of pipes that link to node i, and k represents the number of nodes of a pipe and it normally equals 1 or 2. Therefore, in this study, the weighted and unweighted graphs are comparatively investigated in partitioning.
5. Results and Discussion
5.1. Unweighted Partitioning
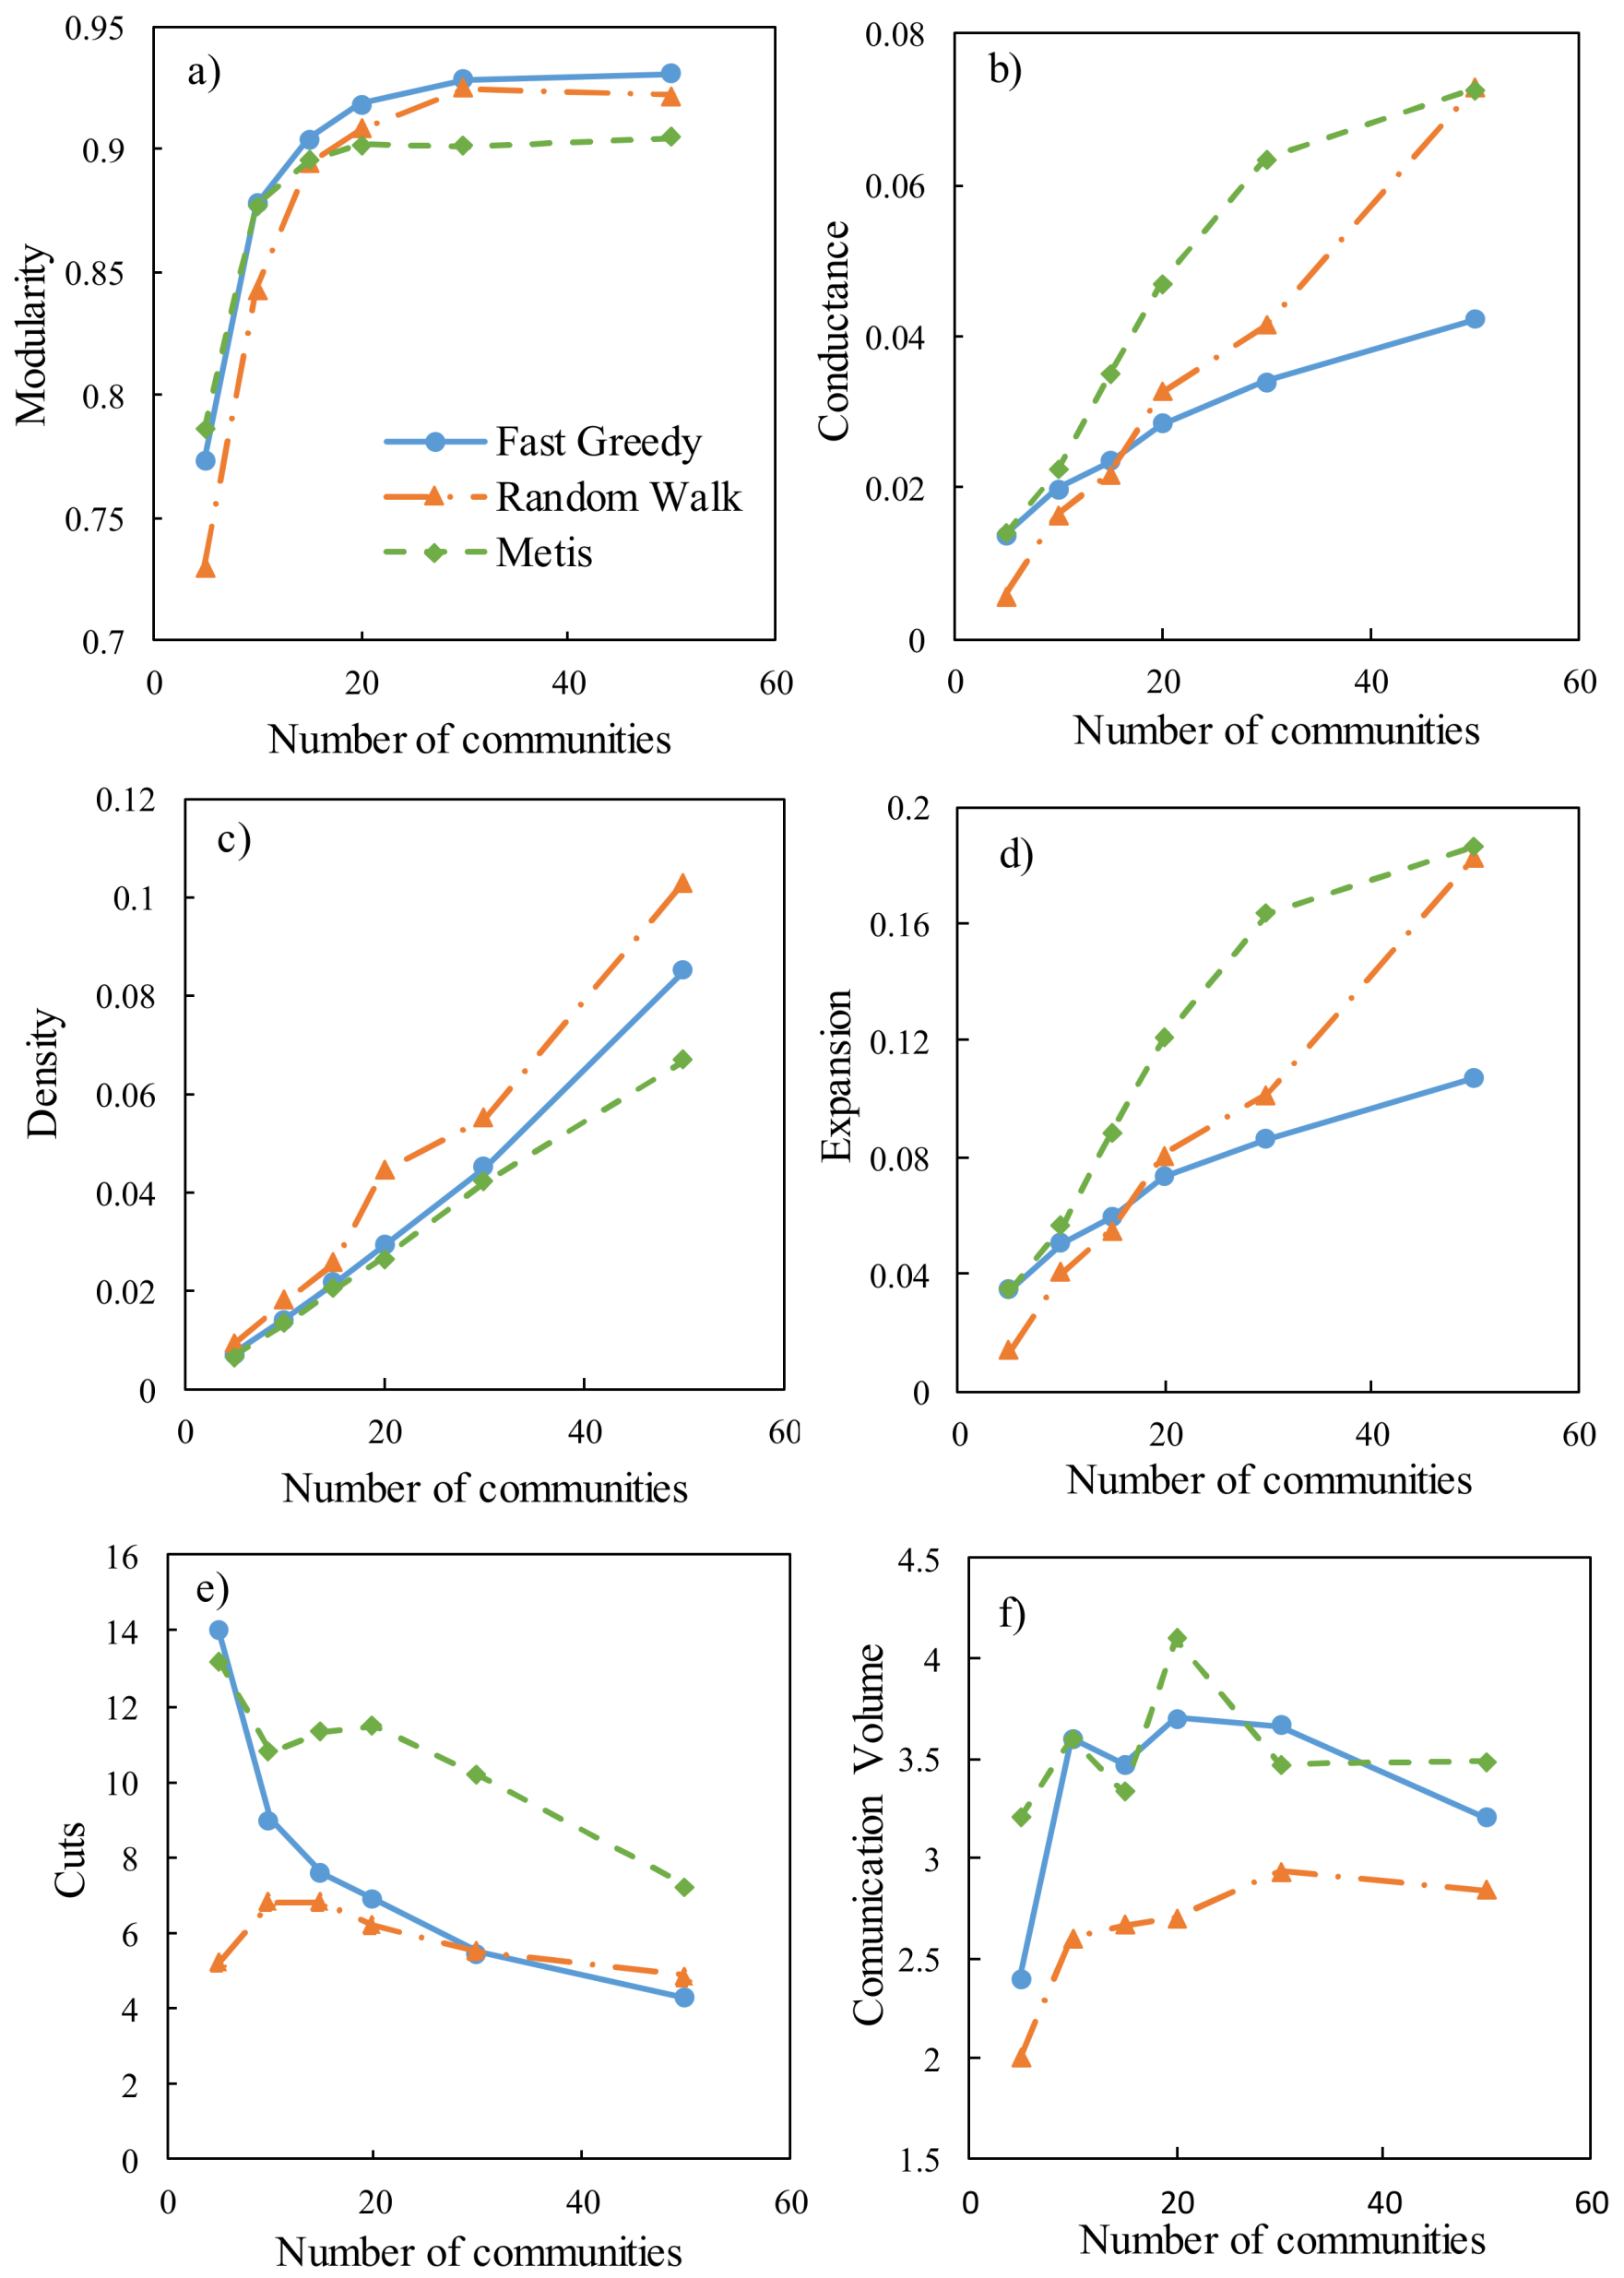
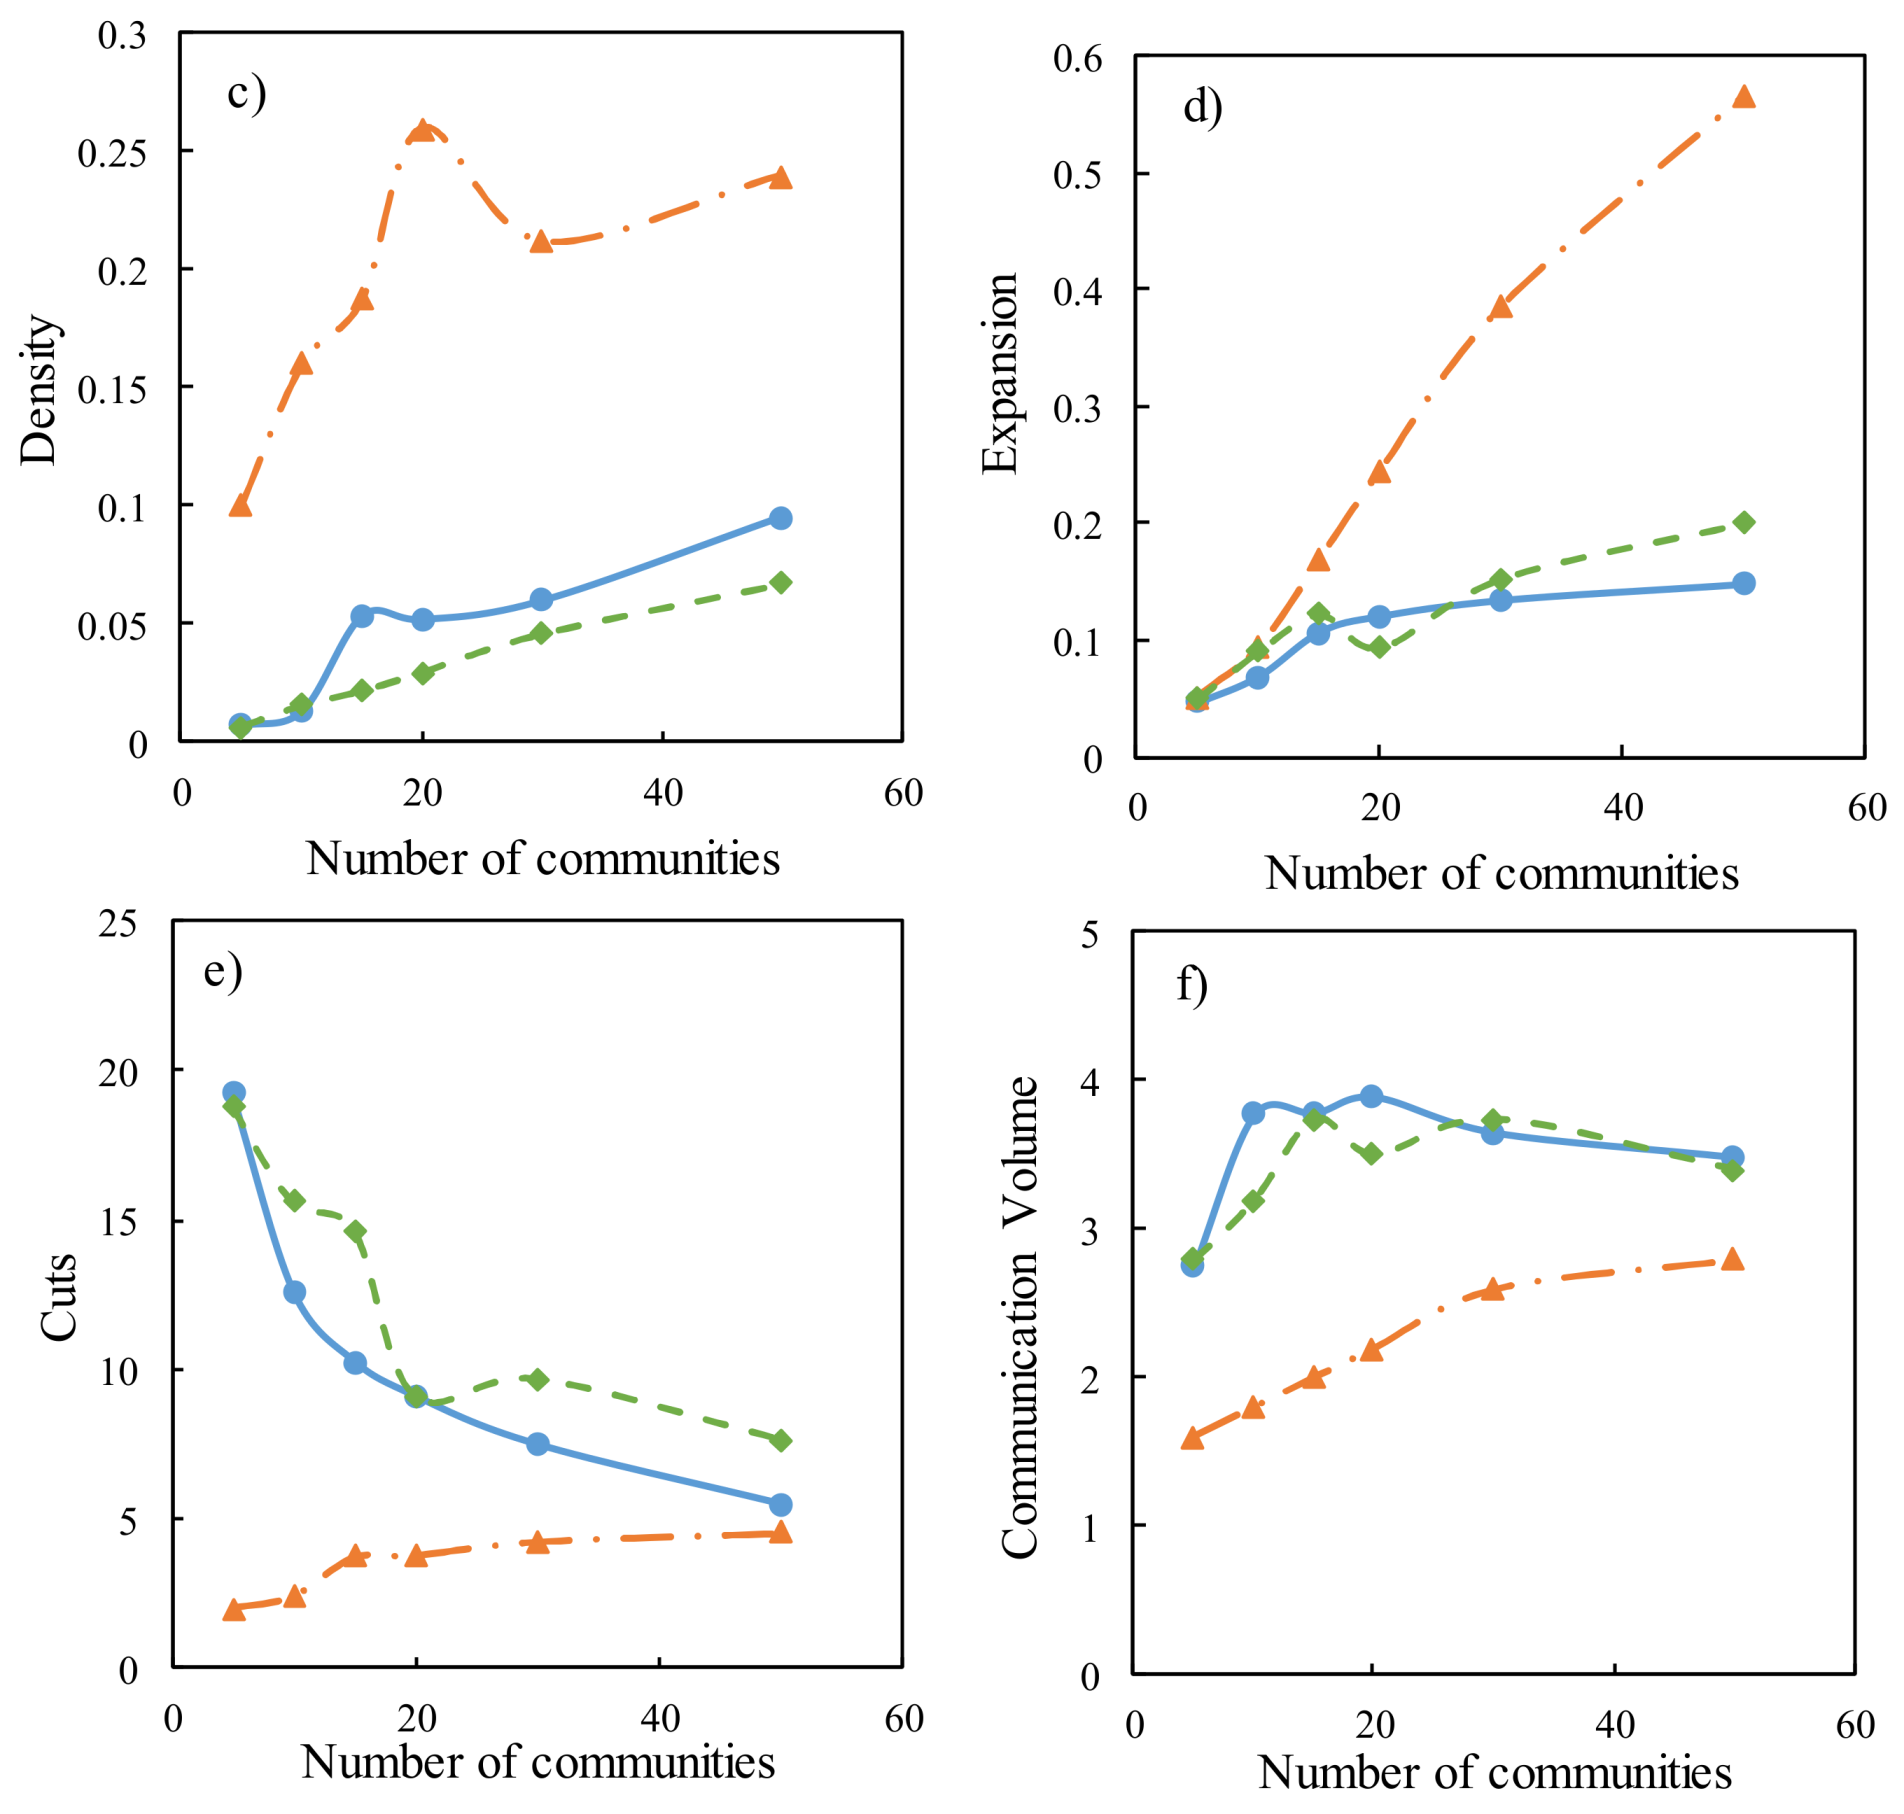
The EXNET network is partitioned into 5, 10, 15, 20, 30, and 50 communities using the Fast Greedy, Random Walk, and Metis algorithms, respectively. The indicators are calculated for each partitioning in the case study network. The averaged indicator values of all communities in the network are shown in
Figure 3. The modularity indicator varies significantly when the number of communities is less than 20 in this case, but has little variation in the cases of more than 20 communities. Comparing the three methods, the solutions derived from the Fast Greedy method are better than those from the other two methods, though they are very close to those from the Random Walk method. In terms of the density results, Metis outperforms the Random Walk and Fast Greedy methods. With respect to the conductance and expansion indicators, Fast Greedy and Random Walk are better than Metis. However, Random Walk produces the smaller number of cuts and communication volume than the other methods. In all, the three methods have their respective advantages in terms of the different indicators (i.e., modularity, conductance, density, expansion, cut, and communication volume). It is impossible to say one method is absolutely better than others when all indicators are considered.
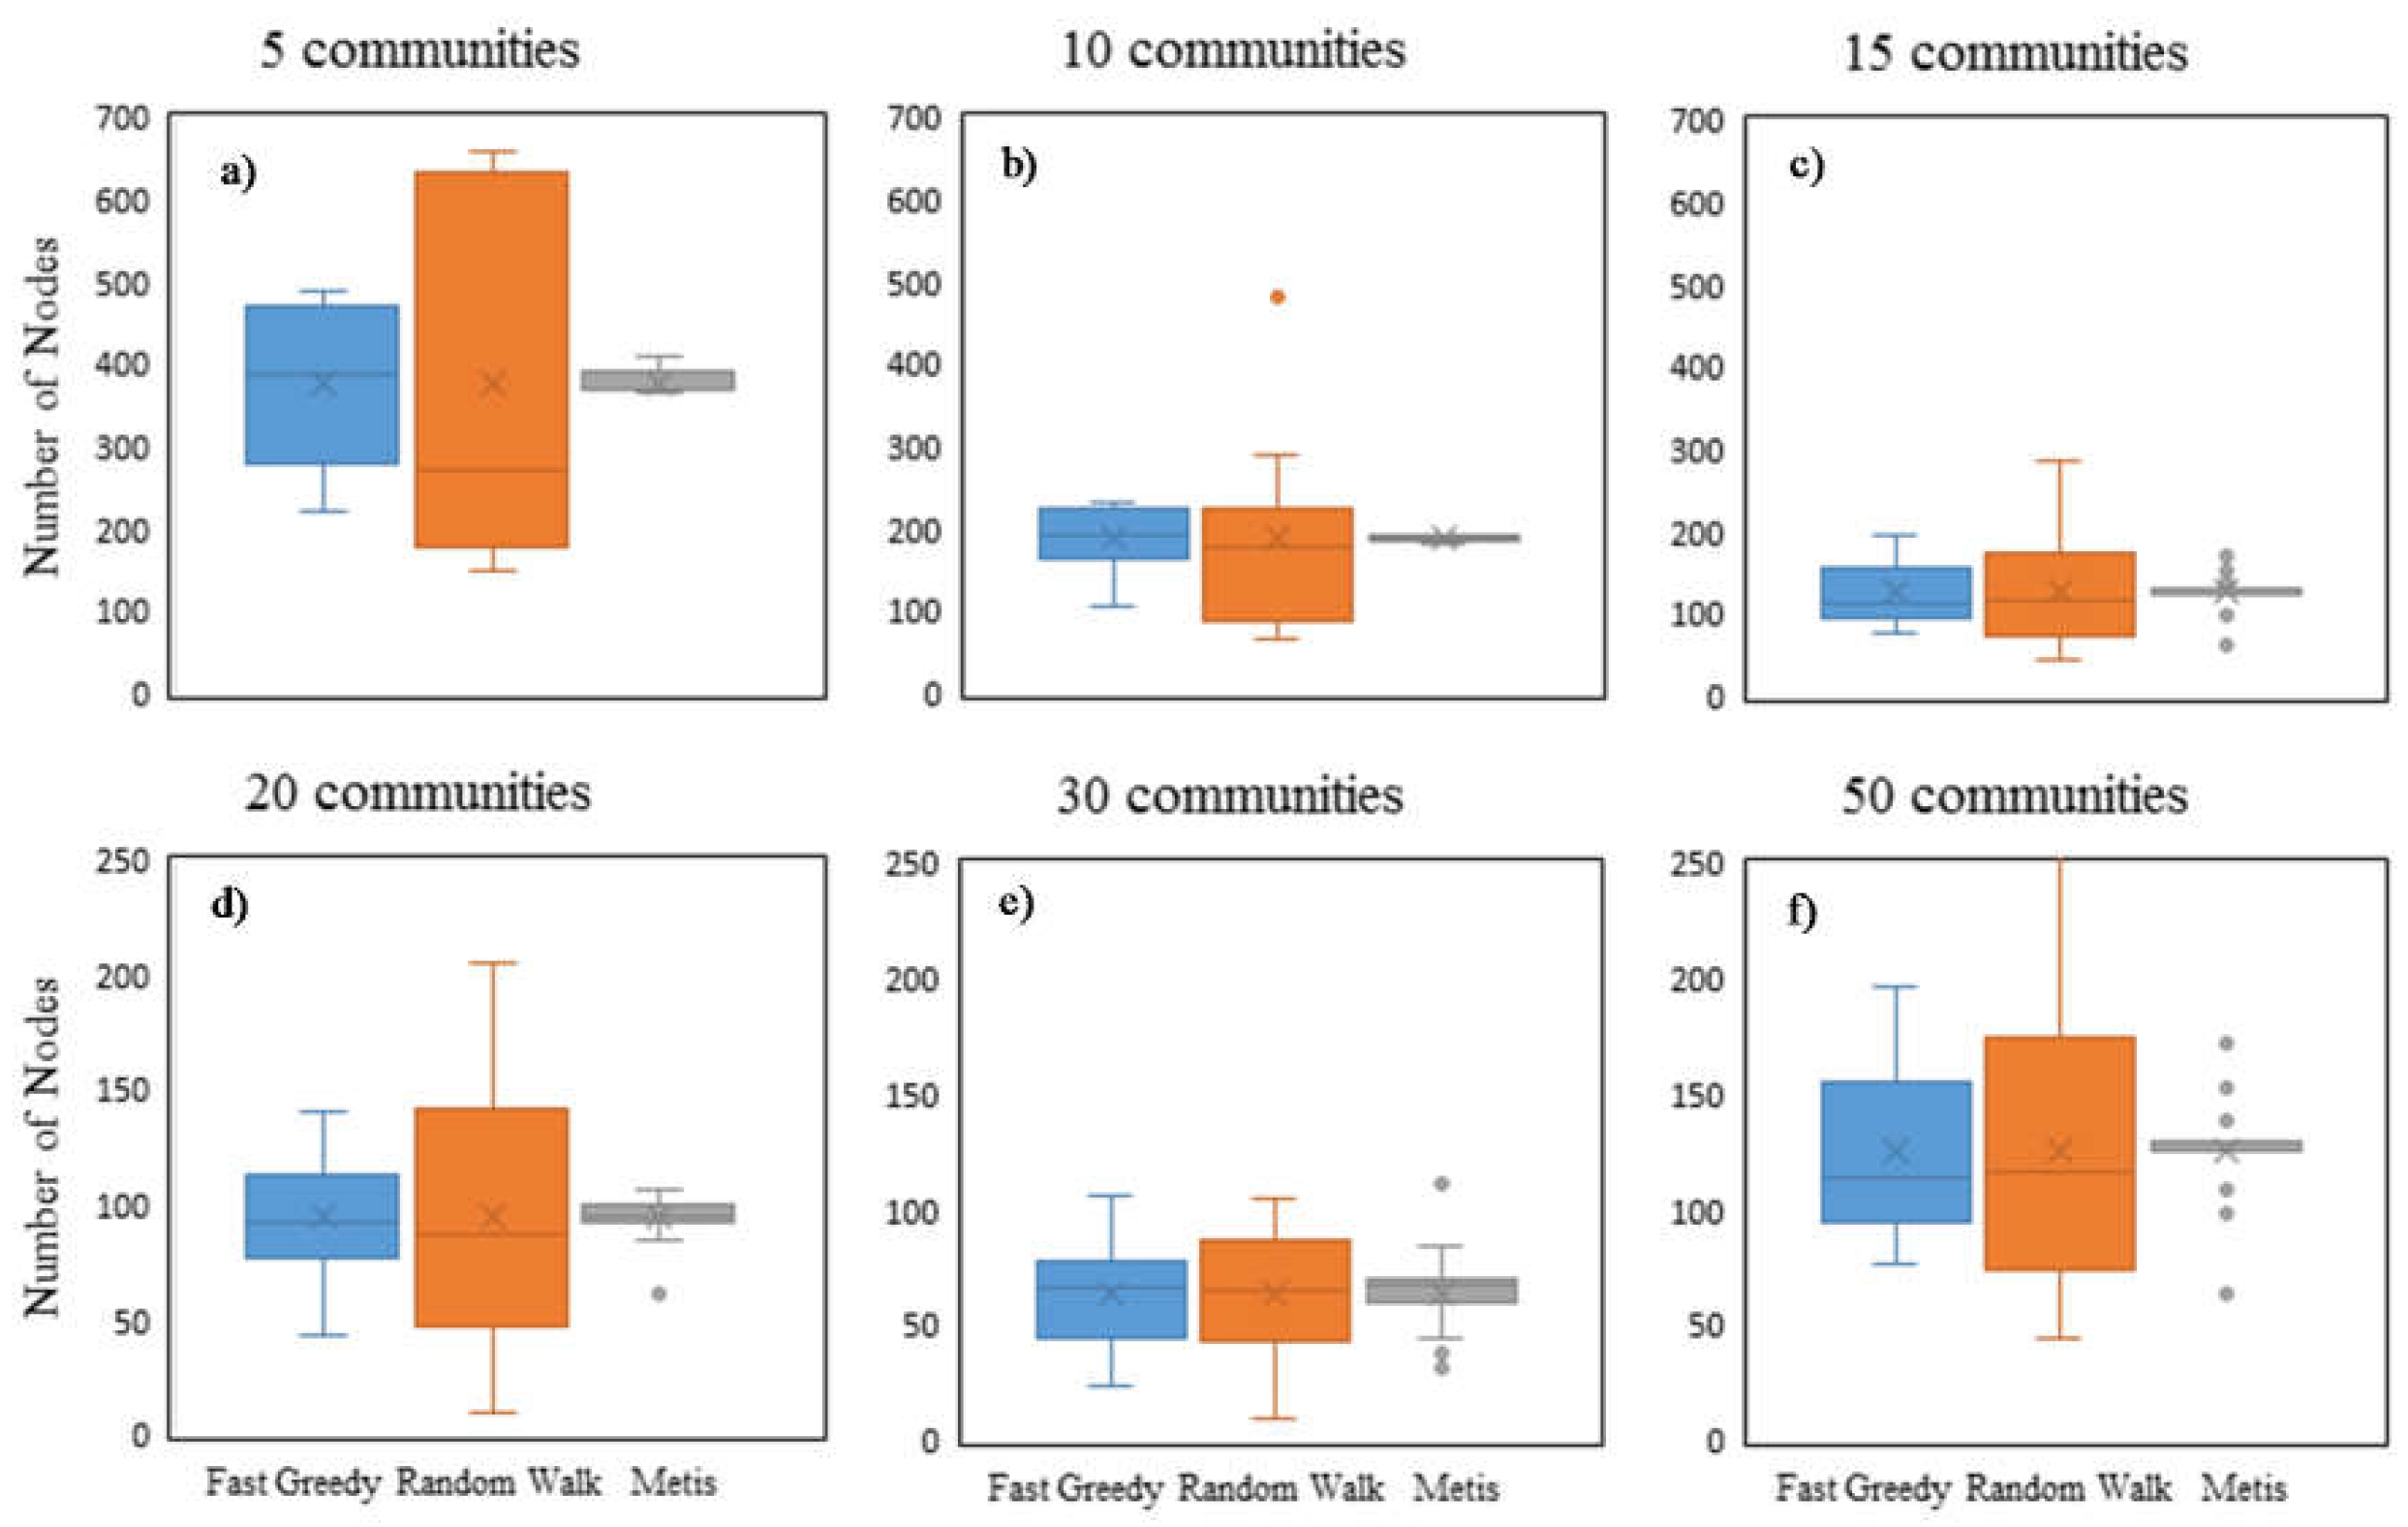
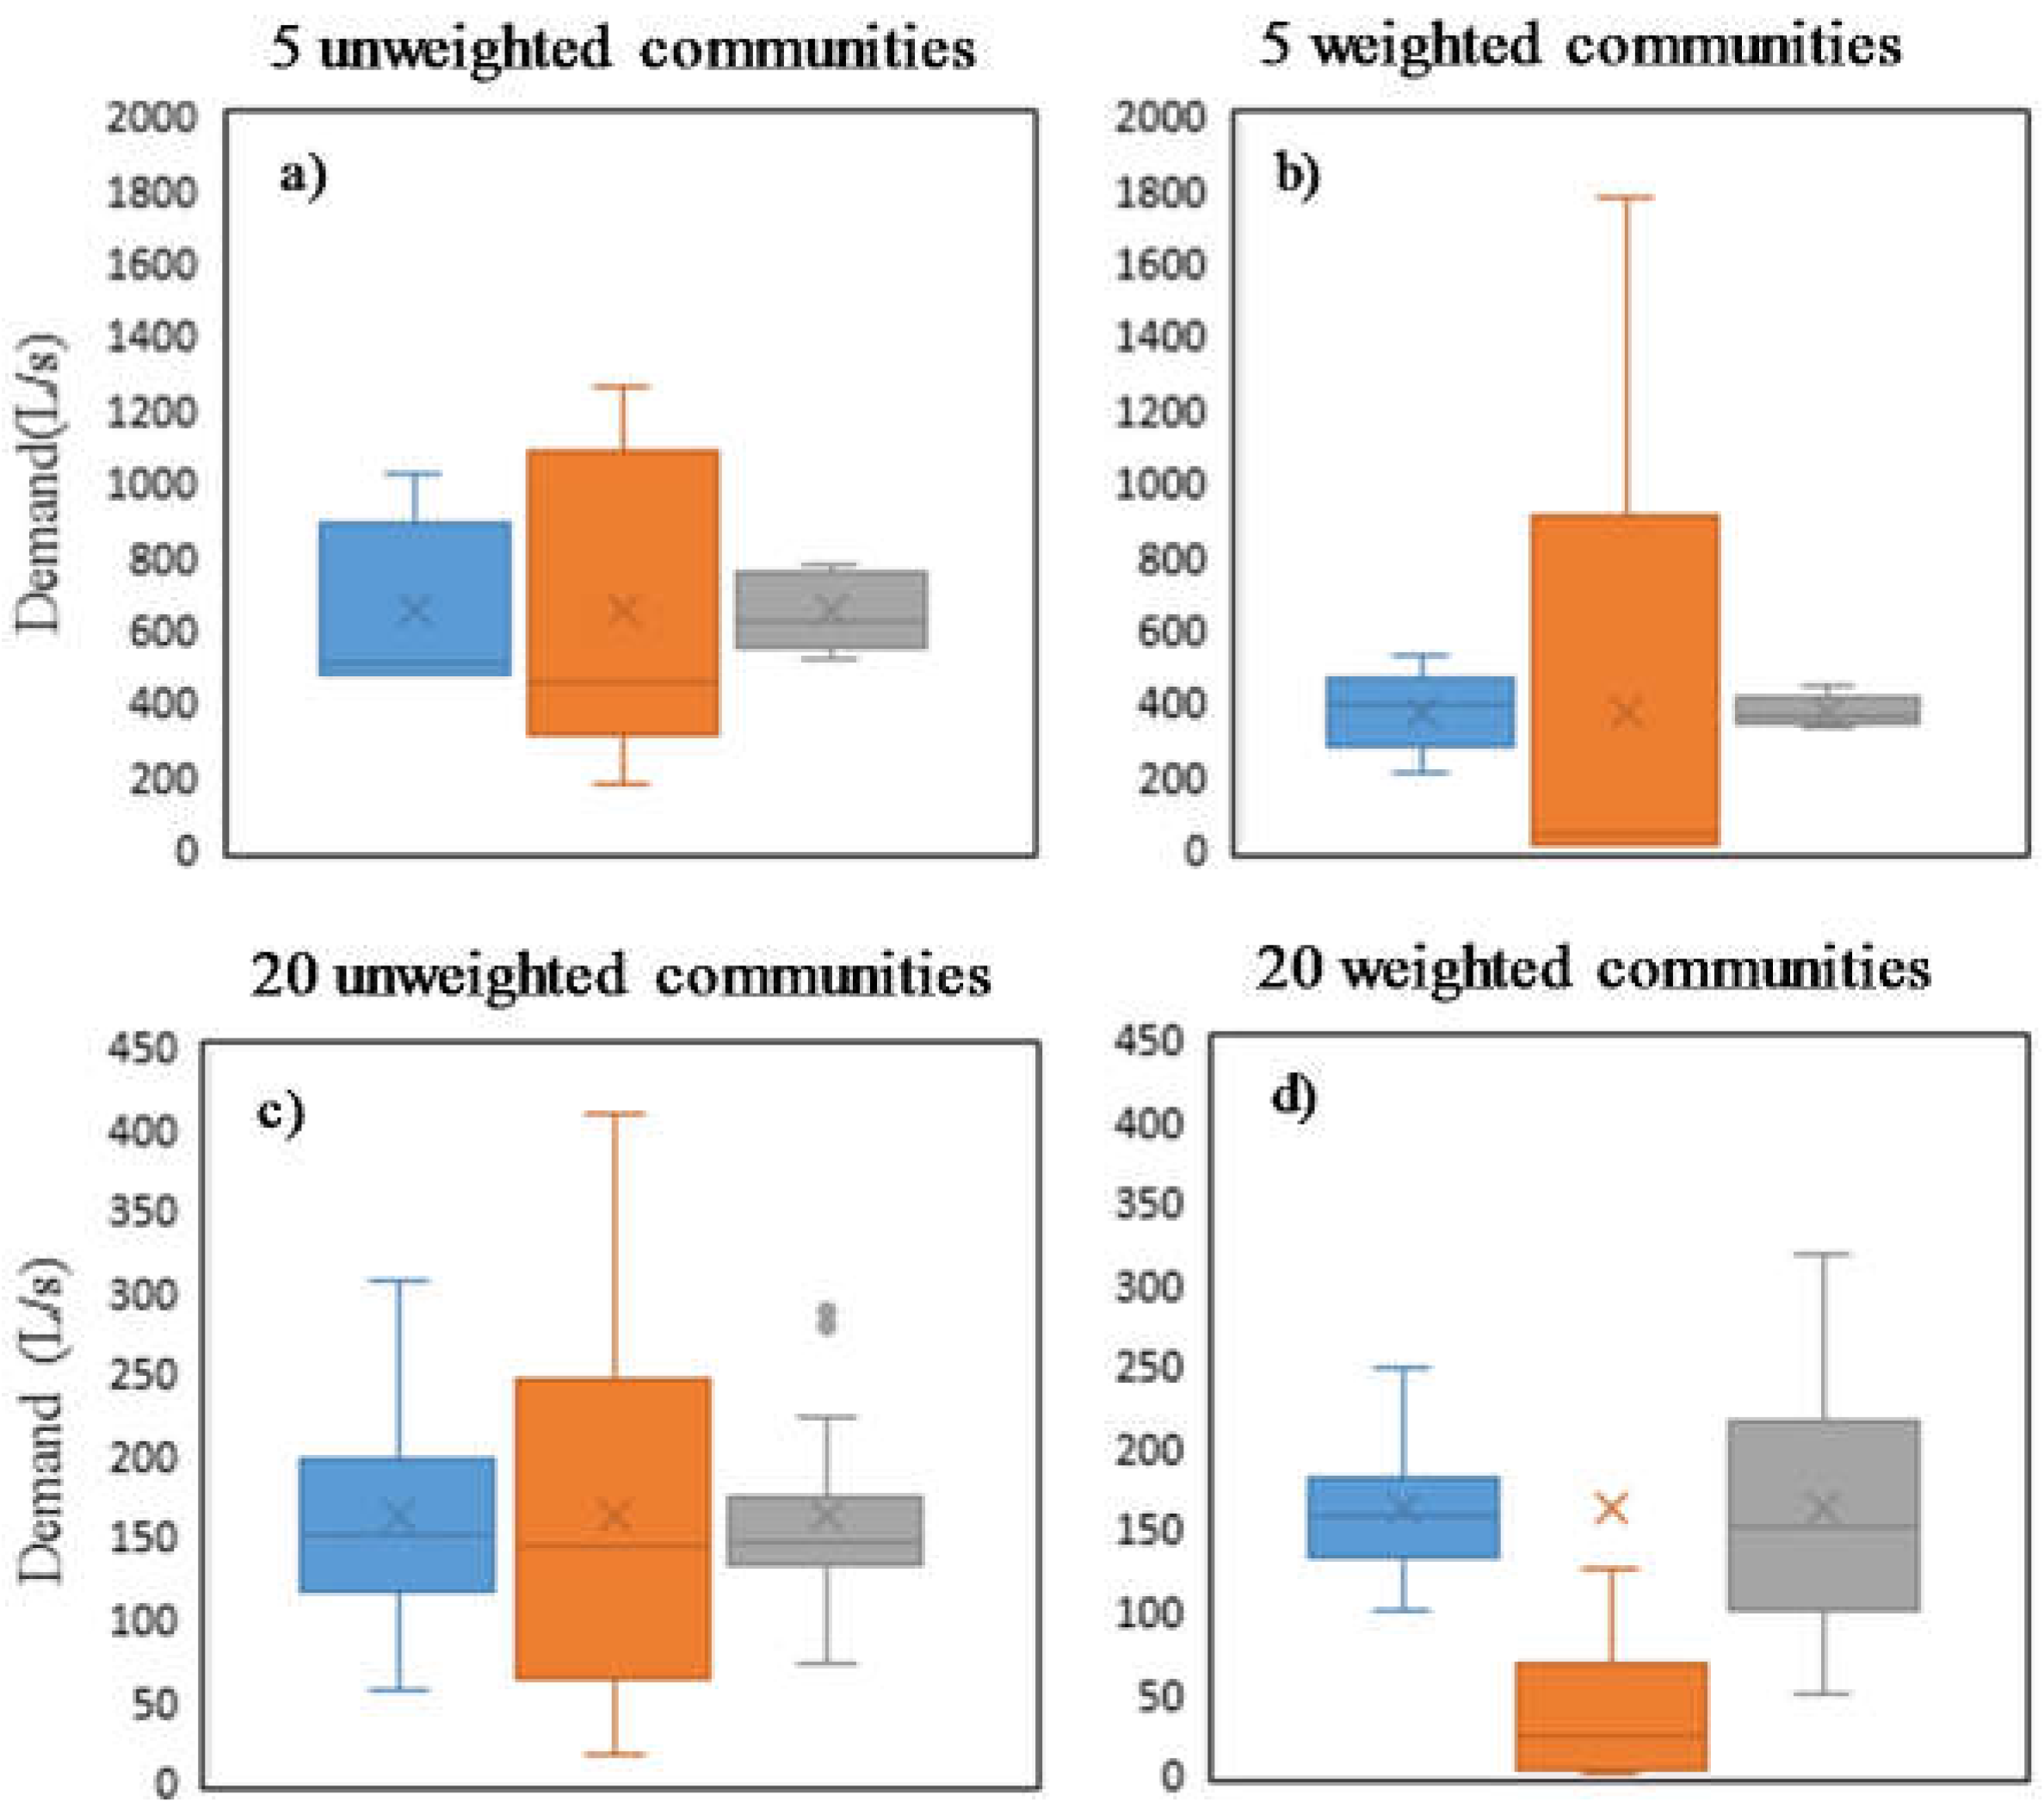
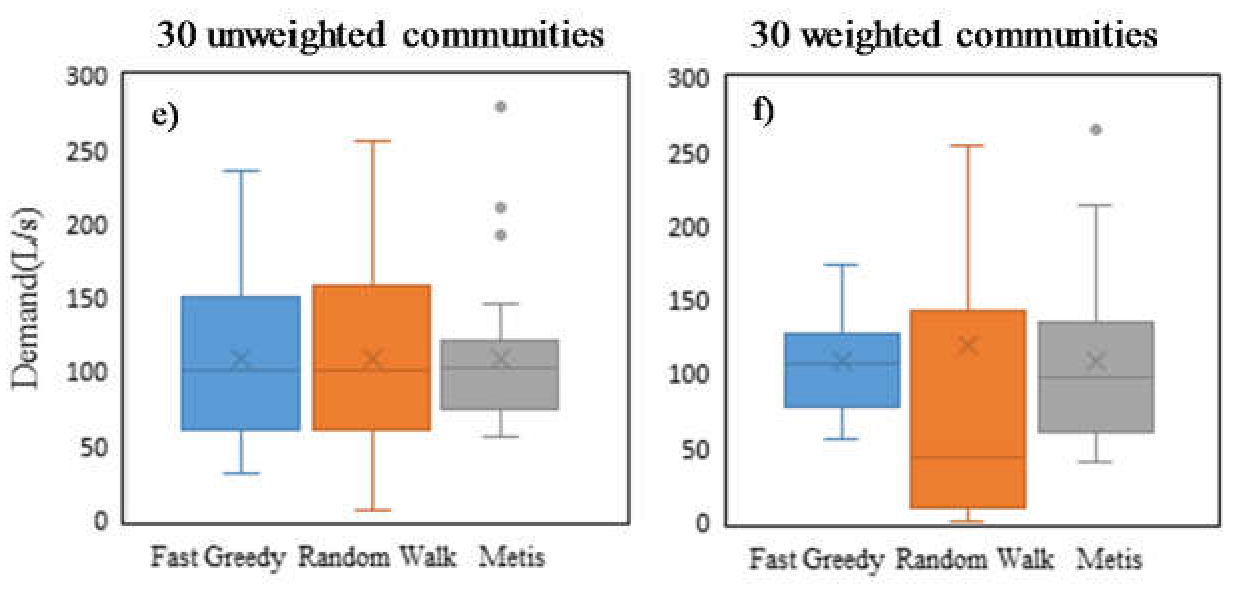
The numbers of nodes in all communities of the network are shown in
Figure 4. The maximum (top bar), the minimum (bottom bar), the 25 and 75 percentiles (box top and bottom edges), the median (line in the box), and the mean (cross) are demonstrated in
Figure 4. Usually, the similar numbers of nodes throughout all communities are desired as a result of DMA partitioning. As can be seen in
Figure 4, Metis shows a smaller variation of the node number and, thus, its partitioning result outperforms the Fast Greedy and Random Walk from the uniformity perspective. Random Walk shows a larger variation in node number, particularly when the cluster number is small. However, when the cluster number becomes large, e.g., 30 and 50 clusters, the variations derived from Fast Greedy and Random Walk are very similar, but are still larger than that from Metis. Metis includes the outstanding feature on the node distribution of partitioning, as it has two in three phases (i.e., partitioning and refinement) to adjust the balance of the size of communities. If the uniformity of nodes in the communities is pursued in the network partitioning, the Metis algorithm is strongly recommended.
5.2. Weighted Partitioning
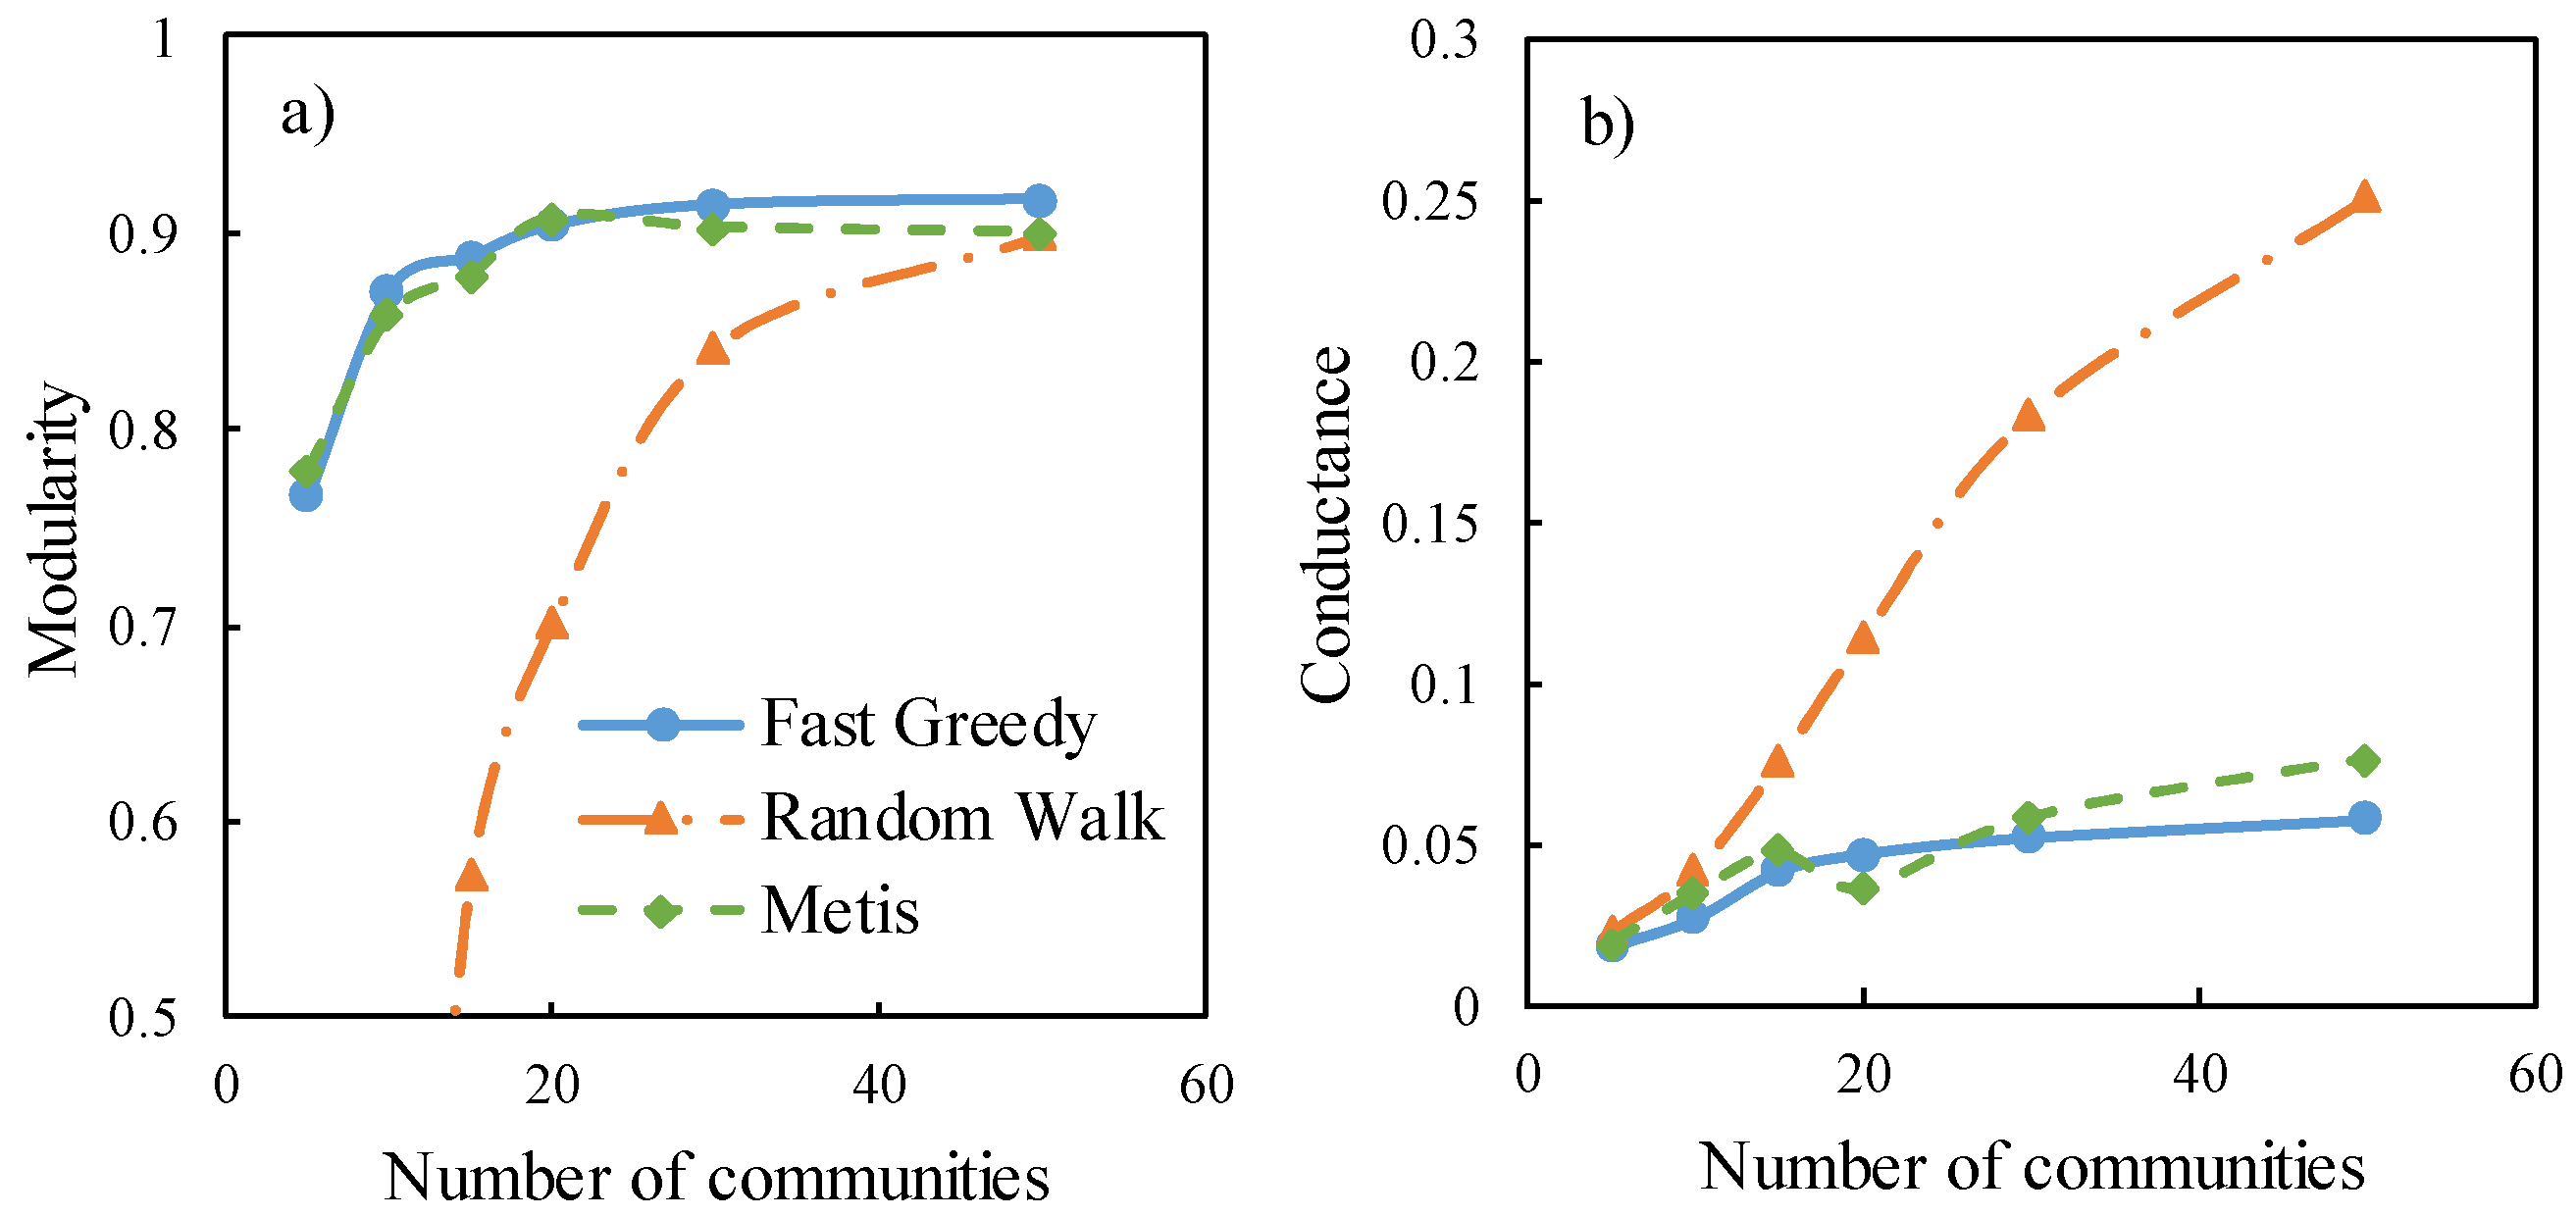
The demands are used as weights to differentiate the crucial edges. In doing so, the crucial edges (i.e., with large weights) are not prone to be chosen as the cut edges (the links between communities), since flow meters and isolation valves are normally installed at the boundary of communities (i.e., cut edges). The results of the indicators are shown in
Figure 5. As can be seen in
Figure 5, the indicator values are substantially different from those of the unweighted partitioning. In particular, the Random Walk method has the distinct performance in comparison with Metis and Fast Greedy. The Random Walk shows the lower modularity than Fast Greedy and Metis, which indicates that the overall performance of Random Walk is worse, with the only exception being the case of 50 communities. Fast Greedy obtained the higher modularity values in both weighted and unweighted network partitioning, since the Fast Greedy optimizes the modularity function directly. Similar to the unweighted partitioning, the cuts and communication volume of Random Walk are better than the other two methods.
Figure 6 shows the demand statistics in all communities with and without weights in partitioning. The Fast Greedy method shows the best performance, since the demands become more condensed (i.e., demands for all clusters concentrate on the average) when taking the weights into account. The Metis shows the inconsistent performance, i.e., good performance at five communities’ partitioning, but poor performance at 20 and 30 communities’ partitioning. The Random Walk method seems incapable of dealing with the weighted partitioning.
5.3. Discussion
Random Walk is mainly concerned with the cut number, but significantly sacrifices the balance of network partitions. In some engineering fields, including water distribution systems, balanced network partitioning is vital. Hence, Metis and Fast Greedy methods are preferable for water distribution network partitioning. Random Walk is applied in the directed and weighted graph partitioning in Rosvall and Bergstrom [
15]. That might be the reason why it does not perform well in the water distribution network that is an undirected graph.
The EXNET is a water distribution network that is modified from a real network in the UK. When applied to real-world networks, the partitioning methods need to consider the following factors: (1) the real-world WDS has more complex structure and components (pump, tank, reservoir) than the model network; (2) some small pipes of network branches in a complex network could be removed because the focus should be on the main pipes of the real-world network regarding network partitioning; and (3) hydraulic isolation (valve operation) should be considered in partitioning.
Further, network partitioning, in practice, should concern more influence factors that might significantly impact the partitioning results, for example, pipe length, pressure area, water quality deterioration, minimum night flow, degree of demand variation, and fire flow capacity, to name a few [
12,
19].
6. Conclusions
This paper evaluated three partitioning methods, including Fast Greedy, Random Walk, and Metis, using a spectrum of topological evaluation indicators. The three partitioning methods are commonly used for water network partitioning and are developed from different theories. A large-scale water distribution network, i.e., EXNET, is used for comparison analysis. The unweighted and weighted graphs (represented by demands) are comparatively analyzed in partitioning. According to the results obtained, key conclusions are given below:
- (1)
The Fast Greedy method is better than the Random Walk and Metis methods in terms of the modularity indicator for a single test case. Fast Greedy directly optimizes the modularity function which measures the network partitioning in a comprehensive way. The good overall performance of Fast Greedy tends to weaken inter-community links and strengthen intra-community links. Random Walk results in a smaller number of edge cuts, which indicates the connections between the communities are not strong; conversely, Fast Greedy and Metis lead to the dense links in the communities.
- (2)
Fast Greedy is able to reflect the effect of weighted edges in the partitioning, while Random Walk does not perform well in the weighted graph partitioning. Metis shows the varied performance with respect to the weighted graph, and its performance depends on the number of communities.
- (3)
Metis is able to obtain well-balanced communities in terms of a similar number of nodes across communities. This feature is preferred in the water distribution network partitioning, since the uniformity of DMAs is convenient for the management and maintenance tasks in the utilities.
This study provides an insight into the partitioning methods from a topological perspective. The three methods used in the study are all developed in the context of complex networks, thus, they should be tailored when applied to DMAs partitioning. The mechanism, characteristic, and applicability of the three partitioning algorithms demonstrated in this paper would provide useful insight to extend the applications of network partitioning.
Only one water distribution network (EXNET) is applied in this study, and more case studies should be investigated based on the methodology in future work. The future work should investigate how to establish the suitable valves and meters to form the relatively isolated zones and consider the hydraulic and economic performance when assessing network partitioning.

