Article

Water Pricing and Implementation Strategies for the Sustainability of an Irrigation System: A Case Study within the Command Area of the Rakh Branch Canal

by
Muhammad Uzair Qamar
1,
Muhammad Azmat
2,3,
Azhar Abbas
4,*,
Muhammad Usman
1,5,
Muhammad Adnan Shahid
6 and
Zahid Mahmood Khan
7
1
Department of Irrigation & Drainage, Faculty of Agricultural Engineering and Technology, University of Agriculture, 38040 Faisalabad, Pakistan
2
Institute of Geographical Information Systems (IGIS), School of Civil & Environmental Engineering (SCEE), National University of Sciences and Technology (NUST), IGIS Building (2nd Floor), 44000 Islamabad, Pakistan
3
Department of Geography, University of Zurich, Irchel Winterthurerstr. 190 CH-8057 Zurich, Switzerland
4
Institute of Agricultural and Resource Economics, Faculty of Social Sciences, University of Agriculture, 38040 Faisalabad, Pakistan
5
Department of Remote Sensing, Institute for Geography and Geology, Julius Maximillian’s University Wuerzburg, Oswald Külpe Weg 86, 97074 Wuerzburg, Germany
6
Water Management Research Center, University of Agriculture, 38040 Faisalabad, Pakistan
7
Department of Agricultural Engineering, Bahauddin Zakariya University, 60800 Multan, Pakistan
*
Author to whom correspondence should be addressed.
Water 2018, 10(4), 509; https://doi.org/10.3390/w10040509
Submission received: 21 March 2018 / Revised: 9 April 2018 / Accepted: 17 April 2018 / Published: 19 April 2018
(This article belongs to the Section Water Resources Management, Policy and Governance)

Abstract

:
The command area of the Rakh branch canal grows wheat, sugarcane, and rice crops in abundance. The canal water, which is trivial for irrigating these crops, is conveyed to the farms through the network of canals and distributaries. For the maintenance of this vast infrastructure; the end users are charged on a seasonal basis. The present water charges are severely criticized for not being adequate to properly manage the entire infrastructure. We use the residual value to determine the value of the irrigation water and then based on the quantity of irrigation water supplied to farm land coupled with the infrastructure maintenance cost, full cost recovery figures are executed for the study area, and policy recommendations are made for the implementation of the full cost recovery system. The approach is unique in the sense that the pricings are based on the actual quantity of water conveyed to the field for irrigating crops. The results of our analysis showed that the canal water is severely under charged in the culturable command area of selected distributaries, thus negating the plan of having a self-sustainable irrigation system.

1. Introduction

Irrigation in Pakistan is indispensable for agriculture, as is true for most of the World’s arid and semiarid environments. The area of irrigated land in Pakistan has grown from about 11.6 million hectares in 1947 to nearly 22.6 million ha in 1997 [1]. Therefore, irrigated farming accounts for 75% of total water withdrawals [2].
The preamble of the recent research done in the context of food and water security states that water supplies in Pakistan are threatened by human-induced pressures. Moreover, the quality of aquatic ecosystems is experiencing severe deterioration due to climate change [3]. This deterioration of the ecosystem can have a serious adverse impact on Pakistan’s economy in general and Punjab’s (a province of Pakistan) in particular. The majority of Punjab’s rural work force (as much as 60%) is engaged in the field of agriculture either directly (i.e., farming) or indirectly (i.e., working in agriculture-based industries) [4].
Pakistan has a financially unsustainable irrigation system owing to the fact that the water pricing is independent of the actual volume of water supplied to the farm land, which results in wastage of water by farmers. In the absence of incentives, farmers inundate their entire fields through flood irrigation rather than irrigating the crops through a high-efficiency irrigation system (HEIS), resulting in low water productivity. Dinar and Subramanian [5] argued that proper water pricing improves water use efficiency, water allocation efficiency and raises revenue for general purposes. Burt [
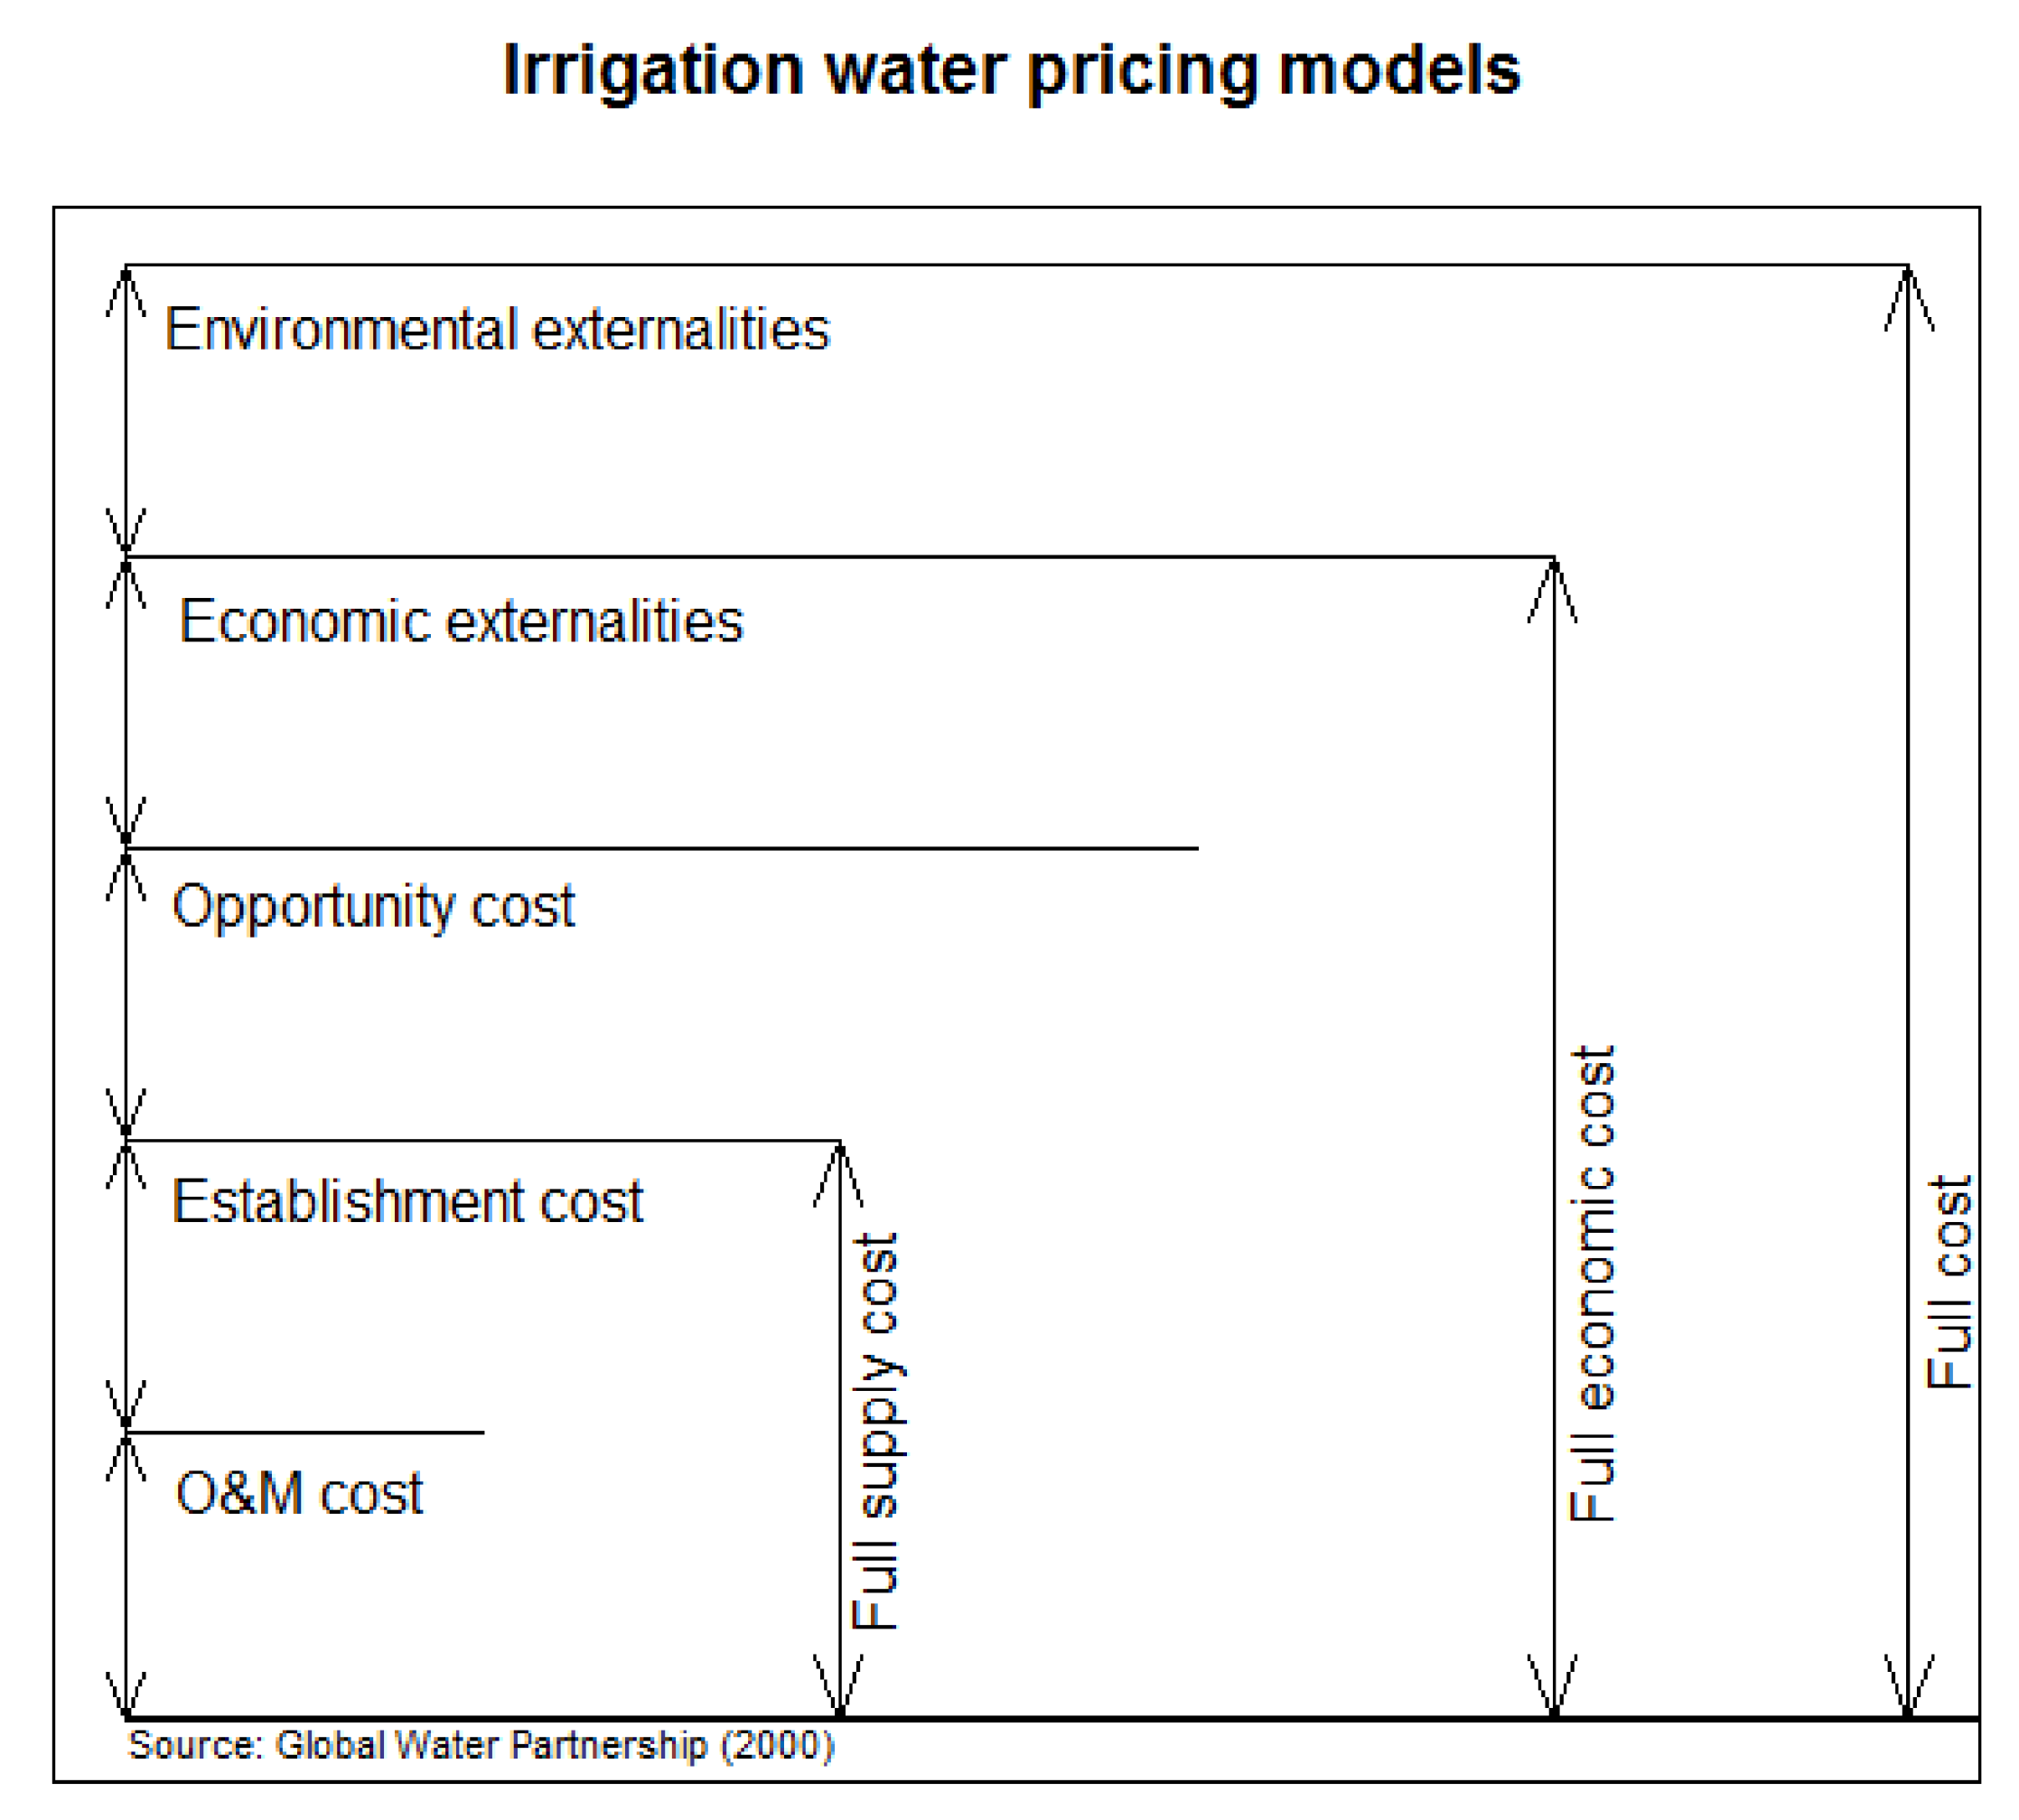
6] categorized the global water pricing systems as; (1) No irrigation fees at all; (2) Area-based pricing system in which the end-user is charged a fixed rate per unit of farm (or irrigated area); (3) Crop-based water pricing mechanism which defines a variable rate per hectare depending on the type of crop irrigated; (4) Volumetric method which establishes fixed or variable rates per unit of water received; and (5) Per irrigation water charges. Roger et al. [7] proposed three levels of water costs which can comprehensively form the basis of a water pricing mechanism, viz., full supply cost, full economic cost, and full cost (see Figure 1).
“Cost recovered” generally refers to the percentage of the full supply cost collected from the farmers. The full supply cost can be defined readily, owing to the ease in the estimation of its parameters (i.e., O&M cost and Establishment). However, the “full economic cost” and “full cost” are difficult to estimate due to the increased complexity involved in the estimation of the opportunity cost and other parameters [8].
In the case of Pakistan, water charges are based on either area or season-based flat rates. The present water pricing system does not encourage water use efficiency as it fails to relate the water price to the actual water volume supplied to the field [9]. Similarly, other major water pricing issues in Pakistan are the absence of linkage between water fee collection and service provision (lack of financial autonomy) and the lack of incentives for service providers to collect charges [10,11].
Several environmental laws, which support the use of economics as a key discipline to reach the objective of a self-sustainable irrigation system, have been introduced (e.g., [12,13]). The Water Framework Directive (WFD) approach hinges on the notion of full cost recovery for water services including environmental and resource costs from the farmers, which is precisely one of the most novel and interesting aspects in the norm. The WFD further strengthens the call for inculcating economic analysis to find the economic value of water for different alternatives to improve the water supply system for improved environmental status. [13] fully describes the implementation of WFD and explains the idea of full water cost coverage based on the concept of “water services”.
Such analyses are urgent in regions like the Punjab province of Pakistan, where water scarcity is a critical issue. The province currently recovers only 20% of its irrigation water supply cost from consumers and intends to ensure full cost recovery as part of a new reform process [14]. The use of economic instruments such as full cost recovery and the analysis of measures applied to the irrigation sector need to take into account the level of demand for irrigation water in order to quantify the response of water use against the proposed measures (e.g., water saving as a response to increased water price). For this purpose, a detailed economic valuation of irrigation water might be useful to support the water pricing mechanism at the local scale.
Heal et al. [15] thoroughly discussed the methods available in literature to calculate the economic value of goods and services. The methods were later reviewed by Young [16] to estimate the economic value of water. Heal et al. [15] argues that in order to find the economic value of an unpriced input such as water, its contribution to the total value of the produced output should be isolated from the other inputs by subtracting their value addition to the product. Based on the data extracted from field experiments on crops in the 1970s and 1980s, the demand of irrigation water was estimated by statistically utilizing crop-water production functions [17,18]. The relationship between the output price and varying cost of water was studied to develop the demand functions.
Perhaps the most frequently used tool for estimating the value of irrigation water is linear programming (LP), which is based on the use of mathematical programing. The method presents an optimal solution by developing linearity between the constraints and objective function. The former is defined by the restrictions of the cropping area and water availability, whereas the latter is specified as the maximized return from several crops. The concept has been widely used for the estimation of the value of irrigation water; therefore, a large amount of literature can be found related to its application in the field of agriculture [19]. Chaudhry et al. [20] estimated the net return from water in Punjab province of Pakistan by using LP models. The study concluded that the marginal product value of irrigation water was high owing to its limited supply. However, the objective functions and constraints may not be linearly associated; hence the resulting regression equation may not be the true representative of the issue at hand [21]. Some researchers argued about the rigidity of LP in addressing several objectives of conflicting nature, simultaneously [22]. In this regard, Multicriteria Criteria Decision Making (MCDM) analysis is classified as a better alternative to LP (see [23] for a review). Researchers have proposed a number of multicriteria approaches to solve the problems in farming systems related to decision making (see [24] for a review of multicriteria methods in agricultural economics). A complete review of multicriteria methods was done by [25]. The method is unique in the sense that the most decisive factor in its implementation is not the sensitivity of the algorithms but the ways in which the process is organized, including stakeholder involvement and facilitation, and the ways in which the results are presented [26]. Berbel et al. [27] evaluated sustainability of the irrigation sector of Europe under various policy scenarios by generating farm-level water demand curves through MCDM. The authors claim that the methodology well grasped the complexities related to the European agriculture. However, the MCDM methods are criticized by a number of researchers because the methods are: (1) prone to manipulation, resulting in a false sense of accuracy [28] and (2) require the definition of a utility function, representing the preferences of decision-makers, through a complicated procedure [29]. A complete criticism of MCDM methods can be found in Mutikanga [30].
Occasionally, a hedonic method for estimating the value of irrigation water has also been employed and can be found in the literature to a limited extent. For example, Berbel and Mesa [31] used this technique in Guadalquivir Basin of Spain to estimate the value of irrigation water. Besides its numerous advantages, the major drawback of the hedonic method is its inability to translate the implicit costs into a meaningful financial sum.
Most recently, a technique called the Residual Value Method (RVM) has been employed by several researchers. The technique considers water as an intermediate input for the production of crops. The underlying assumption for the application of the model is that the farmer will use water to an extent where the net revenue generated per additional unit of water is equal to the marginal cost of the water [32]. Only a limited number of studies can be found in the literature making use of this technique [33,34] with almost no recently published studies. A complete review of this technique is provided by [16]. Using farm budget surveys data from 1987 to 1991, Bate and Dubourg [35] calculated the residual value of irrigation water applied to five crops in the eastern region of Anglia. Lange [32] used the same technique in the Orange River basin of Namibia. Moran and Dann [36] used secondary data sources in RVM to evaluate the economic value of water for the implementation of WFD. They further argued that the valuation of irrigation water will help in implementing the WFD. Speelman et al. [37] and Esmaeili and Vazirzadeh [38] applied the RVM technique for the valuation of irrigation water in South Africa and Iran, respectively.
In our work, we plan to use the RVM to execute the economic value of water for different crops. The estimated economic values define the income of farmers per unit of irrigation water applied to the crops. Afterwards, the full cost recovery figures are proposed for the operation and maintenance (O&M) of irrigation infrastructure by linking the water prices with the volume of water supplied to the field. Eventually, the implementation strategies are defined to ensure the same economic returns for the farmers during pre-and post-implementation phases of the full cost recovery prices.

2. Improved Water Pricing Mechanism: Why Now?

The province of Punjab, which is considered to be the agricultural hub of the country, is entitled to carry 55 million acre feet (MAF) of water according to Water Apportionment Accord 1991 [39]. Out of total Punjab’s share, only 26 MAF (47.3%) reaches the farm gate while the rest is lost during conveyance in unlined water channels. These losses can be reduced from 60 to 80% by lining the water channels [40]. Over the last few years, a lot of investment has been made to reduce the post-farm gate losses by lining the water courses through successful cost sharing agreement between the government and farmers. However, no such investment is ever made at the national level to line the irrigation canals and distributaries, apart from few individual canals and distributaries which are lined recently (e.g., Lower Chenab Canal).
Unfortunately, due to the sociopolitical uncertainty in the country, no new water reservoirs have been constructed since the formulation of the Water Accord of 1991. With no new water-storage infrastructure and rising water demand, the water supply to each province is stagnant. The delivery of the allocated volume of water to the farmland takes place through the networks of canals and distributaries. These canals and distributaries require a huge financial capital per annum for their operation and maintenance (O&M). To recover the cost of O&M, a flat rate system of water pricing is currently in place in Punjab. Under the flat rate system, water charges are fixed per hectare of area sown in Rabi (winter) and Kharif (summer) seasons regardless of the type of crop being irrigated. The nominal rates of 123.55 PKR (Pakistani Rupees)/hectare and 210.035 PKR/hectare ($1 = 104.5 PKR) are charged for the winter (Rabi) and summer (Kharif) crops, respectively. The water charges are collected from the farmers by either the head of the village (locally called “Lambardar”) or by the chairman of farmer’s committee nominated by the Punjab Irrigation Department (PID). The flat rate water pricing system significantly increases the cropping intensities and production, but the system needs to be modified as it fails to ensure the sustainability of the irrigation system [41]. Our hypothesis is that irrigation water in Punjab is severely under charged and there is a need to revise the pricing system to ensure the sustainability of the irrigation system.
The long-forgotten issue of irrigation water pricing took center stage when the Asian Development Bank (ADB) and the Government of Punjab got involved in a process to finalize the loan of 2 million dollars to upgrade the Agriculture sector of the province. One of the conditions which ADB reiterated from its previous suggestions is that the Government of Punjab needs to improve the irrigation water pricing mechanism of the province [42]. Therefore, the aim of our research work is to find the value of irrigation water and then test the suitability of our newly developed pricing model which is based on the actual quantity of water supplied for irrigation. The model will suggest the appropriate prices of irrigation water for the study area to recover 100% of the O&M cost of irrigation system. The project will interpret the full cost recovery figures for three major crops (wheat, rice and sugarcane) grown in the area. It will also aid in understanding the issues and complexities related to the implementation of a full cost recovery mechanism. In the past, every effort to put in place such a mechanism was fully resisted by the average farmers of the area due to their delicate financial conditions, although the farmers were assured that the mechanism will be complimented with tax evasion in order to provide financial relief to them [14]. Therefore, the project will also assist in framing a mechanism to increase water prices in such a way that the average farmers are not financially over-burdened.

3. Study Area

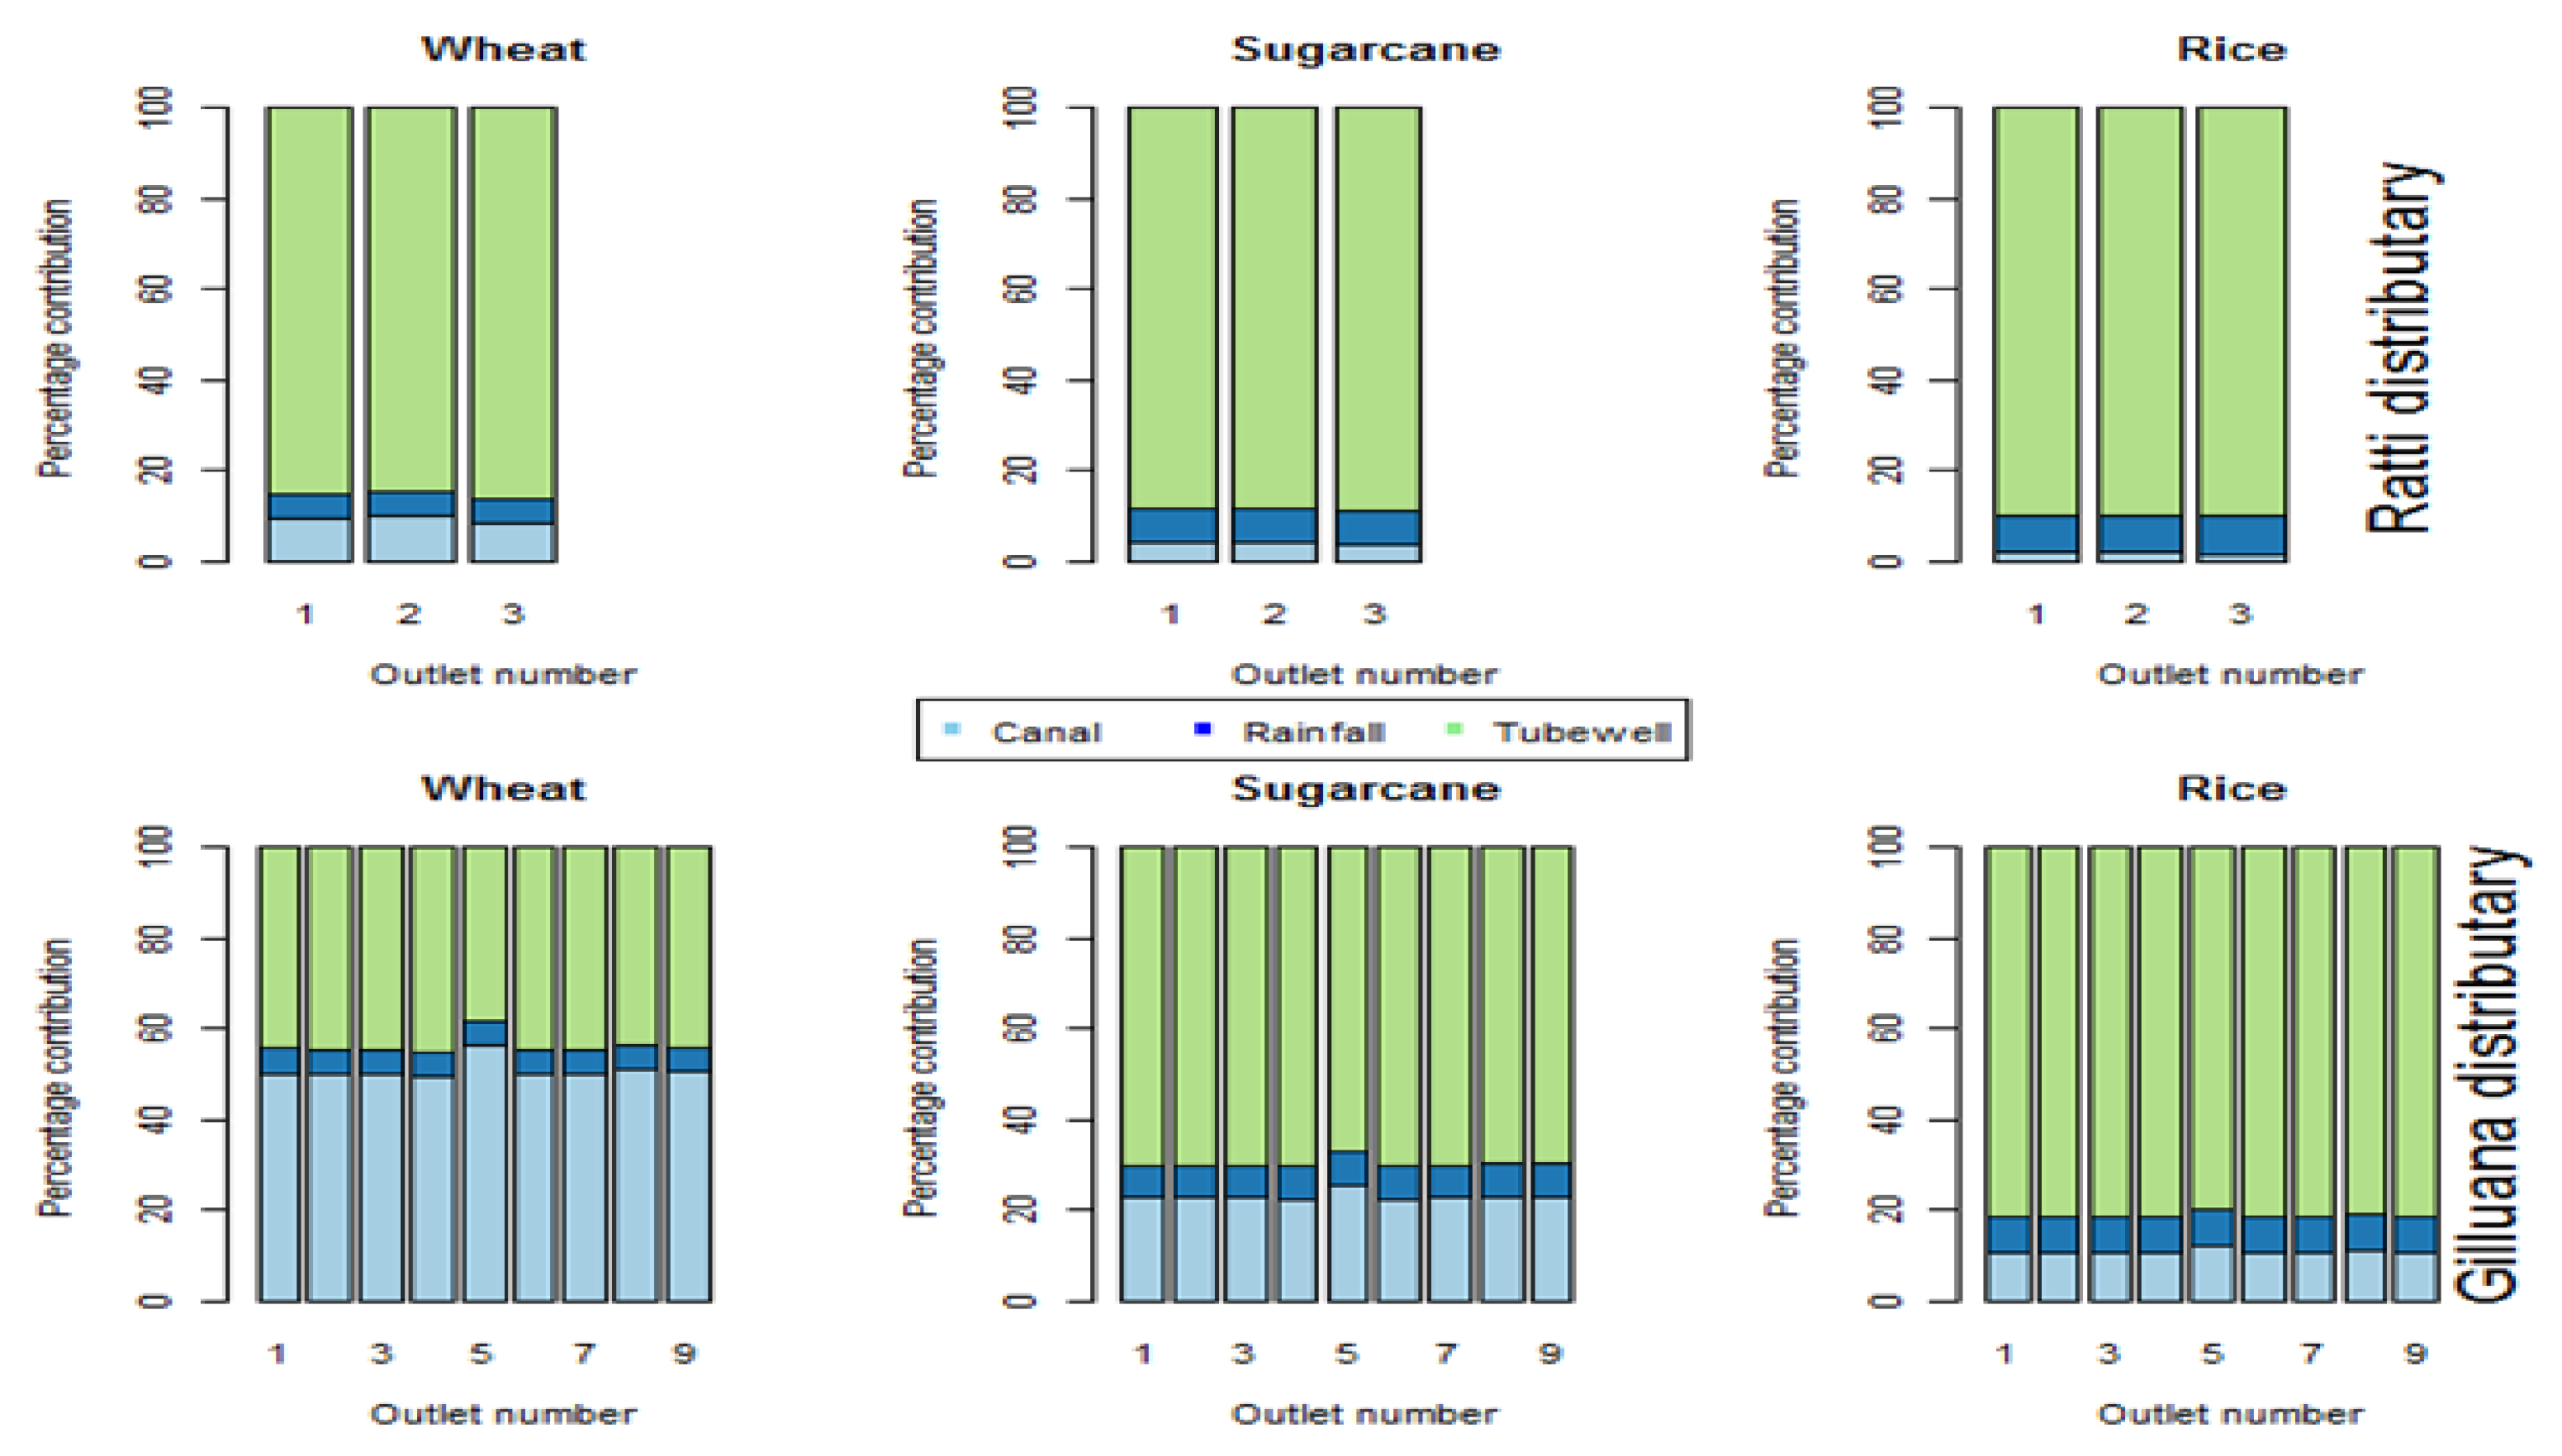
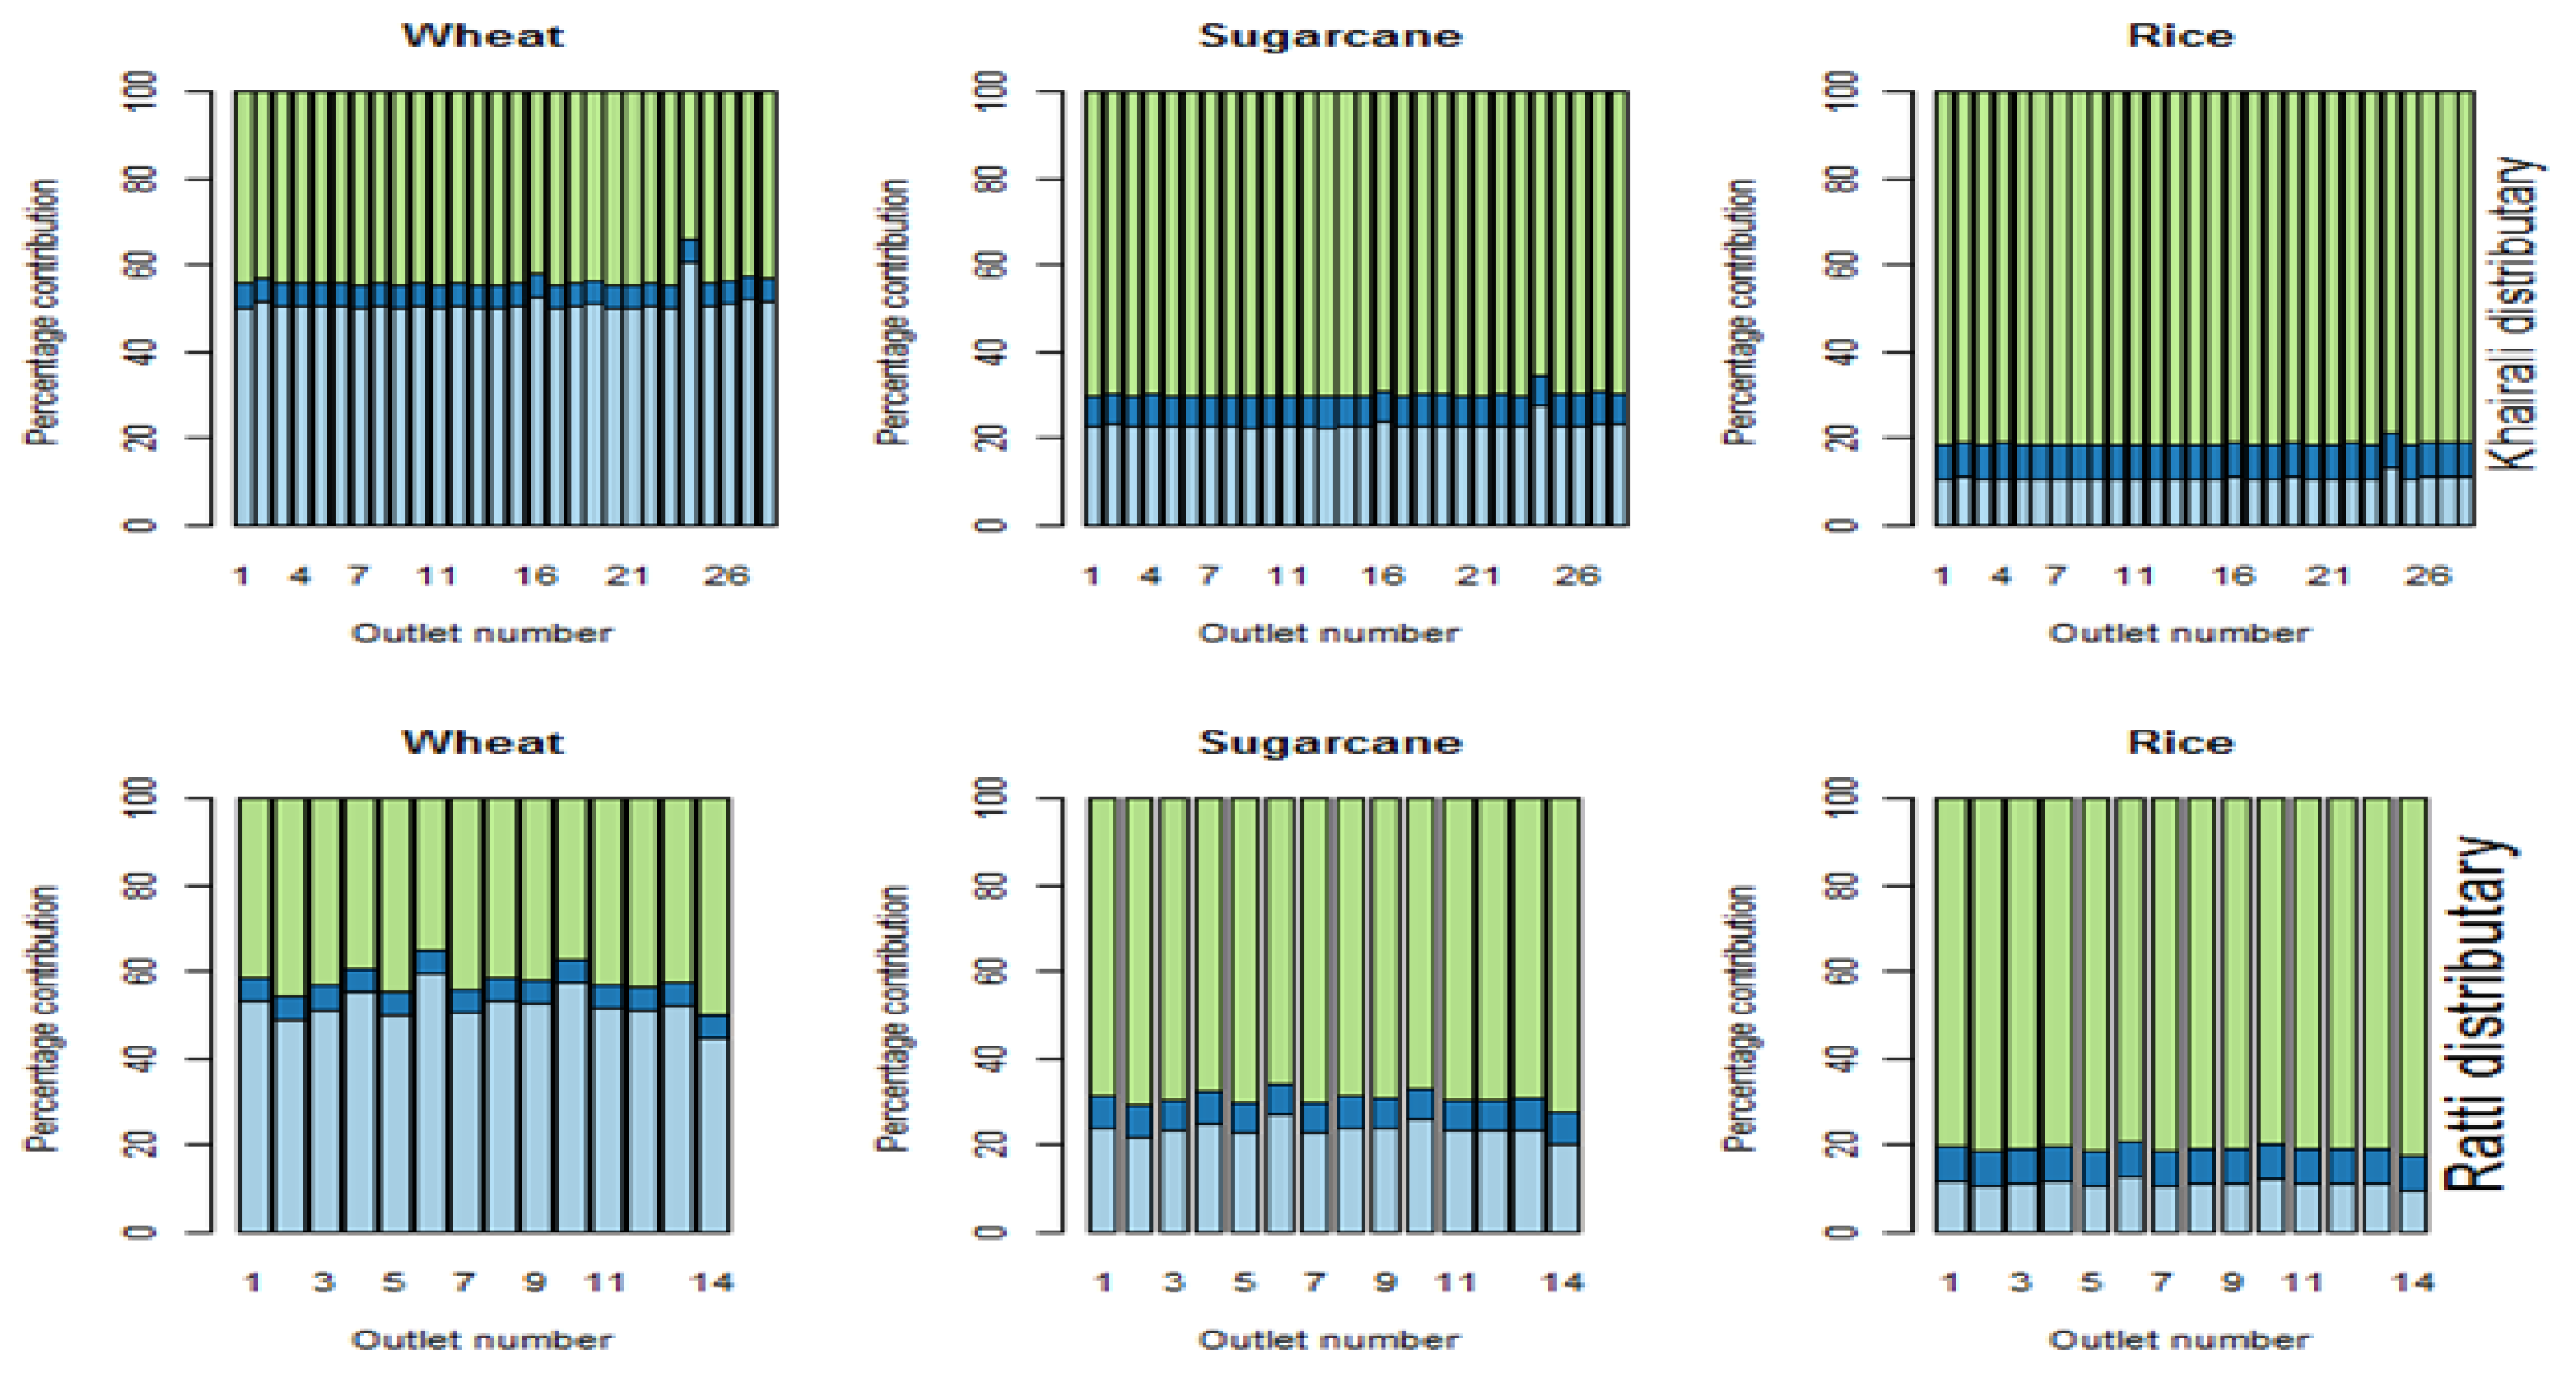
The major sources of irrigation water in Punjab are: (1) canal water which contributes 40% of the total irrigation water (26 MAF); (2) tubewell water supplies 50% of the total irrigation requirements (33 MAF); and (3) rainfall accounts for 10% of water supplies (7 MAF) for irrigation [43,
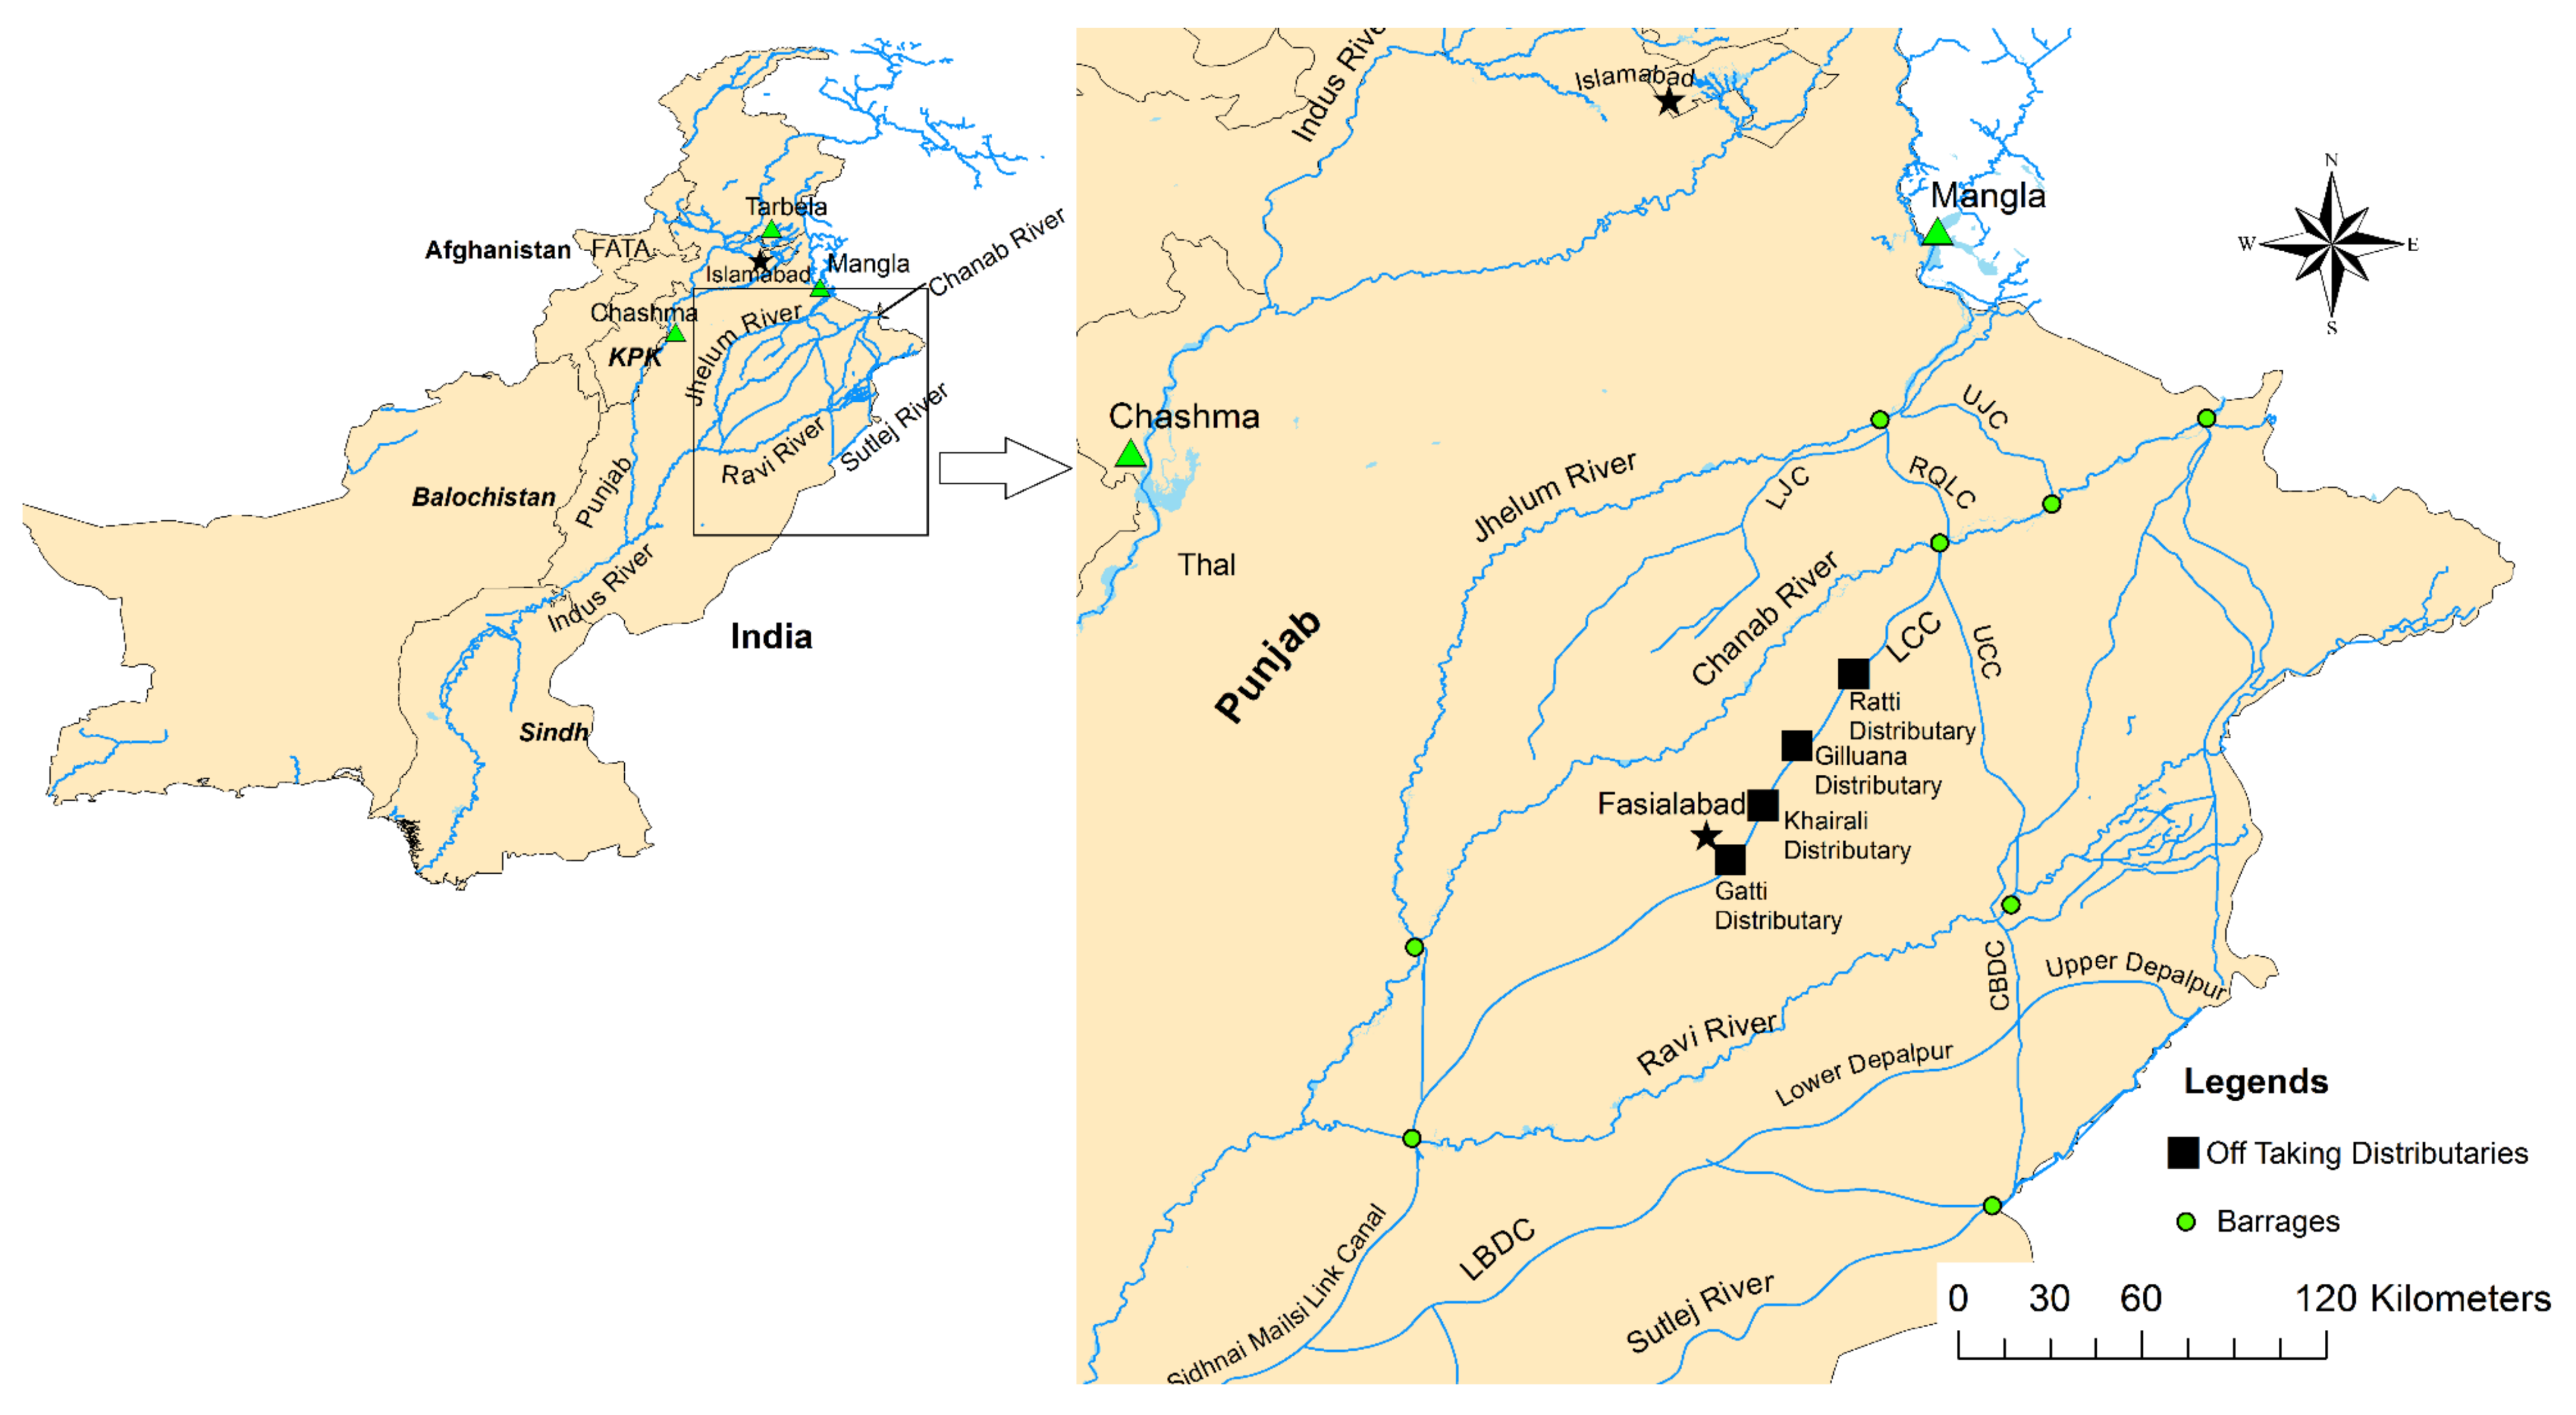
44]. Since our ultimate objective is to find the value of canal water, we therefore had to select a site where canal water is a major means of irrigation. The culturable command area (CCA) of the Rakh branch canal is selected for the implementation of the proposed methodology. The selected area is predominately irrigated by canal water due to better infrastructure which includes a lined branch canal, distributaries, and the majority of water courses. The study area is irrigated by four lined distributaries (Ratti, Gilluana, Khair ali, and Gatti distributaries) of the Rakh branch canal. The lining of irrigation channels ensures the delivery of irrigation water according to the designed criteria. The Rakh branch canal receives perennial canal supplies from the Lower Chenab Canal (LCC) system during the entire year of canal operation except December when the canal is closed for maintenance. The selected distributaries are located at the head, middle, and tail sections of the Rakh branch. A schematic diagram of the LCC illustrating the arrangement of distributaries is given in Figure 2.
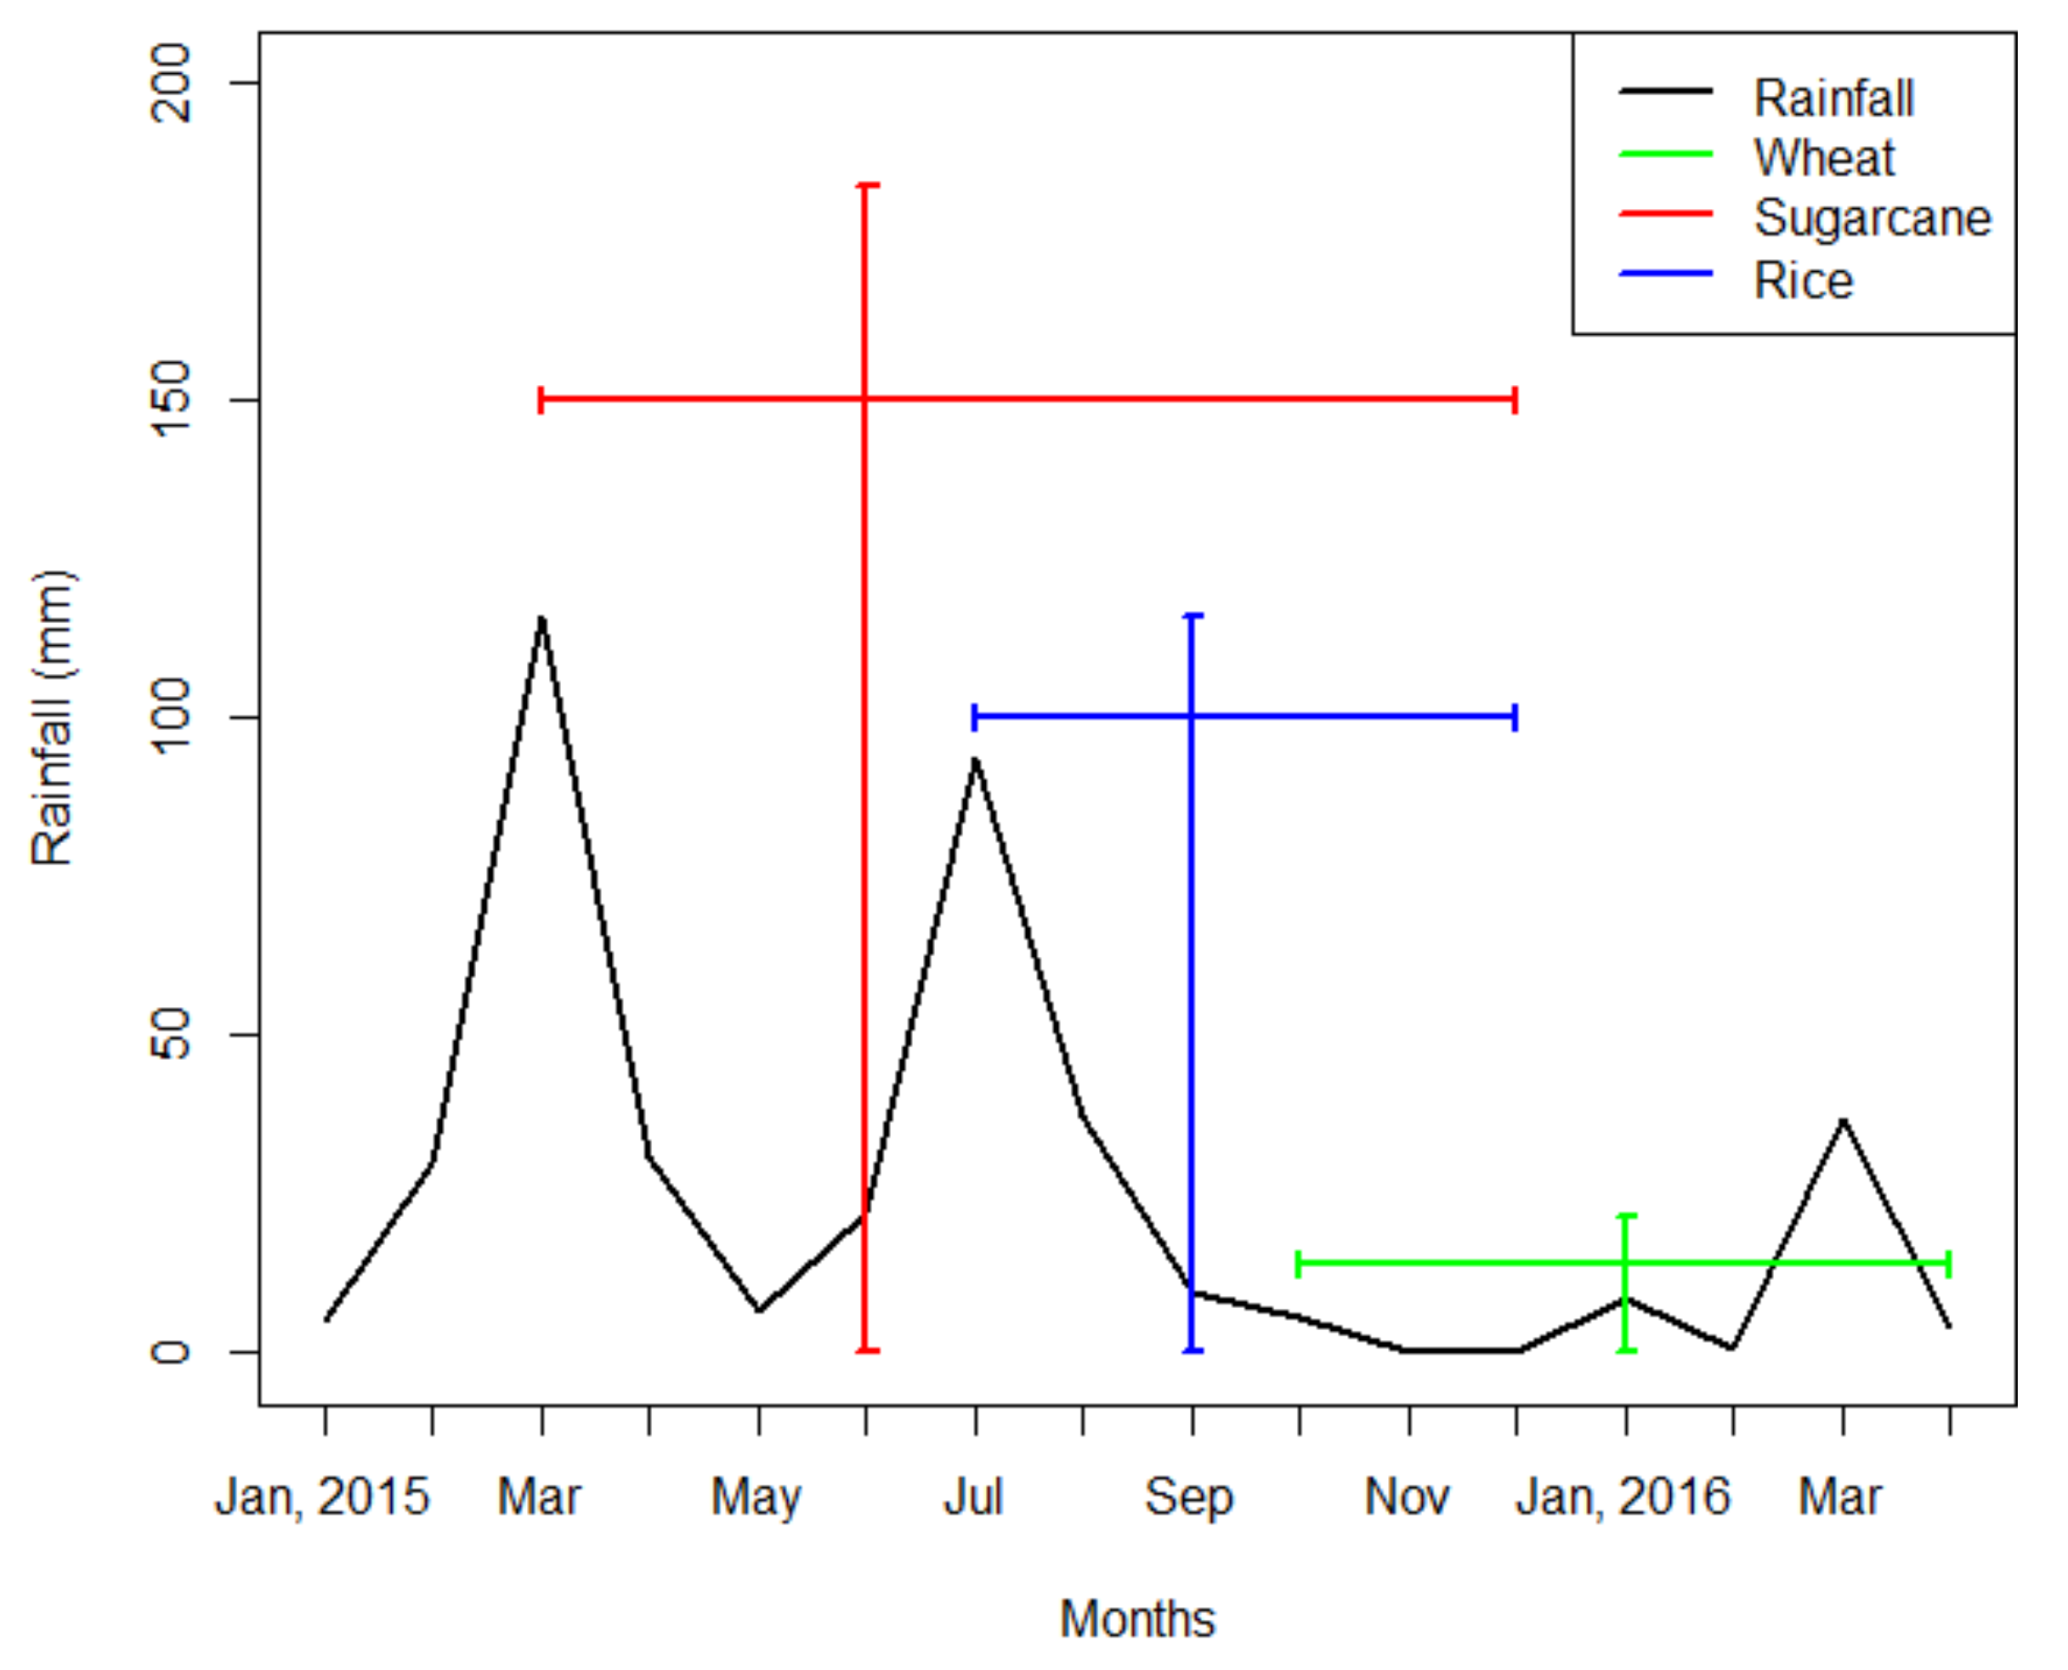
The area is defined as a mixed cropping zone, and analogous to rest of the country, the farmers in the study area are authorized to use the entire volume of water diverted to the water course by the distributary outlet, on a 7-day rotation period under the system called “Warabandi” [45]. Rice, wheat, and sugarcane are the main crops of the area while cotton and maize are not commonly cultivated in the area. The area is considered to be the most fertile area of the province with average output per hectare surpassing the national average. However, the area can still be more productive as the biological potential of the area is fairly higher than the present yield. The gap between average yield and biological potential for various crops in the study area is translated in the following Table 1.
The details of the four distributaries irrigating a total of 10,615.136 hectares of the CCA are summed up in the following Table 2.
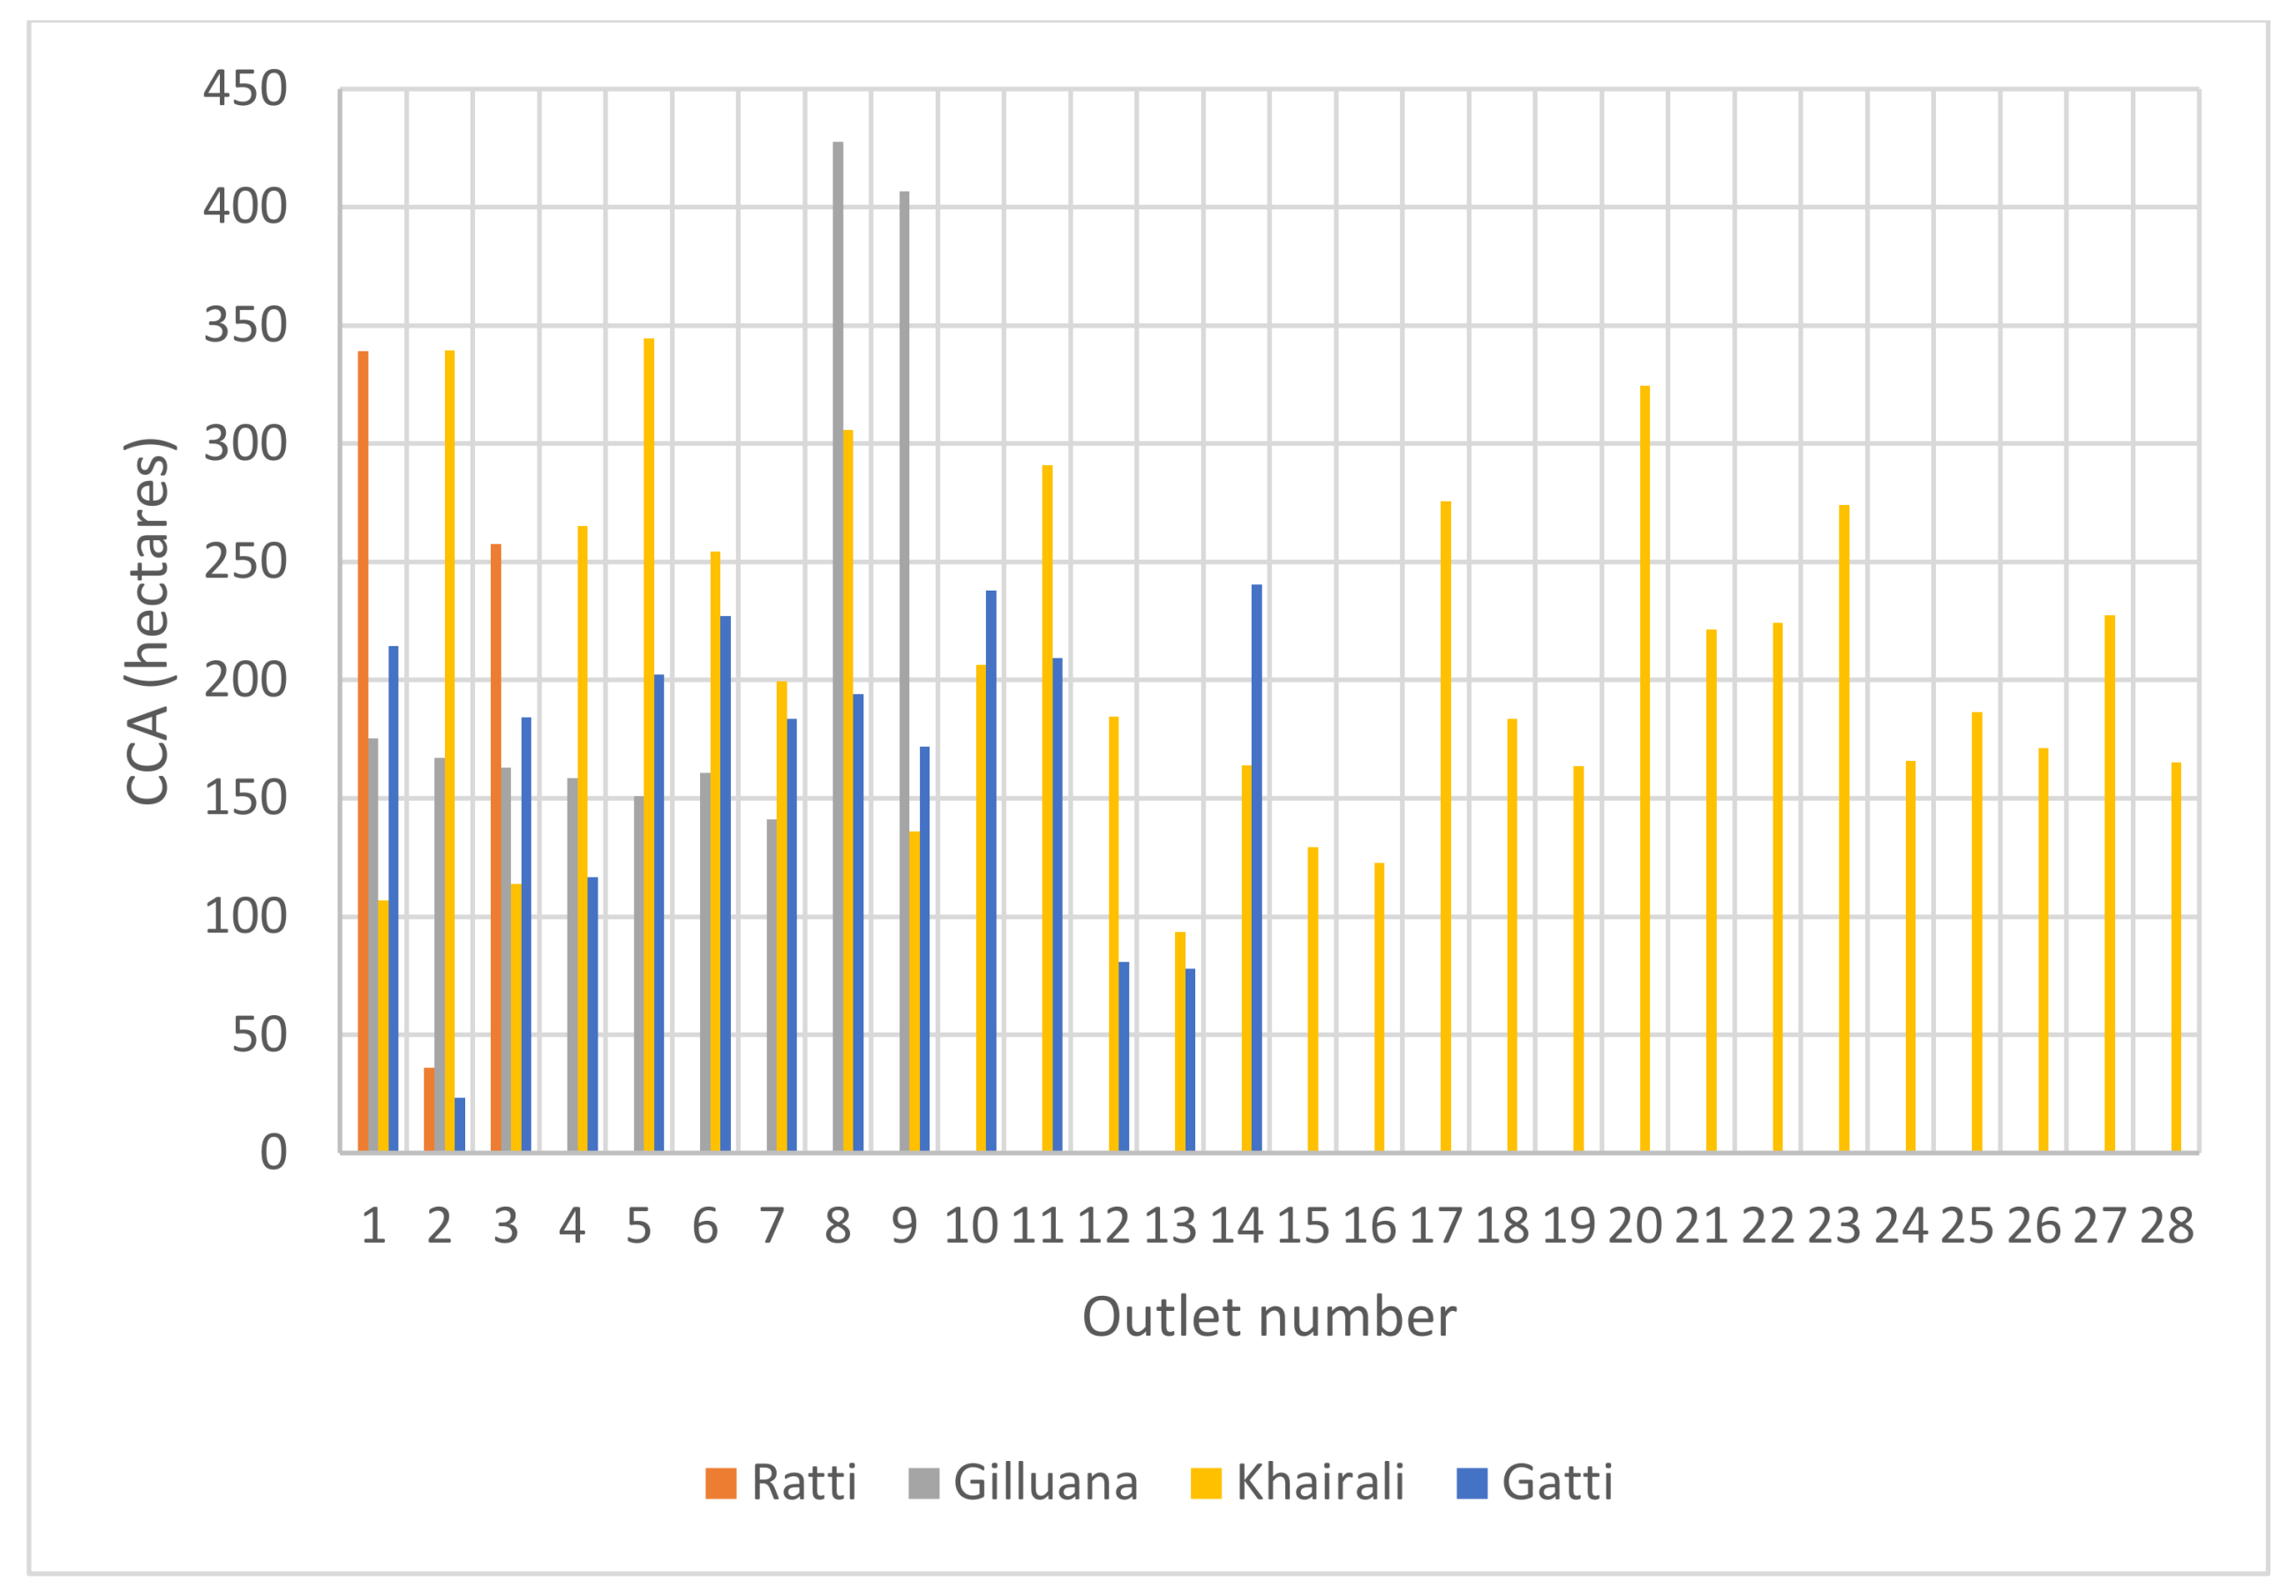
Ratti distributary originates from the head reach of the Rakh Branch Canal and stretches to a length of 0.724 km. The distributary directly serves 3 outlets supplying irrigation water to a total CCA of 643.86 hectares. Each outlet is authorized for an average discharge of 0.0085 m3/s. A flumegate structure at the head of the distributary regulates the discharge magnitude in the distributary given that there is sufficient head available in the Branch canal.
Gilluana Distributary serves a CCA of 1951.437 hectares having a design discharge of 0.419 m3/s. The distributary extends to a total length of 2.832 km and supplies irrigation water to 9 outlets operating at an average authorized discharge of 0.0436 m3/s.
Khairali distributary covers a length of 14.934 km and feeds 28 outlets which ultimately supply irrigation water to 5655.200 hectares of CCA. The distributary is designed to carry a discharge of 1.313 m3/s and is the longest distributary in our selection. The average authorized designed discharge of its outlets is 0.042 m3/s.
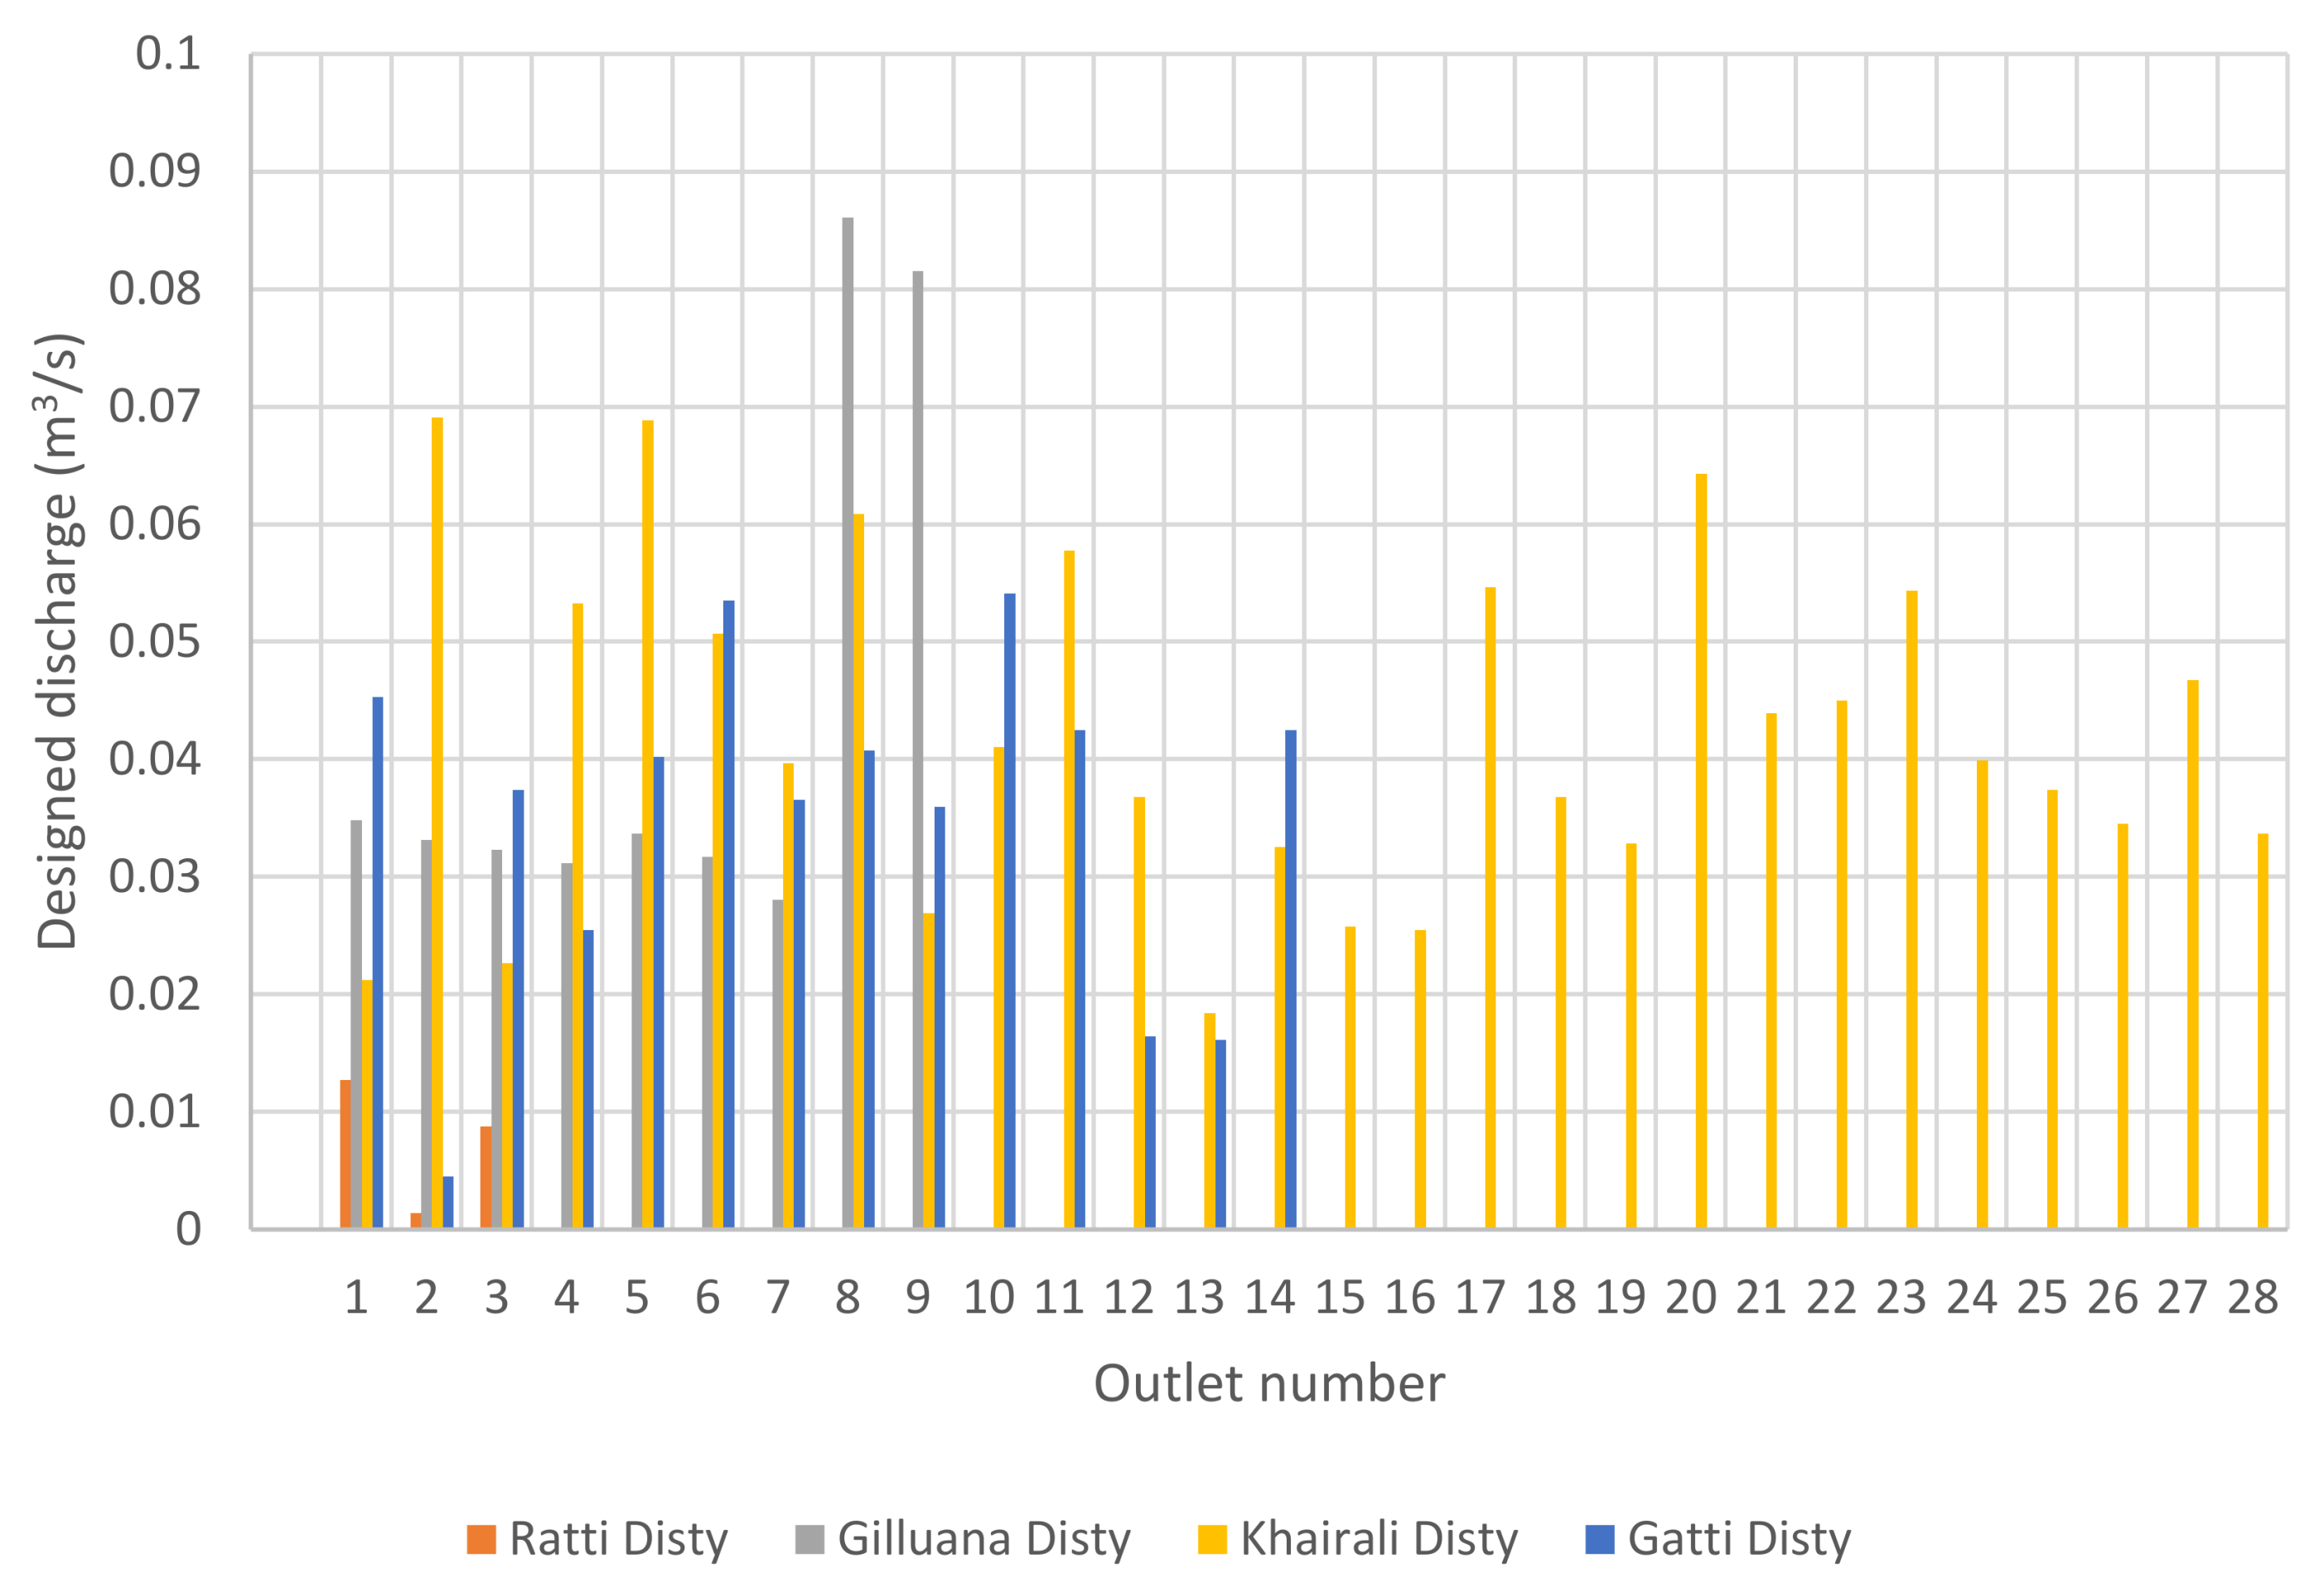
Gatti distributary offshoots from the tail section of Rakh Branch Canal having a total length of 7.515 km and supplies water at a design discharge of 0.582 m3/s. It has 14 outlets operating an average flow rate of 0.0351 m3/s to serve 2364.630 hectares of CCA.
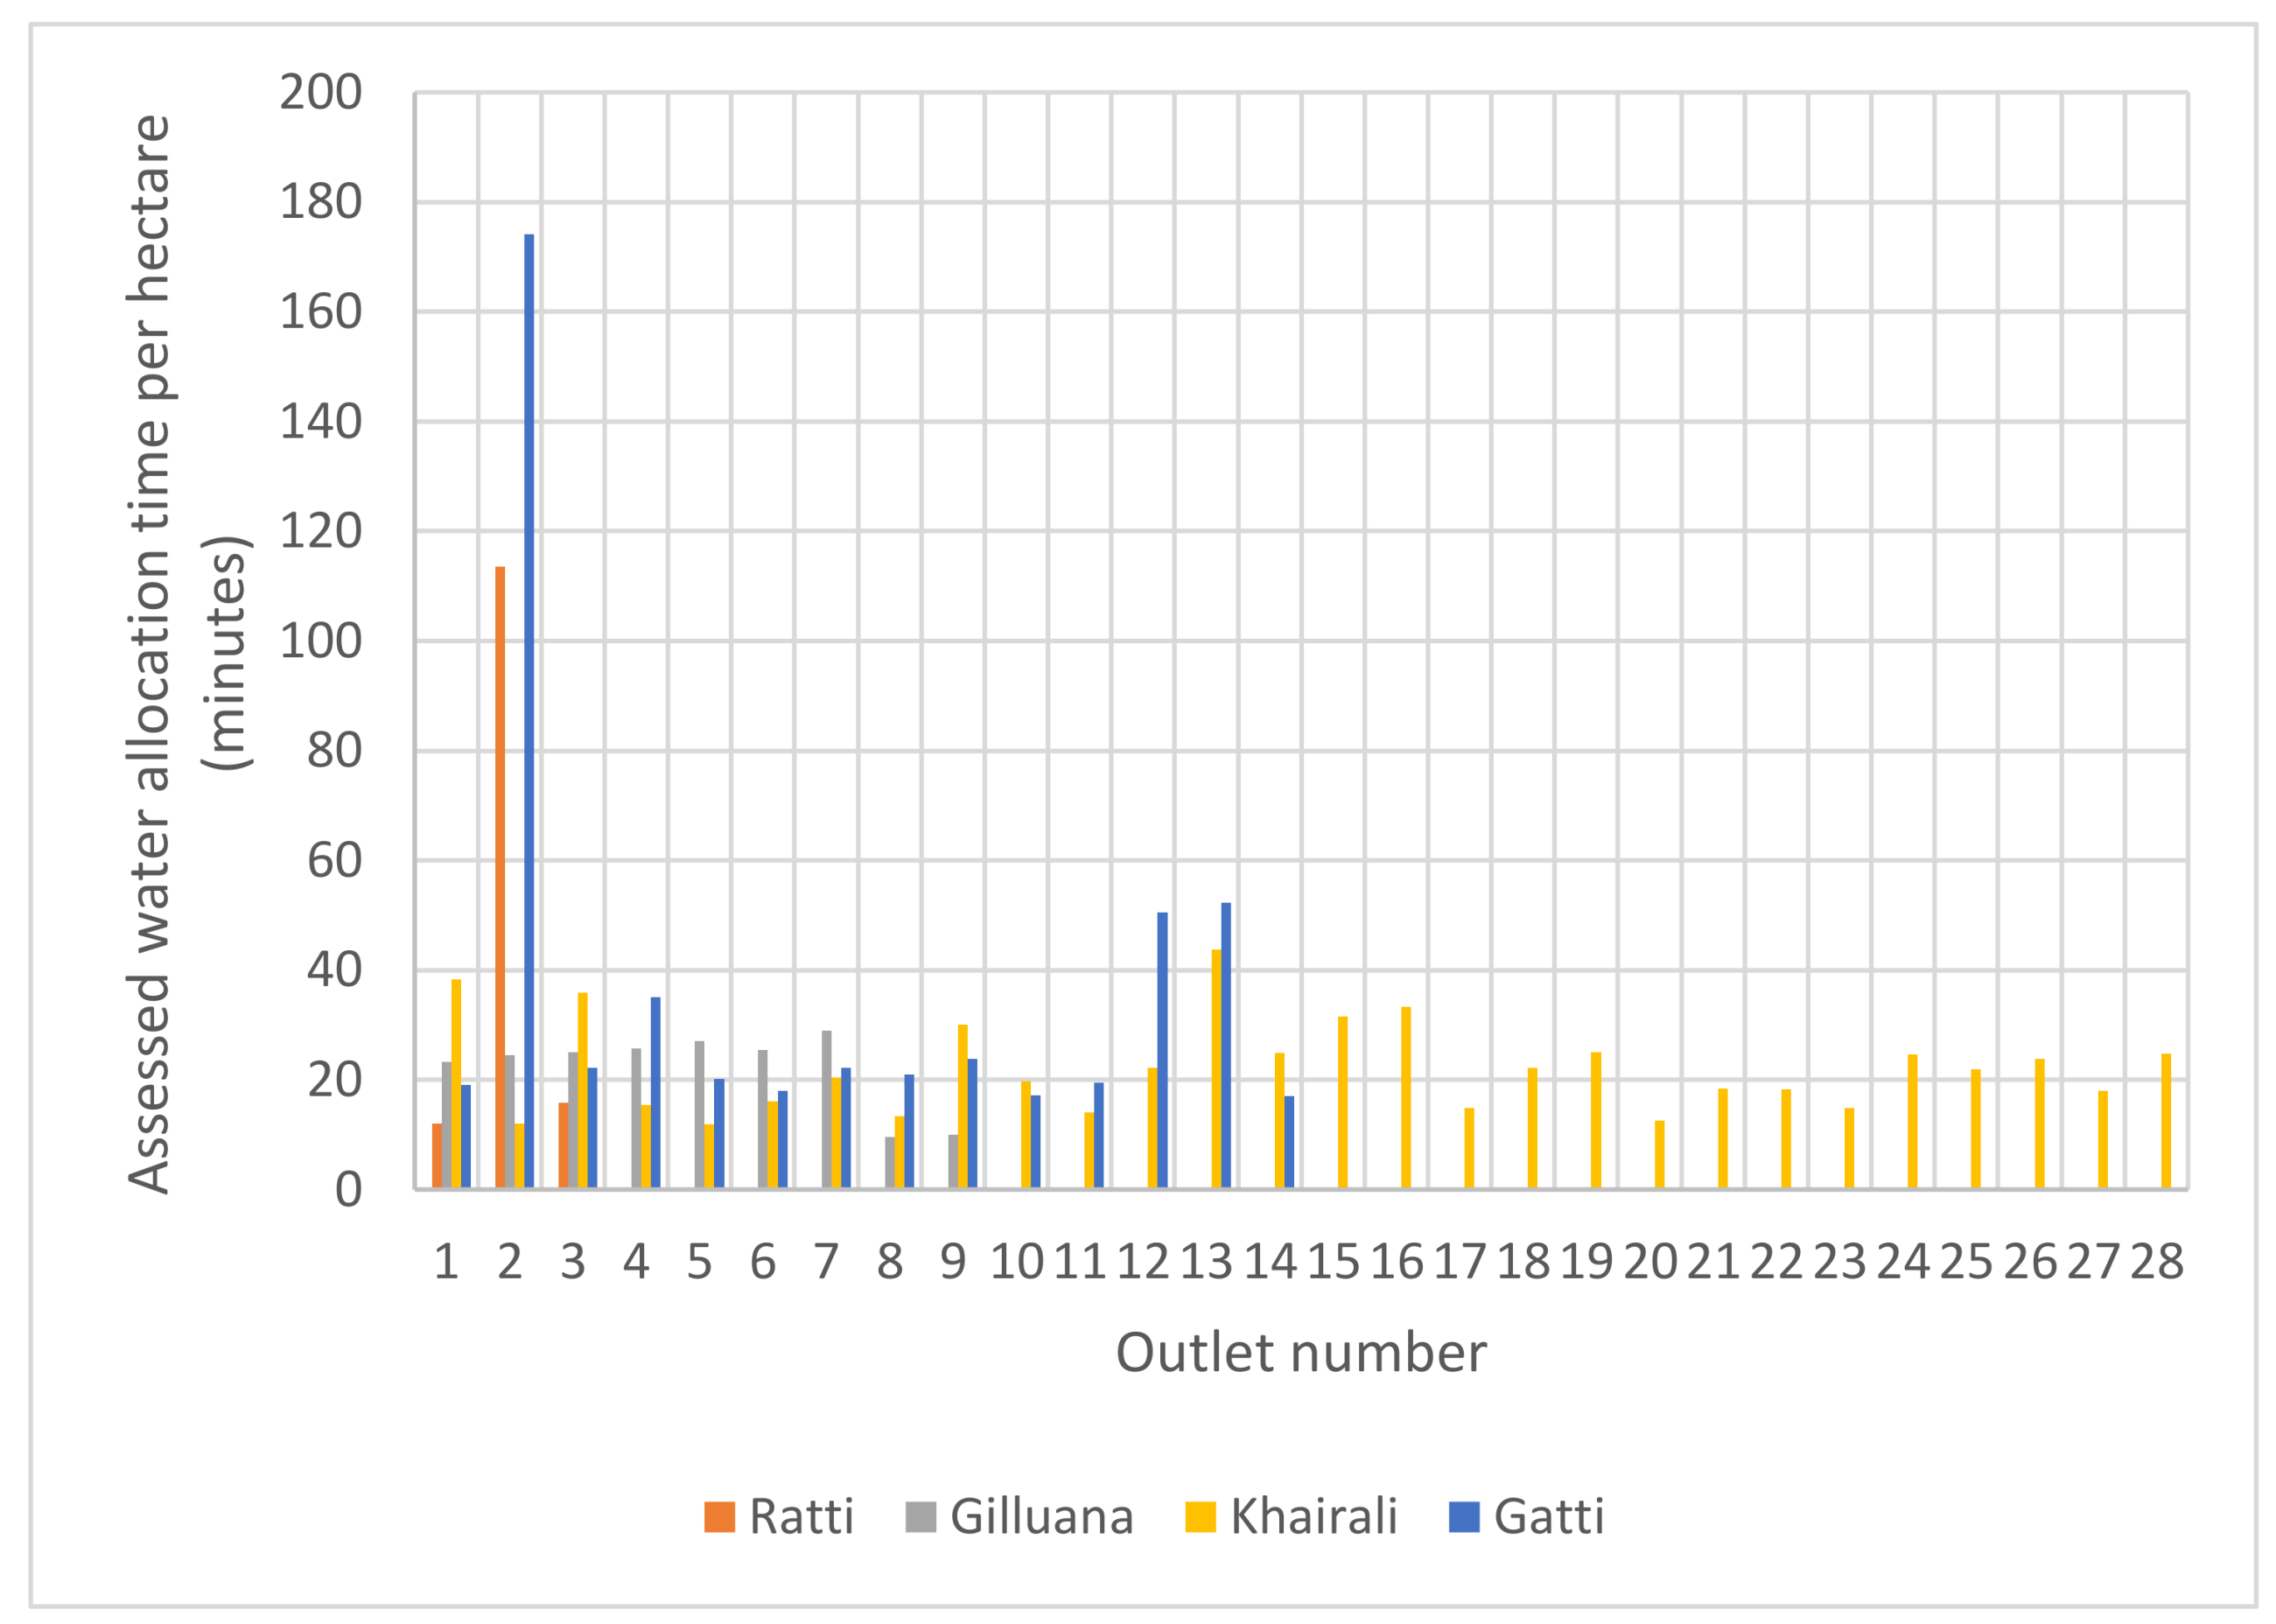
The Ratti distributary, being the smallest in our selection, has the lowest water allowance of 0.039 cumecs/1000 hectares while the other three distributaries have equal water allowance of 0.198 cumecs/1000 hectares. The allocated water is systematically delivered to the field through the outlets, engraved along the entire length of the distributaries, designed to carry only a specific amount of water. The magnitudes of discharge of each outlet in the selected distributaries are presented in Figure 3.

4. Methodology

4.1. Value of Irrigation Water

The economic value of a service or good is measured according to its contribution towards the well-being of a given population [47]. The economic theory states that, analogous to land, water can also be treated as an input in the crop production [48].
This research uses the residual value of water for agriculture in the selected study area to study the allocation of the resource [16]. The application of the proposed model begins with the identification of variables that are defining features of agricultural property. Among other features, the geographical location of the study area is the core factor in defining all the parameters needed to implement our model. It should also be noted that increased size of the study area will certainly increase the number of dominating features that might affect the revenue generated by a farmer from agriculture productivity (e.g., local taxes on land and other inputs). The model conceptualizes around the fact that the agriculture production is the function of input variables. Mathematically, the model can be represented by the following equation:
Y = f ( X L , X M , X G , X I , X W , F C )
  • X L = L a b o u r   i n p u t
  • X M = M a c h i n e r y   o p e r a t i n g   a n d   m a i n t a n a n c e   ( i n c l u d i n g   f e u l )
  • X G = T r a n s p o r t a t i o n   c o s t
  • X i = M a t e r i a l   i n p u t
  • X W = W a t e r   i n p u t
  • F C = F i x e d   c o s t
  • Y = Y i e l d / h e c t a r e
By considering technology available to the farmers in study area as constant and all other features as variables except water, the total revenue generated by a farmer from agricultural output can be written as:
P Y · Y = V M P L · X L + V M P M · X M + V M P G · X G + V M P I · X I + V M P W · X W + F C
where ( P Y · Y ) represents revenue generated from product Y for unit surface (e.g., hectares) and ( V M P i ) is the value of the marginal product of each feature ( X i ) . The VMP defines the incremental change in output value attributed to a unit change in any single input item. For details on VMP, the readers are referred to [49]. The above equation can be made operational by assuming the following three points: (i) total revenue generated by the farmer is the function of capital invested on inputs except water; (ii) the inputs will maximize the output (maximizing behavior i.e., V M P i = P i ) and (iii) the costs of agricultural inputs are provided by the local markets.
Through simple rearrangement of Equation (2), the value of irrigation water can be calculated as:
P W = P Y · Y P L · X L P M · X M P G · X G P I · X I F C X W ;
where X W represents the actual quantity of water consumed by the crops. This variable is very important for the areas where irrigation water is not present in adequate quantity. It can be expressed by the definition of maximum irrigation needs, which is obtained by subtracting Evapotranspiration (ET) from usable (or effective) rainfall computed from an agronomic method based on FAO publications and the actual quantity of irrigation water given to crop. The farmers of areas with a surplus amount of water supply usually supply irrigation water greater than or equal to ET requirements of crop. The amount of water supplied in excess to ET demands of a crop does not increase the yield and so it has no value beyond this point.
The collected datasets both from the field and government departments are used to estimate the numerators of Equation (3), whereas the denominator, which represents the actual quantity of irrigation water supplied to the crop, is estimated by using the irrigation applied to each crop from sowing to harvesting and the depth of irrigation. While the major difference is observed in the values of X M , the values of other variables of Equation (3) are similar for the entire study area, predominately due to the similar farm practices and technology available to the farmers. The reason for the disagreement in the value of X M is the variable quantity of subsurface water extraction by using diesel motor pump tubewells which significantly increases the production cost associated with X M . The diesel driven tubewells in the study area consume 3 L (85.33 PKR/L) of diesel per hour to discharge 0.021 m3/s of water and require 12.355 h to irrigate one hectare of land. It is worth mentioning that due to the recent energy crisis in the country, the electric tubewells have become obsolete and are not used for irrigation in the study area [50].
The economic data for the application of the proposed methodology are based on the value and cost incurred by the farmers for the production of each crop. The field surveys are carried out at the head, middle and tail sections of the selected distributaries to collect the data on farming practices, production per hectare and cost incurred for the production of crops. Altogether, 120 farmers are interviewed. The sample is carefully selected to replicate the provincial average-to-progressive farmers proportion of 90 to 10% [51] because the full pricing mechanism is intended to be put in place in the study-area, evaluated, and extended from the pilot area to the entire province as per the directions of ADB. The progressive farmers, by definition, are considered to be the efficient growers producing relatively higher yield per hectare by eagerly adopting scientific methods of growing, whereas the average farmers adopt traditional inefficient methods of farming, resulting in a loss of precious resources and lower output. The output per hectare, in kilogram, against the resources spent on procuring inputs (in Pakistani rupees) is shown in Figure 4.
It can be interpreted from Figure 4 that the farmers of the study area can be broadly categorized as: (1) average farmers and (2) progressive farmers. The classification is based on the farm size with the latter having a larger size (above 10.12 hectares) than the average farms (of less than 10.12 hectares) [52]. The progressive farmers, on average, are yielding 62.5%, 37.5% and 10.77% more yield per hectare (for wheat, sugarcane and rice, respectively) as compared to the average farmers. The significant increase in the yields are due to a nominal increase in production costs of 13.680, 10.382 and 12.888% for wheat, sugarcane and rice, respectively. The progressive farmers spend the difference in cost on: (1) sowing only certified and graded seeds; (2) soil testing to evaluate the fertility status in order to rationalize the optimum requirement of fertilizers for good yield; (3) consistent soil moisture monitoring for timely application of irrigation water; (4) usage of weedicides to prevent pre-harvest losses; and (5) effective utilization of machinery to prevent post-harvest losses.
Although progressive farmers are producing higher yields, even the present production levels are notably lower than the identified biological potential of the region (see, Table 1). The major constraints that bar farmers from reaching the biological potential are a lack of appropriate technology, inadequate investment in irrigation infrastructure, and lack of quality inputs and resources.
Besides production cost and revenue generated per hectare, the information related to crop rates is trivial for the implementation of Residual Value method (RVM). It was acquired from the official data of Ministry of agriculture and was further cross-validated during the field surveys, whereas the land rent statistics necessary for the execution of RVM are gathered from the “Lambardar” of the area falling within the CCA of the selected distributary and the farmers acquiring land on a rent basis.
However, the fundamental quantity required in the pricing of irrigation water is the volume of water that ultimately irrigates the farmland. The distributaries are the last point where the live flow data is recorded. The PID records data at the head and tail sections of each distributary. The data have recently been made available online at the official website of PID (irrigation.punjab.gov.pk/Search.aspx). Each distributary and its corresponding outlets acquire a fair share of water in case the main perennial canal is operational.
We conducted field surveys in the study area to determine the amount of irrigation that farmers are applying to each crop—from sowing to full maturity. The information regarding maximum evapotranspiration requirements of each crop and average dose of water provided to each crop are summed up in Table 3.
Table 3 shows the availability of water resources in the Rakh branch canal command area. We defined the ratio of water applied and water requirement of a crop as the Relative Irrigation Supply (RIS). For example, the average dose of wheat is 4065.04 m3 against the maximum ET requirement of 4575.64 m3 which results in an average RIS value of 0.88 (i.e., 88% of ET requirements of wheat are fulfilled). It can also be observed that the sugarcane crop (RIS = 1.408) is over irrigated and there is still some room to save water by improving irrigation practices. Besides sugarcane (ETPmax = 108,040 m3), the ET requirement of rice crop is very high (16,089.4 m3) although the duration of the rice crop is only 100–120 days. The average water doses in the study area, as stated above in Table 3, are obtained from the multiple sources, viz. canal water, ground water and rainfall. Due to limited surface water supply in the face of an ever-increasing demand, the increased magnitude of rainfall will minimize the extraction of groundwater but will have no impact on the surface water supplies.
To determine the contribution of rainfall in irrigation, the effective rainfall depth for the study area is calculated by using the agronomic method outlined in FAO publications [53,54]. The effective rainfall depths for different crops in the study area along with the actual rainfall amount and the length of growing season are represented in Figure 5.
The horizontal lines in the Figure 5 represent the length of the growing season for each crop while the vertical lines quantify the contribution of effective rainfall depth to irrigation. Sugarcane is generally sown in February and is harvested in January. It therefore has the longest growing season and the greatest contribution of effective rainfall depth to irrigation. On the contrary, paddy crop has a span of only 100–120 days in the study area, falling in the summer monsoon season, and therefore has a reasonable effective rainfall depth as compared to the wheat crop which spans over 6 months__ 4 months in winter and 2 months in spring. Since the winter season receives considerably less rainfall, the effective rainfall depth is the lowest for wheat among the entire selection of crops.
Assuming that the effective rainfall depth is constant over the entire study area, the percentage contributions of canal, tubewell and rainfall in irrigating wheat, sugarcane and rice crops cultivated in the CCA of the selected distributaries are displayed in Figure 6.

4.2. Pricing Irrigation Water

Within the context of the full supply cost, the Punjab Irrigation and Drainage Authority Act (PIDA) 1997 clearly states that the full supply cost of irrigation systems is to be recovered from the end users within the next 7 to 10 years [41]. Table 4 lists the total full supply cost, including its components (i.e., establishment cost and actual O&M cost), starting from 2003–2004 to 2016–2017.
It can clearly be seen from Table 4 that the Irrigation Department collected only a fraction (about 20%) of the full supply cost while the difference is shared by the provincial government. Strictly speaking, a reasonable amount of 111,468 millions PKR is paid by the provincial government in the last 14 years (2003–2016) at an annual average of 7962 millions. In the given span of time (2003–2016), the full supply cost is increased from 4263 to 11,398 millions to the corresponding decrease of 1205 to 1017 millions for the revenue collected. Conclusively, the irrigation related infrastructure is persistently underfunded which speaks volume for its financial unsustainability [9]. It is also a matter of great concern that almost 70% of total full supply cost is consumed in operational needs (establishment cost) compared to only 30% which is actually spent on the maintenance of infrastructure.
For the sustainability of the irrigation system, it is inevitable to collect the full supply cost from the end users. To this end, we linked the irrigation pricing per hectare ( P i / W ) with the full supply cost by using the following newly developed equation;
P i / W = [ ( Q d T 60 ) L G S W T ] η C
where;
  • Q d = Designed discharge of distributary outlet ( m 3 s )
  • L G S = Length of growing season (days)
  • η C = Unit price coefficient = C O / M V F / G
  • C O / M = Total O&M cost for a given fiscal year (PKR)
  • V F / G = Volume of canal water available at the farm gate (m3)
  • T = Assessed allocated irrigation time per hectare in Warabandi system (min) = d i * 166.670 Q d
  • d i = Uniform irrigation depth (m) = 8.640 * ( Q d * W T ) C C A
  • W T = Complete cycle of water rotation (days)
  • C C A = Culturable command area of distributary (hectare)
The above Equation (4) consists of the product of the total volume of water ( in   m 3 ) applied during irrigation ( Q d T 60 ) , number of irrigation events ( L G S W T ) , and the maintenance cost (in PKR) required per unit volume of water ( η C ) . The assessed allocated irrigation time ( T ) in Equation (4) defines the actual time for which the CCA of a specific outlet is irrigated during each irrigation event in Warabandi. Figure 7 shows the values of T for each outlet of the selected distributaries, while the CCA of each outlet is shown in Figure 8.
Some of the fundamental parameters of Equation (4), viz., Q d ,   L G S ,   C O / M ,   T ,   and   C C A are respectively extracted from Figure 3 and Figure 5, Table 4, Figure 7 and Figure 8, whereas, the availability of 26 MAF of water at the farmgate of Punjab and the 7-day water rotation cycle in the study area set the values of V F / G and W T , respectively.

5. Results

5.1. Economic Characterization of Irrigated Crops in Rakh Branch Command Area

Equation (3) is solved for the CCA of Rakh branch for three major crops (Wheat, Sugarcane and Rice) and the results for average and progressive farmers are presented in Table 5.
Table 5 describes the residual value of water for the considered crops in the study area for 2016–2017 data. The “apparent water productivity” is executed by dividing “total sales of crop per hectare” or “total income generated per hectare” by water usage, whereas, the residual value of water is calculated by excluding all the other paid factors by the farmer (e.g., Land rent).
It can be clearly noticed that (out of three considered crops) wheat has maximum apparent water productivity and residual value as compared to sugarcane and rice. From this it should never be concluded that irrigating other crops is irrational because crops cannot be analyzed in isolation [55]. For example, if irrigating sugarcane is considered in isolation, it may seem as if due to low value of water, sugarcane should not be irrigated. However, the whole sugar industry, which generates thousands of direct and indirect jobs, is dependent on this crop. Moreover, different crops are needed to optimize the agronomic system as a whole.

5.2. Irrigation Water Pricing for Full Cost Recovery

Having set the values of parameters in Equation (4), we calculate the annual price of irrigation water per hectare for the CCA falling under each outlet of the selected distributaries. The revised prices to recover the full cost of O&M are recommended in Figure 9A and are compared with the case when recovery cost includes infrastructure maintenance cost only (see Figure 9B).
It can clearly be interpreted from Figure 9A that the irrigation water in the command area of Rakh branch canal is severely under charged ever since the introduction of the flat-rate irrigation pricing system. The maximum deficit is observed for the Khairali distributary, whereas the Ratti distributary showed the least deficit. It can be further noted from Figure 9B that the prices for each distributary are reduced to almost one-third if only the infrastructure maintenance cost is recovered from the farmers. Apart from the annual water prices for the CCA falling under each outlet discussed in Figure 9, the crop-wise rates considering the volume of water each crop consumes from sowing to harvesting in the study area are also analyzed and summed in Table 6.
The above table reports that the seasonal crops are consuming water far above the set seasonal prices in the CCA of all the selected distributaries. The situation is even worse for Gilluana, Khairali and Gatti distributaries as present water charges are not even recovering the O&M only, let alone the full cost recovery. On the contrary, due to comparatively lower water allowance, the Ratti distributary has not only the lowest deficit between cost and recovery but also recovers the O&M cost.
The advised rates are very high as compared to the current water charges. However, the proposed prices are nominal when compared to the pumping cost of groundwater using tube-wells. It is estimated for the case study area that 1000 m3 of canal water even with modified rates costs 374.3 PKR against 3113.6 PKR needed to extract the same volume from sub-surface resources.
The seemingly obvious drawback of shifting from flat-rates to a full cost recovery model is a noticeable dip in the farmers’ income. Therefore, the resistance of the average farmers against the full cost recovery model seems logical. The resistance can be minimized effectively by facilitating the farmers and ensuring the same profitability of the farmers even after the introduction of the full cost recovery system. It can be ensured by either one or a combination of the following options: (1) tax evasion; (2) decreasing conveyance losses or increasing availability of canal water; and (3) increasing average productivity per hectare. The response of water value against these options is mapped in the following panels of Figure 10.
The green shade in Figure 10 represents the extent to which these compensations can be extended in the present circumstances related to the agricultural sector of the province. Against the traditional perception, tax evasion has the least impact on the improvement of the value of water, whereas increased productivity exponentially improves the value of water for three crops. Moreover, although tax evasion can be an instantaneous relief, it will directly put pressure on public money, whereas, the increasing conveyance efficiency or constructing new reservoirs can take a longer time because the option requires lined water channels or public consensus on the issue (of constructing new water reservoirs). Therefore, the most feasible option is to increase productivity of the average farmers. The increased productivity is not only possible; physical examples of progressive farmers can be found in the region. Bringing production to the level of progressive farmers will not only increase the water value but will also increase the farmers’ revenue even after increased water pricings. During the field survey, it was noticed with a grave concern that the lack of awareness and lack of intent to change are the core reasons preventing the average farmers from adopting a more functional frame of reference. For example, most of the farmers acquire the seeds from private dealers instead of buying from certified dealers of provincial seed corporations, thus compromising the productivity. Moreover, the average farmers seldom get their soil quality checked and continue using inputs based on their judgement. The continuous crop production squeezes the nutrients out of the soil and thus with the passage of time, the demand for fertilizer increases [56]. These small factors might not be seen as significant when observed in isolation but they impact greatly on the productivity when analyzed in totality. Therefore, following these rules can reduce the difference between average and progressive farmers. Alongside the aforementioned reasons, another reason for lower productivity is the continuous shrinking of average farm sizes in Punjab, which decreases efficiency of agricultural farming and ultimately the profitability [57].

6. Discussions

The application of this method has the advantage of simplicity and the easiness of replications once the values of variables defined in pricing equation are known for the outlets of a selected distributary. Evidently, the method defines the price of irrigation water as the function of volumetric quantity of water applied to the farm land each year. Therefore, the areas with lower water supply are charged less. For example, the Ratti distributary has a lower water allowance than the other three distributaries; therefore, the proposed prices for Ratti are lower, thus signifying how effectively the logical connection between water pricing and quantity supplied is explained by the proposed model.
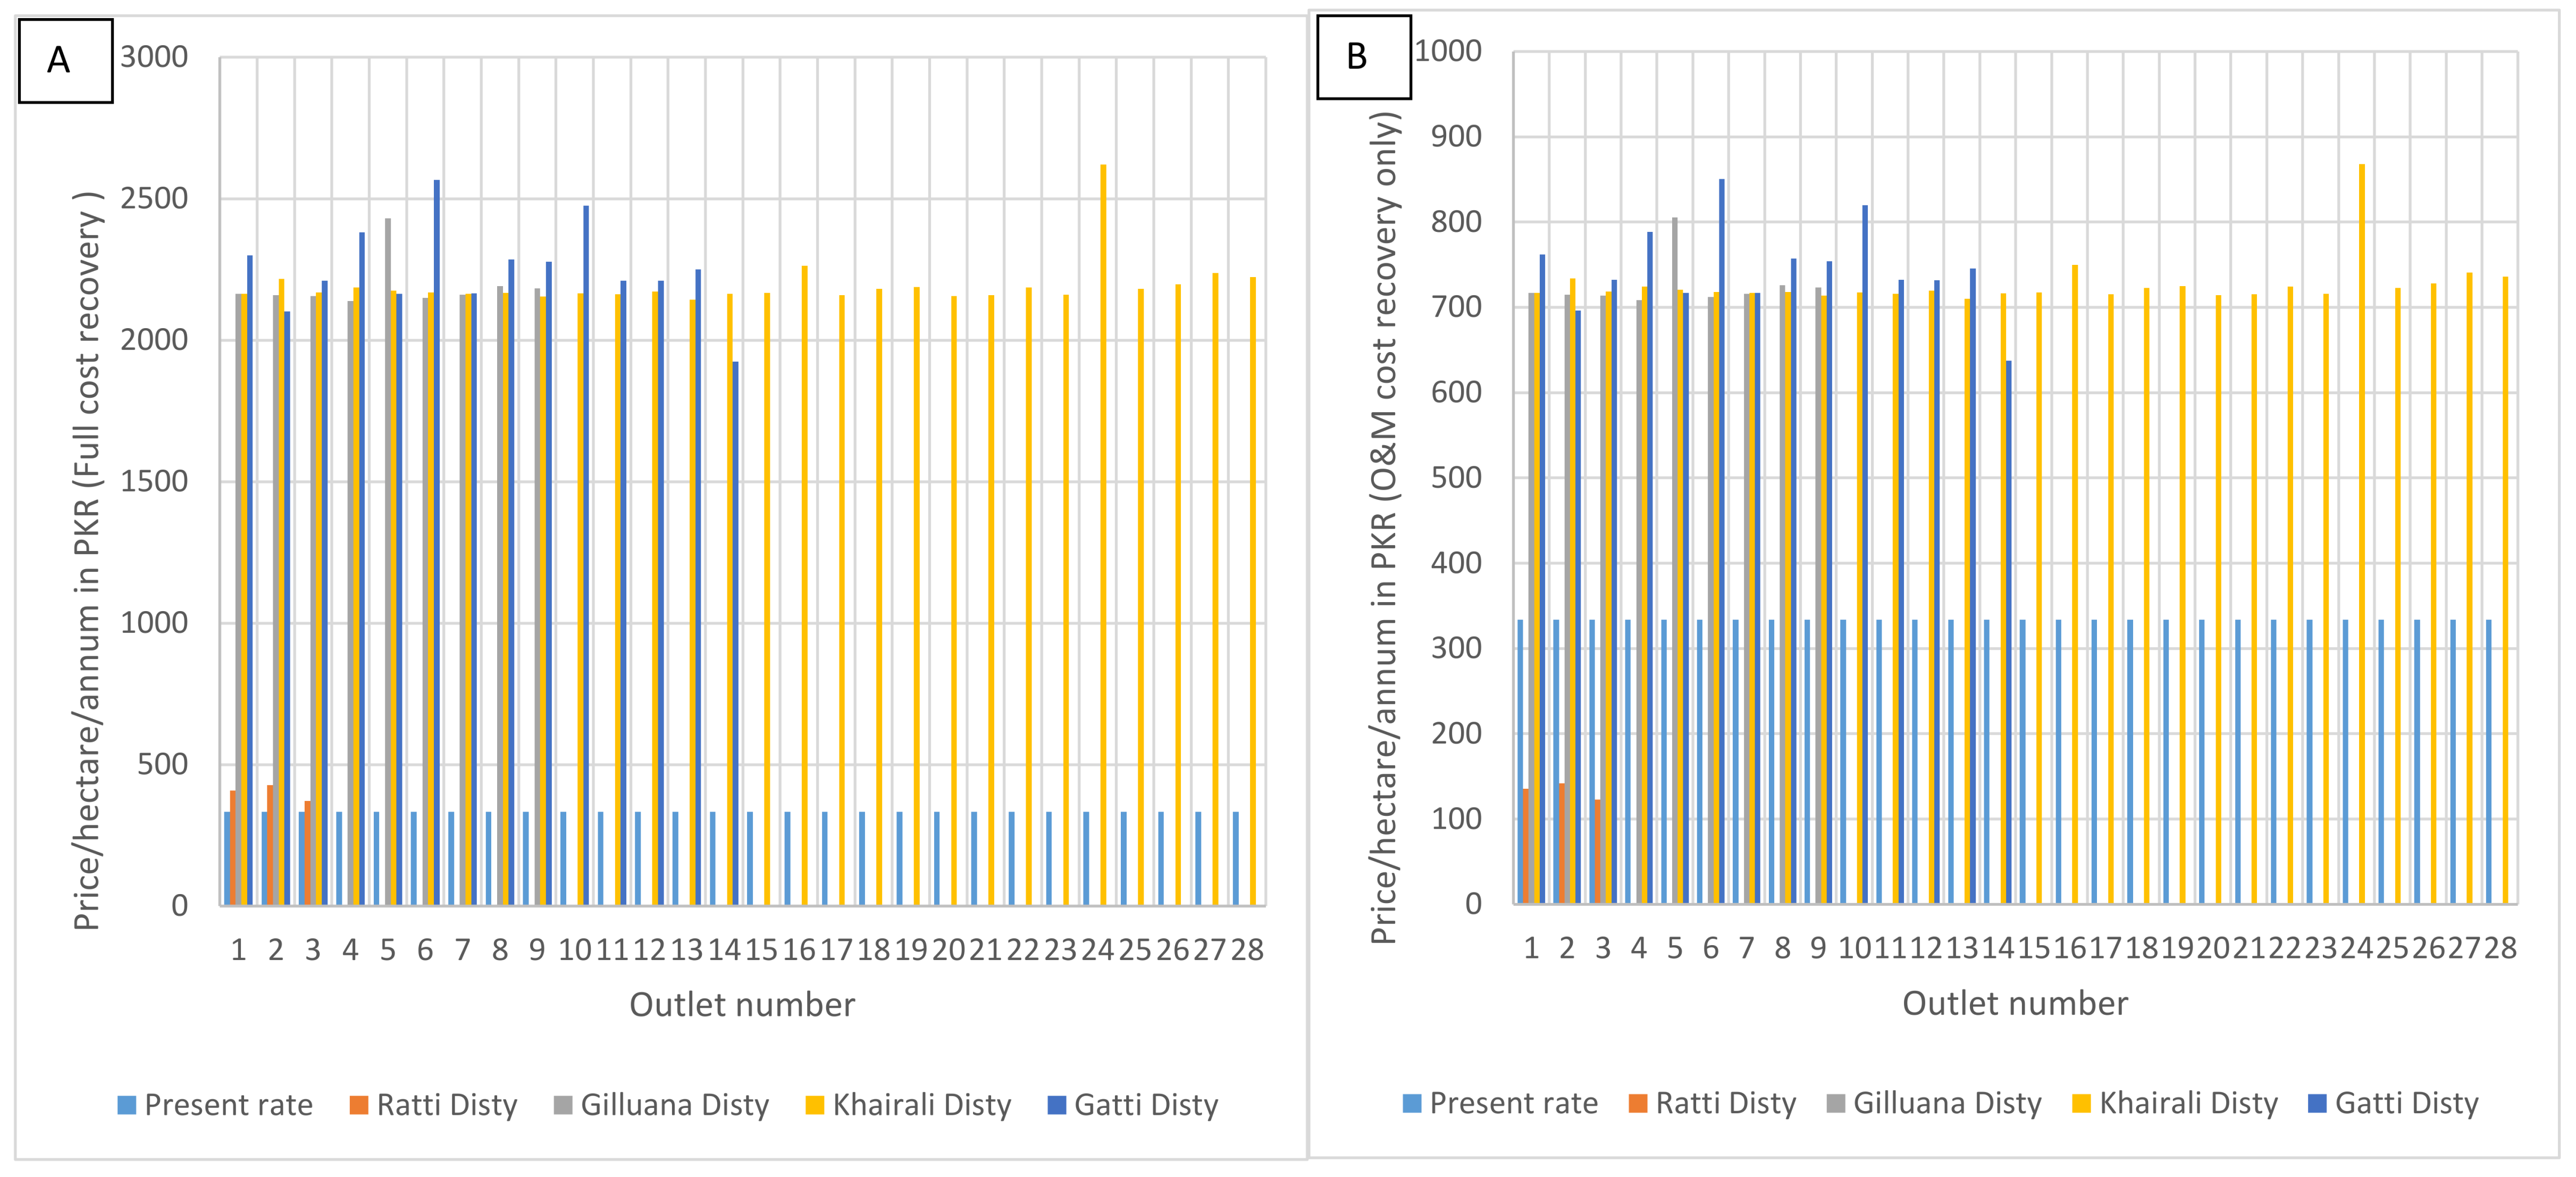
The proposed water prices are 5.0%, 7.9% and 7.5% of the value of water in Gilluana, Khairali and Gatti distributaries and 6.0%, 9.7% and 8.0% in Ratti distributary for wheat, sugarcane and rice crops, respectively. The recommended prices are 3 to 9 times higher than the existing water prices against the value of water. Moreover, the deficit between full cost recovery and collection is increasing with the passage of time (see, Table 4). This difference should be minimized to achieve sustainability, keeping in mind the thin financial conditions of the small farmers which constitute the majority in Punjab’s agriculture and are mostly going to be affected by an increase in water price. One recommended solution is a phasal increase in water cost with initial emphasis on either full cost recovery from the progressive farmers owning large farms or recovering 100% of infrastructure maintenance cost only. However, with the involvement of the majority of the rural work force in the field of agriculture, there are also political reasons for the significant under-charging of canal water. Therefore, the adoption of proposed water prices will be challenging and the implementation needs to be systematic so that the sales and incomes of the farmers are well in line with their logical expectations. There should be a long-term political consensus across the board to implement the plan of full recovery prices. The plan should then be rigorously followed by the elected political administration of the province.
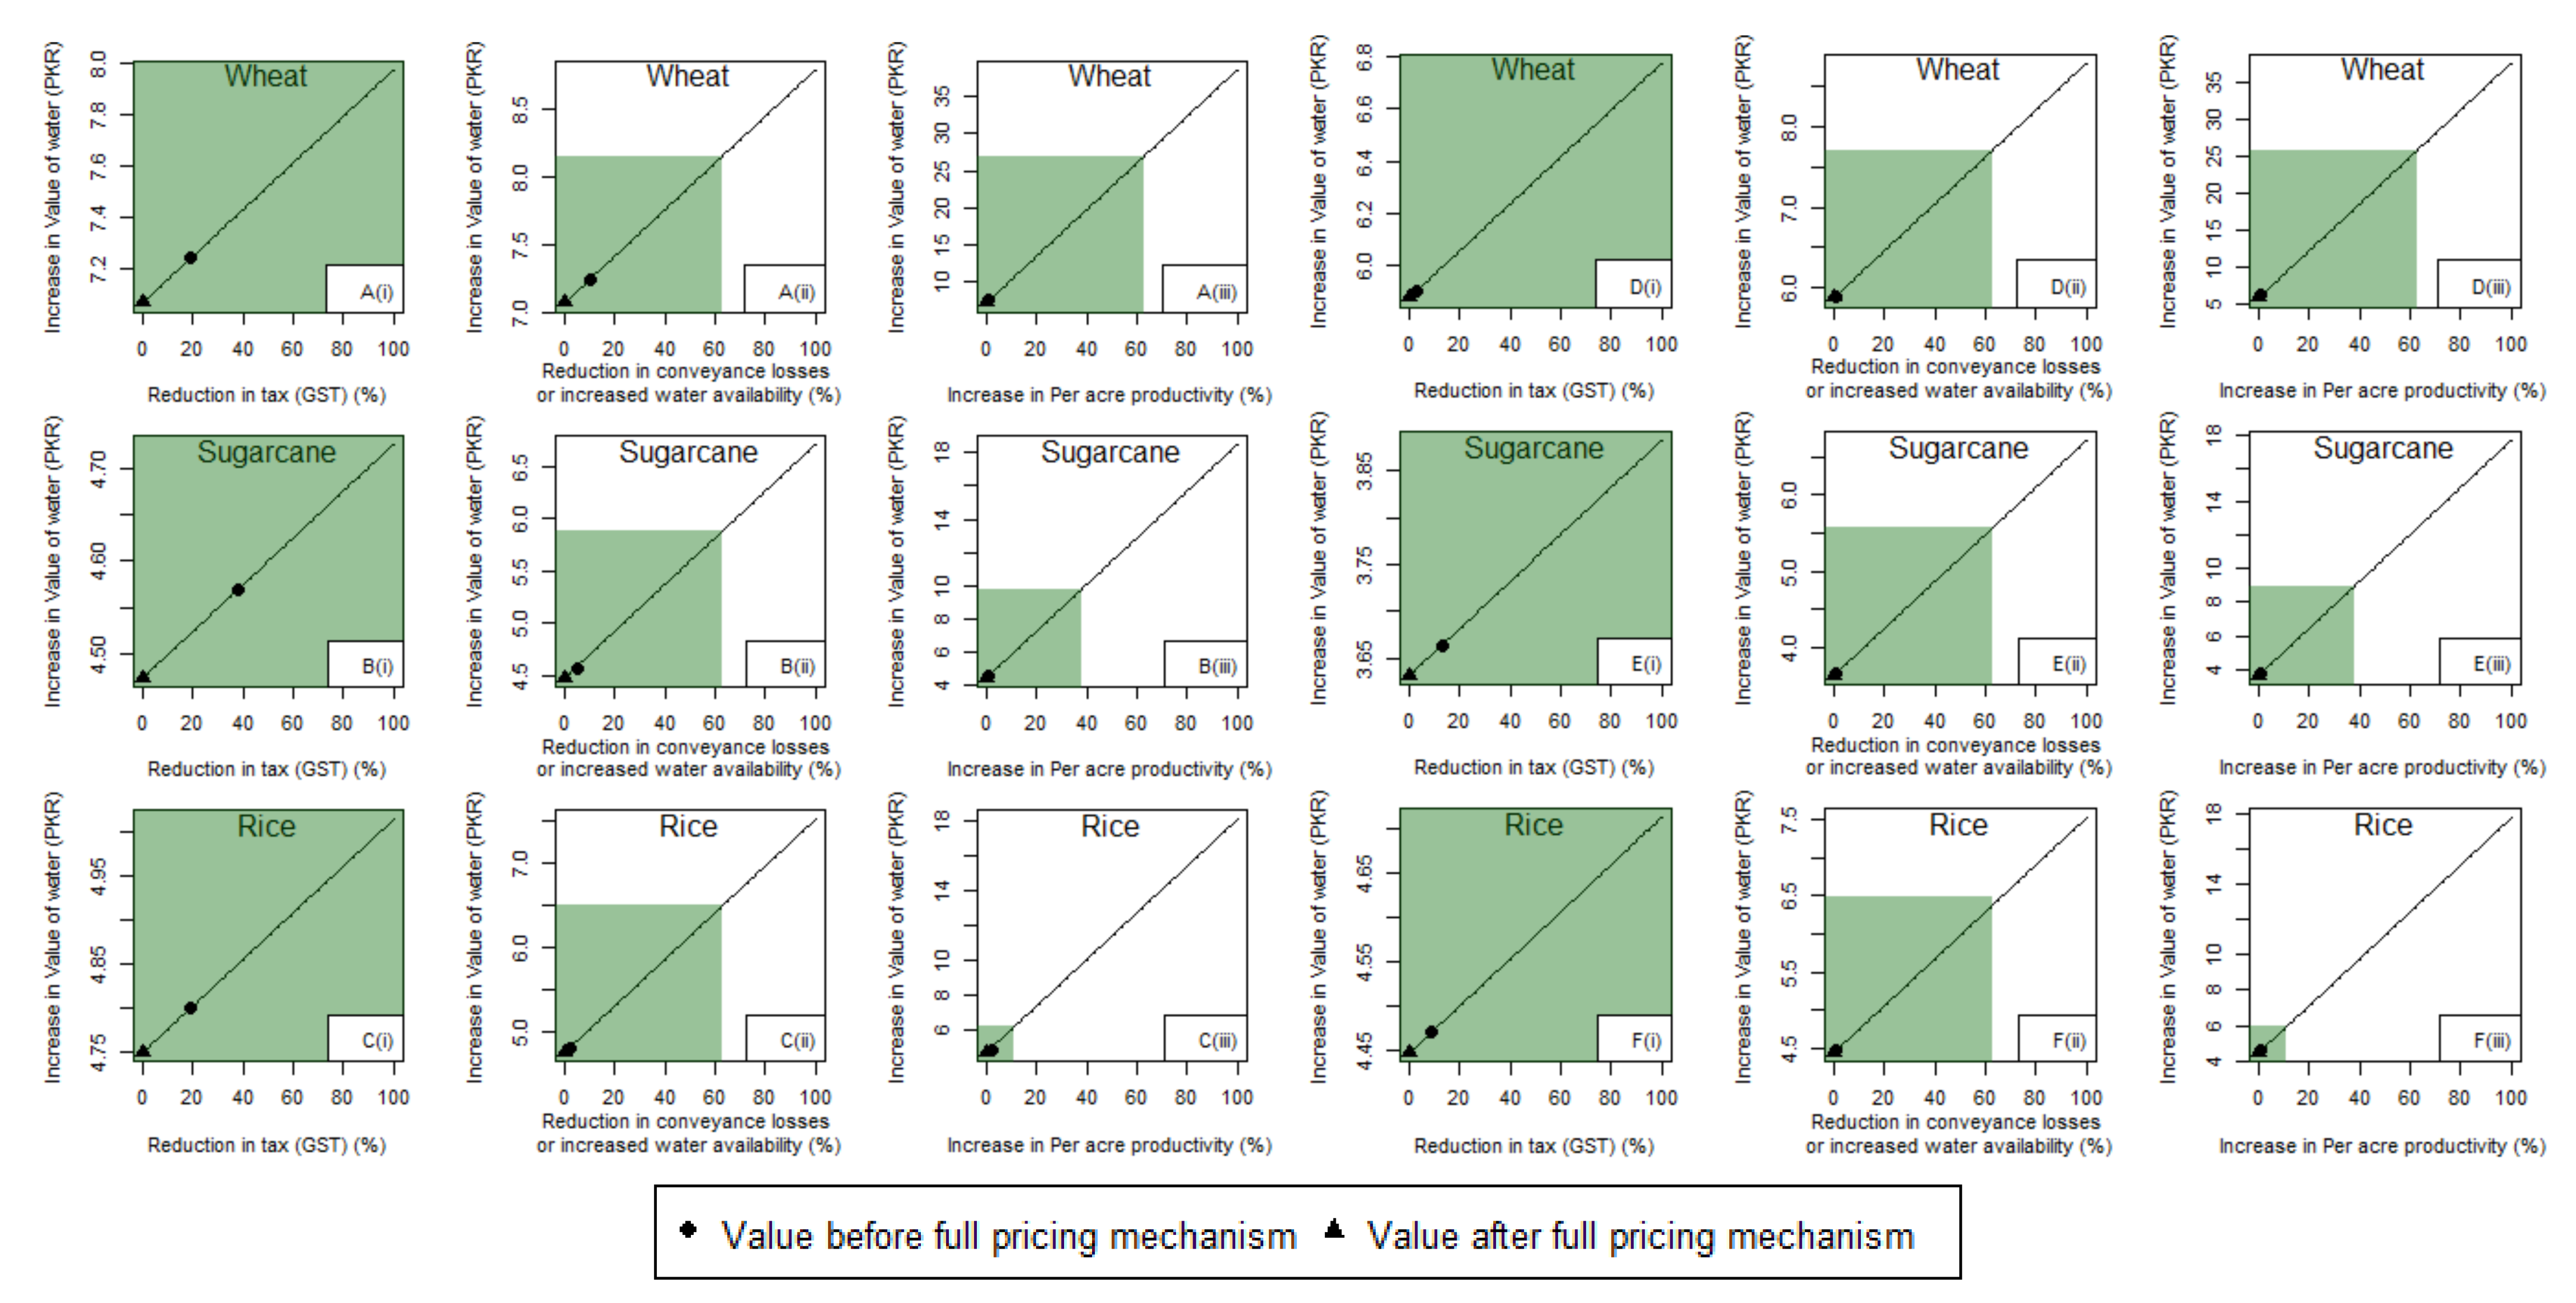
Along with the efforts to put in place a full pricing mechanism, there also needs to be a policy-support mechanism to reduce the O&M cost of irrigation system. For example, the “establishment cost” which is 70% of the total O&M cost (see Table 4), can be reduced by empowering the farmers through decentralization and involving them in irrigation infrastructure development and maintenance. The most relevant example in this regard is the California State Water Project in which Farmer Organizations (Irrigation Districts) are responsible for overseeing a number of field tasks (e.g., collecting the O&M cost of the irrigation systems) [6]. The same system, if followed in Punjab, can significantly reduce the “establishment cost”. Another pertinent solution is to create a consensus at the national level on the construction of new reservoirs and developmental projects to line the irrigation channels because increased availability of canal water at the farm-gate will bring down the prices per unit volume of water. Also, the improvement in per hectare productivity, which is presently on the lower side, will reduce the resistance against the full pricing mechanism. The major reason for lower productivity per hectare of average farmers is the shrinking farm size which can be properly addressed by encouraging corporate farming [58].
Finally, we urge that implementing any newer policy without winning hearts, minds and trust of farmers will be counterproductive. Farming, in general, is becoming more and more challenging with the unpredictable climate and out of all the businesses which are based on agriculture, only farming remains most vulnerable. Farmers know the importance of water in farming business and fully understand the importance of its sustainability. For example, lining of water course project was a massive hit only because of its visible benefits to the farmers. We believe that the farmers should be taught the importance of pricing the irrigation water for the sustainability of an irrigation system before increasing the prices of water. It can be concluded that any system developed for the sustainability of an irrigation system will have the full support of the farming community.

7. Conclusions

Water is the life line of agriculture, yet the sustainability of the Irrigation system of Punjab, Pakistan cannot be guaranteed. We believe that instead of the presently adopted flat rate system, the pricing of irrigation water should be linked with the pressure which the irrigation system has to sustain each year to ensure a proper pricing model that hinges on the concept of per unit water usage [59,60]. Increasing the price of water will encourage farmers to invest more into water saving technologies (HEIS), thus significantly improving the water productivity. However, the farmers of Punjab are already overcommitted and any unplanned increase in water cost would further aggravate their problems. We therefore suggested a number of solutions for the implementation of proposed methodology.
The results of this project will give insight into the practical implementation of the much delayed PIDA Act 1997. Apart from the sustainability of irrigation networks, the method can be helpful in the allocation of surface water to the intra-sector (tree irrigation versus herbaceous crops) by observing value per unit of water and allocating more water to high water-value crops. However, the estimation of the value of water for a larger study area would require the proper knowledge of area-based exceptions which cause disproportionality in the measurement of the value of irrigation water. These exceptional highlights also play a vital role in setting up cost-efficiency analysis which fundamentally needs to be based on the economic values of water.
We recommend that the proposed analysis should also be done for the other parts of the country to obtain a holistic picture of sustainability of the irrigation system. Moreover, future research works should also specifically focus on devising such policies or strategies which can rationalize the establishment cost resulting in a significant reduction in the total O&M cost of the irrigation system.

Acknowledgments

This policy study was funded by the U.S.-Pakistan Center for Advanced Studies in Agriculture and Food Security (USPCAS-AFS) at the University of Agriculture Faisalabad under the grant number (USPCAS-AFS: P&D/PP/03). We greatly acknowledge the role of Iqrar Ahmad Khan for sharing the details of meetings held between government of Punjab and the officials of ADB with us. The acknowledgement is also due to Muhammad Azam Khan for ensuring the timely availability of vehicles to carry out the field surveys. We are also thankful to Jay Lund from UC Davis for his valuable suggestions which greatly improved our work. Finally, we appreciate the role of our research associates including Muhammad Nabeel, Siraj Yousaf and Mohsin Ijaz for assisting us in the collection of field data.

Author Contributions

Muhammad Uzair Qamar, Muhammad Azmat and Azhar Abbas conceived and designed the study; Muhammad Usman processed and analyzed the collected data; Muhammad Adnan Shahid and Zahid Mehmood Khan carried out the application and evaluation of the pricing model; Muhammad Uzair Qamar wrote the paper; and the co-authors contributed text blocks.

Conflicts of Interest

The authors declare no conflict of interest.

References

  1. FAO. FAO-Nutrition Country Profiles: Pakistan; Food and Agricultural Organization of the United Nations: Rome, Italy, 1998; 26p. [Google Scholar]
  2. Hussain, I.; Jehangir, W.; Choudry, G. Irrigation and poverty in Pakistan: A review of policy issues and options. In Proceedings of the Regional Workshop on Pro-Poor Intervention Strategies in Irrigated Agriculture in Asia, Colombo, Sri Lanka, 9–11 August 2001. [Google Scholar]
  3. Pappas, G. Pakistan and Water: New Pressures on Global Security and Human Health. Am. J. Public Health 2011, 101, 786–788. [Google Scholar] [PubMed]
  4. Government of Pakistan. Pakistan Economic Survey, Economic Advisor’s Wing, Finance Division; Government of Pakistan: Islamabad, Pakistan, 2008.
  5. Dinar, A.; Subramanian, A. Water Pricing Experiences: An International Perspective; Technical Paper 386; World Bank: Washington, DC, USA, 1997. [Google Scholar]
  6. Burt, C.M. Volumetric irrigation water pricing considerations. Irrig. Drain. Syst. 2007, 21, 133–144. [Google Scholar] [CrossRef]
  7. Rogers, P.; Bhatia, R.; Huber, A. Water as a Social and Economic Good: How to Put the Principle into Practice; Global Water Partnership/Swedish International Development Cooperation Agency: Stockholm, Sweden, 1998. [Google Scholar]
  8. Briscoe, J. Water as an Economic Good: The Idea and What It Means in Practice; Special Sessiotz R I I, Iiltemutional Commission on Irrigation and Drainage, Sixkenth Session: Cairo, Egypt, 1996. [Google Scholar]
  9. Ahmad, D. Case Study of Pakistan. In Cost Recovery and Water Pricing for Irrigation and Drainage Projects; William Easter, Y.L.K., Ed.; The World Bank: Washington, DC, USA, 2005; pp. 47–48. [Google Scholar]
  10. Lika, A.; Galioto, F.; Scardigno, A.; Zdruli, P.; Viaggi, D. Pricing unmetered irrigation water under asymmetric information and full cost recovery. Water 2016, 8, 596. [Google Scholar] [CrossRef]
  11. Bell, A.R.; Shah, M.A.A.; Ward, P.S. Reimagining cost recovery in Pakistan’s irrigation system through willingness-to-pay estimates for irrigation water from a discrete choice experiment. Water Resour. Res. 2014, 50, 6679–6695. [Google Scholar] [PubMed]
  12. European Commission. Directive 2000/60/EC of the European Parliament and of the Council Establishing a Framework for the Community Action in the Field of Water Policy. Official Journal (OJ L327), 22 December 2000. [Google Scholar]
  13. WATECO Economics and the Environment. The Implementation Challenge of the Water Framework Directive; Accompanying Documents to the Guidance; European Commission: Brussels, Belgium, 2003. [Google Scholar]
  14. Planning Commission of Pakistan. Canal Water Pricing for Irrigation in Pakistan: Assessment, Issues and Options; Planning Commission of Pakistan: Islamabad, Pakistan, 2012. [Google Scholar]
  15. Heal, G.M.; Barbier, E.B.; Boyle, K.J.; Covich, A.P.; Gloss, S.P.; Hershner, C.H.; Hoehn, J.P.; Pringle, C.M.; Polasky, S.; Segerson, K.; et al. Valuing Ecosystem Services: Toward Better Environmental Decision-Making; National Academy Press: Washington, DC, USA, 2005. [Google Scholar]
  16. Young, R.A. Determining the Economic Value of Water: Concepts and Methods; Resources for the Future: Washington, DC, USA, 2005. [Google Scholar]
  17. Hexem, R.W.; Heady, E.O. Water Production Functions for Irrigated Agriculture; Iowa State University Press: Ames, IA, USA, 1978. [Google Scholar]
  18. Vaux, H.J.; Pruitt, W.O. Crop-water production functions. In Advances in Irrigation; Hillel, D., Ed.; Academic Press: New York, NY, USA, 1983; pp. 61–97. [Google Scholar]
  19. Hazell, B.R.; Norton, R.D. Mathematical Programming for Economic Analysis in Agriculture; Macmillan Publishing Co.: New York, NY, USA, 1986. [Google Scholar]
  20. Chaudhry, M.A.; Young, R.A. Valuing irrigation water in Punjab Province, Pakistan: A linear programming approach. J. Am. Water Resour. Assoc. 1989, 25, 1055–1061. [Google Scholar] [CrossRef]
  21. Jain, S.K.; Singh, V.P. Water Resources Systems Planning and Management; Elsevier: Singapore, 2003; pp. 279–349. [Google Scholar]
  22. Moe, A.; Koehler-munro, K.; Bryan, R.; Goddard, T.; Kryzanowksi, L. Multi-criteria decision analysis of feed formulation for laying hens. In Proceedings of the 9th International Conference on Life Cycle Assessment in the Agri-Food Sector, San Francisco, CA, USA, 8–10 October 2014; pp. 835–844. [Google Scholar]
  23. Romero, C.; Rehman, T. Multiple Criteria Analysis for Agricultural Decisions; Elsevier Science Publishers: Amsterdam, The Netherlands, 2003. [Google Scholar]
  24. Hayashi, K. Multicriteria analysis for agricultural resource management: A critical survey and future perspectives. Eur. J. Oper. Res. 2000, 122, 486–500. [Google Scholar] [CrossRef]
  25. Gómez-Limón, J.A.; Berbel, J.; Arriaza, M. MCDM farm system analysis for public management of irrigated agriculture. In Handbook on Operations Research in Natural Resources; Weintraub, A., Bjorndal, T., Epstein, R., Romero, C., Eds.; Kluwer: Alphen aan den Rijn, The Netherlands, 2007; pp. 93–114. [Google Scholar]
  26. Saarikoski, H.; Mustajoki, J.; Barton, D.; Geneletti, D.; Langemeyer, J.; Gomez-Baggethun, E.; Marttunen, M.; Antunes, P.; Keune, H.; Santos, R. Multicriteria decision analysis and cost-benefit analysis: Comparing alternative frameworks for integrated valuation of ecosystem services. Ecosyst. Serv. 2016, 22, 238–249. [Google Scholar]
  27. Berbel, J.; Viaggi, D.; Manos, B. Estimating demand for irrigation water in European Mediterranean countries through MCDM models. Water Policy 2009, 11, 348–361. [Google Scholar] [CrossRef]
  28. Zardari, N.H.; Ahmed, K.; Moniruzzaman, S.; Yusop, Z.B. Weighting Methods and Their Effects on Multi-Criteria Decision Making Model Outcomes in Water Resources Management; Springer: Berlin/Heidelberg, Germany, 2014; Chapter 2. [Google Scholar]
  29. De Montis, A.; De Toro, P.; Droste, B.; Omann, I.; Stagl, S. Assessing the quality of different MCDA methods. In Alternatives for Environmental Valuation; Getzner, M., Spash, C.L., Stagl, S., Eds.; Routledge: London, UK, 2004. [Google Scholar]
  30. Mutikanga, H.E. Water Loss Management: Tools and Methods for Developing Countries; TU Delft, Delft University of Technology: Delft, The Netherlands, 2012. [Google Scholar]
  31. Berbel, J.; Mesa, P. Valoración del agua de riego por el método de precios quasi-hedónicos: Aplicación al Guadalquivir. Econ. Agrar. Recur. Nat. 2007, 14, 127–144. (In Spanish) [Google Scholar]
  32. Lange, G.M. Case studies of water valuation in Namibia’s commercial farming areas. In The Economics of Water Management in Southern Africa: An Environmental Accounting Approach; Lange, G.M., Hassam, R., Eds.; Edward Elgar Publishing: Chelthenham, UK, 2006; pp. 237–255. [Google Scholar]
  33. Calatrava-Leyva, J.; Sayadi, S. Economic valuation of water and “willingness to pay” analysis with respect to tropical fruit production in southeastern Spain. Span. J. Agric. Res. 2005, 3, 25–33. [Google Scholar]
  34. Grimes, A.; Aitken, A. Water, Water Somewhere: The Value of Water in a Drought-Prone Farming Region; MOTU Working Paper 08-10; Motu Economic and Public Policy Research: Wellington, New Zealand, 2008. [Google Scholar]
  35. Bate, R.N.; Dubourg, W.R. Net-back analysis of irrigation water demand in East-Anglia. J. Environ. Manag. 1997, 49, 311–322. [Google Scholar]
  36. Moran, D.; Dann, S. The economic value of water use: Implications for implementing the Water Framework Directive in Scotland. J. Environ. Manag. 2008, 87, 484–496. [Google Scholar] [CrossRef]
  37. Speelman, S.; Frija, A.; Perret, S.; D’Haese, M.; Farolfi, S.; D’Haese, L. Variability in smallholder’s irrigation water values: Study in North-West province, South Africa. Irrig. Drain. 2009. [Google Scholar] [CrossRef]
  38. Esmaeili, A.; Vazirzadeh, S. Water pricing for agricultural production in the South of Iran. Water Resour. Manag. 2009, 23, 957–964. [Google Scholar] [CrossRef]
  39. Government of Pakistan. The National Conservation Strategy; Environment & Urban Affairs Division: Islamabad, Pakistan, 1991.
  40. Kraatz, D.B. Irrigation Canal Lining, FAO Land and Water Development Series No. 1; FAO Land and Water Development Division, Food and Agricultural Organization of the United Nations: Rome, Italy, 1977. [Google Scholar]
  41. Government of Punjab. Punjab Irrigation and Drainage Act, 1997; Provincial Gazette; Punjab Printing Press: Lahore, Pakistan, 1997.
  42. Panella, T. Technical Assistance to the Islamic Republic of Pakistan for Preparing the Punjab Irrigated Agriculture Development Sector Project (Co-Financed by the Japan Special Fund, the Government of the Netherlands, and the Cooperation Fund for the Water Sector); Asian Development Bank: Mandaluyong, Philippines, 2005. [Google Scholar]
  43. Rehman, G.; Jehangir, W.A.; Rehman, A.; Aslam, M.; Skogerboe, G.V. Salinity Management Alternatives for the Rechna Doab, Punjab, Pakistan. Principal Findings and Implications for Sustainable Irrigated Agriculture; IIMI: Lahore, Pakistan, 1997; Volume 1. [Google Scholar]
  44. Qureshi, A.S.; Shah, T.; Akhtar, M. The Groundwater Economy of Pakistan; IWMI Working Paper No. 64; International Water Management Institute: Colombo, Sri Lanka, 2003; 23p. [Google Scholar]
  45. Bandaragoda, D.J.; Rehman, S.U. Warabandi in Pakistan’s Canal Irrigation Systems: Widening Gap between Theory and Practice; Country Paper No. 7; International Irrigation Management Institute: Colombo, Sri Lanka, 1995. [Google Scholar]
  46. Government of Punjab. Punjab Growth Strategy 2018; First Draft; Planning & Development Department: Lahore, Pakistan, 2013.
  47. Freeman, A.M. The Measurement of Environmental and Resource Values: Theory and Methods, 2nd ed.; Resources for the Future: Washington, DC, USA, 2003. [Google Scholar]
  48. Mesc-Jurado, M.; Piston, J.; Giannoccaro, G.; Berbel, J. Irrigation water value scenarios for 2015: Applications to Guadalquivir River. In Proceedings of the 107th EAAE Seminar on Modelling of Agricultural and Rural Development Policies, Seville, Spain, 29 January–1 February 2008. [Google Scholar]
  49. Wise, W.S. The Calculation of Rates of Return on Agricultural Research from Production Functions. J. Agric. Econ. 1986, 37, 151–161. [Google Scholar] [CrossRef]
  50. Farooq, M.; Shakoor, A. Severe energy crises and solar thermal energy as a viable option for Pakistan. J. Renew. Sustain. Energy Rev. 2013, 5, 013104. [Google Scholar] [CrossRef]
  51. Government of Pakistan. Agriculture Statistics of Pakistan, Ministry of Food Agriculture: Islamabad, Pakistan. 2010. Available online: http://www.pbs.gov.pk/content/agriculture-statistics-pakistan-2010-11 (accessed on 17 February 2018).
  52. Khan, M.H. Farm Size and Land Productivity Relationships in Pakistan. Pak. Dev. Rev. 1979, 18, 69–77. [Google Scholar]
  53. Doorenbos, J.; Kassam, A.H. Yield Response to Water; FAO Irrigation and Drainage Paper 33; FAO: Rome, Italy, 1979. [Google Scholar]
  54. Allen, R.G.; Pereira, L.S.; Raes, D.; Smith, M. Crop Evapotranspiration: Guidelines for Computing Crop Water Requirements Irrigation and Drainage Paper 56; FAO—Food and Agriculture Organization of the United Nations: Rome, Italy, 1998. [Google Scholar]
  55. Berbel, J.; Mesa-Jurado, M.A.; Pistón, J.M. Value of irrigation water in Guadalquivir Basin (Spain) by residual value method. Water Resour. Manag. 2011, 25, 1565–1579. [Google Scholar] [CrossRef]
  56. Van der Pol, F.; Traore, B. Soil nutrient depletion by agricultural production in southern Mali. Fertil. Res. 1993, 36, 79–90. [Google Scholar] [CrossRef]
  57. Chaudhry, M.G.; Gill, M.A.; Chaudhry, G.M. Size Productivity Relationship in Pakistan’s Agriculture in the Seventies. Pak. Dev. Rev. 1985, 24, 349–361. [Google Scholar]
  58. Aziz, S. Task Force on Food Security; Planning Commission, Government of Pakistan: Islamabad, Pakistan, 2009.
  59. Perry, C.J. Charging for Irrigation Water: The Issues and Options, with a Case Study from Iran; Res. Rep. 52; International Water Management Institute: Colombo, Sri Lanka, 2001. [Google Scholar]
  60. Webber, M.; Barnett, J.; Finlayson, B.; Wang, M. Pricing China’s irrigation water. Glob. Environ. Chang. 2008, 18, 617–625. [Google Scholar] [CrossRef]
Figure 1. Irrigation pricing models defined by the Global Water Partnership (2000).
Water 10 00509 g001
Figure 2. Map of the case study area.
Water 10 00509 g002
Figure 3. Designed discharge of each outlet in the selected distributaries.
Water 10 00509 g003
Figure 4. Cost of production for crops against yields in CCA of distributaries.
Water 10 00509 g004
Figure 5. Effective rainfall depth and length of the growing season of each selected crop in the study area.
Water 10 00509 g005
Figure 6. Percentage contribution of canal, tubewell and rainfall in irrigating selected crops of the study area.
Water 10 00509 g006aWater 10 00509 g006b
Figure 7. Assessed water allocation time for each outlet in the selected distributaries.
Water 10 00509 g007
Figure 8. CCA of each outlet in the selected distributaries.
Water 10 00509 g008
Figure 9. Recommended irrigation water prices for the selected distributaries to recover: (A) the full cost of O&M; (B) infrastructure maintenance cost only.
Water 10 00509 g009
Figure 10. Response of water value for three crops against tax evasion, increased canal water availability and increased per hectare productivity for Gulliana, Khair-ali, Gatti (AC) and Ratti distributaries (DF).
Water 10 00509 g010
Table 1. Comparison between average yield in the study area with national average and biological yield potential.
CropsAverage Yield (×40 kg)/Hectare (Study Area)Average Yield (×40 kg)/Hectare (National)Biological Potential (×40 kg)/Hectare
Wheat98.8474.13180.383
Sugarcane1976.81435.6514447.8
Rice160.615135.905222.39
Source: [46].
Table 2. Quantitative characteristics of selected distributary channels.
Location of DistyName of DistyLength of Distributary (Km)Designed Discharge (Cumecs)No. of OutletsWater Allowance (Cumecs/1000 Hec)G.C.A (Hectare)C.C.A (Hectare)
HeadRatti Disty0.7240.02530.039709.025643.869
MiddleGulliana Disty2.8320.41990.1982260.2191951.437
Lower-MiddleKhair Ali Disty14.9341.313280.1987095.9135655.200
TailGatti Disty7.5150.582140.1983453.2582364.630
Table 3. Irrigation water supply and relative use by crops in Rakh Branch Canal.
CropAverage Dose (m3/hectare)Number of Irrigation EventsETP-Max (m3/Hectare)RIS-Ratio
Wheat4064.9644575.550.890
Sugarcane25,405.992518,039.631.408
Rice14,477.711216,089.080.900
Table 4. O&M cost for the maintenance of Irrigation system in Punjab (Water share = 55MAF).
Fiscal YearEstablishment Cost * (In Million PKR)Infrastructure Maintenance Cost (In Million PKR)Total O&M Cost (In Million PKR)Abiana Collected (In Million PKR)Cost Recovery (%)
2003288613774263120528.266
2004312713694496110824.644
2005361117925403103319.119
2006416320896252122819.642
2007437120556426122319.032
2008466526467311129717.740
2009509827887886143218.159
2010558830098597188221.891
2011498026827662160921.000
2012626733709637166017.225
20136854337610,230130112.717
20147375397111,34611219.880
20157076348510,561121111.467
20167418398011,39810178.923
Source: Irrigation Department, Govt. of Punjab, Lahore * In Table 4, the “Establishment cost” includes salary and allowances, administration of the headquarters units, buildings, transport, telephone usage, and utilities.
Table 5. Ratios related to Water productivity and residual value of water for 2015–2016 in Rakh Branch Command area. The values in square brackets are for the Ratti distributary.
Farmer TypeCropEconomic Result Per HectareApparent ProductivityResidual ValuePaid by Farmers to Irrigation PID
Total Sale (PKR/Hectare)Gross Margin (PKR/Hectare)Sales/Water (PKR/m3)Gross Margin/Water (PKR /m3)Excluding Fixed Costs (PKR/m3)Irrigation Bill (PKR/m3)
Average FarmerWheat128,49262,086.332157.20.054
(128,492)(57,228.3)(32)(14)(5.9)(0.202)
Sugarcane355,824180,400.314.07.14.60.044
(355,824)(158,985.1)(14.0)(6.2)(3.7)(0.110)
Rice192,73896,567.4713.36.74.80.076
(192,738)(92,174.5)(13.3)(6.4)(4.5)(0.145)
Progressive FarmerWheat208,799.5129,682.151.431.926.90.054
(208,799.5)(124,200.1)(51.4)(30.5)(25.8)(0.202)
Sugarcane489,258291,052.919.211.49.80.044
(489,258)(267,925.9)(19.2)(10.5)(8.9)(0.110)
Rice213,494.4101,699.614.77.06.20.076
(213,494.4)(96,818.9)(14.7)(6.7)(5.9)(0.145)
Table 6. Analyses for full cost recovery of water for average farmers for 2016–2017.
CropPresent PriceProposed PricesDeficitPrices for the Recovery of Infrastructure Maintenance Only
Collection from Farmers (PKR)Price as Percentage of Value of Water (%)For 100% Cost Recovery (PKR)Price as Percentage of Value of Water (%)(PKR)(PKR)
Wheat123.50.8852.05.0728.5282.3
(123.5)(3.4)(228.2)(6.0)(104.7)(75.6)
Sugarcane333.61.02852.87.92519.2945.1
(333.6)(3.0)(1141.1)(9.7)(807.5)(378.0)
Rice210.01.61029.67. 5819.6341.1
(210.0)(3.3)(542)(8.0)(331.9)(179.5)

