Cover Crops for Managing Stream Water Quantity and Improving Stream Water Quality of Non-Tile Drained Paired Watersheds


Department of Forestry, College of Agricultural Sciences, Southern Illinois University Carbondale, Carbondale, IL 62901, USA
*
Author to whom correspondence should be addressed.
Water 2018, 10(4), 521; https://doi.org/10.3390/w10040521
Submission received: 22 March 2018
/
Revised: 18 April 2018
/
Accepted: 19 April 2018
/
Published: 21 April 2018
(This article belongs to the Section Water Quality and Contamination)
Abstract
:In the Midwestern United States, cover crops are being promoted as a best management practice for managing nutrient and sediment losses from agricultural fields through surface and subsurface water movement. To date, the water quality benefits of cover crops have been inferred primarily from plot scale studies. This project is one of the first to analyze the impacts of cover crops on stream water quality at the watershed scale. The objective of this research was to evaluate nitrogen, phosphorus, and sediment loss in stream water from a no-till corn-soybean rotation planted with winter cover crops cereal rye (Secale cereale) and hairy vetch (Vicia villosa) in non-tile drained paired watersheds in Illinois, USA. The paired watersheds are under mixed land use (agriculture, forest, and pasture). The control watershed had 27 ha of row-crop agriculture, and the treatment watershed had 42 ha of row crop agriculture with cover crop treatment (CC-treatment). During a 4-year calibration period, 42 storm events were collected and Event Mean Concentrations (EMCs) for each storm event were calculated for total suspended solids (TSS), nitrate-N (NO3-N), ammonia-N (NH4-N), dissolved reactive phosphorus (DRP), and total discharge. Predictive regression equations developed from the calibration period were used for calculating TSS, NO3-N, NH4-N, and DRP losses of surface runoff for the CC-treatment watershed. The treatment period consisted of total 18 storm events, seven of which were collected during the cereal rye, eight in the hairy vetch cover crop season and three during cash crop season. Cover crops reduced TSS and discharge by 33% and 34%, respectively in the CC-treatment watershed during the treatment period. However, surprisingly, EMCs for NO3-N, NH4-N, and DRP did not decrease. Stream discharge from the paired-watersheds will continue to be monitored to determine if the current water quality results hold or new patterns emerge.
1. Introduction
Nutrient enrichment of runoff from agricultural fields is a significant problem in the Midwestern United States [1]. Best management practices (BMPs) promoted to reduce nutrient and sediment export into streams include the adoption of no-till practices, improved nutrient management, cover crops, riparian buffers, and bioreactors. However, the effectiveness of these BMPs in improving water quality at the plot to field scale varies from 100% to not effective [2,3,4,5,6]. Additionally, the long-term research examining the effects of these BMPs at the watershed scale is limited [7,8,9,10].
Best management practices like cover crops, when planted at the plot or field scale, can reduce nitrate-N (NO3-N), ammonia-N (NH4-N), and dissolved reactive phosphorus (DRP) in soil leachate by scavenging residual nutrients in corn-soybean cropping systems [11,12,13]. The benefits of using cover crops for nutrient reduction were realized in a relatively short period (two to three years) in most of these studies. However, a significant time lag may occur between implementing and obtaining results for improvement in water quality using BMPs at the watershed scale [14] due to complex hydrology and soil variability that exists at the watershed scale [15]. Many watershed scale studies have reported no or little improvement in water quality with a combination of different conservation programs/BMPs over the last four decades [4,16,17,18]. Numerous factors can contribute towards failure of water quality improvement projects in large watersheds, such as insufficient participation of landowners, improper selection and installation of conservation practices, poor experimental design, unidentifiable pollution sources in watersheds, and inadequate distribution/design of BMPs in critical source areas within watersheds [19].
Small, headwater agricultural watersheds provide an opportunity to test the effectiveness of single BMP such as cover crops in improving the water quality of runoff. It is relatively easy to manage these small-scale watersheds compared to county level watersheds that involve many farm owners/stakeholders. Some headwater watershed studies have provided valuable information on the long-term benefits of strategically placed perennial vegetation, nutrient management, and minimal or no-till systems on runoff and water quality [9,10,20,21,22,23,24,25,26,27]. A few of these headwater watershed studies used a paired watershed design, where experimental units include at least two watersheds (control and treatment) that can vary in size and can include parts of single or multiple fields. The advantage of using a paired watershed approach is that the use of a control watershed allows the effect of treatment to be isolated from potential factors like climate and hydrology that might result in differences in response variables between the watersheds [28]. A paired watershed approach is ideal for isolating treatment effects and has been extensively used to evaluate the response of silvicultural practices on runoff [29,30,31]. To the best of our knowledge, no study has used a paired watershed approach to evaluate water quantity and quality response of cover crops at the watershed scale. The lack of published studies on this topic is likely due to the time required to set up regression models during the three- to five years of calibration period where control and treatment watersheds are treated identical [28].
Multiple plot studies have reported the effectiveness of winter cover crops on improving soil and water quality [32,33,34]. However, it is unknown whether similar results can be achieved at a watershed scale. Further, the time duration needed to detect an improvement in water quality at the watershed scale is unknown. Therefore, the objective of this study was to compare the effectiveness of winter cover crops in reducing runoff, total suspended solids (TSS), nitrogen (N) and phosphorus (P) concentrations in ephemeral streams of non-tile drained headwater agricultural watersheds.
2. Materials and Methods
2.1. Site Description, Design, and Installation of Monitoring Equipment
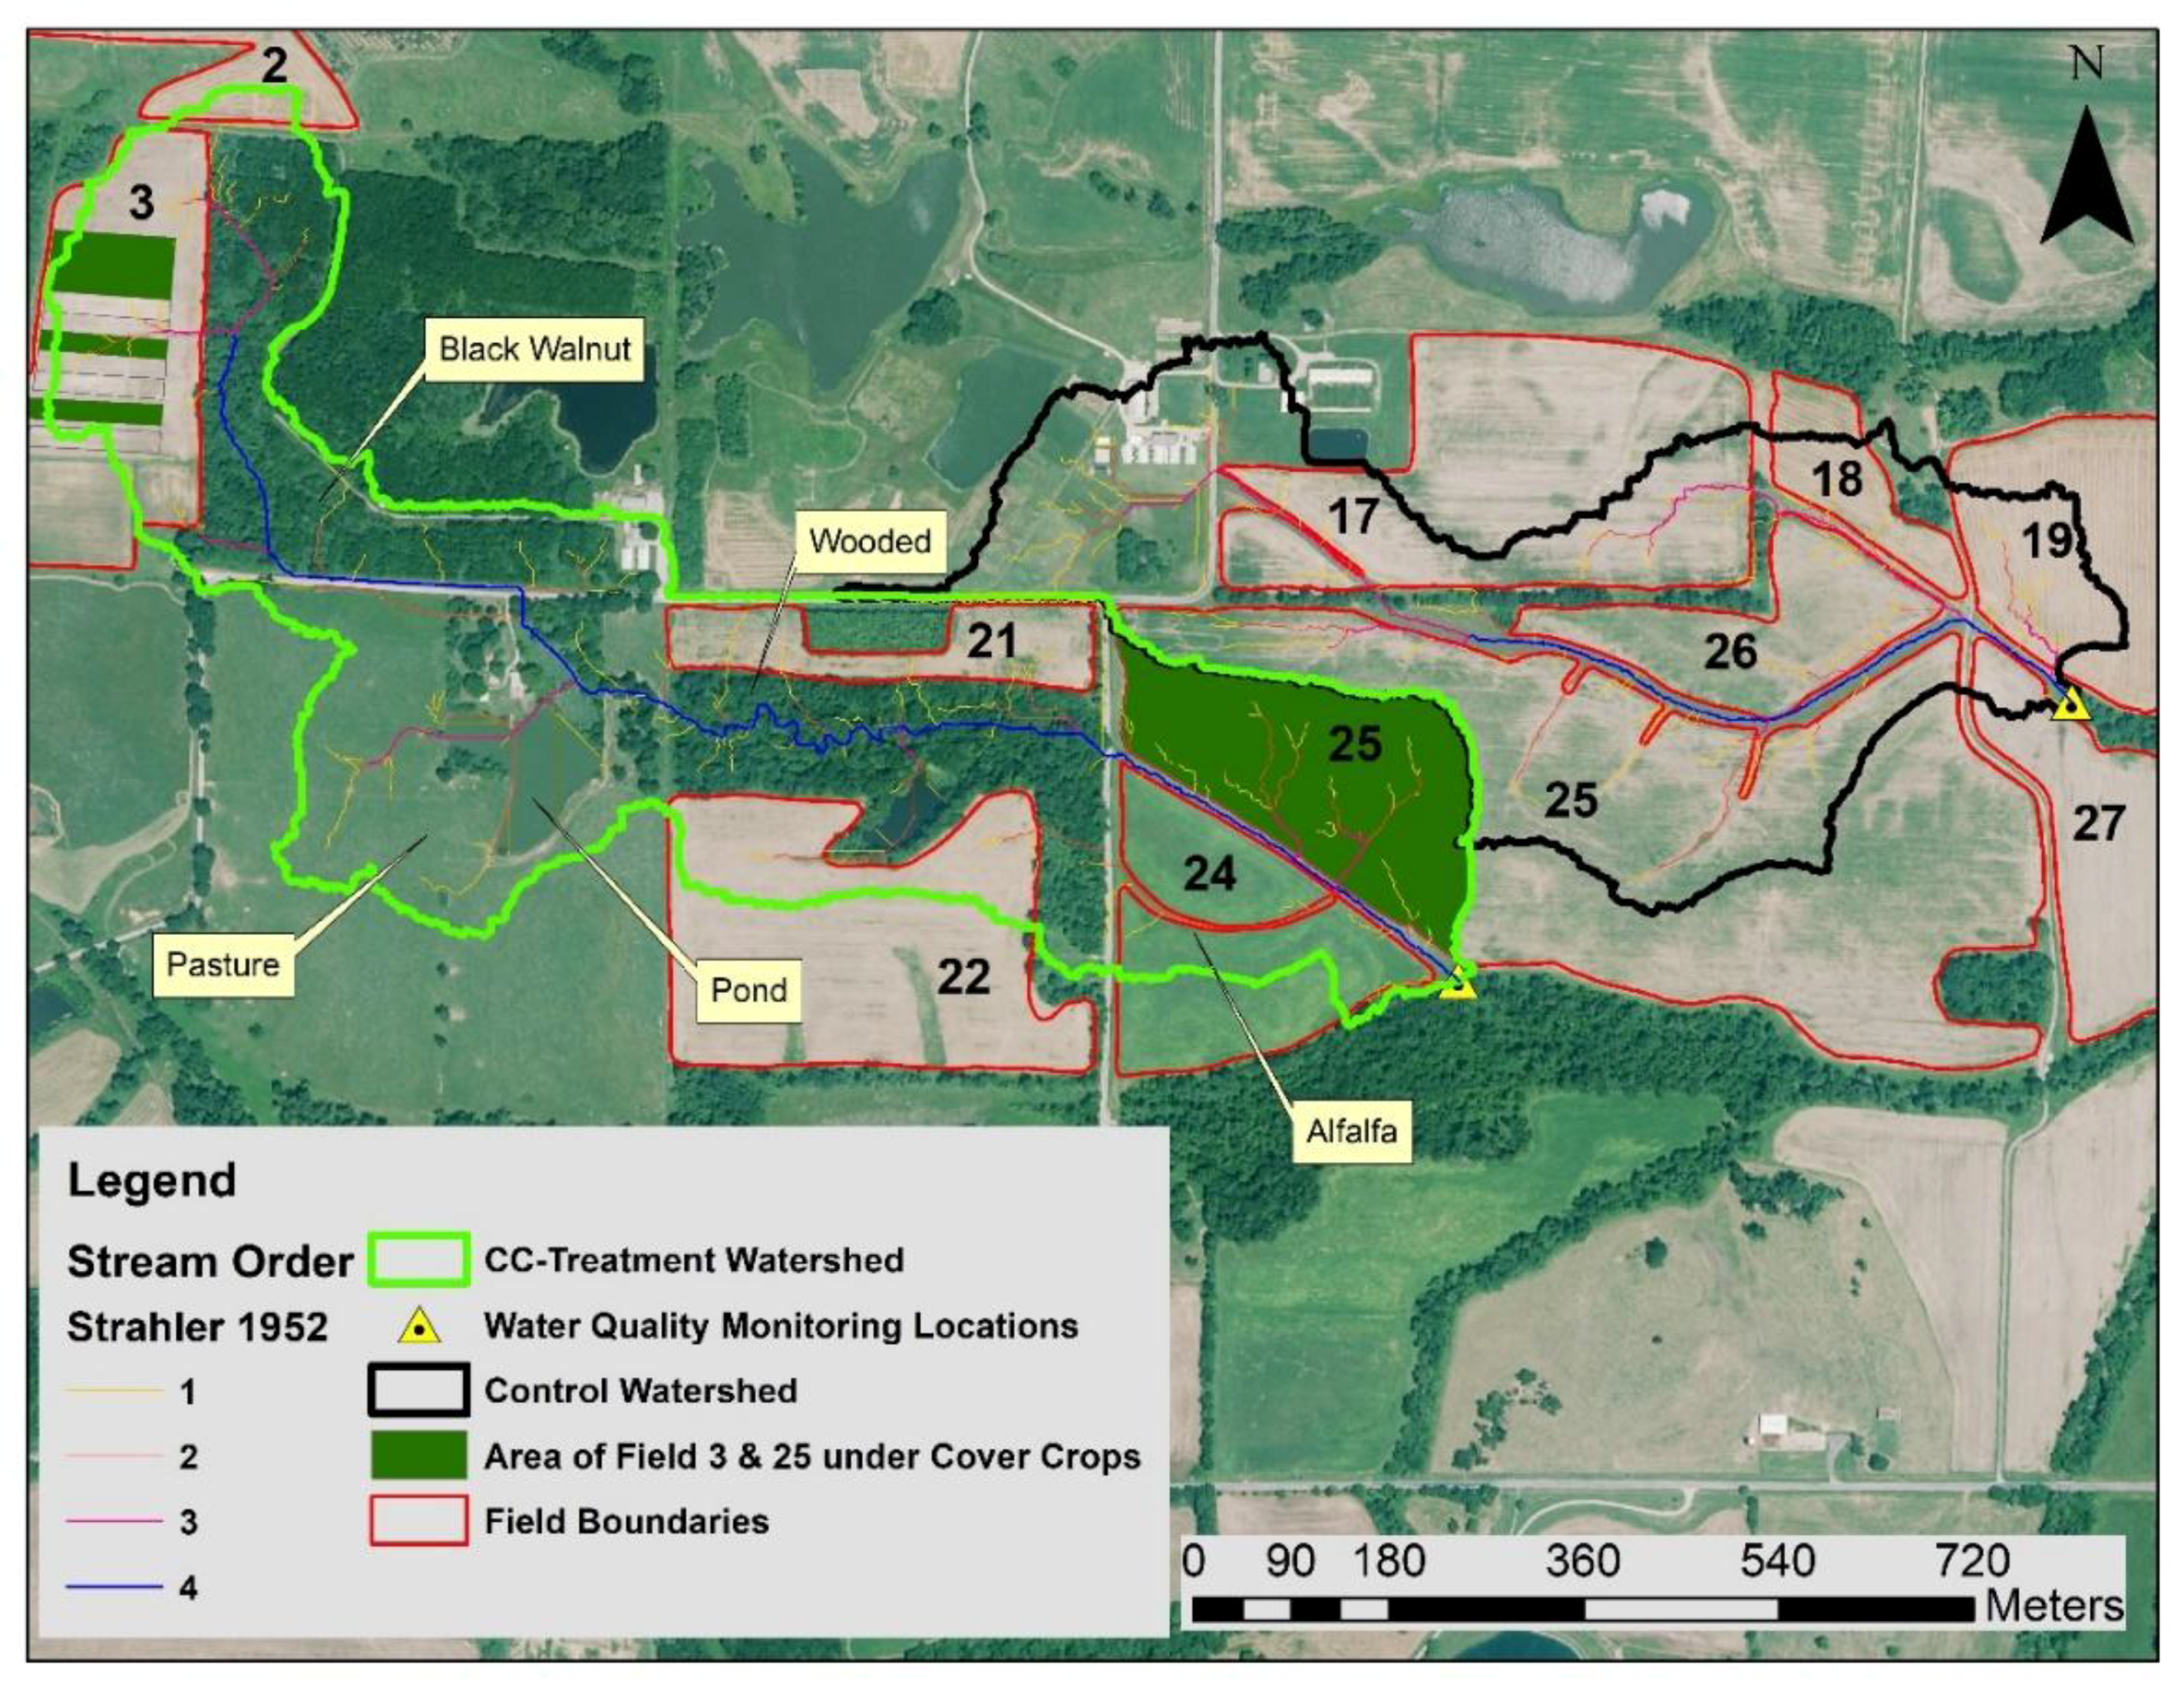
The paired watershed study site is located at Southern Illinois University’s research farms in Carbondale, IL (37°42′34″ N, [35] 89°16′08″ W) and was established in 2007 (Figure 1). Paired watersheds have a calibration period of three- to five years, during which all watersheds are treated identically and event-based monitoring of runoff water is conducted for measuring parameters of interest. Regression equations developed for pairs of watersheds during the calibration period can be statistically evaluated to determine the probability of measuring a minimum detectable change in runoff parameters during the treatment period [2,28,36,37,38]. During the treatment period, management remains the same in the control watershed, which serves as a check on climate and other year-to-year variation, and the treatment is applied to the other watershed. The paired watersheds were managed identically under a two-year rotation of no-till corn-soybean for four years during the calibration period (2008–2011). Cover crop treatment (CC-treatment) cereal rye (Secale cereale) was planted after corn harvesting and hairy vetch (Vicia villosa) after soybean harvesting in the CC-treatment watershed in the fields highlighted in dark green color in the map during the treatment period (Figure 1). The other watershed was maintained as a control watershed with no cover crops during winter.
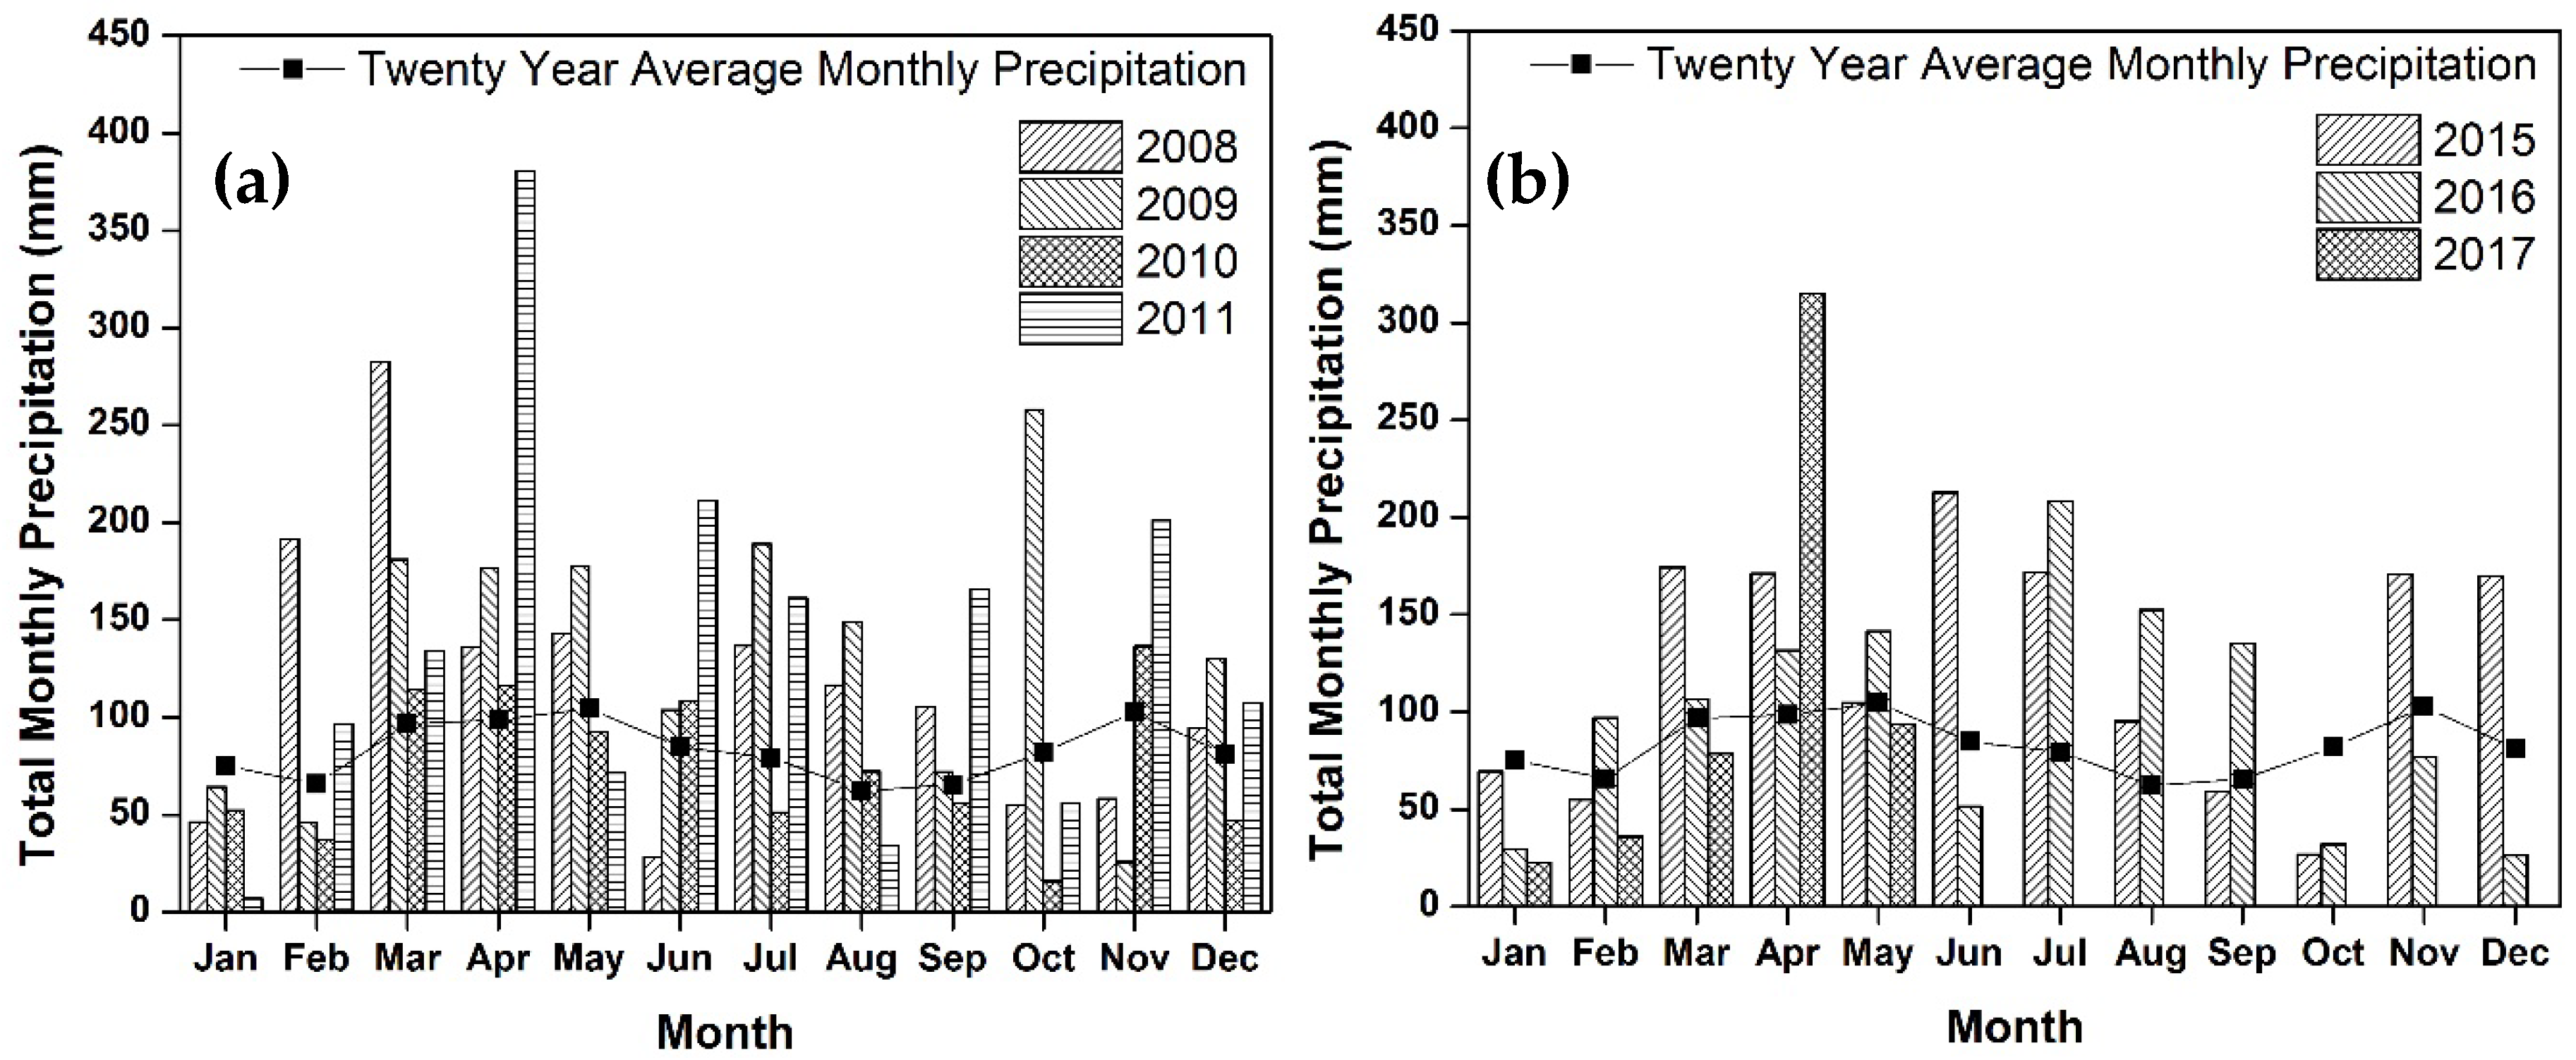
Paired watersheds were originally delineated using a Topcon GMS-2 handheld global positioning system (GPS) (Topcon Positioning Systems, Livermore, CA, USA), and ArcGIS V. 10 (ESRI, Redlands, CA, USA). However, availability of LIDAR data in 2011 from Illinois Geospatial Data Clearinghouse allowed the delineation of these watersheds using a 1.219 × 1.219 m digital elevation model (DEM) in ESRI ArcMap (version 10.2.2) and the hydrology toolbox for determining the correct watershed size [39]. The control watershed had an area of 27 ha and land use included 67.6% cropland, 23.4% grassed, 6.6% forested cover, and 2.4% impervious surface. The CC-treatment watershed had an area of 42 ha and its land use was 40.1% cropland, 30.3% forested cover, 23.6% pasture/grassed and 3.3% impervious surface. Soils in both watersheds were primarily Hosmer silt loams with slopes ranging from 2–20%. The Hosmer series is a moderately well-drained soil that formed from loess found on hillsides. The watersheds contained a perched, seasonal water table at a depth of 0.46 to 0.76 m depending upon the time of year [40]. Annual precipitation for this area is 1160 mm (Figure 2), and mean annual temperature is 13.4 °C. The climate data for the calibration period was obtained from the nearest weather station (37°69′97″ N, 89°24′33″ W) provided by the Water and Atmospheric Resources Monitoring Program, Illinois Climate Network (2017). Additionally, three tipping bucket rain gauges were installed for onsite monitoring of precipitation and temperature during the treatment period (Onset rain gauge, Onset Computer Corporation, Bourne, MA, USA).
Fiberglass Parshall flumes (Tracom Inc., Marble Hill, GA, USA) were installed at the outlets of the paired watersheds in June 2007 (Figure 1). Flume sizes for the watersheds were chosen based on channel dimensions and WinTR-55 modeling of runoff [41]. The widths of the control and CC-treatment watershed flumes were 91.44 cm and 121.92 cm, respectively. Pressure transducers, 720 Submerged Probe Flow Module (Teledyne ISCO Inc., Lincoln, NE, USA), were used to record water stage and estimate discharge rate at one-minute intervals during runoff events. ISCO 6712 automated samplers (Teledyne ISCO Inc., Lincoln, NE, USA) were utilized to collect water samples during storm events. Pressure transducers were set to trigger water sampling by ISCO 6712 automated samplers when the stage was more than 0.09 m. The automated samplers were programmed to collect 500 mL samples at varying time intervals to compensate for the fluctuations in the hydrograph. The time between samples was set closer together for summer months because of flashier, convective storm events and was extended for spring, winter, and fall when precipitation events were primarily frontal storms that had longer durations and lower intensities. Each automated sampler can collect a total of 24 water samples (each sample = 1000 mL) over the course of a sampling event. In the case of a storm event lasting over 24 h, the sampling base (24 new collection bottles) was changed to avoid missing the falling limb of the storm hydrographs.
2.2. Crop Management
The total area in each watershed under corn and soybean during the calibration and treatment period is provided in Table 1. The crop fields in paired watersheds were under the corn-soybean rotation and were managed by Southern Illinois University’s farm staff throughout the study period (Table 2). All fields in paired watersheds were maintained under no-till practice starting in 2006. Field no. 24 was under corn-soybean rotation prior to 2007. Alfalfa was grown in field no. 24 from 2007 to present. Field no. 22 was under alfalfa during the calibration period and was put under corn-soybean rotation during the treatment period. Two bailings of alfalfa were performed annually. Wheat was planted after corn harvesting in 2007 in field no. 25.
Corn was planted between the last week of April to the second week of May and harvested in October. Soybean was planted in May and harvested in November throughout the study period. Planting of corn was delayed to May in 2015 due to the inability to operate machinery in wet soil conditions. During treatment period in fall 2015, cereal rye was drilled after harvesting of corn on October 5 at a seeding rate of 88 kg ha−1 (Figure 1). Hairy vetch was drilled after harvesting soybean on October 26 in fall 2016 at a seeding rate of 28 kg ha−1. Pre-plant spring fertilizer application of N, P, K was based on the maximum return to nitrogen calculator for Illinois and soil fertility tests and averaged around 130:30:150 kg NPK ha−1 during the calibration period and 163:26:187 kg NPK ha−1 during the CC-treatment period. Phosphorus and K fertilizers were broadcast applied as diammonium phosphate (DAP) and Muriate of potash (MOP), whereas N was side dressed as anhydrous ammonia in spring. The NPK fertilizer application rates received by individual fields are given in Table 2.
2.3. Data Collection and Analysis
2.3.1. Stream Water Quality
Stream water sampling for the calibration period was initiated in January 2008 and ended in April 2011, whereas the stream water sampling for the treatment period began in June 2015 and ended in May 2017. There was a lag between the calibration period and treatment period due to the lack of sufficient funding for continuous monitoring of the stream water. The paired watersheds are headwater agricultural watersheds drained by ephemeral streams, therefore we only collected runoff during the storm events. Water samples collected during runoff events were placed in coolers (maintained below 4 °C) and transported to the water quality lab., located at the Southern Illinois University campus. Stream water samples were analyzed for pH, electrical conductivity (EC), TSS, NO3-N, NH4-N, and dissolved reactive phosphorus (DRP). A Fisher Scientific AT 20 pH/Conductivity meter (Fisher Scientific, Indian, PA, USA) was used to determine pH and EC. The TSS was measured using vacuum filtration following the 2540 D TSS method [42]. A Dionex ICS 2000 Ion Chromatograph (Dionex, Sunnyvale, CA, USA) was used for determining NO3-N concentrations. Dissolved reactive phosphorus and NH4-N levels were determined with a PerkinElmer Lambda 25 UV/Vis spectrophotometer (PerkinElmer Inc, Waltham, MA, USA) using the ascorbic acid method (4500-PE) [43] and the phenate method (4500 NH3 F) [43], respectively.
2.3.2. Cover Crop Biomass
During the treatment period, cover crop biomass was sampled at 27 locations before termination of the cover crops in field 25 in the CC-treatment watershed and weed biomass (weed species: Barbarea vulgaris, Packera glabella, Purple Deadnettle, Allium vineale, Stellaria media, Amaranthus tuberculatus) was sampled in field 25 in the control watershed where there were no cover crops (Figure 1). Biomass was estimated by randomly collecting biomass samples by throwing a 0.4-m2 PVC quadrat twice at each location. All live above ground biomass (including weed biomass) was harvested within the quadrat and biomass samples were dried at 60 °C until constant weight was obtained. Further, the dry weight per sample was recorded. Dried samples were ground and analyzed for TN and TC using a CN soil-plant analyzer (Flash 2000, organic elemental analyzer, Thermo Scientific, Waltham, MA, USA). Biomass harvested and TN was scaled up to a kilogram per hectare basis for reporting of data.
2.3.3. Event Mean Concentration Calculations and Statistical Analysis
For each storm event, the total runoff volume was calculated by summing volumes recorded at one-minute intervals and converting to depth equivalent by dividing it by the watershed area. Annual loads were not calculated because all storm events were not sampled. Stage data along with contaminant concentrations were used to produce storm event mean concentrations (EMCs) and predictive linear regression equations for CC-treatment watershed (Table 3). Contaminant concentrations across the hydrographs for TSS, NO3-N, NH4-N, and DRP were averaged between known sample concentrations. Event mean concentrations were then calculated from this dataset for 42 storms collected from both of the watersheds [28,44]. Only storm events for which the entire hydrographs were obtained from both watersheds were used in this analysis. Event mean concentrations were used in formulating the predictive regression equations (Table 3). The CC-treatment watershed represented the treatment for the regression, while the other watershed remained the control. Additionally, another set of regression equations was developed from 28 storm events collected between November to May during the calibration period (Table 4). These equations were developed to focus on the time cover crops would be growing.
All statistical procedures were performed in SAS v9.4 (SAS Institute, 2014). Regression equations were developed using Proc REG, where EMCs of CC-treatment watershed were regressed onto the control watershed for TSS, NO3-N, NH4-N, DRP and event discharge (EQ). Proc Univariate command in SAS was used for testing the normality of the data sets. Normality was determined before regression using a Shapiro-Wilks test. Natural log transformations were used for TSS, NO3-N, and DRP. Square root transformations were used on NH4-N and EQ. Cover crop biomass data were analyzed using PROC Glimmix, and the Tukey-Kramer test was used for testing mean differences at alpha = 0.05.
3. Results and Discussion
3.1. Cover Crop Biomass, C:N Ratio and N-Uptake
Cereal rye was planted on 5 October 2015 at a seeding rate of 88 kg ha−1 and was terminated on 23 April 2016, at early boot stage. Cereal rye cover crop biomass was sampled on 12 April 2016. No significant differences were found between cereal rye plus weed biomass (1322.1 ± 244.7 kg ha−1) from the CC-treatment watershed and the weed biomass (1386.9 ± 154.6 kg ha−1) from the control watershed (Table 5). However, significant differences existed between the C:N ratio where control watershed had 26:1 verses CC-treatment watershed had 30:1 (Table 5). Cereal rye planting and termination date impacts on biomass accumulation have been studied previously [45,46,47]. Duiker and Curran [45] reported that aboveground cereal rye biomass can be three times greater when terminated at the late-boot stage (4200 kg ha−1) compared with the early-boot stage (1400 kg ha−1) in the mid-Atlantic region of the US. In central Illinois, Ruffo, et al. [48] also reported C:N ratio of 28:1 at Brownstown, and a lower C:N ratio of 23:1 at Urbana Illinois due to greater N availability from soil residual nitrate-N and mineralization that allowed higher N-uptake. In a three year experiment, Meisinger and Ricigliano [49] also found that cereal rye had 58 to 61 units higher C:N ratio than the no cover crop treatments which only had weeds. The C:N ratio of cereal rye in the study conducted by Meisinger and Ricigliano [49] was comparatively higher to values found in our study (30:1), probably due to differences in variety, biomass production, climatic and soil conditions and crop management. The larger C:N ratio play vital role in immobilizing N where soil microorganism temporarily utilize available N for decomposing the cereal rye biomass. Therefore, if availability of N is reduced in soil the N available for leaching and runoff loss in also reduced by the cover crops.
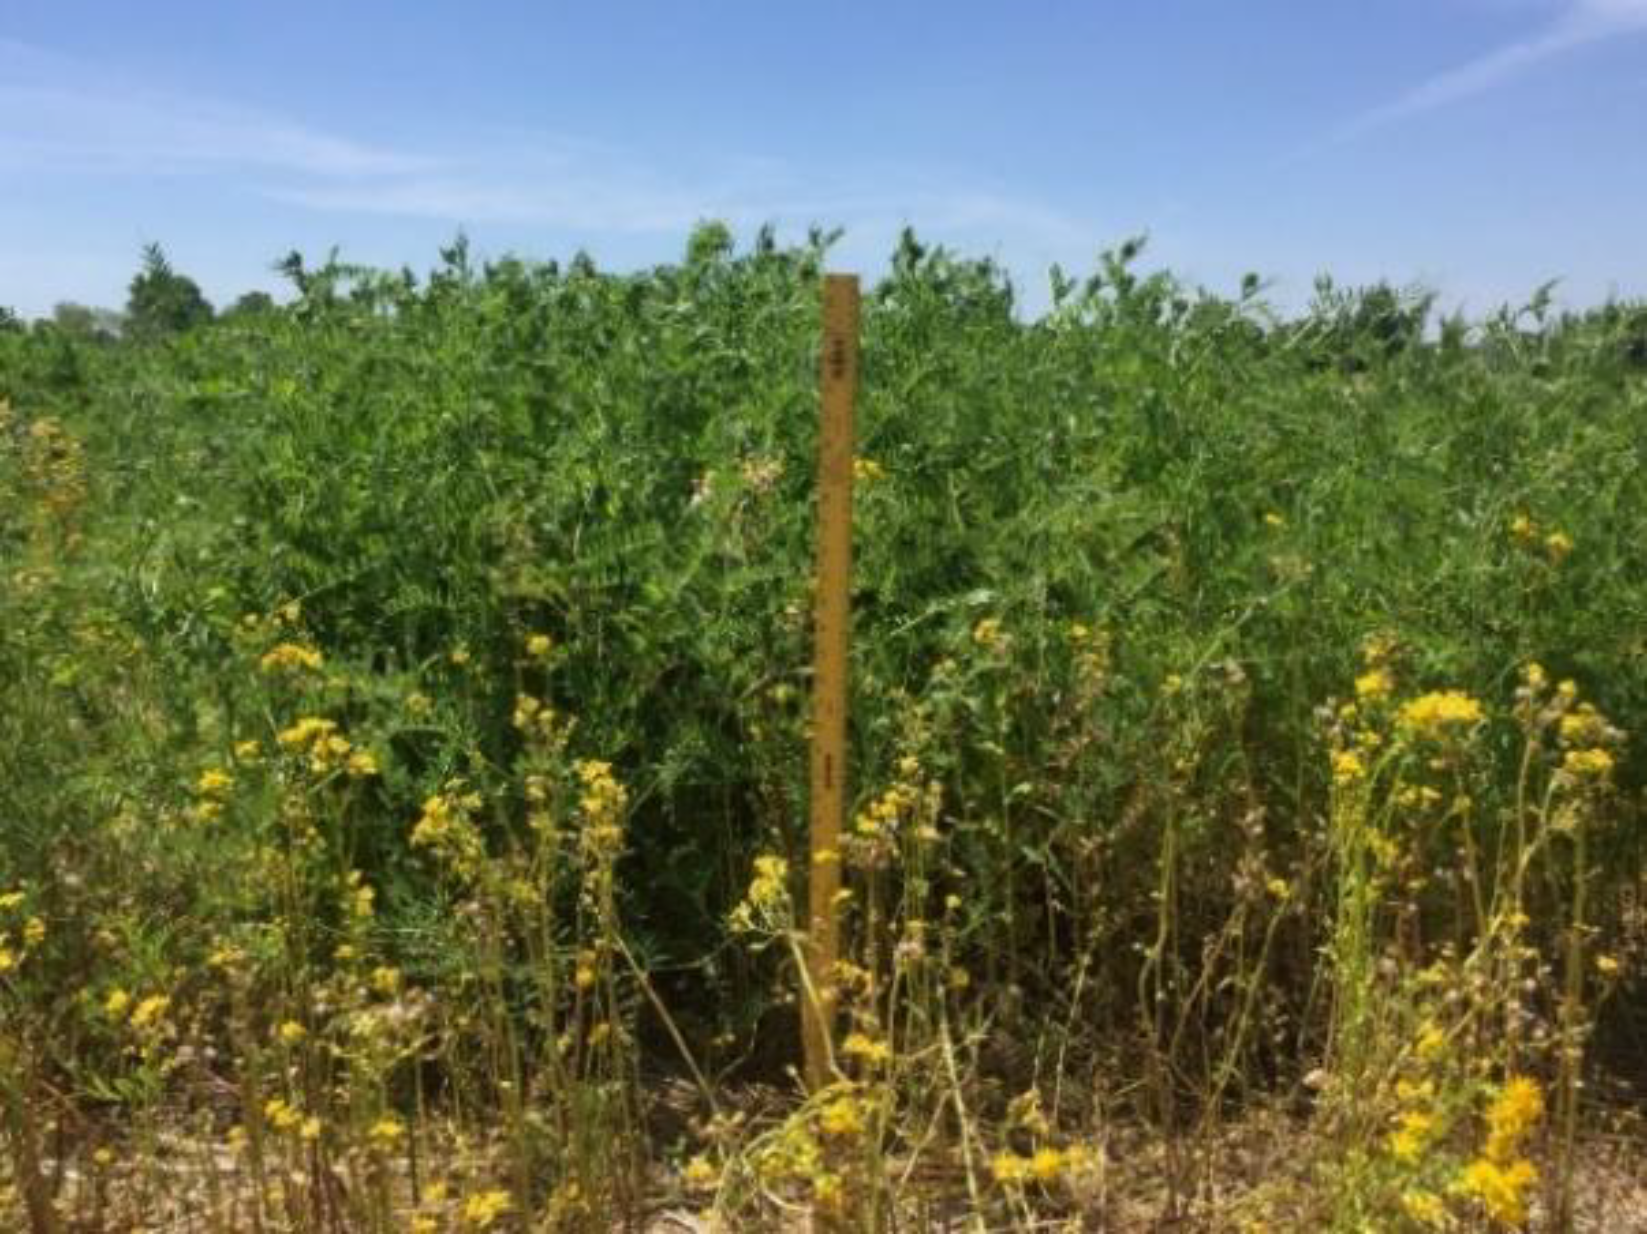
Hairy vetch was planted on 26 October 2016 at a seeding rate of 28 kg ha−1 and was terminated on 12 May 2017. Biomass of hairy vetch was collected twice, first on 13 April 2017, and second on 12 May 2017. The termination date of hairy vetch was delayed until May due to wet soil conditions from heavy precipitation (241 mm) received during the last week of April 2017 (Figure 2). Hairy vetch plus weed biomass (1831.2 ± 212.9 kg ha−1) in the CC-treatment watershed was not significantly different from weed biomass (1672.3 ± 213.1 kg ha−1) in the control watershed during the earlier sampling date in April 2017 (Table 5). However, delaying hairy vetch termination by a month yielded 100% greater biomass of hairy vetch plus weeds (4182.8 ± 655.8 kg ha−1) in the CC-treatment watershed compared to the April sampling and it was significantly greater than the biomass of the weeds (1193.9 ± 677.1 kg ha−1) from the control watershed (Table 5). Hairy vetch height increased to nearly one meter by the termination date because of optimum temperature and moisture conditions for growth during the spring season (Figure 3). The hairy vetch plus weeds C:N ratio in the CC-treatment watershed was 4.21 units lower than the control watershed in May 2017 (Table 5). The high N content in the hairy vetch legume biomass due to biological N fixation reduces its C:N ratio (22:1). Use of hairy vetch CC increased N-uptake in CC-treatment watershed by 80.27 kg ha−1 when compared to the control watershed during May 2017 biomass sampling (Table 5). Teasdale, et al. [50] found that hairy vetch biomass can increase linearly by 41 g m−2 for every 100 growing degree days. Mirsky, Curran, Mortenseny, Ryany and Shumway [46] reported that approximately 2000 kg ha−1 hairy vetch cover crop biomass can be increased by early fall planting dates (25 August–15 October) and for each 10-day incremental delay in spring termination dates (1 May–1 June) of the cover crop. The rate of biomass accumulation by hairy vetch in the spring can also be influenced by the timing of fall planting. Similarly to our results, Kuo, et al. [51] found that hairy vetch had 16–20 units lower C:N ratio than the no-CC treatment in a study conducted in Washington. Early planting of cover crops during fall is very important for establishing a good stand of cover crops that can withstand winter frost/snow and generate good biomass accumulation during spring.
3.2. Surface Runoff
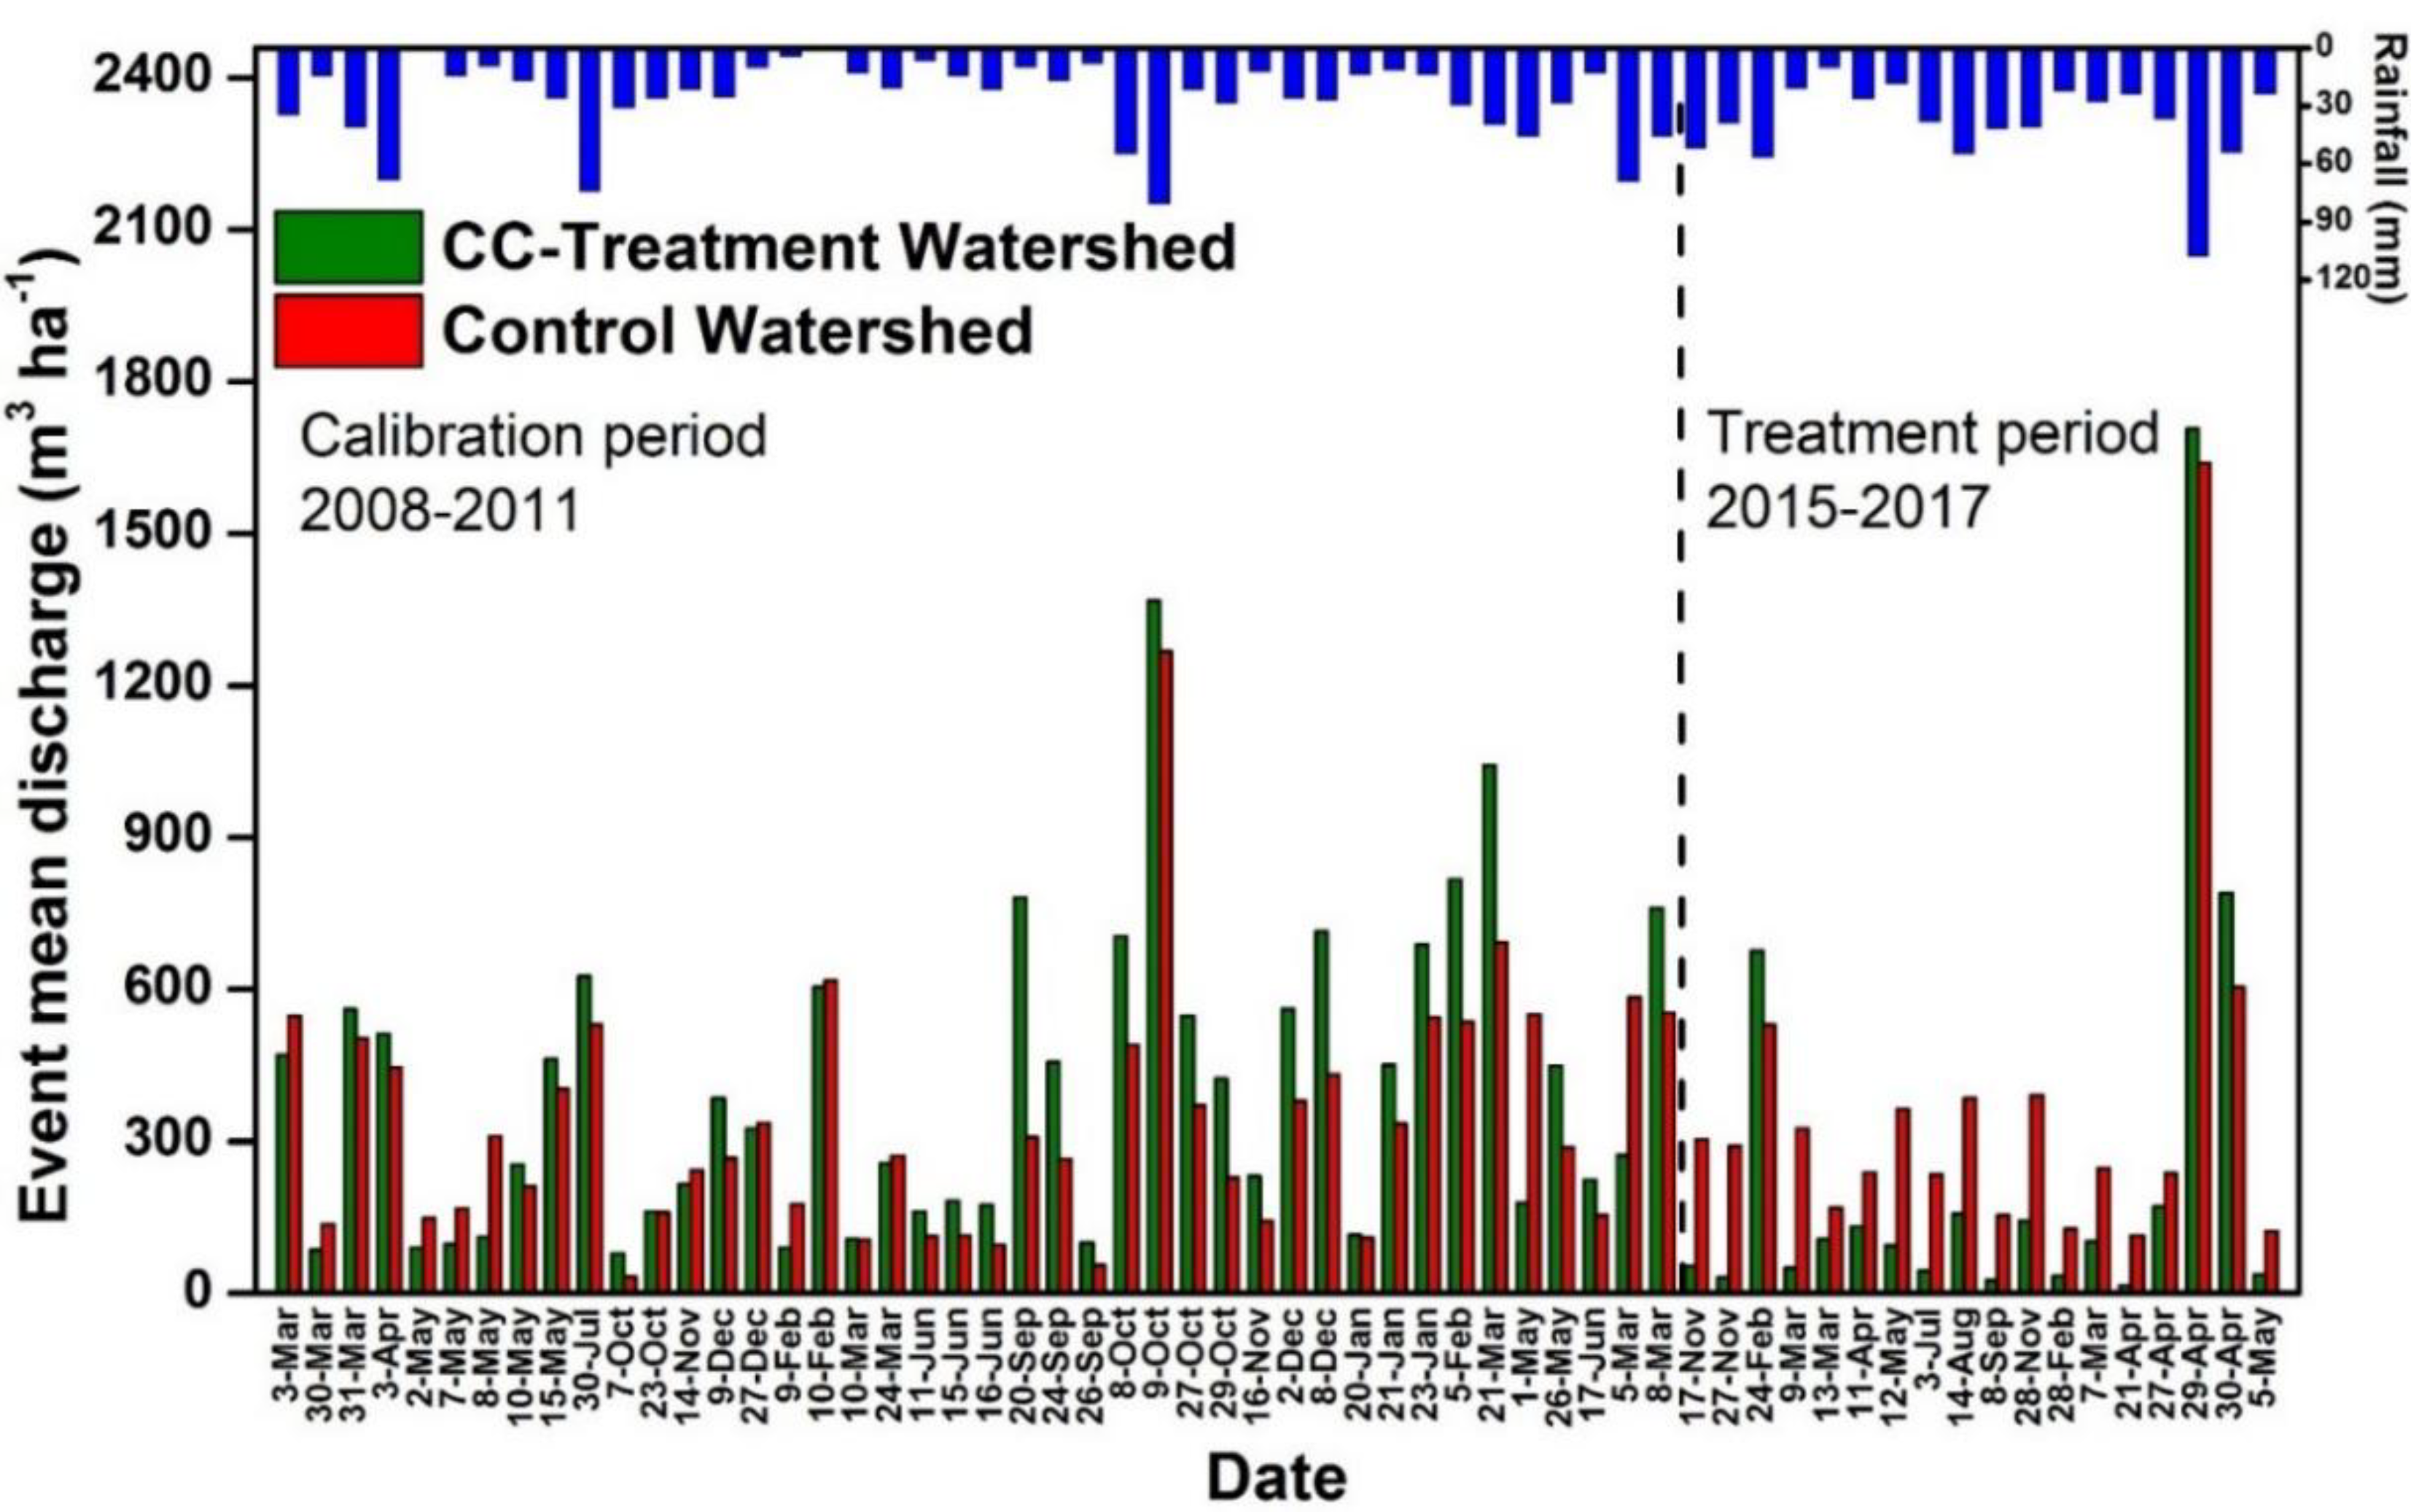
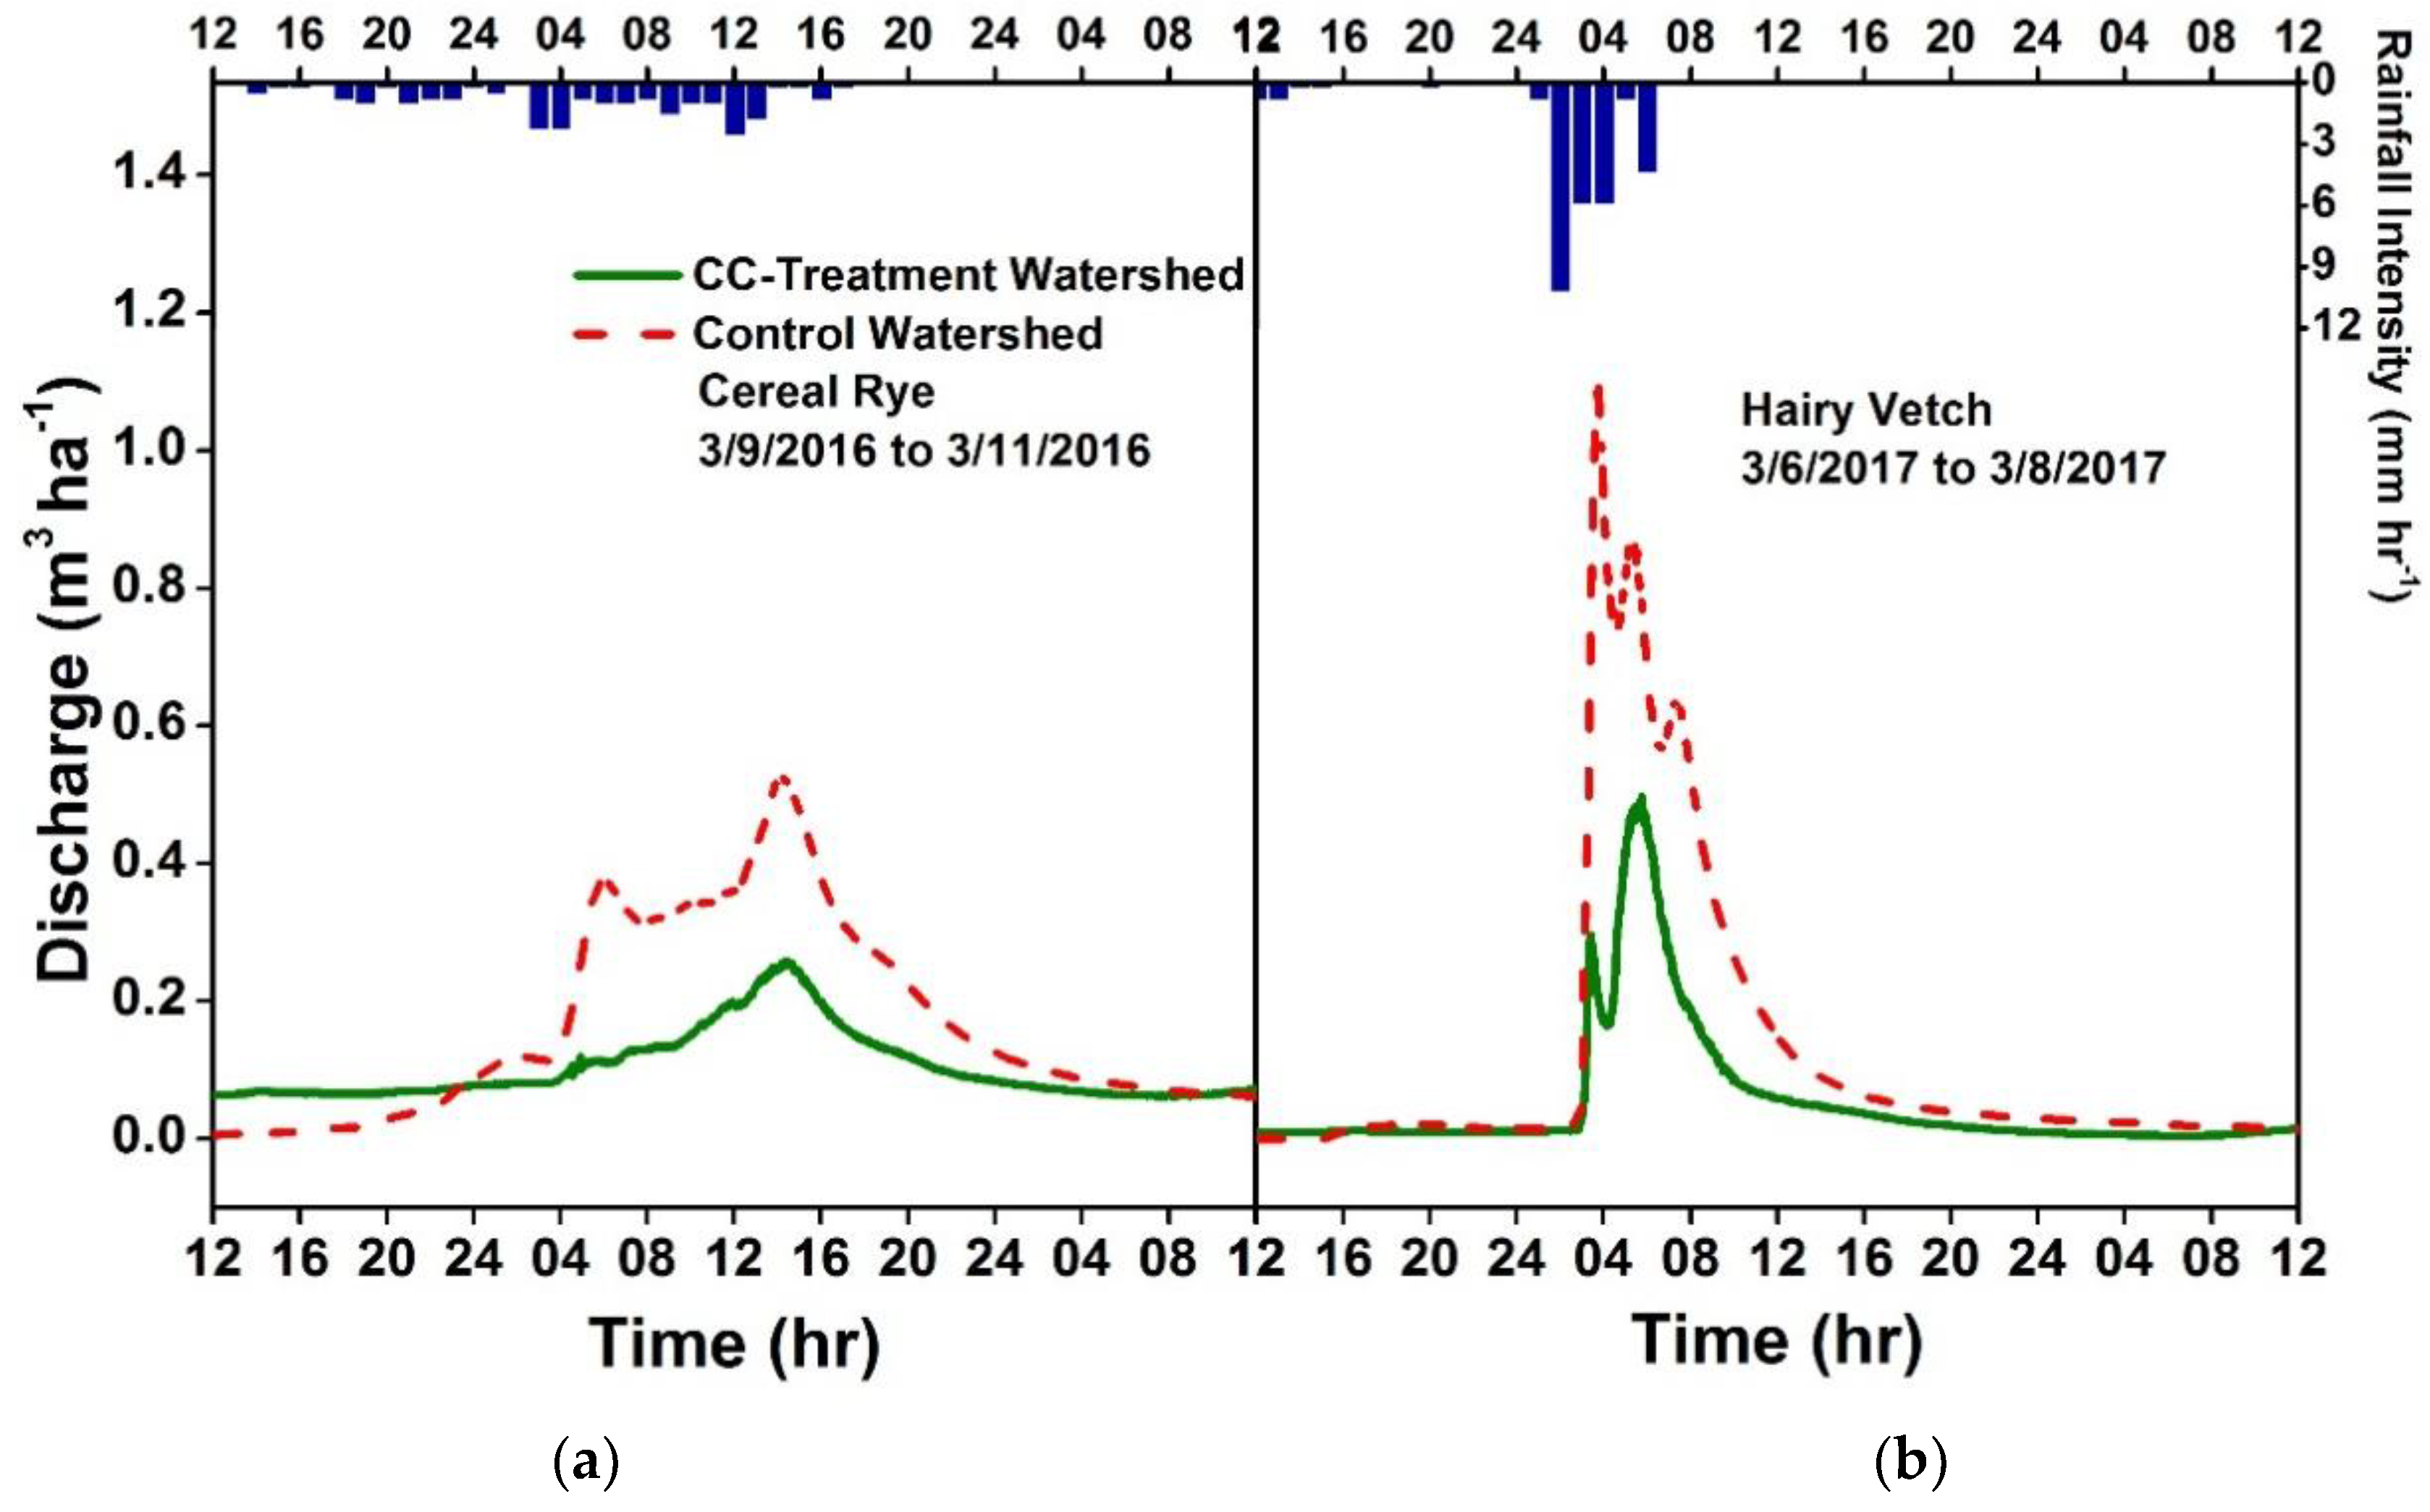
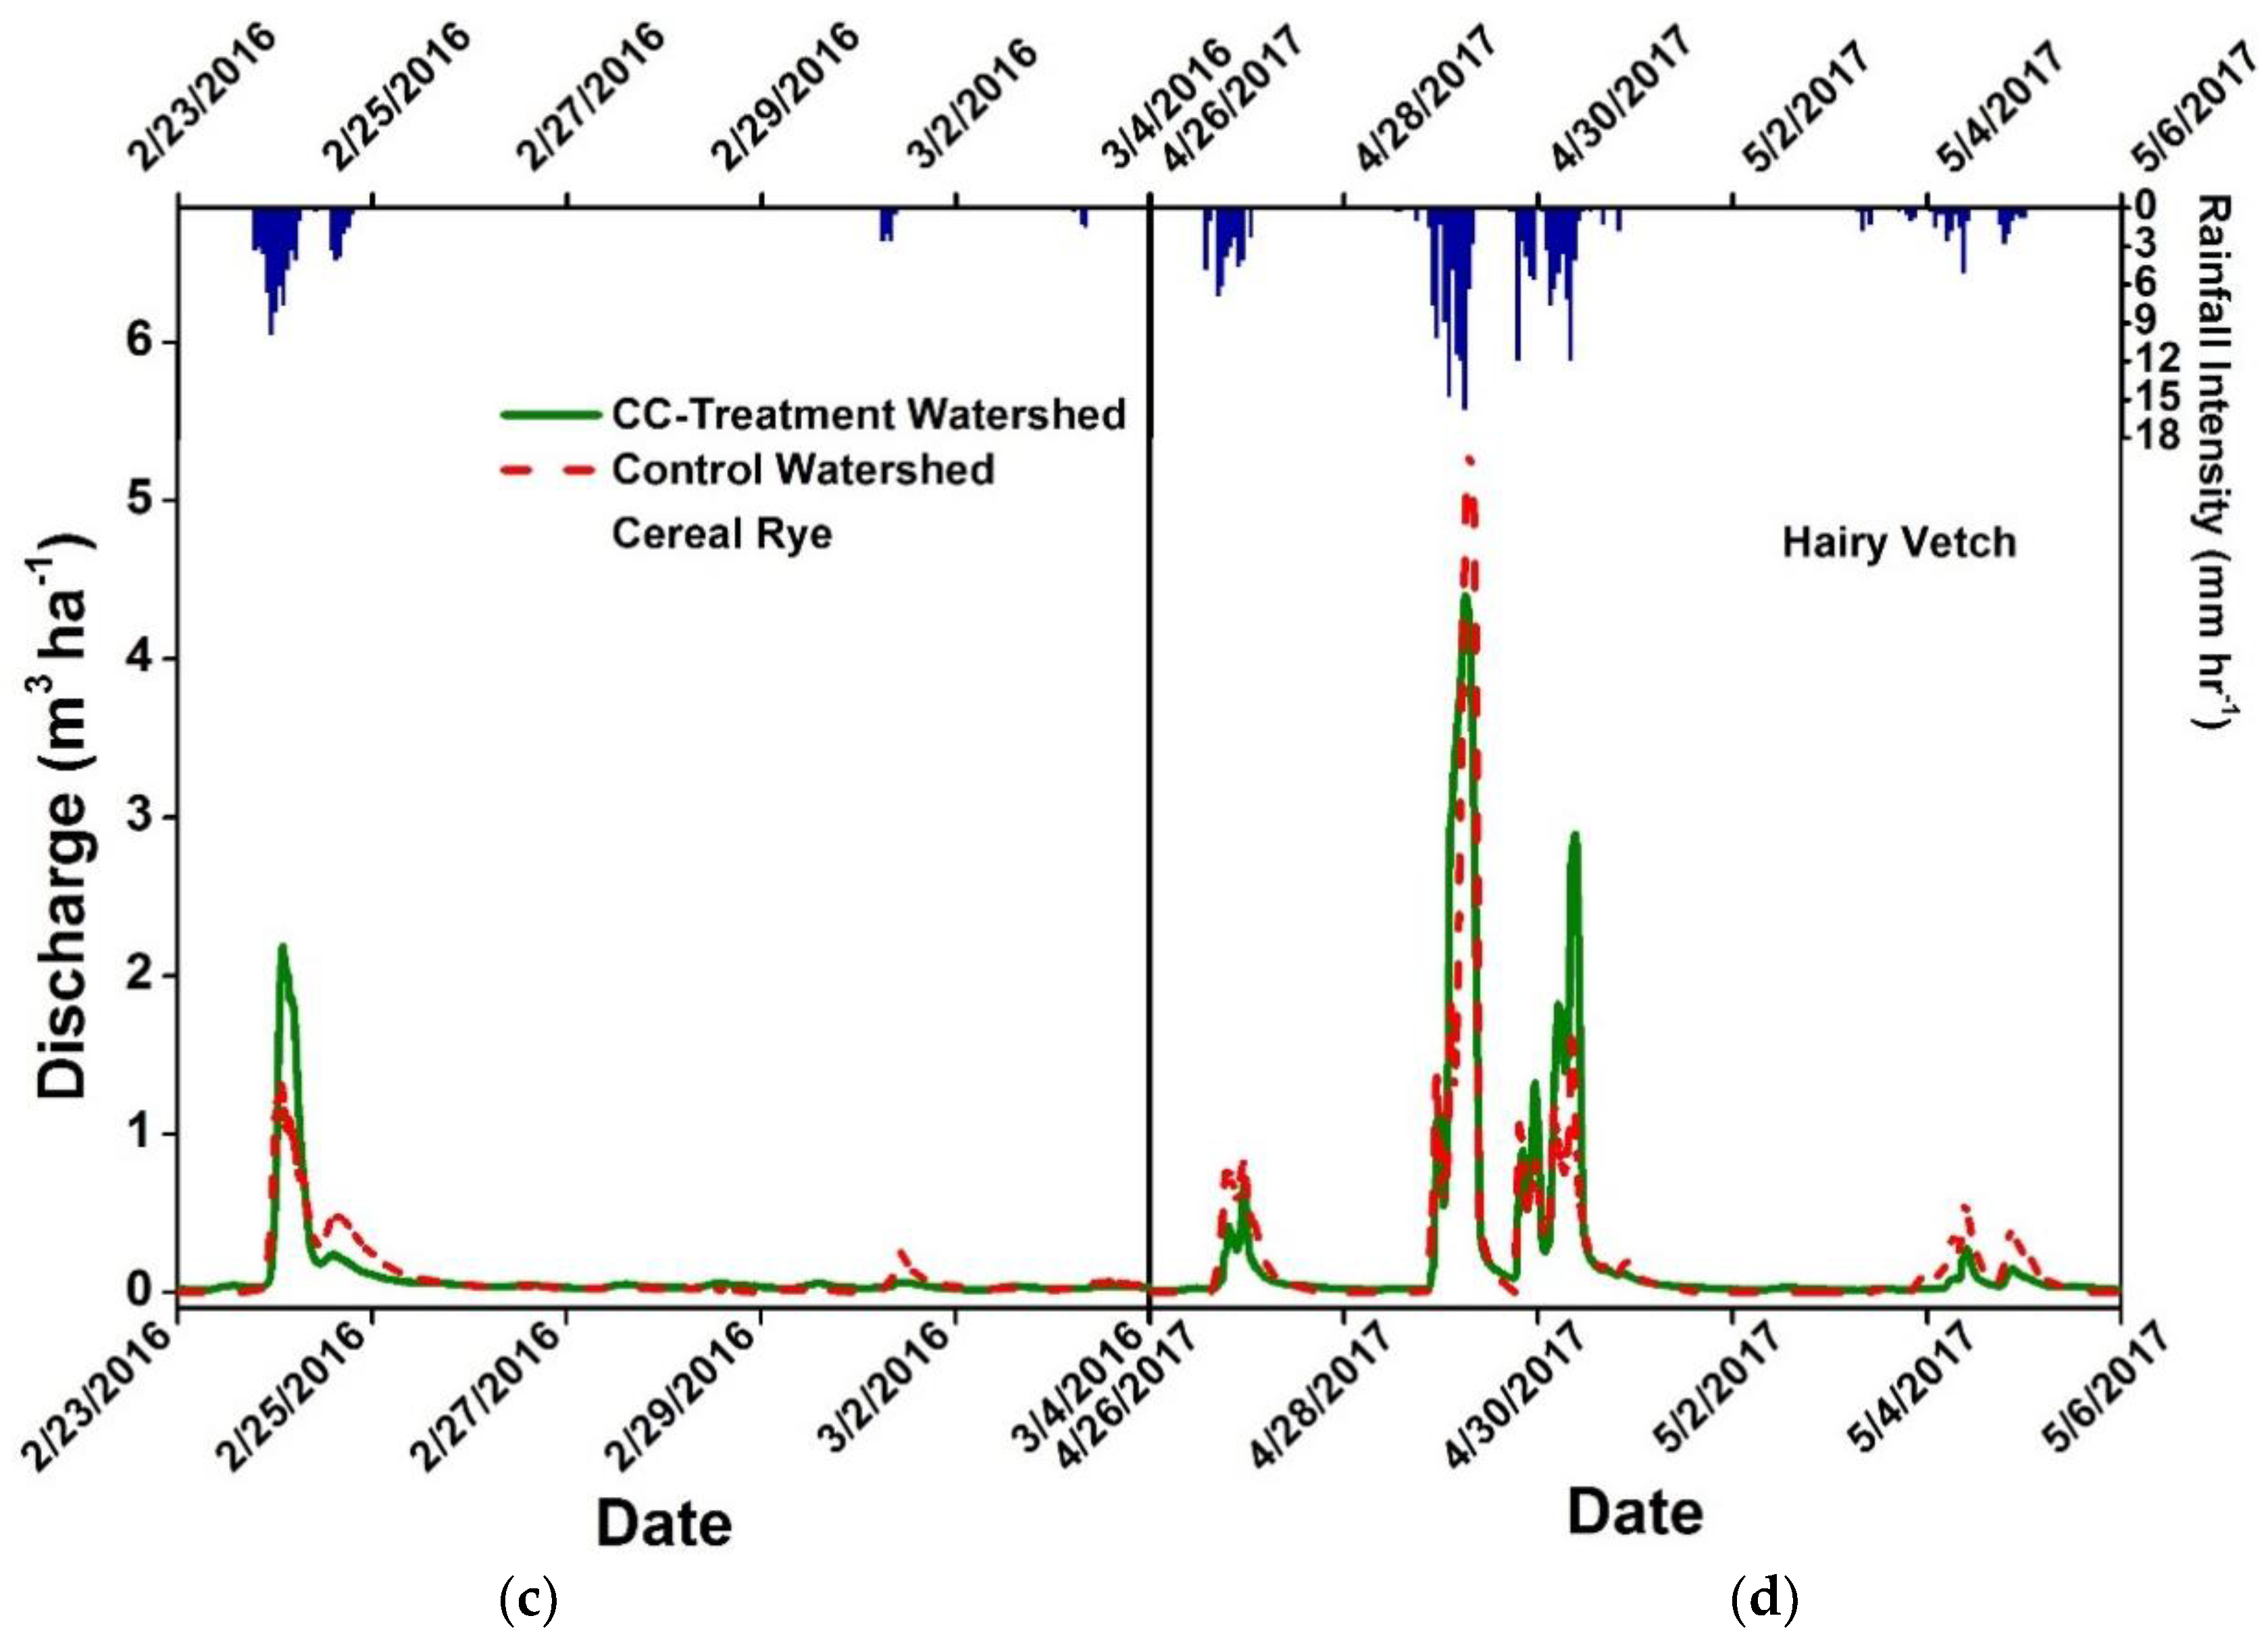
During the treatment period, event mean discharge of the CC-treatment watershed was lower compared to the control watershed except for three storm events collected on 24 February 2016, and on 29 and 30 April 2017 (Figure 4). The peak discharge of storm events with intensity <10 mm hr−1 was 51–55% lower for the CC-treatment watershed compared to the control watershed (Figure 5a,b). However, the peak discharge of storm event with intensity >10 mm hr−1 was greater (25–37%) for the CC-treatment watershed compared to control watershed, except for the 29 April 2017 storm event where it was 17% lower (Figure 5c,d).
Cover crops are reported to increase infiltration rates [52,53], rooting depth/density [54,55], porosity [56], evapotranspiration rates [57] and surface roughness [58] thereby reducing runoff. In one study, cereal rye had a significantly higher infiltration rate of 46.8 mm hr−1 when compared to fallow control, 39.1 mm hr−1 [52]. McVay, Radcliffe and Hargrove [53] reported that hairy vetch had infiltration rates as high as 58.4 mm hr−1 that were significantly different from fallow control (37.8 mm hr−1) in sandy clay loam soils of Georgia. Higher root counts for cereal rye and hairy vetch were reported by Sainju, Singh and Whitehead [54] than fallow control using a mini-rhizotron camera. The root count was significantly correlated to the aboveground cover crop biomass [54]. In Illinois, Villamil, Bollero, Darmody, Simmons, and Bullock [56] found that the corn-cereal rye-soybean-hairy vetch cover cropping system had a higher total porosity (40.3 μm) compared to corn-soybean cropping system (39.0 μm). Winter cover crops significantly increased soil cover by 30 to 50% during the critical erosion period of late spring to early summer in Missouri and reduced average runoff by 47% compared to no-cover crop control [58]. The impact of the erosive power of raindrops is reduced due to the increased ground cover by cover crops, thus reducing surface sealing and prolonging the residence time of water on the soil surface. All studies discussed above were conducted at the plot scale and describe the potential mechanisms that can work in concert at the watershed scale to reduce runoff.
During the treatment period, three storm events out of 18 had higher event mean discharge for the CC-treatment watershed (Figure 4). These results may be explained by prevailing weather conditions. Brill and Neal [59] studied the impact of cereal rye cover crop on water infiltration throughout the year and reported that runoff from cereal rye cover crop was lower in every month compared to bare ground except in February. They concluded that bare ground thawed more rapidly compared to the ground with a surface cover of cereal rye, thereby infiltrating more water in February and cereal rye produced greater runoff because it remained frozen for a longer period. Total precipitation received during April 2017 was 318 mm (Figure 2), out of which 241 mm was received during the last week of April. Antecedent soil moisture condition along with rainfall intensity reaching >10 mm ha−1 resulted in higher event mean discharge from the CC-treatment watershed for the storm events collected on 29 and 30 April 2017 (Figure 4). The peak discharge of the storm event on 29 April 2017 was 17% lower for the CC-treatment watershed compared to the control watershed and can be explained by greater hairy vetch biomass that could have increased hydraulic roughness and may have increased water infiltration. However, when the succeeding storm event on 30 April 2017 occurred, peak discharge for the CC-treatment watershed increased compared to the control watershed because of saturation, leading to greater overland flow (Figure 5d). Grissinger [60] compared runoff hydrographs from conventional till soybean with non-grazed pasture and observed 20% reduction in total runoff and 70% reduction in peak runoff rates. In summary, cover crops that are planted in early fall and are established well with a significantly higher biomass compared to no cover crops during spring have the potential to reduce total as well as peak runoff rates, thereby minimizing stream bank and bed erosion [15].
3.3. Observed-Predicted Discharge: TSS, NO3-N, NH4-N, and DRP for CC-Treatment Watershed
The difference between observed minus predicted discharge and TSS ranged from −206 to −999 m3 ha−1 and +0.11 to −0.22 g L−1, respectively (Figure 6). Fifteen out of 18 storm events had negative observed minus predicted TSS suggesting that cover crops have great potential to reduce TSS. A five-year small plot-scale erosion study conducted by Meyer, et al. [61] showed that no-till sorghum-corn followed by hairy vetch reduced average monthly runoff to <15 mm from January to May when compared to conventional till soybean and no-till soybean. In a paired watershed study in claypan soils of Missouri, USA, an 8.4% (p = 0.015) reduction in runoff was observed by implementing grassed filter strips during nine years of the treatment period [27].
A number of studies using cover crops have reported reductions in TSS and total soil loss compared to fallow control [58,62,63,64,65,66,67]. Authors in these studies reported soil loss as high as 16,906 kg ha−1 year−1 from fallow control to a low of 33 kg ha−1 year−1 from plots/fields with cover crops [66]. In a six-year watershed scale study conducted by Shipitalo and Edwards [9], authors reported that reduced till corn-fallow-soybean-cereal rye rotation had an average soil loss of 500 kg ha−1 year−1, which was below the required soil loss tolerance limit of 7800 kg ha−1 year−1 in Ohio, USA. Vegetative buffers including grassed and agroforestry buffers in a paired watershed setting were reported to reduce sediment losses by 30% and 28%, respectively [10].
The positive differences for TSS occurred on storm events collected on 23 February 2016 and 28 February 2017 when the minimum air temperature was −4.4 °C (average air temperature 2.1 °C) and −8.1 °C (average air temperature 2.6 °C) and the soil surface was frozen (Figure 6). The control watershed with no cover may have thawed earlier than the CC-treatment watershed, resulting in higher infiltration rates and in turn reducing runoff and sediment loss for the storm event received on 24 February 2016 and sediment loss for 28 February 2017 [59]. The positive difference for TSS also occurred on 30 April 2017 when rain continued for an extended period causing a greater antecedent moisture level in the soil than with normal rain events [10].
Observed minus predicted NO3-N, NH4-N, and DRP concentrations ranged between +1.67 to −0.22 mg L−1, +0.56 to −0.15 mg L−1 and +1.52 to −0.19 mg L−1, respectively (Figure 6). The NO3-N concentrations in runoff were highest during the soybean season, whereas DRP and NH4-N concentrations were highest after DAP fertilizer application on 9 April 2016. However, the observed minus predicted NH4-N ranged between −0.01 to −0.13 mg L−1 for five storm events collected between 17 November 2015 to 13 March 2016 before DAP fertilizer application.
Nitrate-N losses from soybeans may have resulted from either residual soil N following decomposition of cover crops or from N mineralization during summer and early fall due to the availability of ideal precipitation and temperature conditions [68,69]. In a plot scale study conducted by Klausner, Zwerman, and Ellis [63], surface runoff monitored for one year for nitrate-N and soluble-P loads yielded reductions of 43% for N and 73% for P in plots planted with no-till ryegrass compared to conventional-till no-cover crop following corn. However, Pesant, Dionne, and Genest [65] reported an increase of 36% in NO3-N loads and a decrease of 14% of soluble-P loads in no-till corn-alfalfa rotation compared to conventional till corn-no-cover crop rotation. In a four year study on soil monoliths and nitrate leaching conducted in Iowa, Logsdon, Kaspar, Meek and Prueger [57] reported a reduction in NO3-N loads by using cereal rye. However, this reduction was not significant when compared to fallow control during the fall-winter cover cropping season. Similarly, NO3-N leaching was not significantly reduced in two out of three years of study on corn-cereal rye-Broccoli-cereal rye rotation when compared to fallow control [70]. Therefore, while scaling up cover crops from plot/lysimeter studies to a watershed scale, researchers and policymakers should consider the amount of time that will be required for cover crops (BMPs) to reduce NO3-N loading to streams in the impaired watersheds.
Additionally, the amount of fertilizer and time of application are critical for improving water quality. Fertilizer application followed by a precipitation event can result in the dissolution of P from applied fertilizer causing dissolved P in runoff water [71,72]. Rainfall intensity ranging between 50 and 160 mm h−1 along with slope ranging from 2 to 20% can increase runoff energy, thereby further enhancing sorption and desorption of dissolved P to runoff sediments [73]. During the hairy vetch cover crop season, no P fertilizer was added and therefore DRP concentrations ranged between +0.22 to −0.04 mg L−1 which might be due to legacy P or residual P in runoff water [74]. Lysimeter studies reported above and watershed scale studies [4,16,17,18] show the importance of lag time between implementation of cover crops and their subsequent response in improving water quality. The treatment period in this study lasted for two cover cropping seasons, therefore the time required for the cover crops to improve water quality may not be sufficient [14].
3.4. Overall Event Means Concentrations
Overall event mean TSS concentration, discharge, and discharge per ha were decreased by 32.67, 40.68 and 34.28%, respectively by planting cover crops during two years of the treatment period (Table 6). However, EMCs of NO3-N, NH4-N, and DRP increased by 104.11%, 34.56% and 60.07%, respectively.
The CC-treatment watershed and control watershed received 15 storm events that were large enough to produce runoff from both of the watersheds from November to May. We collected seven storm events and calculated EMCs from regression equations developed from 28 storm events collected during the calibration period from November to May (Table 7). Event mean TSS, discharge, and discharge per ha were reduced by 35.35%, 49.95% and 44.55%, respectively. However, EMCs of NO3-N, NH4-N, and DRP were increased by 43.56%, 16.99% and 119.67%, respectively. We collected eight out of 12 storm events during the hairy vetch cover crop season. Event mean TSS, discharge, and discharge per ha were again reduced by 23.03%, 19.74%, and 11.08%, respectively. Event mean concentration for NO3-N, NH4-N, and DRP were increased by 74.45%, 57.03% and 28.97% (Table 8). There was an increase in NO3-N and NH4-N in runoff water when hairy vetch cover crop was planted in the CC-treatment watershed, when percent change from predicted values for EMCs of NO3-N, and NH4-N from Table 7 and Table 8 were compared.
The paired watersheds in this study had intermittent flow regimes. Therefore, most N and P transport occurred during the storm events, and any change in land use and/or fertilizer rate can increase or decrease N and P concentrations in runoff [25,75]. Total land use area under corn-soybean production was increased from 11.33 ha to 14.11 ha for CC-treatment watershed during the treatment period compared to the calibration period, where alfalfa was change to corn-soybean rotation in field 22 (Table 1). This change in land use during CC-treatment watershed might have contribute to the increased nutrient losses during the treatment period. Additionally, the average NPK rate for the calibration period was 130:30:150 and treatment period was 163:26:187, with an increase of 20% N and K and decrease of 24% P fertilizer application during the treatment period. Over application of N fertilizer to corn by 38 kg N ha−1 can increase NO3-N leaching by 30 to 50% [76]. Therefore, increased N fertilization rate along with the time of application and legacy P storage in the soil can be tied to increased N and P losses in surface waters observed in our study [74,75]. To date, no watershed scale studies are available that have investigated the use of legume cover crops and their influence on water quality. However, lysimeter studies are available that have reported increased NO3-N leaching by use of hairy vetch [77]. Nitrate-N leaching losses were 0.35 g N m2 for corn followed by cereal rye compared to 2.51 g N m2 for corn followed by hairy vetch [77]. Legume cover crops like hairy vetch have lower C:N ratio (16:1 or 22:1 as in our study) that might decompose at a faster rate [78]. This could result in release of available N from the cover crop biomass that is not synchronized with maximum N demand of the cash crop and result in runoff/leaching and might increase N loading to the headwater streams.
4. Conclusions and Implications
Cover crops do have the potential to reduce surface runoff and sediment loading to the streams when implemented at the watershed scale. However, surface water quality in terms of nutrients was not improved by using cover crops after two years. The lag time between the establishment of conservation practices and water quality response have been studied previously and is difficult to predict whether it will last from a few years to decades [14,75]. Cover crops are effective in scavenging residual fertilizer. However, their success in improving water quality will depend on the type of cover crop used (legume vs. non-legume), time of establishment in the fall, biomass accumulation during the spring, termination date, and most importantly how long they have been implemented. Cover crop decomposition after termination and their synchronization with maximum nutrient demand by cash crops needs to be explored for their adoption by the farmers. Additionally, nutrient management strategies such as time of fertilizer application and reduction in fertilizer rate according to cover crop biomass still need to be addressed. Results from this study demonstrate the importance of cover crops and their use at the watershed scale in reducing non-point source of pollution in headwater agricultural watersheds. Specific conclusions that can be drawn from this study include:
- Hairy vetch biomass can be increased by about 100% if termination date is delayed to May. Thick biomass cover of hairy vetch has the potential to reduce event mean discharge as well as peak discharge.
- Cover crops reduced peak discharge of the storm events with intensity <10 mm hr−1 by 51–55% for the CC-treatment watershed compared to control watershed.
- Total suspended solids and discharge were reduced by 33% and 34%, respectively in the CC-treatment watershed during the treatment period.
- Nitrate-N concentrations in runoff were highest during cash crop season whereas DRP and NH4-N concentration in surface runoff were highest after DAP fertilization.
- Percent change from the predicted values of EMCs of NO3-N and NH4-N in runoff waters were higher for hairy vetch compared to cereal rye. This indicates the potential of legume cover crops in increasing N loading to adjacent streams.
- Long-term research at the watershed scale is needed to draw strong conclusions for understanding the potential of cover crops for improving water quality at the watershed scale.
Acknowledgments
We thank personnel from Southern Illinois University Farms who provided assistance in managing the paired watersheds.
Funding
We are grateful to our funding sources, USDA McIntire-Stennis Cooperative Forestry Research Program, the Illinois Nutrient Research and Education Council, Monsanto, and Agronomy Science Foundation.
Author Contributions
Jon E. Schoonover and Karl W. J. Williard conceived and designed the experiments; Gurbir Singh performed the experiments and wrote the paper.
Conflicts of Interest
The authors declare no conflict of interest.
References
- Helmers, M.J.; Isenhart, T.M.; Kling, C.L.; Simpkins, W.W.; Moorman, T.B.; Tomer, M.D. Theme overview: Agriculture and water quality in the cornbelt: Overview of issues and approaches. Choices 2007, 22, 79–85. [Google Scholar]
- Clausen, J.; Jokela, W.; Potter, F.; Williams, J. Paired watershed comparison of tillage effects on runoff, sediment, and pesticide losses. J. Environ. Qual. 1996, 25, 1000–1007. [Google Scholar] [CrossRef]
- Johnson, S.R.; Burchell, M.R.; Evans, R.O.; Osmond, D.L.; Gilliam, J.W. Riparian buffer located in an upland landscape position does not enhance nitrate-nitrogen removal. Ecol. Eng. 2013, 52, 252–261. [Google Scholar] [CrossRef]
- Jokela, W.E.; Clausen, J.C.; Meals, D.W.; Sharpley, A.N. Effectiveness of agricultural best management practices in reducing phosphorous loading to Lake Champlain. In Lake Champlain: Partnerships and Research in the New Millennium; Manley, T., Ed.; Kluwer Academic/Plenum Publication: New York, NY, USA, 2004; pp. 39–52. [Google Scholar]
- Richards, R.P.; Baker, D.B. Trends in water quality in Leaseq Rivers and streams (northwestern Ohio), 1975–1995. J. Environ. Qual. 2002, 31, 90–96. [Google Scholar] [CrossRef] [PubMed]
- Smith, T.; Osmond, D.; Gilliam, J.W. Riparian buffer width and nitrate removal in a lagoon-effluent irrigated agricultural area. J. Environ. Qual. 2006, 61, 273–281. [Google Scholar]
- Tomer, M. A twice-paired watershed experimental design to assess stacked practices through field-edge monitoring. J. Soil Water Conserv. 2018, 73, 58–61. [Google Scholar] [CrossRef]
- Jacquemin, S.J.; Johnson, L.T.; Dirksen, T.A.; McGlinch, G. Changes in water quality of grand lake st. Marys watershed following implementation of a distressed watershed rules package. J. Environ. Qual. 2018, 47, 113–120. [Google Scholar] [CrossRef] [PubMed]
- Shipitalo, M.; Edwards, W. Runoff and erosion control with conservation tillage and reduced-input practices on cropped watersheds. Soil Tillage Res. 1998, 46, 1–12. [Google Scholar] [CrossRef]
- Udawatta, R.P.; Garrett, H.E.; Kallenbach, R. Agroforestry buffers for nonpoint source pollution reductions from agricultural watersheds. J. Environ. Qual. 2011, 40, 800–806. [Google Scholar] [CrossRef] [PubMed]
- Kladivko, E.; Kaspar, T.; Jaynes, D.; Malone, R.; Singer, J.; Morin, X.; Searchinger, T. Cover crops in the upper midwestern united states: Potential adoption and reduction of nitrate leaching in the Mississippi river basin. J. Environ. Qual. 2014, 69, 279–291. [Google Scholar] [CrossRef]
- Kuo, S.; Huang, B.; Bembenek, R. Effect of winter cover crops on soil nitrogen availability, corn yield, and nitrate leaching. Sci. World J. 2001, 1, 22–29. [Google Scholar] [CrossRef] [PubMed]
- Tonitto, C.; David, M.; Drinkwater, L. Replacing bare fallows with cover crops in fertilizer-intensive cropping systems: A meta-analysis of crop yield and n dynamics. Agric. Ecosyst. Environ. 2006, 112, 58–72. [Google Scholar] [CrossRef]
- Meals, D.W.; Dressing, S.A.; Davenport, T.E. Lag time in water quality response to best management practices: A review. J. Environ. Qual. 2010, 39, 85–96. [Google Scholar] [CrossRef] [PubMed]
- Dabney, S.M. Cover crop impacts on watershed hydrology. J. Soil Water Conserv. 1998, 53, 207–213. [Google Scholar]
- Goodman, J.; Collins, J.; Rapp, K. Nitrate and pesticide occurrence in shallow groundwater during the Oakwood Lakes-Poinsett RCWP project. In The National Rural Clean Water Program Symposium; Uniter States Environmental Protection Agency: Orlando, FL, USA, 1992; Volume EPA/625/R-92/006, pp. 33–45. [Google Scholar]
- Inamdar, S.; Mostaghimi, S.; McClellan, P.; Brannan, K.M. Bmp impacts on sediment and nutrient yields from an agricultural watershed in the coastal plain region. Trans. ASAE 2001, 44, 1191. [Google Scholar] [CrossRef]
- Meals, D.W. Watershed-scale response to agricultural diffuse pollution control programs in Vermont, USA. Water Sci. Technol. 1996, 33, 197–204. [Google Scholar]
- Osmond, D.; Meals, D.; Hoag, D.; Arabi, M.; Luloff, A.; Jennings, G.; McFarland, M.; Spooner, J.; Sharpley, A.; Line, D. Improving conservation practices programming to protect water quality in agricultural watersheds: Lessons learned from the national institute of food and agriculture–conservation effects assessment project. J. Soil Water Conserv. 2012, 67, 122A–127A. [Google Scholar] [CrossRef]
- Harmel, R.; Richardson, C.; King, K.; Allen, P. Runoff and soil loss relationships for the Texas blackland prairies ecoregion. J. Hydrol. 2006, 331, 471–483. [Google Scholar] [CrossRef]
- Karlen, D.L.; Dinnes, D.L.; Tomer, M.D.; Meek, D.W.; Cambardella, C.A.; Moorman, T.B. Is no-tillage enough? A field-scale watershed assessment of conservation effects. Electron. J. Integr. Biosci. 2009, 7, 1–24. [Google Scholar]
- Locke, M.; Knight, S.; Smith, S.; Cullum, R.; Zablotowicz, R.; Yuan, Y.; Bingner, R. Environmental quality research in the Beasley lake watershed, 1995 to 2007: Succession from conventional to conservation practices. J. Environ. Qual. 2008, 63, 430–442. [Google Scholar] [CrossRef]
- Tomer, M.; Moorman, T.; Kovar, J.; Cole, K.; Nichols, D. Eleven years of runoff and phosphorus losses from two fields with and without manure application, Iowa, USA. Agric. Water Manag. 2016, 168, 104–111. [Google Scholar] [CrossRef]
- Zhou, X.; Helmers, M.J.; Asbjornsen, H.; Kolka, R.; Tomer, M.D.; Cruse, R.M. Nutrient removal by prairie filter strips in agricultural landscapes. J. Soil Water Conserv. 2014, 69, 54–64. [Google Scholar] [CrossRef]
- Bishop, P.L.; Hively, W.D.; Stedinger, J.R.; Rafferty, M.R.; Lojpersberger, J.L.; Bloomfield, J.A. Multivariate analysis of paired watershed data to evaluate agricultural best management practice effects on stream water phosphorus. J. Environ. Qual. 2005, 34, 1087–1101. [Google Scholar] [CrossRef] [PubMed]
- Tiessen, K.; Elliott, J.; Yarotski, J.; Lobb, D.; Flaten, D.; Glozier, N. Conventional and conservation tillage: Influence on seasonal runoff, sediment, and nutrient losses in the Canadian prairies. J. Environ. Qual. 2010, 39, 964–980. [Google Scholar] [CrossRef] [PubMed]
- Veum, K.S.; Goyne, K.W.; Motavalli, P.P.; Udawatta, R.P. Runoff and dissolved organic carbon loss from a paired-watershed study of three adjacent agricultural watersheds. Agric. Ecosyst. Environ. 2009, 130, 115–122. [Google Scholar] [CrossRef]
- Clausen, J.C.; Spooner, J. Paired Watershed Study Design; Office of Wetlands, Oceans and Watersheds, Environmental Protection Agency: Washington, DC, USA, 1993. [Google Scholar]
- Fraser, N.E. A Paired Watershed Investigation of Clearcut BMPS Revisited; The University of Georgia: Athens, Georgia, 2006. [Google Scholar]
- Ssegane, H.; Amatya, D.; Muwamba, A.; Chescheir, G.; Appelboom, T.; Tollner, E.; Nettles, J.; Youssef, M.; Birgand, F.; Skaggs, R. Calibration of paired watersheds: Utility of moving sums in presence of externalities. Hydrol. Process. 2017. [Google Scholar] [CrossRef]
- Wilm, H.G. How long should experimental watersheds be calibrated? Am. Geophys. Union Trans. 1949, 30, 272–278. [Google Scholar] [CrossRef]
- Blanco-Canqui, H.; Shaver, T.M.; Lindquist, J.L.; Shapiro, C.A.; Elmore, R.W.; Francis, C.A.; Hergert, G.W. Cover crops and ecosystem services: Insights from studies in temperate soils. Agron. J. 2015, 107, 2449–2474. [Google Scholar] [CrossRef]
- Dabney, S.M.; Delgado, J.A.; Meisinger, J.J.; Schomberg, H.H.; Liebig, M.A.; Kaspar, T.; Mitchell, J.; Reeves, W. Using cover crops and cropping systems for nitrogen management. In Advances in Nitrogen Management for Water Quality; Delgado, J., Follett, R., Eds.; Soil and Water Conservation Society: Ankeny, IA, USA, 2010; pp. 231–282. [Google Scholar]
- Kaspar, T.; Jaynes, D.; Parkin, T.; Moorman, T.; Singer, J. Effectiveness of oat and rye cover crops in reducing nitrate losses in drainage water. Agric. Water Manag. 2012, 110, 25–33. [Google Scholar] [CrossRef]
- Singh, G.; Williard, K.W.; Schoonover, J.E. Spatial relation of apparent soil electrical conductivity with crop yields and soil properties at different topographic positions in a small agricultural watershed. Agronomy 2016, 6, 57. [Google Scholar] [CrossRef]
- Clausen, J.; Guillard, K.; Sigmund, C.; Dors, K.M. Water quality changes from riparian buffer restoration in connecticut. J. Environ. Qual. 2000, 29, 1751–1761. [Google Scholar] [CrossRef]
- Jokela, W.E.; Casler, M.D. Transport of phosphorus and nitrogen in surface runoff in a corn silage system: Paired watershed methodology and calibration period results. Can. J. Soil Sci. 2011, 91, 479–491. [Google Scholar] [CrossRef]
- Loftis, J.C.; MacDonald, L.H.; Streett, S.; Iyer, H.K.; Bunte, K. Detecting cumulative watershed effects: The statistical power of pairing. J. Hydrol. 2001, 251, 49–64. [Google Scholar] [CrossRef]
- Database, G. Illinois Geospatial Data Clearinghouse. Available online: https://clearinghouse.isgs.illinois.edu/ (accessed on 13 December 2017).
- Staff, S.S. Web Soil Survey. Available online: https://websoilsurvey.sc.egov.usda.gov (accessed on 11 January 2018).
- Wintr-55 Team. Wintr-55 Watershed Hydrology; Natural Resources Conservation Service: Washington, DC, USA, 2017. [Google Scholar]
- Eaton, A.; Clesceri, L.; Rice, E.; Greenberg, A.; Franson, M. Standard Methods for the Examination of Water and Wastewater; American Public Health Association, Federation Water Environmental: Washington, DC, USA, 2005. [Google Scholar]
- Alleman, J.; Jones, M.; Kamhawy, S.; Keefe, C. 4500-nh3 f. Phenate method. In Standard Methods for the Examination of Water and Wastewater; Eaton, A., Clesceri, L., Greenberg, A., Eds.; American Public Health Association (APHA): Rockville, MD, USA, 1995; Volume 20, pp. 480–481. [Google Scholar]
- Huber, W. Contaminant transport in surface water. In Handbook of Hydrology; Maidment, D., Ed.; McGraw-Hill Book Co. Inc.: New York, NY, USA, 1993; p. 14. [Google Scholar]
- Duiker, S.W.; Curran, W.S. Rye cover crop management for corn production in the northern Mid-Atlantic region. Agron. J. 2005, 97, 1413–1418. [Google Scholar] [CrossRef]
- Mirsky, S.; Curran, W.; Mortenseny, D.; Ryany, M.; Shumway, D. Timing of cover-crop management effects on weed suppression in no-till planted soybean using a roller-crimper. Weed Sci. 2011, 59, 380–389. [Google Scholar] [CrossRef]
- Mirsky, S.B.; Spargo, J.T.; Curran, W.S.; Reberg-Horton, S.C.; Ryan, M.R.; Schomberg, H.H.; Ackroyd, V.J. Characterizing cereal rye biomass and allometric relationships across a range of fall available nitrogen rates in the eastern united states. Agron. J. 2017, 109, 1520–1531. [Google Scholar] [CrossRef]
- Ruffo, M.L.; Bullock, D.G.; Bollero, G.A. Soybean yield as affected by biomass and nitrogen uptake of cereal rye in winter cover crop rotations. Agron. J. 2004, 96, 800–805. [Google Scholar] [CrossRef]
- Meisinger, J.; Ricigliano, K. Nitrate leaching from winter cereal cover crops using undisturbed soil-column lysimeters. J. Environ. Qual. 2017, 46, 576–584. [Google Scholar] [CrossRef] [PubMed]
- Teasdale, J.R.; Devine, T.E.; Mosjidis, J.A.; Bellinder, R.R.; Beste, C.E. Growth and development of hairy vetch cultivars in the northeastern united states as influenced by planting and harvesting date. Agron. J. 2004, 96, 1266–1271. [Google Scholar] [CrossRef]
- Kuo, S.; Sainju, U.; Jellum, E. Winter cover cropping influence on nitrogen in soil. Soil Sci. Soc. Am. J. 1997, 61, 1392–1399. [Google Scholar] [CrossRef]
- Kaspar, T.; Radke, J.; Laflen, J. Small grain cover crops and wheel traffic effects on infiltration, runoff, and erosion. J. Soil Water Conserv. 2001, 56, 160–164. [Google Scholar]
- McVay, K.; Radcliffe, D.; Hargrove, W. Winter legume effects on soil properties and nitrogen fertilizer requirements. Soil Sci. Soc. Am. J. 1989, 53, 1856–1862. [Google Scholar] [CrossRef]
- Sainju, U.M.; Singh, B.P.; Whitehead, W.F. Cover crop root distribution and its effects on soil nitrogen cycling. Agron. J. 1998, 90, 511–518. [Google Scholar] [CrossRef]
- Williams, S.M.; Weil, R.R. Crop cover root channels may alleviate soil compaction effects on soybean crop. Soil Sci. Soc. Am. J. 2004, 68, 1403–1409. [Google Scholar] [CrossRef]
- Villamil, M.; Bollero, G.; Darmody, R.; Simmons, F.; Bullock, D. No-till corn/soybean systems including winter cover crops. Soil Sci. Soc. Am. J. 2006, 70, 1936–1944. [Google Scholar] [CrossRef]
- Logsdon, S.; Kaspar, T.C.; Meek, D.W.; Prueger, J.H. Nitrate leaching as influenced by cover crops in large soil monoliths. Agron. J. 2002, 94, 807–814. [Google Scholar] [CrossRef]
- Zhu, J.; Gantzer, C.; Anderson, S.; Alberts, E.; Beuselinck, P. Runoff, soil, and dissolved nutrient losses from no-till soybean with winter cover crops. Soil Sci. Soc. Am. J. 1989, 53, 1210–1214. [Google Scholar] [CrossRef]
- Brill, G.; Neal, O. Seasonal occurrence of runoff and erosion from a sandy soil in vegetable production. Agron. J. 1950, 42, 192–195. [Google Scholar] [CrossRef]
- Grissinger, E. Reclamation of gullies and channel erosion. In Soil Erosion, Conservation, and Rehabilitation; Agassi, M., Ed.; Marcel Dekker: New York, NY, USA, 1996; pp. 301–313. [Google Scholar]
- Meyer, L.; Dabney, S.; Murphree, C.; Harmon, W.; Grissinger, E. Effects of Cropland Management Practices on Storm Runoff and Erosion. In Proceedings of the Conference on Management of Landscapes Distributed by Channel Incision, Oxford Campus, MS, USA, 19–23 May 1997; Wang, S., Langendoen, E., Shields, F., Eds.; The University of Mississippi: Oxford Campus, MS, USA; pp. 983–989. [Google Scholar]
- Angle, J.; Mc Clung, G.; Mc Intosh, M.; Thomas, P.; Wolf, D. Nutrient losses in runoff from conventional and no-till corn watersheds. J. Environ. Qual. 1984, 13, 431–435. [Google Scholar] [CrossRef]
- Klausner, S.; Zwerman, P.; Ellis, D. Surface runoff losses of soluble nitrogen and phosphorus under two systems of soil management. J. Environ. Qual. 1974, 3, 42–46. [Google Scholar] [CrossRef]
- Langdale, G.; Leonard, R.; Thomas, A. Conservation practice effects on phosphorus losses from southern piedmont watersheds. J. Soil Water Conserv. 1985, 40, 157–161. [Google Scholar]
- Pesant, A.; Dionne, J.; Genest, J. Soil and nutrient losses in surface runoff from conventional and no-till corn systems. Can. J. Soil Sci. 1987, 67, 835–843. [Google Scholar] [CrossRef]
- Sharpley, A.; Smith, S. Effects of Cover Crops on Surface Water Quality. In Proceedings of the Cover Crops for Clean Water, Ankeny, IA, USA, 9–11 April 1991; Hargrove, W., Ed.; Soil and Water Conservation Society: Ankeny, IA, USA; pp. 41–49. [Google Scholar]
- Yoo, K.; Touchton, J.; Walker, R. Runoff, sediment and nutrient losses from various tillage systems of cotton. Soil Tillage Res. 1988, 12, 13–24. [Google Scholar] [CrossRef]
- Zhu, Y.; Fox, R. Corn–soybean rotation effects on nitrate leaching. Agron. J. 2003, 95, 1028–1033. [Google Scholar] [CrossRef]
- Angle, J.S. Nitrate leaching losses from soybeans (Glycine max L. Merr.). Agric. Ecosyst. Environ. 1990, 31, 91–97. [Google Scholar] [CrossRef]
- Brandi-Dohrn, F.M.; Hess, M.; Selker, J.S.; Dick, R.P.; Kauffman, S.M.; Hemphill, D.D. Nitrate leaching under a cereal rye cover crop. J. Environ. Qual. 1997, 26, 181–188. [Google Scholar] [CrossRef]
- Sharpley, A. Depth of surface soil-runoff interaction as affected by rainfall, soil slope, and management. Soil Sci. Soc. Am. J. 1985, 49, 1010–1015. [Google Scholar] [CrossRef]
- Sharpley, A.N.; Chapra, S.; Wedepohl, R.; Sims, J.; Daniel, T.C.; Reddy, K. Managing agricultural phosphorus for protection of surface waters: Issues and options. J. Environ. Qual. 1994, 23, 437–451. [Google Scholar] [CrossRef]
- Sharpley, A.; Menzel, R.; Smith, S.; Rhoades, E.; Olness, A. The sorption of soluble phosphorus by soil material during transport in runoff from cropped and grassed watersheds. J. Environ. Qual. 1981, 10, 211–215. [Google Scholar] [CrossRef]
- Sharpley, A.; Jarvie, H.P.; Buda, A.; May, L.; Spears, B.; Kleinman, P. Phosphorus legacy: Overcoming the effects of past management practices to mitigate future water quality impairment. J. Environ. Qual. 2013, 42, 1308–1326. [Google Scholar] [CrossRef] [PubMed]
- Owens, L.; Shipitalo, M.; Bonta, J. Water quality response times to pasture management changes in small and large watersheds. J. Environ. Qual. 2008, 63, 292–299. [Google Scholar] [CrossRef]
- Sogbedji, J.M.; van Es, H.M.; Yang, C.L.; Geohring, L.D.; Magdoff, F.R. Nitrate leaching and nitrogen budget as affected by maize nitrogen rate and soil type. J. Environ. Qual. 2000, 29, 1813–1820. [Google Scholar] [CrossRef]
- McCracken, D.V.; Smith, M.S.; Grove, J.H.; Blevins, R.L.; MacKown, C.T. Nitrate leaching as influenced by cover cropping and nitrogen source. Soil Sci. Soc. Am. J. 1994, 58, 1476–1483. [Google Scholar] [CrossRef]
- Sievers, T.; Cook, R.L. Aboveground and root decomposition of cereal rye and hairy vetch cover crops. Soil Sci. Soc. Am. J. 2018, 82, 147–155. [Google Scholar] [CrossRef]
Figure 1.
Paired watershed research site at Southern Illinois University’s research farms in Carbondale, IL, USA. The control watershed has an area of 27 ha and contains field numbers: 17, 18, 19, 25, 26, and 27. The cover crop treatment (CC-treatment) watershed has an area of 42 ha and contains field numbers: 2, 3, 21, 22, 24 and 25.

Figure 2.
Mean monthly precipitation received at the paired watershed site during calibration (a) and treatment (b) periods.
Figure 2.
Mean monthly precipitation received at the paired watershed site during calibration (a) and treatment (b) periods.

Figure 3.
Hairy vetch height at the time of termination on 12 May 2017.

Figure 4.
Event mean discharge of 48 storm events collected during the calibration period and 18 storm events collected during the treatment period from the CC-treatment and control watersheds.
Figure 4.
Event mean discharge of 48 storm events collected during the calibration period and 18 storm events collected during the treatment period from the CC-treatment and control watersheds.

Figure 5.
Storm water discharge measured from paired watersheds representing storm events received during cover crop season in 2016 and 2017 with rainfall intensity lower than 10 mm hr−1 (a,b) and greater than 10 mm hr−1 (c,d). Blue bars represent rainfall intensity (mm hr−1).
Figure 5.
Storm water discharge measured from paired watersheds representing storm events received during cover crop season in 2016 and 2017 with rainfall intensity lower than 10 mm hr−1 (a,b) and greater than 10 mm hr−1 (c,d). Blue bars represent rainfall intensity (mm hr−1).


Figure 6.
Observed minus predicted discharge, total suspended solids (TSS), NO3-N, NH4-N, and dissolved reactive phosphorus (DRP) from the CC-treatment watershed.
Figure 6.
Observed minus predicted discharge, total suspended solids (TSS), NO3-N, NH4-N, and dissolved reactive phosphorus (DRP) from the CC-treatment watershed.


Table 1.
Total area in each watershed under corn, soybean, wheat and alfalfa during calibration and treatment periods.
Table 1.
Total area in each watershed under corn, soybean, wheat and alfalfa during calibration and treatment periods.
| Period | Year | Watershed | Area (ha) | |||
|---|---|---|---|---|---|---|
| Corn | Soybean | Wheat | Alfalfa | |||
| Calibration | 2008 | Control | 4.20 | 13.73 | 7.87 | - |
| CC-treatment | 0.27 | 11.33 | 5.24 | 5.61 | ||
| 2009 | Control | 12.37 | 5.89 | - | - | |
| CC-treatment | 11.33 | 0.27 | - | 5.61 | ||
| 2010 | Control | 4.20 | 14.05 | - | - | |
| CC-treatment | 0.27 | 11.33 | - | 5.61 | ||
| 2011 | Control | 14.05 | 4.20 | - | - | |
| CC-treatment | 11.33 | 0.27 | - | 5.61 | ||
| Treatment | 2015 | Control | 14.05 | 4.20 | - | - |
| CC-treatment | 14.11 | - | - | 3.09 | ||
| 2016 | Control | - | 18.26 | - | - | |
| CC-treatment | - | 14.11 | - | 3.09 | ||
Table 2.
Fertilizer application rates for individual fields during calibration and treatment periods. Average NPK rate kg ha−1 for the calibration period was 130:30:150 and treatment period was 163:26:187, respectively.
Table 2.
Fertilizer application rates for individual fields during calibration and treatment periods. Average NPK rate kg ha−1 for the calibration period was 130:30:150 and treatment period was 163:26:187, respectively.
| Calibration Period | |||||||||||||||||
| Watershed | Field No. | 2008 | 2009 | 2010 | 2011 | ||||||||||||
| Crop | N | P | K | Crop | N | P | K | Crop | N | P | K | Crop | N | P | K | ||
| kg ha−1 | kg ha−1 | kg ha−1 | kg ha−1 | ||||||||||||||
| Control | 17 | Corn | 198 | 34 | 139 | Soybean | - | - | 140 | Corn | 226 | 34 | 139 | Soybean | - | - | 139 |
| 18 | Soybean | - | - | 111 | Corn | 238 | 34 | 363 | Soybean | 30 | 34 | 111 | Corn | 179 | - | 168 | |
| 19 | Soybean | - | - | 111 | Soybean | 59 | 34 | 84 | Soybean | 30 | 34 | 111 | Corn | 179 | - | 150 | |
| 25 | Wheat/soybean | 59 | 34 | 84 | Corn | 209 | 34 | 112 | Soybean | 30 | 23 | 111 | Corn | 217 | 41 | 174 | |
| 26 | Soybean | - | - | 111 | Corn | 209 | 34 | 112 | Soybean | 30 | 23 | 111 | Corn | 209 | 34 | 84 | |
| 27 | Reed canary grass | 22 | 25 | - | Corn | 209 | 34 | 279 | Soybean | 30 | 23 | 111 | Corn | 209 | 34 | 181 | |
| CC-treatment | 2 | Corn | 198 | 34 | 139 | Soybean | - | - | 139 | Corn | 219 | 45 | 140 | Soybean | - | - | 181 |
| 3 | Soybean | - | - | 139 | Corn | 209 | 34 | 112 | Soybean | 30 | 34 | 140 | Corn | 222 | 48 | 139 | |
| 21 | Soybean | - | - | 111 | Corn | 209 | 34 | 112 | Soybean | 30 | 34 | 111 | Corn | 221 | 47 | 181 | |
| 22 | Alfalfa | - | - | 223 | Alfalfa | - | - | 223 | Alfalfa | 30 | 23 | 167 | Alfalfa | 30 | 23 | 167 | |
| 24 | Alfalfa | - | - | 223 | Alfalfa | - | - | 223 | Alfalfa | 30 | 23 | 167 | Alfalfa | 30 | 23 | 167 | |
| 25 | Wheat/Soybean | 59 | 34 | 84 | Corn | 209 | 34 | 112 | Soybean | 30 | 23 | 111 | Corn | 217 | 41 | 174 | |
| Treatment Period | |||||||||||||||||
| Watershed | Field No. | 2015 | 2016 | ||||||||||||||
| Crop | N | P | K | Crop | N | P | K | ||||||||||
| kg ha−1 | kg ha−1 | ||||||||||||||||
| Control | 17 | Soybean | 30 | 34 | 84 | Soybean | - | - | 156 | ||||||||
| 18 | Corn | 224 | - | - | Soybean | - | - | 234 | |||||||||
| 19 | Corn | 205 | - | 138 | Soybean | - | - | 198 | |||||||||
| 25 | Corn | 222 | 17 | 56 | Soybean | 20 | 23 | 284 | |||||||||
| 26 | Corn | 236 | 23 | 87 | Soybean | - | - | 200 | |||||||||
| 27 | Corn | 213 | 12 | 110 | Soybean | - | - | 344 | |||||||||
| CC-treatment | 2 | Corn | 247 | 45 | 112 | Soybean | - | - | 196 | ||||||||
| 3 | Corn | 179 | 34 | 56 | Soybean | 20 | 23 | - | |||||||||
| 21 | Corn | 237 | 34 | 84 | Soybean | - | - | 257 | |||||||||
| 22 | Corn | 233 | 23 | 57 | Soybean | - | - | 321 | |||||||||
| 24 | Alfalfa | 17 | 19 | 307 | Alfalfa | - | - | 463 | |||||||||
| 25 | Corn | 222 | 17 | 56 | Soybean | 20 | 23 | 284 | |||||||||
Table 3.
Equations used to calculate Event Mean Concentrations (EMCs) established from runoff events collected during the calibration period.
Table 3.
Equations used to calculate Event Mean Concentrations (EMCs) established from runoff events collected during the calibration period.
| Variables | Regression Equation | R-Square | p Value | n1 |
|---|---|---|---|---|
| TSS | ln(y) = 0.35987 ln(x) + −0.31379 | 0.20 | 0.0035 | 41 |
| NO3−-N | ln(y) = 0.50601 ln(x) + −0.36186 | 0.56 | <0.0001 | 42 |
| NH4+-N | √(y) = 0.49256 √(x) + 0.24204 | 0.40 | <0.01 | 42 |
| DRP | ln(y) = 0.70461 ln(x) + −0.70381 | 0.61 | <0.01 | 42 |
| Discharge (Q) | √(y) = 1.23883 √(x) + 303.930 | 0.70 | <0.01 | 42 |
1 Total storm events collected during the calibration period.
Table 4.
Equations used to calculate Event Mean Concentrations (EMCs) established from 28 storm events collected from November to May during the calibration period.
Table 4.
Equations used to calculate Event Mean Concentrations (EMCs) established from 28 storm events collected from November to May during the calibration period.
| Variables | Regression Equation | R-Square | p Value | n1 |
|---|---|---|---|---|
| TSS | ln(y) = 0.50993 ln(x) + −0.03484 | 0.41 | 0.0002 | 28 |
| NO3−-N | ln(y) = 0.50832 ln(x) + −0.26908 | 0.58 | <0.0001 | 28 |
| NH4+-N | √(y) = 0.51489 √(x) + 0.22421 | 0.41 | 0.0003 | 28 |
| DRP | ln(y) = 0.65071 ln(x) + −0.83798 | 0.62 | <0.0001 | 28 |
| Discharge (Q) | √(y) = 1.38243 √(x) + −349.77794 | 0.64 | <0.0001 | 28 |
1 Total storm events collected during the calibration period.
Table 5.
Mean biomass production, C:N ratio and N-uptake of weeds in the control watershed and cover crop plus weeds in the CC-treatment watershed in spring of 2016 and 2017. The same letter within a column indicates no significant difference for a given factor or combination of factors (α = 0.05).
Table 5.
Mean biomass production, C:N ratio and N-uptake of weeds in the control watershed and cover crop plus weeds in the CC-treatment watershed in spring of 2016 and 2017. The same letter within a column indicates no significant difference for a given factor or combination of factors (α = 0.05).
| Cereal Rye + Weeds | Hairy Vetch + Weeds | Hairy Vetch + Weeds | |||||||
|---|---|---|---|---|---|---|---|---|---|
| (April 2016) | (April 2017) | (May 2017) | |||||||
| Biomass | N-Uptake | C:N Ratio | Biomass | N-Uptake | C:N Ratio | Biomass | N-Uptake | C:N Ratio | |
| kg ha−1 | kg ha−1 | kg ha−1 | |||||||
| Control | 1386.95 | 17.74 | 26.59b | 1672.36 | 14.67b | 24.91a | 1193.97b | 13.76b | 26.48a |
| CC-treatment | 1322.12 | 19.19 | 29.97a | 1831.25 | 43.14a | 16.25b | 4182.84a | 94.03a | 22.27b |
Table 6.
Event mean concentrations representing 42 storm events collected during the calibration period and 18 during the treatment period. Predicted values are calculated from the equations in Table 3.
Table 6.
Event mean concentrations representing 42 storm events collected during the calibration period and 18 during the treatment period. Predicted values are calculated from the equations in Table 3.
| Period | Watershed | TSS (g L−1) | NO3−-N (mg L−1) | NH4+-N (mg L−1) | DRP (mg L−1) | Storm Q 1 (m3) | Storm Q 2 (m3 ha−1) |
|---|---|---|---|---|---|---|---|
| Calibration | |||||||
| Control | 0.322 | 0.606 | 0.352 | 1.721 | 9149 | 339 | |
| CC-treatment | 0.564 | 0.738 | 0.293 | 0.743 | 16911 | 403 | |
| Treatment | |||||||
| Control | 0.121 | 0.327 | 0.069 | 0.488 | 9717 | 360 | |
| CC-treatment | 0.215 | 0.563 | 0.179 | 0.463 | 10203 | 243 | |
| Predicted | 0.319 | 0.276 | 0.133 | 0.289 | 17201 | 370 | |
| Percent change from predicted values to CC-treatment | −32.67 | 104.11 | 34.56 | 60.07 | −40.68 | −34.28 | |
1 Event mean discharge (m3) = Q (m3 s−1) × Time of storm event (s); 2 Event mean discharge (m3 ha−1) = Event mean discharge (m3)/watershed area; 27 ha for control watershed and 42 ha for CC-treatment watershed.
Table 7.
Event mean concentrations representing 28 storm events collected during the calibration period from November to May and 7 during the CC-treatment period (Cereal Rye). Predicted values are calculated from the equations in Table 4.
Table 7.
Event mean concentrations representing 28 storm events collected during the calibration period from November to May and 7 during the CC-treatment period (Cereal Rye). Predicted values are calculated from the equations in Table 4.
| Period | Watershed | TSS (g L−1) | NO3−-N (mg L−1) | NH4+-N (mg L−1) | DRP (mg L−1) | Storm Q 1 (m3) | Storm Q 2 (m3 ha−1) |
|---|---|---|---|---|---|---|---|
| Calibration | Control | 0.392 | 0.744 | 0.313 | 1.701 | 9686 | 359 |
| CC-treatment | 0.652 | 0.932 | 0.270 | 0.610 | 16377 | 390 | |
| Treatment | Control | 0.105 | 0.134 | 0.090 | 0.590 | 8571 | 317 |
| CC-treatment | 0.189 | 0.336 | 0.164 | 0.658 | 6862 | 163 | |
| Predicted | 0.293 | 0.234 | 0.141 | 0.299 | 13708 | 295 | |
| Percent change from predicted values to CC-treatment | −35.35 | 43.56 | 16.99 | 119.67 | −49.95 | −44.55 | |
1 Event mean discharge (m3) = Q (m3 s−1) × Time of storm event (s); 2 Event mean discharge (m3 ha−1) = Event mean discharge (m3)/watershed area; 27 ha for control and 42 ha for CC-treatment watershed.
Table 8.
Event mean concentrations representing 28 storm events collected during the calibration period from November to May and 8 during the CC-treatment period (Hairy vetch). Predicted values are calculated from the equations in table 4.
Table 8.
Event mean concentrations representing 28 storm events collected during the calibration period from November to May and 8 during the CC-treatment period (Hairy vetch). Predicted values are calculated from the equations in table 4.
| Period | Watershed | TSS (g L−1) | NO3−-N (mg L−1) | NH4+-N (mg L−1) | DRP (mg L−1) | Storm Q 1 (m3) | Storm Q 2 (m3 ha−1) |
|---|---|---|---|---|---|---|---|
| Calibration | Control | 0.392 | 0.744 | 0.313 | 1.701 | 9686 | 359 |
| CC-treatment | 0.652 | 0.932 | 0.270 | 0.610 | 16377 | 390 | |
| Treatment | Control | 0.145 | 0.084 | 0.035 | 0.351 | 11757 | 435 |
| CC-treatment | 0.247 | 0.314 | 0.157 | 0.270 | 15757 | 375 | |
| Predicted | 0.322 | 0.180 | 0.100 | 0.209 | 19631 | 422 | |
| Percent change from predicted values to CC-treatment | −23.03 | 74.45 | 57.03 | 28.97 | −19.74 | −11.08 | |
1 Event mean discharge (m3) = Q (m3 s−1) × Time of storm event (s); 2 Event mean discharge (m3 ha−1) = Event mean discharge (m3)/watershed area; 27 ha for control and 42 ha for CC-treatment watershed.
© 2018 by the authors. Licensee MDPI, Basel, Switzerland. This article is an open access article distributed under the terms and conditions of the Creative Commons Attribution (CC BY) license (http://creativecommons.org/licenses/by/4.0/).
Share and Cite
MDPI and ACS Style
Singh, G.; Schoonover, J.E.; Williard, K.W.J. Cover Crops for Managing Stream Water Quantity and Improving Stream Water Quality of Non-Tile Drained Paired Watersheds. Water 2018, 10, 521. https://doi.org/10.3390/w10040521
AMA Style
Singh G, Schoonover JE, Williard KWJ. Cover Crops for Managing Stream Water Quantity and Improving Stream Water Quality of Non-Tile Drained Paired Watersheds. Water. 2018; 10(4):521. https://doi.org/10.3390/w10040521
Chicago/Turabian StyleSingh, Gurbir, Jon E. Schoonover, and Karl W. J. Williard. 2018. "Cover Crops for Managing Stream Water Quantity and Improving Stream Water Quality of Non-Tile Drained Paired Watersheds" Water 10, no. 4: 521. https://doi.org/10.3390/w10040521
Note that from the first issue of 2016, this journal uses article numbers instead of page numbers. See further details here.