Assessment of a Field Tidal Flow Constructed Wetland in Treatment of Swine Wastewater: Life Cycle Approach


1
School of Civil Engineering, Chang’an University, Xian 710061, China
2
UCD Dooge Centre for Water Resources Research, School of Civil Engineering, University College Dublin, Newstead, Belfield, Dublin D04 K3H4, Ireland
3
Key Laboratory of Subsurface Hydrology and Ecology in Arid Areas (Ministry of Education), School of Environmental Science and Engineering, Chang’an University, Xian 710054, China
*
Author to whom correspondence should be addressed.
Water 2018, 10(5), 573; https://doi.org/10.3390/w10050573
Submission received: 7 April 2018
/
Revised: 24 April 2018
/
Accepted: 26 April 2018
/
Published: 28 April 2018
(This article belongs to the Special Issue Wetlands for the Treatment of Agricultural Drainage Water)
Abstract
:The spreading of livestock wastewater onto the grassland poses the inevitable risk of pollutants into the surface water or ground water, causing adverse environmental problems. Although the constructed wetlands (CWs) represent a cost-effective treatment system, they fail to achieve satisfactory total nitrogen (TN) removal performance. Dewatered alum sludge (DAS) based CW with tidal flow operation strategy is set up to intensify the TN removal efficiency by creating alternating aerobic and anoxic conditions, which relies on the water pumps instead of air pumps. In the present study, the environmental performance of a four-stage field tidal flow CW system treating swine wastewater was evaluated based on the life cycle assessment (LCA). The contribution of each process in LCA was clarified and compared whereby the potential improvement was indicated for further application. The results showed that the electricity almost dominated all the environmental impact categories while the water pumps (used for creating tidal flow) were the dominant electricity consumer. Moreover, the mitigation effect of vegetation by uptaking CO2 was relatively marginal. Overall, compared with conventional CWs, the tidal flow CW brought about more adverse impact to the environment although the tidal flow could achieve better treatment efficiency.
1. Introduction
The agri-food sector is one of Ireland’s most important indigenous manufacturing sectors, accounting for the employment of approximately 167,500 people [1]. In 2015, the agri-food sector in Ireland generated 5.7% of gross value and 9.8% of Ireland’s merchandise exports [1]. Behind the economic prosperity, there is a large amount of livestock wastewater generation in Ireland. Although the exact wastewater data are not available, the adverse effect of such a large amount of wastewater production and inappropriate management has emerged and attracted attention. In Ireland, it is common in practice to spread livestock wastewater on nearby grassland after anaerobic stabilization [2]. Indeed, it is a convenient option for the wastewater while the nutrients in the wastewater can help grass growth. However, there are also some harmful components, such as antibiotics and heavy metals etc. Moreover, the leakage and diffusion of these substances into the surface water or groundwater could cause severe pollution. As such, Ireland is labelled as one of the nitrate vulnerable zones by the EU (European Union) [3].
Thus, it is highly desirable to develop a sustainable approach to manage the livestock farming wastewater. Indeed, constructed wetlands (CWs) have been recognized as a popular and low-cost technology to treat livestock farming wastewater [4]. Moreover, the application and installment of CWs are highly flexible, catering to various locations and scales, compared with other treatment technologies. However, regarding the high strength livestock wastewater, conventional CWs, including surface flow CWs and subsurface flow CWs or even the hybrid system of vertical- and horizontal-flow combination, cannot achieve satisfying treatment efficiency especially for TN and total phosphorus(TP). Therefore, in recent years, dewatered alum sludge (DAS) was intensively tested as the main wetland substrate for effective phosphorus (P) removal/immobilization, while “tidal flow” operation strategy was developed and had been demonstrated to be a good input in improving the air supply and thus bringing about a better nitrogen (N) removal [5,6].
Alum sludge refers to the drinking water treatment residual when aluminum sulphate was dosed to flocculate the raw water. The use of DAS cakes as substrate in CWs lies in the Al3+ in the sludge to adsorb P in wastewater since Al3+ and P have strong adsorption affinity from chemistry point of view. Therefore, the alum sludge-based CWs were developed [5]. “Tidal flow” CWs are a variant of passive CWs owning improved treatment performance and capacity [6]. They are operated in accordance with sequencing batch philosophy with a cycle consisting of fill, contact, drain, and rest period sequentially whereby a tide is generated in the bed matrix. In such a tide regime, the redox status in the bed matrix varies with the saturated/unsaturated conditions corresponding to the contact/rest periods. Herein, the nitrification and denitrification can be promoted in a tide cycle, respectively. As such, tidal flow CW seems an alternative to the aeration-intensified CWs to treat livestock farming wastewater. It has been well demonstrated that alum sludge-based tidal flow CWs enable the system to treat the high strength wastewater [6]. It is noted that, in the tidal flow operation, the electricity fueling the air pumps can be avoided. However, the tides in the tidal CWs rely on water pumps to create aerobic and anoxic conditions. Compared with the intensified CWs by air pumps, the electricity consumption transferred to the water pumps. It is fair to say that attention has been paid to the treatment efficiency, while less attention was placed on the entire environment impact of the tidal flow CW system when more pumps were used to create the “tides”. Clearly, regarding the novel alum sludge-based tidal flow CWs, there is a “gap” between good treatment efficiency and the overall environmental impact in the literature. The quantification and verification on the environmental performance of the tidal flow CWs is desirable. This forms the basis of the current study.
Life cycle assessment (LCA) is a standardized and sophisticated tool to “compile and evaluate the inputs, outputs and the potential environmental impacts of a product system through its life cycle” [7]. As adopted in the field of wastewater treatment, LCA allows assessing the environmental sustainability over its complete life cycle. Since LCA was applied in wastewater treatment plants (WWTPs) as early as in 1990s, it has been widely applied in research or practical projects of WWTPs. The key step of LCA is to collect the input and output inventory of the target object in as much detailed as possible. The exact procedure of LCA in WWTPs can refer to several comprehensive reviews [7,8,9].
To address the environment-related issues of the tidal flow CWs in treating swine wastewater, this paper presents a LCA study aimed at looking into the environmental performance of a field work in an Irish farm. All the related processes and materials were classified and evaluated. This LCA was performed through the analysis of seven environmental categories, pinpointing the process contributing the most, and assessing the sensitivity to the background processes. According to the best knowledge of the authors, this study is the first study to explore the insight into the environmental performance of tidal flow CWs.
2. Materials and Methods
2.1. Target Process
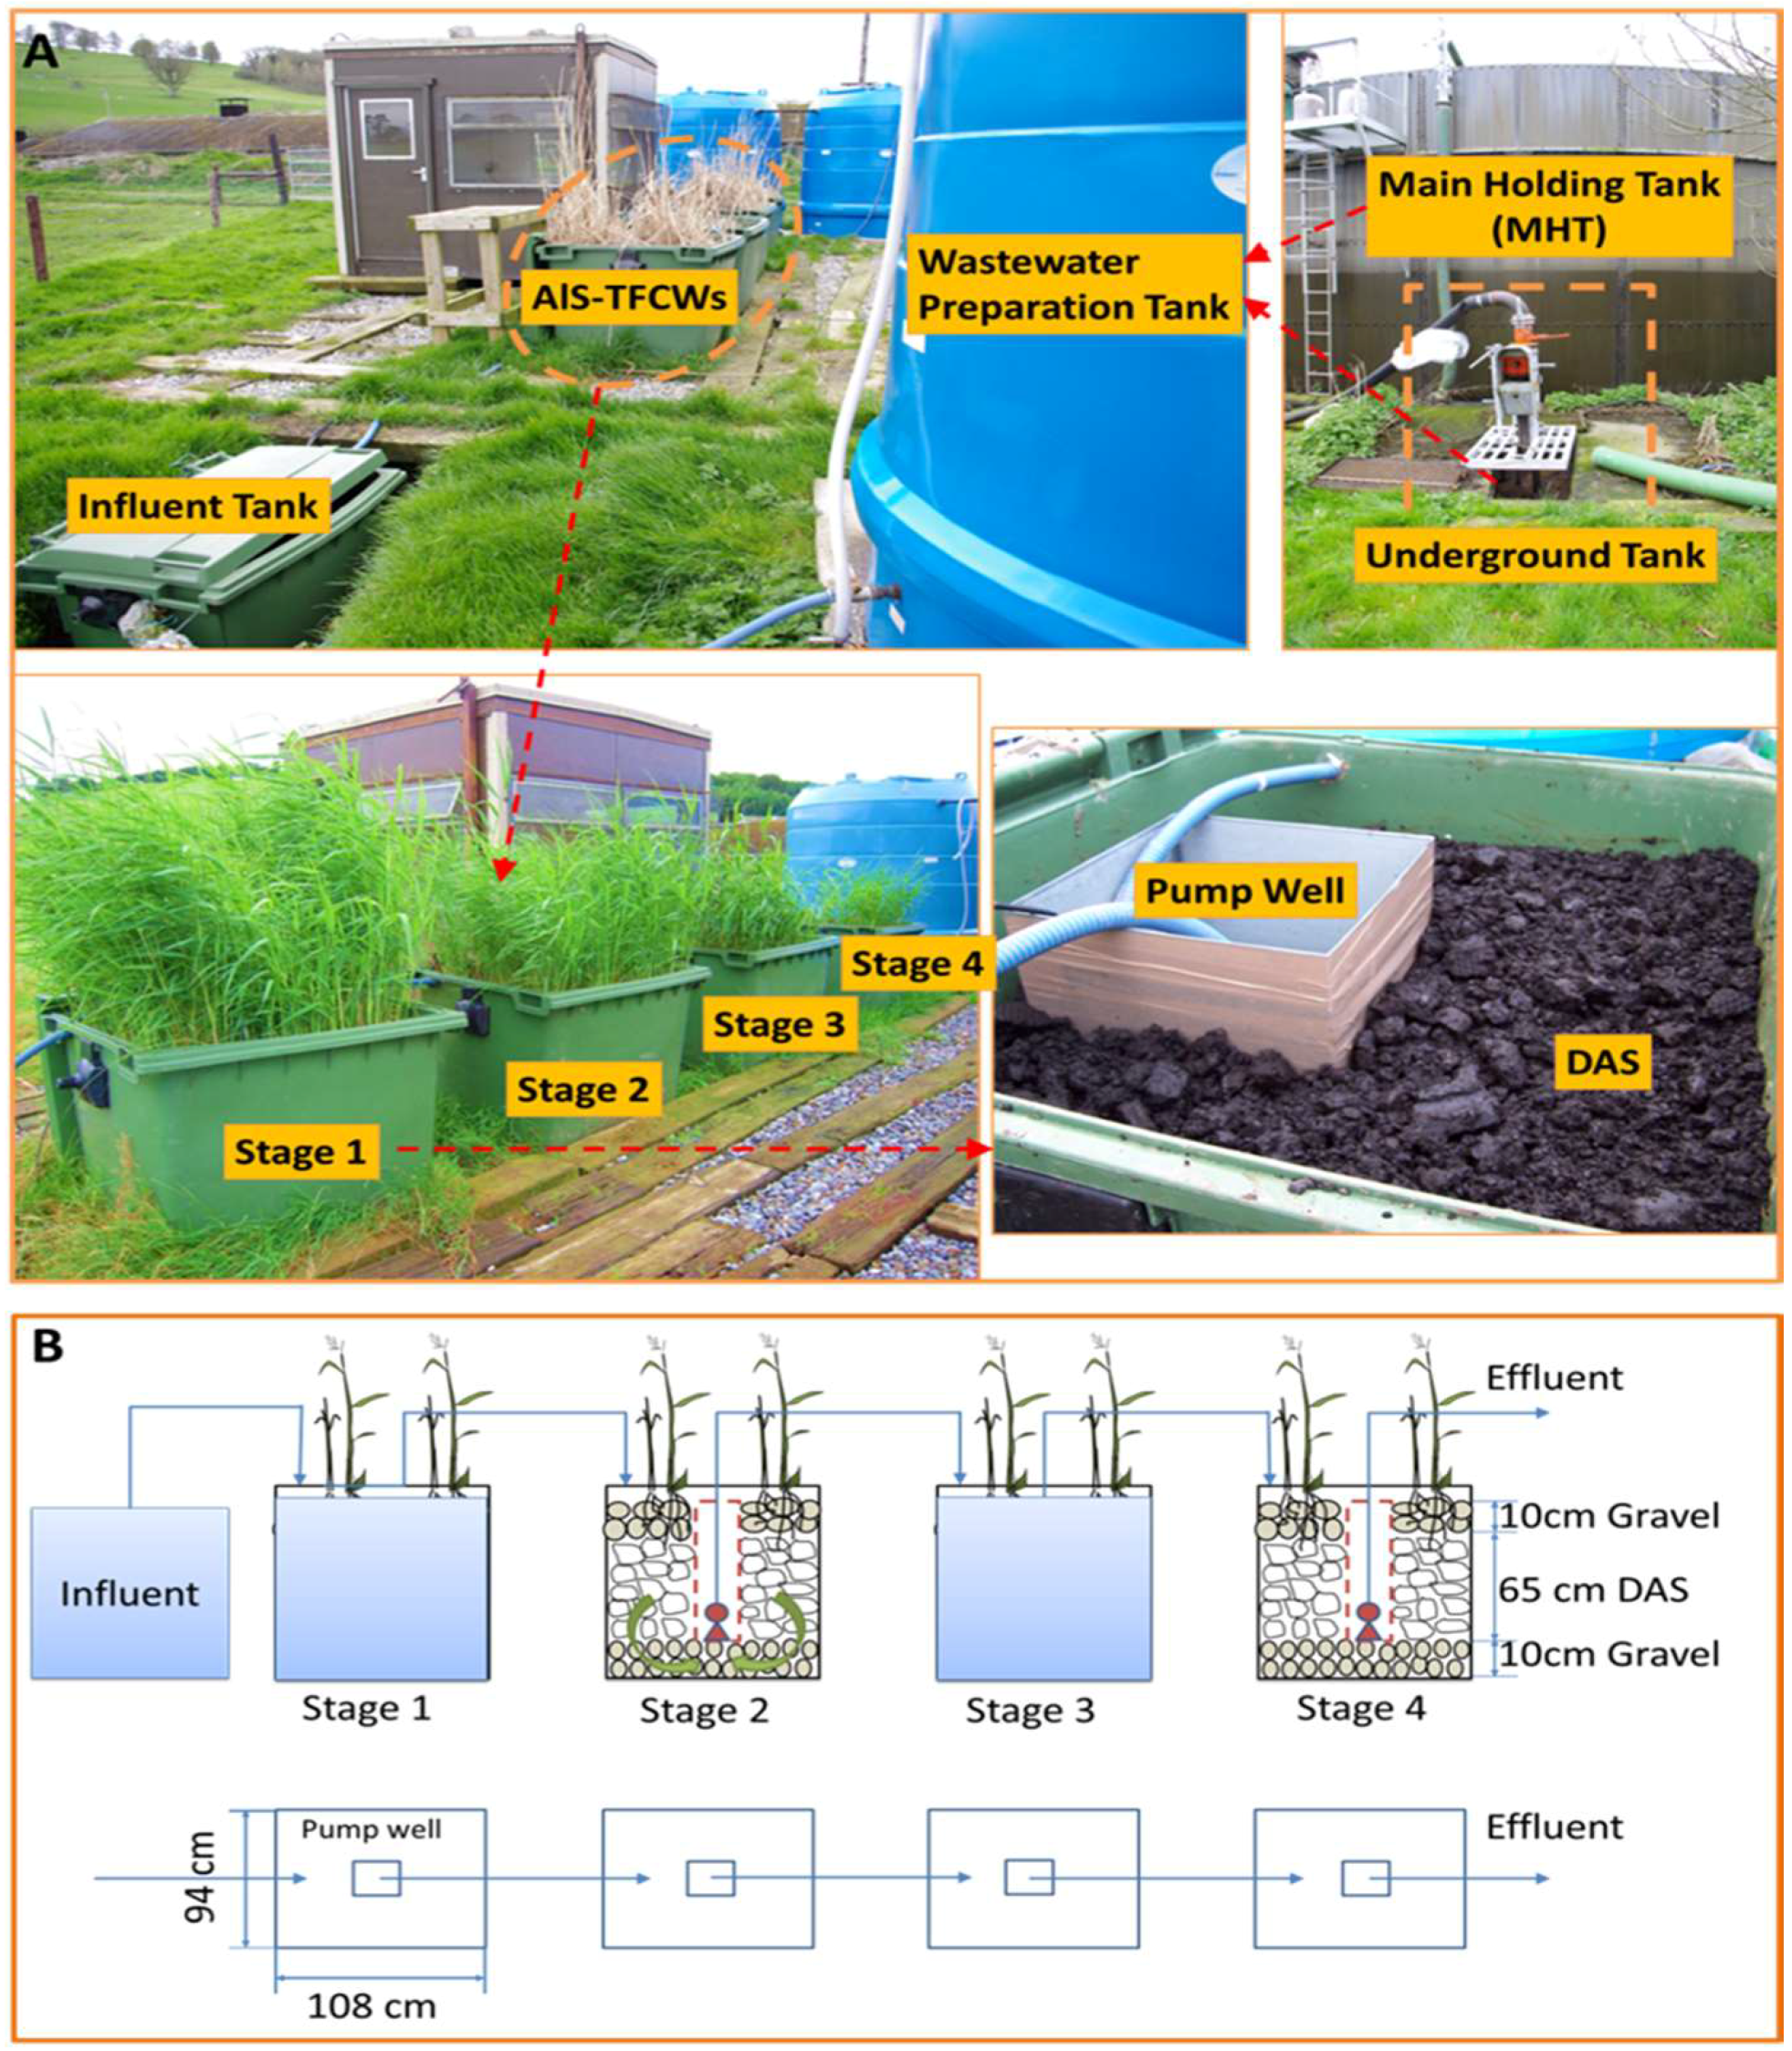
The pilot-scale field CW consisted of four identical reed beds (Figure 1) [10]. Each identical bed/stage of the CWs was constructed using a 1100 L plastic bin (108 cm × 94 cm × 105 cm), while the four stages were connected with submersible pumps placed inside a well (40 cm × 40 cm × 100 cm) set within each bin. Each well also served as the sampling port. Each bin was filled with 10 mm gravel at the bottom up to a depth of 10 cm, covered with 65 cm of DAS cakes as the ‘medium’ layer, and then 10 cm of 20 mm gravel to serve as the distribution layer. The DAS cakes were collected fresh from a drinking water treatment plant in Southwest Dublin. Common reeds, phragmites australis, were planted on top of each stage at the commencement of the experimental trials. The good growth with lush vegetation was observed after 2 months. The characteristics of the swine wastewater and the performance of this tidal flow CW are summarized in Table 1.
2.2. Goal and Scope Definition
The targeted product in the present study is a field pilot-scale tidal flow CW established for purifying swine wastewater in a livestock farm. The initial function of the tidal flow CW was to remove pollutants from the influent swine wastewater by the production of purified effluent. Thus, the Functional Unit (FU) of the present assessment is defined in quantitative terms as the production of 1 m3 of purified wastewater [11]. As the swine wastewater collecting system in the farm had already existed, it was not included in the present LCA. In addition, the construction and demolition phases under the present LCA were excluded.
2.3. Life Cycle Inventory
2.3.1. Input
According to the field work, the main materials and energy input for the construction and operation of the tidal flow CWs include containers, pumps, gravels, DAS, transportation, and electricity. The field tidal flow CW was a newly established system in the farm and five HDPE (high-density polyethylene) plastic bins including four stages and influent tank were used to form the CW system to keep the operation and upgrading flexible. A life time of 10 years was assumed for the replacement of the plastic containers. Each HDPE container was 1100 L in volume and 40 kg in weight. As such, the HDPE needed for manufacturing the containers in terms of one FU could be normalized against the wastewater volume treated in the 10 years (Table 2). Compared with conventional passive CWs, the tidal flow CWs rely on pumps to create the tides. As such, 5 submersible pumps were installed in the system. The rated flow and power are 1800 L/h and 1100 W, respectively. It is hypothesized that they should be renewed every 5 years. Then, the number of pumps per FU can be calculated (Table 2). In terms of the electricity consumption, it mainly came from the pumps. In each cycle, each submersible pump worked for 0.1 h based on the working volume of each unit. Thus, the total electricity input could be calculated. The amounts of gravel and DAS in the systems were listed in Table 1. For DAS, it should be considered to replace to promise the P removal performance when the DAS become fully saturated [12]. To evaluate the worst scenario of the field tidal flow CW, the gravel was assumed to be replaced as well along with the DAS.
For the background processes including the electricity generation, containers/pumps manufacturing, and transportation, the data were derived from the Chinese Life Cycle Database (CLCD) [13]. Electricity from the grid was regarded as the only energy input in the present LCA which comprised of 42%, 25%, 17% and 16% from natural gas, coal, renewable sources, and others [14]. The containers and the pumps were assumed to be transported with a distance of 100 km while the DAS and gravel were assumed to be transported with a distance of 20 km. All the transportation is based on a lorry with a capacity of 16–32 t.
2.3.2. Emissions
All the processes, i.e., electricity and chemicals production, wastewater treatment itself and transportation, are associated with substances emissions into water, air or soil whereby the LCA is quantitatively processed. In the present study, the direct domestic carbon dioxide emission from the field tidal flow CW was excluded from the analysis as it is biogenic in nature while the methane and nitrous oxide involved in the calculation were gained from the previous study [15]. The extra emissions from the DAS were listed and calculated separately in order to clearly interpret the exact environmental impacts of the DAS. The existence of vegetation could be a carbon sink except for the fantastically aesthetic value. The CO2 uptake capacity of the vegetation is between 617 and 977 g C/(m2·year) [16] and 800 g C/(m2·year) was adopted in the present study.
2.4. Life Cycle Impact Assessment
The LCA was performed in E-balance software [13] in accordance with the international standards ISO 14040/14044 [8]. CML2002 LCIA methodology was used in the analysis at the Midpoint level. The climate change-associated impacts and environmental quality-associated issues were the main focuses of the present LCA. Impact categories involved in this methodology include fossil depletion potential (FDP), acidification potential (AP), eutrophication potential (EP) and global warming potential (GWP). In addition, the emission of CO2, NOx, and SO2 was calculated as well in the model. Regarding the environmental impacts from the vegetation, the impact value from the LCA calculation was negative while others were positive. Normalization method (normalization reference of China) was used to convert the characterization results into dimensionless scores to make them comparably [17].
2.5. Sensitivity Analysis
To evaluate to what degree the processes parameters may influence the LCA outcome of the tidal flow CW, a sensitivity analysis was conducted regarding several key materials and energy input. Herein, the electricity consumption, quantity of DAS, lifetime of containers and pumps, as well as the coverage of vegetation were considered in the sensitivity analysis. According to Garfí et al. [18] a variation of ±10% was considered for all parameters and the sensitivity coefficient was calculated using Equation (1).
where, Input is the value of the input variable (i.e., DAS, effluent quality, chemicals and vegetation), while Output is the value of the environmental indicator (i.e., FDP, AP etc.).
3. Results and Discussion
3.1. Interpretation of the LCA Results
The characterization and normalization results of LCA regarding the field tidal CW are summarized and presented in Table 3 and Table 4, respectively. Characterization results enable the implementers to figure out the most positive contributing process to the environmental degradation within each category while the normalization results present the predominant damage category within each process [17].
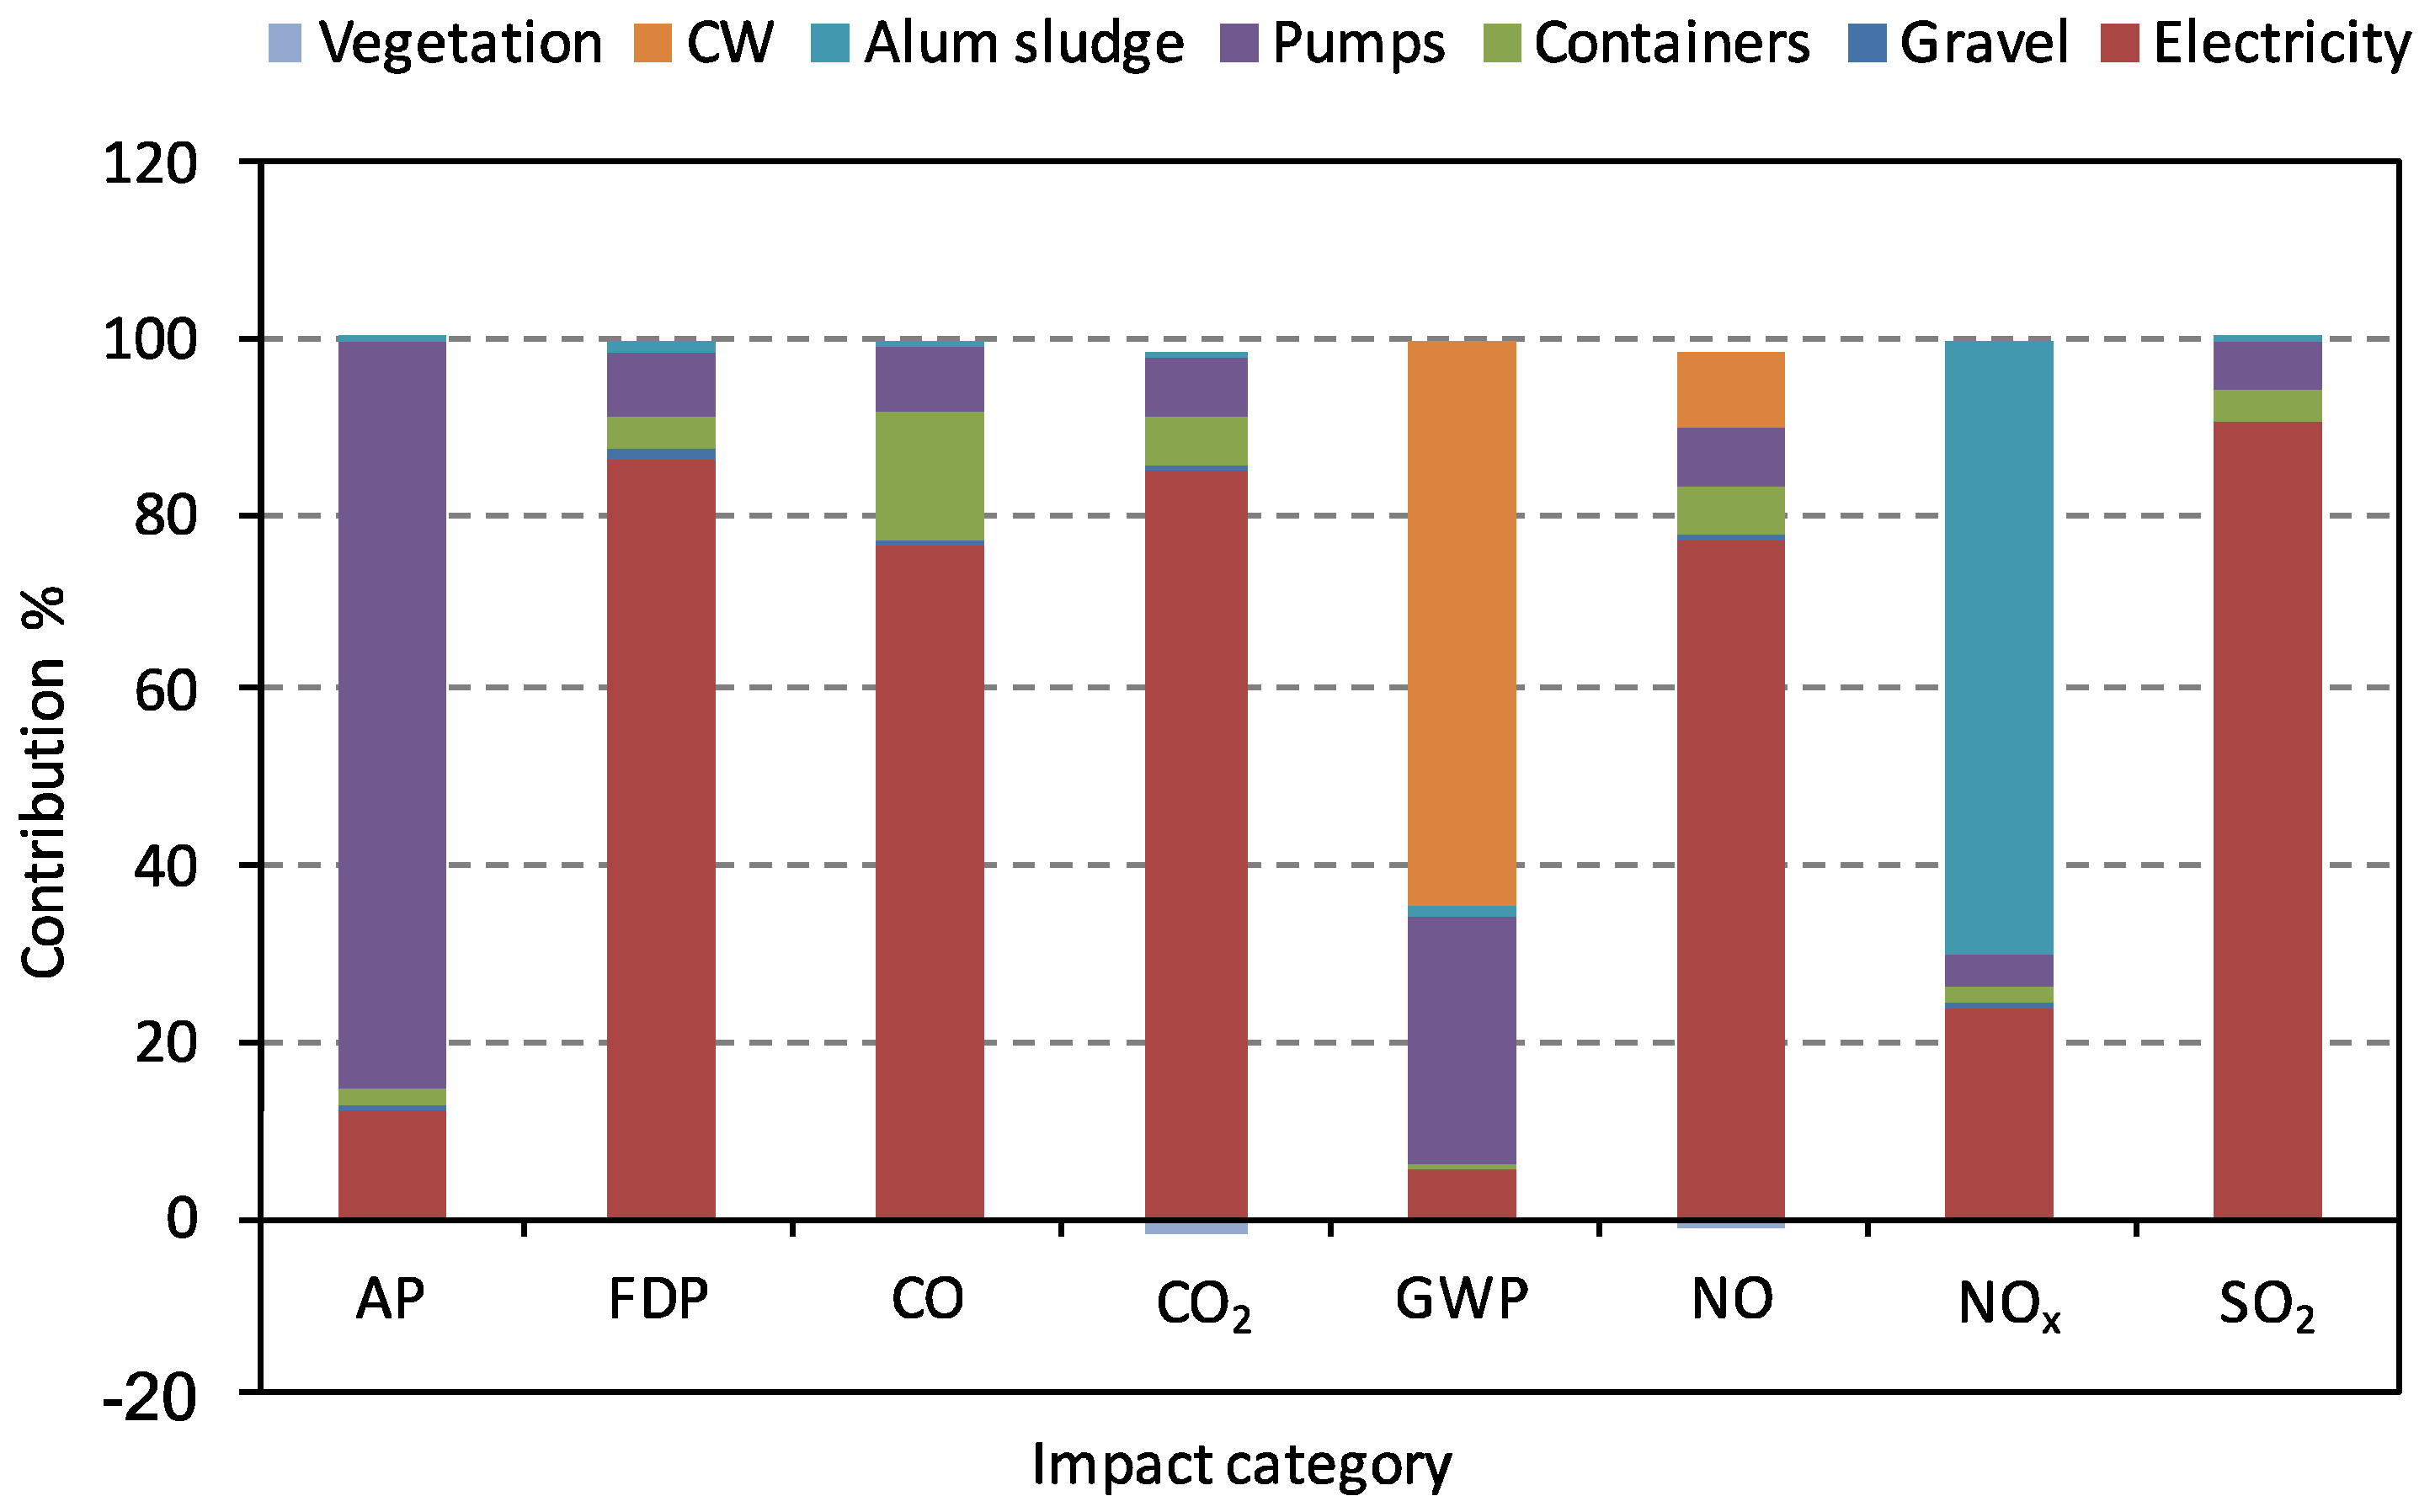
From the characterization results, the highest contributor to each environmental impact category is clearly shown. Pumps manufacturing, electricity generation, effluent, and tidal flow CW treatment processes dominated the AP, FDP, EP, and GWP, respectively. Moreover, the electricity generation mainly induced the CO2 and SO2 emissions while the DAS transportation was the main source of NOx emission. Particularly, the electricity generation dominated three environmental impact categories and is deemed to be the key process contributing to the destruction of the environment. This is unexpectedly out of the conventional scope to CW as CW is recognized as an energy-effective technology for wastewater treatment. This is probably because of the application of tidal flow operational strategy in the field CW project to enhance the treatment efficiency while tidal CW relies on the pumps to generate the tides.
On the other hand, the normalization results also presented some important information to guide the application of the tidal flow CW in treating swine wastewater. In addition, it can help to determine the most significantly environmental impact in each process. Obviously, the most significant impact is FDP for electricity generation, container manufacturing, and pump manufacturing, NOx emission for gravel transportation, and EP for DAS and CW performance, respectively.
3.2. AP, SO2, and NOx Emission
AP was mainly due to the SO2 and NOx emissions from the fossil fuel combustion which generated electricity or fueled the transportation [19]. As aforementioned, fossil fuel is still one of the first energy sources in Ireland. Thus, electricity generation shared almost 90% contribution to SO2 emission (Figure 2). On the other hand, pump manufacturing and DAS transportation had the biggest contribution to the AP and NOx emission.
3.3. EP
EP refers to the environmental impact caused by the nutrients released into the surface water [9]. For the wastewater treatment facilities, N and P residuals in the effluent are the main culprits of the EP. As such, the effluent from the tidal flow CW was the predominant source of EP, sharing about 64% of the impact (Figure 2). As shown in Table 1, the average N and P contents in the effluent were 71 and 1.5 mg/L, respectively. The high N residual is really a nuisance to the environment, particularly the surface water bodies. Under the circumstance of spreading the effluent on grassland, the adverse impact on groundwater should not be ignored either. According to the pollutant removal performance, the ammonia and nitrate content in the effluent were still high, which needs further improvement.
3.4. CO2 Emission and GWP
GW is an indicator to quantify the greenhouse gas (GHG) emission of the target product. Apart from the CO2, GWP also includes methane and nitrous oxide. Indeed, the concept of “carbon neutrality” in wastewater treatment describes the GWP. In general, conventional CW is always a carbon sink rather than a GHG source [18]. That is why nature-based solutions are always the priority for wastewater treatment.
However, the tidal flow CW in the present study showed a positive GWP and CO2 emission which means that the tidal flow CW was not a carbon sink any more. According to Figure 2, the electricity generation shared most of the GHG emission with a proportion of 77–85%. It is worth noting that the CW also contributed about 8% to the GWP. Although the CO2 emission from the CW was not considered, the tidal flow CW also generated a considerable quantity of the methane and nitrous oxide. In addition, CW is also acknowledged by the existence of the vegetation which could uptake the CO2 from the air. However, in the present study, the CO2 fixation by CW seemed fairly minor compared with the CO2 generation from the electricity.
3.5. Sensitivity Analysis
According to the results of the sensitivity analysis (Table 5), the processes holding significant influence on the environmental impact categories include electricity, HDPE, and pump. In contrast, the environmental impact categories seemed immune to other processes. In the present analysis, the DAS was regarded as a kind of byproduct of the water treatment plants. Herein, no resource or energy was input into the production of the DAS and thus, there was insignificant sensitivity coming from the DAS. In terms of the gravel, it is a natural material with little energy input and therefore, its variation induced marginal response from all the environmental impact categories. In the present study, the vegetation is also unlikely to influence the environmental impacts due to its insignificant mitigation compared with other processes, such as the electricity.
By the contrast consideration, all the environmental impact categories except for the EP are sensitive to the variation of the electricity. A 7–9% increase was recorded for each category with a 10% increase of the electricity consumption. This result also demonstrated again that the electricity is the dominant source of almost all the adversely environmental impacts. In addition, the variation of the HDPE also significantly influences the FDP while the variation of pump influenced the EP and NOx emission. On the other hand, the results in Table 5 indicate the remaining aspects that need further improvement to mitigate the environmental impacts.
4. Summary and Conclusions
In the present LCA analysis, a field tidal flow CW for treating a farmland wastewater was assessed based on the environmental impacts. The LCA results indicated that the present field tidal flow CW unexpectedly presented a high adverse impact on the environment. In several previous studies regarding the environmental performance of CWs [18], the CO2 emission is at least a negative value which means that the CW sequesters carbon from the atmosphere and mitigates the adverse impacts from other materials/energy input. However, in the present field tidal flow CW, the CO2 emission was positive due to the electricity consumption. Consequently, the CO2 sequestration by the vegetation in the field tidal flow CW was very small compared with that emitted from the electricity generation.
On the other hand, the operation of the pumps mainly contributed to the electricity consumption in the field tidal CW. Indeed, the tidal flow CW is designed to enhance the oxygen diffusion efficiency and nitrification process. This strategy is an effective alternative to the aeration process and had led to high treatment efficiency [10]. However, from this LCA analysis, the energy consumption of the field tidal flow CW was very high, which induced the adverse environmental impacts. Thus, further comparison and discussion are needed to verify the environmental impact of tidal flow scheme and artificial aeration. It is noted that background information, e.g., the wastewater treated and the background conditions considered in the LCA, should be taken into account to fairly evaluate the environmental performance of tidal flow CW in the present LCA. The livestock farms are usually located far away from each other. Thus, it is difficult to converge all the wastewater and then treat it with conventional activated sludge systems. Generally, the cost of activated sludge systems scales down with the increase of wastewater loading rate. Therefore, it is cost-intensive to adopt the conventional activated sludge system. Regardless, the real environmental performance of activated sludge in comparison to the tidal flow CW in treatment of livestock wastewater needs further evaluation.
In addition, the footprint is another major concern in choosing the appropriate technology. The tidal flow CW is usually small compared with conventional CWs. This favorable feature of tidal flow CW extends its application in some land-limited area. However, a lot of land is available on most livestock farms. Thus, the suitability of tidal flow CW in treating livestock wastewater is rooted in its recognized treatment performance.
Overall, in this study, it has been demonstrated via a field tidal flow CW for purifying swine wastewater that the LCA seems useful for providing entire environmental impact. Although tidal flow is a novel strategy in CW technology, the sustainability of the tidal flow CW was frustrated by the high electricity consumption to create the tides. The electricity generation accounted about 60–80% of the adverse impacts in the FDP, GWP, CO2 and SO2 emissions. Attention should be paid to the application of the tidal flow strategy in some cases.
Author Contributions
Tong Wang and Yaqian Zhao conceived and designed the experiments; Kate O’Meara and Emmet Mullan performed the experiments; Ranbin Liu and Tong Wang analyzed the data; Tong Wang, Ranbin Liu and Yaqian Zhao wrote the paper.
Funding
This research was partially funded by National Natural Science Foundation of China [No. 41572235].
Acknowledgments
This study was partially supported by National Natural Science Foundation of China (No. 41572235).
Conflicts of Interest
The authors declare no conflict of interest.
References
- Agriculture and Food Development Authority Agriculture in Ireland. Available online: https://www.teagasc.ie/rural-economy/rural-economy/agri-food-business/agriculture-in-ireland/ (accessed on 2 April 2018).
- Journal Engineers Green farming: Making the Pig Industry a Nexus of Waste Management and Renewable Energy. Available online: http://www.engineersjournal.ie/2016/07/12/green-farm-pig-renewable-energy/ (accessed on 2 April 2018).
- Portal, E.D. Nitrate Vulnerable Zones. Available online: https://www.europeandataportal.eu/data/en/dataset/nitrate-vulnerable-zones (accessed on 2 April 2018).
- Kadlec, R.H.; Wallace, S.D. Treatment Wetlands, 2nd ed.; Taylor & Francis Group: Boca Raton, FL, USA, 2009; ISBN 978-1-56570-526-4. [Google Scholar]
- Hu, Y.; Zhao, Y.; Rymszewicz, A. Robust biological nitrogen removal by creating multiple tides in a single bed tidal flow constructed wetland. Sci. Total Environ. 2014, 470–471, 1197–1204. [Google Scholar] [CrossRef] [PubMed]
- Hu, Y.; Zhao, X.; Zhao, Y. Achieving high-rate autotrophic nitrogen removal via Canon process in a modified single bed tidal flow constructed wetland. Chem. Eng. J. 2014, 237, 329–335. [Google Scholar] [CrossRef]
- Zang, Y.; Li, Y.; Wang, C.; Zhang, W.; Xiong, W. Towards more accurate life cycle assessment of biological wastewater treatment plants: A review. J. Clean. Prod. 2015, 107, 676–692. [Google Scholar] [CrossRef]
- Corominas, L.; Foley, J.; Guest, J.S.; Hospido, A.; Larsen, H.F.; Morera, S.; Shaw, A. Life cycle assessment applied to wastewater treatment: State of the art. Water Res. 2013, 47, 5480–5492. [Google Scholar] [CrossRef] [PubMed]
- Kalbar, P.P.; Karmakar, S.; Asolekar, S.R. Assessment of wastewater treatment technologies: Life cycle approach. Water Environ. J. 2013, 27, 261–268. [Google Scholar] [CrossRef]
- Zhao, Y.Q.; Babatunde, A.O.; Hu, Y.S.; Kumar, J.L.G.; Zhao, X.H. Pilot field-scale demonstration of a novel alum sludge-based constructed wetland system for enhanced wastewater treatment. Process Biochem. 2011, 46, 278–283. [Google Scholar] [CrossRef]
- Remy, C.; Boulestreau, M.; Warneke, J.; Jossa, P.; Kabbe, C.; Lesjean, B. Evaluating new processes and concepts for energy and resource recovery from municipal wastewater with life cycle assessment. Water Sci. Technol. 2015, 73, 1074–1080. [Google Scholar] [CrossRef] [PubMed]
- Yang, Y.; Zhao, Y.Q.; Babatunde, A.O.; Wang, L.; Ren, Y.X.; Han, Y. Characteristics and mechanisms of phosphate adsorption on dewatered alum sludge. Sep. Purif. Technol. 2006, 51, 193–200. [Google Scholar] [CrossRef]
- Bai, S.; Wang, X.; Huppes, G.; Zhao, X.; Ren, N. Using site-specific life cycle assessment methodology to evaluate Chinese wastewater treatment scenarios: A comparative study of site-generic and site-specific methods. J. Clean. Prod. 2017, 144, 1–7. [Google Scholar] [CrossRef]
- Sustainable Energy Authority of Ireland. Energy in Ireland 1990–2015. Available online: http://www.seai.ie/resources/publications/Energy-in-Ireland-1990-2015.pdf (accessed on 3 April 2018).
- Mander, Ü.; Maddison, M.; Soosaar, K.; Karabelnik, K. The impact of pulsing hydrology and fluctuating water table on greenhouse gas emissions from constructed wetlands. Wetlands 2011, 31, 1023–1032. [Google Scholar] [CrossRef]
- De Klein, J.J.M.; Van der Werf, A.K. Balancing carbon sequestration and GHG emissions in a constructed wetland. Ecol. Eng. 2014, 66, 36–42. [Google Scholar] [CrossRef]
- Bai, S.; Wang, X.; Zhang, X.; Zhao, X.; Ren, N. Life cycle assessment in wastewater treatment: Influence of site-oriented normalization factors, life cycle impact assessment methods, and weighting methods. RSC Adv. 2017, 7, 26335–26341. [Google Scholar] [CrossRef]
- Garfí, M.; Flores, L.; Ferrer, I. Life Cycle Assessment of wastewater treatment systems for small communities: Activated sludge, constructed wetlands and high rate algal ponds. J. Clean. Prod. 2017, 161, 211–219. [Google Scholar] [CrossRef]
- Corbala-robles, L. Life cycle assessment of biological pig manure treatment versus direct land application—A trade-off story. Resour. Conserv. Recycl. 2018, 131, 86–98. [Google Scholar] [CrossRef]
Figure 1.
Field photos (A) and schematic representation (B) of the pilot-scale four stages tidal flow constructed wetlands (CWs).
Figure 1.
Field photos (A) and schematic representation (B) of the pilot-scale four stages tidal flow constructed wetlands (CWs).

Figure 2.
Contribution of all the processes to each environmental impact category.


Table 1.
Wastewater characteristics, construction parameters, and performance of the CW [10].
Table 1.
Wastewater characteristics, construction parameters, and performance of the CW [10].
| Wastewater (mg/L) | |||||
| Composition | Influent | Effluent | Composition | Influent | Effluent |
| BOD | 318 | 102 | PO43−-P | 20 | 1.5 |
| COD | 446 | 206 | SS | 188 | 68 |
| TN | 136 | 72 | Al | 0.01 | 0.07 |
| CW (Each Stage) | |||||
| Volume-total | 1100 L | DAS | 972 kg (75% moisture) | ||
| Volume-working | 180 L | Gravel-mass | 305 kg | ||
| Cycle | 3 cycles/day | Cycle time | 8 h | ||
Table 2.
LCA inventory of direct input of the tidal CW per FU (1 m3).
| Item | Unit | Value | Item | Unit | Value |
|---|---|---|---|---|---|
| COD | g | 446 | Containers | kg | 0.055 |
| TN | g | 136 | Tran-container | t·km | 0.0055 |
| TP | g | 20 | Gravel | kg | 2.36 |
| Electricity | kWh | 2.36 | Tran-gravel | t·km | 0.047 |
| Pumps | - | 0.00186 | DAS | kg | 7.55 |
| Tran-pump | t·km | 2.62 | Tran-alum | t·km | 0.151 |
| Vegetation | m2 | 0.011 | - | - | - |
Table 3.
The characterization results of the present LCA.
| Process | AP (kg SO2 eq) | FDP (kg Coal-R eq) | CO2 (kg) | EP (kg PO43− eq) | GWP (kg CO2 eq) | NOx (kg) | SO2 (kg) |
|---|---|---|---|---|---|---|---|
| Electricity | 1.08 × 10⁻² | 5.93 | 1.99 | 5.65 × 10⁻⁴ | 2.05 | 3.73 × 10⁻³ | 7.92 × 10⁻³ |
| Gravel | 1.33 × 10⁻⁴ | 4.80 × 10⁻² | 1.07 × 10⁻² | 1.80 × 10⁻⁵ | 1.14 × 10⁻² | 1.33 × 10⁻⁴ | 3.90 × 10⁻⁵ |
| Containers | 5.24 × 10⁻⁴ | 1.18 | 1.26 × 10⁻¹ | 4.77 × 10⁻⁵ | 1.47 × 10⁻¹ | 2.71 × 10⁻⁴ | 3.16 × 10⁻⁴ |
| Pumps | 8.50 × 10⁻⁴ | 5.61 × 10⁻¹ | 1.60 × 10⁻¹ | 2.92 × 10⁻³ | 1.74 × 10⁻¹ | 5.66 × 10⁻⁴ | 4.76 × 10⁻⁴ |
| DAS | 2.24 × 10⁻⁴ | 6.35 × 10⁻² | 9.95 × 10⁻³ | 1.01 × 10⁻⁴ | 1.10 × 10⁻² | 1.10 × 10⁻² | 1.23 × 10⁻⁵ |
| CW | 0 | 0 | 0 | 0.006715 | 0.22495 | 0 | 0 |
| Vegetation | 0 | 0 | −0.0363 | 0 | −0.0363 | 0 | 0 |
Table 4.
The normalization results of the LCA.
| Process | AP-CN-2010 | FDP (Fossil Fuel)-CN-2010 | CO2-CN-2010 | EP-CN-2010 | GWP-CN-2010 | NOx-CN-2010 | SO2-CN-2010 |
|---|---|---|---|---|---|---|---|
| Electricity | 2.97 × 10⁻¹³ | 3.83 × 10⁻¹³ | 2.40 × 10⁻¹³ | 1.50 × 10⁻¹³ | 1.95 × 10⁻¹³ | 1.79 × 10⁻¹³ | 3.63 × 10⁻¹³ |
| Gravel | 3.66 × 10⁻¹⁵ | 3.10 × 10⁻¹⁵ | 1.29 × 10⁻¹⁵ | 4.78 × 10⁻¹⁵ | 1.09 × 10⁻¹⁵ | 6.41 × 10⁻¹⁵ | 1.78 × 10⁻¹⁵ |
| Containers | 1.44 × 10⁻¹⁴ | 7.60 × 10⁻¹⁴ | 1.52 × 10⁻¹⁴ | 1.27 × 10⁻¹⁴ | 1.40 × 10⁻¹⁴ | 1.30 × 10⁻¹⁴ | 1.45 × 10⁻¹⁴ |
| Pumps | 2.33 × 10⁻¹⁴ | 3.63 × 10⁻¹⁴ | 1.93 × 10⁻¹⁴ | 7.77 × 10⁻¹³ | 1.65 × 10⁻¹⁴ | 2.72 × 10⁻¹⁴ | 2.18 × 10⁻¹⁴ |
| DAS | 6.16 × 10⁻¹⁵ | 4.11 × 10⁻¹⁵ | 1.20 × 10⁻¹⁵ | 2.68 × 10⁻¹⁴ | 1.04 × 10⁻¹⁵ | 1.45 × 10⁻¹⁴ | 5.64 × 10⁻¹⁶ |
| CW | 0 | 0 | 0 | 1.79 × 10⁻¹² | 2.13 × 10⁻¹⁴ | 0 | 0 |
| Vegetation | 0 | 0 | −4.37 × 10⁻¹⁵ | 0 | −3.45 × 10⁻¹⁵ | 0 | 0 |
Table 5.
The sensitivity analysis of the selected variables to the environmental impact categories.
| Variable (±10%) | Sensitivity % | ||||||
|---|---|---|---|---|---|---|---|
| AP | FDP | CO2 | EP | GWP | NOx | SO2 | |
| DAS | 0.018 | 0.008 | 0.004 | 0.009 | 0.004 | 0.060 | 0.001 |
| Electricity | 0.862 | 0.762 | 0.853 | 0.054 | 0.772 | 0.745 | 0.903 |
| Vegetation | 0 | 0 | 0.016 | 0 | 0.014 | 0 | 0 |
| HDPE | 0.042 | 0.151 | 0.054 | 0.004 | 0.055 | 0.054 | 0.036 |
| Pump | 0.068 | 0.072 | 0.068 | 0.28 | 0.065 | 0.113 | 0.054 |
| Gravel | 0.010 | 0.006 | 0.004 | 0.001 | 0.004 | 0.027 | 0.004 |
Note: Bold letter means the significantly sensitive category.
© 2018 by the authors. Licensee MDPI, Basel, Switzerland. This article is an open access article distributed under the terms and conditions of the Creative Commons Attribution (CC BY) license (http://creativecommons.org/licenses/by/4.0/).
Share and Cite
MDPI and ACS Style
Wang, T.; Liu, R.; O’Meara, K.; Mullan, E.; Zhao, Y. Assessment of a Field Tidal Flow Constructed Wetland in Treatment of Swine Wastewater: Life Cycle Approach. Water 2018, 10, 573. https://doi.org/10.3390/w10050573
AMA Style
Wang T, Liu R, O’Meara K, Mullan E, Zhao Y. Assessment of a Field Tidal Flow Constructed Wetland in Treatment of Swine Wastewater: Life Cycle Approach. Water. 2018; 10(5):573. https://doi.org/10.3390/w10050573
Chicago/Turabian StyleWang, Tong, Ranbin Liu, Kate O’Meara, Emmet Mullan, and Yaqian Zhao. 2018. "Assessment of a Field Tidal Flow Constructed Wetland in Treatment of Swine Wastewater: Life Cycle Approach" Water 10, no. 5: 573. https://doi.org/10.3390/w10050573
Note that from the first issue of 2016, this journal uses article numbers instead of page numbers. See further details here.