Potential Impact of In-Situ Oil Shale Exploitation on Aquifer System

1
Key Laboratory of Groundwater Resources and Environment of Ministry of Education, Jilin University, Changchun 130021, China
2
College of Environmental and Resources, Jilin University, Changchun 130021, China
3
National-Local Joint Engineering Laboratory of In-situ Conversion, Drilling and Exploitation Technology for Oil Shale, Changchun 130021, China
4
College of Water Resources and Architectural Engineering, The Northeast Agricultural University, Harbin 150030, China
*
Author to whom correspondence should be addressed.
Water 2018, 10(5), 649; https://doi.org/10.3390/w10050649
Submission received: 18 March 2018
/
Revised: 3 May 2018
/
Accepted: 10 May 2018
/
Published: 17 May 2018
(This article belongs to the Special Issue Groundwater Contamination and Remediation)
Abstract
:The effects of heat on physical and hydraulic properties of oil shale were investigated. The porosity and water absorption of oil shale increased with increasing pyrolysis temperature. The porosity increased by 19.048% and water absorption increased by 0.76% when oil shale was heated to 500 °C. Thus, originally impermeable oil shale was converted to a permeable rock formation, facilitating interactions between surrounding groundwater and oil. Heated oil shale was immersed in water, which showed strong alkaline properties. The content of Ca2+ remained stable and a slight decrease in SO42− content was observed. Hydrocarbon content in the water samples reached maximum concentration within three days.
1. Introduction
With rapid socio-economic development, the demand for energy is growing. Conventional petroleum resources can no longer meet the rapidly increasing demand for oil. Consequently, development and utilization of unconventional petroleum resources is gaining attention. Shale oil plays an important role in the world’s energy supply as it is one of the main unconventional oil resources [1]. Significant reserves of oil shale exist globally, amounting to nearly 10 trillion tonnes, which can be converted to nearly 0.045 trillion tons shale oil [2]. This is nearly four times the amount of current oil resources [3,4]. Presently, oil shale is produced by strip mining or underground mining, and crushed and sieved to the desired particle size. The particles are subject to dry distillation in furnaces to generate shale oil [5]. However, the traditional method of developing and utilizing oil shale is not economically efficient and is environmentally unfriendly [6,7]. In-situ oil shale mining does not require mining, transportation, and ore processing. Additionally, it can mine deep and high-strength oil shale mines [8,9]. In-situ shale oil extraction heats sections of vast oil shale fields in-situ, releasing shale oil and oil shale gas from the rock, which is pumped to the surface and converted to fuel [10]. Scientists and energy companies have researched oil shale exploration and development technologies extensively, domestically and globally [11,12,13]. Current in-situ oil shale mining technologies mainly include Shell’s in-situ conversion process (Shell ICP), ExxonMobil Electrofrac in-situ shale oil extraction technology, Geothermic Fuels Cells Process (IEP GFC) [11,12], and convection heating technology of Taiyuan University of Technology among others [13]. Although in-situ oil shale mining offers several advantages, the physico-chemical properties of the shale layer can change after heating to high temperatures. Pyrolysis products such as oil, gas, and residue generated during the mining process can enter groundwater and affect the aquifer water quality [14]. In-situ exploitation of industrialized oil shale has not been extensively investigated and limited research has focused on the influence of in-situ mining on groundwater quality.
In this paper, changes in physical and hydraulic properties of oil shale after high-temperature pyrolysis were tested in the laboratory. We selected oil shale samples from the in-situ oil shale mining demonstration area in Fuyu City, Jilin Province, China. Immersion tests were conducted to analyze water quality indices generated by different oil shales due to water–rock interactions and assess the potential impact of in-situ recovery of oil shale on aquifer water quality.
2. Materials and Methods
2.1. Study Area and Samples
Samples were collected from the in-situ oil shale mining demonstration area in Fuyu City, Jilin Province, China. Fuyu City is located in Northwest Jilin Province at 125°0′–126°10′ E and 44°30′–44°44′ N. Rock formation at the site was cretaceous. Based on hydraulic properties, characteristics, and occurrence, the groundwater in the study area can be divided into three categories: quaternary unconsolidated rock pore water, pore fissure water in clastic rocks of upper cretaceous, and bedrock fissure water construction.
Porosity is the ratio of the total volume of pores in the rock to the volume of the rock. Porosity has significant influence on groundwater movement as the number and size of pores determine the ability of the rock to contain water. Rock water absorption mainly depends on the number of pores, cracks, pore sizes, and opening degrees. Rock water absorption is the ratio of the rock’s volume under atmospheric pressure to absorb water and the dry rock mass. It takes the degree of rock fracture development into account [15]. Han et al. tested original samples of oil shale and residues obtained after heating using Fourier transform infrared spectroscopy. They found that the characteristic peak of organic matter began to decrease at 300 °C and disappeared at 500 °C [16], indicating that kerogen began to pyrolyze at 300 °C and completely decomposed at 500 °C. Therefore, we chose heating temperatures of 300 °C and 500 °C to investigate the changes in physical, hydraulic, and chemical properties of oil shale. Separate samples were collected for each test.
2.2. Porosity Determination
2.2.1. Determination of Oil Shale Sample Weight
Nine oil shale samples were obtained from the study area for porosity tests. Each sample had a diameter of 60 mm and height between 40 mm to 60 mm. Porosity test samples were divided into three groups: Pa, Pb, and Pc, with three samples per group. Pa and Pb groups were heated to 300 °C and 500 °C, respectively, in a muffle furnace, and cooled to 20 °C after heating. Samples in the Pc group were not heated. All sets of oil shale samples were placed in an oven for 8 h at 105 °C and their dry weights were determined. The bulk density was calculated accordingly to the formula:
where ds represents the bulk density of oil shale, g/cm3; dw the dry weight of the sample, g; and V the sample volume, cm3.
2.2.2. Determination of the Specific Gravity of Oil Shale Samples
Individual test samples were ground in a ceramic bowl and passed through a 0.2 mm sieve. Next, 3.0 g of the sample was transferred to a 50 mL pycnometer and 25 mL of distilled water was added slowly along the vial wall. The pycnometer was boiled in 100 °C water bath for 1 h to remove gases adsorbed in the pores of the powder. The mixture was removed from the pycnometer and distilled water was poured dropwise along the bottle wall using a straw, which was closed using a bottle stopper, and placed at the bottle mouth. Excess distilled water overflowed through the capillaries of the stopper. Afterwards, the pycnometer was cooled to room temperature and dried. The three groups of samples were simultaneously transferred to an oven heated to 105–110 °C to dry for 24 h. Dried samples were placed in a desiccator, cooled to room temperature and weighed. Subsequently, the weight of the pycnometer, oil shale powder, and water (G1) was determined. A control setup where oil shale powder was not added to the pycnometer was used as a reference. Finally, the weights of the pycnometer and water (G0) were determined using the formula:
where γs represents the proportion of oil shale; and ρw the density of water, g/cm3.
2.2.3. Porosity Calculation
Porosity was calculated using the bulk density and specific gravity of the sample, as described below:
2.3. Water Absorption
Nine samples were tested to ensure accuracy of the water absorption test. The free immersion method was utilized to saturate the samples. The samples were placed in a sink and water was added to cover one-fourth of the samples’ height. After two hours, additional water was added to cover one-half of the samples’ height. After two more hours, water was added to cover three-fourth of the samples’ height. Finally, after additional two hours (total of six hours), water was added to completely cover the samples. The samples were subsequently soaked in water for 48 h. Finally, the samples were taken out of the water bath, and surface moisture was wiped off and weighed. Sample water absorption was calculated according to the following formula:
where wa represents rock water absorption, %; mo the specimen weight after water quality testing, g; and ms the dry specimen mass, g.
2.4. Determination of Water Quality Indices in Oil Shale Soaking Liquid
Unheated oil shale samples and oil shale samples heated to 300 °C and 500° C were weighed into seven portions (100 g each) and placed in individual conical flasks. Then, 1000 mL distilled water was added to each sample and the bottle was sealed. Sample sets were soaked for different durations: 3, 6, 9, 15, 21, 33, and 69 days. Values of regular indices in the water were measured after the stipulated immersion duration to determine pH, carbonate, bicarbonate, sulfate, calcium, iron, and ammonium ions. According to China quality standard for ground water, the pH of each sample was measured using pHS-3C pH meter. CO32−, HCO3−, and Ca2+ contents were determined using titration tests. The SO42− content was measured by barium chloride titration using methyl orange as an indicator. Iron ions in water samples were analyzed using Shimadzu AA-6000CF Flame Atomic Absorption Spectrophotometer. Ammonium ion content was determined using Nessler’s reagent spectrophotometry.
2.5. Determination of Organic Matter in Oil Shale Immersion Samples
Unlike the determination of conventional indexes, the water samples were acidified to pH < 2 to inhibit the activity of microorganisms before immersion. After immersion, 300 mL of each water sample was poured into a 1000 mL separatory funnel and 60 mL dichloromethane (Chromatography grade) was added. Additionally, a small amount of sodium chloride was added to reduce organic matter and extraction solvent was added to improve the extraction effect.
Thereafter, the separatory funnels were shaken for 20 min and left to settle. After stratification, the lower extract was filtered using a rotary evaporator with anhydrous sodium sulfate. Anhydrous sodium sulfate needed to be baked at 600 °C for 4 h to improve water absorption capacity. Rotary evaporation bottles had to be dried in advance to avoid water contamination of the samples.
Afterwards, the heating temperature of the evaporation bottles was set to 40 °C to enable evaporation of the extraction solution (methylene chloride) and increase organic matter concentration in the extract. After the volume of the extract had decreased to 1 mL, the rotary evaporator was switched off, and the concentrated solution was transferred to an Agilent bottle for organics measurement.
Finally, water samples, in which oil shale had been immersed for different durations, were tested to analyze the organic content of the oil shale samples heated to different temperatures. Organic components in the water samples were determined according to the results of the automatic match between the internal database of the Agilent 6890/5973 GC-MS analysis and peak positions of the substances (Table 1 and Table 2). A capillary column HP-5MS (30 m 0.32 mm 0.25 μm) was used in the experiment. Chromatographic setup conditions were: inlet 300 °C, constant flow mode, column flow 2 mL/min, and split ratio 50:1.
As shown in Table 1 and Table 2, the match probability for alkanes was much higher than for the other components. Therefore, the content of hydrocarbons in the samples was determined using mixed standard samples of C10–C20.
Therefore, 0.2 mg/mL of mixed standard samples were diluted to concentrations of 0.2, 0.5, 1.0, 2.0, and 4.0 mg/L to draw a standard curve. Then, the mass spectra of the mixed samples at different concentrations were integrated to represent the content of the substance. The mass spectrum of the tested sample was integrated ensuring any minor peak of the tested alkanes was also included in the integration. Finally, C10–C20 was calculated quantitatively from the area obtained after integration.
3. Results and Discussion
3.1. Impact of High-Temperature Pyrolysis on Physical and Hydraulic Properties of Oil Shale
3.1.1. Change in Porosity
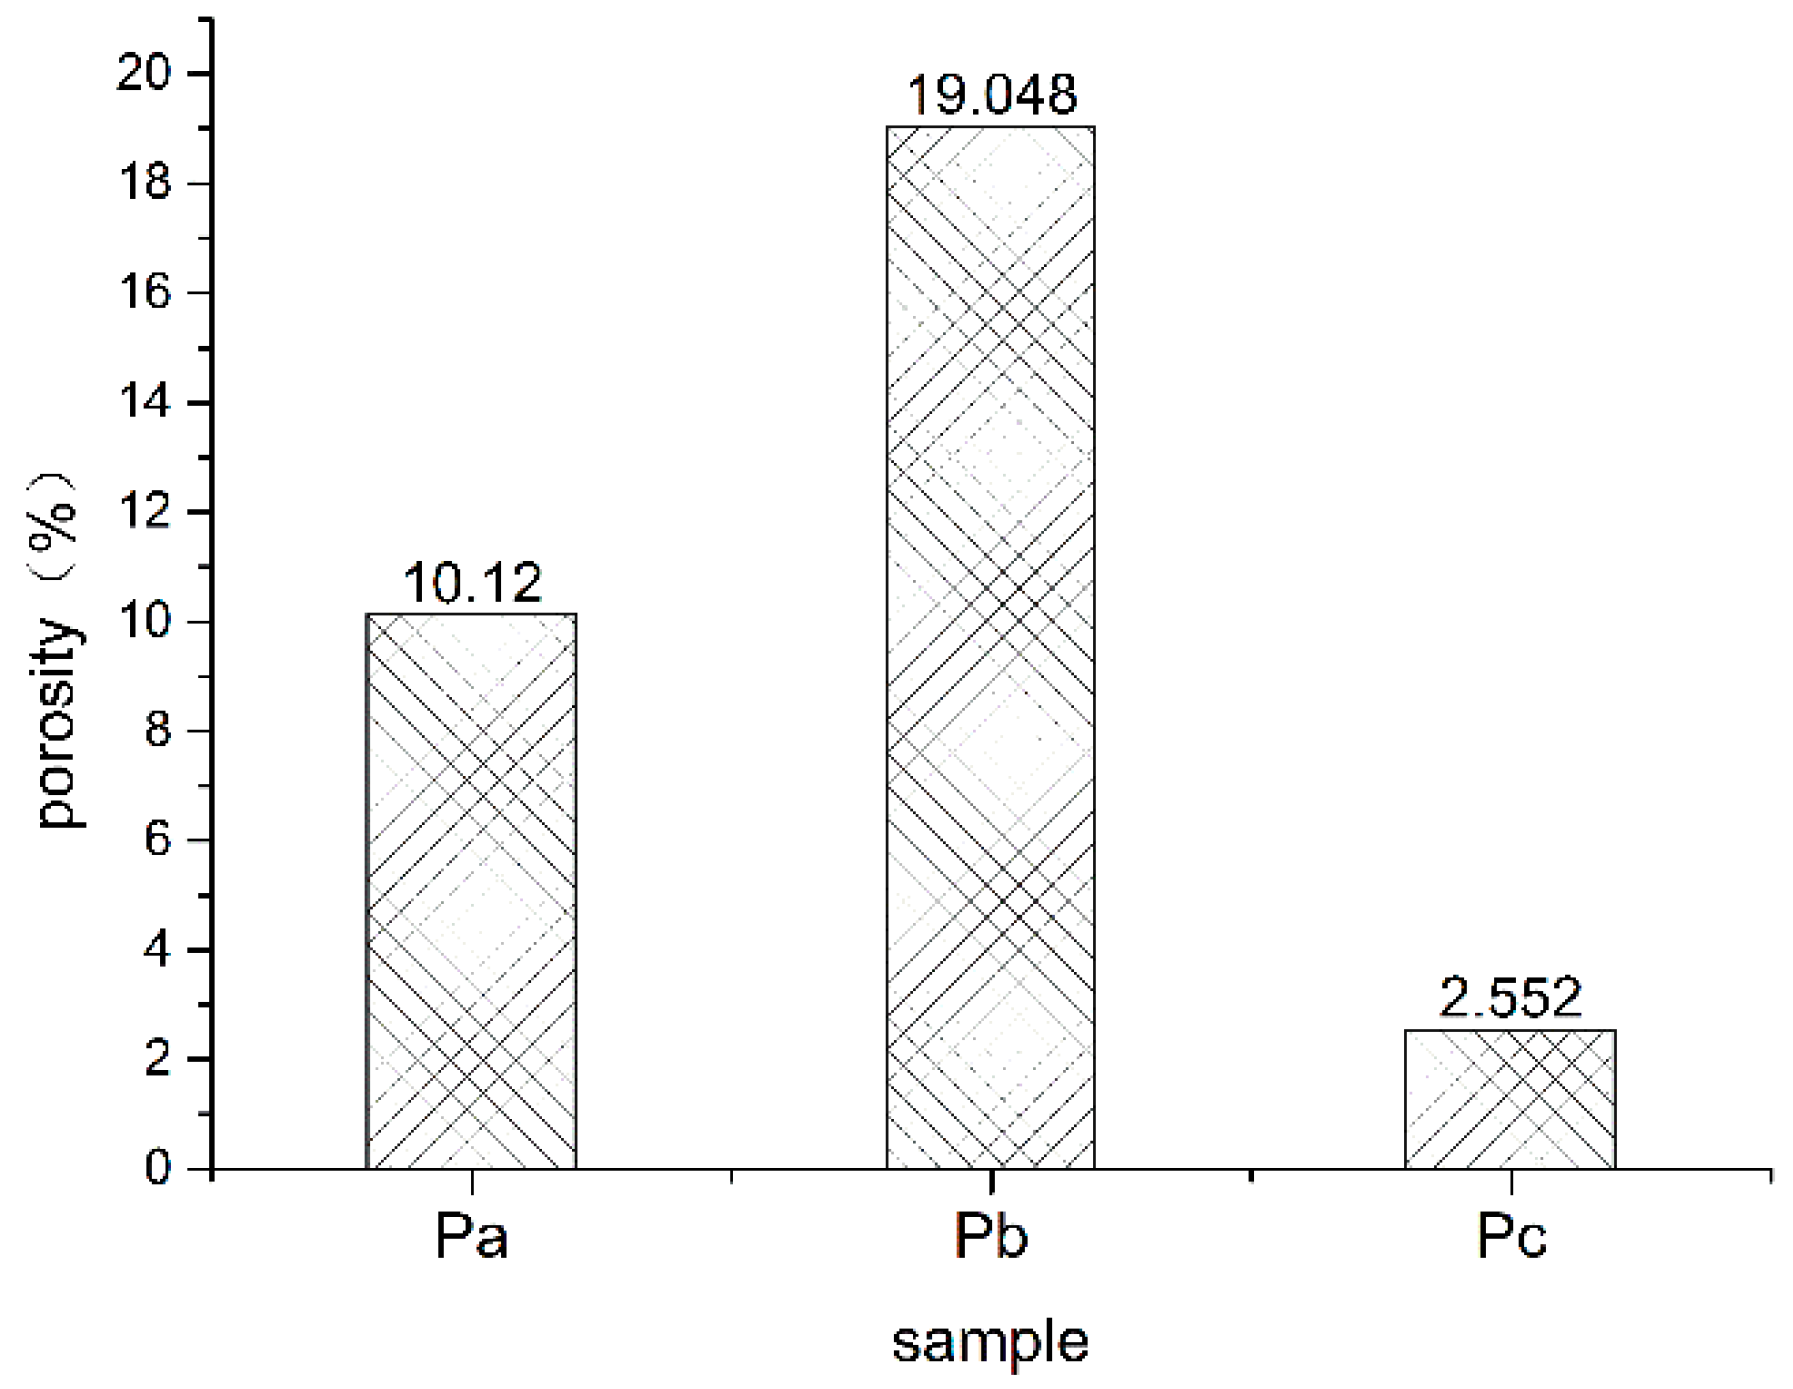
Figure 1 shows the average porosity of oil shale at different heating temperatures. The average porosity of an oil shale sample before heating was 2.552%; the porosity of oil shale increased significantly during heating. The increase in porosity of oil shale with increasing temperature was mainly caused by pyrolysis. After the oil shale was heated, kerogen decomposed to generate oil and gas.
Precipitation of petroleum products results in a large number of pore fissures in oil shale [17]. The difference in porosity from room temperature to 300 °C was less than the difference from 300 °C to 500 °C. This is mainly because when oil shale is heated to 300 °C, only water and some organic matter with low melting point is precipitated from oil shale [17]. When the heating temperature was increased from 300 °C to 500 °C, high-molecular organic compounds in oil shale, such as aliphatic hydrocarbons or aromatic hydrocarbons, begin to crack, contributing significantly to the increase in porosity after oil and gas pyrolysis [6,14].
3.1.2. Change in Water Absorption
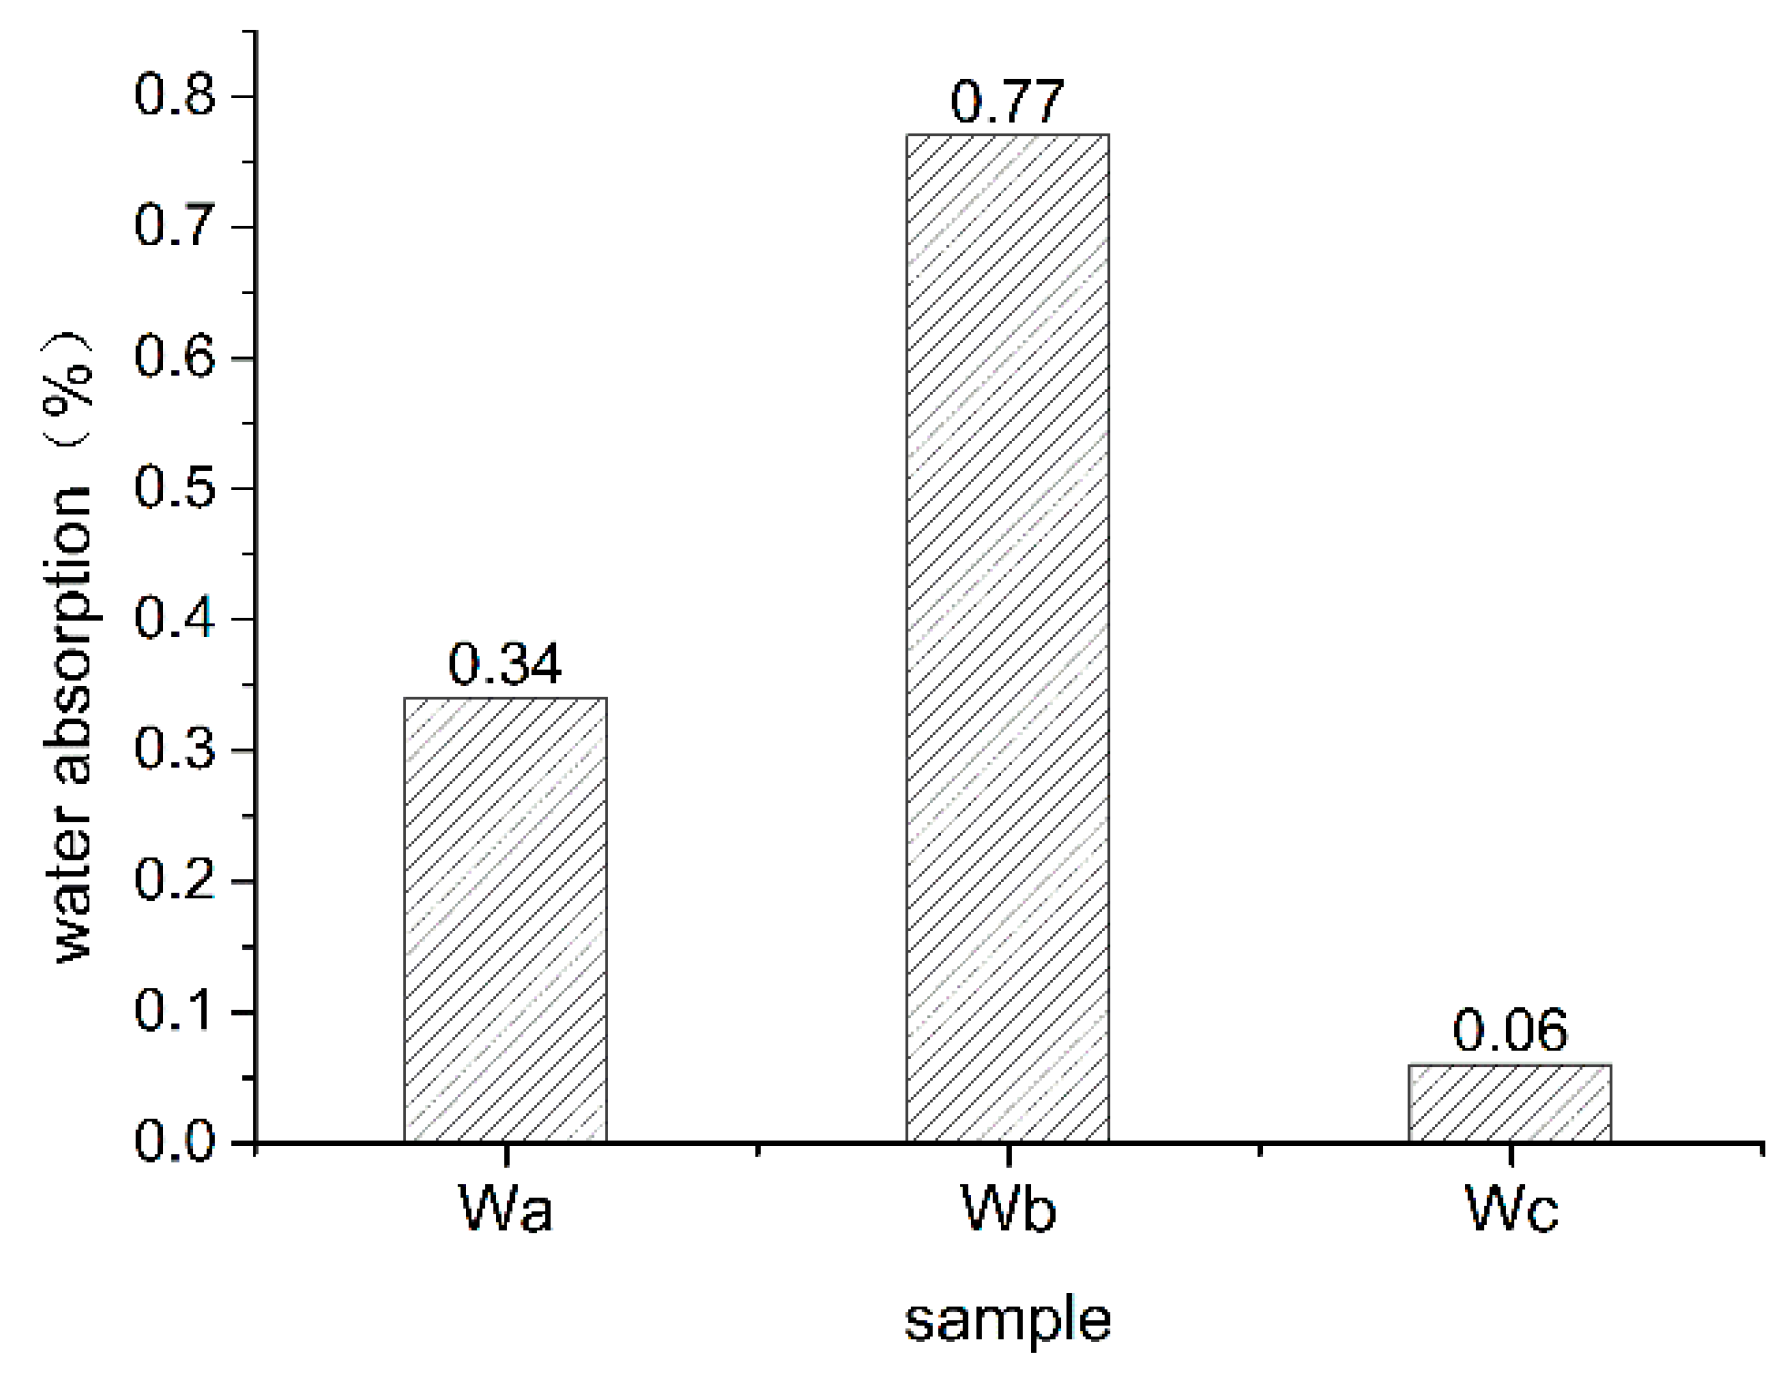
Figure 2 shows the average water absorption of oil shale at different heating temperatures. As seen in Figure 2, oil shale water absorption increased significantly after heating. When heated to 300 °C, the water absorption of oil shale increased to 0.34%, which was five times higher than the water absorption at room temperature (0.06%). When heated to 500 °C, the water absorption of the oil shale increased to 0.76%, which was 12.5 times higher than the water absorption at room temperature. Water absorption rate of oil shale increased with pyrolysis temperature primarily due to the liberation of oil and gas products resulting in a large number of pore fractures within the oil shale. Higher numbers of pores contribute to higher water absorption. Water absorption and porosity change of oil shale after pyrolysis were synchronous; the change in water absorption from room temperature to 300 °C was less than the change in oil shale heated to 300 °C and 500 °C.
3.1.3. Analysis of Changes in Physical and Hydraulic Properties
Most fossil fuel chemical reactions such as pyrolysis, gasification, and combustion occur inside the pores of fuel particles [18,19,20,21,22,23]. When kerogen is stored in oil shale pyrolusite, pores arise inside the rock. Additionally, pyrolysis of generated oil and gas also causes expansion of pores. This process turns the originally dense, impermeable, or water-pervious oil shale into a more porous aquifer. In this paper, when the kerogen decomposed after heating to 500 °C, the porosity of oil shale increased to 19.048% and water absorption increased to 0.76%. Qiu et al. measured the permeability of oil shale in Meihekou City in Jilin Province and found that permeability increased from 1.62 × 10⁻³ μm2 to 10.53 × 10⁻³ μm2 after heating [19].
Thus, after thermal decomposition, physical and hydraulic properties of oil shale changed the impermeable oil shale to a more permeable rock formation. Further, the enlarged pores and fissures serve as conduit for water diversion, enabling the oil shale layer to come in hydraulic contact with the overlying sub-aquifer and underlying confined aquifer which was consistent with the research on the pyrolysis process of Huadian oil shale [21,22]. This enables water in the adjacent aquifer to enter the oil shale layer.
3.2. Effect of Pyrolysis on Chemical Properties of Oil Shale
3.2.1. Changes in pH and Ion Concentrations
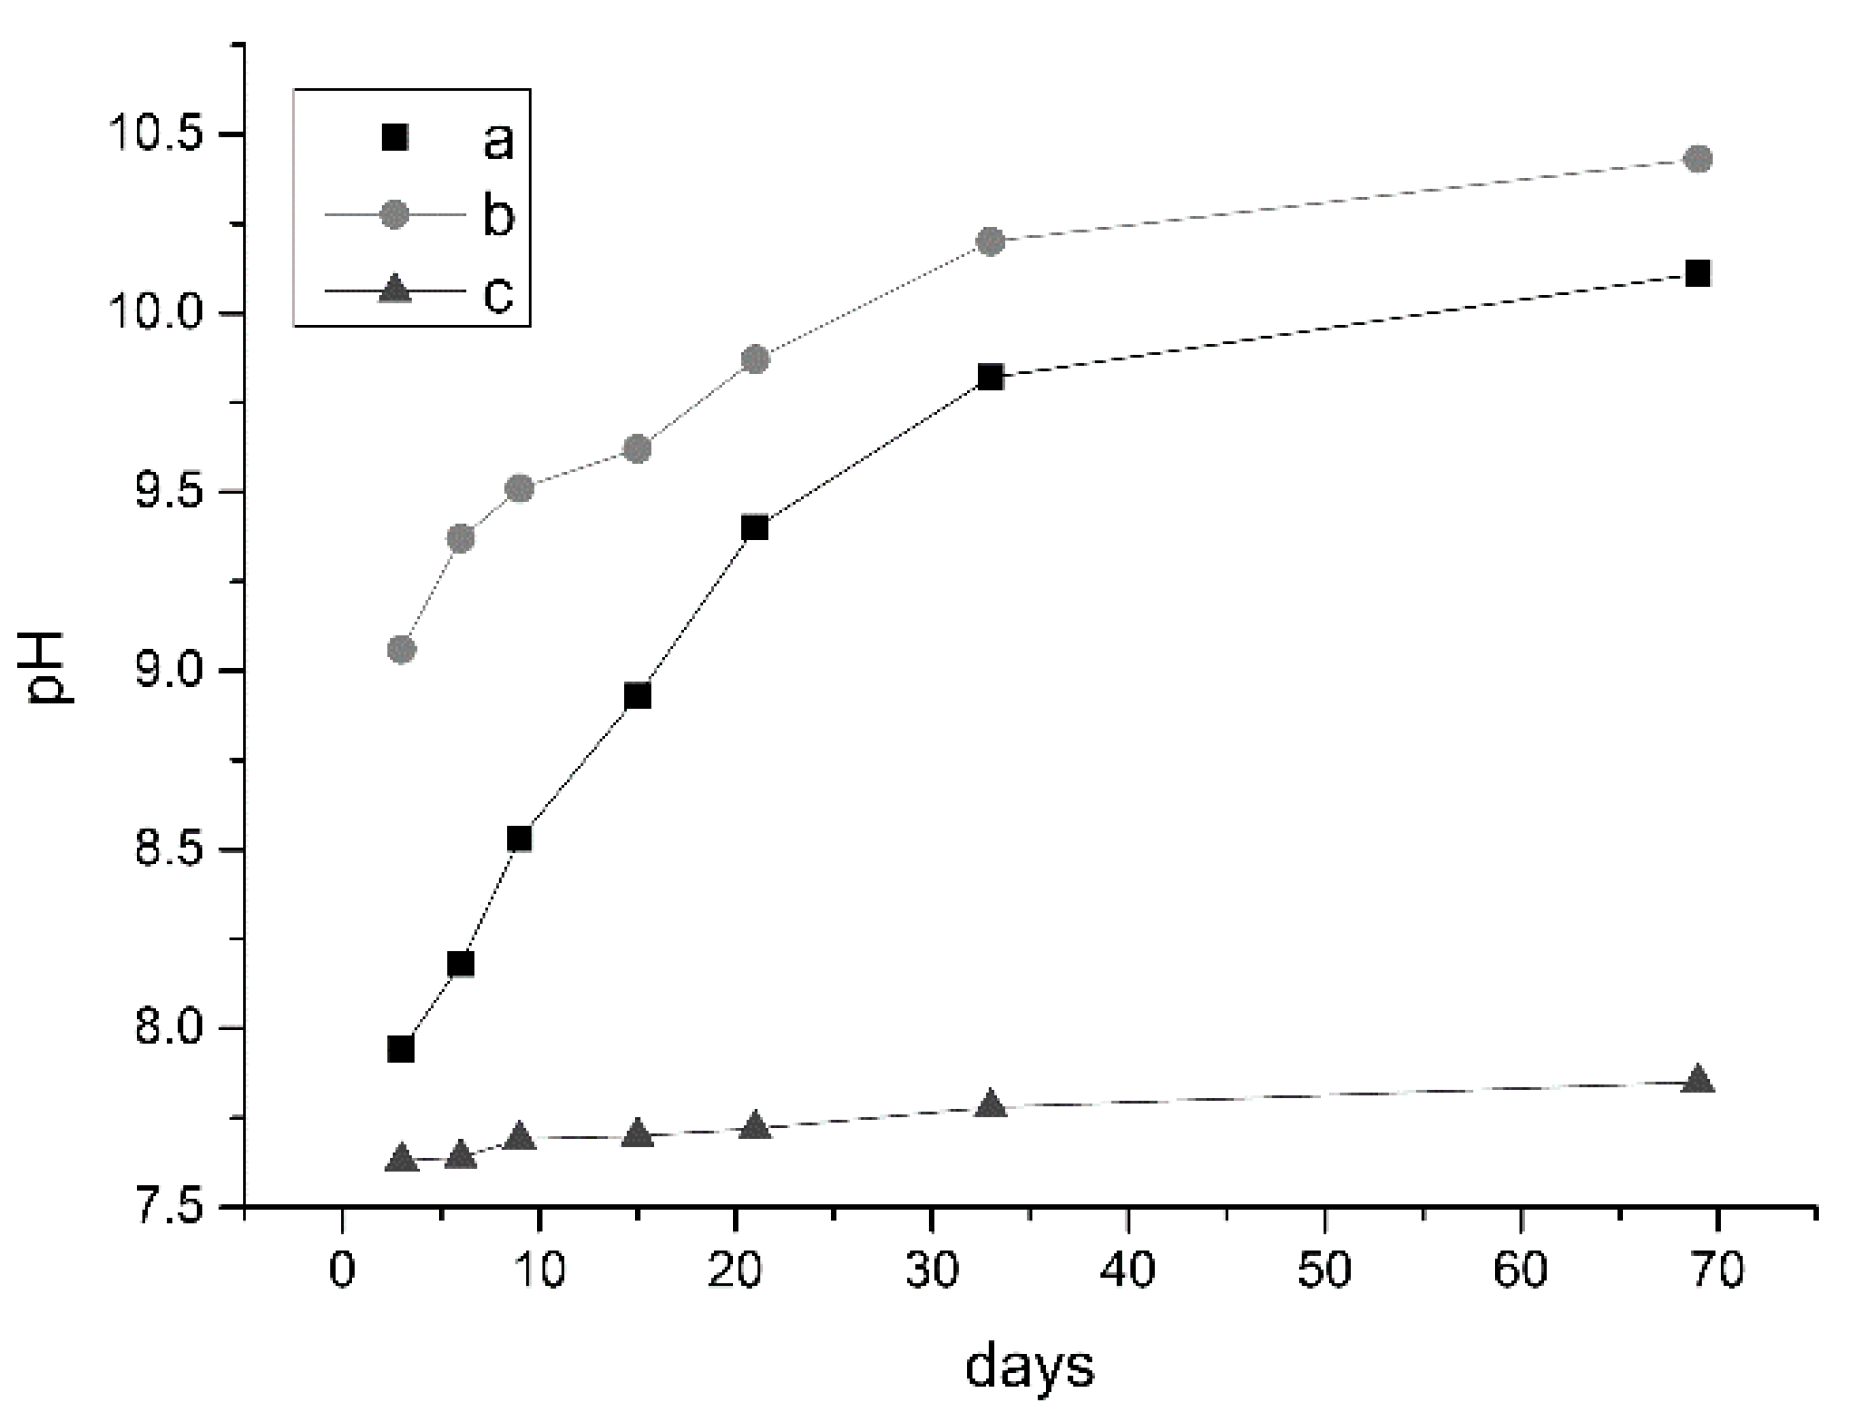
Figure 3 shows the change in pH over immersion time. It was evident that the pH of the oil shale reached its maximum when it was heated to 300 °C. As the immersion time increased, the pH value increased but the rate of increase decreased over time. The change in pH of water samples with oil shale heated to 500 °C was similar to the pH change of water samples with oil shale heated to 300 °C. The pH change of water samples with unheated oil shale was the least; pH increased with time, but the rate was very slow and almost unchanged; the average pH was 7.72.
The pH of the liquid with oil shale heated to 300 °C was the most alkaline and carbonate (Figure 4). Higher concentrations of CO32− promoted hydrolysis reactions and increased the OH−. CO32− was not detected in the liquids with unheated oil shale and oil shale heated to 500 °C; however, the HCO3− content of both liquids were very high, with an average content of 227.45 mg/L and 242.50 mg/L, respectively.
When the oil shale was heated to 300 °C, the thermal motion of carbonate minerals increased, which caused the crystal to break down and the material to change from crystalline to liquid phase. In this molten state, the carbonate minerals ionized to produce carbonate. When the oil shale was heated to 500 °C, most of the carbonates had been decomposed after the oil shale calcined at 500 °C; however, since the porosity of the oil shale became larger after calcination, the remaining small amount of soluble carbonate was separated out more easily. In addition, carbon dioxide from the surrounding air could also enter the sample. Under the corresponding pH conditions obtained from the experiment, bicarbonate was predominant, and slightly higher than in unheated oil shale.
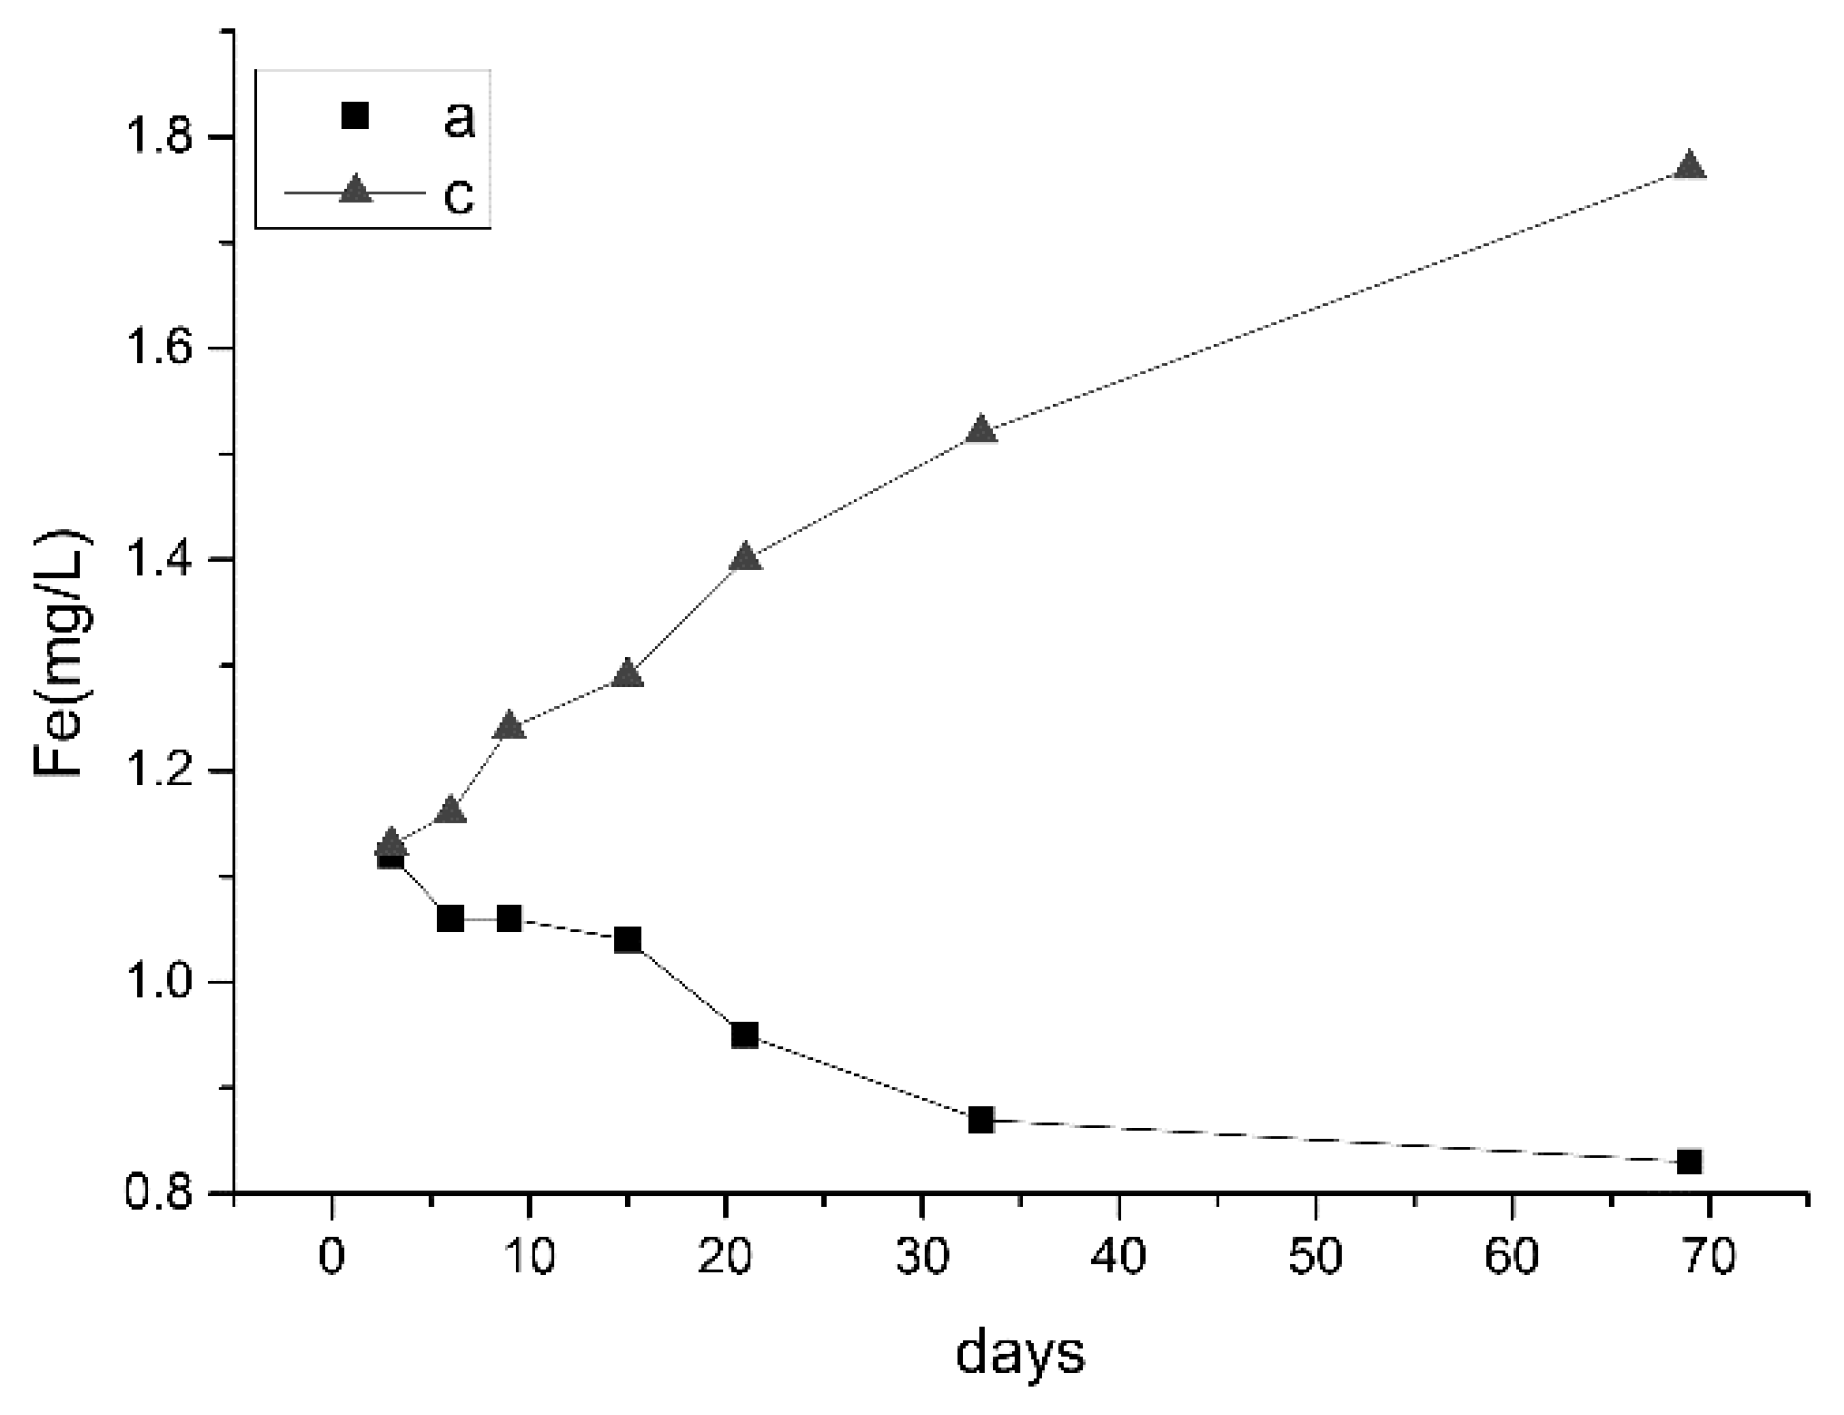
The liquid with oil shale heated to 500 °C did not contain iron ions; the other two liquids contained iron ions. This can be attributed to the decomposition of iron-containing compounds at high temperatures [24]. Oxidation may occur in iron cement at high temperature. Ferric ion concentration curves of liquids with oil shale heated to 300 °C and unheated shale is shown in Figure 5.
The liquid with unheated oil shale contained more iron ions than the liquid with oil shale heated to 300 °C. The concentration of iron ions in the liquid with unheated oil shale gradually built up over time. However, the concentration of iron ions in the liquid with oil shale heated to 300 °C decreased continuously with time. This is related to the pH of the soaking liquid and the type and content of iron-containing compounds in the oil shale. With continuous increase in pH, iron ions in the solution generate precipitates or ferrites, and decrease in concentration.
Fe3+ + 3OH− = Fe(OH)3 ↓
Fe(OH)3 + 3OH− = Fe(OH)63−
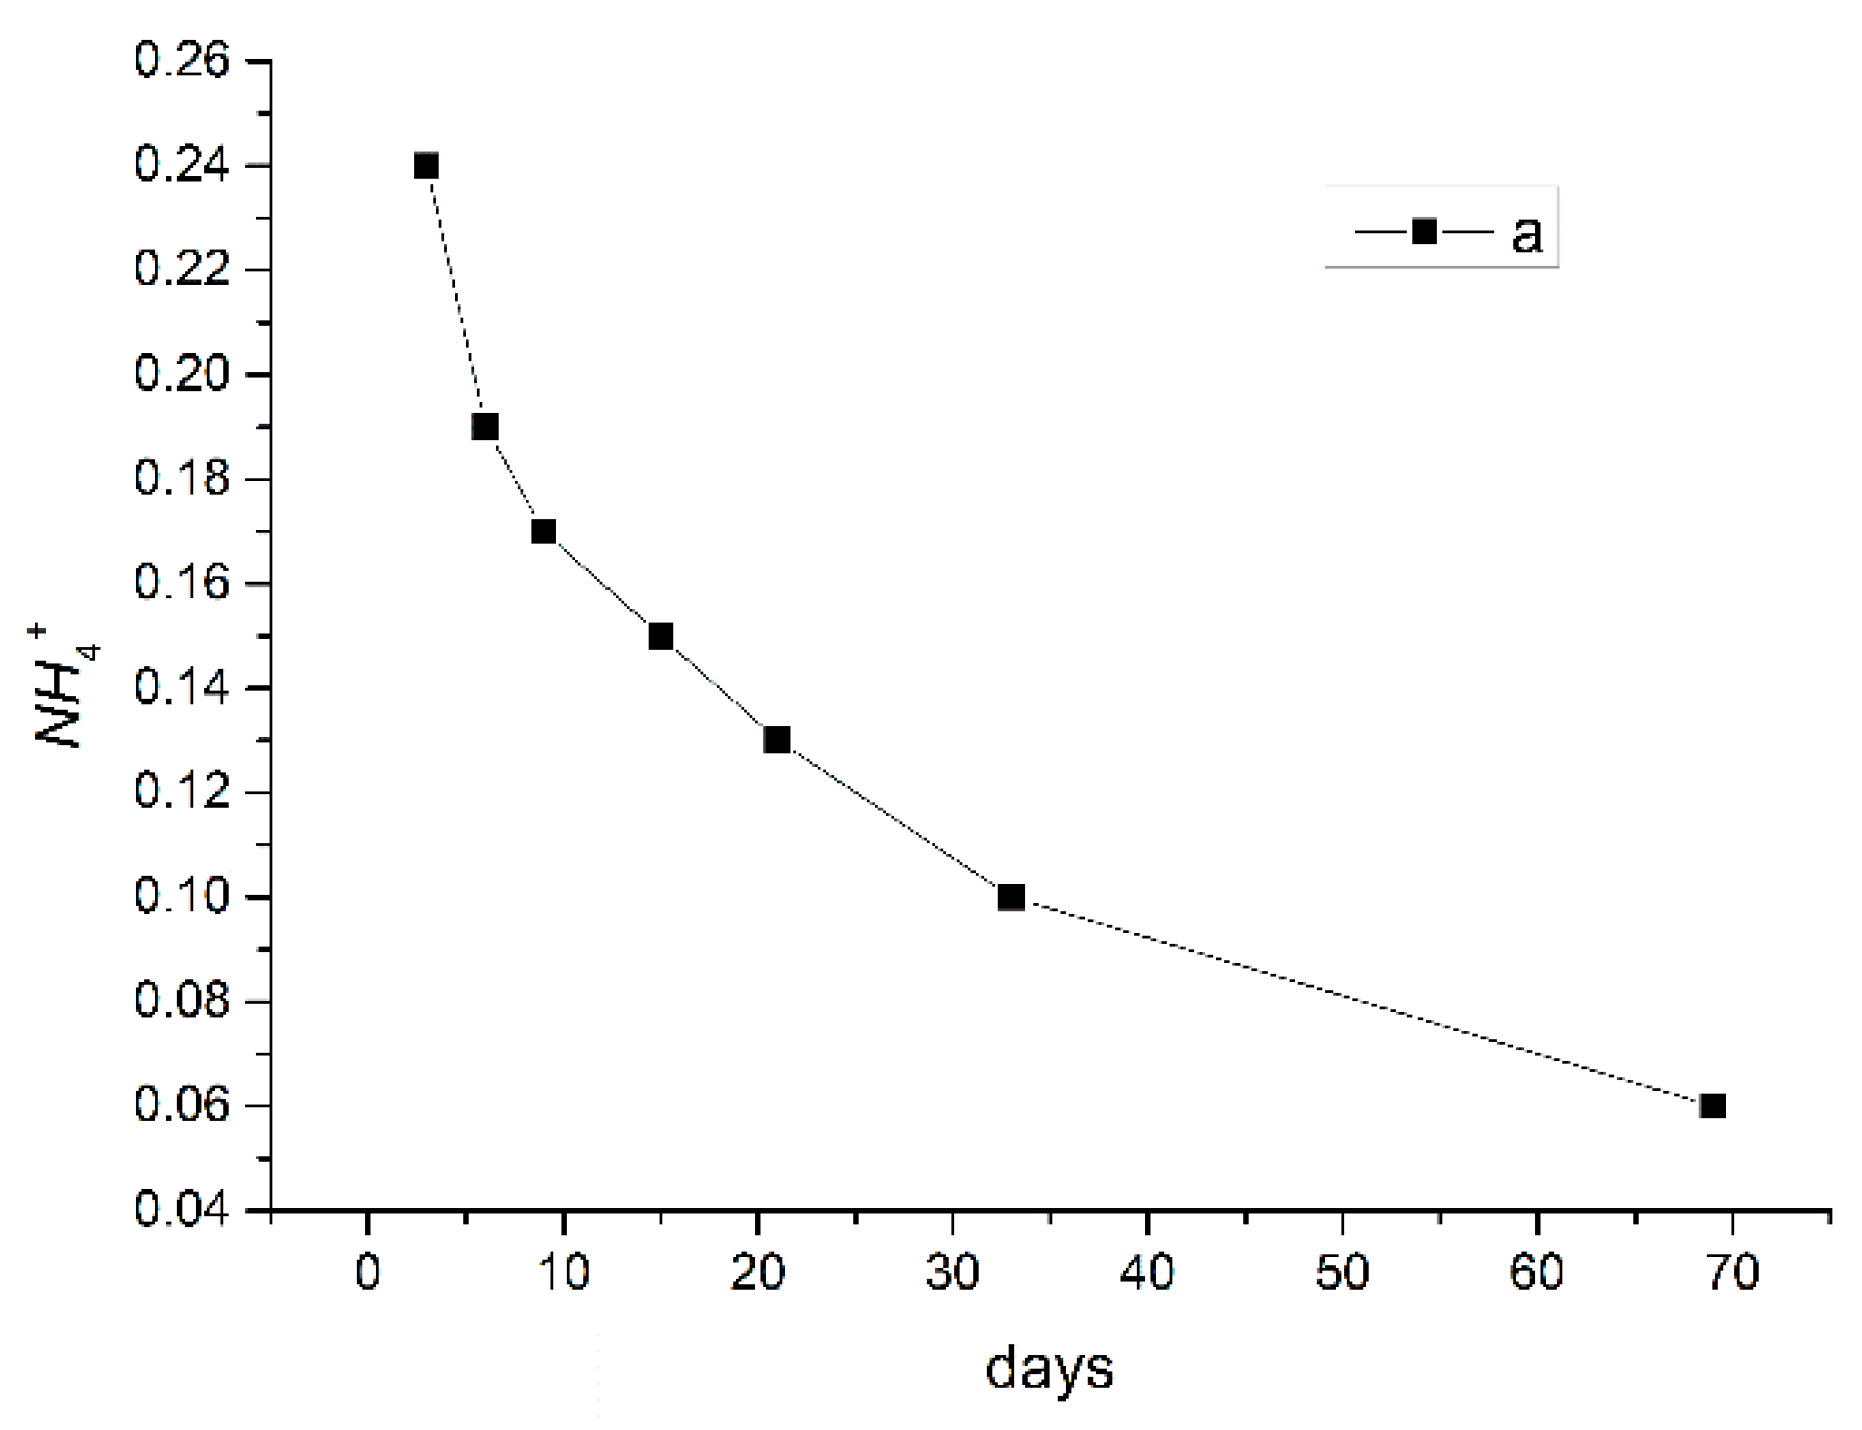
Concentration of ammonium ions in the liquid with oil shale heated to 300 °C changed over time, as shown in Figure 6. When the oil shale was heated to 300 °C, organic compounds containing nitrogen decomposed into simpler nitrogenous organic matter. Under anaerobic conditions, the nitrogenous organic matter further decomposed into ammonium [23,24,25]. When the oil shale was heated to 500 °C, organic matters were decomposed and nitrogenous compounds turned into NOx and discharged. Hence, the liquid with oil shale heated to 500 °C did not contain ammonium ions.
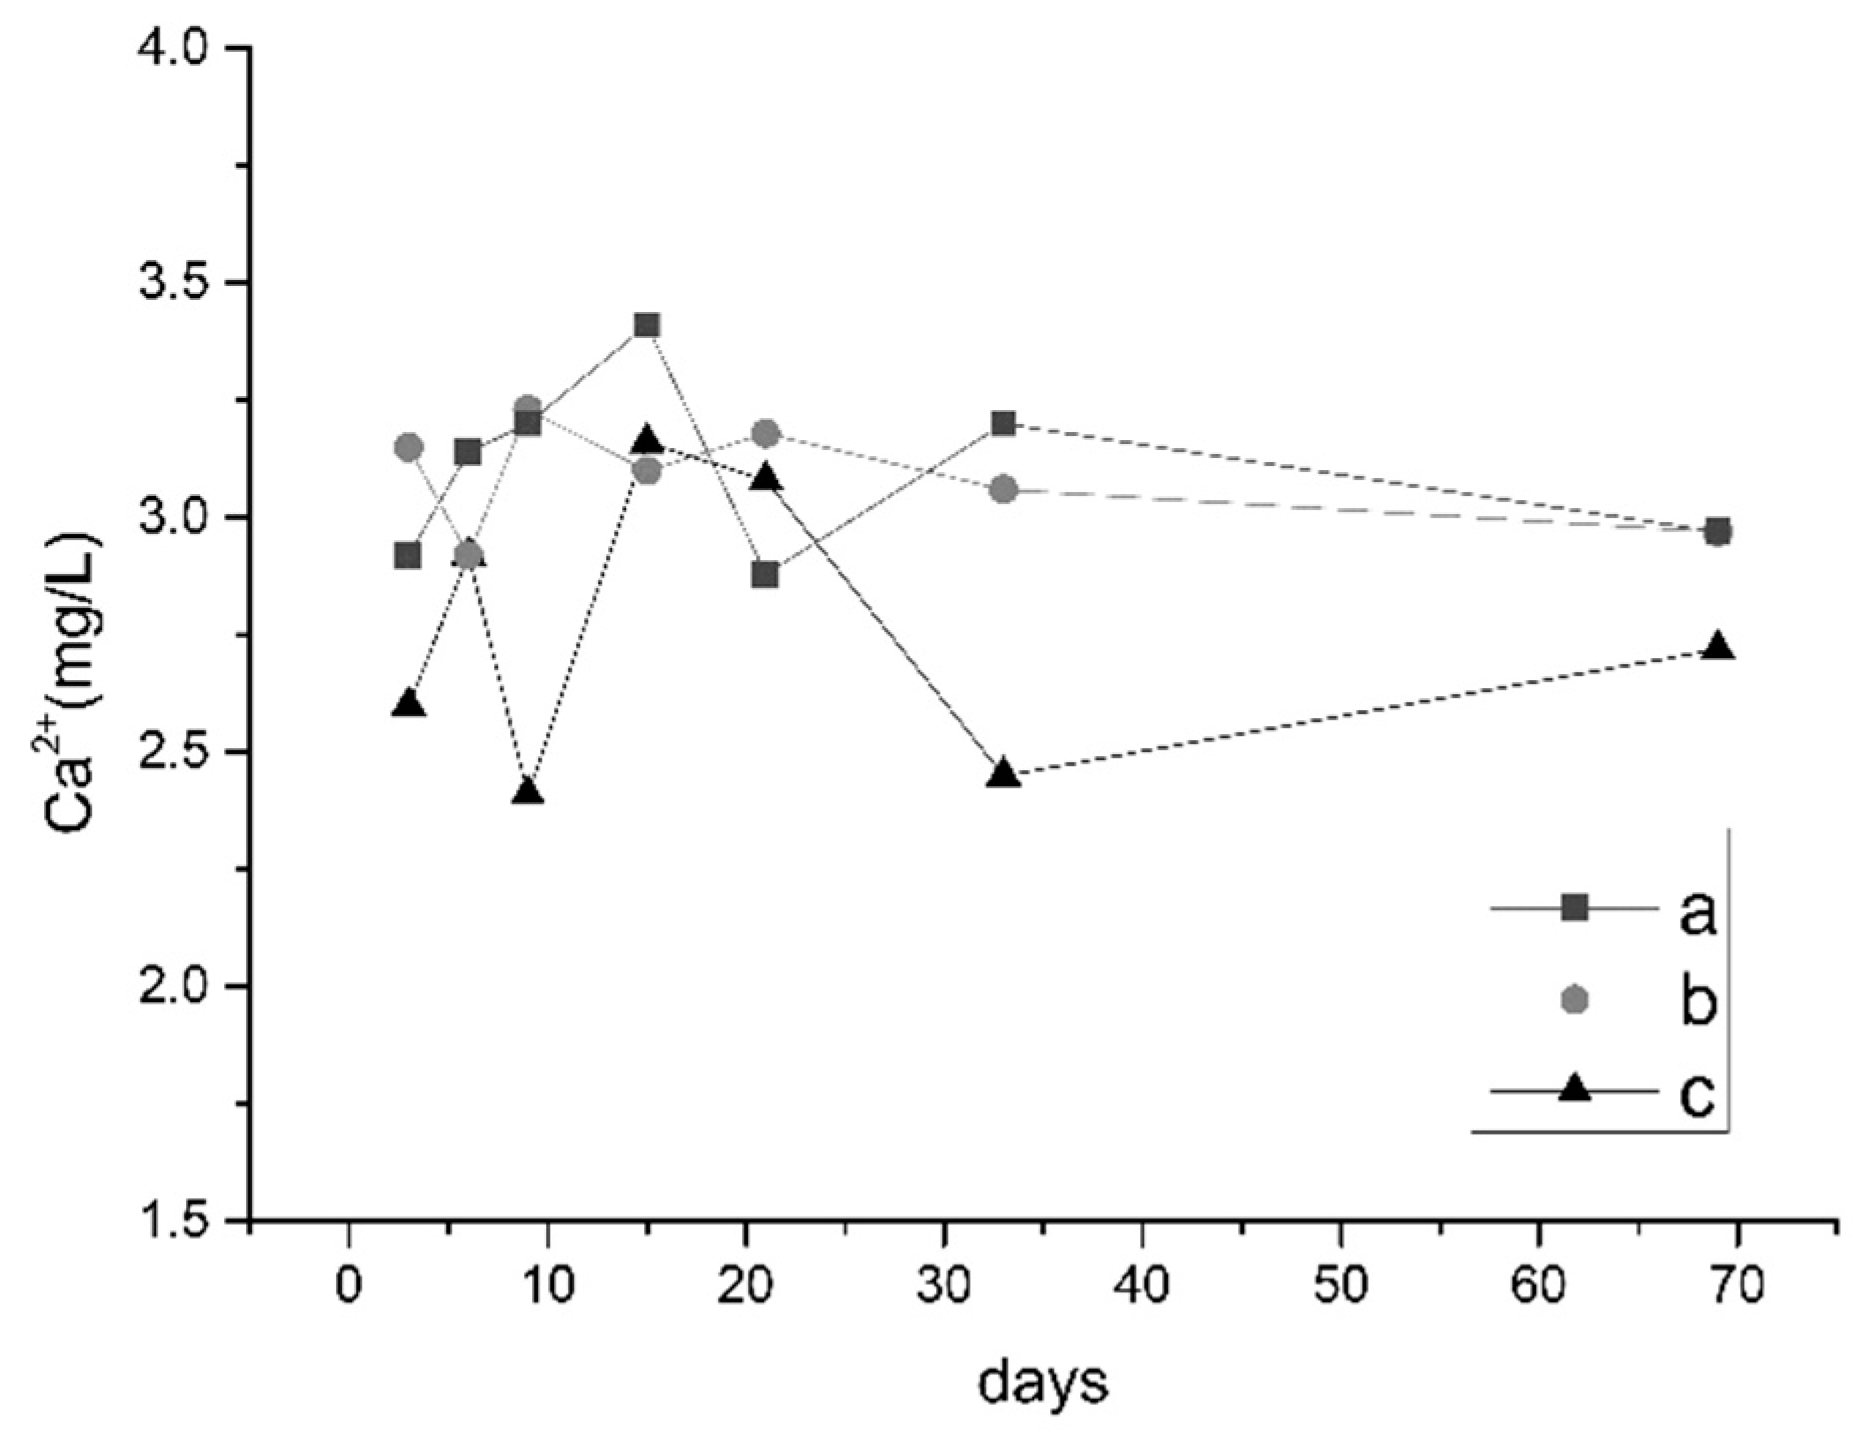
Figure 7 shows that the content of Ca2+ of liquids with oil shale heated to 300 °C and 500 °C changed slightly as the mineral oil shale can only pyrolyze at temperatures over 500 °C [25].
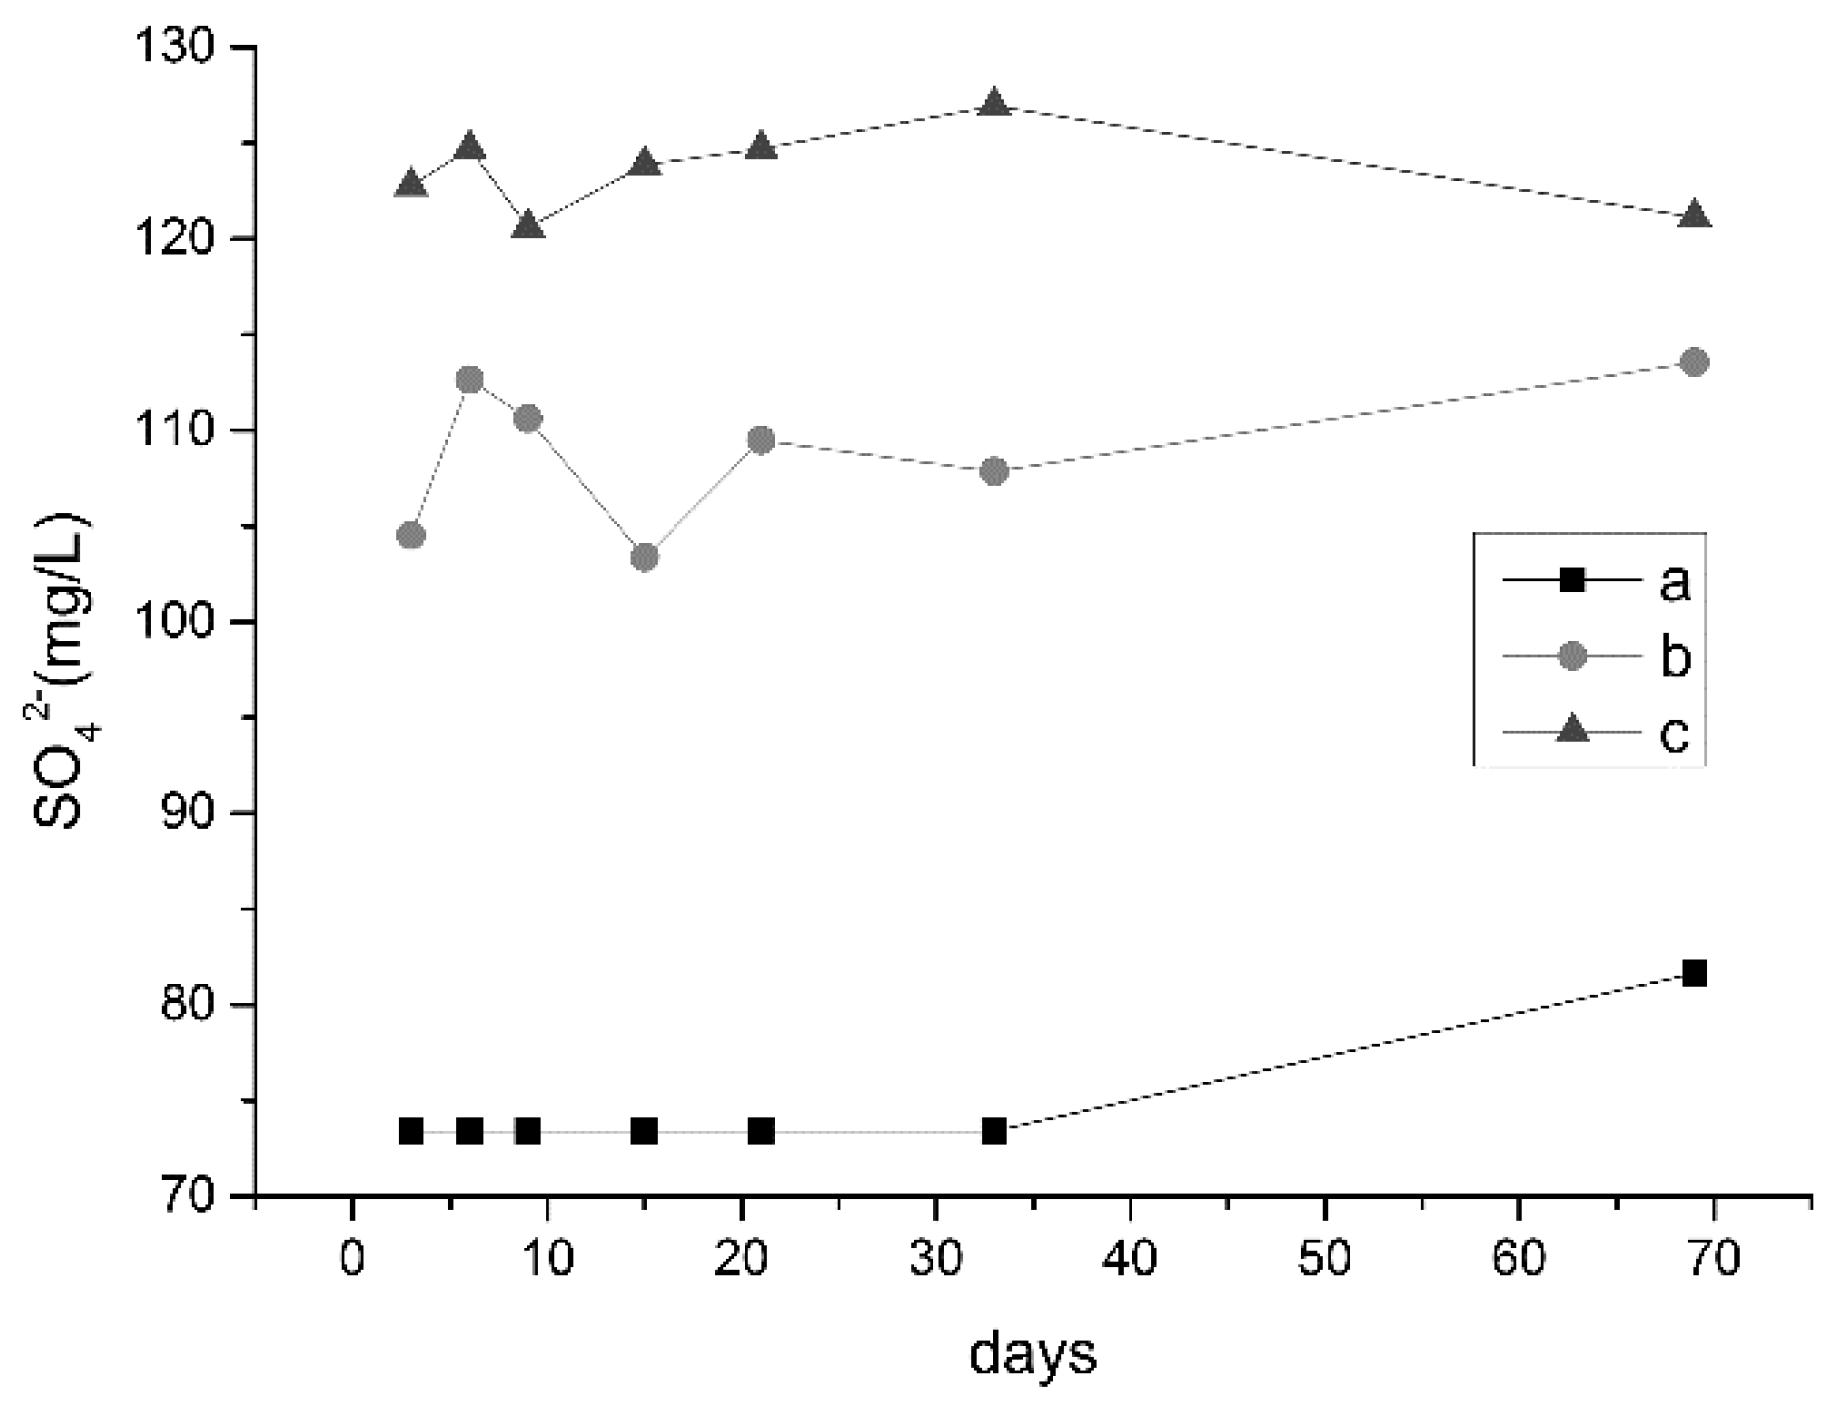
Acid roots were measured in the three samples and Figure 8 shows their content curve over time. The concentration of SO42− in the liquid with oil shale heated to 300 °C was the lowest, with an average concentration of 77.26 mg/L.
Brandt found that kerogen decomposed into a mixture of oil, HC gas, and carbon-rich shale coke that adheres to shale particles (as well as CO2, water vapor, and trace gases) [26]. Kerogen decomposition rates were dependent on temperature: 90% decomposition occurred within 5000 min at 370 °C and within 2 min at 500 °C [26]. The content of organic matter in the oil shale after 500 °C pyrolysis was less, the oil shale after pyrolysis at 300 °C was not completely pyrolyzed, and the organic matter content was higher. Sulfate and hydrocarbons reacted with sulfate thermochemical reduction (TSR) to reduce sulfate minerals to produce acid gases such as H2S and CO2 [27]. Therefore, the content of SO42− in the water-soaked oil shale samples after 300 °C pyrolysis was the lowest. This also explains the high carbonate content in water-soaked oil shale after 300 °C pyrolysis.
3.2.2. Changes in Organic Content
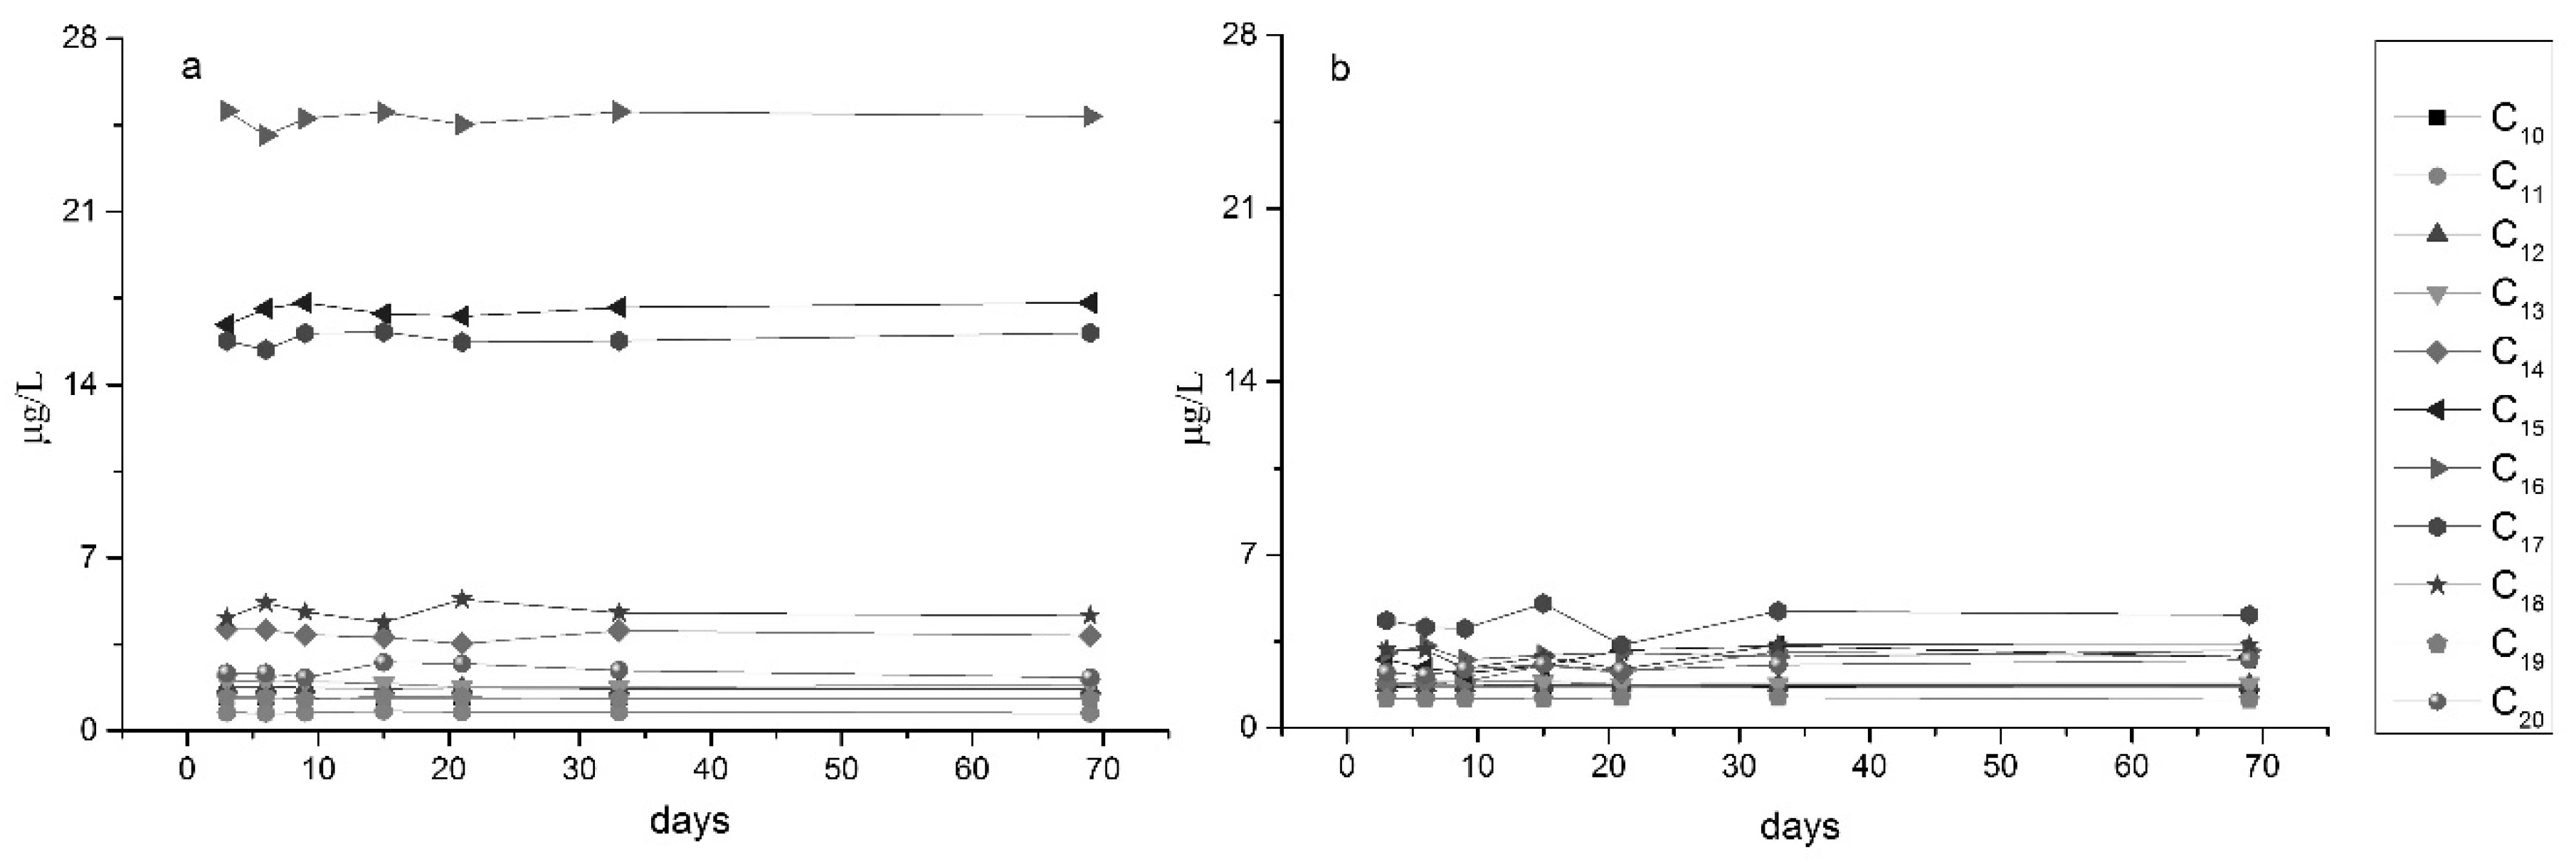
Figure 9 shows the changes in C10–C20 content in the tested samples. The content of C10–C20 in the 300 °C sample was the highest; especially for C15, C16, and C17, which were over 15%. When heated to 300 °C, kerogen in the oil shale was in the warm-up phase and at the beginning of decomposition. The rock samples in this stage are rich in organic matter. When heated to 500 °C, kerogen has been pyrolyzed and organic matter content in the samples has decreased.
Qiu [25] had also studied the effect of three treatment methods on organic matter content. The soaked oil shale solution heated to 300 °C had the largest organic matter content, followed by unheated oil shale. The soaked oil shale solution heated to 500 °C had the smallest organic matter content.
The composition of the samples did not change significantly over time. Hydrocarbon contents reached their maximum initial concentration within three days indicating that the C10–C20 hydrocarbons release process was shorter than three days.
3.2.3. Analysis of Water Quality Changes
Water is produced during retorting (up to 1.5% of the raw shale). Further, the retort water may contain up to 160 g/L of soluble organic carbon [28]. Both fracturing and pyrolysis during mining increases formation porosity and water absorption, and the dense oil shale layer becomes a weakly permeable or aquiferous layer. In this case, groundwater and hydraulic shale layers have a hydraulic connection and groundwater pollution can occur.
According to the Chinese “Sanitary Standards for Drinking Water” and “Quality Standards for Farmland Irrigation Water”, water with pH higher than 8.5 should not be used for either drinking or farm irrigation. After oil shale pyrolyzed, the pH of soaking water increased with soaking time. After 60 days of soaking in oil shale and heating to 500 °C, the pH of the water sample exceeded 10 and showed strong alkalinity.
When the oil shale was heated to 500 °C, iron-containing compounds in the rock were decomposed and the organic matter containing nitrogen was also completely cracked. As a result, the soaked oil shale samples did not contain iron. However, iron and ammonium in the oil shale samples were not completely pyrolyzed at 300 °C and its content did not fulfill above standards.
Large numbers of hydrocarbons were present in the water sample after oil shale thermal cracking. The content of C10–C20 in the soaked samples with oil shale heated to 300 °C was greater than in samples heated to 500 °C. Further, the hydrocarbons (C10–C20) were released in the water in less than three days. If a hydraulic connection between the oil shale layer and external aquifer exists, maximum initial concentration of hydrocarbons in the aquifer can be achieved within a short time, which pollutes the groundwater subsequently.
4. Conclusions
Changes in the physical and hydraulic properties of oil shale were tested to analyze the effect of in-situ oil shale mining. Further, changes in the chemical properties of water samples immersed with heated oil shale were tested to analyze the impact of in-situ mining on groundwater. Based on the results of the work, the following conclusions were drawn.
Porosity and water absorption of oil shale increased with increase in pyrolysis temperature. After kerogen was completely decomposed (after heating to 500 °C), the porosity of oil shale increased to 19.048%, which was 6.5 times greater than the porosity of unheated oil shale; corresponding water absorption of oil shale increased to 0.76%, 11.5 times greater than the water absorption of unheated oil shale. Permeability of rocks is a precondition for the transfer of elements and minerals from rocks into water; increase in porosity and water absorption promotes groundwater entry into the oil shale, facilitating entry of overlying and underlying water into the oil shale layer, and increase water–rock interaction.
After the oil shale was paralyzed, pH of the water samples increased with soaking time. When the oil shale sample was heated to 500 °C and soaked for 60 days, the pH of the water sample exceeded 10, exhibiting strong alkalinity.
Large amounts of hydrocarbon material were detected in the water samples. The content of C10–C20 in the water with oil shale heated to 300 °C was greater than the 500 °C sample; after a short period of time (less than three days) the content of hydrocarbons in the water samples reached its maximum initial concentration.
In short, it also affects groundwater quality around the mining area and the damage comes from two aspects. On one hand, due to the leakage of production wells to underground rock formations during the mining process, organic components in groundwater increase, including volatile materials such as benzene, toluene, etc. Additionally, volume and quality of the groundwater changes, and pH is slightly increased and becomes alkaline. Therefore, this study on the impact of in-situ exploitation of oil shale on groundwater environment provides a reliable basis for groundwater protection.
Author Contributions
Shuya Hu and Xiujuan Liang conceived the manuscript; Changlai Xiao and Xue Jiang analyzed the data; Xue Jiang collected data; Shuya Hu and Xue Jiang wrote the paper.
Acknowledgments
The authors acknowledge the support of The National Natural Science Funds of China (41572216), The Water Resources Project of Jilin Province, China (0773-1441GNJL00390), The Natural Science Funds of Jilin Province, China (20140101164JC).
Conflicts of Interest
The authors declare no conflict of interest.
References
- Wang, H.; Zhao, Q.; Liu, H. Resource Distribution and Technical Progress of Oil Shale in China; Petroleum Industry Press: Beijing, China, 2013. [Google Scholar]
- Li, S.-Y.; Ma, Y.; Qian, J.-L. Global oil shale research, development and utilization today and an overview of three oil shale symposiums in 2011. Sino-Glob. Energy 2012, 17, 8–17, (In Chinese with English Abstract). [Google Scholar]
- Guan, X.; Dong, L.-I.; Han, D.-Y. Development and utilization progress of foreign oil shale resources. Contemp. Chem. Ind. 2015, 44, 80–82, (In Chinese with English Abstract). [Google Scholar]
- Sun, P.; Liu, Z.; Bai, Y.; Xu, Y.; Liu, R.; Meng, Q.; Hu, F. Accumulation stages and evolution characteristics of oil shale and coal in the Dunhua-Mishan fault zone, Northeast China. Oil Shale 2016, 33, 203–215. [Google Scholar] [CrossRef]
- Chen, X.-F.; Gao, W.-J.; Zhao, J. Status of exploiting and utilization of oil shale in China. Clean Coal Technol. 2010, 16, 29–31. [Google Scholar]
- Jalkanen, L.; Juhanoja, J. The effect of large anthropogenic particulate emissions on atmospheric aerosols, deposition and bioindicators in the eastern Gulf of Finland Region. Sci. Total Environ. 2000, 262, 123–136. [Google Scholar] [CrossRef]
- Song, Y.; Liu, Z.; Meng, Q.; Xu, J.; Sun, P.; Cheng, L.; Zheng, G. Multiple controlling factors of the enrichment of organic matter in the upper cretaceous oil shale sequences of the Songliao basin, ne China: Implications from geochemical analyses. Oil Shale 2016, 33, 142–166. [Google Scholar] [CrossRef]
- Zhong, S.; Tao, Y.; Li, X.; Li, T.; Zhang, F. Simulation and assessment of shale oil leakage during in situ oil shale mining. Oil Shale 2014, 31, 337–350. [Google Scholar]
- McCarthy, H.E.; Cha, C.Y.; Bartel, W.J.; Burton, R.S. Development of the modified in situ oil-shale process. Aiche J. 1976, 72, 14–23. [Google Scholar]
- Liu, D.-X.; Wang, H.-Y.; Zheng, D.-W.; Fang, C.-H.; Ge, Z.-X. World progress of oil shale in-situ exploitation methods. Nat. Gas Ind. 2009, 25, 128–132, (In Chinese with English Abstract). [Google Scholar]
- Zheng, D.; Li, S.; Ma, G.; Wang, H. Autoclave pyrolysis experiments of Chinese Liushuhe oil shale to simulate in-situ underground thermal conversion. Oil Shale 2012, 29, 103–114. [Google Scholar] [CrossRef]
- Maaten, B.; Loo, L.; Konist, A.; Nesumajev, D.; Pihu, T.; Külaots, I. Decomposition kinetics of American, Chinese and Estonian oil shales kerogen. Oil Shale 2016, 33, 167–183. [Google Scholar] [CrossRef]
- Qian, J.; Yin, L. Oil Shale—Petroleum Alternative; Petroleum Industry Press: Beijing, China, 2010. [Google Scholar]
- Brandt, A.R. Converting oil shale to liquid fuels: Energy Inputs and greenhouse gas emissions of the shell in situ conversion process. Environ. Sci. Technol. 2008, 42, 7489–7495. [Google Scholar] [CrossRef] [PubMed]
- Tang, D. Rock and Soil Engineering; Geology Publishing House: Beijing, China, 1985. (In Chinese) [Google Scholar]
- Zhou, K.; Sun, Y.-H.; Li, Q.; Guo, W.; Lyu, S.-D.; Han, J. Experimental research about thermogravimetric analysis and thermal physical properties of Nong’an oil shale. Glob. Geology 2016, 35, 1178–1184. (In Chinese) [Google Scholar]
- Wang, W.; Ma, Y.; Li, S.; Shi, J.; Teng, J. Effect of temperature on the EPR properties of oil shale pyrolysates. Energy Fuels 2016, 30, 830–834. [Google Scholar] [CrossRef]
- Decora, A.W.; Kerr, R.D. Processing use, and characterization of shale oil products. Environ. Health Perspect. 1979, 30, 217–223. [Google Scholar] [CrossRef] [PubMed]
- Han, X.-X.; Jiang, X.-M.; Cui, Z.-G.; Yu, L.-J. Evolution of pore structure of oil shale particles during combustion. Proc. Chin. Soc. Electr. Eng. 2007, 27, 26–30. [Google Scholar]
- Jiang, Q. Study on Physical and Chemical Properties of Oil Shale in Huadian City; Northeast Electric Power University: Jilin, China, 2006. (In Chinese) [Google Scholar]
- Meng, Q. Research on Petrologic and Geochemical Characteristics of Eocene Oil Shale and Its Enrichment Regularity, Huadian Basin; Jilin University: Jilin, China, 2010. (In Chinese) [Google Scholar]
- Bai, F.; Sun, Y.; Liu, Y.; Guo, M. Evaluation of the porous structure of Huadian oil shale during pyrolysis using multiple approaches. Fuel 2017, 187, 1–8. [Google Scholar] [CrossRef]
- Xi, F.-Y.; Zhao, X.-E.; Cai, X. Study on kinetics of oxidation of iron sulfur compounds. Appl. Chem. Ind. 2017, 5, 825–828. (In Chinese) [Google Scholar]
- Qiu, S. Experimental Study on the Impacts of Oil Shale in-Situ Pyrolysis on Groundwater Hydrochemical Characteristics; Jilin University: Jilin, China, 2016. (In Chinese) [Google Scholar]
- Song, W.N.; Dong, Y.L.; Zhou, G.J.; Ding, H.X.; Li, Z. Research summarization of structure-constitute and application of oil shale. J. Heilongjiang Hydraul. Eng. 2010, 3, 20. (In Chinese) [Google Scholar]
- Ying, H.-H.; Zhang, Z.-P.; Wu, Y.-B. Study on influence factors of acid solubility of fracturing proppant. Liaoning Chem. Ind. 2015, 44, 1052–1055, 1065. (In Chinese) [Google Scholar]
- Zhu, G.-Y.; Zhang, S.-C.; Liang, Y.-B.; Li, J. Alteration of thermochemical sulfate reduction to hydrocarbons. Acta Pet. Sin. 2005, 26, 48–52. [Google Scholar]
- Routson, R.C.; Wildung, R.E.; Bean, R.M. A Review of the environmental impact of ground disposal of oil shale wastes. J. Environ. Qual. 1979, 8, 14–19. [Google Scholar] [CrossRef]
Figure 1.
Average porosity of oil shale heated to different temperatures (Pa, Pb, Pc, respectively, represent oil shale heated to 300 °C, oil shale heated to 500 °C, and unheated oil shale).
Figure 1.
Average porosity of oil shale heated to different temperatures (Pa, Pb, Pc, respectively, represent oil shale heated to 300 °C, oil shale heated to 500 °C, and unheated oil shale).

Figure 2.
Average water absorption of oil shale at different heating temperatures (Wa, Wb, Wc, respectively, represent oil shale heated to 300 °C, oil shale heated to 500 °C, and unheated oil shale).
Figure 2.
Average water absorption of oil shale at different heating temperatures (Wa, Wb, Wc, respectively, represent oil shale heated to 300 °C, oil shale heated to 500 °C, and unheated oil shale).

Figure 3.
Change in pH over immersion time (a, b, and c, respectively, represent the pH of the liquids with oil shale heated to 300 °C, oil shale heated to 500 °C, and unheated oil shale).
Figure 3.
Change in pH over immersion time (a, b, and c, respectively, represent the pH of the liquids with oil shale heated to 300 °C, oil shale heated to 500 °C, and unheated oil shale).

Figure 4.
Concentration curves of CO32− and HCO3− contents in sample liquids (a, b, and c, respectively, represent HCO3− content of liquids with oil shale heated to 300 °C, oil shale heated to 500 °C, and unheated oil shale; a1 represents the CO32− content of liquids with oil shale heated to 300 °C).

Figure 5.
Ferric ion concentration curves of sample liquids (a and c, respectively, represent the ion concentration in the liquids with oil shale heated to 300 °C and unheated oil shale).
Figure 5.
Ferric ion concentration curves of sample liquids (a and c, respectively, represent the ion concentration in the liquids with oil shale heated to 300 °C and unheated oil shale).

Figure 6.
Ammonium ion concentration curve of liquids with oil shale heated to 300 °C.

Figure 7.
Ca2+ concentration curve of sample liquids (a, b, and c, respectively, represent the Ca2+ content in the liquids with oil shale heated to 300 °C, oil shale heated to 500 °C, and unheated oil shale).
Figure 7.
Ca2+ concentration curve of sample liquids (a, b, and c, respectively, represent the Ca2+ content in the liquids with oil shale heated to 300 °C, oil shale heated to 500 °C, and unheated oil shale).

Figure 8.
SO42− concentration curves of sample liquids (a, b, c, respectively, represent liquids with oil shale heated to 300 °C, oil shale heated to 500 °C, and unheated oil shale).
Figure 8.
SO42− concentration curves of sample liquids (a, b, c, respectively, represent liquids with oil shale heated to 300 °C, oil shale heated to 500 °C, and unheated oil shale).

Figure 9.
Content of C10–C20 in liquid for (a) oil shale heated to 300 °C, and (b) oil shale heated to 500 °C.
Figure 9.
Content of C10–C20 in liquid for (a) oil shale heated to 300 °C, and (b) oil shale heated to 500 °C.


Table 1.
Composition-matching statistics of water samples with oil shale heated to 300 °C.
| Time (min) | 14.16 | 15.29 | 18.67 | 21.35 | 24.04 | 25.01 | 27.84 |
|---|---|---|---|---|---|---|---|
| Component Chemical formula | C14H22O | C19H41NO3S | C18H24O | C7H5NS2 | C28H38O10 | C30H42Cl2N4O3 | C30H50 |
| Match probability | 50.90% | 52.90% | 52.70% | 65.50% | 57.00% | 50.20% | 57.90% |
Table 2.
Composition-matching statistics of water samples with oil shale heated to 500 °C.
| Time (min) | 11.99 | 12.62 | 13.82 | 14.82 | 14.96 | 15.97 | 23.18 |
|---|---|---|---|---|---|---|---|
| Component Chemical formula | C13H28 | C14H30 | C15H32 | C15H32 | C15H32 | C16H34 | C18H35NO |
| Match probability | 77.50% | 75.90% | 73.80% | 80.30% | 73.90% | 78.90% | 78.60% |
© 2018 by the authors. Licensee MDPI, Basel, Switzerland. This article is an open access article distributed under the terms and conditions of the Creative Commons Attribution (CC BY) license (http://creativecommons.org/licenses/by/4.0/).
Share and Cite
MDPI and ACS Style
Hu, S.; Xiao, C.; Jiang, X.; Liang, X. Potential Impact of In-Situ Oil Shale Exploitation on Aquifer System. Water 2018, 10, 649. https://doi.org/10.3390/w10050649
AMA Style
Hu S, Xiao C, Jiang X, Liang X. Potential Impact of In-Situ Oil Shale Exploitation on Aquifer System. Water. 2018; 10(5):649. https://doi.org/10.3390/w10050649
Chicago/Turabian StyleHu, Shuya, Changlai Xiao, Xue Jiang, and Xiujuan Liang. 2018. "Potential Impact of In-Situ Oil Shale Exploitation on Aquifer System" Water 10, no. 5: 649. https://doi.org/10.3390/w10050649
Note that from the first issue of 2016, this journal uses article numbers instead of page numbers. See further details here.