Physical Simulation of Strata Failure and Its Impact on Overlying Unconsolidated Aquifer at Various Mining Depths


1
College of Water Resources Science and Engineering, Taiyuan University of Technology, Taiyuan 030024, China
2
College of Environmental Science and Engineering, Taiyuan University of Technology, Taiyuan 030024, China
*
Author to whom correspondence should be addressed.
Water 2018, 10(5), 650; https://doi.org/10.3390/w10050650
Submission received: 24 March 2018
/
Revised: 26 April 2018
/
Accepted: 13 May 2018
/
Published: 17 May 2018
(This article belongs to the Section Hydrology)
Abstract
:Underground mining severely lowers the water table and worsens the ecological environment. To determine the mechanism influencing drawdown in unconsolidated aquifers induced by deep mining combined with overburden movement, with a view to environmental protection, physical simulations for three different depths were designed to investigate and contrast deformation and fracture distribution characteristics at diverse depths after mining. The impacts on overlying unconsolidated aquifers were then analyzed by monitoring overburden movement and ground water level data, and the deformation limit was estimated. Modeling results indicated that coal mining had different impacts on the overlying unconsolidated aquifer via various mechanisms of groundwater level reduction. The aquifer outside the fractured water-conducting zone could be affected by coal mining, and the water tables dropped rapidly. The failure and the deformation features of the aquitard floor were the key to revealing the mechanism of groundwater depletion in deep mining. The effects on aquitard decreased as the distance from the working face increased. A relationship between the strata deformation and the drawdown rate was established; that is, the rate of decline of the groundwater level did not accelerate until the maximum subsidence of the aquitard floor exceeded approximately 0.9 m, or the subsidence-bending area of the aquitard floor exceeded approximately 156 m2.
1. Introduction
Shanxi Province, a significant coal industry base in China, has afforded coal output of more than 10 billion metric tons for national economic development since the founding of the People’s Republic of China, and has contributed greatly to national energy security. However, Shanxi Province lies on the ecologically vulnerable Loess Plateau; thus, serious ecological and environmental problems arise out of the mass extensive and intensive coal exploitation, with destruction of watery environments and a huge impact on shallow groundwater [1,2,3]. Following coal extraction, there are three distinct zones of movement and hydrological responses in the overburden rock mass above the mined area in the vertical section: caved zone, fracture zone, and continuous deformation zone [4,5,6,7,8]. The fissures (voids) in the former two zones interconnect with mine workings, forming water flow channels. Therefore, the fracture zone together with the caved zone has been defined as a fractured water-conducting zone [9,10], of which maximum height is often expressed and estimated as a function of the mining height in China [8,9,10,11]. It is generally known that, in a shallow coalfield, the fractured water-conducting zone intersects the overlying Quaternary aquifers, providing unhindered passageways for groundwater flow into the mining area. The hydraulic connection not only seriously threatens mine safety, but also leads to groundwater recession, which could destroy vegetation and cause wells to dry up, so that affected locals would need to look for alternative water supplies [2,6,12,13].
In some deep coalfields, most hydrogeological engineers calculated the maximum height of a fractured water-conducting zone with empirical equations that are widely used in China [13,14], and they generally consider that underground coal excavation has a minimal effect on the Quaternary unconsolidated aquifer. However, it still lowers the water tables and even dries out wells; subsequently, several controversies have arisen between mining companies and the residents affected [6,13]. The Changcun Coal Mine is situated in the Changzhi Basin of Shanxi Province; a decrease in the groundwater supply due to coal production is a serious problem for the locals affected, resulting in disputes. These conflicts are widespread, both locally and globally [6]; therefore, the underlying impacts of coal mining on groundwater are one of great significant concerns both domestically and internationally. Moreover, “coalmining with water resource conservation” was popularized and applied in arid and semi-arid regions of North western China in 2014 [11]; this is different from a previous concept, “flood control of mining”, because slight but continuing leakage causes significant damage to the natural environment, although it does not affect mine safety [15].
In recent decades, assessments have been conducted on the influence of underground mining on the overlying aquifer. The overlying aquifers are affected by several different mechanisms: the groundwater table is lowered directly by drainage to the mine and indirectly by hydraulic gradient, ground subsidence, and ground movement. However, these studies have tended to emphasize a relationship between the water-conducting fractures and the position of the aquifers, focusing on aquifers within the scope of the fractured water-conducting zone rather than the areas outside [14,16]. Other hydrological responses from several case studies have been investigated [6,10,17,18,19], and the impacts of deep mining on the overlying aquifers were assessed using various methods [19,20,21]. Although several studies were devoted to the influence of coal mining on groundwater, less attention has been given to strata failure and deformation. Based on the importance of mining beneath aquifers and water bodies, a considerable amount of research has been performed on the fracture development and the failure characteristics of the mining overburden strata under unconsolidated aquifers, mainly from the aspects of mining safety and mine life extension [12,22,23,24,25]; some results were used to derive empirical relations that allowed predictions of the height of fractured water-conducting zones. In other words, these study objectives were still the maximum height of the fractured water-conducting zone and the aquifers inside, which could be used to determine the height of a waterproof pillar to avoid catastrophic water inrush into the mine. Nowadays, numerical simulation is used as a tool for quantitatively studying the influence of coal mining on groundwater resources [12,22]. However, this approach rarely considers ground movement and fracture development, leading to low accuracy and little intuition. Despite a great deal of work having been done to date, more studies need to be conducted to ascertain the effects of deep underground mining on overlying unconsolidated aquifer combined with overburden movement and deformation.
The purpose of this study is to determine the mechanism influencing the groundwater level drop in the overlying unconsolidated aquifer caused by deep coal extraction, and establish a relationship between strata deformation and drawdown rate from the perspective of ecological environment protection. This paper describes three physical models designed using similar materials at three different depths; and the deformation, the fracture distribution, and the water table depression for the different models are compared and investigated. The impacts on the groundwater in the overlying unconsolidated aquifer were then analyzed by monitoring data on the overlying strata movement and deformation. These research results could benefit hydrogeological consultants and engineers, and support “coal mining with water resource conservation” techniques.
2. Description of Study Area
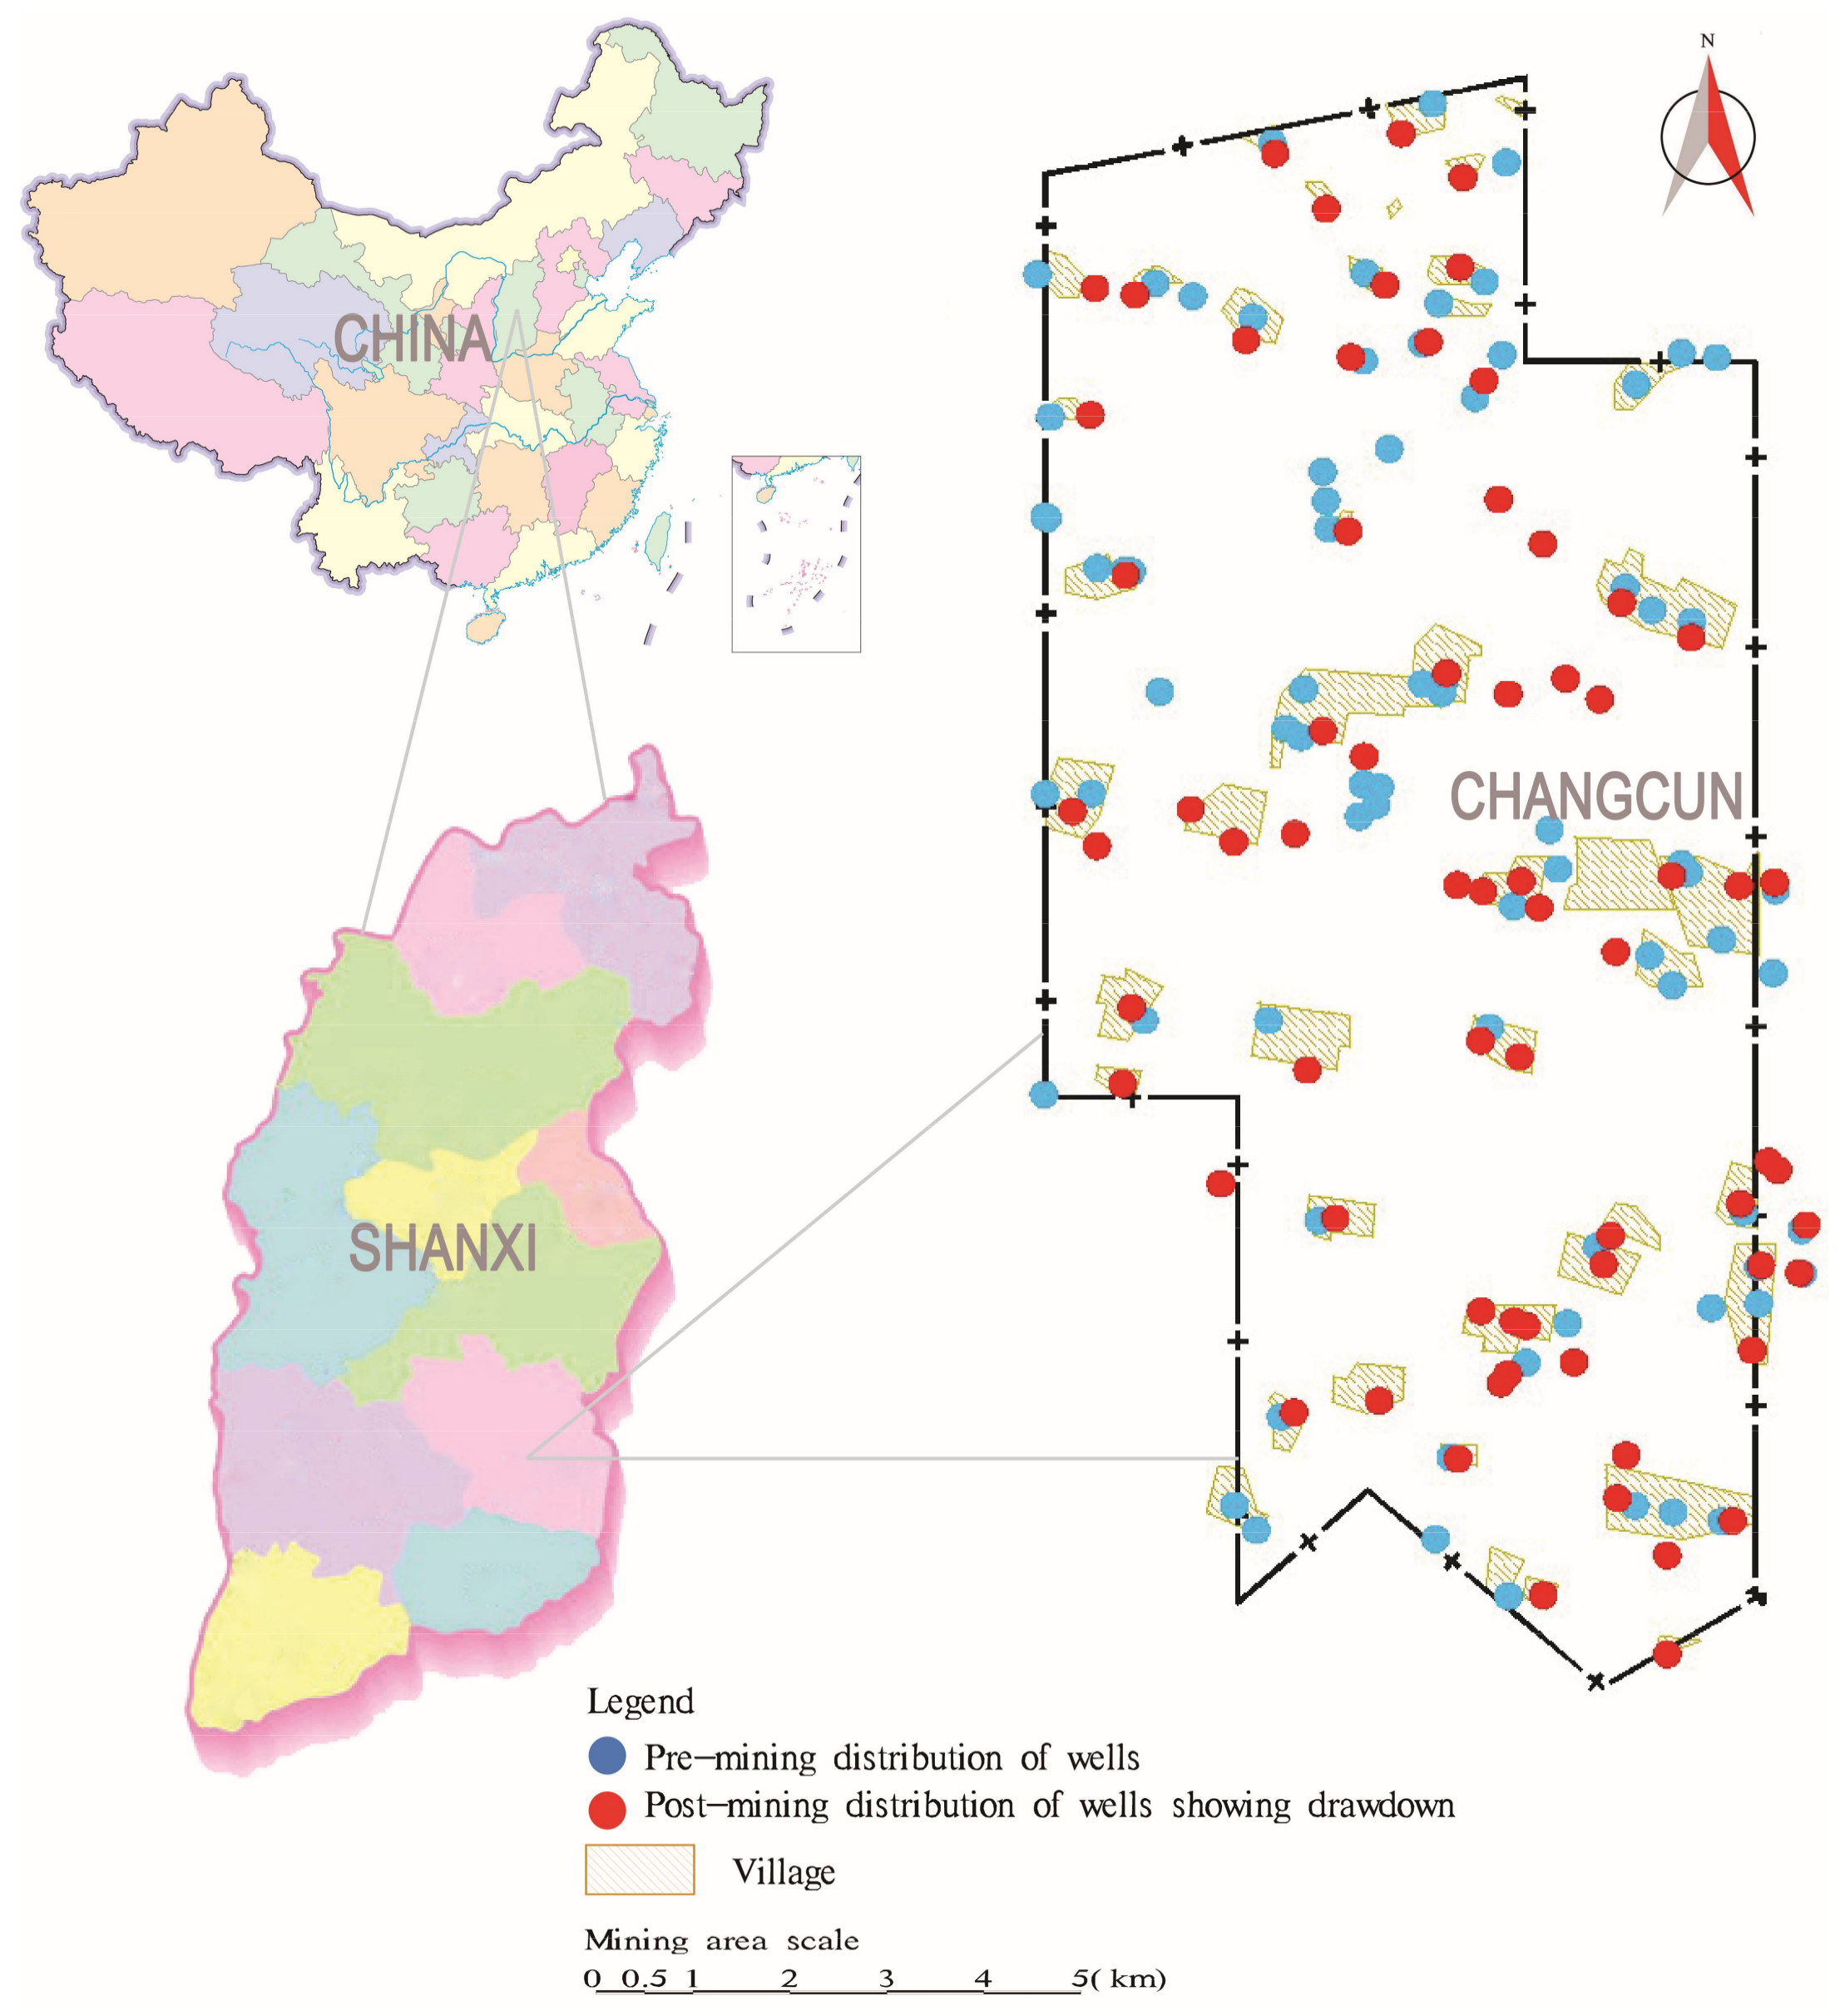
Changcun Coal Mine is located in the western area of the Changzhi Basin, which has a very dry climate with an average rainfall of 594.80 mm/year, but the evaporation exceeds 1738.60 mm/year. The colliery is widely covered with heavy loess belonging to the Cenozoic era, where the Quaternary strata are 0–132 m and have gently rolling topography. The coal measures are composed of Shanxi formation and Taiyuan formation of the Permian upper Paleozoic. Coal seam No. 3 is currently being mined, and the thickness of the overlying bedrock is 150–190 m.
This coal mining area contains approximately 50 villages; however, there is a shortage of water supply. The main overlying aquifers include the Quaternary unconsolidated aquifer, the Permian rock weathering zone aquifer, and the sandstone fissure aquifer. Their specific yields are 1.31–16.66 L/(s·m), 0.0866 L/(s·m), and 0.0556–0.253 L/(s·m), respectively, and the hydraulic conductivity of the Permian sandstone fissure aquifer is 2.05–3.88 m/day. Among these aquifers, the sandstone and the weathering zone aquifers were poor in water and the top aquifer exhibited strong water-yielding property. Only one aquifer perched on Quaternary alluvium is utilized for domestic groundwater supplies, and this is an unconsolidated deposit. The unconsolidated confined porous aquifer, which has a thickness of 10–56 m and consists of siltstone, fine sand, sandy clay, and gravel layers, has a specific yield of 1.31–16.66 L/(s·m) and a water level of +927.29 m to +943.74 m; it is enclosed by an aquitard consisting of silty clay layers of various thicknesses, whose hydraulic conductivity is 7.39 × 10⁻⁵ cm/s. This water supply is of crucial importance to residents.
According to a survey, and contrasted with pre-mining, the overall water level of residential wells had declined, as shown in Figure 1. Most of the shallow wells (10–20 m) showed a significant water reduction or had even dried up. To this end, some residents had to dig deeper wells every year, and other people rebuilt a deep well at a new site because the original wells were waterless and abandoned, with residents living near the surface plant being provided for from a centralized water supply. The loss of water from the Quaternary unconsolidated aquifers meant that residents living in the mining district and surrounding areas encountered serious difficulties concerning domestic water provision.
3. Physical Simulation Experimental Methods
A physical simulation experiment is an effective method for observing the overburden failure directly and is widely applied [26]. The quantitative or qualitative movement and deformation of overlying strata rooted in underground mining have been successfully simulated [9]. The experiments were designed to directly show the complex impact of deep underground mining on groundwater.
3.1. Geological Background
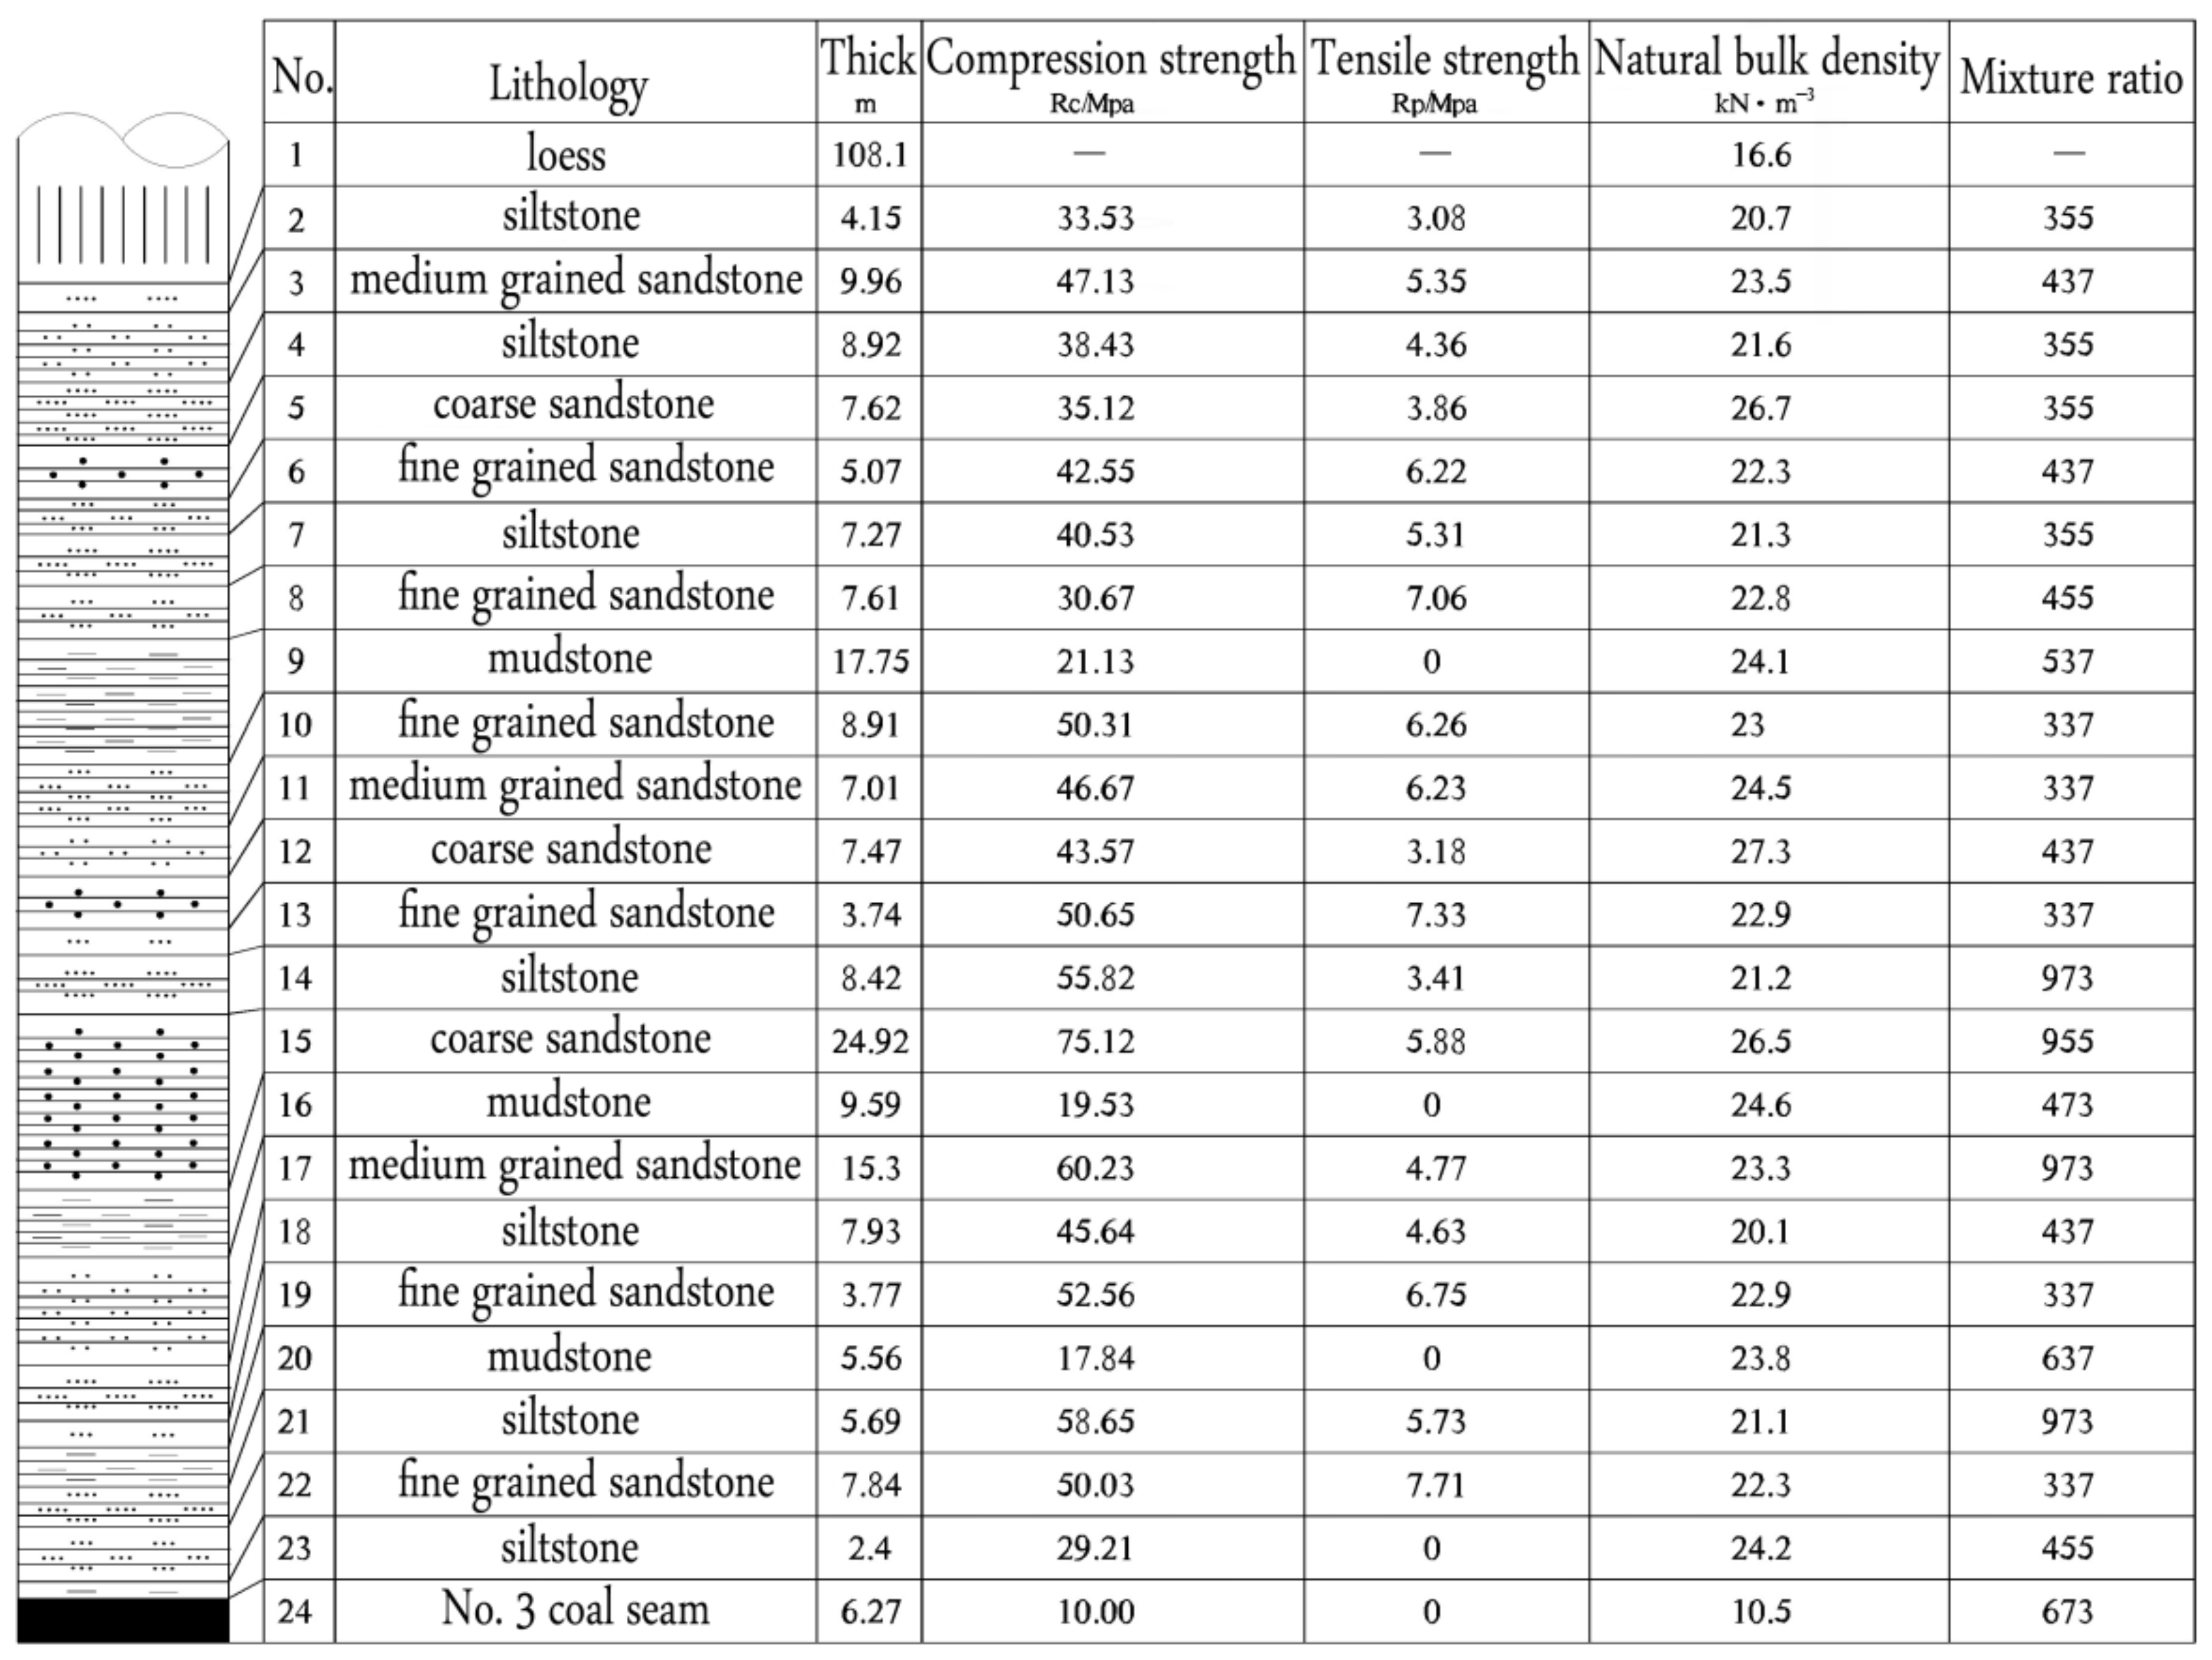
In this study, the physical modeling experiments took the S6–9 panel of Changcun colliery as the geological prototype. The length of S6–9 panel along the strike is 885 m, with a dip width of 255 m and an output of 1.84 million tons per year. The fully mechanized coal mining is performed via roof caving. Coal seam No. 3 is at a depth of 295 m, with a mean mining thickness of 6.5 m and a dip angle of 1°–3°. The immediate roof of the coalbed is grayish black siltstone or shale with an average thickness of 2 m, while the main roof is fine or medium-coarse sandstone with an average thickness of 7.8 m. The mechanical parameters of the overburden strata and the coal seam are shown in Figure 2. The thicknesses of the overlying loess and bedrock are 108.1 m and 186.9 m, respectively. The average thicknesses of the unconsolidated aquifer and the aquitard at the bottom of the loess are approximately 14 m and 16 m, respectively.
3.2. Meterials and Methods
3.2.1. Physical Model
For the purposes of the experiments, the geological conditions for the models were simplified to facilitate simulation and analysis. The model simplification was as follows: (1) The rock layer was flat [7]; (2) a weighted average of the rock volume weight in each layer was taken; (3) the loading of the overlying strata were uniformly and physically similar; and (4) the primary fissures of the overlying strata were negligible.
A similar large-scale simulation model was selected for achieving highly reliable measurement results. The size of the 2D model frame was 430 cm × 40 cm × 350 cm (length × width × height) in accordance with the test conditions and the size of experimental apparatus. On the basis of the similarity theory [27,28], length, time and mass are elemental physical quantities for any mechanical process. Between two similar mechanical systems, each elemental physical quantity must satisfy geometric similarity, kinematic similarity, and dynamic similarity, as well as follow Newton’s Second Law. The geometric similarity coefficient was adopted as Cl = 100 to better observe the process of rock failure and fracture development. According to the properties of the selected simulation materials and their ratios, the weighted average specific gravity of the stratum was 22.62 KN/m3 for the prototype and 14.60 KN/m3 for the model; thus, the bulk density similarity coefficient would be considered as: Cγ = 22.62/14.60 = 1.54. Based on the similarity principle [28] and the dimensional analysis, the stress similarity coefficient, Cσ = Cl × Cγ = 154, and the time similarity coefficient were chosen.
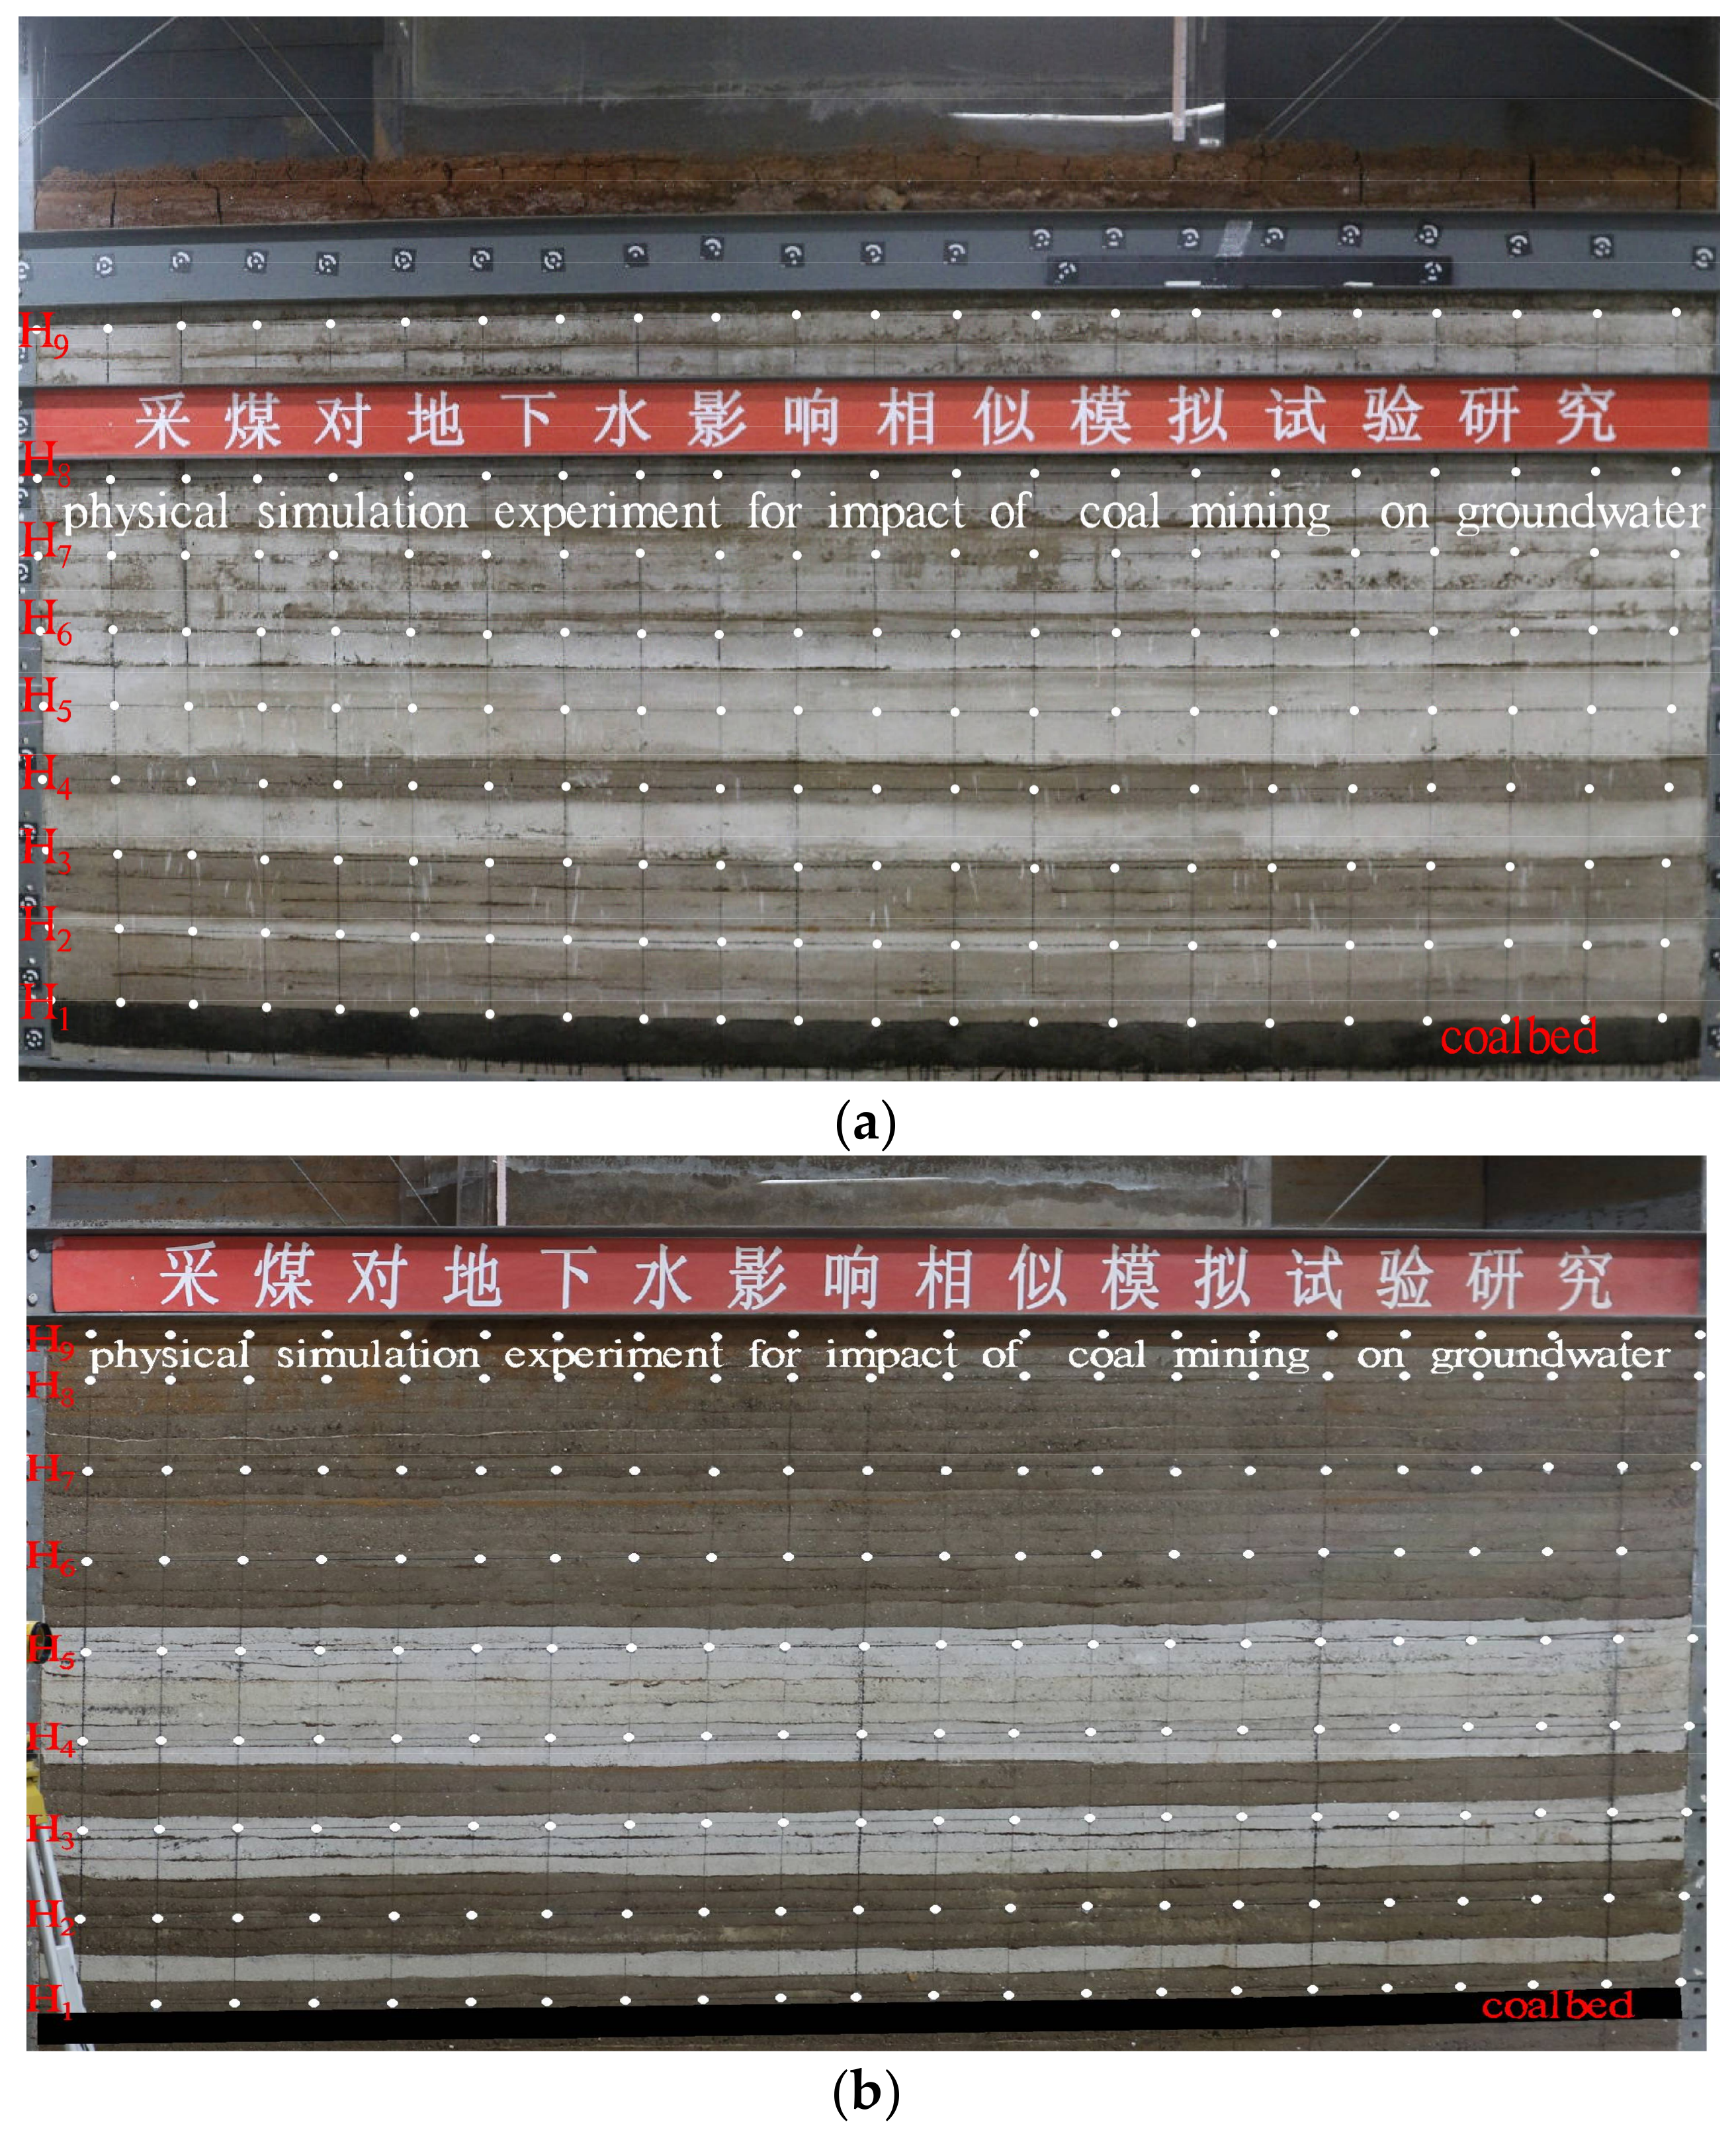
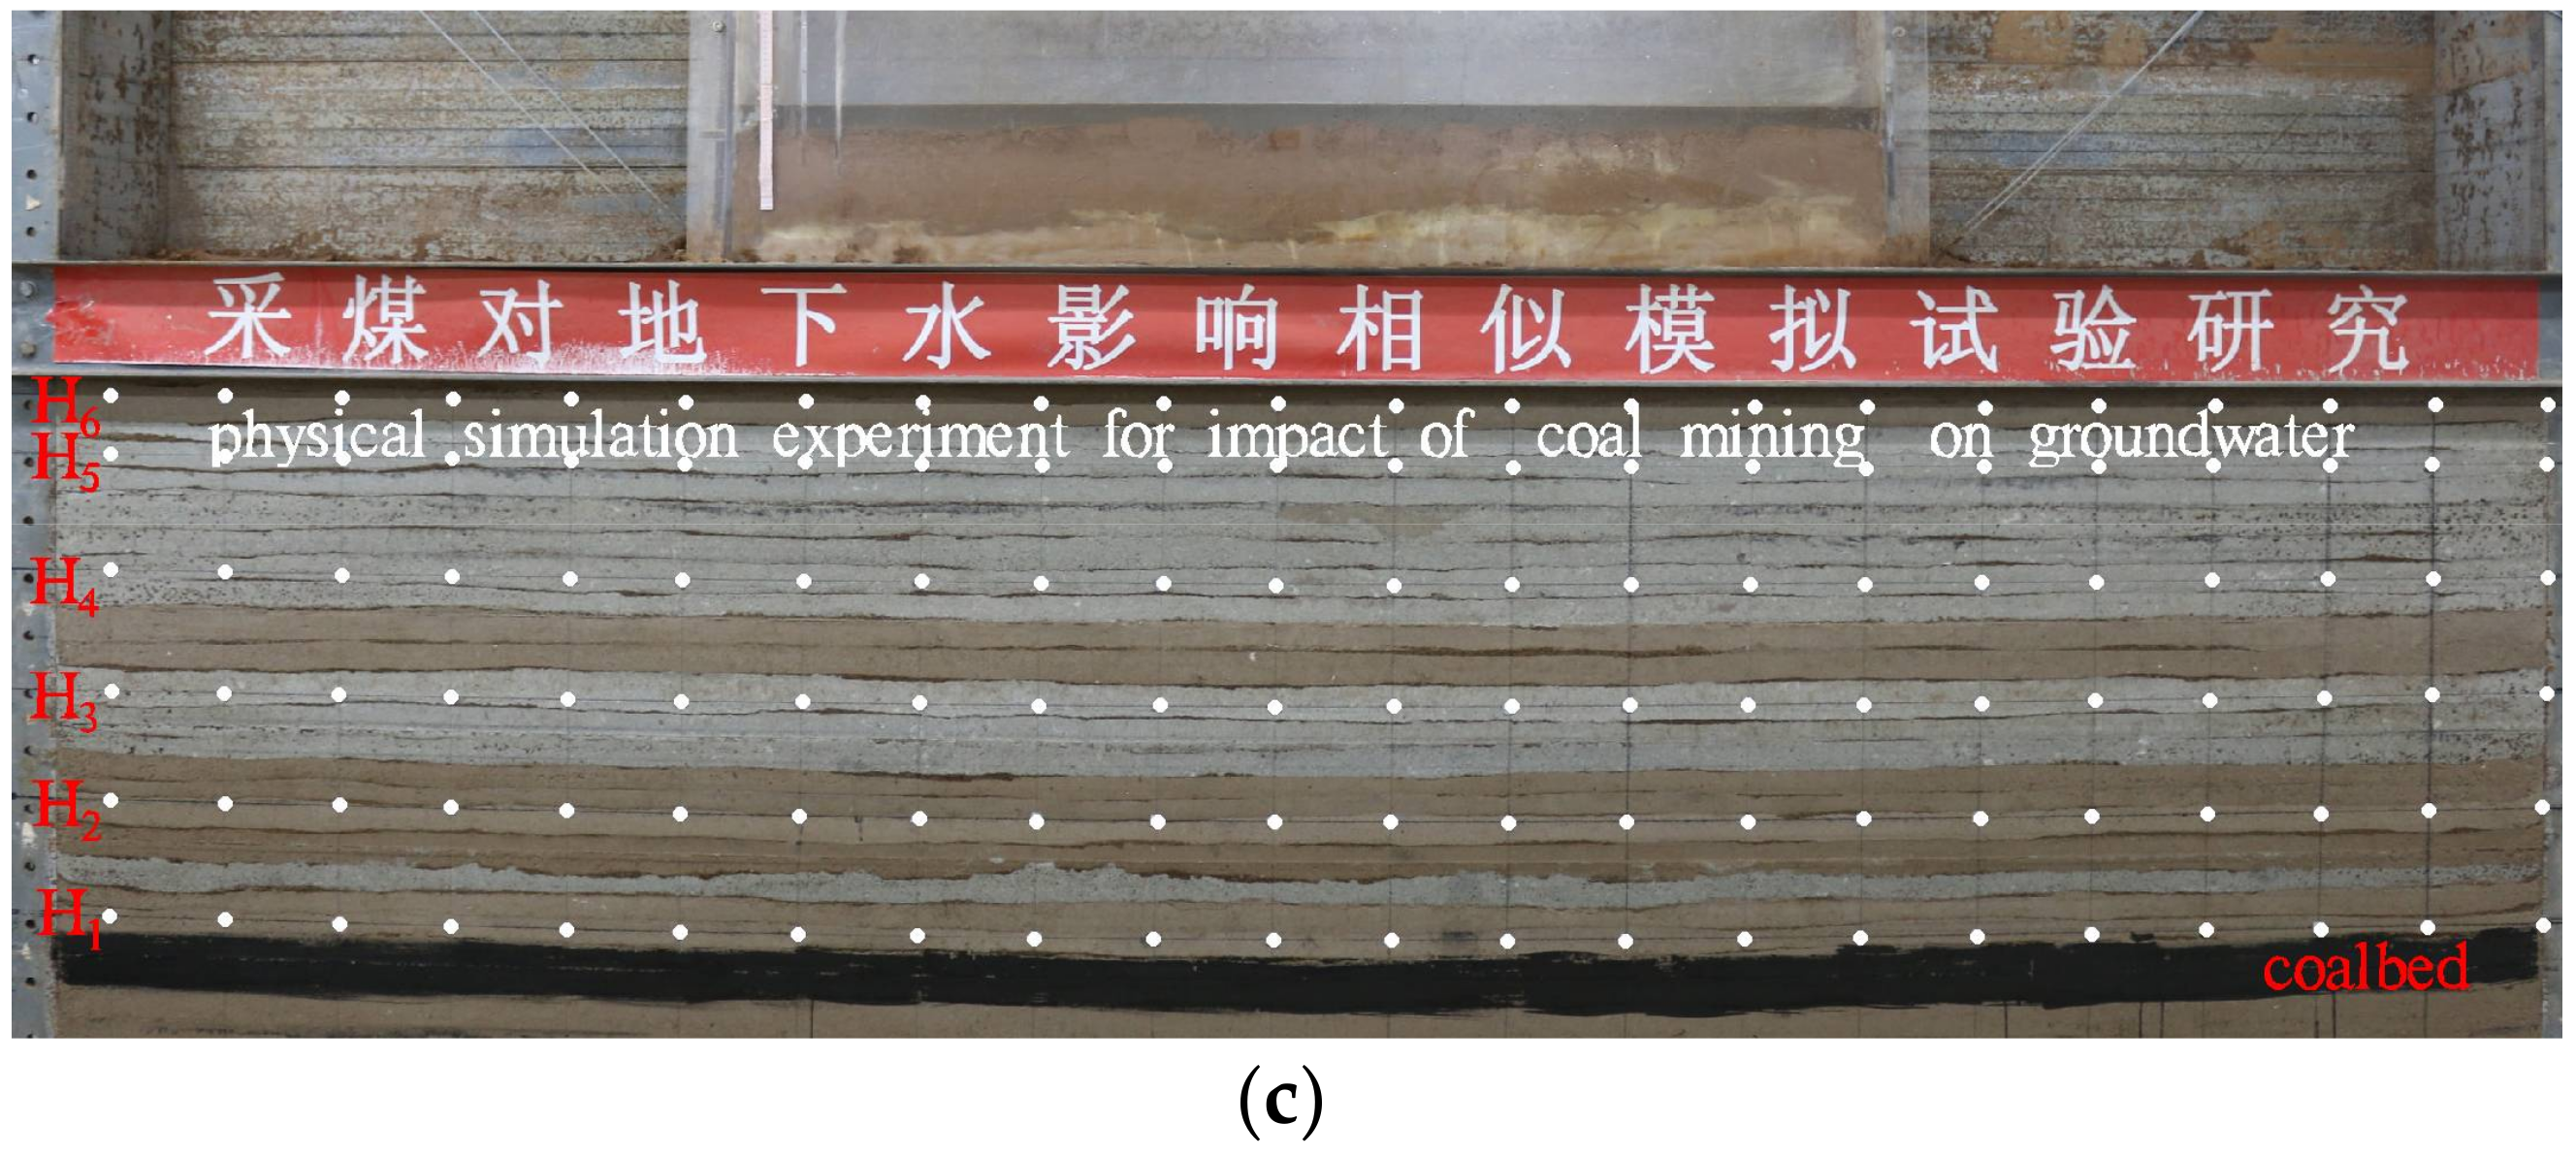
To observe the failure characteristics of the overburden strata at various depths, and analyze their impact on the overlying unconsolidated aquifer, three models were designed based on the burial depth of the coal seam and the thickness of the overlying bedrock in the study area. The three models had all the same aspects, except the overburden thickness, which was varied to enable comparisons. These models are shown in Figure 3 and explained as follows. Model I was constructed from the actual situation of the prototype; the overlying strata had a thickness of 186.9 cm. Model II and Model III were structured using the thicknesses of the overlying strata of 151.2 cm and 102.6 cm, respectively. The 7–23rd layers and the 12–23rd layers in Figure 2 were selected as the overlying rock in Model II and Model III, respectively.
To allow a convenient comparison, the experimental conditions for the three models were identical except for the mining depth. The overburden rock mass was covered with a 16-cm-thick clay aquitard and a 14-cm-thick unconsolidated aquifer. There were 80-cm-long pillars on both sides of the mining area to minimize the impact of underground mining on structure stability. The mining height was 3 m, the mining speed was 10 cm/h, and the simulated mining time was 2.645 days (63.47 h).
Following the geometric similarity ratio, an airtight Plexiglas box was filled with 14-cm-depth water to substitute for the overlying unconsolidated confined aquifer. This was then inserted into the clay layer in the middle of the model to eliminate the boundary effect. To avoid the influence of evaporation on the test results, the box was covered with a sealed organic glass plate. Based on the connector principle, a vertical glass tube with openings at both ends was pasted on the outside of the box to observe the water level. The water tables were measured and recorded bihourly at the beginning of the experiment, and more frequently there after depending on the rate of descent.
3.2.2. Similar Materials
The compressive strength and the tensile strength of the experimental materials were similar to those of the geological prototype [28]. In this study, quartz sand and river sand were selected for the aggregate; lime and gypsum constituted cementing material, and borax (concentration: 1.0%) were used as a retarder. The surface of the coalbed model was painted black for better observation.
3.2.3. Monitoring System
To observe the destruction and the movement of the overburden strata, a horizontal and longitudinal monitoring network with 20 cm intervals was arranged on the bedrock surface from the roof of the coal seam to the bottom of the clay layer, with one monitoring point at each intersection. The strata deformation and movement during experiments were monitored using an electronic total station with high measurement accuracy. The monitoring grid layouts are shown in Figure 3.
The process of the ground movement and the fracture evolution in the overlying strata of varying heights over the advancing face was observed directly and photographed with a digital camera. The photographs were rectified using the “image correction” function of MAPGIS software (V6.7, Zondy cyber, Wuhan, China). The laws of the failure and the deformation of the overlying strata were then investigated.
4. Results and Discussion
4.1. FailureCharacteristics of Overburden Strata at Various Mining Depths
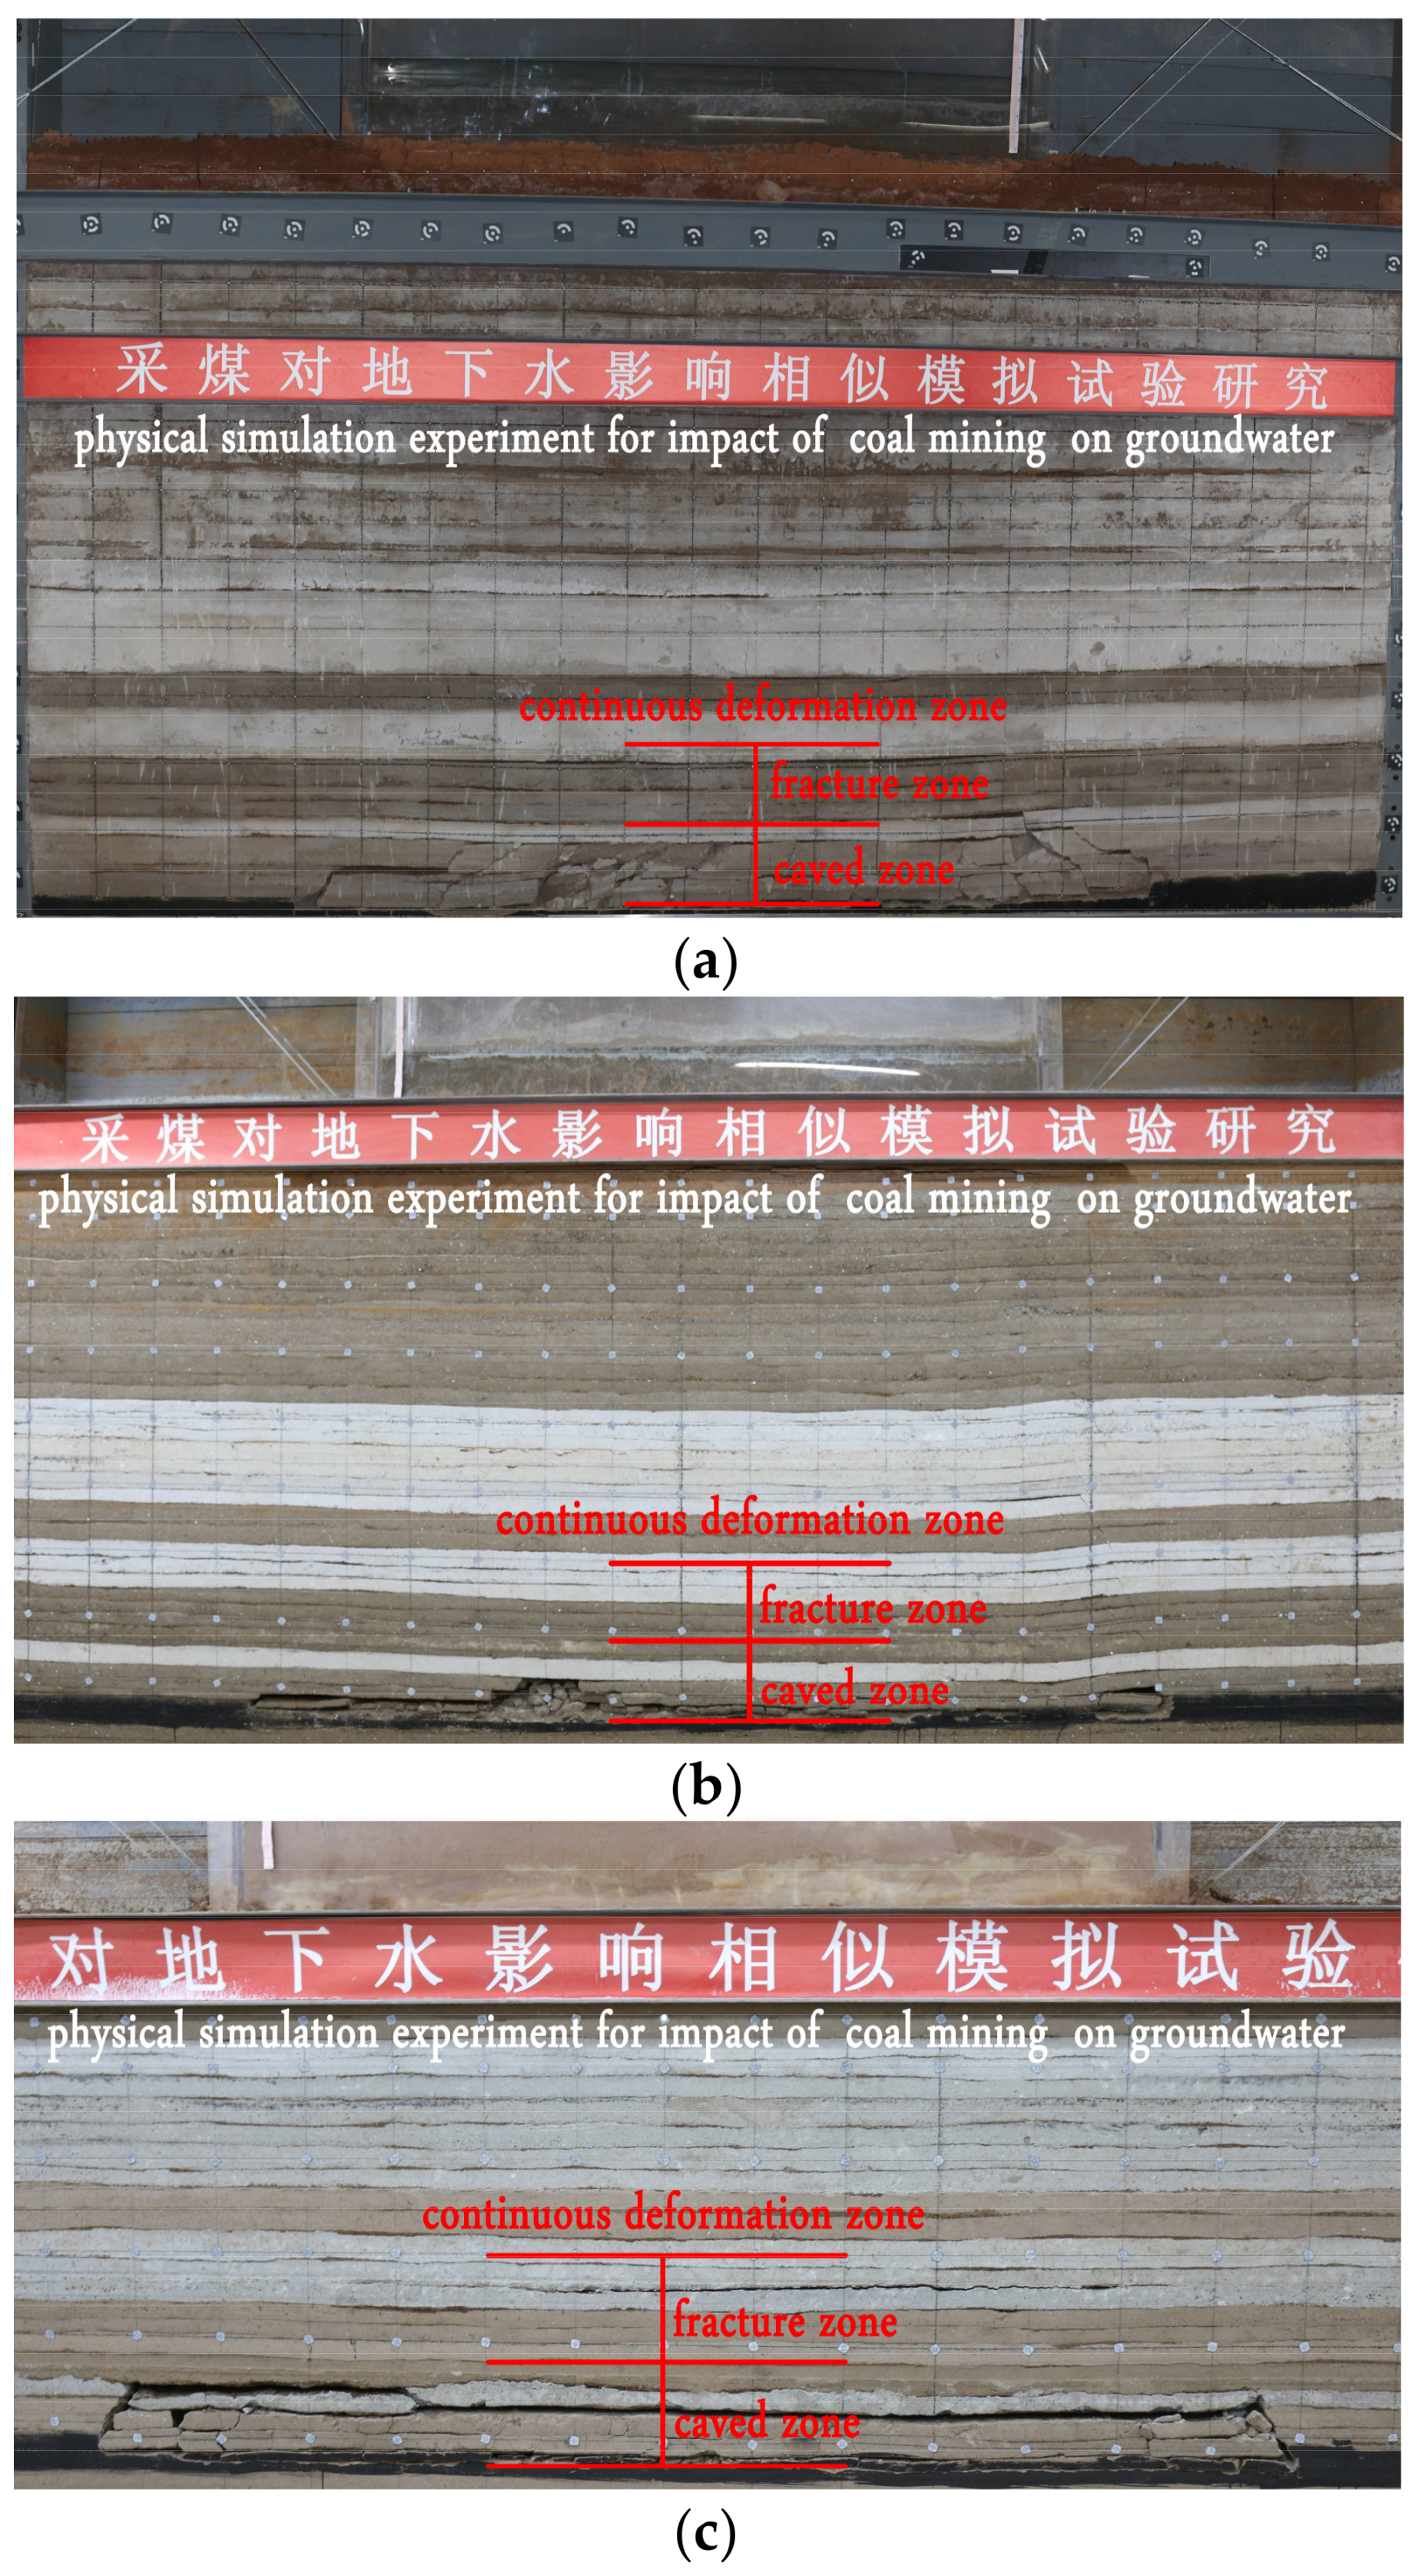
Destruction and deformation are generated in overburden strata along with coal extraction. In addition, fractures or cavities are formed, and their connectivity characteristics determine whether they provide access for groundwater inflow into the working face [29]. The overlying strata over the vacated area are often categorized into three zones (caved zone, fracture zone, and continuous bending or deformation zone) with respect to the characteristics of strata failure and fracture distribution [4,5,6,7,8], as illustrated in Figure 4. The fracture zone and the caved zone constitute the interconnected zone, which forms a system of run-through channels for water. The degrees of overburden damage, displacement, and fracture development decreased as the distance from the goaf increased. The most severe destruction was localized over and near the work faces, while this was least severe on top of the strata. To aid understanding, the data in the following analysis were restored to their actual values.
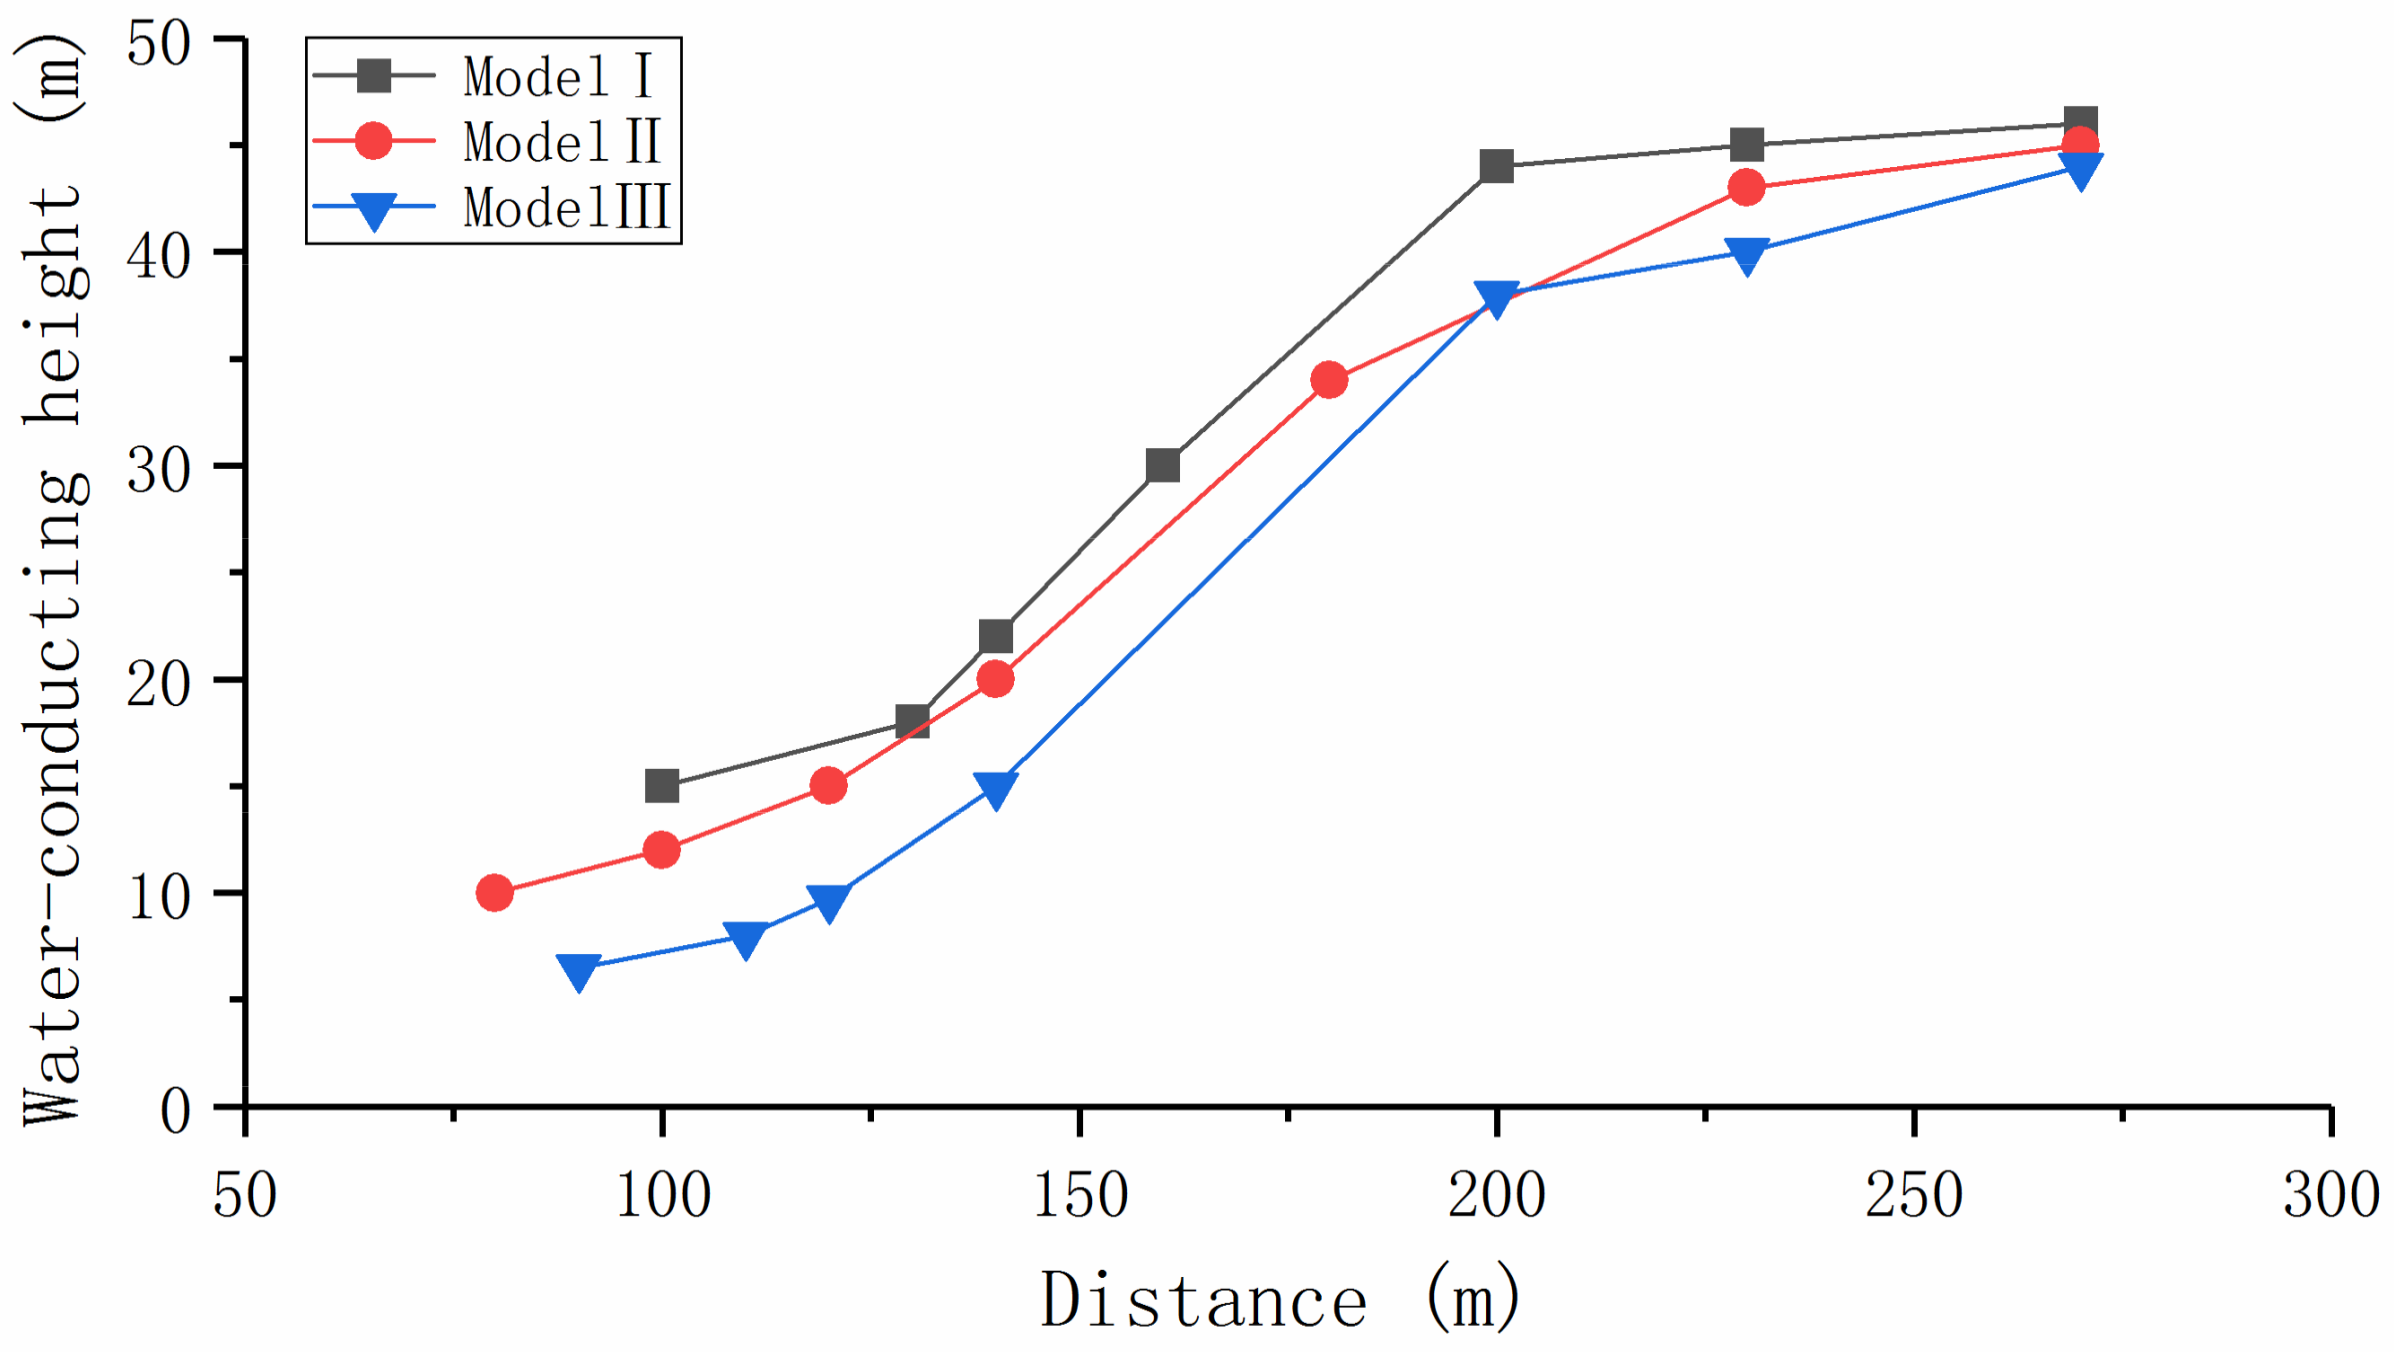
The study on the distribution of mining fractures in rock masses is not only related to coal mine safety, but also to the protection of groundwater resources [23,30,31]. Fractures developed throughout the whole excavation and continued for a limited period after mining [32]. As the mine face advances, the caving fissures in the roof gradually grow from the bottom to the top, forming an “upward crack zone”, also known as a fractured water-conducting zone [33], which is the most interesting region to mining engineers. It is vital to accurately determine its height because complete groundwater drainage occurs here, and the post-mining and pre-mining hydraulic conductivities (K) are different [16,34,35], which can lead to rapid groundwater inrush into the working face. The bending deflection downward of roof strata above the mined-out area is being aggravated with the enlarging excavation scope, resulting in greater odds of failure. The developing height and range of the water-conducting zone thus grew gradually in a stepwise manner and tended to increase gently after the working face advanced to a certain distance. This is because the bearing capacity of the caving rock increases as collapsed rock fills the gob, accumulating and compacting continuously. Under the same geological conditions, mining thickness, and exploitation method, the deeper coal seam, the greater overburden pressure and the larger overburden movement scale resulted in a more developed fractured water-conducting zone. In other words, the height of the fractured water-conducting zone was directly related to the void width and the overburden thickness. During coal mining, the height variation of the fractured water-conducting zone with the distance advanced by the face is shown in Figure 5. The peak heights were approximately 15 times the seam thickness, which were approximately 46 m, 45 m, and 44 m for Model I, Model II and Model III, respectively. There was no significant difference between the models of different heights.
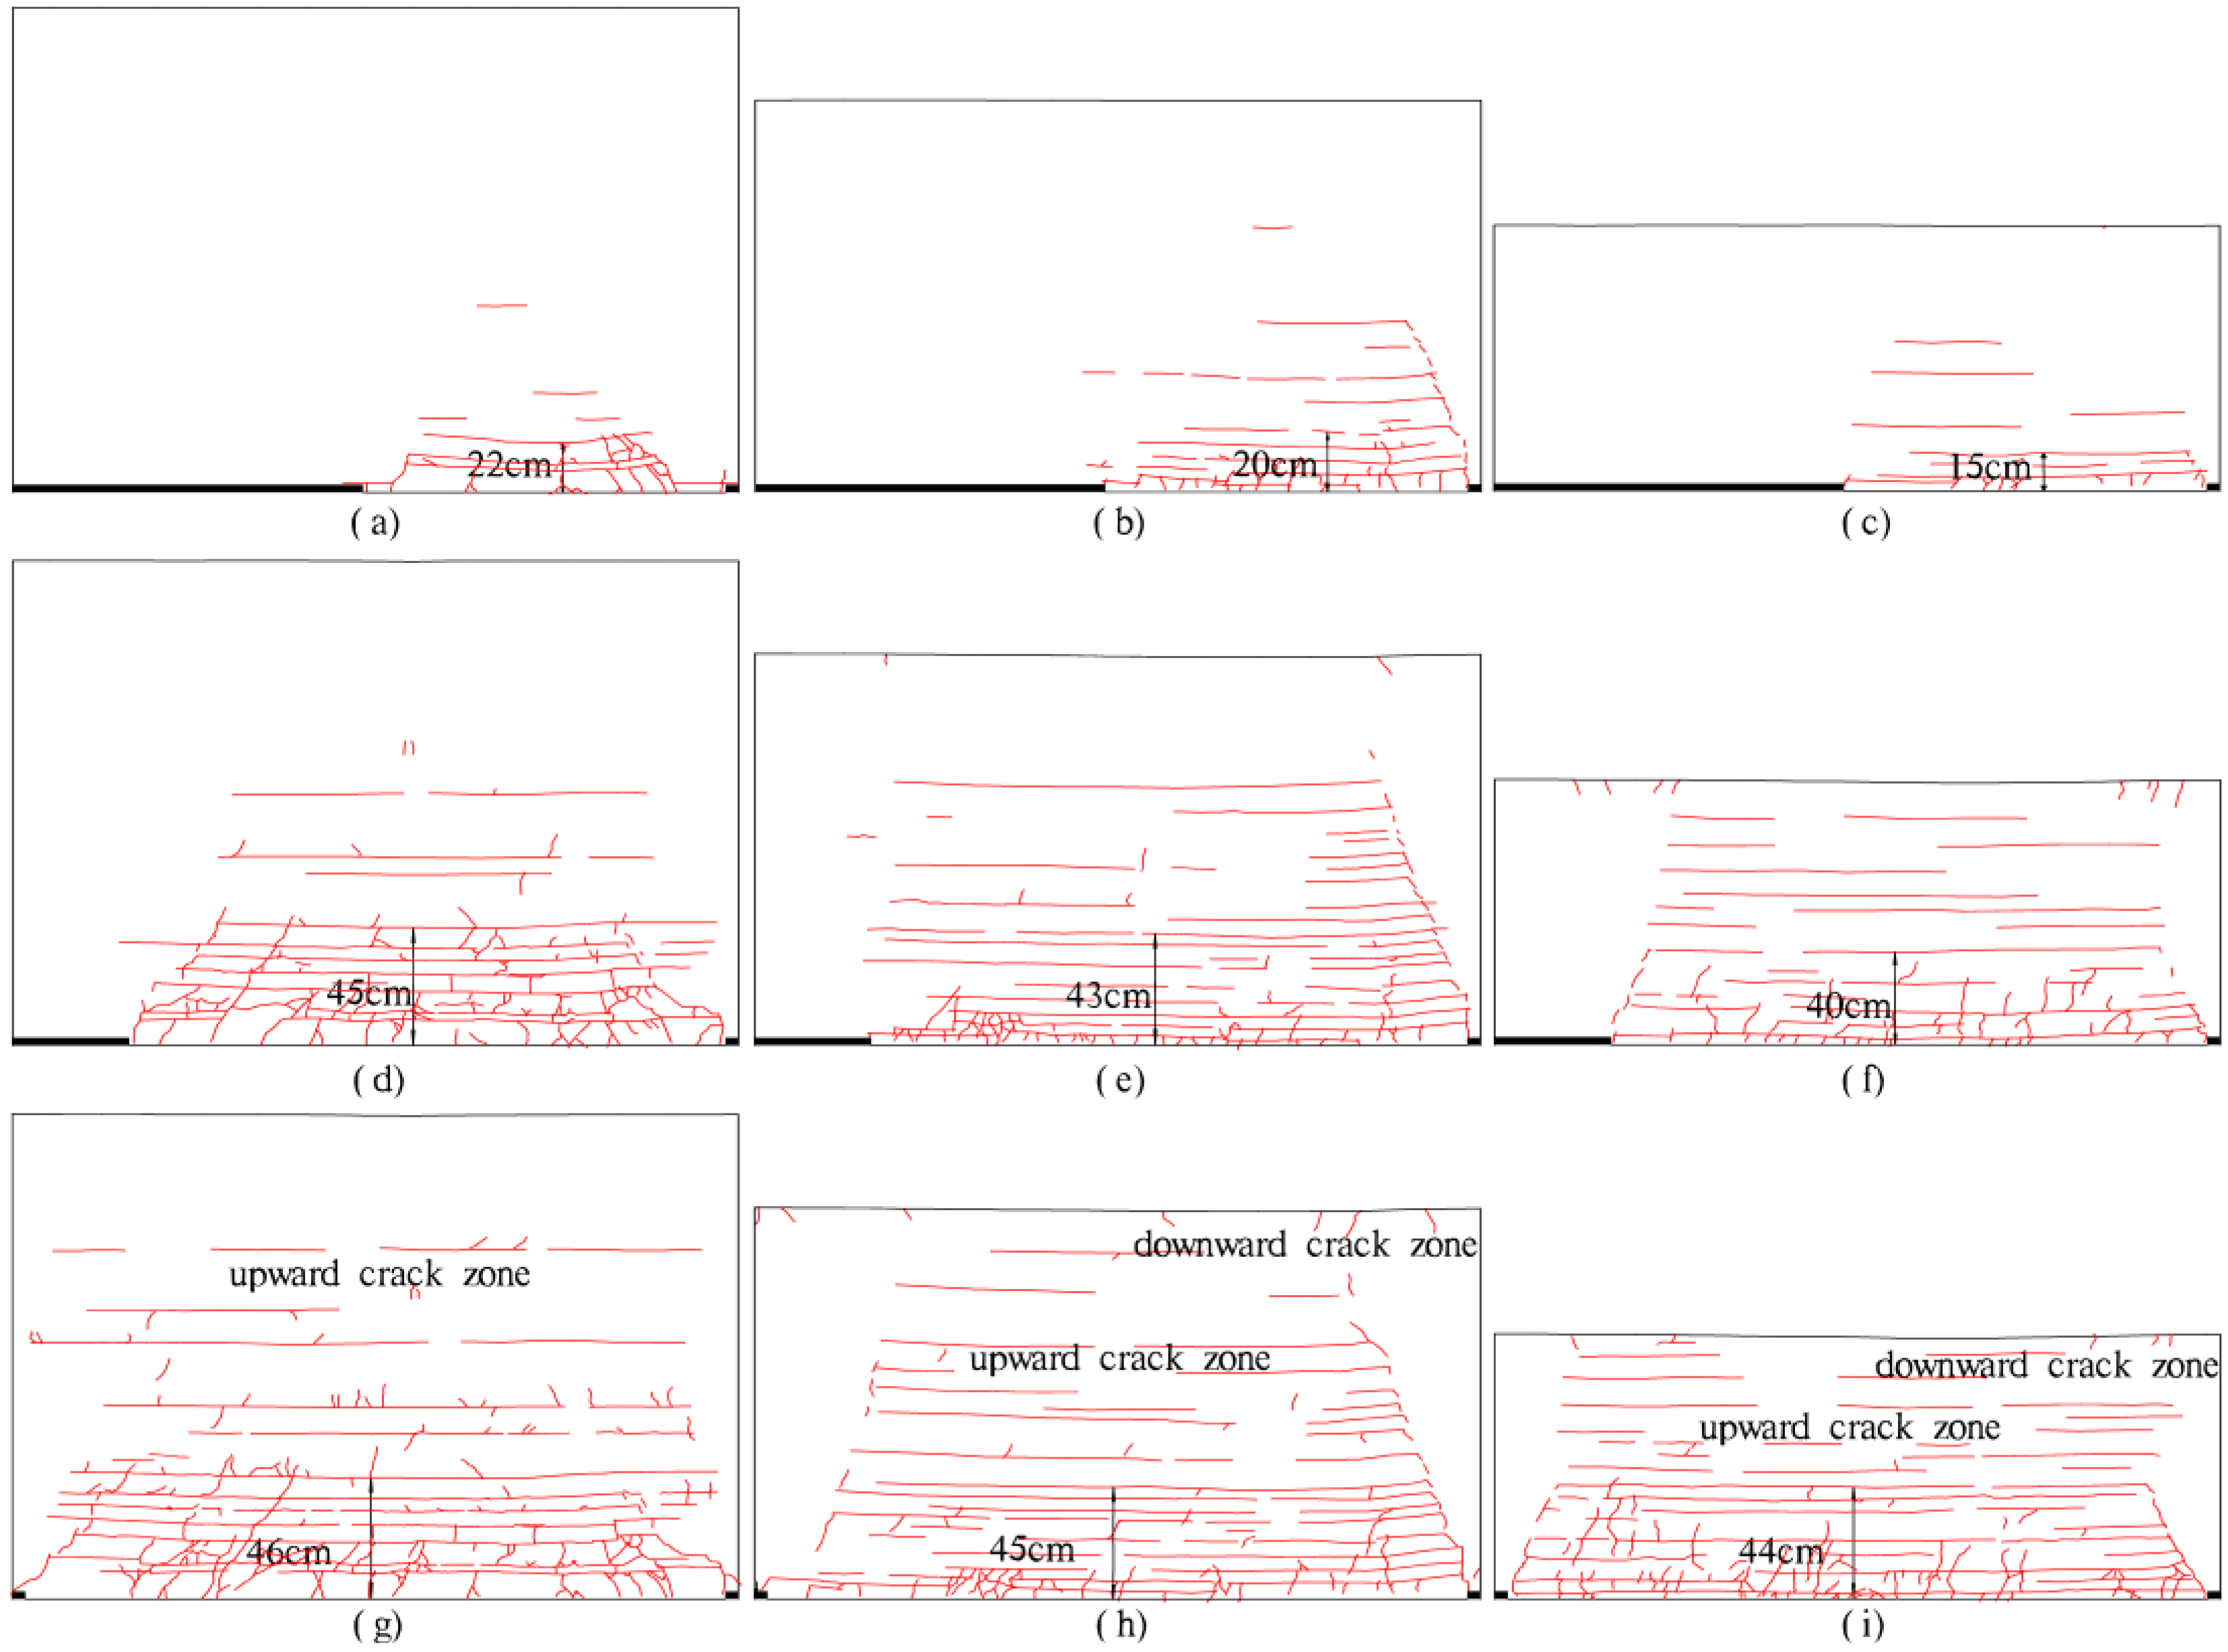
As the mined-out area expanded, tensile stress built up during strata subsidence, while some surface cracks were initiated [33,36]; the resultant tension fractures occurred from the top to the bottom, forming a “downward crack zone” [33], which is mainly found on the surface of the goaf edge and is located in the continuous deformation zone.
Various fracture distribution networks appeared at diverse mining depths and mined-out spaces. Fracture development for different advancements in the three sets of the models is shown in Figure 6.
After the movement of the overlying strata stabilized, the descending and ascending fractures did not connect. The cracks fell into two categories according to their different directions: Longitudinal fractures and bed separation fissures [30,37]. The longitudinal fractures dominated the area within 30 m of the coal seam roof and ground surface; however, the bed separation fractures were primarily outside this area. The fissures at the edge of the mined-out area were larger than those in its central section.
4.2. Influence on Permeability of Floor Aquitard
4.2.1. Pre-Mining Drawdown
The pre-mining change of the groundwater table overtime was measured after the aquitard was saturated, and the infiltration rate of water under unmined conditions was calculated. The infiltration rate of the water level in an unconsolidated aquifer before mining is summarized in Table 1. There are minimal differences concerning infiltration rates among the three models, which meet the experimental requirements.
4.2.2. Post-Mining Drawdown
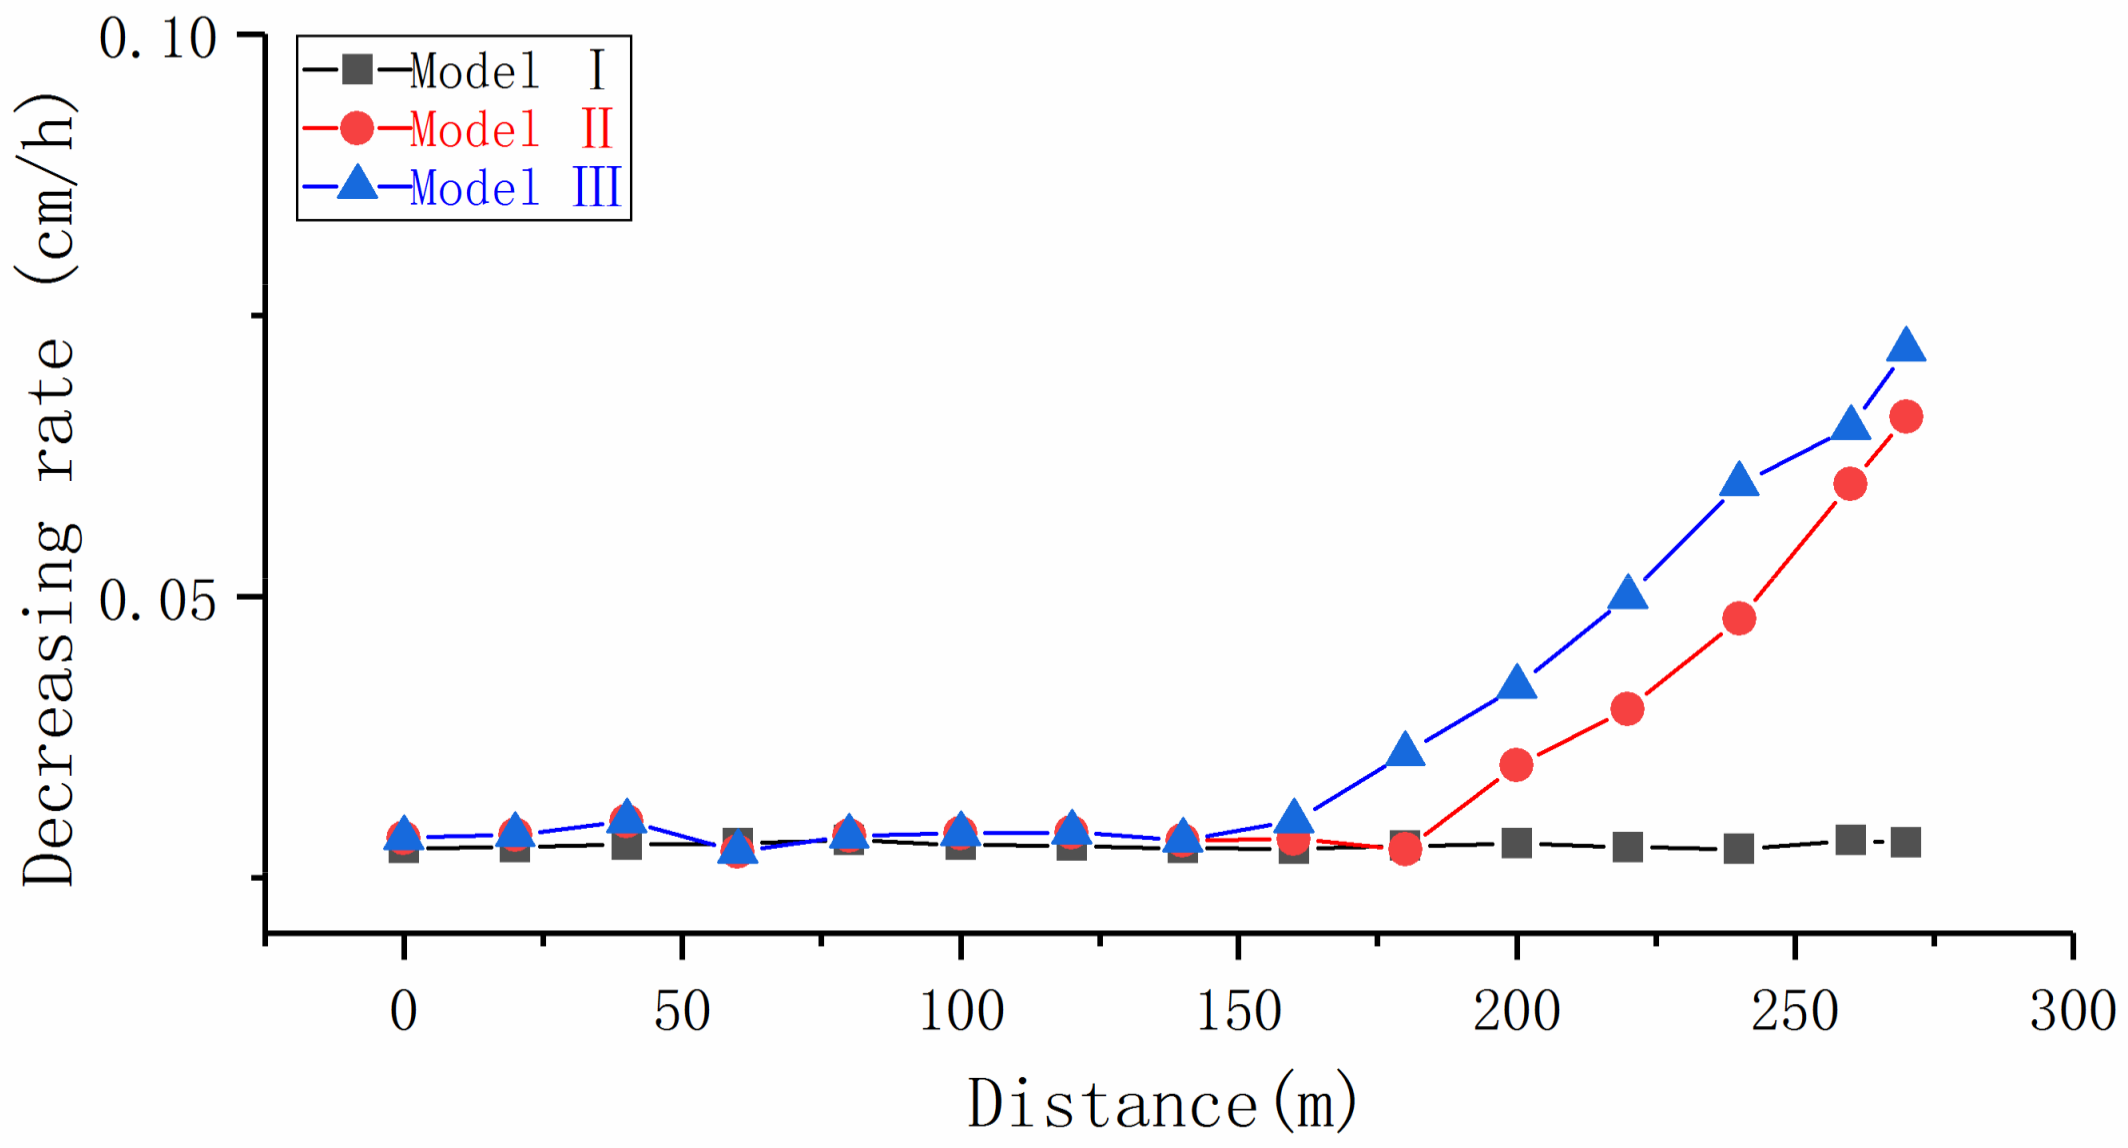
The change in the water level during mining in the overlying unconsolidated aquifer, corresponding to various overburden heights, is shown in Figure 7. For Model I, the rate of descent of the water was consistent with pre-mining over time; the unconsolidated aquifer was not affected by mining. For Model II, the rate of descent was relatively stable in the process of the working face advancing to 180 m. Thereafter, the water level dropped rapidly and the rate of decrease was 0.066 cm/h at the end of mining. For Model III with minimum overburden thickness, similar to Model II, the water level decline remained steady during the working face advancing to 160 m, and then gradually accelerated and finally reached 0.072 cm/h. Exploitation at various depths had different effects on the overlying unconsolidated aquifer.
Variations in the drawdown rate can reflect changes in the permeability of the floor aquitard during mining.
4.3. Analysis of Causes of Variations in DrawdownRate
It is well known that once the fractured water-conducting zone grew up to the aquifer or connected with the downward crack zone underneath the aquifer, it would lead groundwater loss. However, in these experiments, the fractured water-conducting zone had connections neither with the overlying unconsolidated aquifer nor with the downward crack zone in all the models. In contrast, the rapid drop of the groundwater table appeared in Model II and Model III in the late mining period. We conclude that: (a) The drop of the water level may be caused by the increase in permeability, because of the development of fissures in the clay stratum; and (b) The formation of the downward cracks made the groundwater leakage downward through the fissures. By performing coal mining in Model II and Model III, the developing fractures in the clay stratum caused a decline in the steady acceleration of the water lever before the downward cracks reached the upward crack zone. Furthermore, fissures were accompanied by the deformation of the clay aquitard in strata failure, which could decrease their stability and increase permeability. Thus, the aquifer outside the fractured water-conducting zone could be certainly affected by coal mining. The extent of the influence was considerable in Model III, followed by the lesser influence in Model II and the only little influence in Model I.
According to the conceptual model modified from Tammetta in 2012 [17,34], there were two distinct zones (the collapsed zone and the disturbed zone) above the mined area. The height of the collapsed zone was coincident with the height of the fractured water-conducting zone, and the disturbed zone had pressure heads lying over the collapsed zone. The post-mining hydraulic conductivity (K) in the disturbed zone increased moderately by ten times or less [34] compared to the pre-mining value.
The rate of decline of the water level in Model I was constant, and this indicates that the aquitard at the bottom of the aquifer remained intact during coal mining. This is because the overburden in Model I was so high that the unconsolidated aquifer and its aquitard floor were located outside the disturbed zone and were unaffected by mining. The depression of the groundwater table was caused only by the head difference, which could be recovered at a later time after mining [6]. The shallower coal extraction in Model II and Model III had a more significant effect on the overlying unconsolidated formation, which was located in the disturbed zone, although there was no connection between the upward and downward fractures. The stability and the permeability of the aquitard were also greatly affected. These factors led to an accelerating fall in the water level.
It is clear that the destructiveness of the aquitard floor beneath the unconsolidated aquifer was related to the mining depth, but the decisive factor was the bedrock in the continuous bending zone.
4.3.1. Relationship between the Thickness of Bedrock in Continuous Bending and Drawdown Rate
The continuous bending zone is above the fractured water-conducting zone; here, the strata maintain integrity and continuity with no apparent breakings, although a few bed-separated fissures can be partially filled with water. Of all the effects mining has on the overlying aquifer, the continuous bending zone plays a chief role.
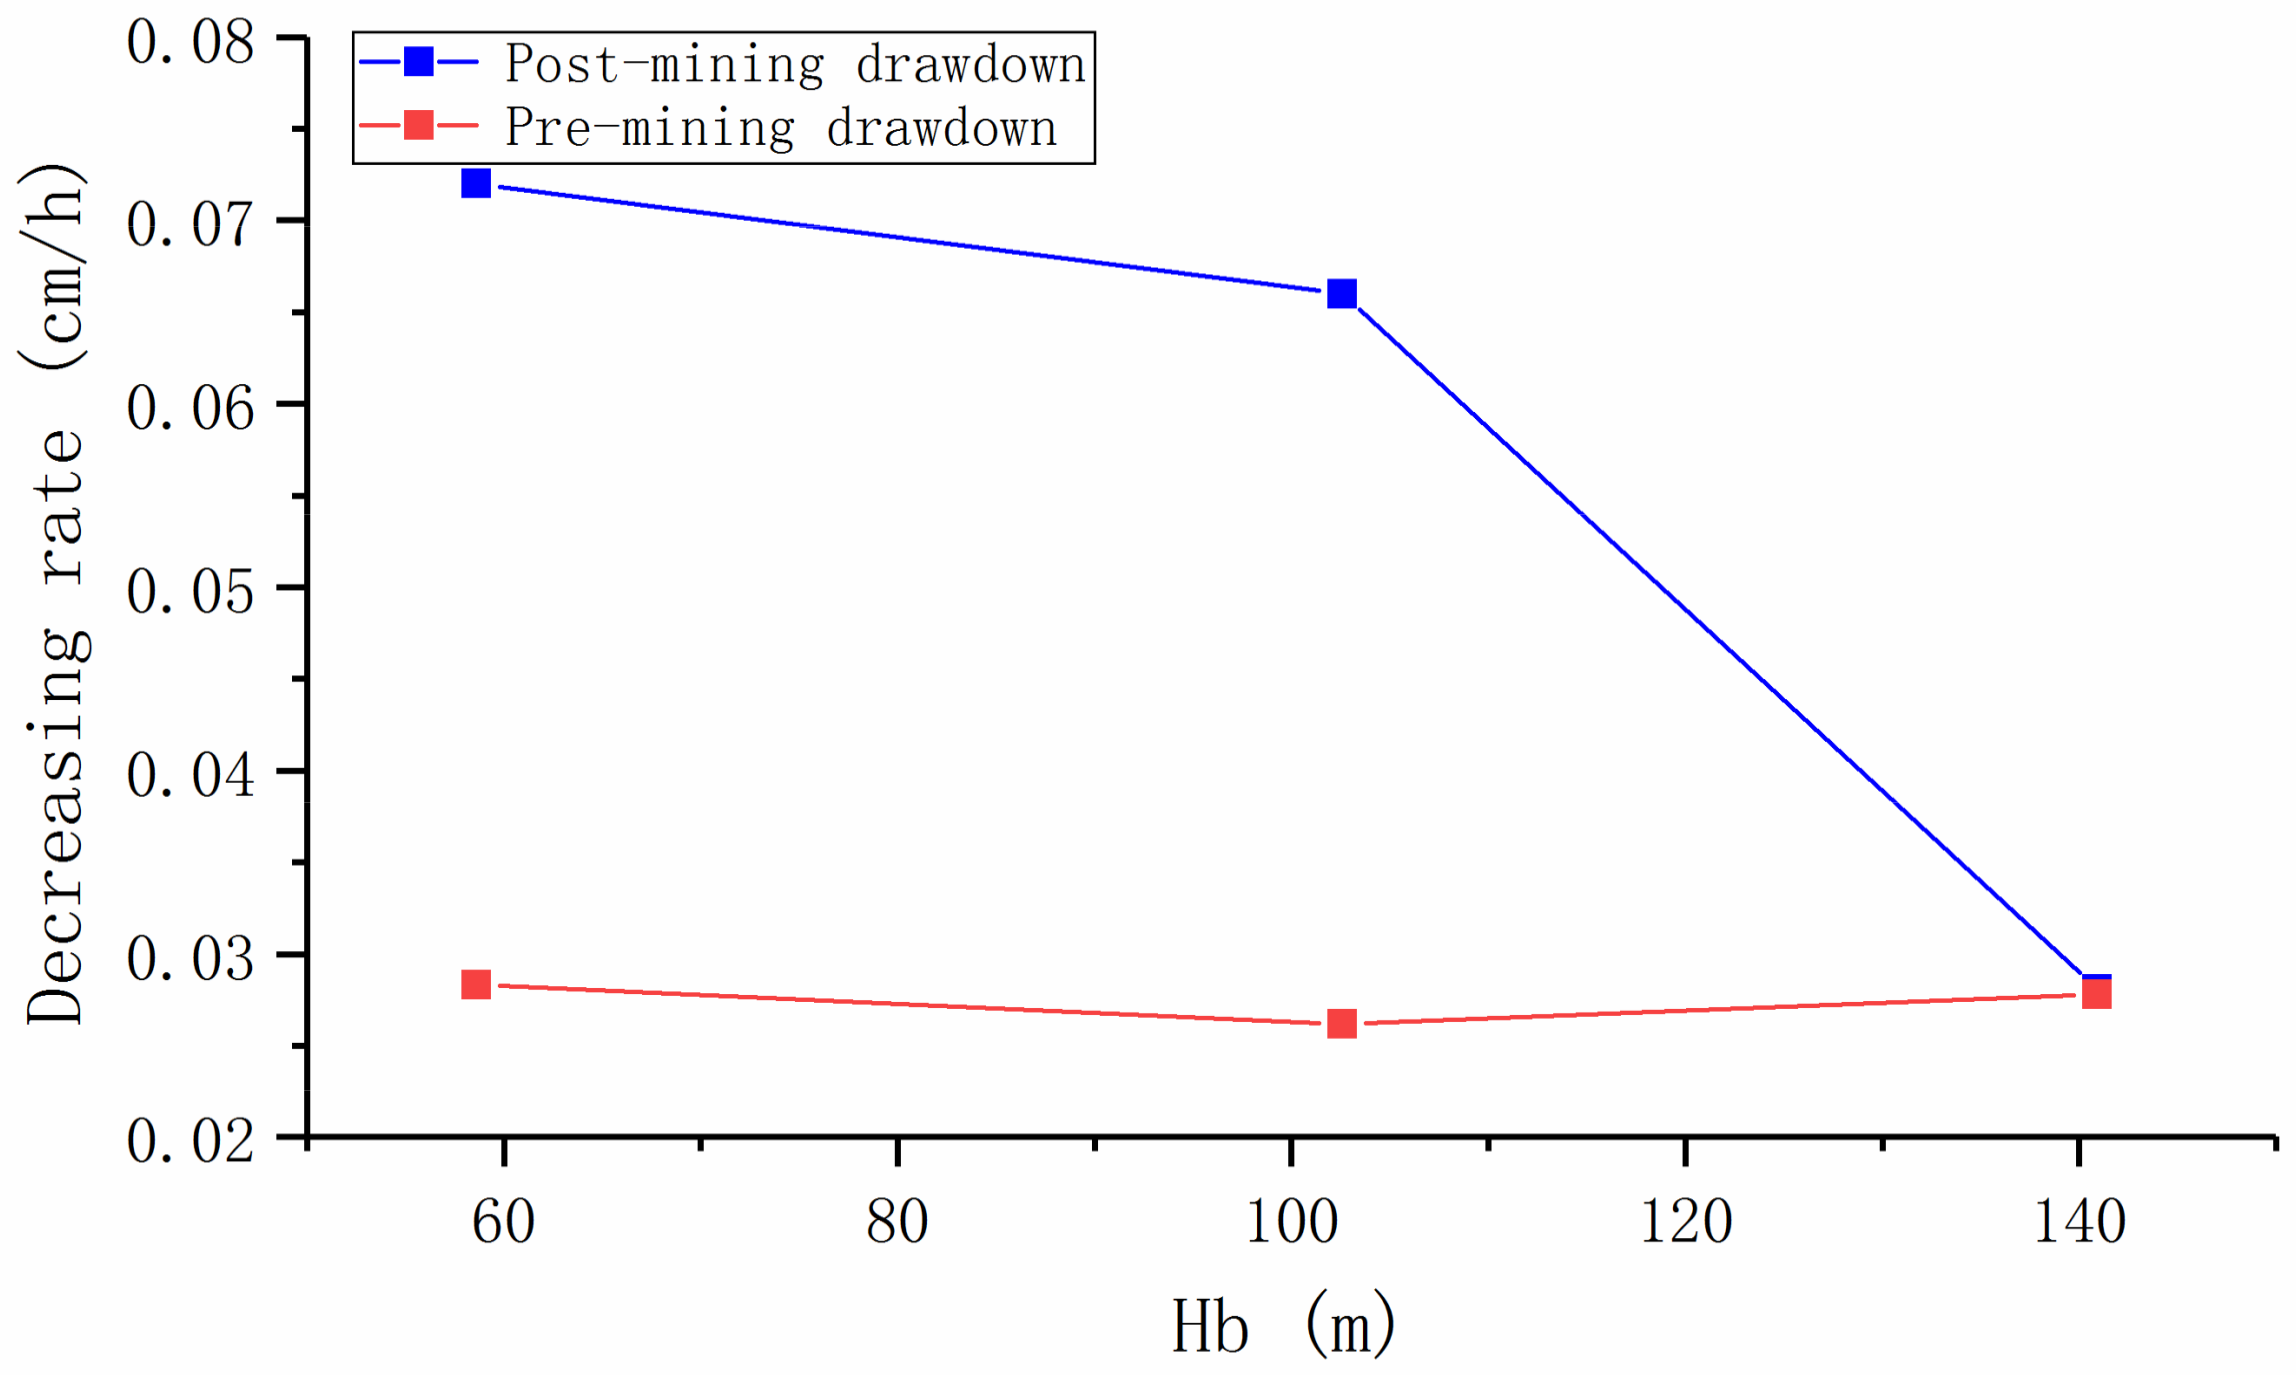
We denote the thickness of bedrock in continuous bending as Hb. The changes in the rate of decline of the water table in an unconsolidated aquifer are related to Hb. The Hb values for the three models were 140.9 m, 106.2 m, and 58.6 m, respectively; the relationship between the thickness and the water table drawdown is shown in Figure 8.
The rate of decrease of the water level in an unconsolidated aquifer was inversely proportional to the thickness of the bedrock above the fissure zone (Hb) after mining; that is, the greater the Hb value, the smaller the variation in water level after coal mining. Conversely, a smaller Hb bought about larger changes in the water table compared with pre-mining, because the disturbed zone within the continuous bending zone was still affected by mining. When Hb was sufficiently high, the aquitard floor underneath the unconsolidated aquifer was located outside the disturbed zone and was not affected by mining.
4.3.2. Relationship between the Deformation of the Floor Aquitard and Groundwater Table Drawdown
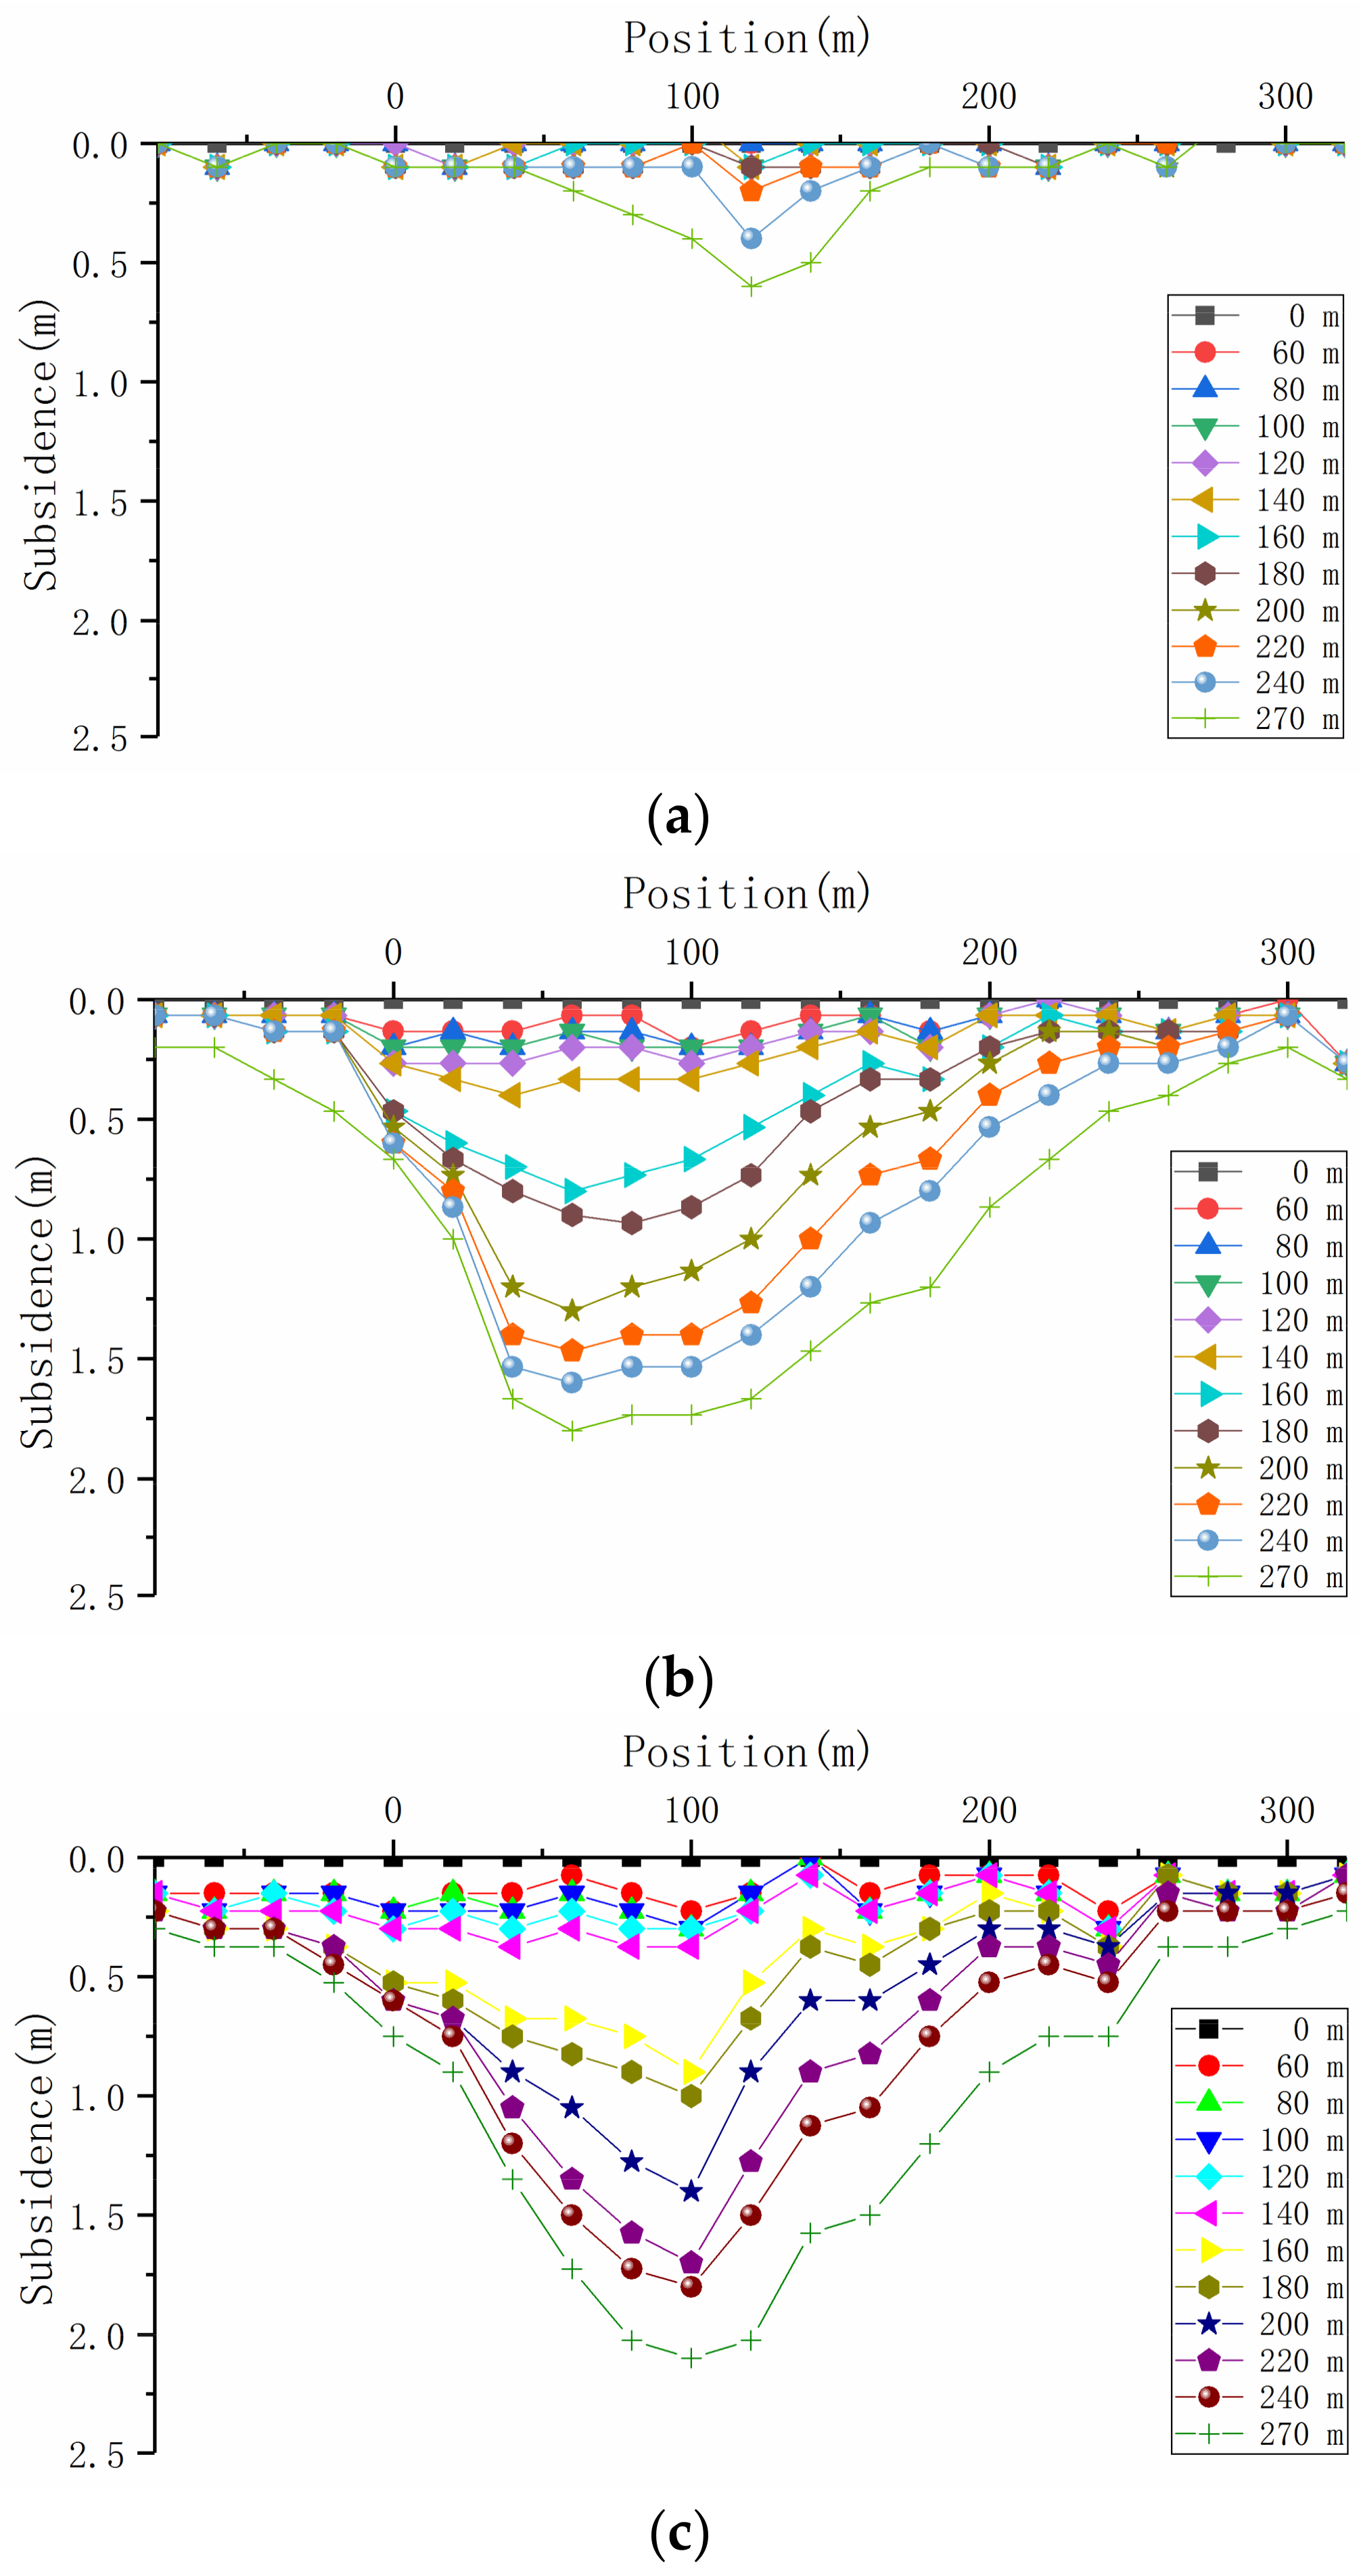
The ground movement and the deformation take two main forms: Horizontal and vertical, both of which affect the overburden stability and the permeability of the post-mining. The clay aquitard beneath the unconsolidated aquifer is located at the top of the overburden, which belongs to the continuous deformation (bending) zone. Its stability is the key to the loss of groundwater from the porous aquifer. Therefore, this provided a theoretical basis for revealing the mechanism of the groundwater depletion with respect to the failure and the deformation features of the aquitard (silty clay stratum) under mining conditions. According to the measured data from the top monitoring lines, subsidence change curves were plotted for different mining depths, as shown in Figure 9.
The chart shows that the subsidence (vertical displacement) of the aquitard floor increased as the working area advanced at the same burial depth. For different mining depths, after mining, the subsidence of strata in the H9 monitoring line at the top of the overburden in Model I was smallest, the width of the overburden shifted by approximately 200 m, and the maximum subsidence was 0.6 m. In both Model II and Model III, the whole width of the overburden exhibited subsidence larger than in the mined-out area, consistent with the field observation; significant subsidence occurred around the middle of the goaf by 1.8 m and 2.1 m according to the data of top monitoring lines. The inconsistent deformation was caused by diverse thicknesses of the overlying strata. The subsidence and the distance from the coal face of the aquitard floor have an inverse relationship.
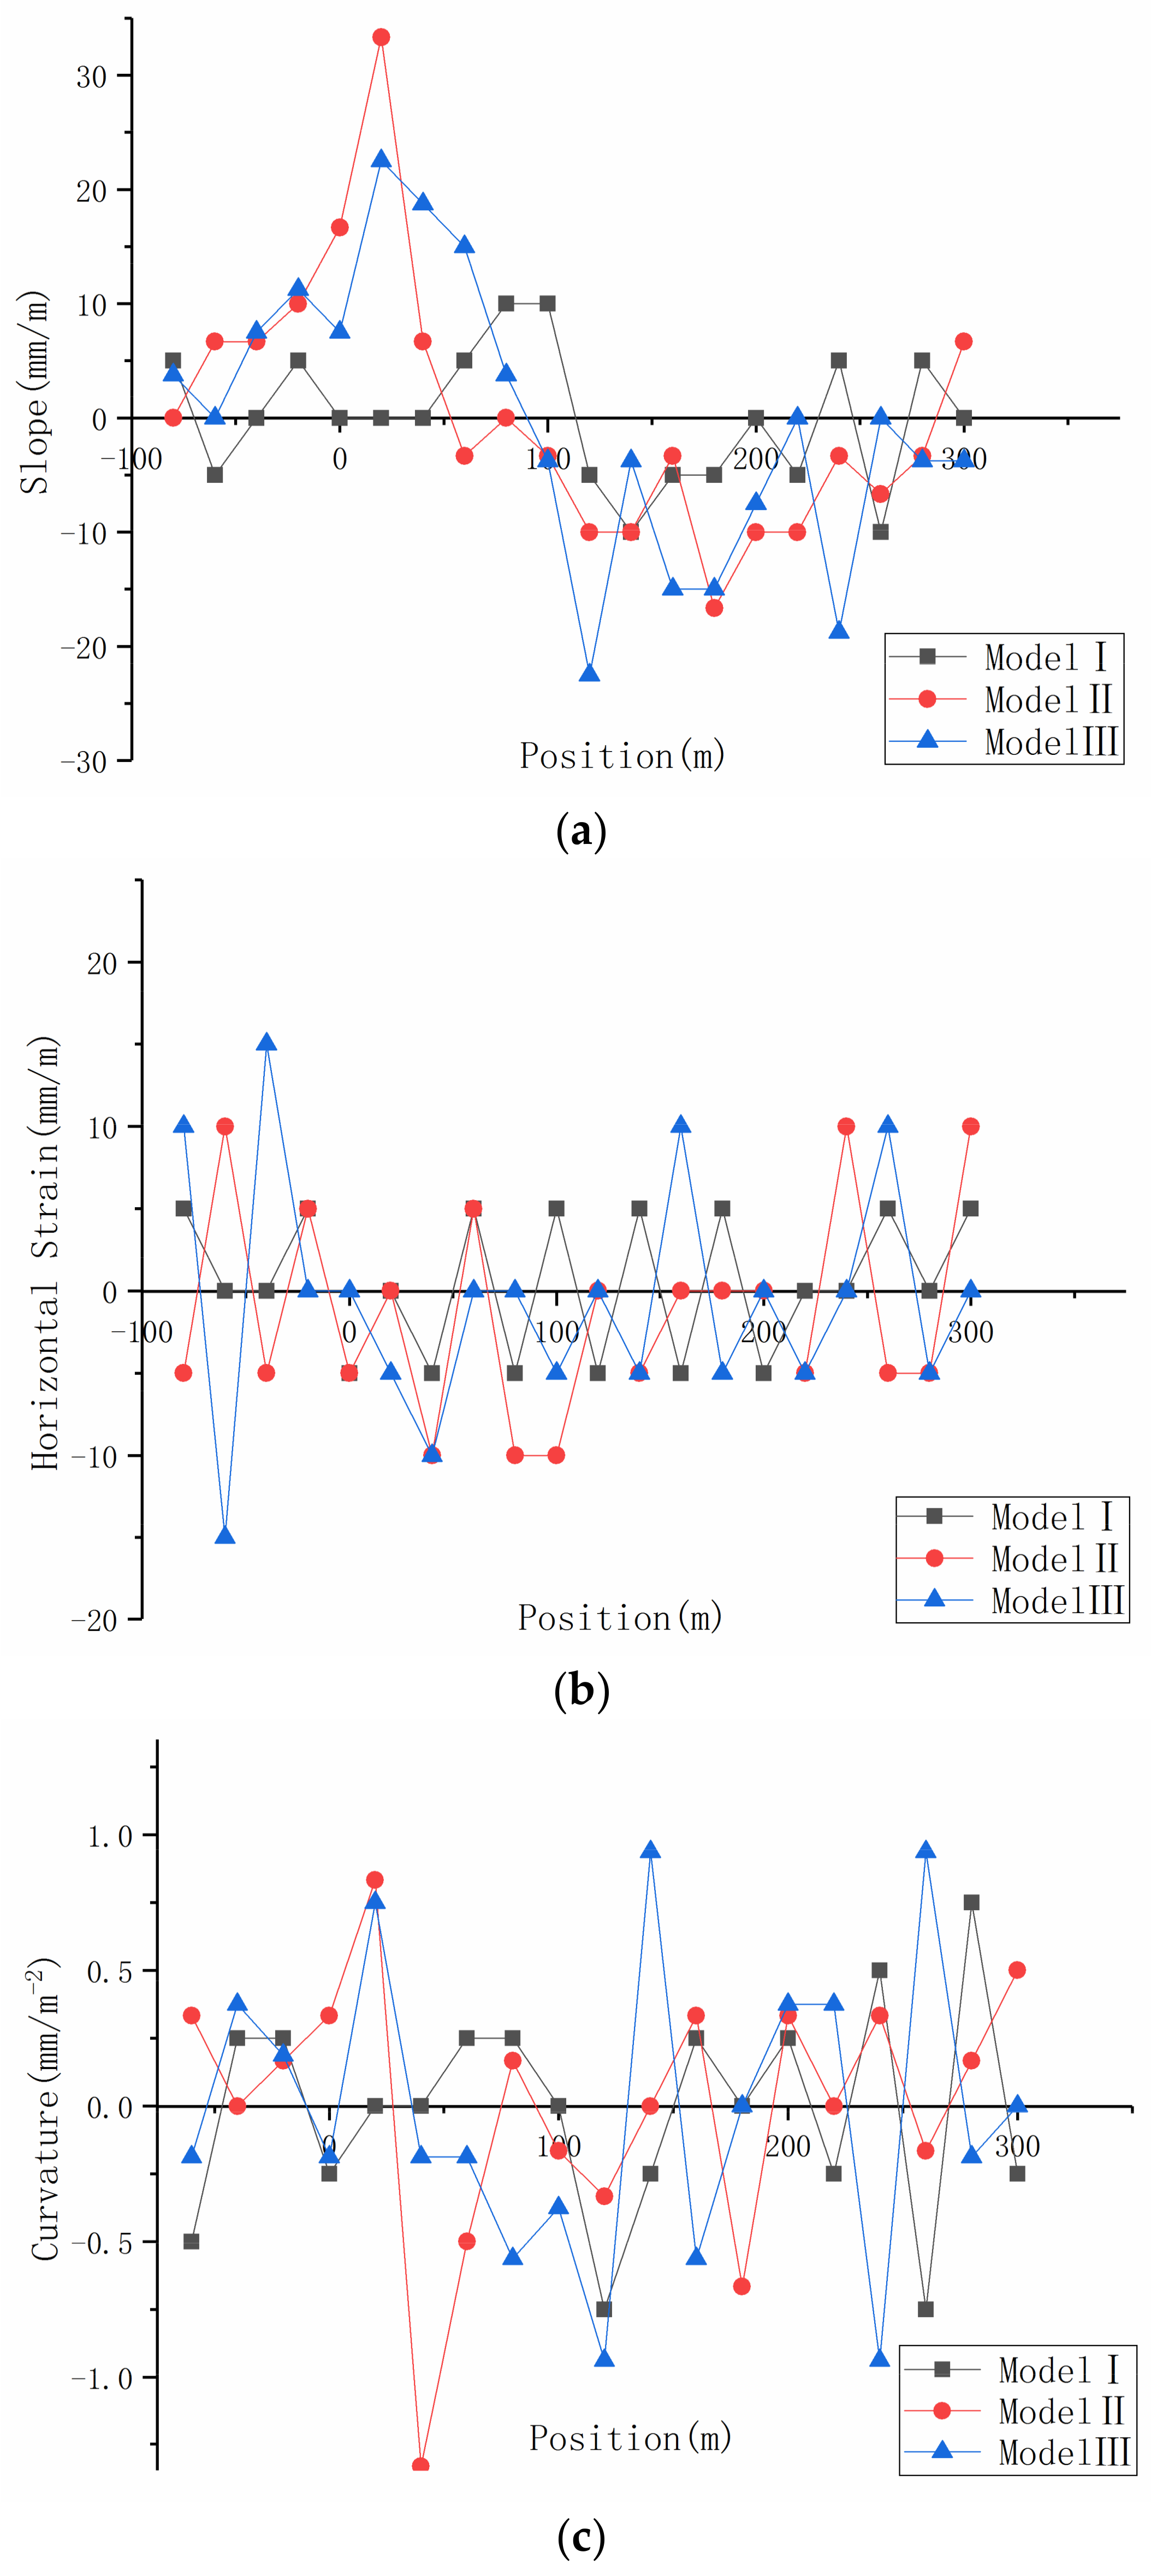
The subsidence produced by the ground movement is different to the horizontal movement [38,39], so the deformation is characterized by slope, curvature, and horizontal strain. The deformation of the aquitard floor at different mining depths after coal mining ended is shown in Figure 10. The mean absolute slopes of the three models were 4.5 mm/m, 8.3 mm/m, and 9.2 mm/m, respectively, and the mean absolute horizontal strains were 3.5 mm/m, 5.0 mm/m, and 6.0 mm/m, respectively; the mean absolute curvatures were 0.30 mm/m−2, 0.35 mm/m−2, and 0.43 mm/m−2 respectively.
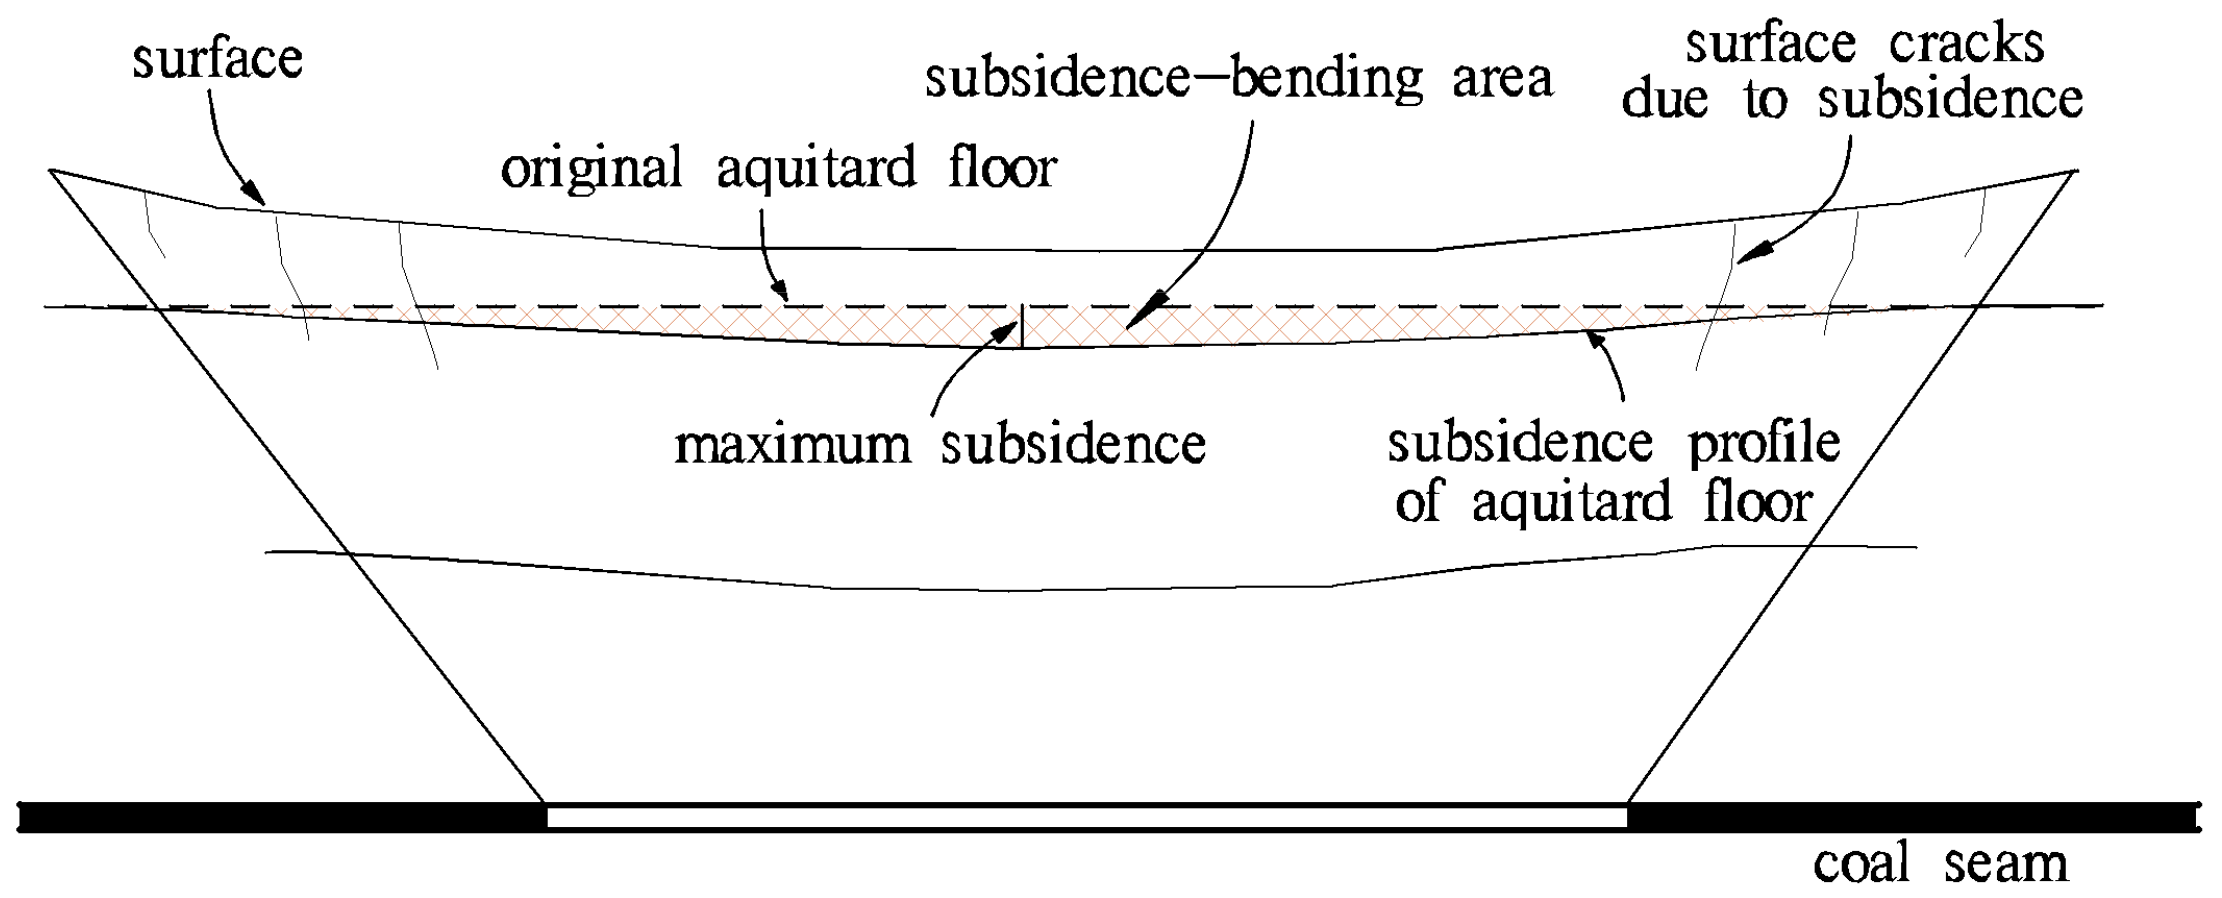
It was shown that the subsidence, the slope, the horizontal strain, and the curvature of the clay aquitard floor enlarged as the thickness of the overlying strata decreased. This indicated that the increases in the overburden thickness can hinder the ground deformation and thus lower the impact on the clay aquitard. Only at a large distance from the mined-out area will the exploitation have little impact on the unconsolidated confined aquifer. The silty clay aquitard is located in the continuous bending zone in which the rock layer deformed, although it is integral and continuous. The deformation of aquitard resulted in tiny cracks, and the fractured aquitard resulted in an increase in permeability. To establish and investigate the relationship between the deformation and the permeability of the aquitard floor, the deformation parameters exhibiting monotonicity with the working face advanced are selected as follows: the maximum subsidence, which reflects vertical displacement, and the subsidence-bending area, which controls the form in plane, as shown in Figure 11.
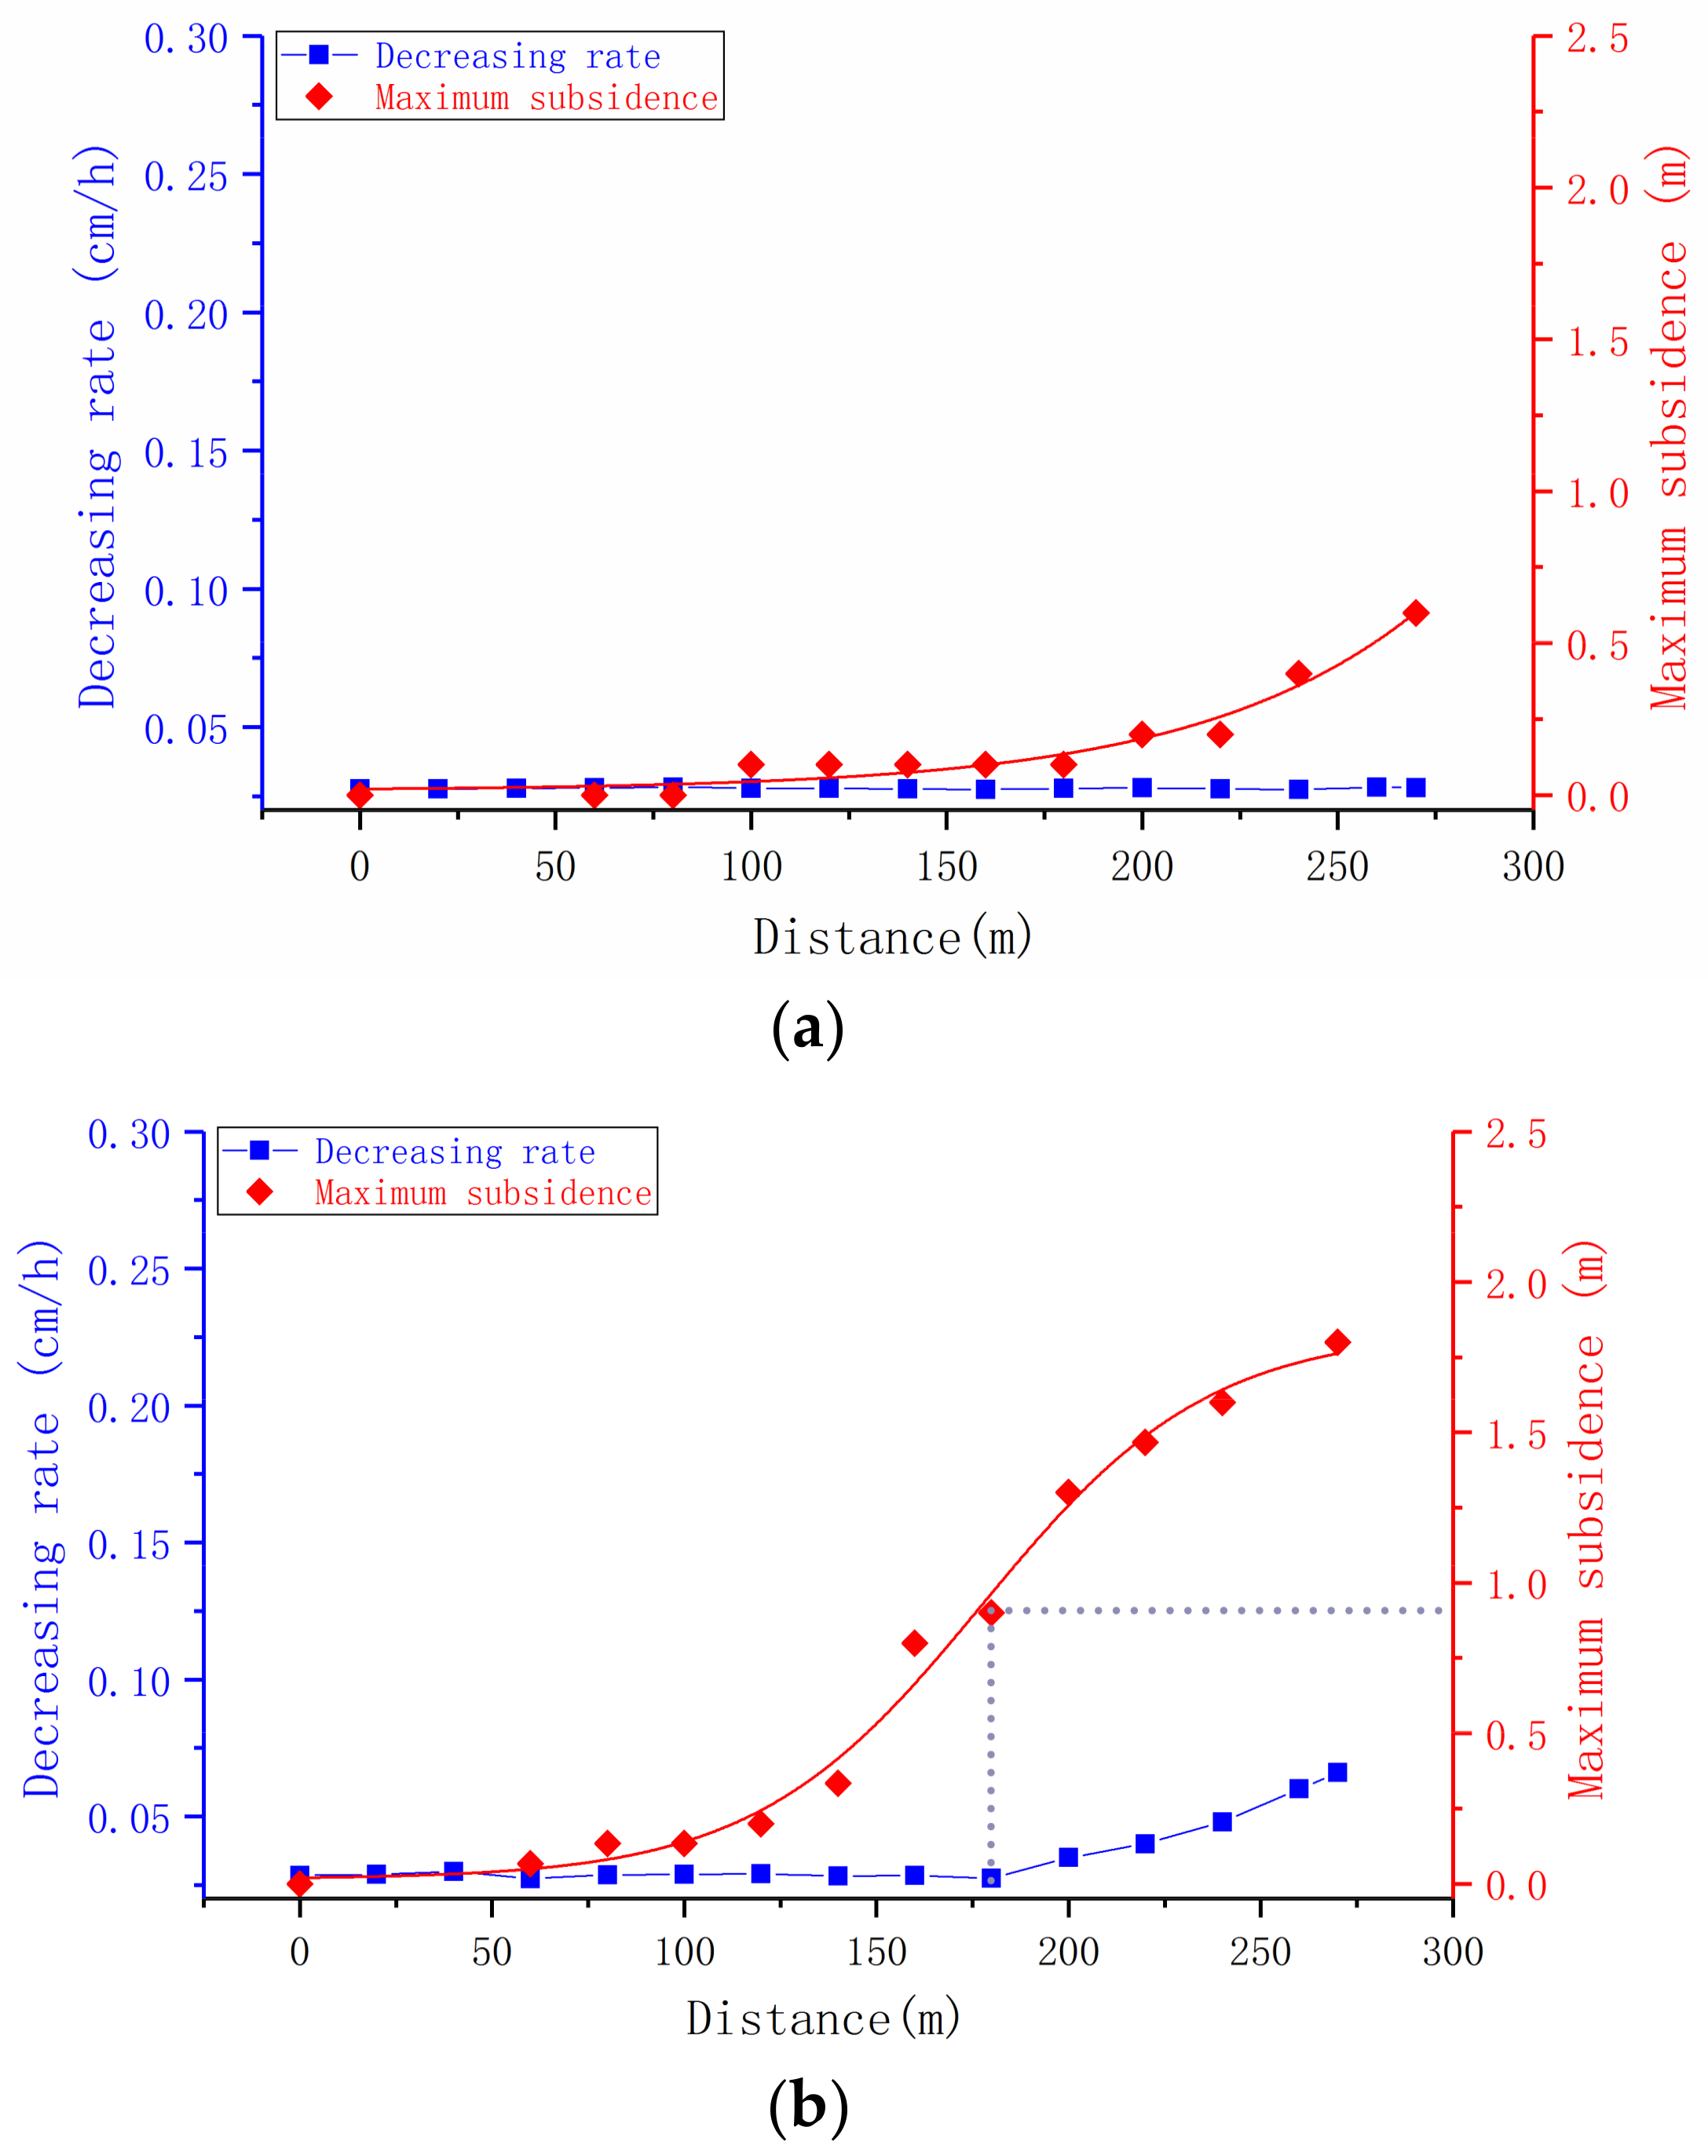
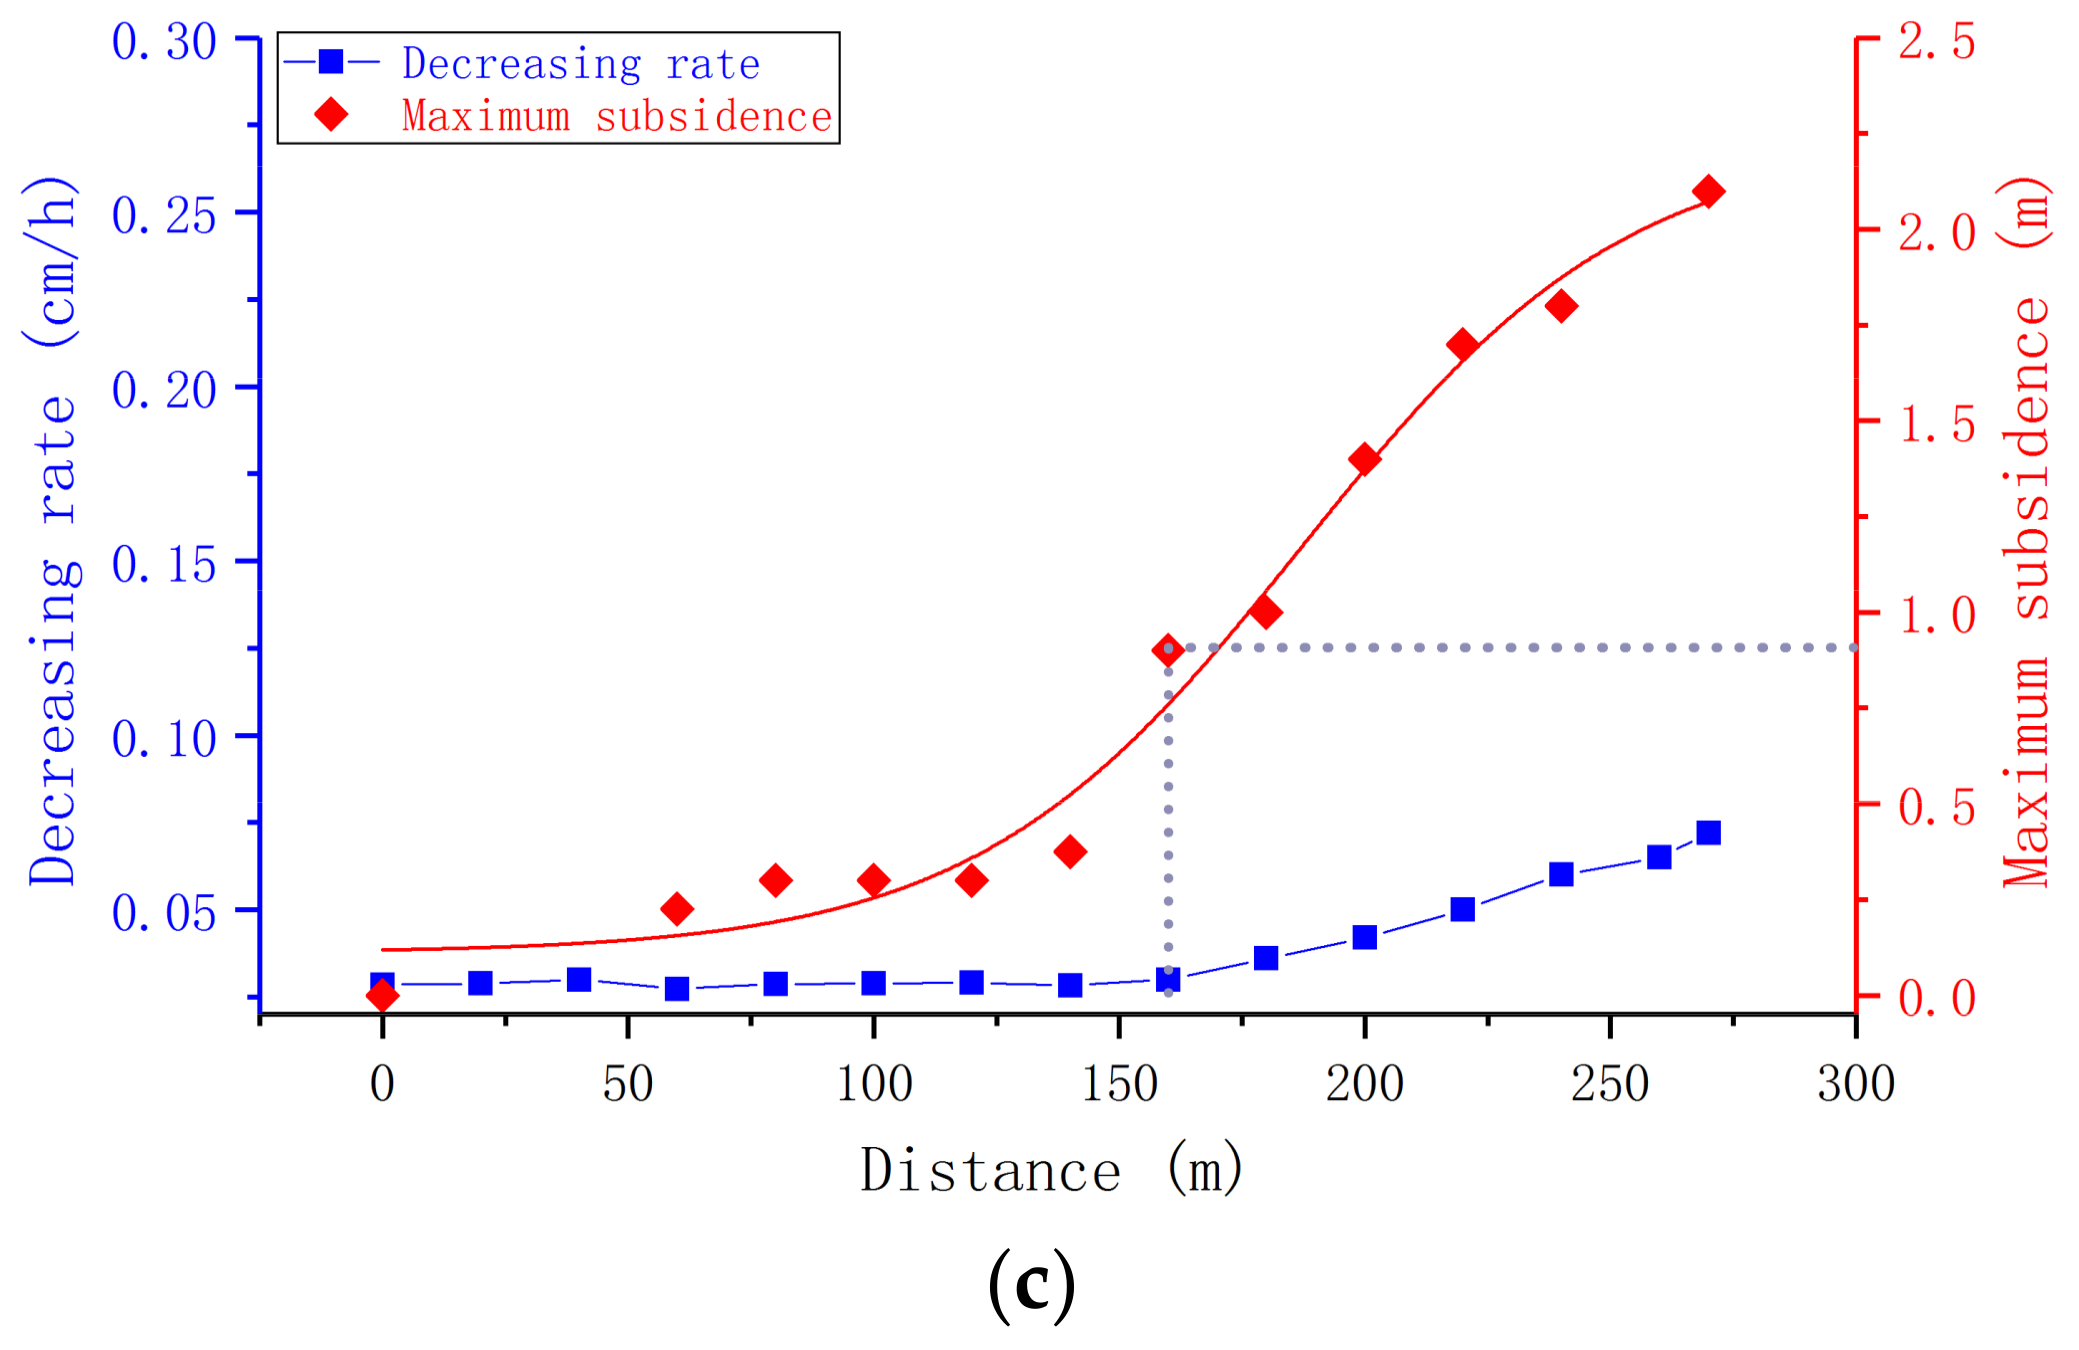
The relationship between the maximum subsidence of the aquitard floor and the water level at different mining depths is shown in Figure 12. The relationship between the subsidence-bending area of the aquitard floor and the water level at different mining depths is shown in Figure 13.
It can be seen that as the overburden height is reduced and the mining area is expanded, the clay aquitard continues to deform. When the deformation reached a certain extent, the original structure of the aquitard was damaged and its stability reduced. This led to further permeability enhancement. Coupled with the deformation analysis of the aquitard floor and the average infiltration rate, it was found that the loss of the water from the overlying unconsolidated aquifer was accelerated when the maximum subsidence of the bottom clay was greater than approximately 0.9 m, or when the subsidence-bending area of the bottom clay was greater than approximately 156 m2. The relationship between the strata deformation and the drawdown rate was obtained accordingly. At approximately this point, the water resistance of the bottom clay was significantly weakened, and the permeability was enhanced.
5. Conclusions
With a constant mining height and exploitation method, deeper mining results in greater overburden failure and faster fracture development. In addition, the damage to the clay aquitard located at the top of the overburden decreased, as the distance from the working face increased.
Some areas outside the fractured water-conducting zone were also affected by mining. The failure and the deformation features of the bottom aquitard were the key to revealing the mechanism of the groundwater depletion in the unconsolidated porous aquifer during deep mining. In all the models, the stability and the permeability of the clay aquitard underneath the unconsolidated aquifer were more or less affected by mining disturbance. In Model I, with an overburden of 189.6 m, the unconsolidated aquifer and its aquitard floor were located away from the disturbed zone, so the deformation of the bottom aquitard was small, as it was minimally affected by coal mining; the rate of decline of the groundwater level in the unconsolidated aquifer was nearly the same as under pre-mining conditions. In Model II and Model III, with overburden heights of 151.2 m and 102.6 m, respectively, the unconsolidated aquifer and aquitard were located in the disturbed zone; the aquitard floor was visibly deformed, and the drawdown rate of the water level was faster in the late mining period.
The loss of groundwater from the overlying unconsolidated aquifer does not accelerate until the maximum subsidence of the bottom clay exceeds approximately 0.9 m, or the subsidence-bending area of the bottom aquitard exceeds approximately 156 m2, which further leads to poor impermeability.
The results of the physical simulation tests with different mining depths provide an understanding of the drawdown mechanism of groundwater in the unconsolidated aquifer from the perspective of the strata movement and the deformation. It could afford a reference in theory for future coal mining with water conservation in arid and semi-arid regions of Northwestern China. The overburden is sufficiently thick to prevent water losses; thus, mining with backfilling is suggested; this process could lower the heights of the fractured water-conducting zone and the disturbed zone, and increase the thickness of the bedrock in the continuous bending zone. In addition, consolidation by horizontal well grouting for clay aquitard can be considered to strengthen its stability and impermeability. This will play an important role in coordinated growth of coal exploitation and environmental protection.
Author Contributions
Y.Z. conceived and designed the simulation experiments. S.X., K.W., and Y.G. performed the model experiments. S.X. analyzed the data and wrote the paper. J.C. and H.S. corrected the grammar errors and provided some suggestions for improving the manuscript.
Funding
This research is funded by National Natural Science Foundation of China (Grant No. 41572221) and National Natural Youth Science Foundation of China (Grant No. 41502243).
Acknowledgments
The authors gratefully acknowledge the financial support and thank Yongxin Xu and Engineer Haodong Sun for providing assistance to conduct this research.
Conflicts of Interest
The authors declare no conflicts of interest.
References
- Zhang, D.S.; Fan, G.W. Field trials of aquifer protection in longwall mining of shallow coal seams in China. Int. J. Rock Mech. Min. Sci. 2010, 47, 908–914. [Google Scholar] [CrossRef]
- Howladar, M.F. Coal mining impacts on water environs around the Barapukuria coal mining area, Dinajpur, Bangladesh. Environ. Earth Sci. 2013, 70, 215–226. [Google Scholar] [CrossRef]
- Tiwary, R.K. Environmental impact of coal mining on water regime and its management. Water Air Soil Poll. 2001, 132, 185–199. [Google Scholar] [CrossRef]
- Singh, M.M.; Kendorski, F.S. Strata disturbance prediction for mining beneath surface water and waste impoundments. In Proceedings of the 1st conference on ground control in mining, Morgantown, WV, USA, 27–29 July 1981; West Virginia University: Morgantown, WV, USA, 1981. [Google Scholar]
- Peng, S.S. Surface Subsidence Engineering; Society for Mining, Metallurgy and Exploration: New York, NY, USA, 1992. [Google Scholar]
- Booth, C.J. Groundwater as an environmental constraint of longwall coal mining. Environ. Geol. 2006, 49, 796–803. [Google Scholar] [CrossRef]
- Zhang, X.; Yu, H.; Dong, J.; Liu, S.; Huang, Z.; Wang, J.; Wong, H. A physical and numerical model-based research on the subsidence features of overlying strata caused by coal mining in Henan, China. Environ. Earth Sci. 2017, 76, 705. [Google Scholar] [CrossRef]
- Bai, M.; Elsworth, D. Some aspects of mining under aquifers in China. Min. Sci. Technol. 1990, 10, 81–91. [Google Scholar] [CrossRef]
- Miao, X.; Cui, X.; Wang, J.; Xu, J. The height of fractured water-conducting zone in undermined rock strata. Eng. Geol. 2011, 120, 32–39. [Google Scholar] [CrossRef]
- Du, F.; Gao, R.; Sciubba, E. Development patterns of fractured water-conducting zones in longwall mining of thick coal seams—A case study on safe mining under the Zhuozhang River. Energies 2017, 10, 1856. [Google Scholar] [CrossRef]
- Ma, L.; Jin, Z.; Liang, J.; Sun, H.; Zhang, D.; Li, P. Simulation of water resource loss in short-distance coal seams disturbed by repeated mining. Environ. Earth Sci. 2015, 74, 5653–5662. [Google Scholar] [CrossRef]
- Yuan, H.; Zhang, G.L.; Yang, G.Y. Numerical simulation of dewatering thick unconsolidated aquifers for safety of underground coal mining. Min. Sci. Technol. 2009, 19, 312–316. [Google Scholar] [CrossRef]
- Di, X.B. Analysis on the influence of Coal Mining on shallow groundwater in Changcun Coal Mine. Min. Saf. Environ. Prot. 2012, 29, 87–89. [Google Scholar]
- Jiao, Y.; Bai, H.B.; Zhang, B.Y. Research on the effect of coal mining on the aquifer of Quaternary loose soils. J. Min. Saf. Eng. 2012, 29, 239–244. [Google Scholar]
- Booth, C.J. Strata-movement concepts and the hydrogeological impact of underground coal mining. Groundwater 1986, 24, 507–515. [Google Scholar] [CrossRef]
- Wu, X.; Jiang, X.W.; Chen, Y.F.; Wang, X.L.; Tan, S.H. Numerical modelling of fractures induced by coal mining beneath reservoirs and aquifers in china. Q. J. Eng. Geol. Hydrogeol. 2013, 46, 237–244. [Google Scholar] [CrossRef]
- Tammetta, P. Estimation of the height of complete groundwater drainage above mined longwall panels. Groundwater 2012, 51, 723–734. [Google Scholar] [CrossRef] [PubMed]
- Booth, C.J. Confined-unconfined changes above longwall coal mining due to increases in fracture porosity. Environ. Eng. Geosci. 2007, 13, 355–367. [Google Scholar] [CrossRef]
- Hill, J.G.; Price, D.R. The impact of deep mining on an overlying aquifer in Western Pennsylvania. Groundw. Monit. Remediat. 1983, 3, 138–143. [Google Scholar] [CrossRef]
- Booth, C.J.; Spande, E.D.; Pattee, C.T.; Miller, J.D.; Bertsch, L.P. Positive and negative impacts of longwall mine subsidence on a sandstone aquifer. Environ. Geol. 1998, 34, 223–233. [Google Scholar] [CrossRef]
- Booth, C.J.; Greer, C.B. Application of MODFLOW using TMR and discrete-step modification of hydraulic properties to simulate the hydrogeologic impact of longwall mining subsidence on overlying shallow aquifers. In Proceedings of Mine Water-Managing the Challenges; Rüde, T.R., Freund, A., Wolkersdorfer, C., Eds.; International Mine Water Association: Aachen, Germany, 2011; pp. 211–216. [Google Scholar]
- Sun, Y.J.; Xu, Z.M.; Dong, Q.H.; Liu, S.D.; Gao, R.B.; Jiang, Y.H. Forecasting water disaster for a coal mine under the Xiaolangdi Reservoir. J. China Univ. Min. Technol. 2008, 18, 516–520. [Google Scholar] [CrossRef]
- Majdi, A.; Hassani, F.P.; Nasiri, M.Y. Prediction of the height of destressed zone above the mined panel roof in longwall coal mining. Int. J. Coal Geol. 2012, 98, 62–72. [Google Scholar] [CrossRef]
- Tang, C.; Tang, C. Numerical simulation of progressive rock failure and associated seismicity. Int. J. Rock Mech. Min. Sci. 1997, 34, 249–261. [Google Scholar] [CrossRef]
- Zhang, S.; Tang, S.; Zhang, D.; Fan, G.; Wang, Z. Determination of the height of the water-conducting fractured zone in difficult geological structures: A case study in Zhao Gu No. 1 coal seam. Sustainability 2017, 9, 1077. [Google Scholar] [CrossRef]
- Yanli, H.; Jixiong, Z.; Baifu, A.; Qiang, Z. Overlying strata movement law in fully mechanized coal mining and backfilling longwall face by similar physical simulation. J. Min. Sci. 2011, 47, 618–627. [Google Scholar] [CrossRef]
- Wang, G.; Wu, M.M.; Wang, R.; Xu, H.; Song, X. Height of the mining-induced fractured zone above a coal face. Eng. Geol. 2016, 216, 140–152. [Google Scholar] [CrossRef]
- Lin, Y.M. Experimental Rock Mechanics—Simulation Study, 2nd ed.; China Coal Industry Publishing House: Beijing, China, 1984; pp. 3–54. [Google Scholar]
- Qu, Q.; Xu, J.; Wu, R.; Wei, Q.; Hu, G. Three-zone characterisation of coupled strata and gas behaviour in multi-seam mining. Int. J. Rock Mech. Min. Sci. 2015, 78, 91–98. [Google Scholar] [CrossRef]
- Whittaker, B.N.; Reddish, D.J.; Fitzpatrick, D.J. Ground Fractures Due to Longwall Mining Subsidence. Available online: https://www.imwa.info/docs/imwa_1985/IMWA1985_Whittaker_1057.pdf (accessed on 14 May 2018).
- Huang, Y.; Zhang, J.; Yin, W.; Sun, Q. Analysis of overlying strata movement and behaviors in caving and solid backfilling mixed coal mining. Energies 2017, 10, 1057. [Google Scholar] [CrossRef]
- Palchik, V. Formation of fractured zones in overburden due to longwall mining. Environ. Geol. 2003, 44, 28–38. [Google Scholar] [CrossRef]
- Huang, Q.X. Research on cracks zone of clay aquiclude in overburden. Appl. Mech. Mater. 2014, 548–549, 1744–1747. [Google Scholar] [CrossRef]
- Tammetta, P. Estimation of the change in hydraulic Conductivity above Mined Longwall Panels. Groundwater 2015, 53, 122–129. [Google Scholar] [CrossRef] [PubMed]
- Ma, D.; Miao, X.X.; Jiang, G.H.; Bai, H.B.; Chen, Z.Q. An experimental investigation of permeability measurement of water flow in crushed rocks. Transp. Porous Med. 2014, 105, 571–595. [Google Scholar] [CrossRef]
- Palchik, V. Experimental investigation of apertures of mining-induced horizontal fractures. Int. J. Rock Mech. Min. Sci. 2010, 47, 502–508. [Google Scholar] [CrossRef]
- Wang, S.; Li, X.; Wang, D. Void fraction distribution in overburden disturbed by longwall mining of coal. Environ. Earth Sci. 2016, 75, 151. [Google Scholar] [CrossRef]
- Ju, J.; Xu, J.; Xu, J. A case study of surface borehole wall dislocation induced by top-coal longwall mining. Energies 2017, 10, 2100. [Google Scholar] [CrossRef]
- Qian, M.G.; Shi, P.W. Mine Pressure and Strata Control, 1st ed.; China University of Mining and Technology Press: Xuzhou, China, 2003; pp. 180–181. ISBN 7-81070-813-9. [Google Scholar]
Figure 1.
Distribution of residential wells.

Figure 2.
Stratigraphic sections and mechanical properties of S6–9.

Figure 3.
Similar simulation experiment models and monitoring networks: (a) Model I; (b) Model II; (c) Model III.
Figure 3.
Similar simulation experiment models and monitoring networks: (a) Model I; (b) Model II; (c) Model III.


Figure 4.
Overburden failure and three-zone distribution: (a) Model I; (b) Model II; and (c) Model III.
Figure 4.
Overburden failure and three-zone distribution: (a) Model I; (b) Model II; and (c) Model III.

Figure 5.
Development of a fractured water-conducting zone.

Figure 6.
Schematics of fissure development. (a) Workface advanced 140 m in Model I; (b) Workface advanced 140 m in Model II; (c) Workface advanced 140 m in Model III; (d) Workface advanced 230 m in Model I; (e) Workface advanced 230 m in Model II; (f) Workface advanced 230 m in Model III; (g) Workface advanced 270 m in Model I; (h) Workface advanced 270 m in Model II; (i) Workface advanced 270 m in Model III.

Figure 7.
Changes in the rate of decrease of the water level.

Figure 8.
Relationship between the drawdown and Hb before and after mining.

Figure 9.
Subsidence of the aquitard floor: (a) Model I; (b) Model II; and (c) Model III.

Figure 10.
Deformation of the clay aquitard floor: (a) Slope; (b) horizontal strain; and (c) curvature.
Figure 10.
Deformation of the clay aquitard floor: (a) Slope; (b) horizontal strain; and (c) curvature.

Figure 11.
Subsidence cross section of aquitard.

Figure 12.
Relationship between the maximum subsidence of the aquitard and the rate of decline of the water level: (a) Model I; (b) Model II; and (c) Model III.
Figure 12.
Relationship between the maximum subsidence of the aquitard and the rate of decline of the water level: (a) Model I; (b) Model II; and (c) Model III.


Figure 13.
Relationship between the subsidence-bending area of the aquitard and the rate of decline of the water level: (a) Model I; (b) Model II; and (c) Model III.
Figure 13.
Relationship between the subsidence-bending area of the aquitard and the rate of decline of the water level: (a) Model I; (b) Model II; and (c) Model III.


Table 1.
The infiltration rate of the water level in an unconsolidated aquifer before mining.
| Model | Drawdown (cm) | Time (h) | Mean Infiltration Rate (cm/h) |
|---|---|---|---|
| Model I | 1.15 | 42 | 0.0278 |
| Model II | 1.10 | 42 | 0.0262 |
| Model III | 1.19 | 42 | 0.0283 |
© 2018 by the authors. Licensee MDPI, Basel, Switzerland. This article is an open access article distributed under the terms and conditions of the Creative Commons Attribution (CC BY) license (http://creativecommons.org/licenses/by/4.0/).
Share and Cite
MDPI and ACS Style
Xu, S.; Zhang, Y.; Shi, H.; Wang, K.; Geng, Y.; Chen, J. Physical Simulation of Strata Failure and Its Impact on Overlying Unconsolidated Aquifer at Various Mining Depths. Water 2018, 10, 650. https://doi.org/10.3390/w10050650
AMA Style
Xu S, Zhang Y, Shi H, Wang K, Geng Y, Chen J. Physical Simulation of Strata Failure and Its Impact on Overlying Unconsolidated Aquifer at Various Mining Depths. Water. 2018; 10(5):650. https://doi.org/10.3390/w10050650
Chicago/Turabian StyleXu, Shuyuan, Yongbo Zhang, Hong Shi, Kai Wang, Yipeng Geng, and Junfeng Chen. 2018. "Physical Simulation of Strata Failure and Its Impact on Overlying Unconsolidated Aquifer at Various Mining Depths" Water 10, no. 5: 650. https://doi.org/10.3390/w10050650
Note that from the first issue of 2016, this journal uses article numbers instead of page numbers. See further details here.