Satellite-Based, Multi-Indices for Evaluation of Agricultural Droughts in a Highly Dynamic Tropical Catchment, Central Vietnam


1
Department of Civil and Environmental Engineering, University of Houston, Houston, TX 77004, USA
2
Da Nang Institute for Socio-Economic Development, Da Nang, Vietnam
3
National Center for Water Resources Planning and Investigation, Ministry of Natural Resources and Environment, Hanoi, Vietnam
4
Institute for Water and Environment, Vietnam Academy for Water Resources, Hanoi, Vietnam
*
Author to whom correspondence should be addressed.
Water 2018, 10(5), 659; https://doi.org/10.3390/w10050659
Submission received: 23 January 2018
/
Revised: 13 May 2018
/
Accepted: 15 May 2018
/
Published: 18 May 2018
(This article belongs to the Special Issue Applications of Remote Sensing and GIS in Hydrology)
Abstract
:Characterization of droughts using satellite-based data and indices in a steep, highly dynamic tropical catchment, like Vu Gia Thu Bon, which is the most important basin in central Vietnam, has remained a challenge for many years. This study examined the six widely used vegetation indices (VIs) to effectively monitor droughts that are based on their sensitivity with precipitation, soil moisture, and their linkage with the impacts on agricultural crop production and forest fires. Six VIs representing the four main groups, including greenness-based VIs (Vegetation Condition Index), water-based VIs (Normalized Difference Water Index, Land Surface Water Index), temperature-based VIs (Temperature Condition Index), and combined VIs (Vegetation Health Index, Normalized Difference Drought Index) were tested using MODIS data from January 2001 to December 2016 with the support of cloud-based Google Earth Engine computational platform. Results showed that droughts happened almost every year, but with different intensity. Vegetation stress was found to be mainly attributed to precipitation in the rice paddy fields and to temperature in the forest areas. Findings revealed that combined vegetation indices were more sensitive drought indicators in the basin, whereas their performance was different by vegetation type. In the rice paddy fields, NDDI was more sensitive to precipitation than other indices; it better captured droughts and their impacts on crop yield. In the forest areas, VHI was more sensitive to temperature, and thus had better performance than other VIs. Accordingly, NDDI and VHI were recommended for monitoring droughts in the agricultural and forest lands, respectively. The findings from this study are crucial to map drought risks and prepare an effective mitigation plan for the basin.
1. Introduction
Drought is a recurring and inevitable phenomenon that affects more than half of terrestrial earth each year [1,2]. Different from other natural disasters, their onset and progresses are unnoticeable and slow, yet their impacts are cumulative and devastating. They range from water shortage, ecological degradation, losses of agricultural production, to human health impacts, famine, and food crisis. Early detection and monitoring of drought is thus important to minimize the damages to the economy, environment, and human life.
Depending on the reference variables, drought is subdivided into different types, including meteorological drought (precipitation deficit), agricultural/soil moisture drought (moisture deficit), and hydrological drought (low stream flow and groundwater level) [3]. Various indices have been developed to assess and quantify drought severity. Meteorological drought indices (such as Palmer Drought Severity Index (PDSI) [4] and Standardized Precipitation Index (SPI) [5] solely use precipitation and/or temperature to estimate precipitation deficiencies for different timescales. Agricultural drought indices (Soil Moisture Deficit Index (SMDI), Evapotranspiration Deficit Index (ETDI) [6]) calculate soil water deficit and identify water stress for crops. Hydrological drought indices (Palmer Hydrological Drought Index (PHDI) [4], Standardized Streamflow Index (SSI) [7], Standardized Water-level Index (SWI) [8]) monitor hydrological conditions (streamflow, groundwater, etc.) at various timescales.
Agriculture is among the most vulnerable of all sectors to drought. In a drought prone region, poor farmers are the most vulnerable when extreme climate conditions could threaten the productivity of agricultural crops and increase economic losses. Not only are poor people among the most vulnerable, extreme climates could also increase the risk of making households become poor [9]. While agricultural drought causes the plant canopy lose vegetation water content and pigments, most of the agricultural drought indices use soil moisture to monitor drought and lack information about vegetation properties [6].
Ground weather stations provide a fairly good source of information for drought monitoring. However, they are often scattered and insufficient due to limited distribution and coverage of the gauging stations. Particularly in developing countries, where the stations are scarcely available, drought monitoring is a further arduous task. A growing number of Earth observation satellites provide useful data sources to monitor the changing dynamics of soil, water, and vegetation in terrestrial surface [10]. The satellite-based information is particularly helpful to monitor drought over areas with limited measuring gauges and improve the assessment of drought severity with higher spatial and temporal resolution [11]. Furthermore, remote sensing based vegetation indices (VIs), which combine different spectral bands, have been widely used to monitor vegetation responses to weather conditions, and thus assess drought conditions [11].
Several VIs that were developed since the 1980s could be categorized into four main groups (Table 1). Firstly, vegetation greenness indices (such as Normalized Difference Vegetation Index (NDVI) [12] and Enhanced Vegetation Index (EVI) [13]) are the most widely applied for monitoring vegetation health and drought conditions through measuring photosynthetic activity and canopy structural variations [11]. Given that variations in NDVI values are due to both weather and ecology components, Kogan [14] developed Vegetation Condition Index (VCI) in order to quantify the weather impacts on vegetation. Secondly, water-related VIs such as the Normalized Different Water Index (NDWI) [15] and Land Surface Water Index (LSWI) [16,17] have been identified as direct indicators of leaf water content; they are thus more sensitive to drought conditions than greenness related VIs [18,19]. Another approach to monitor drought and moisture availability is to use VIs derived from thermal infrared (TIR) satellite observations. Land Surface Temperature (LST), as computed from TIR bands, provides a direct measure of surface temperature and an indirect estimate of moisture availability [20]. As LST provides useful information about vegetation conditions, other temperature-related VIs, such as Temperature Condition Index (TCI) [14], and Normalized Difference Temperature Index (NDTI) [21] were developed to estimate soil moisture content, evapotranspiration and quantify drought stress. To further improve the drought monitoring ability, the combination of aforementioned groups has been used, such as Vegetation Health Index (VHI) [14], Temperature Vegetation Dryness Index (TVDI) [22], Vegetation Temperature Condition Index (VTCI) [23,24], and Normalized Different Drought Index (NDDI) [25].
Over the past three decades, Vietnam has experienced rapid economic growth and has become a major exporter of agricultural and industrial products [26]. Among all of the agricultural crops, rice is by far the most important crop, taking up 75 percent of all crops in Vietnam [27]. Vietnam, which was a net importer of rice in 1980s, has become the world’s second largest rice exporter in 2011 [28]. Although agriculture, forestry and fisheries accounts for 16 percent of gross domestic products in 2016, nearly 70 percent of the population still live in rural areas and 42 percent depend on agriculture for their livelihoods [29]. Farmers, who depend on direct utilization of natural resources, are thus at higher risks than any other social groups at losing their livelihoods during drought events. A typical example of such a paradox between economic growth and socio-economic differentiation in Vietnam is the Vu Gia Thu Bon (VGTB) river basin [26], which is the most important and major river basin in central Vietnam. Located in a tropical, humid, yet significantly uneven rainfall distributed region, VGTB is among the most vulnerable basins in Vietnam to drought, significantly affecting the sustainable development of region, whereas the basin-specific drought monitoring system is still absent [30,31]. With the limited ground observation data, which is a remote sensing based drought assessment, would be invaluable to decision-makers and farmers in the region to cope with droughts.
The Vu Gia Thu Bon is a highly ecologically and socio-economically dynamic, tropical, poorly gauging, recurrently, complicatedly and scatteredly drought impacted catchment, whereas its total area (10,000 km2) is quite small when compared to the scale of remote sensing images. Therefore, satellite based drought monitoring is substantially challenging and thus its application in this important basin is still limited. In Vietnam, satellite based vegetation indices have just been applied in a large-scale Lower Mekong basin [32] and in an arid and semi-arid rural district of Binh Thuan province [33], while using combined VIs based on both NDVI and LST data.
Since drought is inherently a complex phenomenon and its monitoring relies on the availability of good quality data, performance of drought indices could be different from place to place [34,35]. Choosing an appropriate index in such a challenging basin is important to detect the drought onset at an early stage. Accordingly, this study examines the performance of multiple satellite based vegetation indices for monitoring droughts in the VGTB from January 2001 to December 2016 using cloud-based Google Earth Engine (GEE) computational platform. Also, the study would investigate whether identified droughts by these indices are correlated with the negative impacts on agricultural crops and forest fires in the region. Six main indices, which were widely used for monitoring agricultural droughts, representative of each VI group were selected for the study, including NDWI, LSWI, VCI, TCI, VHI, and NDDI [11]. In Vietnam, the performance of VCI, TCI, VHI, and TDVI have been just explored in Binh Thuan province [33] and Lower Mekong basin [32], while water based VIs (NDWI, LSWI) and combined VIs (NDDI) have even not been examined yet. The other combined VI (VTCI) is also based on the use of NDVI and LST, thus it would not be much different from VHI. Accordingly, by comparing the performance of VIs with ground weather data and socio-economic data (drought impacts), the study would not only provide an effective basin-specific drought monitoring tool, but would also better help to understand the performance of VIs in different climatic regions of Vietnam.
2. Study Area and Data Used
2.1. Study Area
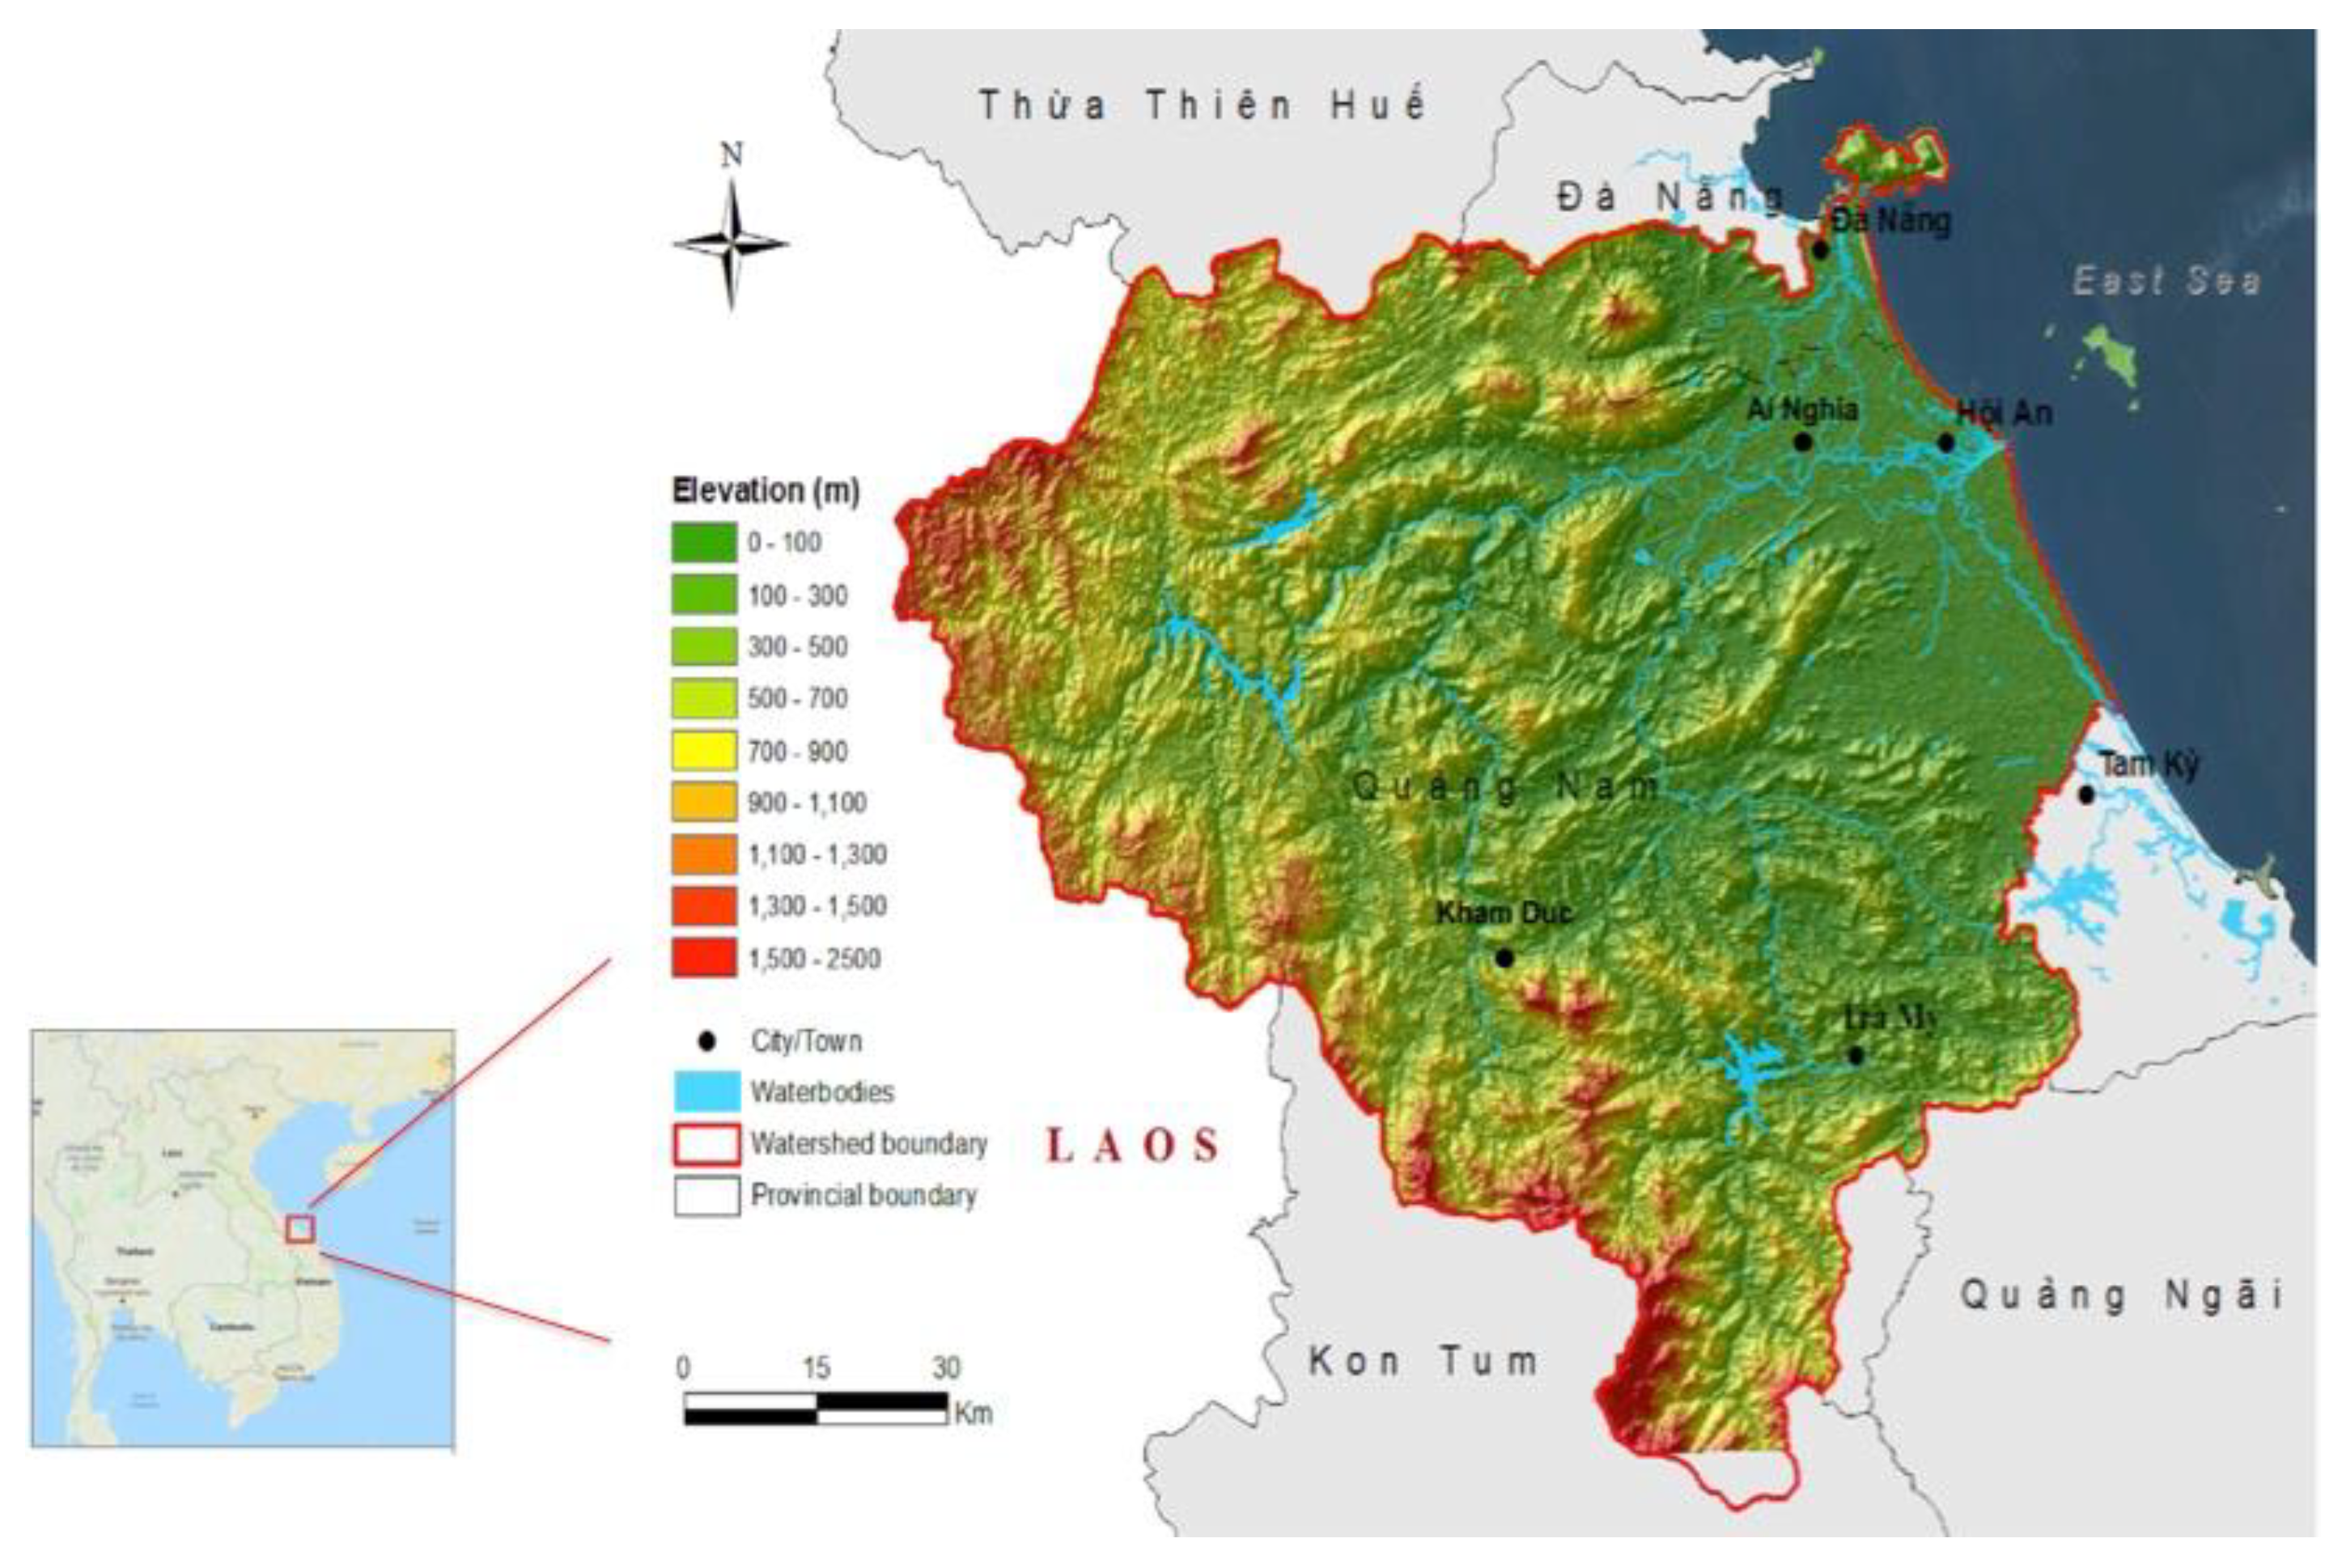
The trans-boundary VGTB river basin is located in central Vietnam (Figure 1). The western part of the VGTB basin is mountainous and sparsely populated, while the flat delta area in the east, covering about one-fifth of the basin area, is dominated by agriculture and urban development. Da Nang (about one million inhabitants), Hoi An, and Tam Ky (both about 100,000 inhabitants each) are the main cities, while the entire basin houses about 2.5 million people [38,39]. The river basin covers most of Quangnam and Da Nang provinces and is about 10,350 square kilometers in size, among which Quang Nam makes up 95 percent of the entire VGTB river basin [30].
The topographic conditions are favorable for water resource development supporting agriculture and hydropower. Numerous reservoirs and weirs are located in the basin irrigating over 30,000 ha of rice and 10,000 ha of subsidiary crops and cash-crop trees. Until now a total of seven hydropower projects are in operation, while another 42 are under construction or in the planning phase [40].
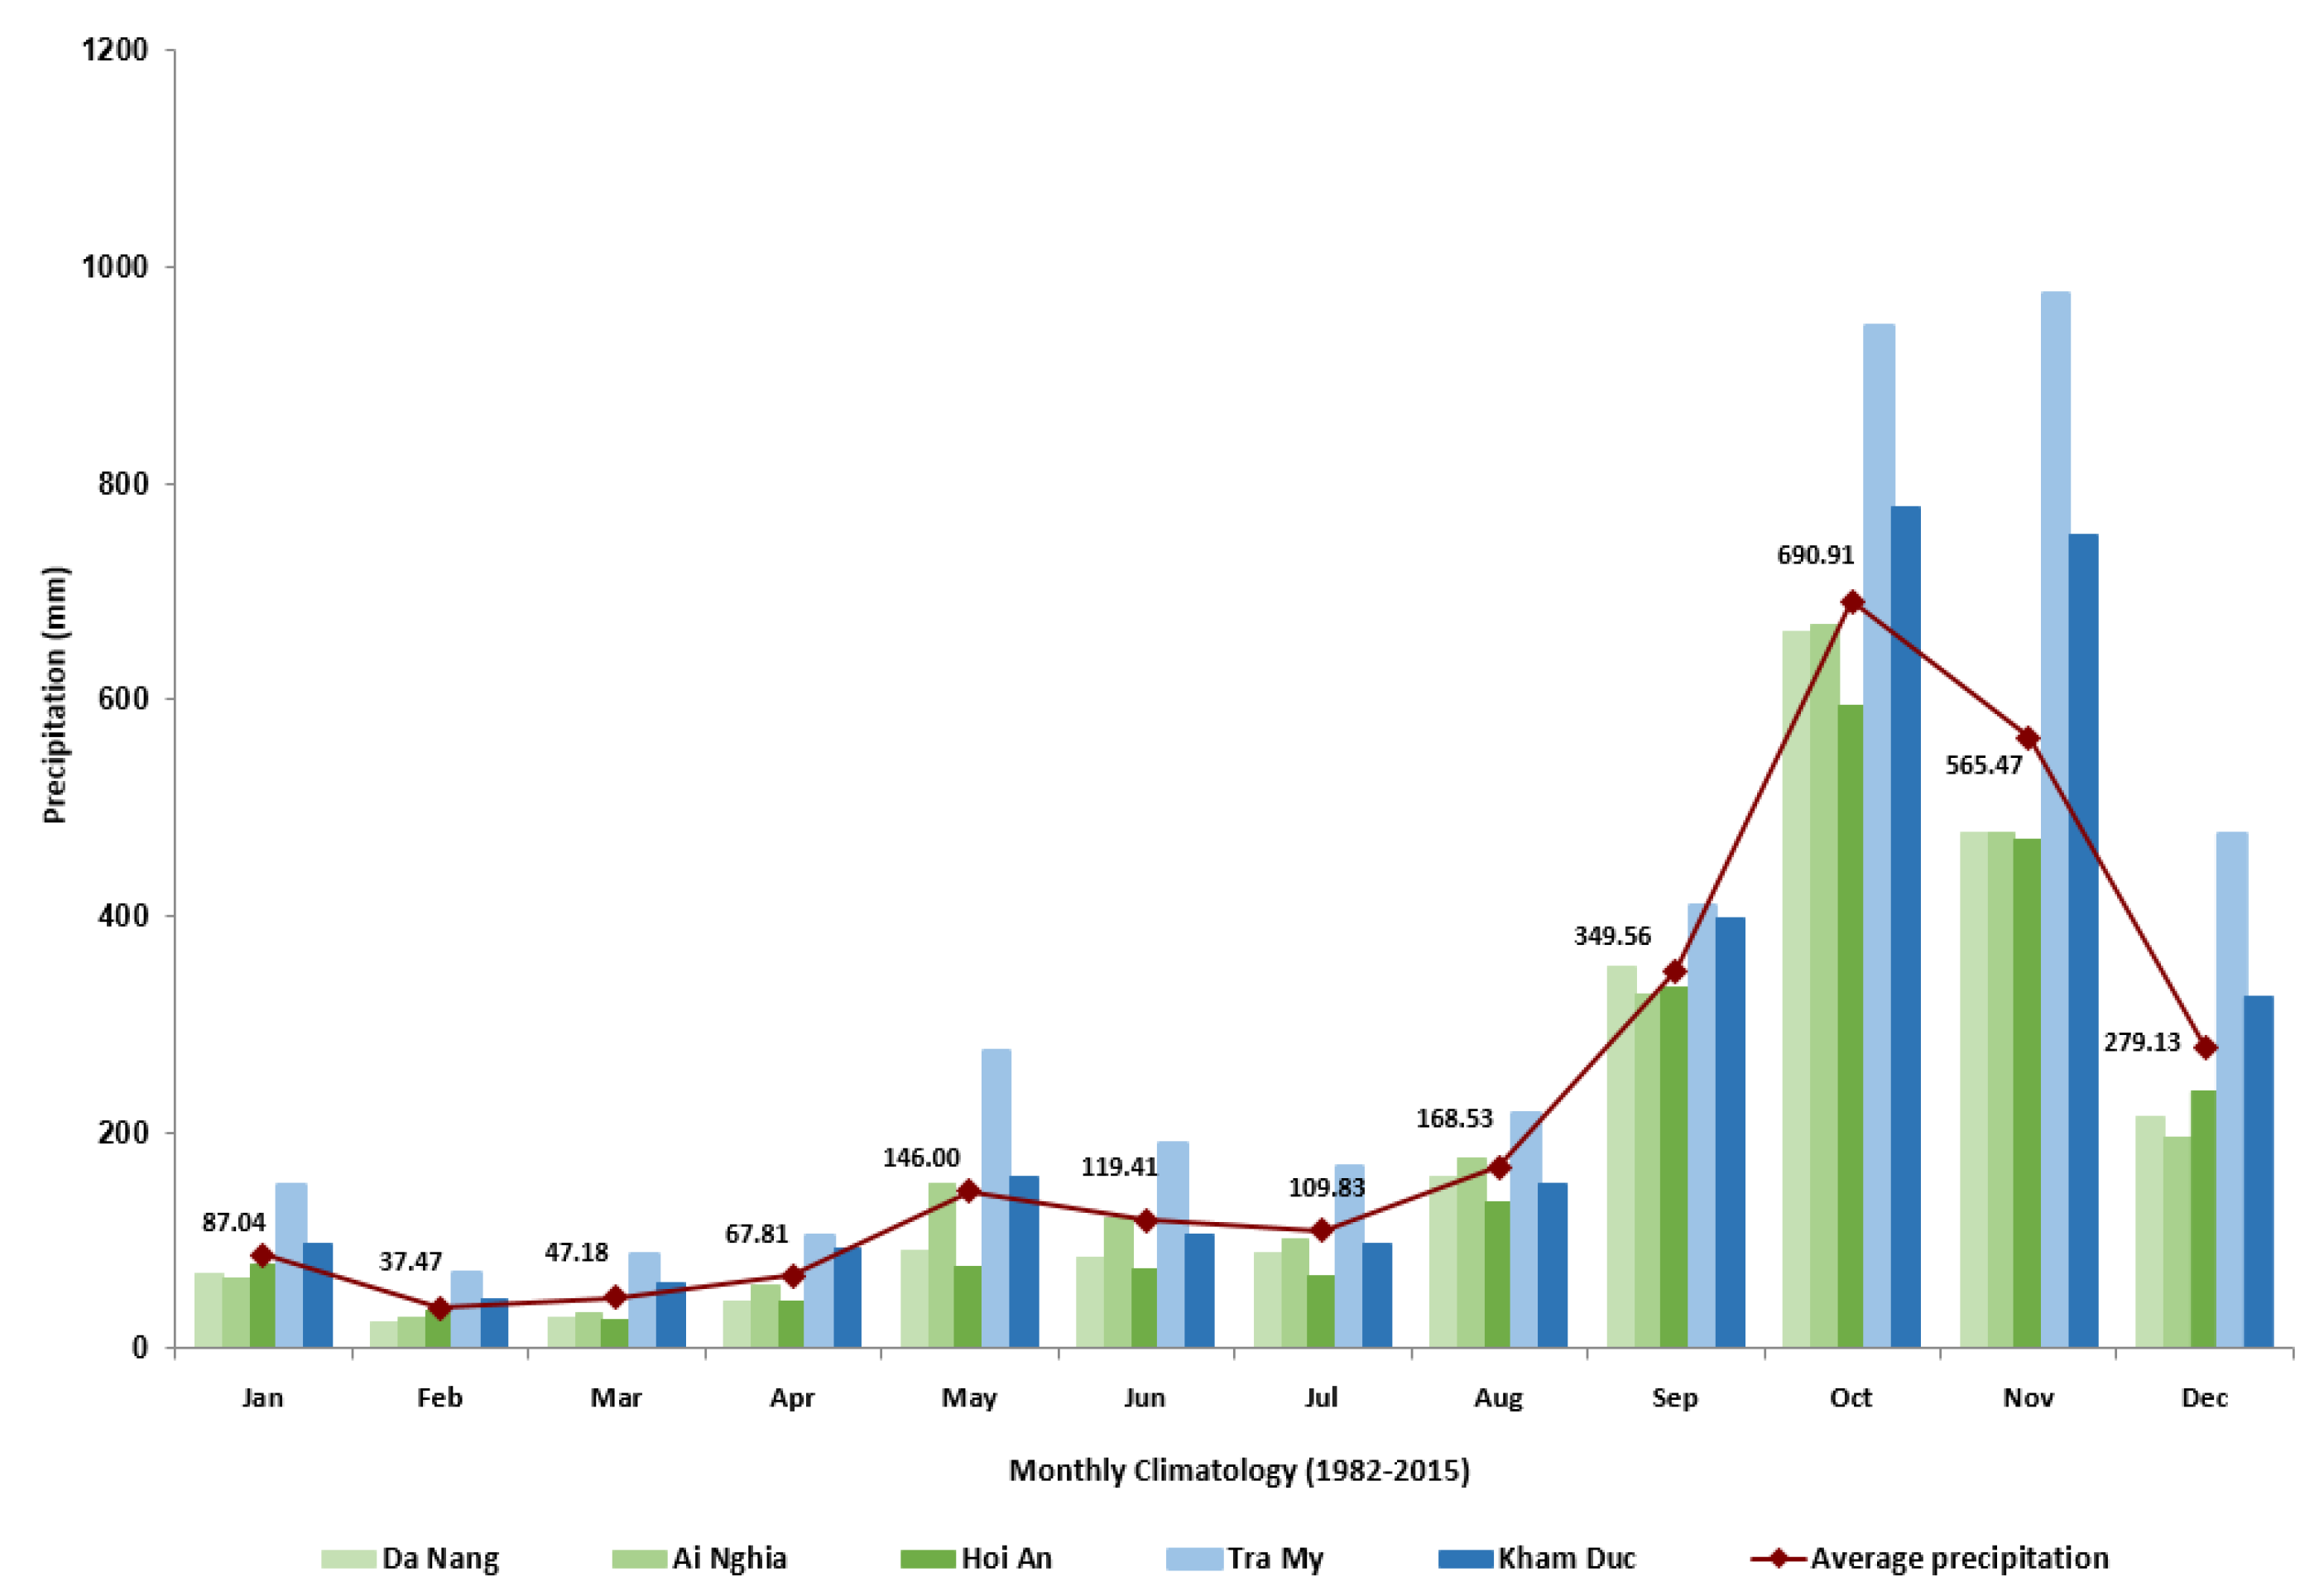
The total annual rainfall in the area varies between 2100 mm in the coastal area to about 4100 mm in the southern mountains (based on rainfall data of eleven ground weather stations from 1982 to 2015). There is a pronounced seasonality, with on average 70 percent of rain falling in the monsoon season from September to December (see Figure 2). October and November have the heaviest rainfall, with on average 47 percent of the annual rainfall. February and March are the driest months with on average three percent of the annual rainfall. In May and June, there is a small rainfall peak, with an average of 10 percent of the annual rainfall.
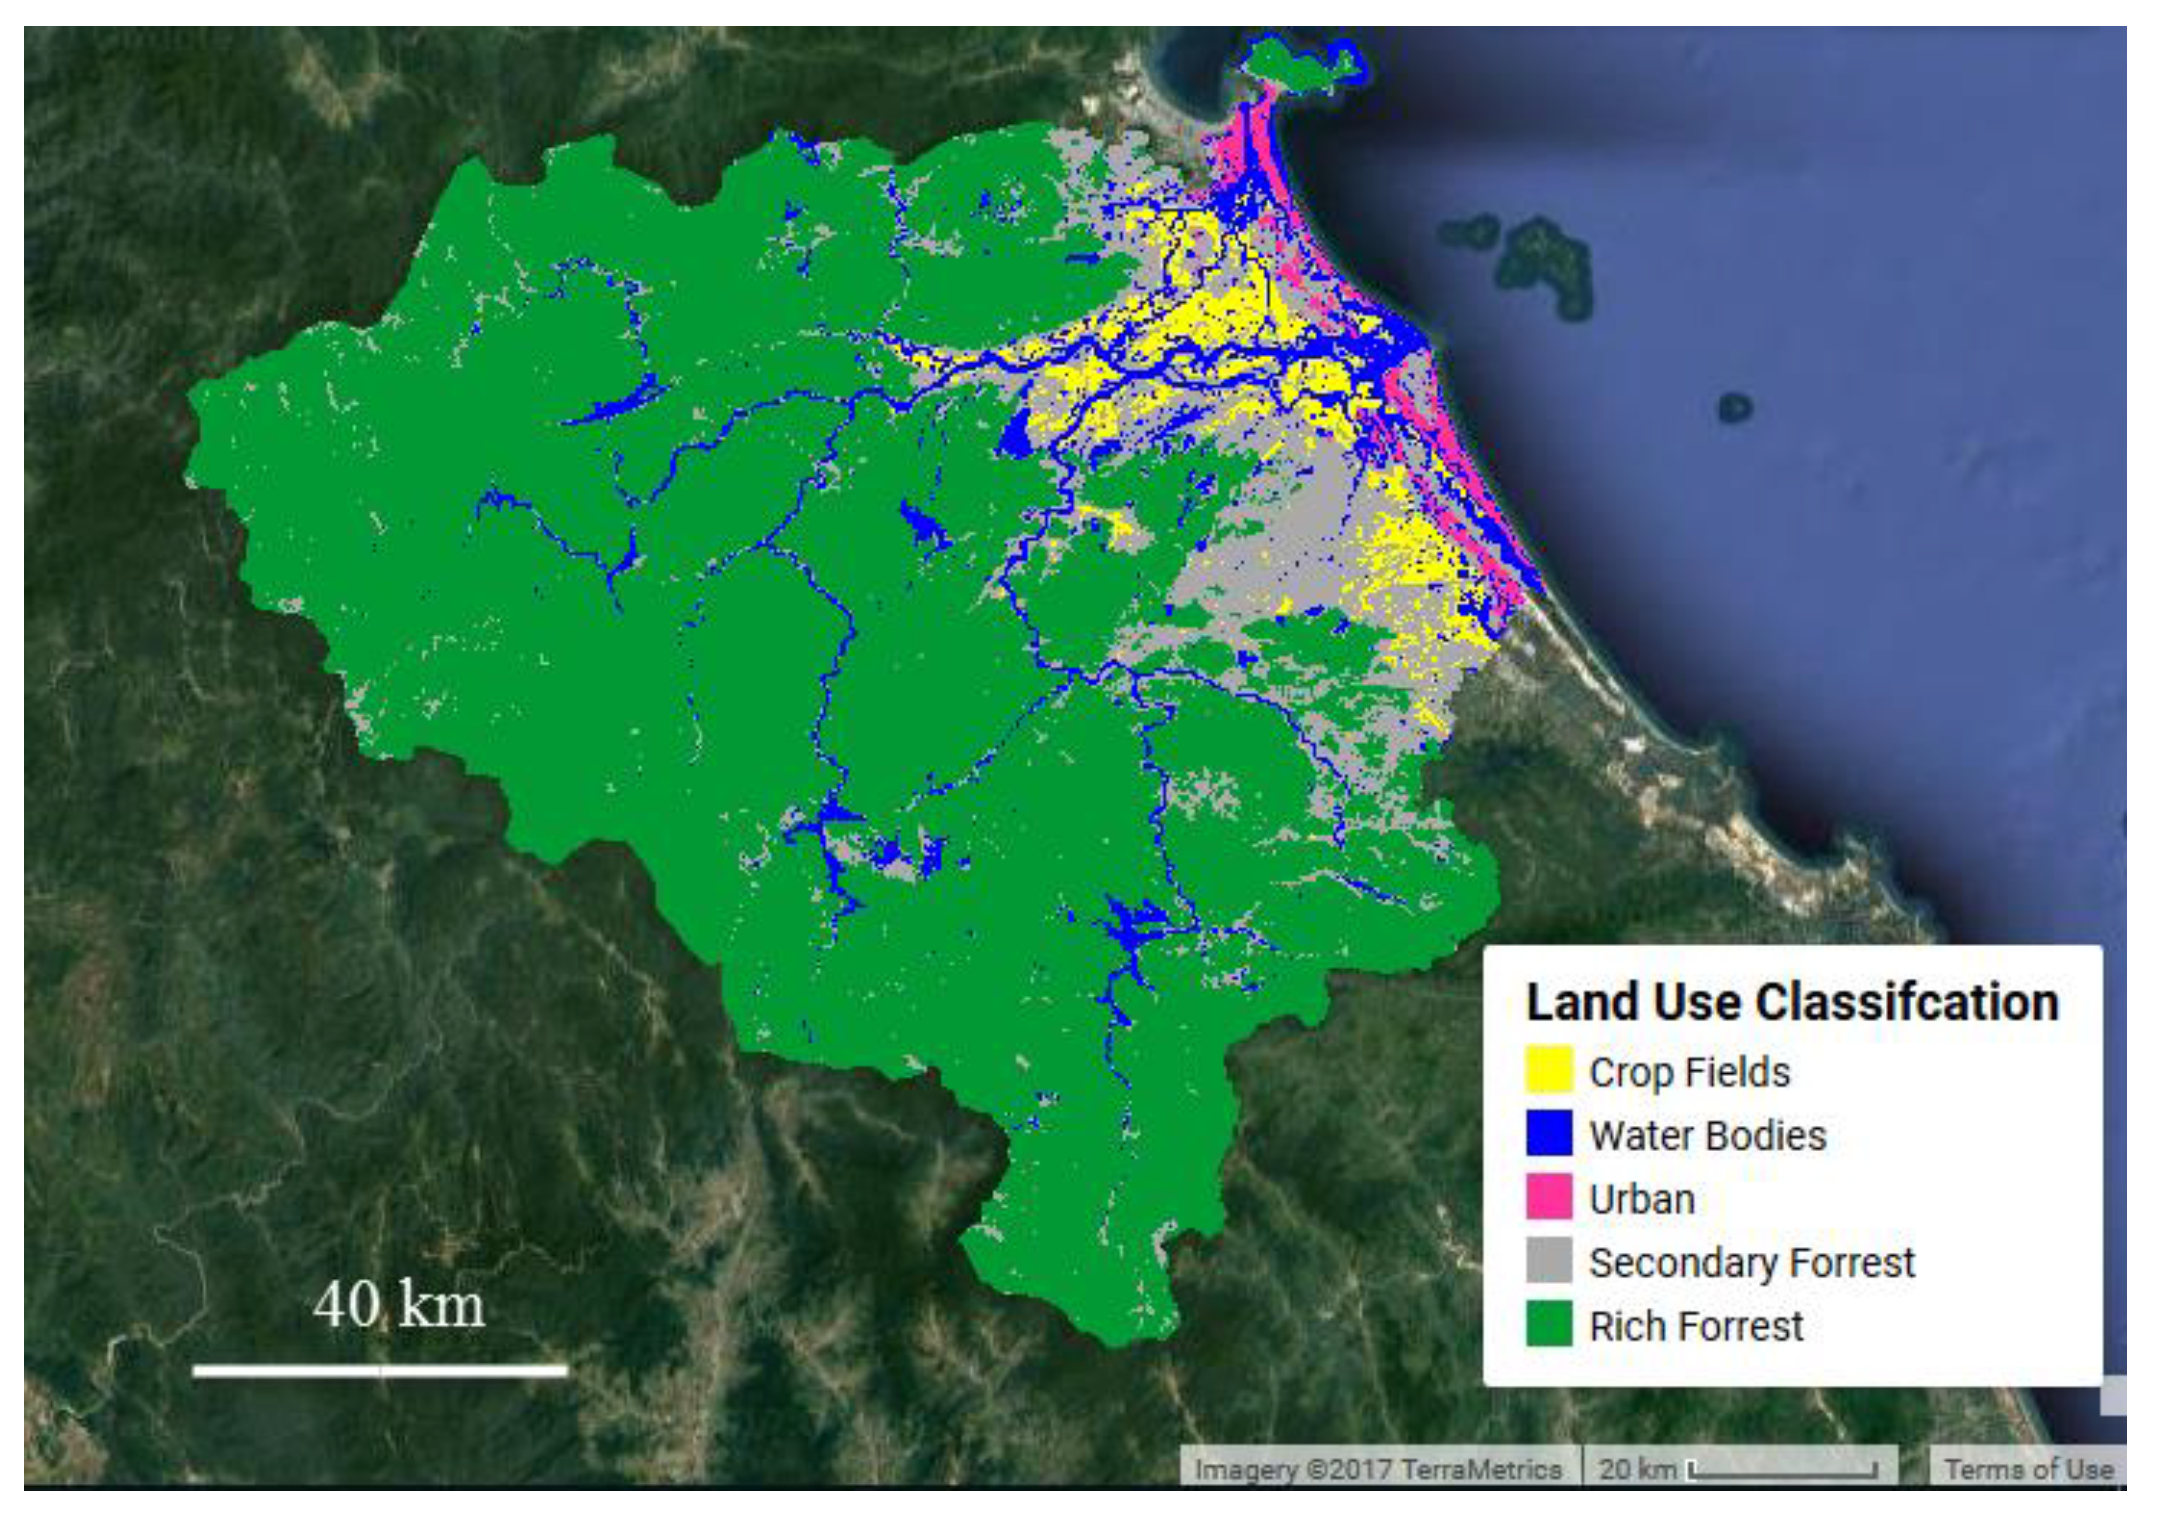
The basin has a diversified economy of agriculture, forestry, and fishery (9%), manufacturing (24%), construction (9%), and a broad range of private and public services (56%) [38,39] (Figure 3). Industry and services are for a large part located in Da Nang, Hoi An, and Tam Ky, while in the rest of the basin there is a heavy dependence on agriculture. Although contribution of agriculture, forestry, and fisheries to the economy in Quang Nam dropped from 51% in 1996 to only 10% in 2016, more than 50 percent of the households are still dependent on agriculture for income and food supply [39]. In Quang Nam, in 2016, the area of agricultural production land was about 220,000 ha (20 percent of the total land), consisting of 61,000 ha for paddy rice, 43,000 ha for miscellaneous gardens, and 116,000 ha for perennial crops; whereas the area of forestry land was 667,000 ha (63 percent of the total land) and 92,000 ha was urban land (nine percent of total land) [39]. The calendar for the main crop production, flood season, and dry periods is presented in Table 2 [30,41]. There are two main crops of paddy rice production: Winter-Spring crop from the end of December to the end of April and Summer–Autumn crop from early May to end of September. In years of normal weather conditions, dry period begins in February and ends with Xiaoman (small but sufficient) rain, which comes in May and June. Meanwhile, this period of years with dry spells lasts longer from January to July or even August.
2.2. Data Used
2.2.1. Moderate Resolution Imaging Spectroradiometer (MODIS) Data
Moderate Resolution Imaging Spectroradiometer (MODIS) provides a new generation of land data products to support global change research and natural resource management. The products are being applied in a wide range of water issues, such as wetland flooding characterization [42] and drought monitoring [18,19,25]. In this study, the MODIS data were obtained from the cloud-based Google Earth Engine (GEE) platform. GEE, with the use of millions of servers around the world and cloud-computing technology and storage capability, provides online access to worldwide coverage of many Earth-observing remote sensing imagery and allows for the scientific community to work on millions of images and trillions of pixels in a parallel computing environment, including Landsat, MODIS, among others, dating back from 2000 in the case of MODIS data [43] (https://earthengine.google.com).
The 16-Day composite MODIS Vegetation Indices product at a 250-m spatial resolution (MOD13Q1) [44] was used to calculate NDVI and NDWI at 250 m. MOD13Q1 V6 product from GEE includes six bands: NDVI, EVI, blue (469 nm), red (645 nm), near infrared (858 nm), and shortwave infrared (2105/2130–2155 nm). Since there is no 1600-nm-wavelength, which was reported to be the most sensitive to plant water content [45], the eight-day composite MODIS Surface Reflectance product at 500 m spatial resolution (MOD09A1) [46] was used to calculate LSWI [16,17]. MOD91A1 V6 production from GEE includes seven bands: blue (459–479 nm), green (545–565 nm), red (620–670 nm), two near infrared (NIR1: 841–876 nm; NIR2: 1230–1250 nm), and two shortwave infrared (SWIR1: 1628–1652 nm, SWIR2: 2105–2155 nm). MOD13Q1 includes vegetation indices quality control for both VIs indicators and surface reflectance bands, whereas MOD09A1 includes quality control flags for surface reflectance bands.
The eight-day composite MODIS Land Surface Temperature (LST) product at 1-km spatial resolution (MOD11A2) [47] was used to obtain day land surface temperature. MOD11A2 includes quality control for daytime LST and emissivity.
Because of differences in spatial resolution between NDVI, NDWI, LSWI and LST, reprojection function with the nearest neighbor resampling by default in GEE was used to resample NDVI, NDWI and LSWI to the same 1-km spatial resolution with LST.
Since MODIS data providers actively encourage using quality band to screen out poor quality data [44,46,47], the quality reliability of MOD13Q1, MOD09A1, and MOD11A2 products was evaluated. For MOD13Q1, a pixel was considered reliable if VI quality flag (bit 0–1) was “Good data, use with confidence” (value 0). For MOD09A1, a pixel passed quality screening if Cloud State (bits 0–1) was “Clear” (value 0) and Cloud Shadow (bit 2) was “No” (value 0). For MOD11A2, if a pixel with “Mandatory QA (quality assurance) flags” (bit 0–1) band was “Pixel produced, good quality, not necessary to examine more detailed QA” (value 0), that pixel was good to be included in the study. One of the limitations of MODIS data was cloud contamination. Cloud-screening and quality control flag process of MODIS data eliminates many pixels of 16-day and eight-day MODIS products. Therefore, the monthly NDVI, NDWI, LSWI, and LST derived from those products seem to be suitable to be used in this study.
2.2.2. Precipitation & Soil Moisture Data
In-situ precipitation is collected from the Hydro-meteorological station for central Vietnam (http://kttvttb.vn/). The data is available from January 1982 until December 2013 for eight stations (Ai Nghia, Hoi An, Cau Lau, Nong Son, Que Son, Cam Le, Tien Phuoc, and Kham Duc) and from January 1982 until October 2015 for the remaining three Stations (Da Nang, Tam Ky, and Tra My). In addition, National Aeronautics and Space Administration (NASA)–U.S. Department of Agriculture (USDA) Global soil moisture, which is collected through GEE computing platform, is used. NASA-USDA derived soil moisture integrates satellite-derived Soil Moisture Ocean Salinity (SMOS) Level 2 soil moisture observations into a two-layer modified Palmer soil moisture model using a one-dimensional (1-D) Ensemble Kalman Filter (EnKF) data assimilation approach [48]. This dataset provides soil moisture information globally at 0.25° × 0.25° spatial resolution, and is available from January 2010 until now.
2.2.3. Crop Yield and Forest Fires
Drought is a recurrent phenomenon in VGTB. From 2001 until 2015, Buurman et al. [30] identified 2002 until 2007, 2010, 2012, 2013, 2014, and 2015 as meteorological drought in the basin based on SPI-12 of rainfall data from 1970 until 2015. Most of interviewed farmers in Quang Nam identified that drought seriously influenced their agricultural production, especially rice production [30,49]. 70 percent of interviewed farmers identified that the impacts of droughts and water shortage on rice cultivation became serious every year [49]. Rice plants are the most sensitive at the flowering and ripening stages and negatively affected by high temperatures. Rising temperatures, together with longer periods of low rainfall level, are identified as the reason for decreasing production yield of paddy rice [49,50]. Additionally, the growing land use change from natural forest to monoculture is also identified to cause faster runoff and to exacerbate seasonal water shortage [50].
Forests play an important role in regulating streamflow. Deforestation can reduce surface water quality, increase flow rate and flood frequency, and also reduce groundwater recharge, which is the essential source of river baseflow during drought season [51,52]. During the Vietnam War (1940–1970s), forest areas decreased rapidly because of chemical defoliants and napalm bombing [53]. After the war (1976–1990), forest cover continued to diminish because of logging, overharvesting of forest products, and the conversion of forests into agriculture by slash and burn method [54]. As a result, many of primary forests in central Vietnam were converted to fire-prone grassland, and are thus more susceptible to forest fires [55]. Frequent forest fires would lead to soil degradation and reduce the amount and quality of surface water, further exacerbating drought in the basin.
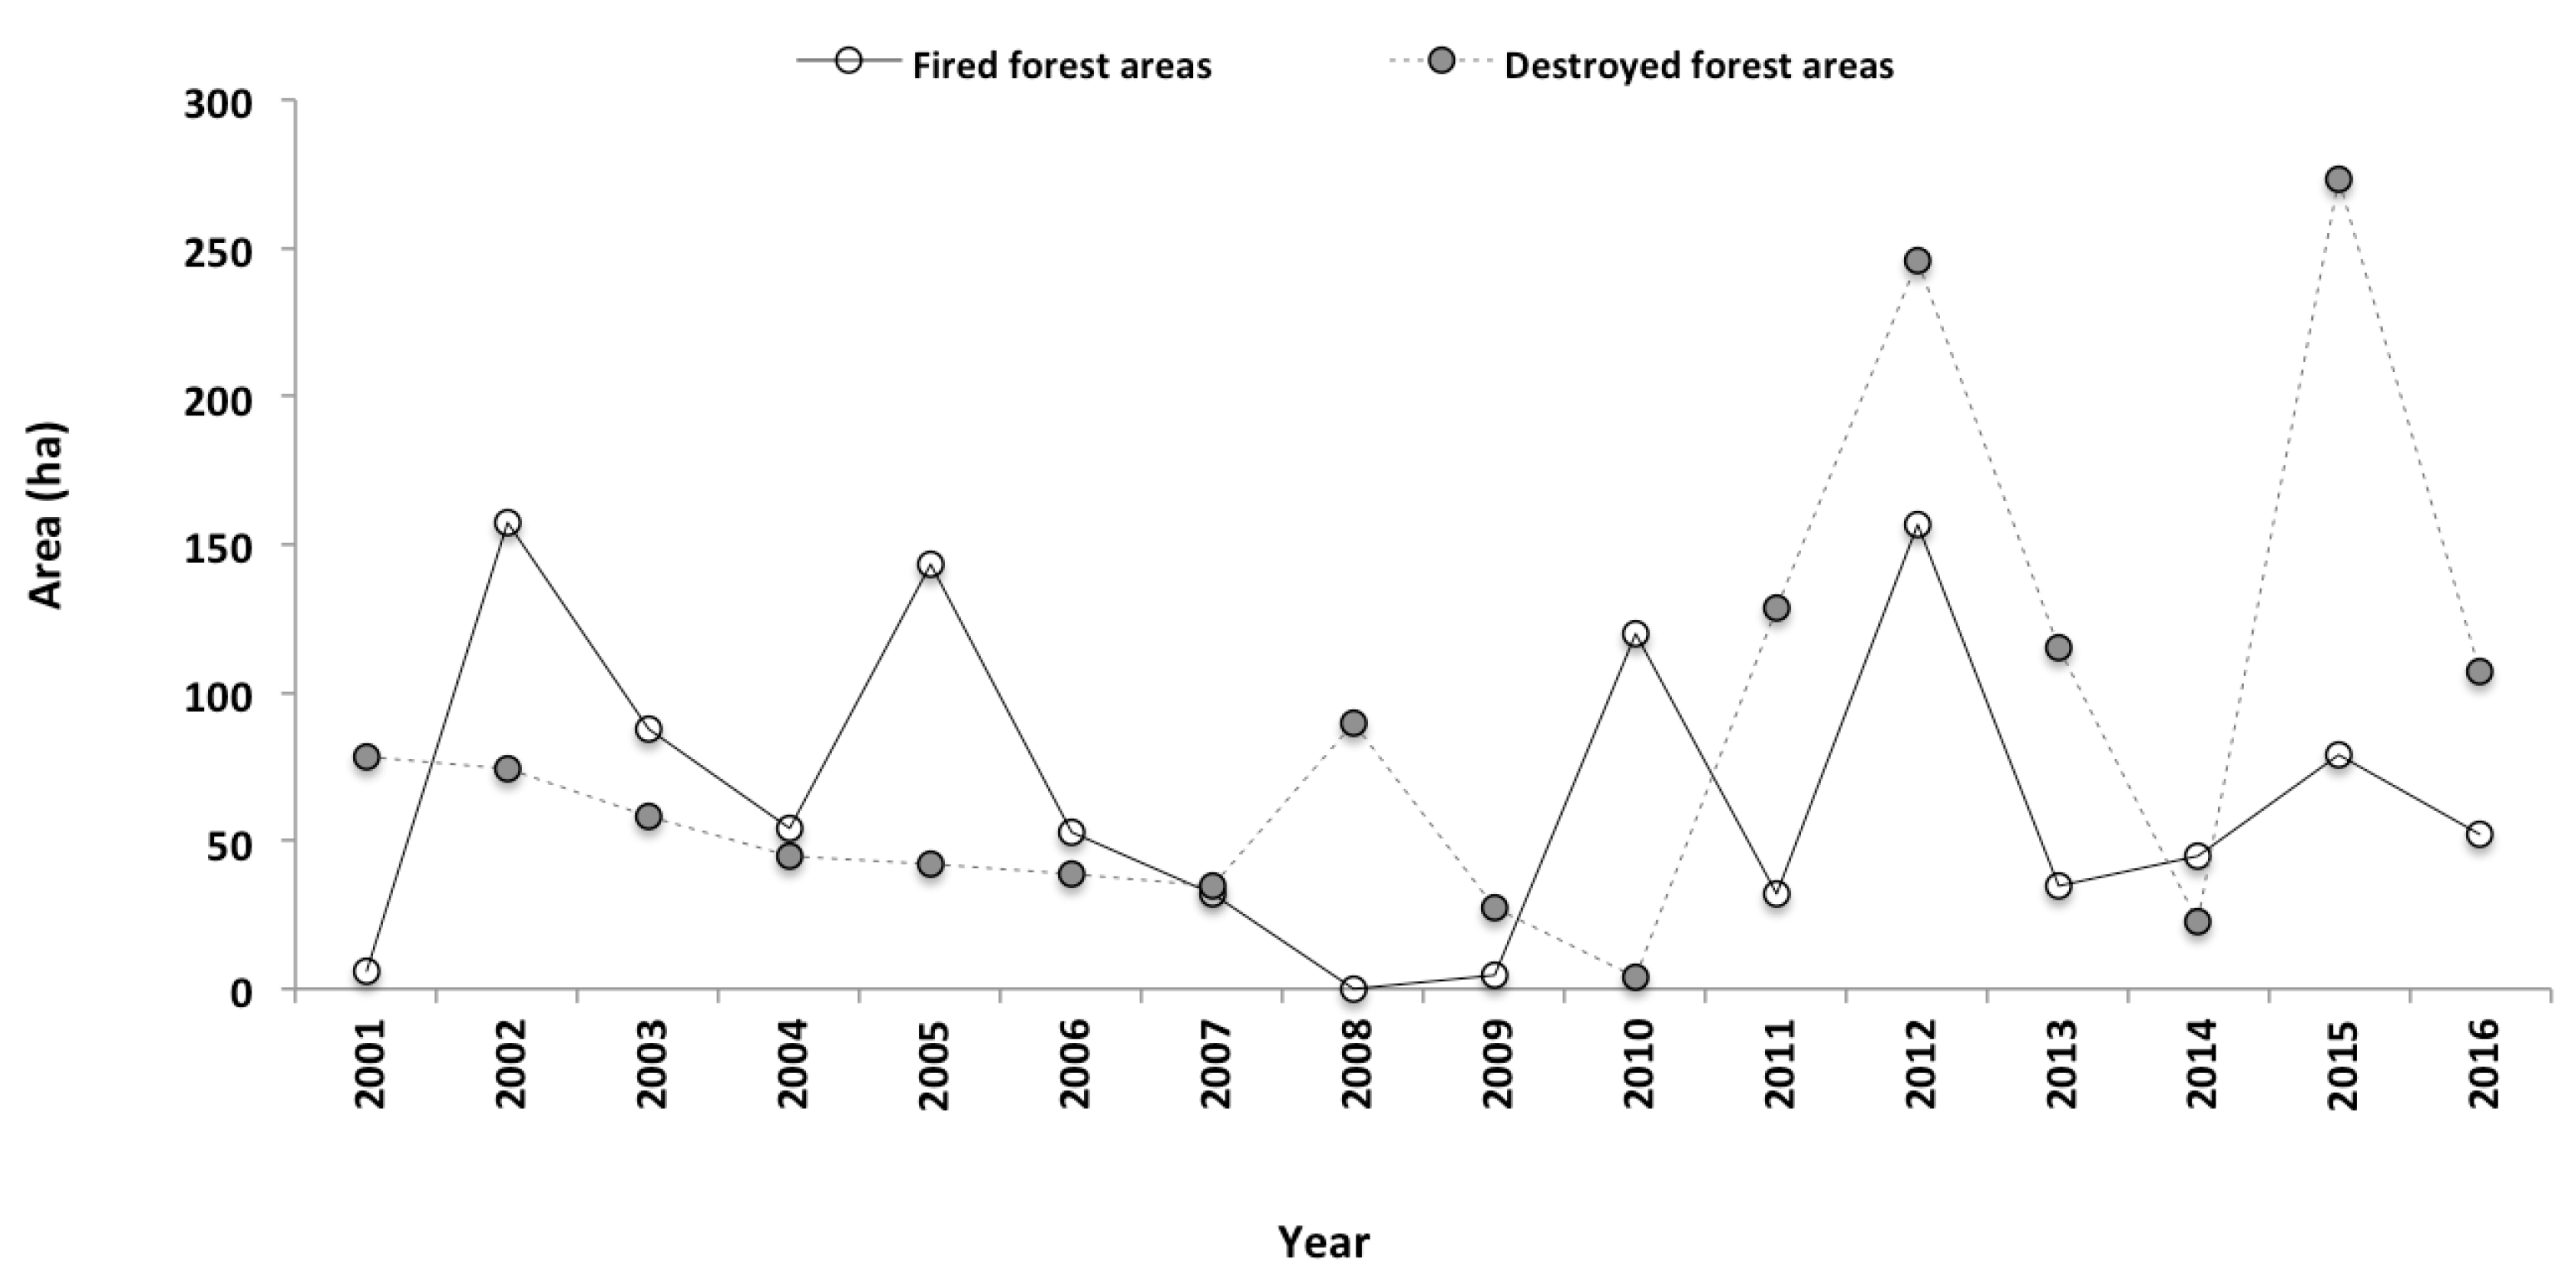
Major historical drought events during the period 2001–2016 were identified from previous studies [30,49,56], in comparison with Statistical books of Quang Nam and Da Nang from 2001 until 2016 [38,39,57,58,59,60]. From this comparison, the production yield of paddy rice in Winter-Spring crop seemed to be negatively affected by drought in 2010 and 2016. The yield in Summer-Autumn decreased in 2002, 2005, and 2012. Also, drought was one of the factors facilitating the likelihood and spread of forest fires, which happened almost every year from 2001 to 2016. In 2008, there were no forest fires whereas 2002, 2005, 2010, and 2012 saw the largest area of forest that was destroyed by fires (157 ha in 2002, 143 ha in 2005, 119.5 ha in 2010, and 156.7 ha in 2012) [61]. Although drought was not the reason, illegal logging and forest destruction also happened in Quang Nam almost every year, with more areas being destroyed from 2011 until 2015 (Table 3 and Figure 4).
3. Vegetation Indices for Drought Monitoring
3.1. Greenness Related Vegetation Indices
3.1.1. Normalized Difference Vegetation Index (NDVI)
From 16-day MOD13Q1 V6 images, monthly NDVI [12] were calculated using surface reflectance (ρ) from MODIS red and near infrared by dividing the difference between them and their sum.
where ρ645 and ρ858 are spectral reflectance measurements that were acquired in the red and near-infrared regions, respectively.
NDVI ranges from −1 to +1, with +1 indicating healthy vegetation cover, lower values representing stressed vegetation, negative values representing open water or high moisture content, and 0.1 value, indicating bare soil. The valid data was used in the analysis is thus from 0.1 to 1.0 [62].
3.1.2. Vegetation Condition Index (VCI)
Kogan [14] developed VCI to separate the weather component from the ecosystem component in NDVI values. By linearly scaling NDVI from zero, minimum NDVI, to 100, maximum NDVI for each grid cell and each month, the resulting VCI is defined as:
where NDVImax and NDVImin are the multiyear absolute maximum and minimum NDVI, respectively, of the studied period (January 2001 until December 2016); while NDVIi is monthly NDVI value at time of observation. The range of VCI is from 0 to 100, corresponding to changes from extremely unfavorable to optimal vegetation condition. VCI has been applied for monitoring drought and vegetation phenology changes in several studies [1,33,63].
3.2. Water Related Vegetation Indices
3.2.1. Normalized Difference Water Index (NDWI)
Gao [15] developed NDWI to estimate moisture condition of vegetation. Using the surface reflectance (ρ) from near infrared and shortwave infrared bands, which represents the changes of water content and mesophyll in vegetation canopies, Gao [15] quantified NDWI by normalizing the difference between the near infrared (858 mm) and shortwave infrared (1230 mm) bands. Meanwhile, Gu et al. [25] used the near infrared (858 mm) and shortwave infrared (2130 mm) bands to calculate NDWI. Since the study used the drought categories identified by Gu et al. [25], the calculation of NDWI was consistent with their study, as follows.
where ρ858 nm and ρ2130 nm are the spectral reflectance measurements that were acquired in the near-infrared and shortwave infrared regions, respectively, in previous studies. These bands are taken from MOD13Q1 V6 product. To be consistent with other indices, monthly NDWI was derived from 16-day MOD13Q1 products. Gu et al. [25] found that NDWI had a quicker response to drought conditions than NDVI. The average NDWI was consistently lower than 0.3 under drought conditions and higher than 0.4 under non-drought conditions. Although it has been used for many regions, its use in Vietnam has not been explored.
3.2.2. Land Surface Water Index (LSWI)
Using eight-day MOD09A1 V6 product, monthly land surface reflectance (ρ) from the near infrared (NIR1: 841–876 nm) and the shortwave infrared (SWIR1: 1628–1652 nm) bands were used to calculate LSWI [16,17].
LSWI was found to correspond well with the drought severities that were defined by the United States Drought Monitor in previous studies (18). An LSWI-based drought severity scheme is divided into four groups as extreme and exceptional drought (LSWI ≤ −0.1), severe and moderate drought (−0.1 < LSWI ≤ 0), abnormally dry (0 < LSWI ≤ 0.1), and no drought (LSWI > 0.1) [18]. Its application in Vietnam has not also been investigated.
3.3. Temperature Related Vegetation Indices
3.3.1. Land Surface Temperature (LST)
The Land Surface Temperature (LST) that was computed from thermal infrared (TIR) bands provides valuable information on surface moisture conditions [20]. Many studies have found that LST indirectly provides information to assess evapotranspiration, vegetation water content, and soil moisture [23,64,65]. MOD11A2 provides day land surface temperature in 16-bit unsigned integer. Therefore, the digital number (DN) of LST is converted to Kelvin temperature and then Celsius degree by applying the following formula Temperature = (DN × 0.02) − 0.02. [47]. Monthly LST was derived from eight-day MOD11A2 products to be consistent with other indices.
3.3.2. Temperature Condition Index (TCI)
NDVI values during the rainy season may be depressed. The interpretation of VCI should be cautious because vegetation stress in this season is attributed to excessive wetness, rather than insufficient moisture [14]. Therefore, Kogan [14] developed TCI to provide additional information about vegetation stress if it is due to dryness or excessive wetness. Similar to VCI, TCI is quantified, as follows.
where LSTmax and LSTmin are the multiyear absolute maximum and minimum LST, respectively, of the studied period (January 2001 until December 2016); while LSTi is the monthly LST value at time of observation. The range of TCI is from 0 to 100, corresponding to changes from extremely unfavorable (high temperature) to optimal (low temperature) vegetation condition.
3.4. Combined Vegetation Indices
3.4.1. Vegetation Health Index (VHI)
Combining the information about vegetation condition from VCI and TCI, Kogan [14] developed the Vegetation Health Index (VHI) for better drought detection, which was also used in many studies to monitor and detect drought in different regions [33,63,66]. The validity of VHI is based on the assumption that NDVI and LST at a given pixel will vary inversely over time, with variation in VCI and TCI driven by local moisture condition [67]. However, Karnieli et al. [67] found that NDVI and LST are not always and were everywhere negatively correlated. It is actually dependent on the season of year, time of day, vegetation type, and climatic characteristics [67,68]; thus, it is recommended to examine this relationship before interpreting the VHI results [68]. Accordingly, the relationship between NDVI and LST were investigated before calculating VHI. VHI is computed by:
The weight of “α” depends on different conditions between temperature and precipitation. In case of unknown moisture conditions, “α” can be set to 0.5 so VCI and TCI are equally weighted to calculate VHI. The classification scheme for drought monitoring based on VHI is divided into five groups as extreme drought (VHI < 10), severe drought (10 < VHI < 20), moderate drought (20 < VHI < 30), mild drought (30 < VHI < 40), and no drought (VHI > 40) [69].
3.4.2. Normalized Difference Drought Index (NDDI)
Combining NDVI and NDWI, Gu et al. [25] developed the Normalized Difference Drought Index (NDDI), which has been used for drought monitoring in many areas [25,70,71].
NDDI ranges from −1 to 1. High NDDI values represent drought conditions, in which both NDVI and NDWI have low values (NDVI < 0.5 and NDWI < 0.3), while low NDDI values represent non-drought conditions, in which both NDVI and NDWI have higher values (NDVI > 0.6 and NDWI > 0.4). Since NDDI incorporates information from both vegetation vitality and water content, NDDI is a more sensitive indicator of drought than NDVI and NDWI alone, for drought monitoring in grassland in United States [25] and crop conditions in China [70]. There are no universal drought categories that are designed by NDDI, some studies have selected 0.5—third quartile of NDDI range—as drought threshold [72]. Therefore, in this study, drought threshold is based on anomaly from the range of NDDI values in each location.
4. Methodology
4.1. Calculation of VIs
Monthly drought intensity from January 2001 until December 2016 in VGTB river basin was calculated using six VIs, including NDWI, LSWI, VCI, TCI, VHI, and NDDI, with the support of cloud-based GEE computing platform. In addition, drought assessment for areas with different vegetation types was also undertaken, including rice paddy fields (grey shaded area in Figure 3) and forest areas (in Tra My—located in Thu Bon subbasin and in Kham Duc—located in Vu Gia subbasin), which are also representatives of downstream and upstream parts, respectively, of the VGTB river basin. The relationship between LST and NDVI was examined before computing VHI to ensure that VHI could be used in this area [67]. Therefore, the linear regression of pixel-based NDVI and LST that were derived from two pairs of MODIS products (First pair: MOD13Q1 and MOD11A2, Second pair: MOD09A1 and MOD11A2) for monthly averages during the study period was investigated.
4.2. Verifying VI Results with Precipitation and Soil Moisture
To compare the results of six VIs, first, the Pearson’s correlation coefficient, which is the most widely used test statistics, was used to examine the linear relationship between VIs. In addition to the six main VIs, NDVI, LST, in-situ precipitation, and NASA-USDA—derived soil moisture (assimilated remote sensing with ground weather data) were also included to further see the collinearity between them. The monthly time series of those variables from January 2001 until December 2016 were derived at the corresponding locations of rice paddy fields and forest areas. Each index is paired with all other indices, resulting in a 10 by 10 matrix of correlation coefficient and p-value of their statistical significance for each location. Monthly in-situ precipitation was available from January 2001 until October 2015, whereas NASA USDA—derived soil moisture was from January 2010 until December 2016. Therefore, the correlation test between precipitation and other variables, as well as between soil moisture and other variables had fewer observations than other pairs.
Since VIs are indirect estimates of moisture availability, each targeted VI was compared with precipitation and soil moisture data to verify the result of each VI. Given the coarse spatial resolution of NASA-USDA soil moisture data (0.25° × 0.25°) and the small entire area of VGTB basin, pixel-based multiple linear regression between the three datasets would have fewer sample observations. The average monthly time series of each index was thus used, including the monthly time series of six VIs, in-situ precipitation, and NASA-USDA soil moisture in the rice paddy fields and forest areas. Since NASA-USDA soil moisture was only available from January 2010 until now and in-situ precipitation was available until October 2015, the study period for this test was from January 2010 until October 2015.
4.3. Verifying VI Results with Crop Yield and Forest Fires
Examining whether droughts that were identified by VIs caused negative impacts on agriculture and forest fires in the region, the drought intensity values that were computed by six VIs were used to compare with the historical drought events and impacts on paddy crop production and forest fires. The years with the highest negative impacts on crop and forest fires in the past were used to compare with drought years identified by six VIs. They included 2002, 2005, 2010, 2012, and 2016 for the rice paddy fields and 2002, 2003, 2005, 2010, and 2012 for the forest areas. For each event, drought characteristics were evaluated by identifying drought onset, duration, and intensity. To identify drought onset and duration, start month, and end month (occurrence) of each drought event (moderate, severe, and extreme drought) was identified for each VI. No mild drought was considered because only droughts resulted in the negative impact on crop yield and the high amount of forest areas affected by fires were taken in account. Drought duration represents the maximum number of consecutive months of index values showing moderate, severe, and extreme drought events between start and end month. Intensity is the index value of each VI. Mean intensity and maximum intensity of drought are the average and maximum index values within the maximum duration of examined drought events. In addition, the number of drought months is the number of months that VIs identify them as drought (mild, moderate, severe, and extreme drought). Maximum duration is the maximum number of consecutive months showing all kinds of droughts. Based on these attributes, each VI is compared and verified as to whether they reflected the impacts of drought years in the basin.
5. Results and Discussion
5.1. VIs Based Drought Identification
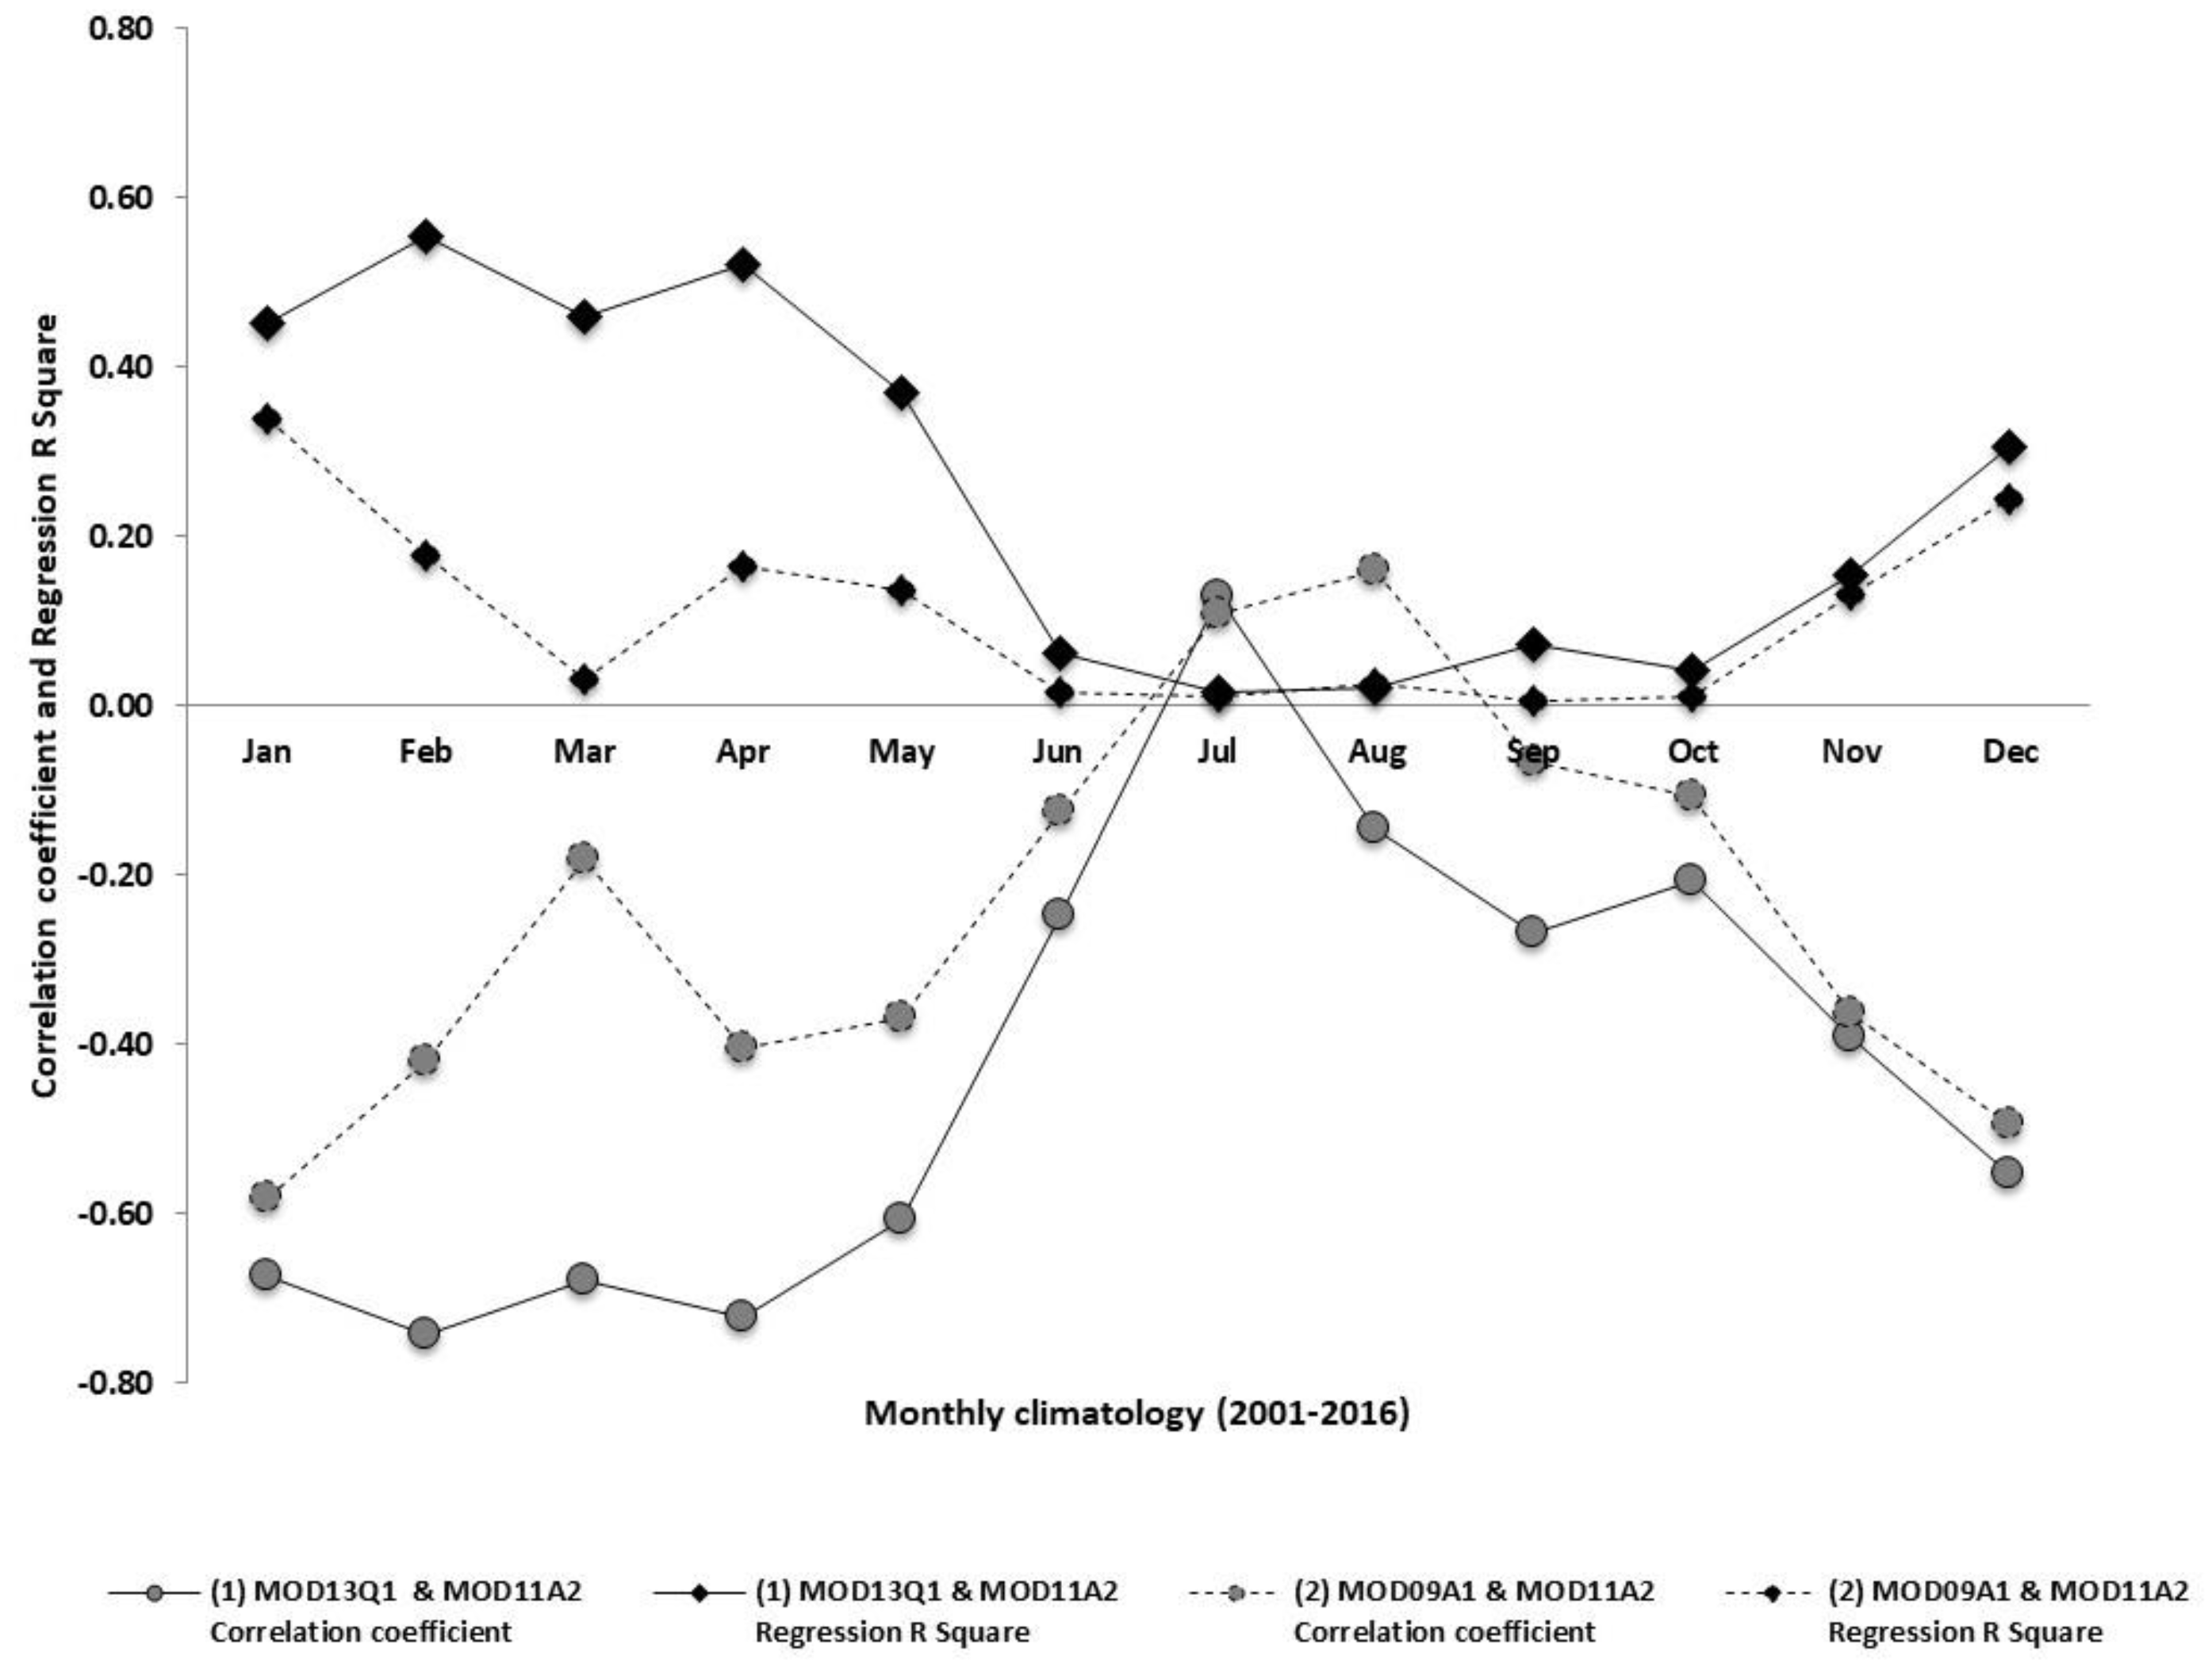
The time series (January 2001 until December 2016) of each VI were produced for two areas with different vegetation types: rice paddy fields and forest areas (in Tra My and Kham Duc). Given similar results of forest areas in Tra My and Kham Duc, only results that were obtained at the rice paddy fields and forest areas in Tra My were presented. To validate the result of VHI, which is based on assumption of negative correlation between NDVI and LST, the linear relationship of their monthly averages was examined. In this study, NDVI can be derived from both MOD13Q1 and MOD09A1, whereas LST can be obtained from MOD11A2. Therefore, simple regression tests were undertaken for two pairs of NDVI and LST at the pixel level during the study period (First pair: MOD13Q1 and MOD11A2, Second pair: MOD09A1 and MOD11A2) (Figure 5). From the Figure 5 and Figure 6, for both pairs, NDVI and LST varied inversely over most of the months during a year, except July, which saw a positive relationship between them. For MOD13Q1 and MOD11A2, NDVI and LST had a statistically significant relationship with at least 95 percent confidence level, even for its positive relationship in July. LST accounted from 30 to 50 percent of variability in NDVI in dry months (December until May) and less than 20 percent of variance in NDVI when the rainy months come (July to November). For MOD09A1 and MOD11A2, although NDVI and LST had a statistically significant relationship for eleven months (except September), LST explained little of the variability in NDVI in most of the months. Accordingly, VHI product derived from MOD09A1 and MOD11A2 was not recommended to be used, whereas the interpretation of VHI derived from MOD13Q1 and MOD11A2 from July to November should be used with caution [68]. All the VHI from this paper was thus calculated by using MOD13Q1 and MOD11A2 products.
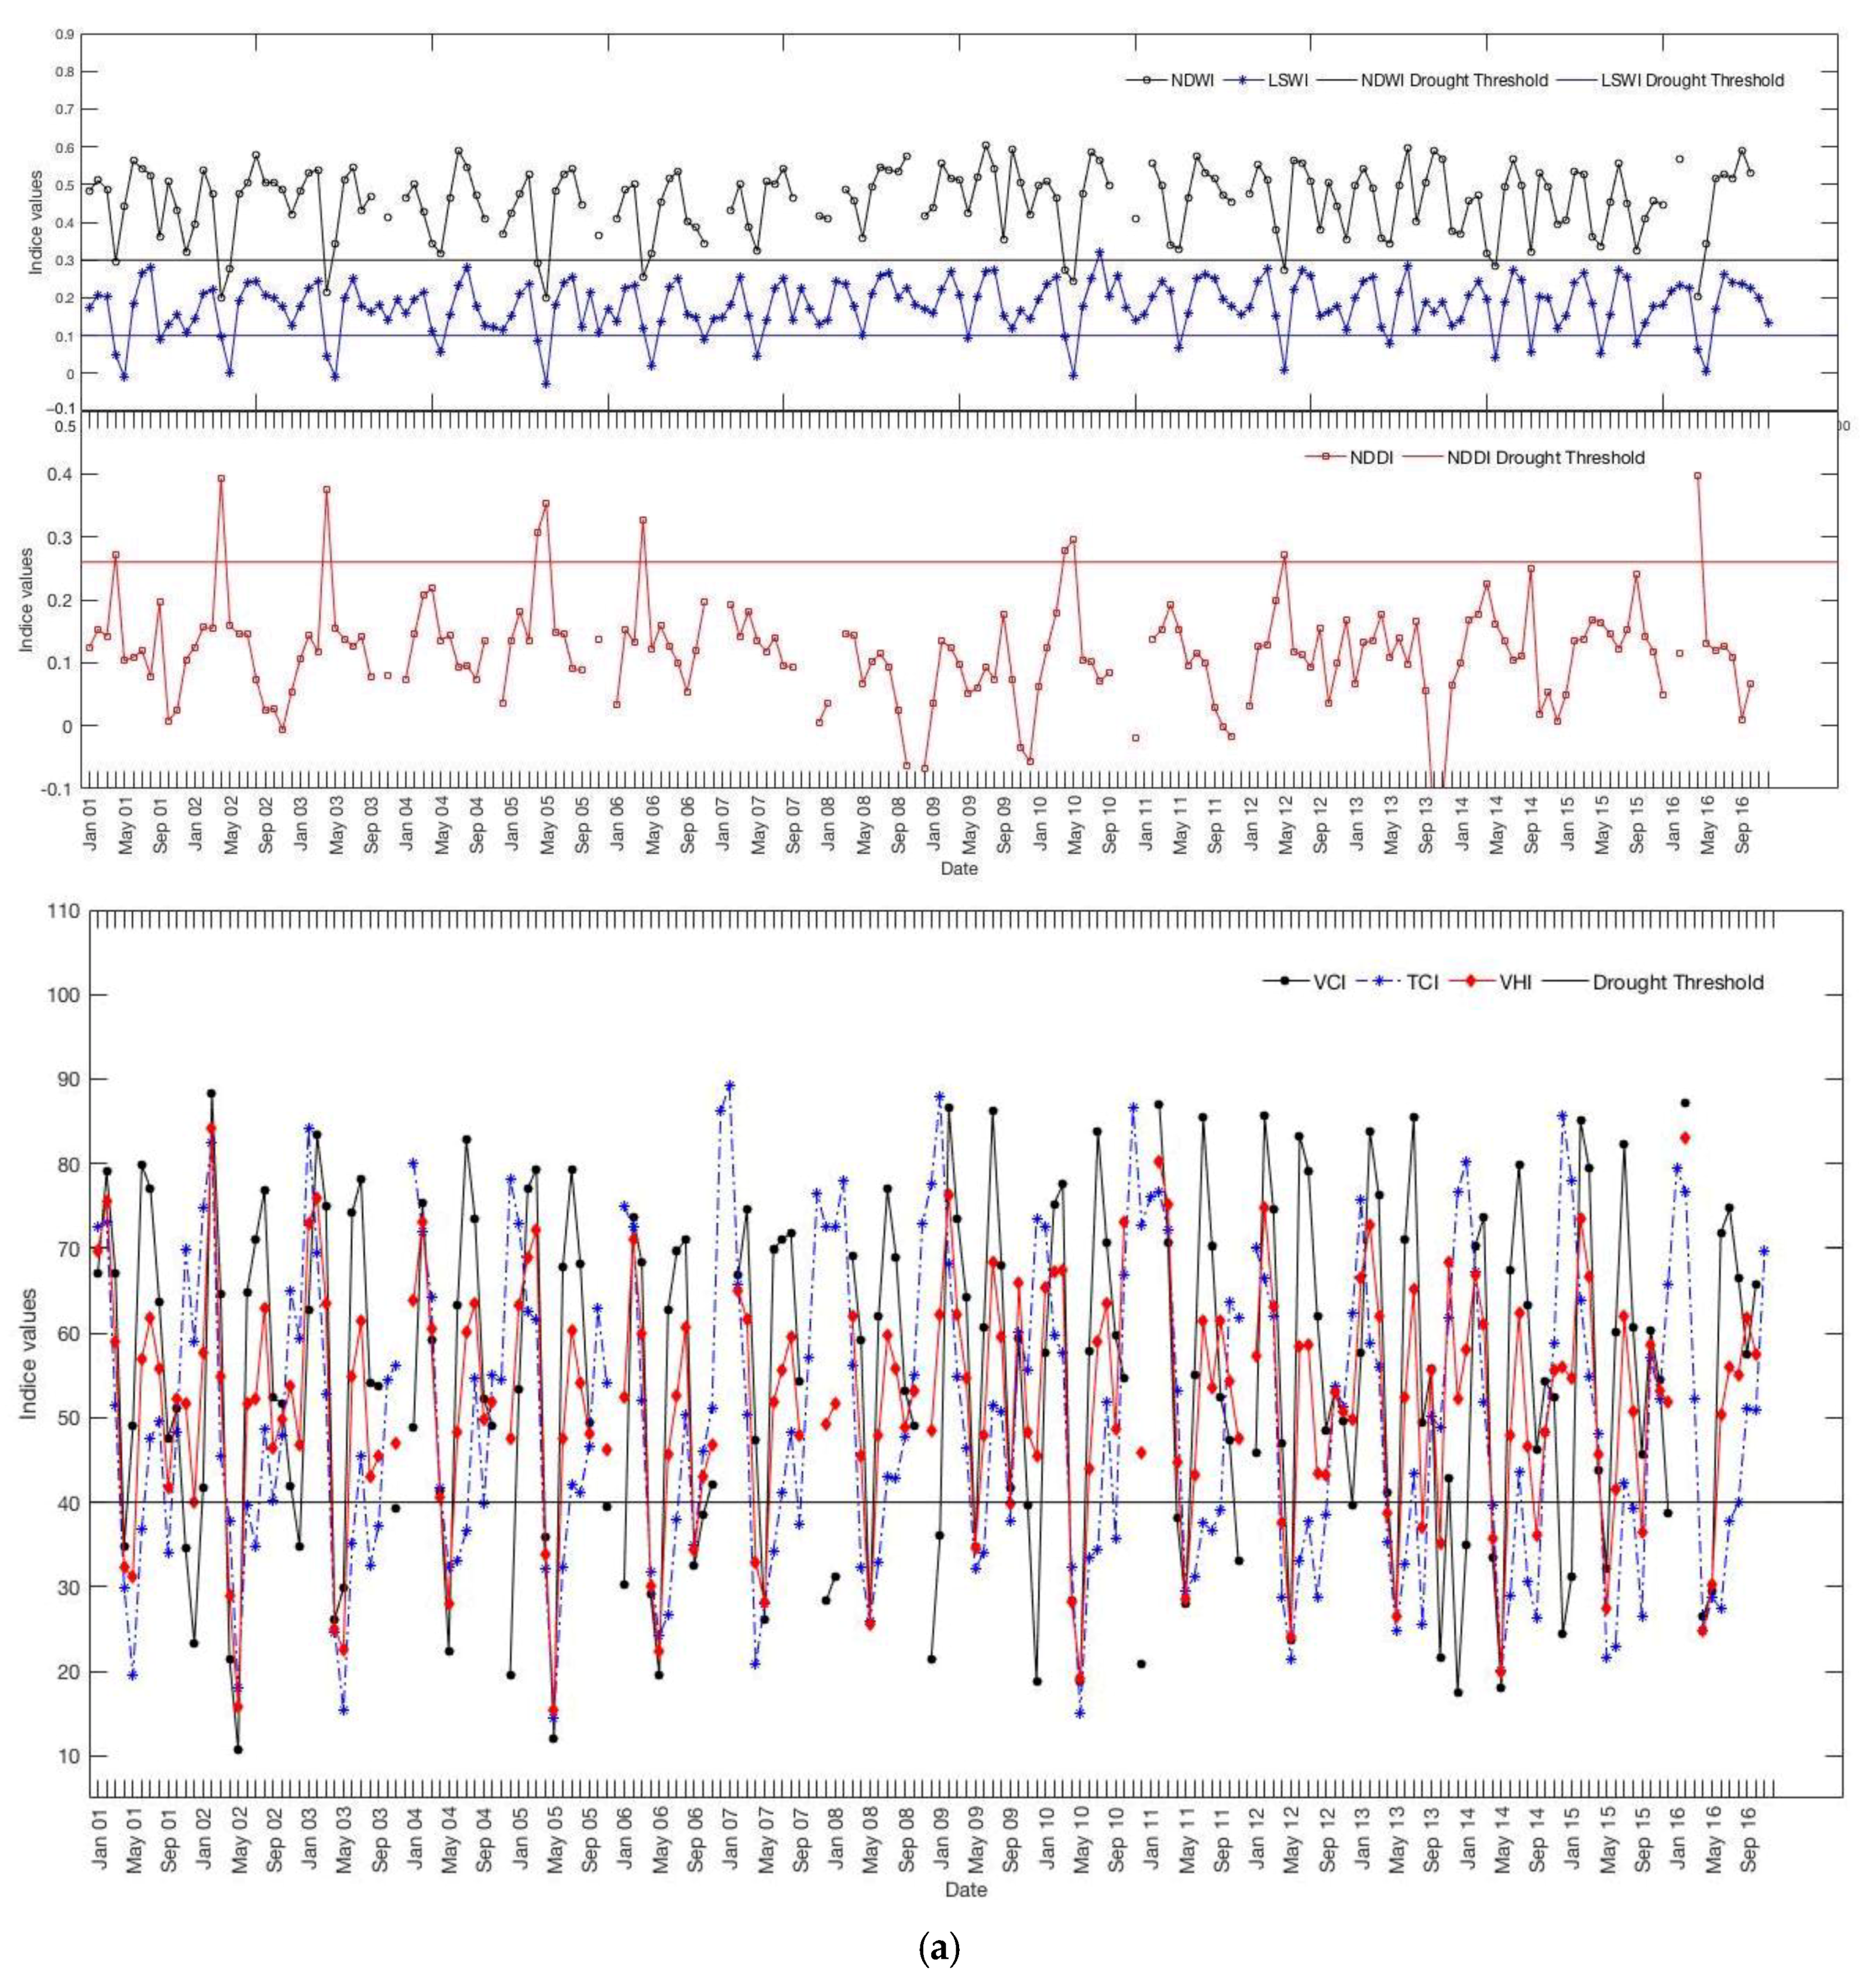
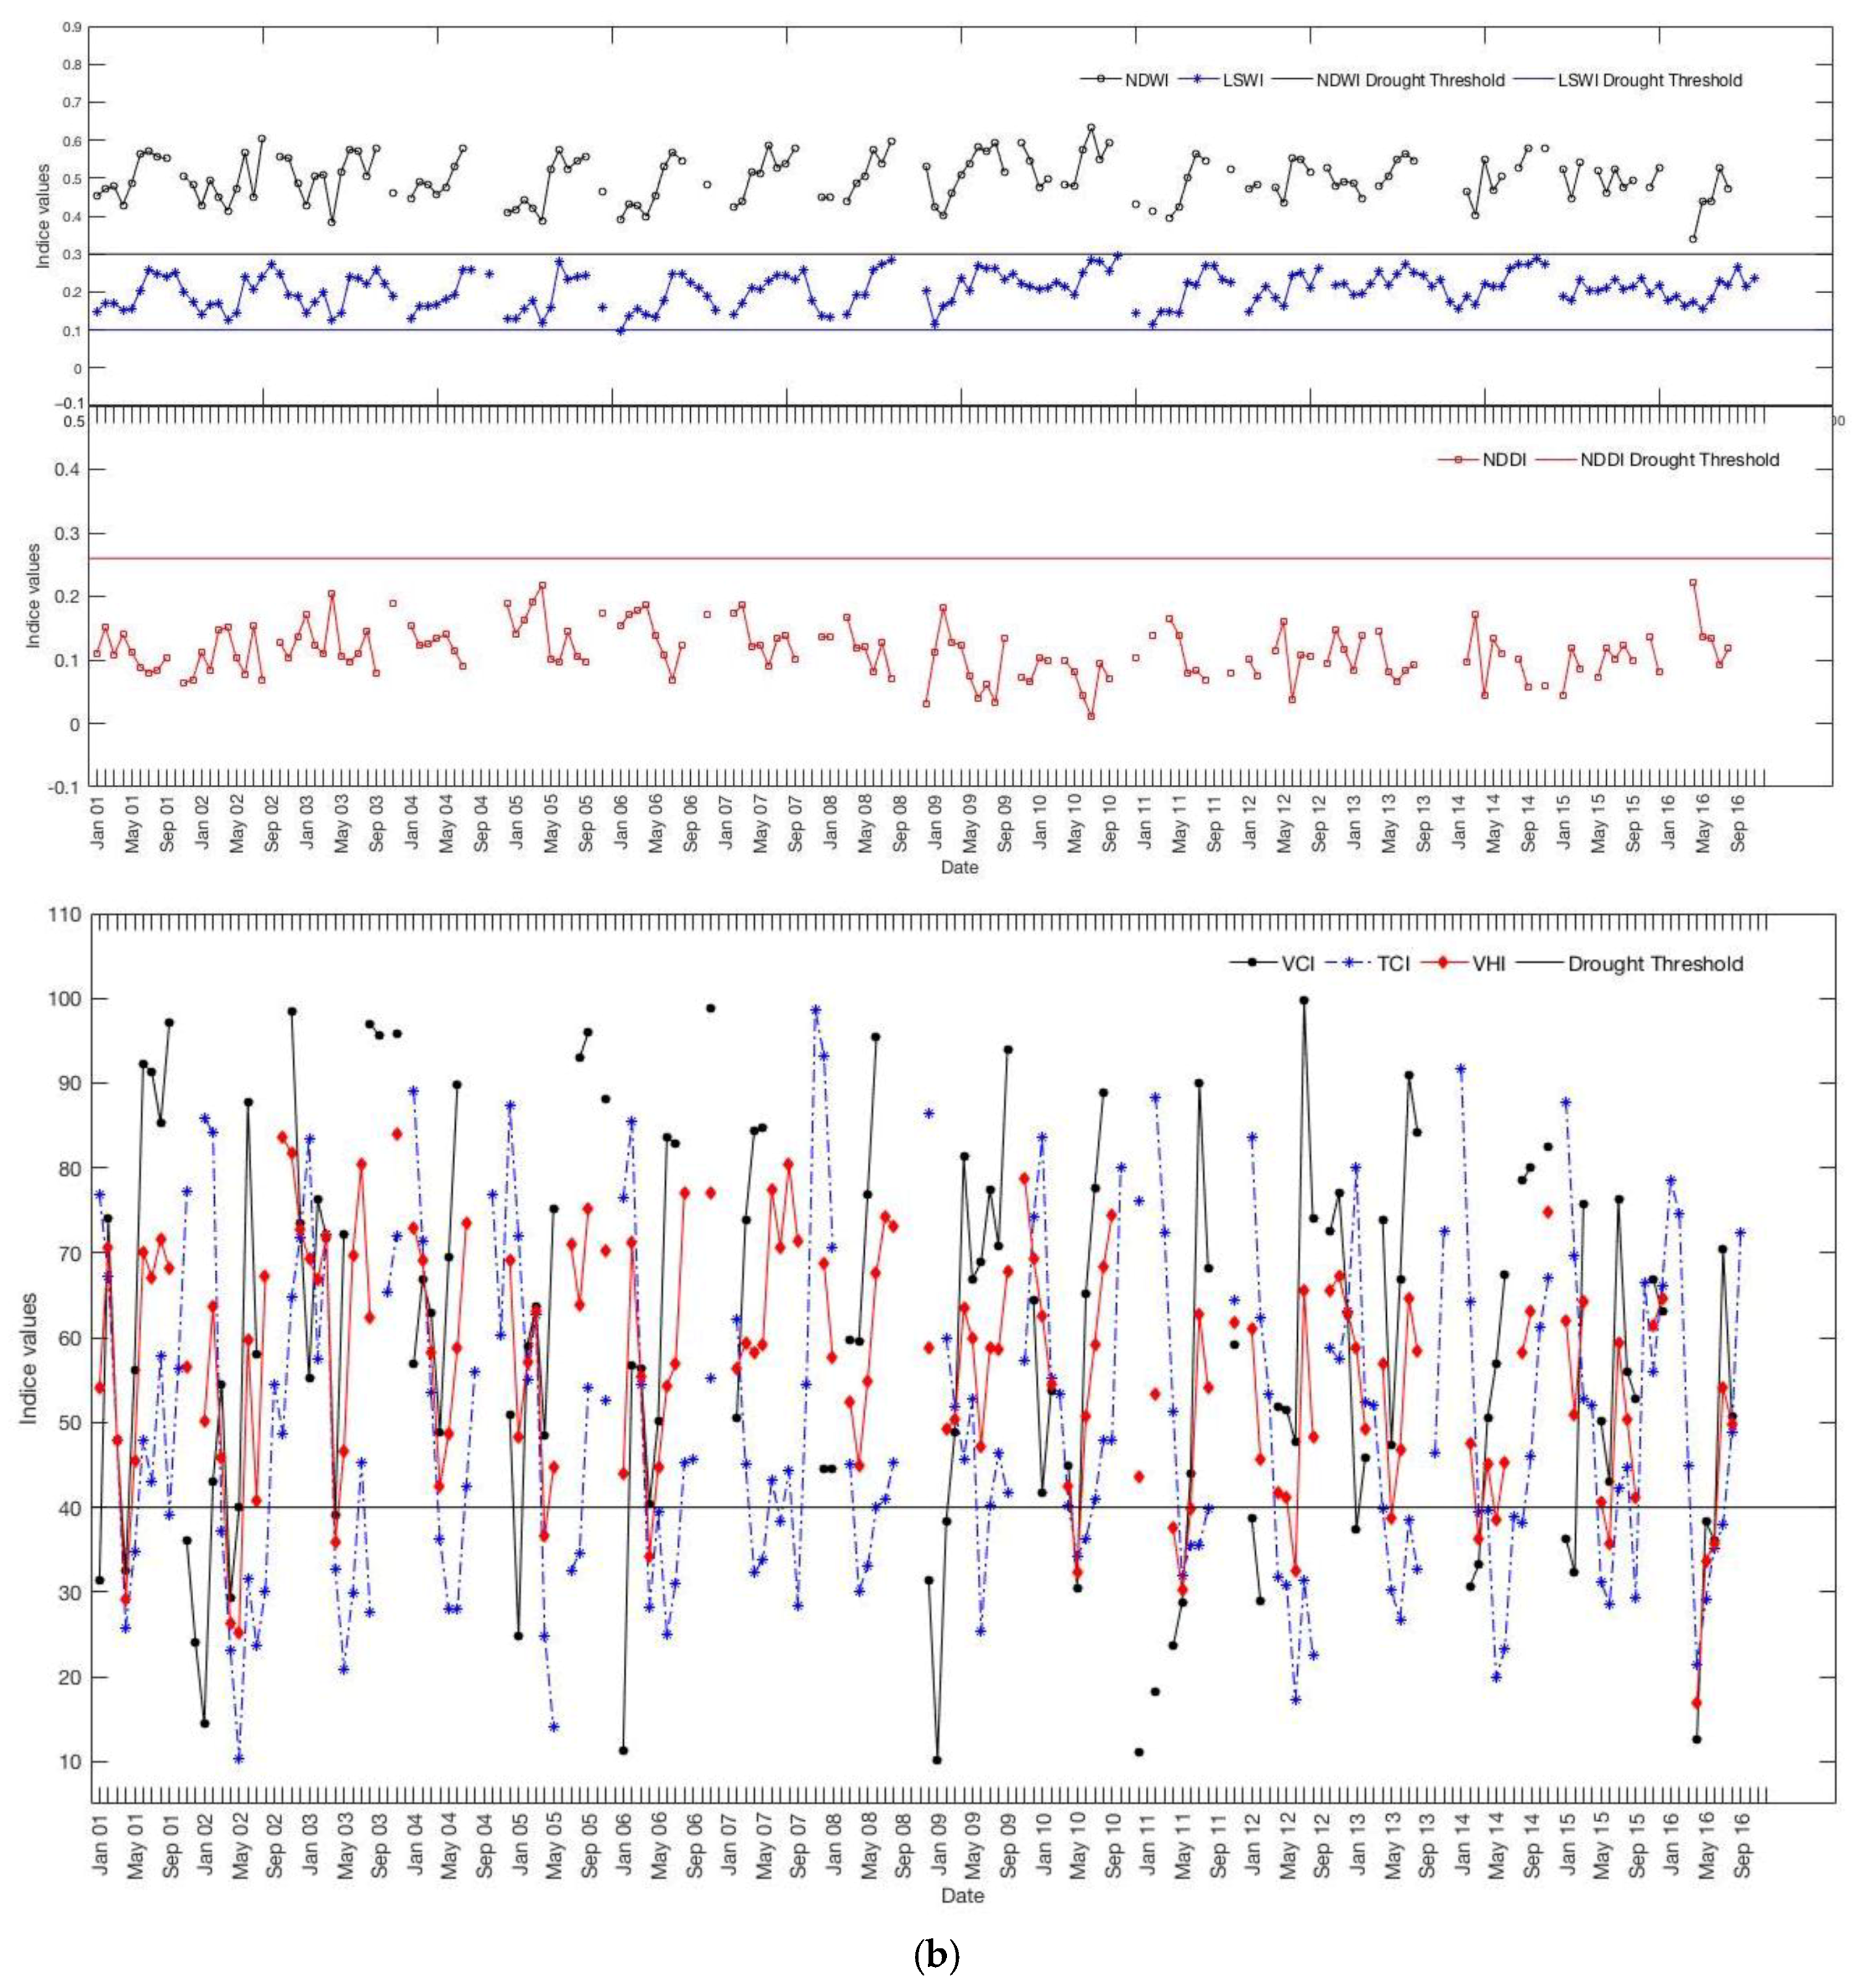
Figure 7 presents the performance of VIs on identifying drought events happening from 2001 until 2016 in the VGTB basin. In the rice paddy field areas, most of the VIs showed that drought was a recurring phenomenon and happened within a short period of time, particularly in April and May, almost every year with different intensity. April and May were also the months having less rainfall and higher temperature in the region, causing the area to be more vulnerable to droughts during these months (Figure 2 and Figure 6). NDWI showed more severe drought intensity in April and May in 2002, 2005, and 2016, whereas LSWI depicted these severe droughts in the same months in 2001, 2002, 2003, 2006, 2010, 2011, and 2016. VCI showed vegetation stress in April, May, and sometimes in October and November every year. The latter two months (October and November), which were during the flood season, were more related to excessive wetness rather than drought. Kogan [14] also found that VCI relied on NDVI, which is normally depressed due to excessive wetness and long cloudiness, and thus it should be interpreted with caution. TCI indicated that droughts happened in April and May every year. Particularly from 2011 until 2016, more drought months were found during dry season (from April until August) because months with higher temperature (LST) lasted longer since 2011 (Figure 6). VHI also found droughts that were happening in April and May every year with different intensity. In addition to April and May, droughts were also found in September in 2006, 2014, and 2015, with lesser intensity. Higher intensity was found in 2002, 2003, 2005, 2010, and 2014. Since NDDI values range from −1 to 1, the time series average value of NDDI is significantly lower than the actual value. Given a big range between the lowest and highest NDDI value (0.55), whereas there were no common NDDI drought categories, any NDDI value above its third quartile of NDDI range (0.26) in the rice paddy fields is considered as water stress for vegetation. With this threshold, NDDI identified water stress for vegetation in April 2002, April 2003, April 2005, April and May 2010, and May 2016.
In the forest areas, VCI, TCI, and VHI found vegetation stress, whereas NDWI, LSWI, and NDDI did not recognize any stress in these areas. NDWI, LSWI, and NDDI had very small range of intensity values, thus there was no abnormal condition found by these indices. In contrast, VCI found forest stress in April 2002, February 2006, January 2009, and April 2016. TCI was more sensitive to temperature and found vegetation stress in longer periods (April–June) almost each year. Particularly, dry seasons in 2001, 2002, 2005, 2012, 2014, and 2016 saw higher vegetation stress. Similarly, VHI found higher stress in May of 2001, 2002, 2010, 2011, 2012 and 2016. From Figure 2 and Figure 6, temperature was mostly higher in May each year when rainfall was also much lower. NDWI and LSWI, which are more sensitive to vegetation water content, however, did not detect vegetation stress in the forest areas. Ogashawara and Bastos [73] found that NDWI was less correlated with temperature. As LSWI is also a water based VI, similar explanations can be assumed. Although NDDI incorporates both information of vegetation vitality and water content, it was not able to detect vegetation stress in this study. As VCI attempts to directly measure vegetation health, which could be affected by many factors (water, insects, disease, nutrients, etc.), vegetation stress that was found by VCI could be caused by other reasons than lack of water. TCI and VHI had good agreement in detecting vegetation stress. Forests in central Vietnam are mostly fire-prone tropical grasslands, which are sensitive to temperature and have deeper root systems than croplands [74]. They are thus less sensitive to rainfall because they have higher available water holding capacities, yet they are more sensitive to temperature. Since both TCI and VHI were calculated using temperature data, they could capture vegetation stress affected by higher temperature. This means that VIs that are sensitive to temperature can better detect droughts in the forest areas in the VGTB basin.
5.2. Correlation between VIs and Other Data
Paired time series of intensity values provided by six VIs (NDWI, LSWI, VCI, TCI, VHI, NDDI) and other four variables (NDVI, LST, in-situ precipitation, and NASA-USDA derived soil moisture) were compared to examine the similarity and the difference between them. In addition, each of six VIs were compared with monthly in-situ precipitation and assimilated soil moisture to investigate whether the variability of drought intensity could be explained by the changes in precipitation and soil moisture. To do this, first, the Pearson’s correlation coefficients and their statistical significance between each pair of 10 variables were computed. Secondly, multiple linear regressions between each VI and independent variables (monthly in-situ precipitation and NASA-USDA soil moisture) were calculated. These comparisons were undertaken for two vegetation types: rice paddy fields and forests areas (in Tra My and Kham Duc). Given the similar results of forest areas in both forest locations, the results at the rice paddy fields and forest areas in Tra My are shown in Table 4 and Table 5.
Table 4 presents correlation matrix of both correlation coefficients and p-value of their statistical test obtained at the rice paddy fields (Table 4a) and forest areas (Table 4b). Values of NDWI, LSWI, VCI, TCI, VHI, NDVI, precipitation, and soil moisture range from small to large corresponding to high water stress to normal condition whereas NDDI and LST show the reverse order. Correlations between NDDI or LST and other variables were thus expected to have negative coefficients. At the rice paddy fields, higher and statistically significant (p < 0.001) pairwise correlations were found between the following pairs: water related VIs (NDWI and LSWI) (r = 0.82); water related VIs (NDWI, LSWI) with greenness related VIs (VCI, NDVI) (r = 0.78~0.81); and, VHI with other VIs (NDWI, LSWI, VCI, TCI, LST) (r = 0.71~0.78) (Table 4a). Medium and statistically significant (p < 0.001) pairwise correlations were observed between NDDI and other VIs (NDWI, LSWI, TCI, VHI, and LST) (r = 0.31~0.57). However, NDDI did not have any statistically significant relationship with greenness related VIs (VCI, NDVI). For TCI, except VHI, it had smaller correlations with other VIs (NDWI, LSWI, NDDI) (r = 0.30~0.43, p < 0.001) and no relation with VCI and NDVI. Most VIs (except TCI and NDDI) were sensitive to NDVI (r = 0.76~0.99). Both VHI and NDDI were more sensitive to LST (r = 0.45~0.71) than water VIs (r = 0.31 = 0.32). In correlation with precipitation, only NDDI had a statistically significant relationship (p < 0.001) (r = −0.48). Correlations between soil moisture and other VIs ranked the highest with NDDI (r = −0.65, p < 0.001), then LST (r = −0.56, p < 0.001), TCI (r = 0.52, p < 0.001), and VHI (r = 0.32, p < 0.001). At the forest areas, pairs had high and statistically significant (p < 0.001) pairwise correlations included: water related VIs (NDWI, LSWI) (r = 0.84); water related VIs (NDWI, LSWI) with greenness related VIs (VCI, NDVI) (r = 0.68~0.74); and, NDDI with water related VIs (NDWI, LSWI) (r = −0.61~−0.79). VHI had statistically significant correlations (p < 0.001) with other VIs, except for NDDI (r = 0.44~0.74). Greenness VIs (NDVI, VCI) were more sensitive to water related VIs and VHI (r = 0.68~0.74) than other VIs. The sensitivity between temperature based VIs (TCI, LST) and VHI (r = 0.44) were the highest among other pairs. There were statistically significant relationships between most VIs (except NDDI) and precipitation, and between all VIs and soil moisture. Among them, VHI had the highest correlations with both precipitation (r = 0.35) and soil moisture (r = 0.59).
Table 5 provides the summary of multiple linear regression results between each VI and hydro-meteorological data (soil moisture and precipitation) at two areas, rice paddy fields and forest areas. At the rice paddy fields, NDWI, VHI, TCI, and NDDI had statistically significant models with precipitation and soil moisture. Among them, NDDI had the highest significant R2 value. 49 percent of variability in NDDI could be explained by changes in both precipitation and soil moisture, whereas this number for TCI is 32 percent and 12 percent for VHI (Table 5). At the forest areas, NDWI, LSWI, VCI, and VHI had statistically significant relationships with both precipitation and soil moisture. VHI had the highest correlations with precipitation and soil moisture (r = 0.35~0.59) than other VIs (Table 4b), resulting in the highest variability of VHI (29 percent) could be explained by the changes in precipitation and soil moisture (Table 5).
Apparently, most VIs in the same VIs groups had similar performance in both paddy fields and forest areas in VGTB, except for the combined VIs group (VHI and NDDI). Since VIs directly measure vegetation health, which is derived from NDVI, most of them had high correlations with greenness-based VIs (except temperature-based VIs and NDDI). The correlations between each VI and temperature-based VIs varied significantly between each pair. Similarly, there were also significant differences in the sensitivities of each VI to either precipitation or soil moisture. In the rice paddy fields, the more sensitive VIs were to precipitation, the better their variability could be explained by both precipitation and soil moisture. Shallow rooted paddy rice with low available water holding capacities responds quickly to water availability. Precipitation is thus the key factor contributing to vegetation stress in these areas. In this case, NDDI had the highest correlation with precipitation and the highest R2 value in the linear regression model with precipitation and soil moisture. NDDI seems to better respond to drought conditions than other VIs in the rice paddy fields. NDDI was also found to have a stronger response to summer drought conditions than NDVI and NDWI in previous studies [25,70].
In the forest areas, the more sensitive VIs were to both LST and precipitation, the higher their variabilities could be explained by both precipitation and soil moisture. Forests in these areas are prone to high temperatures; therefore, temperature is the key factor contributing to vegetation stress. VHI had the highest correlation with LST and the highest R2 value in the linear regression model with precipitation and soil moisture. VHI seems to better monitor drought conditions that are more attributed to temperature stress in these forest areas than other VIs. This finding agrees with previous studies, which found that VHI could detect vegetation stress due to temperature [1] and estimate fire risks in forest areas [69].
5.3. Comparison of VIs Result with Crop Yield and Forest Fires
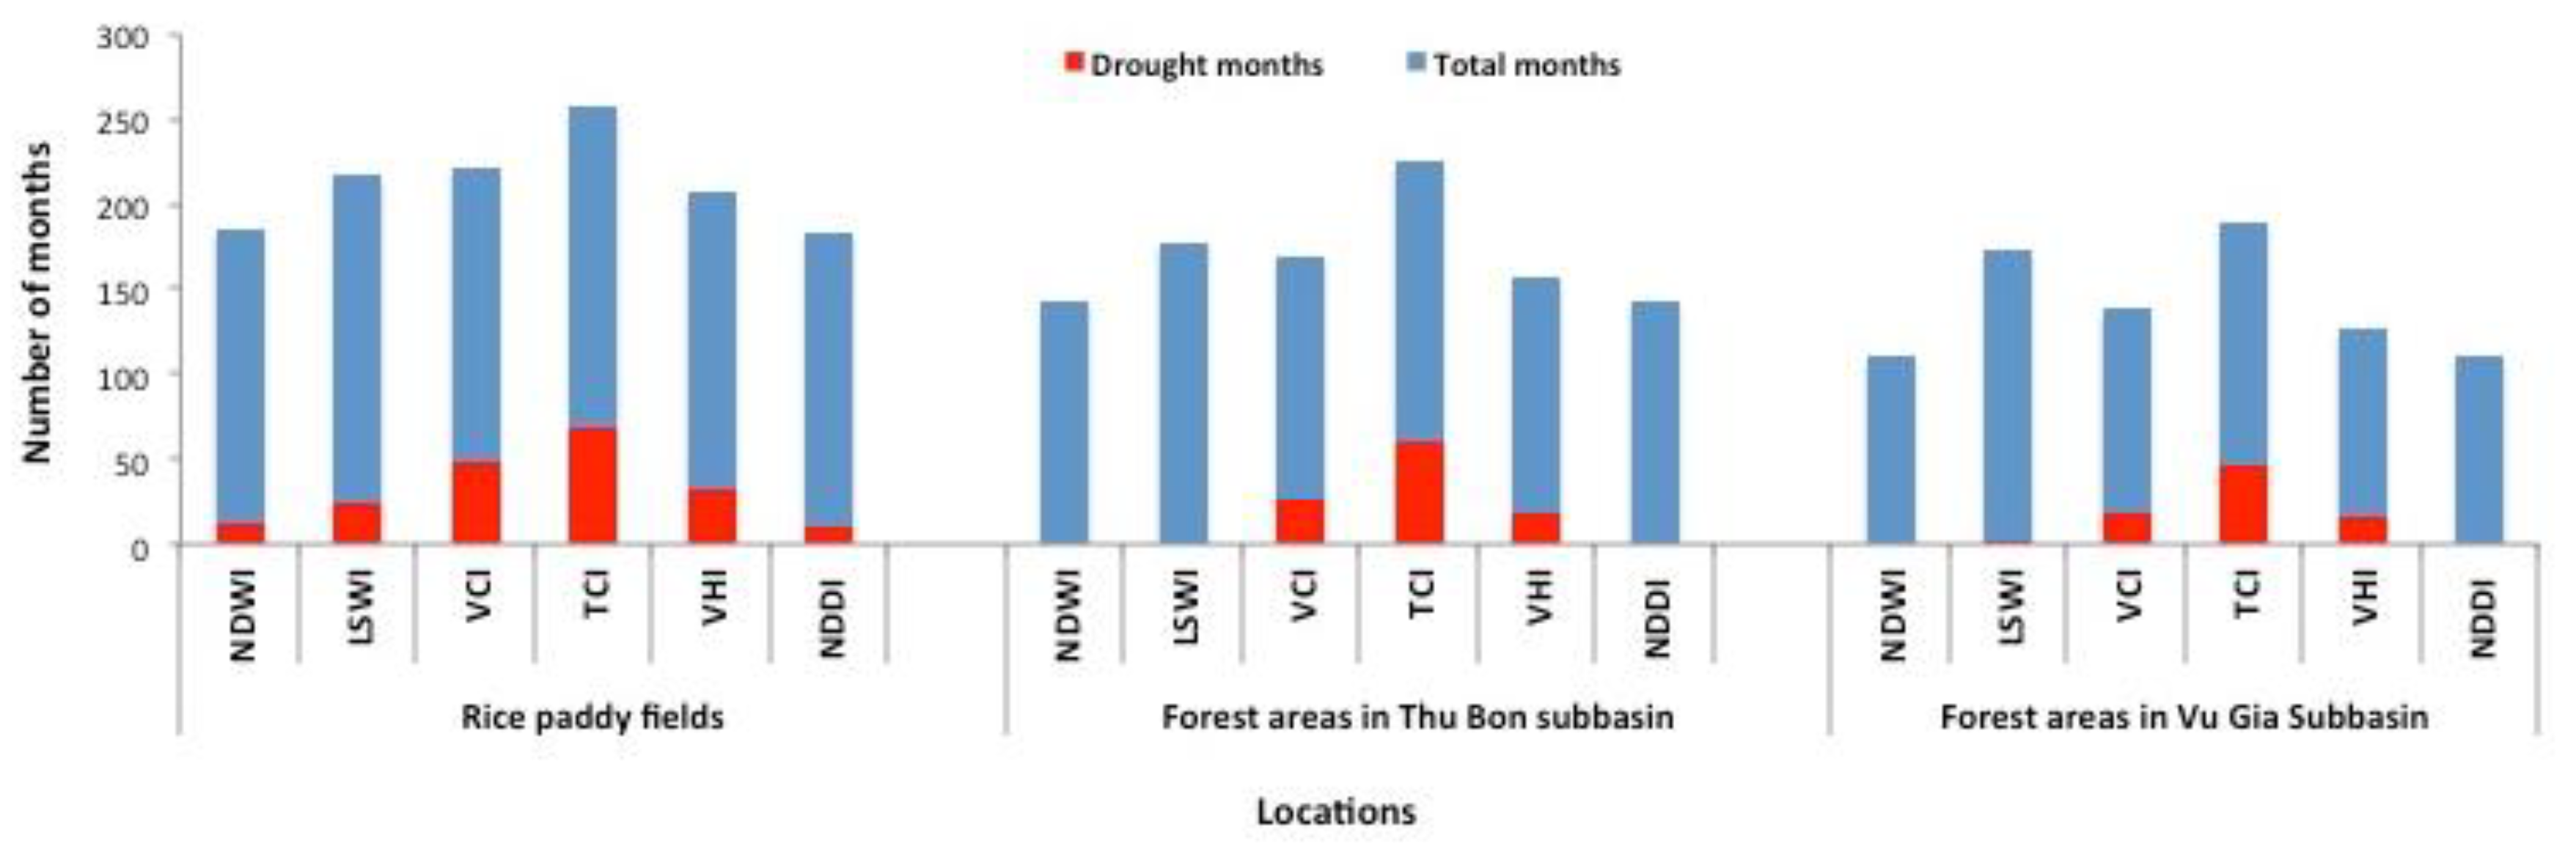
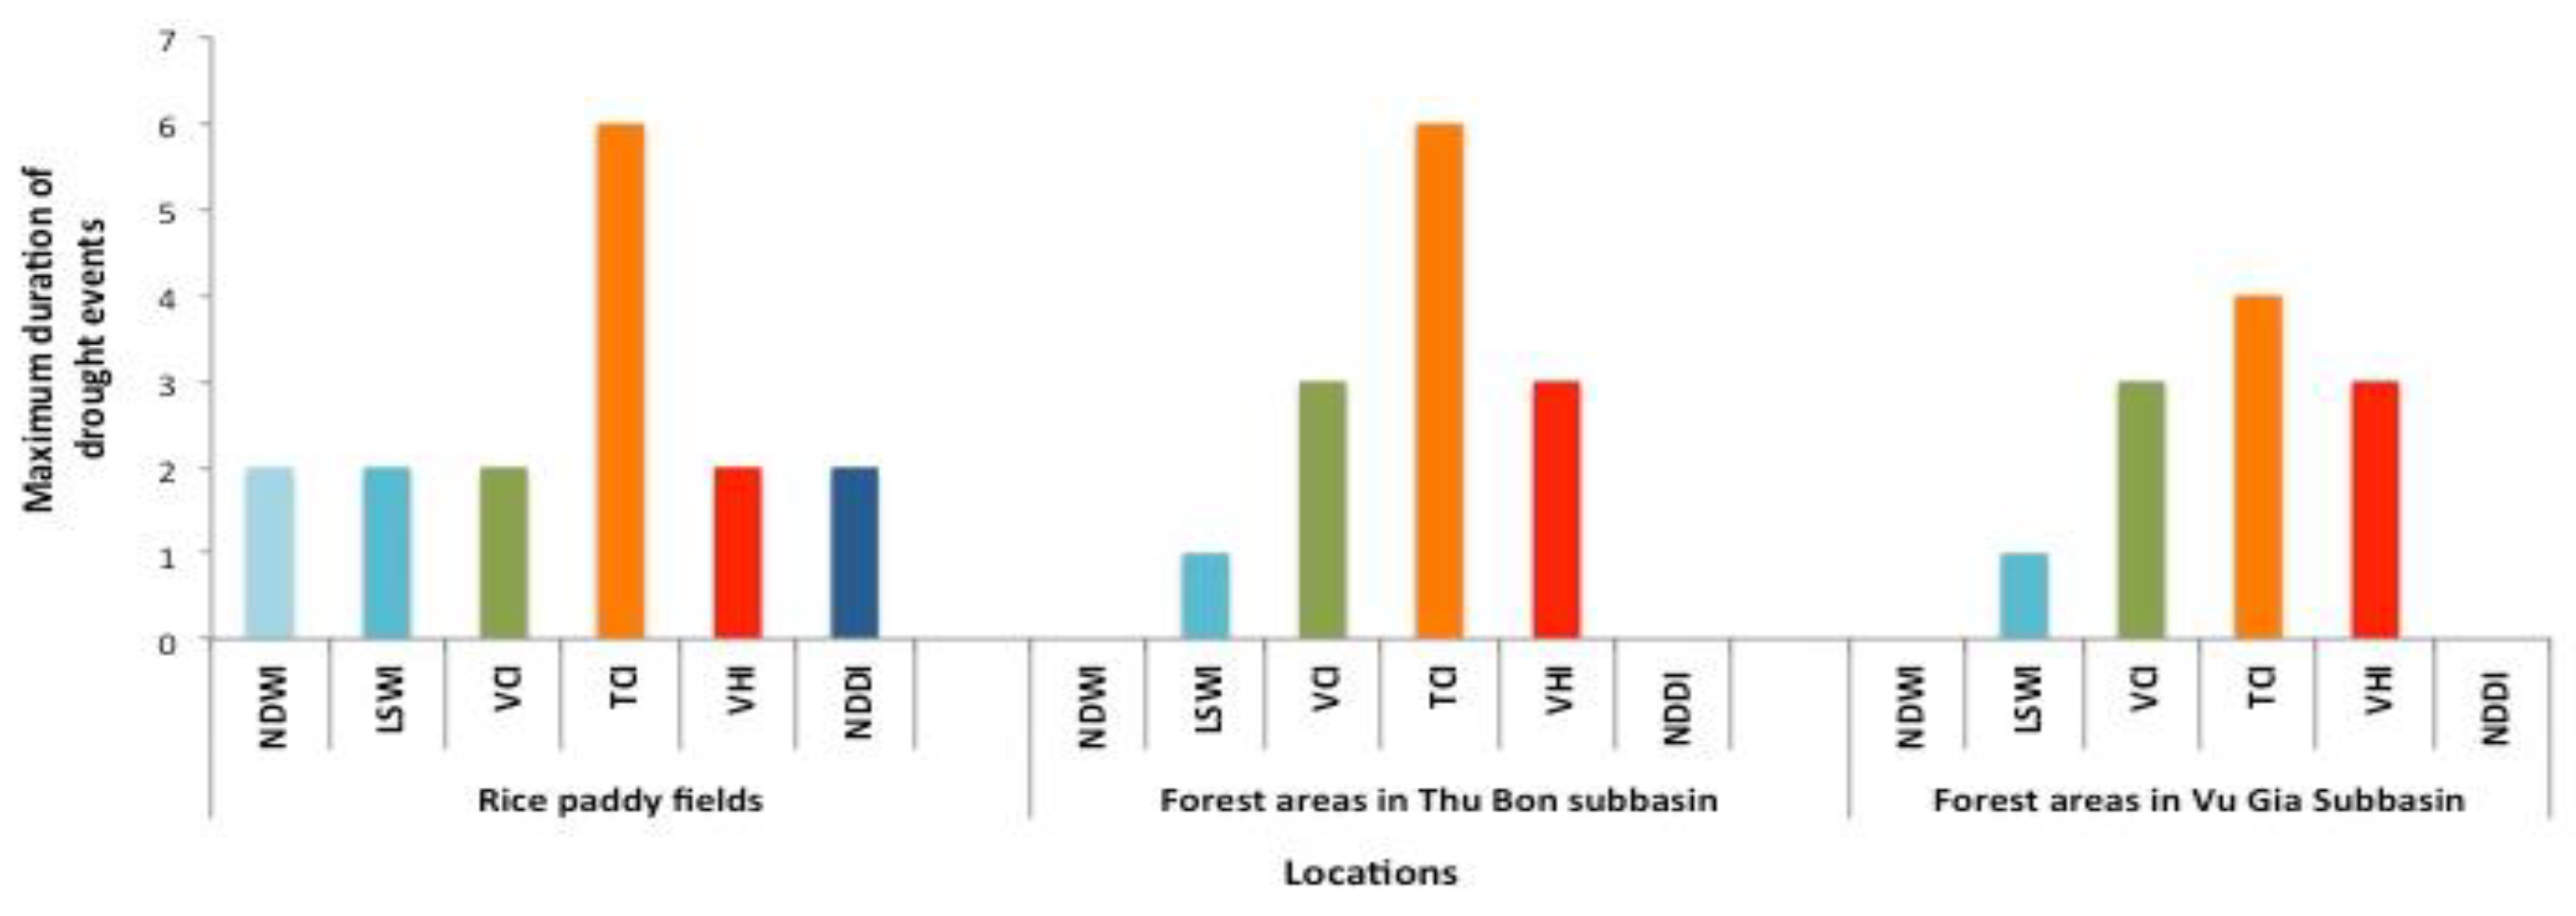
To examine whether droughts that were identified by VIs are linked to historical drought impacts on paddy rice production and forest fires, the drought intensity values that were computed by six VIs were used to identify start and end date, maximum consecutive duration, mean intensity, and maximum intensity for two areas: rice paddy fields and forest areas in Tra My. In the rice paddy fields, all of the VIs found moderate, severe, and extreme agricultural droughts in 2002, 2003, and 2005 (Table 6a). Meanwhile, NDWI, VHI, and NDDI had the same results in identifying severe and extreme droughts in April 2002, April 2003, May 2005, and April 2016. From Table 3, production yield of paddy rice in the basin showed yield reduction compared to the previous year in 2002, 2005, 2010, 2012, and 2016. 2003 was a historical drought year in the entire central Vietnam that most of the key mainstream media reported its progresses and impacts [75]. Fortunately, although its intensity was similar to the historical 1998 drought in the region, no significant drought impacts on crop production were reported due to immediate interventions by mass organizations and government that helped to prevent substantial drought impacts [76]. 2010 and 2012 was also found as drought year by NDWI, LSWI, VHI, and NDDI with lesser intensity. Among all the VIs, NDDI found the least drought months and the least maximum consecutive drought duration, whereas TCI and VHI found the most number of drought months and longer maximum duration (Figure 8 and Figure 9). Higher sensitivity to temperature (r = −0.71~−1) and less sensitivity to precipitation (r = −0.04~0.11) of TCI and VHI (Table 4a) could be the reason why TCI and VHI found more drought months than other indices. Meanwhile, rice paddy is more sensitive to water availability than temperature (indirect estimate of soil moisture). NDDI, which has higher correlation to precipitation (r = −0.48) than other VIs, and thus it better captured droughts and their impacts on crop yield of paddy rice. Combining this result with previous results in Section 5.2, the results of NDDI were well explained by both hydro-meteorological data and impact data on crop yield. Therefore, NDDI could be a more suitable index in identifying droughts in the rice paddy fields.
In the forest areas, as Figure 7b pointed out that NDWI, LSWI, and NDDI did not find any vegetation stress, Table 6b only summarizes the drought years that were identified by VCI, TCI, and VHI. In spite of being located in the Anamite Range Moist Forest that was featured by Tropical and Subtropical Moist Broadleaf Forests, the forest area here has experienced frequent forest fires (Figure 4). Forest destruction, which happened in the past due to the war, has further increased recently since 2011. Therefore, forest areas in the basin are more vulnerable to forest fires. The highest drought intensity (severe drought) was in 2002 (VCI = 14.43; TCI = 10.44; VHI = 25.24), which corresponded to the highest forest areas that were destroyed by fires (157 ha). High drought intensity was also found in 2003, 2005, 2010, and 2012 (VCI = 28.97~39.09; TCI = 14.03~34.26, VHI = 32.4~36.57) that matched well with the high amount of forest areas destroyed by fires in the region (Figure 4). Since fire-prone grasslands in the area are more prone to temperature anomalies, any VI more sensitive to temperature would better explain the drought impacts. In this case, VHI and TCI were more sensitive to temperature (r = −0.44~−1), and thus they better identified drought years and their impacts in the forest (Table 4). Accordingly, TCI found the most number of drought months and maximum duration, which was followed by VHI (Figure 8 and Figure 9). However, since there was no available information on locations and dates of fires except the yearly forest areas that were destroyed by fires, it is unknown if drought intensity values correspond to a period preceding fires or the presence of burned vegetation. Further studies are needed to examine the development of forest fires in these areas. From the previous section results, VHI was found to be better explained by changes in precipitation and soil moisture. One of the unique VHI by-products compared to other VIs was its capabilities to estimate fire risks, which could be the reason of VHI intensity values that are reflected in the basin [69]. Therefore, VHI could be a better index in identifying droughts in the forest areas in the basin.
6. Conclusions
In a highly dynamic, tropical catchment, like Vu Gia Thu Bon, where drought is a recurring phenomenon with persistent negative impacts, while agriculture and forestry (plantation) are still the main livelihoods for the majority of the population, effective drought monitoring and early detection is imperative. The study examined multiple satellite based indices to effectively monitor agricultural droughts from January 2001 until December 2016 for the two main areas with different vegetation types: rice paddy fields and forest areas in the basin. Six vegetation indices (VIs) representing the four main groups: greenness-based VIs (VCI), water-based VIs (NDWI, LSWI), temperature-based VIs (TCI), and combined VIs (VHI, NDDI), were tested based on their sensitivities with precipitation, soil moisture, and their linkage with the negative impacts on agriculture and forest fires.
In each location, there were significant differences in correlations of each VI to temperature, precipitation, or soil moisture. Shallow rooted paddy rice with low available water content is more sensitive to the water availability. Precipitation is thus the key factor contributing to vegetation stress in the rice paddy fields. NDDI was found to have the highest correlation with precipitation, and captured the historical drought impacts on crop yield well. Meanwhile, deeper rooted fire-prone grasslands are more sensitive to temperature, thus temperature is the main factor that is contributing to vegetation stress in the forest areas in the basin. VHI was found to have a high correlation with temperature and its variability was statistically explained by changes in both precipitation and soil moisture. It also well captured the historical drought impacts on forest fires, although whether it is related to risks preceding fires or presence of burned vegetation is unidentified. Future studies are required to examine the development of forest fires in the basin.
Accordingly, satellite-based vegetation indices would be an effective tool for monitoring agricultural droughts in the challenging Vu Gia Thu Bon catchment, which is ecologically dynamic, poorly gauging, recurrently, and scatteredly drought impacted. It was found that combined vegetation indices were more sensitive drought indicators in the basin. However, depending on the vegetation type, specific indices would be more applicable. Particularly, in the agricultural land, NDDI was recommended to be used, whereas for forest land, VHI should be applied.
Author Contributions
T.L.T.D., D.D.B. and M.D.N. conceived and designed the design of the study; T.L.T.D. and M.D.N. performed the data analysis; D.D.B. and H.L. instructed and discussed the results; T.L.T.D. and D.D.B. wrote the paper.
Acknowledgments
This work was carried out as a part of the project “Study to build a toolset for improved drought risk management and adaptive governance in changing climate: a case study in Vu Gia—Thu Bon river basin” funded by the Vietnam National Foundation for Science and Technology (NAFOSTED) under grant number 105.06-2016.15, and partially supported by NASA’s SERVIR Program (NNX16AN35G) and GEOGLOWS Program (80NSSC18K0423). We would like to express our gratitude to government officials, experts and four anonymous reviewers for their helpful advice.
Conflicts of Interest
The authors declare no conflict of interest.
References
- Kogan, F.N. Global drought watch from space. Bull. Am. Meteorol. Soc. 1997, 78, 621–636. [Google Scholar] [CrossRef]
- Hulse, J.H.; Escott, V.J. Drought–Inevitable and Unpredictable the Pattern and Consequences of Recurrent Drought. Interdiscip. Sci. Rev. 1986, 11, 346–358. [Google Scholar] [CrossRef]
- Van Loon, A.F. Hydrological drought explained. Wiley Interdiscip. Rev. Water 2015, 2, 359–392. [Google Scholar] [CrossRef]
- Palmer, W.C. Meteorological Drought (Vol. 30); US Department of Commerce, Weather Bureau: Washington, DC, USA, 1965.
- McKee, T.B.; Doesken, N.J.; Kleist, J. The relationship of drought frequency and duration to time scales. In Proceedings of the 8th Conference on Applied Climatology, Boston, MA, USA, 17–22 January 1993; pp. 179–183. [Google Scholar]
- Narasimhan, B.; Srinivasan, R. Development and evaluation of Soil Moisture Deficit Index (SMDI) and Evapotranspiration Deficit Index (ETDI) for agricultural drought monitoring. Agric. For. Meteorol. 2005, 133, 69–88. [Google Scholar] [CrossRef]
- Modarres, R. Streamflow drought time series forecasting. Stoch. Environ. Res. Risk Assess. 2007, 21, 223–233. [Google Scholar] [CrossRef]
- Bhuiyan, C. Various drought indices for monitoring drought condition in Aravalli terrain of India. In Proceedings of the XXth ISPRS Congress, Istanbul, Turkey, 12–23 July 2004. [Google Scholar]
- Moser, C. The asset vulnerability framework: Reassessing urban poverty reduction strategies. World Dev. 1998, 26, 1–19. [Google Scholar] [CrossRef]
- Tatem, A.J.; Goetz, S.J.; Hay, S.I. Fifty years of earth observation satellites: Views from above have lead to countless advances on the ground in both scientific knowledge and daily life. Am. Sci. 2008, 96, 390–398. [Google Scholar] [CrossRef] [PubMed]
- AghaKouchak, A.; Farahmand, A.; Melton, F.S.; Teixeira, J.; Anderson, M.C.; Wardlow, B.D.; Hain, C.R. Remote Sensing of drought: Progress, challenges and opportunities. Rev. Geophys. 2015, 53, 452–481. [Google Scholar] [CrossRef]
- Tucker, C.J. Red and photographic infrared linear combinations for monitoring vegetation. Remote Sens. Environ. 1979, 8, 127–150. [Google Scholar] [CrossRef]
- Huete, A.; Didan, K.; Miura, T.; Rodriguez, E.P.; Gao, X.; Ferreira, L.G. Overview of the radiometric and biophysical performance of the MODIS vegetation indices. Remote Sens. Environ. 2002, 83, 195–213. [Google Scholar] [CrossRef]
- Kogan, F.N. Application of vegetation index and brightness temperature for drought detection. Adv. Space Res. 1995, 15, 91–100. [Google Scholar] [CrossRef]
- Gao, B.C. NDWI—A normalized difference water index for Remote Sensing of vegetation liquid water from space. Remote Sens. Environ. 1996, 58, 257–266. [Google Scholar] [CrossRef]
- Xiao, X.; Hollinger, D.; Aber, J.; Goltz, M.; Davidson, E.A.; Zhang, Q.; Moore, B., III. Satellite-based modeling of gross primary production in an evergreen needleleaf forest. Remote Sens. Environ. 2004, 89, 519–534. [Google Scholar] [CrossRef]
- Xiao, X.; Zhang, Q.; Braswell, B.; Urbanski, S.; Boles, S.; Wofsy, S.; Moore, B., III; Ojima, D. Modeling gross primary production of temperate deciduous broadleaf forest using satellite images and climate data. Remote Sens. Environ. 2004, 91, 256–270. [Google Scholar] [CrossRef]
- Bajgain, R.; Xiao, X.; Wagle, P.; Basara, J.; Zhou, Y. Sensitivity analysis of vegetation indices to drought over two tallgrass prairie sites. ISPRS J. Photogramm. Remote Sens. 2015, 108, 151–160. [Google Scholar] [CrossRef]
- Bajgain, R.; Xiao, X.; Basara, J.; Wagle, P.; Zhou, Y.; Zhang, Y.; Mahan, H. Assessing agricultural drought in summer over Oklahoma Mesonet sites using the water-related vegetation index from MODIS. Int. J. Biometeorol. 2017, 61, 377–390. [Google Scholar] [CrossRef] [PubMed]
- Gutman, G.G. Towards monitoring droughts from space. J. Clim. 1990, 3, 282–295. [Google Scholar] [CrossRef]
- McVicar, T.R.; Jupp, D.L. Using covariates to spatially interpolate moisture availability in the Murray–Darling Basin: A novel use of remotely sensed data. Remote Sens. Environ. 2002, 79, 199–212. [Google Scholar] [CrossRef]
- Sandholt, I.; Rasmussen, K.; Andersen, J. A simple interpretation of the surface temperature/vegetation index space for assessment of surface moisture status. Remote Sens. Environ. 2002, 79, 213–224. [Google Scholar] [CrossRef]
- Moran, M.S.; Clarke, T.R.; Inoue, Y.; Vidal, A. Estimating crop water deficit using the relation between surface-air temperature and spectral vegetation index. Remote Sens. Environ. 1994, 49, 246–263. [Google Scholar] [CrossRef]
- Wan, Z.; Wang, P.; Li, X. Using MODIS Land surface temperature and normalized difference vegetation index products for monitoring drought in the southern Great Plains, USA. Int. J. Remote Sens. 2004, 25, 61–72. [Google Scholar] [CrossRef]
- Gu, Y.; Hunt, E.; Wardlow, B.; Basara, J.B.; Brown, J.F.; Verdin, J.P. Evaluation of MODIS NDVI and NDWI for vegetation drought monitoring using Oklahoma Mesonet soil moisture data. Geophys. Res. Lett. 2007, 35. [Google Scholar] [CrossRef]
- Buch-Hansen, M.; Khanh, N.N.; Anh, N.H. Paradoxes in Adaptation: Economic Growth and Socio-Economic Differentiation. A Case Study of Mid-Central Vietnam. In On the Frontiers of Climate and Environmental Change; Bruun, O., Casse, T., Eds.; Springer: Berlin/Heidelberg, Germany, 2013; pp. 23–41. [Google Scholar]
- Vu, N.Q.; Schroll, H.; Andersen, J.; Lund, S. Is Climate Change a Reality for Agriculture in Quang Nam Province? In On the Frontiers of Climate and Environmental Change; Bruun, O., Casse, T., Eds.; Springer: Berlin/Heidelberg, Germany, 2013; pp. 43–69. [Google Scholar]
- Food and Agriculture Organization. Viet Nam and FAO Achievements and Success Stories. FAO: Rome, Italy. Available online: http://www.fao.org/docrep/015/an165e/an165e00.pdf (accessed on 1 April 2018).
- General Statistics Office of Vietnam. Statistical Handbook of Vietnam 2016; Statistical Publishing House: Hanoi, Vietnam, 2017. [Google Scholar]
- Buurman, J.; Bui, D.D.; Goedbloed, A.; Du, T.L.T.; Vu, H.H.; Chu, Y. Measuring and Monitoring Droughts and Drought Risks in the Vu Gia—Thu Bon River Basin. In Water Security in a Changing Era, Proceedings of the 4th International Symposium & Exhibition of Vietnam Water Cooperation Initiative, Hanoi, Vietnam, 19 October 2015; Tong, T.N., Bui, D.D., Vu, T.T., Du, T.L.T., Eds.; Vietnam Water Cooperation Initiative: Hanoi, Vietnam, 2015. [Google Scholar]
- Du, T.L.T.; Bui, D.D.; Buurman, J.; Quach, X.T. Towards adaptive governance for urban drought resilience: The case of Da Nang, Vietnam. Int. J. Water Resour. Dev. 2018, 1–19. [Google Scholar] [CrossRef]
- Nguyen, T.S.; Chen, C.F.; Chen, C.R.; Chang, L.Y.; Minh, V.Q. Monitoring agricultural drought in the Lower Mekong Basin using MODIS NDVI and land surface temperature data. Int. J. Appl. Earth Obs. Geoinform. 2012, 18, 417–427. [Google Scholar]
- Tran, T.H.; Campbell, J.B.; Tran, T.D.; Tran, H.T. Monitoring drought vulnerability using multispectral indices observed from sequential Remote Sens. (Case Study: Tuy Phong, Binh Thuan, Vietnam). GISci. Remote Sens. 2017, 54, 1–18. [Google Scholar] [CrossRef]
- Jain, V.K.; Pandey, R.P.; Jain, M.K.; Byun, H.R. Comparison of drought indices for appraisal of drought characteristics in the Ken River Basin. Weather Clim. Extrem. 2015, 8, 1–11. [Google Scholar] [CrossRef]
- Bayissa, Y.; Maskey, S.; Tadesse, T.; van Andel, S.J.; Moges, S.; van Griensven, A.; Solomatine, D. Comparison of the Performance of Six Drought Indices in Characterizing Historical Drought for the Upper Blue Nile Basin, Ethiopia. Geosciences 2018, 8, 81. [Google Scholar] [CrossRef]
- Wang, L.; Qu, J.J. Satellite Remote Sens. applications for surface soil moisture monitoring: A. review. Front. Earth Sci. China 2009, 3, 237–247. [Google Scholar] [CrossRef]
- Anderson, M.C.; Hain, C.; Wardlow, B.; Pimstein, A.; Mecikalski, J.R.; Kustas, W.P. Evaluation of drought indices based on thermal Remote Sens. of evapotranspiration over the continental United States. J. Clim. 2011, 24, 2025–2044. [Google Scholar] [CrossRef]
- Da Nang Statistics Office. Da Nang Statistical Yearbook 2016; Statistical Publishing House: Da Nang, Vietnam, 2017. [Google Scholar]
- Quang Nam Statistics Office. Quang Nam Statistical Yearbook 2016; Statistical Publishing House: Quang Nam, Vietnam, 2017. [Google Scholar]
- DCCCO. Current situation and transboundary region issues that need to be tackled in Vu Gia Thu Bon river basin under framework of Global Resilience Partnership Project. In Proceedings of the first Meeting of Vu Gia Thu Bon River basin Coordinating Board, Danang, Vietnam, 23 February 2017. [Google Scholar]
- Chau, V.N. Assessing the Impacts of Extreme Floods on Agriculture in Vietnam: Quang Nam Case Study. A Dissertation Presented in Partial Fulfilment OF THE Requirements for the Degree of Doctor of Philosophy in Environmental Management at Massey University, Manawatu, New Zealand. Ph.D. Thesis, Massey University, Wellington, New Zealand, 2014. [Google Scholar]
- Lee, H.; Yuan, T.; Jung, H.C.; Beighley, E. Mapping wetland water depths over the central Congo Basin using PALSAR ScanSAR, Envisat altimetry, and MODIS VCF data. Remote Sens. Environ. 2015, 159, 70–79. [Google Scholar] [CrossRef]
- Gorelick, N.; Hancher, M.; Dixon, M.; Ilyushchenko, S.; Thau, D.; Moore, R. Google Earth Engine: Planetary-scale geospatial analysis for everyone. Remote Sens. Environ. 2017, 202, 18–27. [Google Scholar] [CrossRef]
- Didan, K. MOD13Q1 MODIS/Terra Vegetation Indices 16-Day L3 Global 250m SIN Grid V006; NASA EOSDIS LP DAAC: Washington, DC, USA, 2015.
- Tucker, C.J. Remote Sens. of leaf water content in the near infrared. Remote Sens. Environ. 1980, 10, 23–32. [Google Scholar] [CrossRef]
- Vermote, E.F.; Kotchenova, S.Y.; Ray, J.P. MODIS Surface Reflectance User’s Guide; MODIS Land Surface Reflectance Science Computing Facility, Version, 1; NASA: Washington, DC, USA, 2011.
- Wan, Z. Collection-6 MODIS Land Surface Temperature Products Users’ Guide. Available online: https://lpdaac.usgs.gov/sites/default/files/public/product_documentation/mod11_user_guide.pdf (accessed on 1 April 2018).
- Bolten, J.D.; Crow, W.T.; Zhan, X.; Jackson, T.J.; Reynolds, C.A. Evaluating the utility of remotely sensed soil moisture retrievals for operational agricultural drought monitoring. IEEE J. Sel. Top. Appl. Earth Obs. Remote Sens. 2010, 3, 57–66. [Google Scholar] [CrossRef]
- Ngo, Đ.M.; Mai, V.T.; Reiner, W.; Tran, Đ.H.; Nguyen, M.K. Farmer’s Perception and Farming Practices in Rice Production under Changing Climate: Case Study in Quảng Nam Province. VNU J. Sci. Earth Environ. Sci. 2014, 30, 25–40. [Google Scholar]
- Von Platen-Hallermund, T. Thorsen, Natural Resource Management Impact on Vulnerability in Relation to Climate Change: A Case in a Micro-Scale Vietnamese Context. In On the Frontiers of Climate and Environmental Change; Bruun, O., Casse, T., Eds.; Springer: Berlin/Heidelberg, Germany, 2013; pp. 155–177. [Google Scholar]
- Bruijnzeel, L.A. Hydrological functions of tropical forests: Not seeing the soil for the trees? Agric. Ecosyst. Environ. 2001, 104, 185–228. [Google Scholar] [CrossRef]
- Giambelluca, T.W. Hydrology of altered tropical forest. Hydrol. Process. 2002, 16, 1665–1669. [Google Scholar] [CrossRef]
- De Koninck, R. Deforestation in Viet Nam; IDRC: Ottawa, ON, Canada, 1999. [Google Scholar]
- Barney, K. Central Plans and Global Exports: Tracking Vietnams Forestry Commodity Chains and Export Links to China. China and Forest Trade in the Asia-Pacific Region: Implications for Forests and Livelihoods; Forest Trends: Washington, DC, USA, 2005. [Google Scholar]
- McNamara, S.; Tinh, D.V.; Erskine, P.D.; Lamb, D.; Yates, D.; Brown, S. Rehabilitating degraded forest land in central Vietnam with mixed native species plantings. Forest Ecol. Manag. 2006, 233, 358–365. [Google Scholar] [CrossRef]
- Le, A.D.; Vu, L.T.T. Climate Change’s Impact on Natural Hazards in Quang Nam Province, Mid-Central Vietnam. In On the Frontiers of Climate and Environmental Change; Bruun, O., Casse, T., Eds.; Springer: Berlin/Heidelberg, Germany, 2013; pp. 91–98. [Google Scholar]
- Da Nang Statistics Office. Da Nang Statistical Yearbook 2010; Statistical Publishing House: Da Nang, Vietnam, 2011. [Google Scholar]
- Quang Nam Statistics Office. Quang Nam Statistical Yearbook 2010; Statistical Publishing House: Quang Nam, Vietnam, 2017. [Google Scholar]
- Da Nang Statistics Office. Da Nang Statistical Yearbook 2006; Statistical Publishing House: Da Nang, Vietnam, 2007. [Google Scholar]
- Quang Nam Statistics Office. Quang Nam Statistical Yearbook 2006; Statistical Publishing House: Quang Nam, Vietnam, 2007. [Google Scholar]
- General Statistics Office of Vietnam. Statistics. Available online: https://www.gso.gov.vn/Default_en.aspx?tabid=766 (accessed on 1 April 2018).
- Zhu, J.; Miller, A.E.; Lindsay, C.; Broderson, D.; Heinrichs, T.; Martyn, P. MODIS NDVI Products and Metrics User Manual, Version 1.0; Geographic Information Network for Alaska: Anchorage, AK, USA, 2013. [Google Scholar]
- Singh, R.P.; Roy, S.; Kogan, F. Vegetation and temperature condition indices from NOAA AVHRR data for drought monitoring over India. Int. J. Remote Sens. 2003, 24, 4393–4402. [Google Scholar] [CrossRef]
- Narasimhan, B.; Srinivasan, R.; Whittaker, A.D. Whittaker Estimation of potential evapotranspiration from NOAA-AVHRR satellite. Appl. Eng. Agric. 2003, 19, 309–318. [Google Scholar] [CrossRef]
- Anderson, M.C.; Norman, J.M.; Mecikalski, J.R.; Otkin, J.A.; Kustas, W.P. A climatological study of evapotranspi-ration and moisture stress across the continental United States based on thermal remote sensing: 1. Model. formulation. J. Geophys. Res. 2007, 112, D10117. [Google Scholar] [CrossRef]
- Seiler, R.; Kogan, F.N.; Sullivan, J. AVHRR-based vegetation and temperature condition indices for drought detection in Argentina. Adv. Space Res. 1998, 21, 481–484. [Google Scholar] [CrossRef]
- Karnieli, A.; Agam, N.; Pinker, R.T.; Anderson, M.; Imhoff, M.L.; Gutman, G.G.; Panov, N.; Goldberg, A. Use of NDVI and Land Surface Temperature for Drought Assessment: Merits and Limitations. J. Clim. 2010, 23, 618–633. [Google Scholar] [CrossRef]
- Sun, D.; Kafatos, M. Note on the NDVI-LST relationship and the use of temperature-related drought indices over North America. Geophys. Res. Lett. 2007, 34, 34. [Google Scholar] [CrossRef]
- Kogan, F.N. World droughts in the new millenium from AVHRR-based Vegetation Health Indices. Eos Trans. Am. Geophys.Union 2002, 83, 562–563. [Google Scholar] [CrossRef]
- Cheng-Lin, L.; Jian-Jun, W. Crop drought monitoring using MODIS NDDI over mid-territory of China. In Proceedings of the IGARSS 2008—2008 IEEE International Geoscience and Remote Sensing Symposium, Boston, MA, USA, 7–11 July 2008; Volume 3, p. III-883. [Google Scholar]
- Rhee, J.; Im, J.; Carbone, G.J. Monitoring agricultural drought for arid and humid regions using multi-sensor Remote Sens. data. Remote Sens. Environ. 2010, 114, 2875–2887. [Google Scholar] [CrossRef]
- Khampeera, A.; Yongchalermchai, C.; Techato, K. Drought Monitoring using Drought Indices and GIS Techniques in Kuan Kreng Peat Swamp, Southern Thailand. Walailak J. Sci. Technol. 2017, 15, 357–370. [Google Scholar]
- Ogashawara, I.; Bastos, V.D.S.B. A quantitative approach for analyzing the relationship between urban heat islands and land cover. Remote Sens. 2012, 4, 3596–3618. [Google Scholar] [CrossRef]
- Jackson, R.B.; Canadell, J.; Ehleringer, J.R.; Mooney, H.A.; Sala, O.E.; Schulze, E.D. A global analysis of root distributions for terrestrial biomes. Oecologia 1996, 108, 389–411. [Google Scholar] [CrossRef] [PubMed]
- Vnexpress. Topic: 2003 Drought. Available online: https://vnexpress.net/han-han-2003/topic-12259.html (accessed on 1 April 2018).
- Asian Disaster Preparedness Center. The Role of Local Institutions in Reducing Vulnerability to Recurrent Natural Disasters and in Sustainable Livelihoods Development. Available online: http://www.fao.org/docrep/007/ae080e/ae080e03.htm (accessed on 1 April 2018).
Figure 1.
Overview of the Vu Gia—Thu Bon basin.

Figure 2.
Monthly precipitation for the period 1982 to 2015 from five ground stations. (Average in-situ precipitation is taken from eleven ground rainfall stations; Multiyear monthly precipitation in Ai Nghia, Hoi An and Kham Duc is from 1982 to 2013, the rest is from 1982 to 2015). Da Nang, Ai Nghia, Hoi An stations are in downstream area, whereas Tra My and Kham Duc stations are in upstream area. Source: Hydro-meteorological station for central Vietnam (http://kttvttb.vn/).

Figure 3.
Land cover map of the region. Source: ESA 2010 and UCLouvain (http://due.esrin.esa.int/page_globcover.php).
Figure 3.
Land cover map of the region. Source: ESA 2010 and UCLouvain (http://due.esrin.esa.int/page_globcover.php).

Figure 4.
The time series plot of forest area destroyed by fires and other reasons in the basin. Source: General Statistics Office of Vietnam (https://www.gso.gov.vn/).
Figure 4.
The time series plot of forest area destroyed by fires and other reasons in the basin. Source: General Statistics Office of Vietnam (https://www.gso.gov.vn/).
Figure 5.
Correlation Coefficient and Regression R Square between Normalized Difference Vegetation Index (NDVI) and Land Surface Temperature (LST) derived from (1) MOD13Q1 and MOD11A2 and (2) MOD09A1 and MOD11A2.
Figure 5.
Correlation Coefficient and Regression R Square between Normalized Difference Vegetation Index (NDVI) and Land Surface Temperature (LST) derived from (1) MOD13Q1 and MOD11A2 and (2) MOD09A1 and MOD11A2.

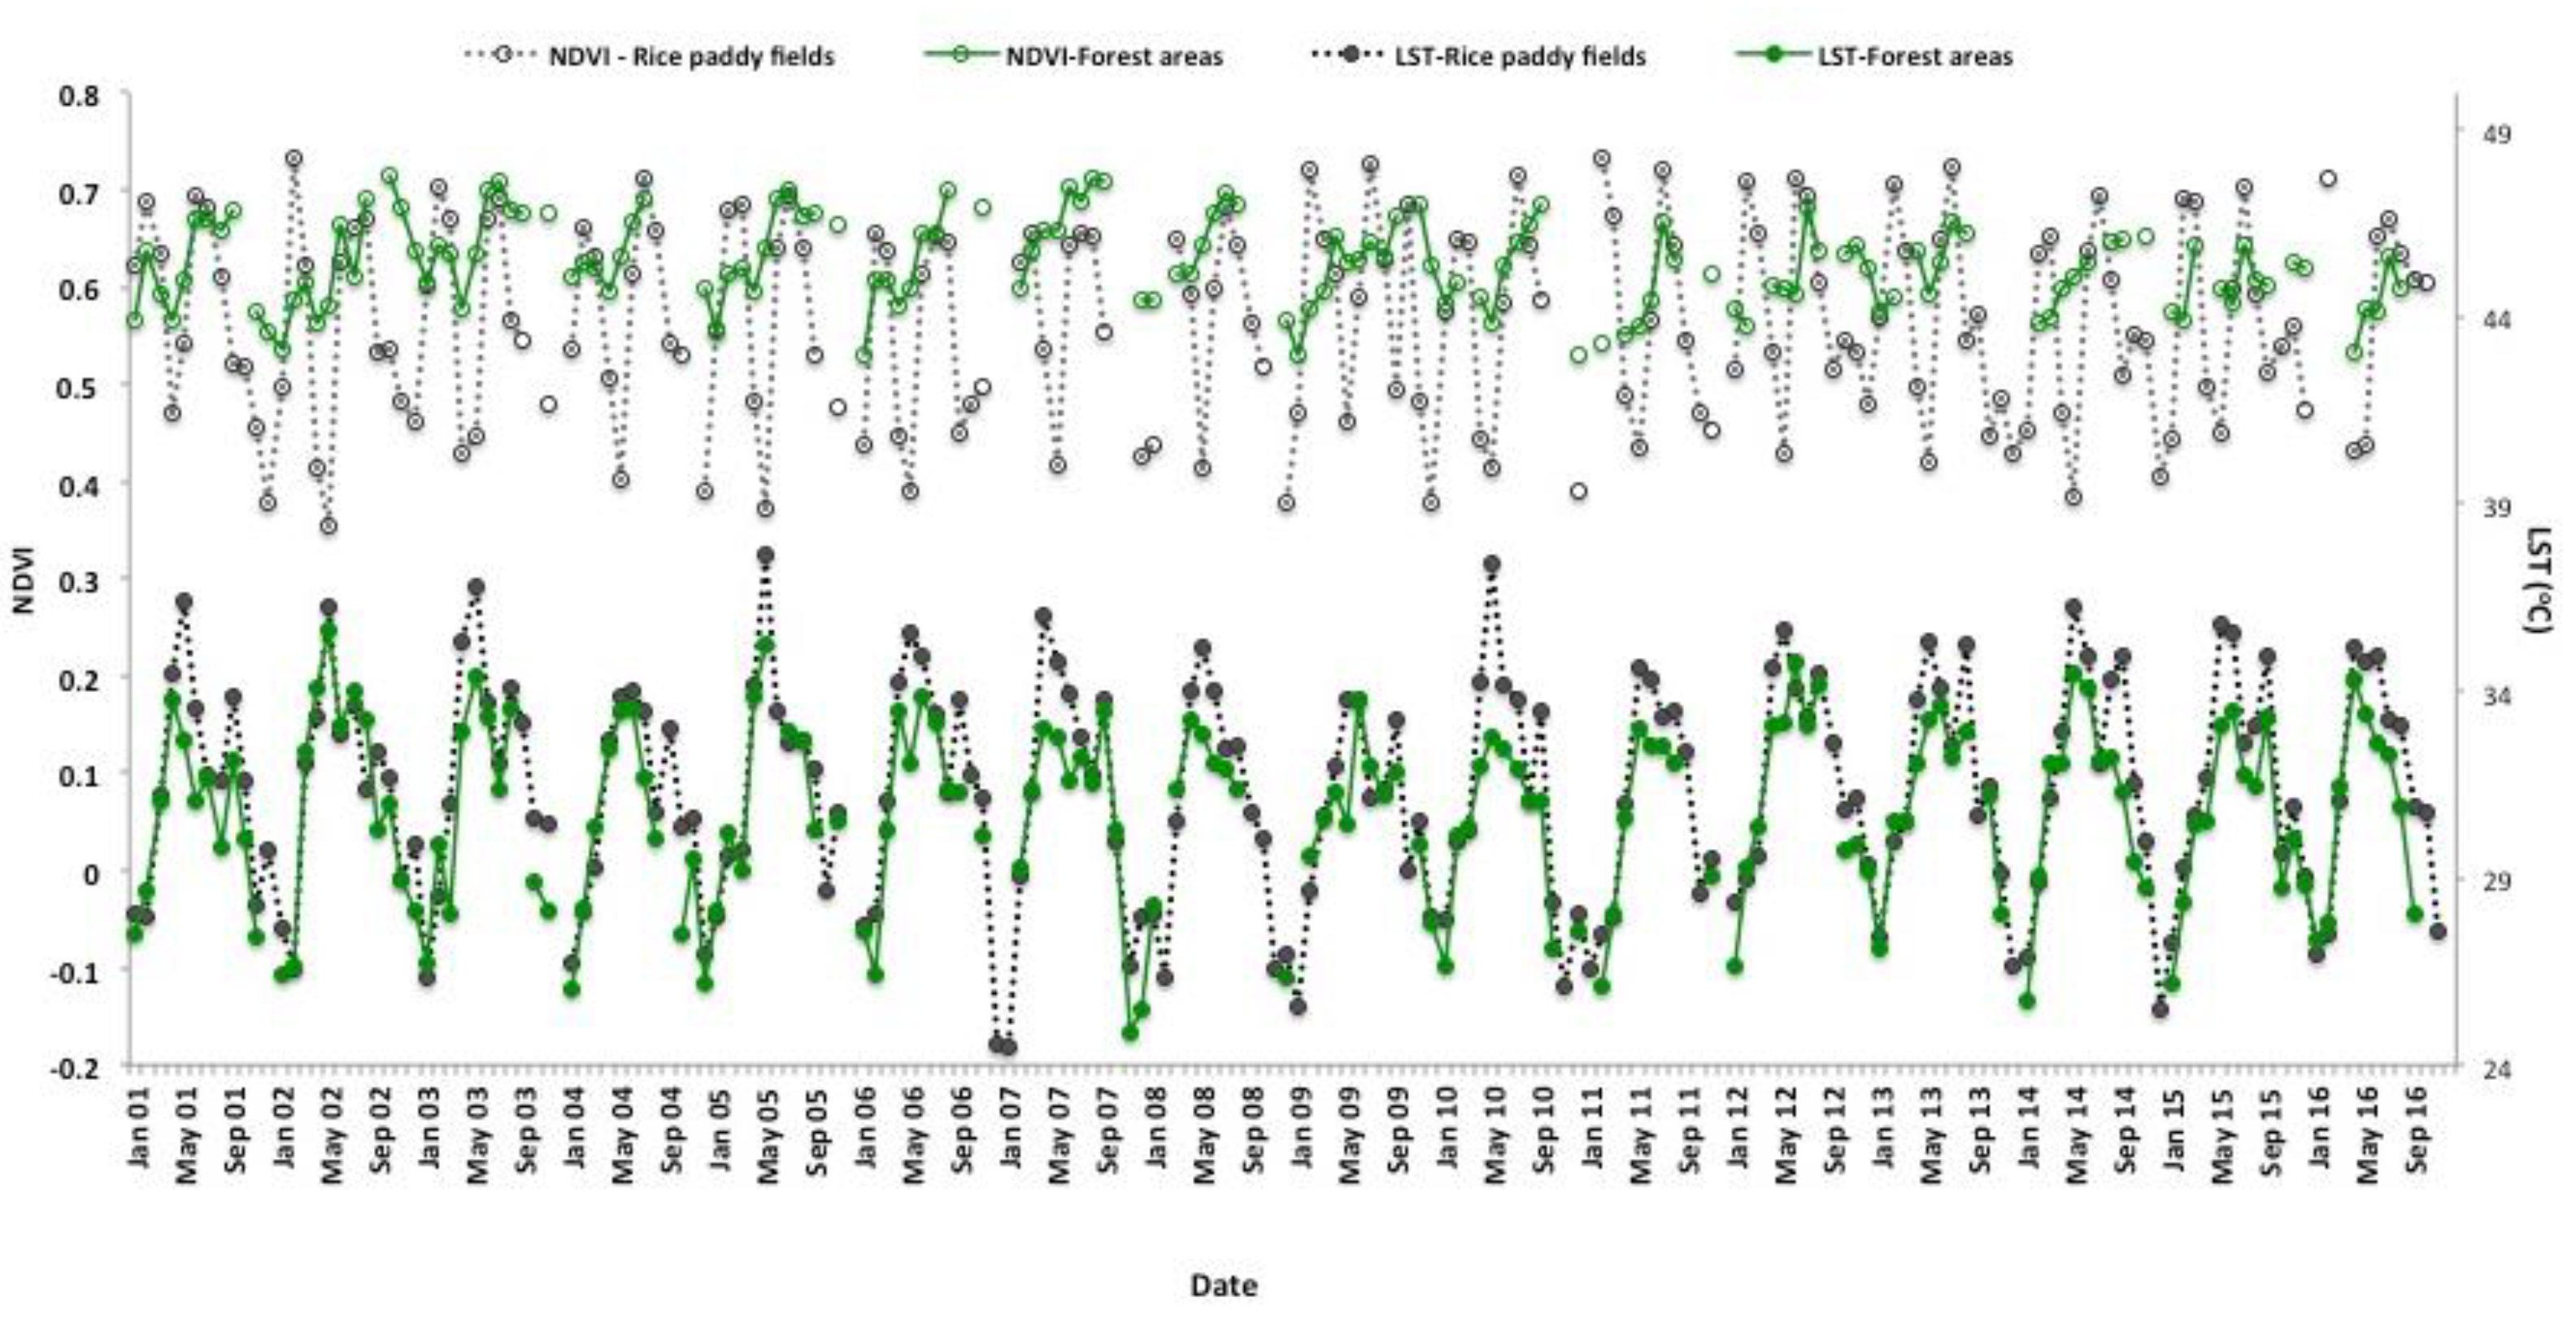
Figure 6.
The time series plot of NDVI and LST for rice paddy fields and forest areas in Tra My.

Figure 7.
The time series plot of VIs for (a) rice paddy fields; and (b) forest areas. Vegetation indices (VIs) include Normalized Different Water Index (NDWI), Land Surface Water Index (LSWI), Vegetation Condition Index (VCI), Temperature Condition Index (TCI), Vegetation Health Index (VHI), and Normalized Different Drought Index (NDDI).


Figure 8.
Number of drought months identified by six VIs at different locations.

Figure 9.
Maximum duration of droughts identified by six VIs at different locations.


Table 1.
Summary of vegetation indices by groups.
| Name of Vegetation Indices | Full Name | Formula | References |
|---|---|---|---|
| 1. Vegetation greenness indices | |||
| NDVI | Normalized Difference Vegetation Index | (ρ858 − ρ650)/(ρ858+ ρ650) | [12] |
| EVI | Enhanced Vegetation Index | 2.5 × (ρ858 – ρ650)/(ρ858 + 6 × ρ650 − 7 × ρ469 + 1) | [13] |
| VCI | Vegetation Condition Index | (NDVI − NDVImin)/(NDVImax − NDVImin) | [14] |
| 2. Vegetation water indices | |||
| NDWI | Normalized Difference Water Index | (ρ858 − ρ1240)/(ρ858 + ρ1240) or (ρ858 − ρ2130)/(ρ858 + ρ2130) | [15] [25] |
| LSWI | Land Surface Water Index | (ρ858 − ρ1640)/(ρ858 + ρ1640) | [16,17] |
| NMDI | Normalized Multiband Drought Index | (ρ860 − (ρ1640 – ρ2130))/(ρ860 + (ρ1640 − ρ2130)) | [36] |
| 3. Vegetation temperature indices | |||
| LST | Land Surface Temperature | [20] | |
| TCI | Temperature Condition Index | 100 × (LSTmax − LST)/(LSTmax − LSTmin) | [14] |
| NDTI | Normalized Difference Temperature Index | (T∞ − Ts)/(T∞ − T0) | [21] |
| ESI | Evapotranspiration Stress Index | ƒPET = ET/PET | [37] |
| 4. Combined indices | |||
| VTCI | Vegetation Temperature Condition Index | VTCI = (LSTNDVIi max − LSTNDVIi)/(LSTNDVIi max − LSTNDVIi min) | [23,24] |
| VHI | Vegetation Health Index | α × VCI + (1 − α) × TCI | [14] |
| TVDI | Temperature Vegetation Dryness Index | (LST − LSTmin)/(a + b × NDVI − LSTmin) | [22] |
| NDDI | Normalized Difference Drought Index | (NDVI − NDWI)/(NDVI + NDWI) | [25] |
Table 2.
Calendar of the main crops and climatic conditions in the Vu Gia Thu Bon (VGTB) river basin.
Table 2.
Calendar of the main crops and climatic conditions in the Vu Gia Thu Bon (VGTB) river basin.
| Content | Jan | Feb | Mar | Apr | May | Jun | Jul | Aug | Sep | Oct | Nov | Dec |
|---|---|---|---|---|---|---|---|---|---|---|---|---|
| Crop calendar | ||||||||||||
| Winter-Spring Rice | ||||||||||||
| Summer-Autumn Rice | ||||||||||||
| Corn | ||||||||||||
| Beans | ||||||||||||
| Other vegetables | ||||||||||||
| Climatic conditions | ||||||||||||
| Flood season | ||||||||||||
| Main flood period | ||||||||||||
| Normal dry period | ||||||||||||
| Dry period during dry spells | ||||||||||||
Table 3.
Summary of paddy yield reduction by drought compared to the previous year.
| Year | Winter Spring Rice Crop | Summer Autumn Rice Crop |
|---|---|---|
| Quintal/ha | Quintal/ha | |
| 2002 | −2.23 | |
| 2005 | −1 | −1.41 |
| 2010 | −1.24 | |
| 2012 | −1.15 | |
| 2016 | −3.81 |
Table 4.
The Pearson’s Correlation coefficient and p-values of statistical test matrix computed between the paired values of VIs and other data (NDVI, LST, in-situ precipitation, and soil moisture) for (a) rice paddy fields and (b) forest areas.
Table 4.
The Pearson’s Correlation coefficient and p-values of statistical test matrix computed between the paired values of VIs and other data (NDVI, LST, in-situ precipitation, and soil moisture) for (a) rice paddy fields and (b) forest areas.
| Categories | Variables | Examined VIs | Other Information | |||||||
|---|---|---|---|---|---|---|---|---|---|---|
| NDWI | LSWI | VCI | TCI | VHI | NDDI | NDVI | LST | In-Situ Precipitation | ||
| (a) Rice paddy fields | ||||||||||
| Examined VIs | LSWI | 0.82 | ||||||||
| VCI | 0.81 | 0.79 | ||||||||
| TCI | 0.30 | 0.32 | 0.14 | |||||||
| VHI | 0.78 | 0.77 | 0.78 | 0.71 | ||||||
| NDDI | −0.57 | −0.31 | −0.01 | −0.43 | −0.31 | |||||
| Other information | NDVI | 0.80 | 0.78 | 0.99 | 0.11 | 0.76 | 0.02 | |||
| LST | −0.31 | −0.32 | −0.13 | −1.00 | −0.71 | 0.45 | −0.10 | |||
| In-situ Precipitation | 0.14 | 0.05 | −0.18 | 0.11 | −0.04 | −0.48 | −0.23 | −0.15 | ||
| SM | 0.33 | 0.17 | −0.06 | 0.52 | 0.32 | −0.65 | −0.10 | −0.56 | 0.66 | |
| (b) Forest areas | ||||||||||
| Examined VIs | LSWI | 0.84 | ||||||||
| VCI | 0.74 | 0.68 | ||||||||
| TCI | −0.21 | −0.23 | −0.27 | |||||||
| VHI | 0.54 | 0.41 | 0.74 | 0.44 | ||||||
| NDDI | −0.79 | −0.61 | −0.18 | 0.04 | −0.14 | |||||
| Other information | NDVI | 0.74 | 0.68 | 1.00 | −0.27 | 0.74 | −0.18 | |||
| LST | 0.21 | 0.23 | 0.27 | −1.00 | −0.44 | −0.04 | 0.27 | |||
| In-situ Precipitation | 0.24 | 0.24 | 0.23 | 0.25 | 0.35 | −0.14 | 0.23 | −0.25 | ||
| SM | 0.39 | 0.37 | 0.39 | 0.37 | 0.59 | −0.29 | 0.39 | −0.37 | 0.57 | |
⬜ p > 0.05, ⬛ p < 0.05, ⬛ p < 0.01, ⬛ p < 0.001.
Table 5.
Summary of multiple linear regression test between six VIs and other related data (in-situ precipitation and NASA-USDA assimilated soil moisture).
Table 5.
Summary of multiple linear regression test between six VIs and other related data (in-situ precipitation and NASA-USDA assimilated soil moisture).
| Model | Observation | Multiple R | R Square | Adjusted R Square | Intercept | Soil Moisture- Slope | Precipitation- Slope |
|---|---|---|---|---|---|---|---|
| Rice paddy fields | |||||||
| NDWI, P, SM model | 76.00 | 0.35 | 0.12 | 0.10 | 0.30 | 0.01 | 0.00 |
| LSWI, P, SM model | 84.00 | 0.17 | 0.03 | 0.01 | 0.11 | 0.00 | 0.00 |
| VCI, P, SM model | 77.00 | 0.10 | 0.01 | −0.02 | 55.47 | 0.11 | −0.29 |
| TCI, P, SM model | 82.00 | 0.56 | 0.32 | 0.30 | −25.75 | 4.62 | −0.67 |
| VHI, P, SM model | 77.00 | 0.34 | 0.12 | 0.09 | 15.46 | 2.27 | −0.28 |
| NDDI, P, SM model | 76.00 | 0.70 | 0.49 | 0.47 | 0.38 | −0.01 | 0.00 |
| Forest areas | |||||||
| NDWI, P, SM model | 49.00 | 0.36 | 0.13 | 0.09 | 0.42 | 0.00 | 0.00 |
| LSWI, P, SM model | 65.00 | 0.40 | 0.16 | 0.13 | 0.15 | 0.00 | 0.00 |
| VCI, P, SM model | 49.00 | 0.35 | 0.12 | 0.09 | 20.79 | 2.03 | 0.01 |
| TCI, P, SM model | 61.00 | 0.29 | 0.09 | 0.05 | 28.64 | 1.10 | 0.01 |
| VHI, P, SM model | 49.00 | 0.56 | 0.32 | 0.29 | 21.13 | 1.73 | 0.00 |
| NDDI, P, SM model | 49.00 | 0.25 | 0.06 | 0.02 | 0.13 | 0.00 | 0.00 |
⬜ p > 0.05, ⬛ p < 0.05, ⬛ p < 0.01, ⬛ p < 0.001.
Table 6.
Summary of historical droughts identified by six VIs for (a) rice paddy fields and (b) forest areas.
(a) Rice paddy fields.
| Drought Index | NDWI | LSWI | VCI | TCI | VHI | NDDI |
|---|---|---|---|---|---|---|
| Dry season 2002 (January 2001–September 2002) | ||||||
| Occurrence (Duration) | Apr–May (2) | Apr–May (2) | Apr–May (2) | May–Aug (4) | Apr–May (2) | Apr–Apr (1) |
| Max Intensity (Mean intensity) | 0.2 (0.24) | 0 (0.05) | 10.67 (16.09) | 17.98 (32.52) | 15.8 (22.41) | 0.39 (0.39) |
| Dry season 2005 (December 2004–September 2005) | ||||||
| Occurrence (Duration) | May–May (1) | May–Sept (2) | May–May (1) | Sept–Sept (1) | ||
| Max Intensity (Mean intensity) | 0.09 (0.09) | 19.52 (28.18) | 31.14 (31.14) | 0.2 (0.2) | ||
| Dry season 2010 (December 2009–September 2010) | ||||||
| Occurrence (Duration) | Apr–May (2) | Apr–May (2) | Dec–May (2) | Apr–Sept (4) | Apr–May (2) | Apr–Apr (1) |
| Max Intensity (Mean intensity) | 0.24 (0.26) | −0.01 (0.04) | 18.88 (23.62) | 15.09 (28.8) | 19.14 (23.69) | 0.55 (0.55) |
| Dry season 2012 (December 2011–September 2012) | ||||||
| Occurrence (Duration) | May–May (1) | May–May (1) | May–May (1) | May–Sept (5) | May–May (1) | May–May (1) |
| Max Intensity (Mean intensity) | 0.27 (0.27) | 0.01 (0.01) | 18.88 (23.61) | 21.52 (31.9) | 24 (24) | 0.27 (0.27) |
| Dry season 2016 (December 2015–September 2016) | ||||||
| Occurrence (Duration) | Apr–Apr (1) | Apr–May (2) | Dec–May (2) | Apr–Aug (5) | Apr–May (2) | Apr–Apr (1) |
| Max Intensity (Mean intensity) | 0.2 (0.20) | 0 (0.03) | 26.52 (28.05) | 24.77 (31.72) | 24.73 (27.53) | 0.4 (0.4) |
(b) Forest areas.
| Drought Index | VCI | TCI | VHI |
|---|---|---|---|
| Forest Fire in 2002 | |||
| Occurrence (Duration) | Jan–Jan (1) | Mar–Aug (6) | Apr–May (2) |
| Max Intensity (Mean intensity) | 14.43 (14.43) | 10.44 (26.01) | 25.24 (25.76) |
| Forest Fire in 2003 | |||
| Occurrence (Duration) | Apr–Apr (1) | Apr–Sept (3) | Apr–Apr (1) |
| Max Intensity (Mean intensity) | 39.09 (39.09) | 20.94 (27.86) | 35.94 (35.94) |
| Forest Fire in 2005 | |||
| Occurrence (Duration) | Jan–Jan (1) | Apr–Sept (5) | Apr–Apr (1) |
| Max Intensity (Mean intensity) | 24.82 (24.82) | 14.03 (14.03) | 36.67 (36.67) |
| Forest Fire in 2010 | |||
| Occurrence (Duration) | May–May (1) | May–Jun (2) | May–May (1) |
| Max Intensity (Mean intensity) | 30.54 (30.54) | 34.26 (35.28) | 32.4 (32.4) |
| Forest Fire in 2012 | |||
| Occurrence (Duration) | Jan–Feb (2) | Apr–Aug (5) | Jun–Jun (1) |
| Max Intensity (Mean intensity) | 28.97 (33.85) | 17.29 (26.76) | 32.51 (32.51) |
© 2018 by the authors. Licensee MDPI, Basel, Switzerland. This article is an open access article distributed under the terms and conditions of the Creative Commons Attribution (CC BY) license (http://creativecommons.org/licenses/by/4.0/).
Share and Cite
MDPI and ACS Style
Du, T.L.T.; Bui, D.D.; Nguyen, M.D.; Lee, H. Satellite-Based, Multi-Indices for Evaluation of Agricultural Droughts in a Highly Dynamic Tropical Catchment, Central Vietnam. Water 2018, 10, 659. https://doi.org/10.3390/w10050659
AMA Style
Du TLT, Bui DD, Nguyen MD, Lee H. Satellite-Based, Multi-Indices for Evaluation of Agricultural Droughts in a Highly Dynamic Tropical Catchment, Central Vietnam. Water. 2018; 10(5):659. https://doi.org/10.3390/w10050659
Chicago/Turabian StyleDu, Tien Le Thuy, Duong Du Bui, Minh Duc Nguyen, and Hyongki Lee. 2018. "Satellite-Based, Multi-Indices for Evaluation of Agricultural Droughts in a Highly Dynamic Tropical Catchment, Central Vietnam" Water 10, no. 5: 659. https://doi.org/10.3390/w10050659
Note that from the first issue of 2016, this journal uses article numbers instead of page numbers. See further details here.