Spatial and Temporal Variations of Precipitation Extremes and Seasonality over China from 1961~2013


1
State Key Laboratory of Hydrology-Water Resources and Hydraulic Engineering, Hohai University, Nanjing 210098, China
2
Bureau of Hydrology, Yellow River Conservancy Commission, Zhengzhou 450004, China
*
Author to whom correspondence should be addressed.
Water 2018, 10(6), 719; https://doi.org/10.3390/w10060719
Submission received: 31 March 2018
/
Revised: 18 May 2018
/
Accepted: 25 May 2018
/
Published: 1 June 2018
(This article belongs to the Special Issue Impact of Climate on Hydrological Extremes)
Abstract
:Using the 0.5° × 0.5° gridded Chinese ground precipitation dataset from 1961–2013, spatial and temporal variations in precipitation extremes, total precipitation, the seasonality of precipitation and their linkages in the context of climate change are investigated using the Mann-Kendall trend test, Pettitt change-point test and correlation analysis. The investigation focuses on four extreme indices, i.e., the annual maximum number of consecutive dry days (CDD), the annual maximum number of consecutive wet days (CWD), the annual total precipitation when daily precipitation is greater than 95th percentile (R95pTOT), and the maximum 1-day precipitation (RX1day). The results show that precipitation extremes increased in northwestern China, especially Xinjiang, Tibet and Qinghai (CWD, R95pTOT and RX1day), and scattered parts of southeastern China (R95pTOT and RX1day), but decreased over considerable parts of southwestern China (CWD) and some small parts of northern China (CWD, R95pTOT and RX1day); the spatial patterns of the trends in precipitation extremes and that of total precipitation exhibit considerable similarity over China, which indicates the close relationship between changes in precipitation extremes and total precipitation; change points are detected in different periods ranging from early 1970s to early 2000s for different regions and extreme precipitation indices, and the spatial patterns of the abrupt changes of extreme indices are similar to those of the trends in extreme indices; the concentration index (CI) is strongly positively correlated with R95pTOT and RX1day in most areas in northern China (from the northeast to the northwest) and southwestern China (including Sichuan, Chongqing Guizhou and Guangxi), which means for these regions, the temporal heterogeneity of daily precipitation over a year is dominated by heavy rainfall amounts. The seasonality index of precipitation (SI) is positively related to R95pTOT and RX1day over most areas above 30° N, indicating that heavy precipitation events have a better chance to occur in places with a strong seasonal variation in annual precipitation in these areas, but for most areas below 30° N, the positive relationship is not significant.
1. Introduction
According to the 5th IPCC assessment report, global warming has become an indisputable fact [1]. Katz et al. [2] stated that changes in extreme climate events are relatively more sensitive to the variability of climate than to its average over many regions in the context of significant global warming. Moreover, the impact of changes of extreme climate events on society, the economy and the environment is far greater than the impact of changes of average climate conditions. Therefore, considerable research efforts have focused on changes in extreme events, especially precipitation extremes, at global and regional scales. Karl et al. [3] observed a significant positive trend in the frequency of precipitation extremes over the last few decades in the USA. Suppiah and Hennessy [4] showed a significant increase in the 90th and 95th percentile of daily rainfall in Australia. Vincent et al. [5] found some increases in consecutive dry days but no change in consecutive wet days and a decrease in precipitation extremes (including R10, R20, RX1day and RX5day) for countries of the western Indian Ocean. Klein Tank & Können [6] analyzed trends in indices of climate extremes in Europe and confirmed that at stations where the annual amount increases, the extreme index has similar changes, but for stations with a decreasing annual amount, there is no such amplified response of the precipitation extremes. For China, Zhai et al. [7] found that there is a small trend in total precipitation for China as a whole, but there are distinctive regional and seasonal patterns of trends, and there is a great similarity between the spatial patterns of trends in extreme and total precipitation. Xiao et al. [8] found that the regionally averaged maximum summer hourly rainfall rate across a large part of China has increased by 11.2%, using continuous hourly gauge records for 1971–2013 from 721 weather stations in China. Liu et al. [9] analyzed the trends of extreme precipitation in eastern China and their possible causes, and demonstrated that global warming was the primary cause of the changes in precipitation extremes, although a number of recent studies suggested that aerosols have huge effects on precipitation extremes. Yang et al. [10] indicated a good agreement between precipitation extremes and total precipitation in China. Wu et al. [11] suggested that most extreme precipitation indices increased over northwestern and southeastern China but decreased over part of northern China. Ren et al. [12] found that the annual maximum 1-day to 5-day precipitation, the amount of heavy rainfall (with rainfall greater than 50 mm/day) and the number of days with heavy rainfall increased generally over China, especially in southern China. Zhou et al. [13] found that changes in precipitation extremes are spatially complex and exhibit a less widespread spatial coverage than the changes in temperature indices, and the patterns of annual total precipitation amount, average daily precipitation rate, and the proportion of heavy precipitation in total annual precipitation are similar with negative trends in a southwest–northeast belt from southwestern China to northeastern China while positive trends occur in eastern China and northwestern China.
In addition to the trend changes, the climatic elements also exhibit abrupt changes. It is now widely accepted that a climatic regime shift transpired in the North Pacific Ocean in the winter of 1976–1977 [14,15]. Trenberth et al. [16] found that there were increases in temperatures and sea surface temperatures along the western coast of North America and Alaska, as well as changes in coastal rainfall and streamflow. In China, Wang et al. [17] found an abrupt decrease in the flood-season precipitation around the year of 1979 based on weather stations in the Haihe River Basin. Zhao et al. [18] confirmed an abrupt decrease in precipitation during the late 1970s and middle 1980s was also observed in the upper Yellow River Basin.
Climate change manifests itself not only in the total precipitation or precipitation extremes, but also in the characteristics of precipitation distribution throughout the year. Pryor et al. [19] investigated the seasonality of precipitation over USA by analyzing changes in the calendar date on which a certain percentile of annual total precipitation was achieved. Zhai et al. [7] showed that trends in precipitation extremes differ from one season to another in eastern China. Spring precipitation has increased in southern Northeast China and northern China but decreased significantly in the mid-reach of the Yangzte River; the summer precipitation has significantly decreased over southern Northeast China, northern China, and over the Sichuan Basin; autumn precipitation has generally decreased throughout eastern China; in winter, precipitation has significantly decreased over the northern part of eastern China but increased in the south. He et al. [20] found that for northeastern China, precipitation in spring and winter showed an increasing trend, but the summer precipitation showed a decreasing trend. Ren et al. [12] found that precipitation increased more or less in winter and summer in most areas of China but decreased significantly in autumn in most areas of central and eastern China. Yao et al. [21] concluded that overall, precipitation in China significantly increased in winter but decreased in other seasons. Pei et al. [22] found that both frequency and intensity of the extreme daily precipitation in the Middle and Lower reaches of the Yangtze River exhibited overall increasing trends from 1961 to 2012, and the increase could be associated with a weakened East Asian summer monsoon in past decades. The relationship between the spatial-temporal variations of precipitation extremes and the seasonality of precipitation over China is an issue worth further investigation.
The objective of this study is to analyze the changes in both total and extreme precipitation at annual and seasonal scales. In addition, the linkage between the spatial-temporal variations of precipitation extremes and total precipitation together with the characteristics of precipitation heterogeneity over China are also investigated in the context of climate change. The paper is organized as follows. The dataset and analysis methods are described in Section 2. The spatial-temporal characteristics of total and precipitation extremes at annual and seasonal scales are presented in Section 3 and Section 4, respectively. Analysis of the heterogeneity of precipitation through the year is reported in Section 5. The linkage between precipitation extremes and total precipitation as well as with the seasonality of precipitation is investigated in Section 6, followed by conclusions in Section 7.
2. Data and Methods
2.1. Data
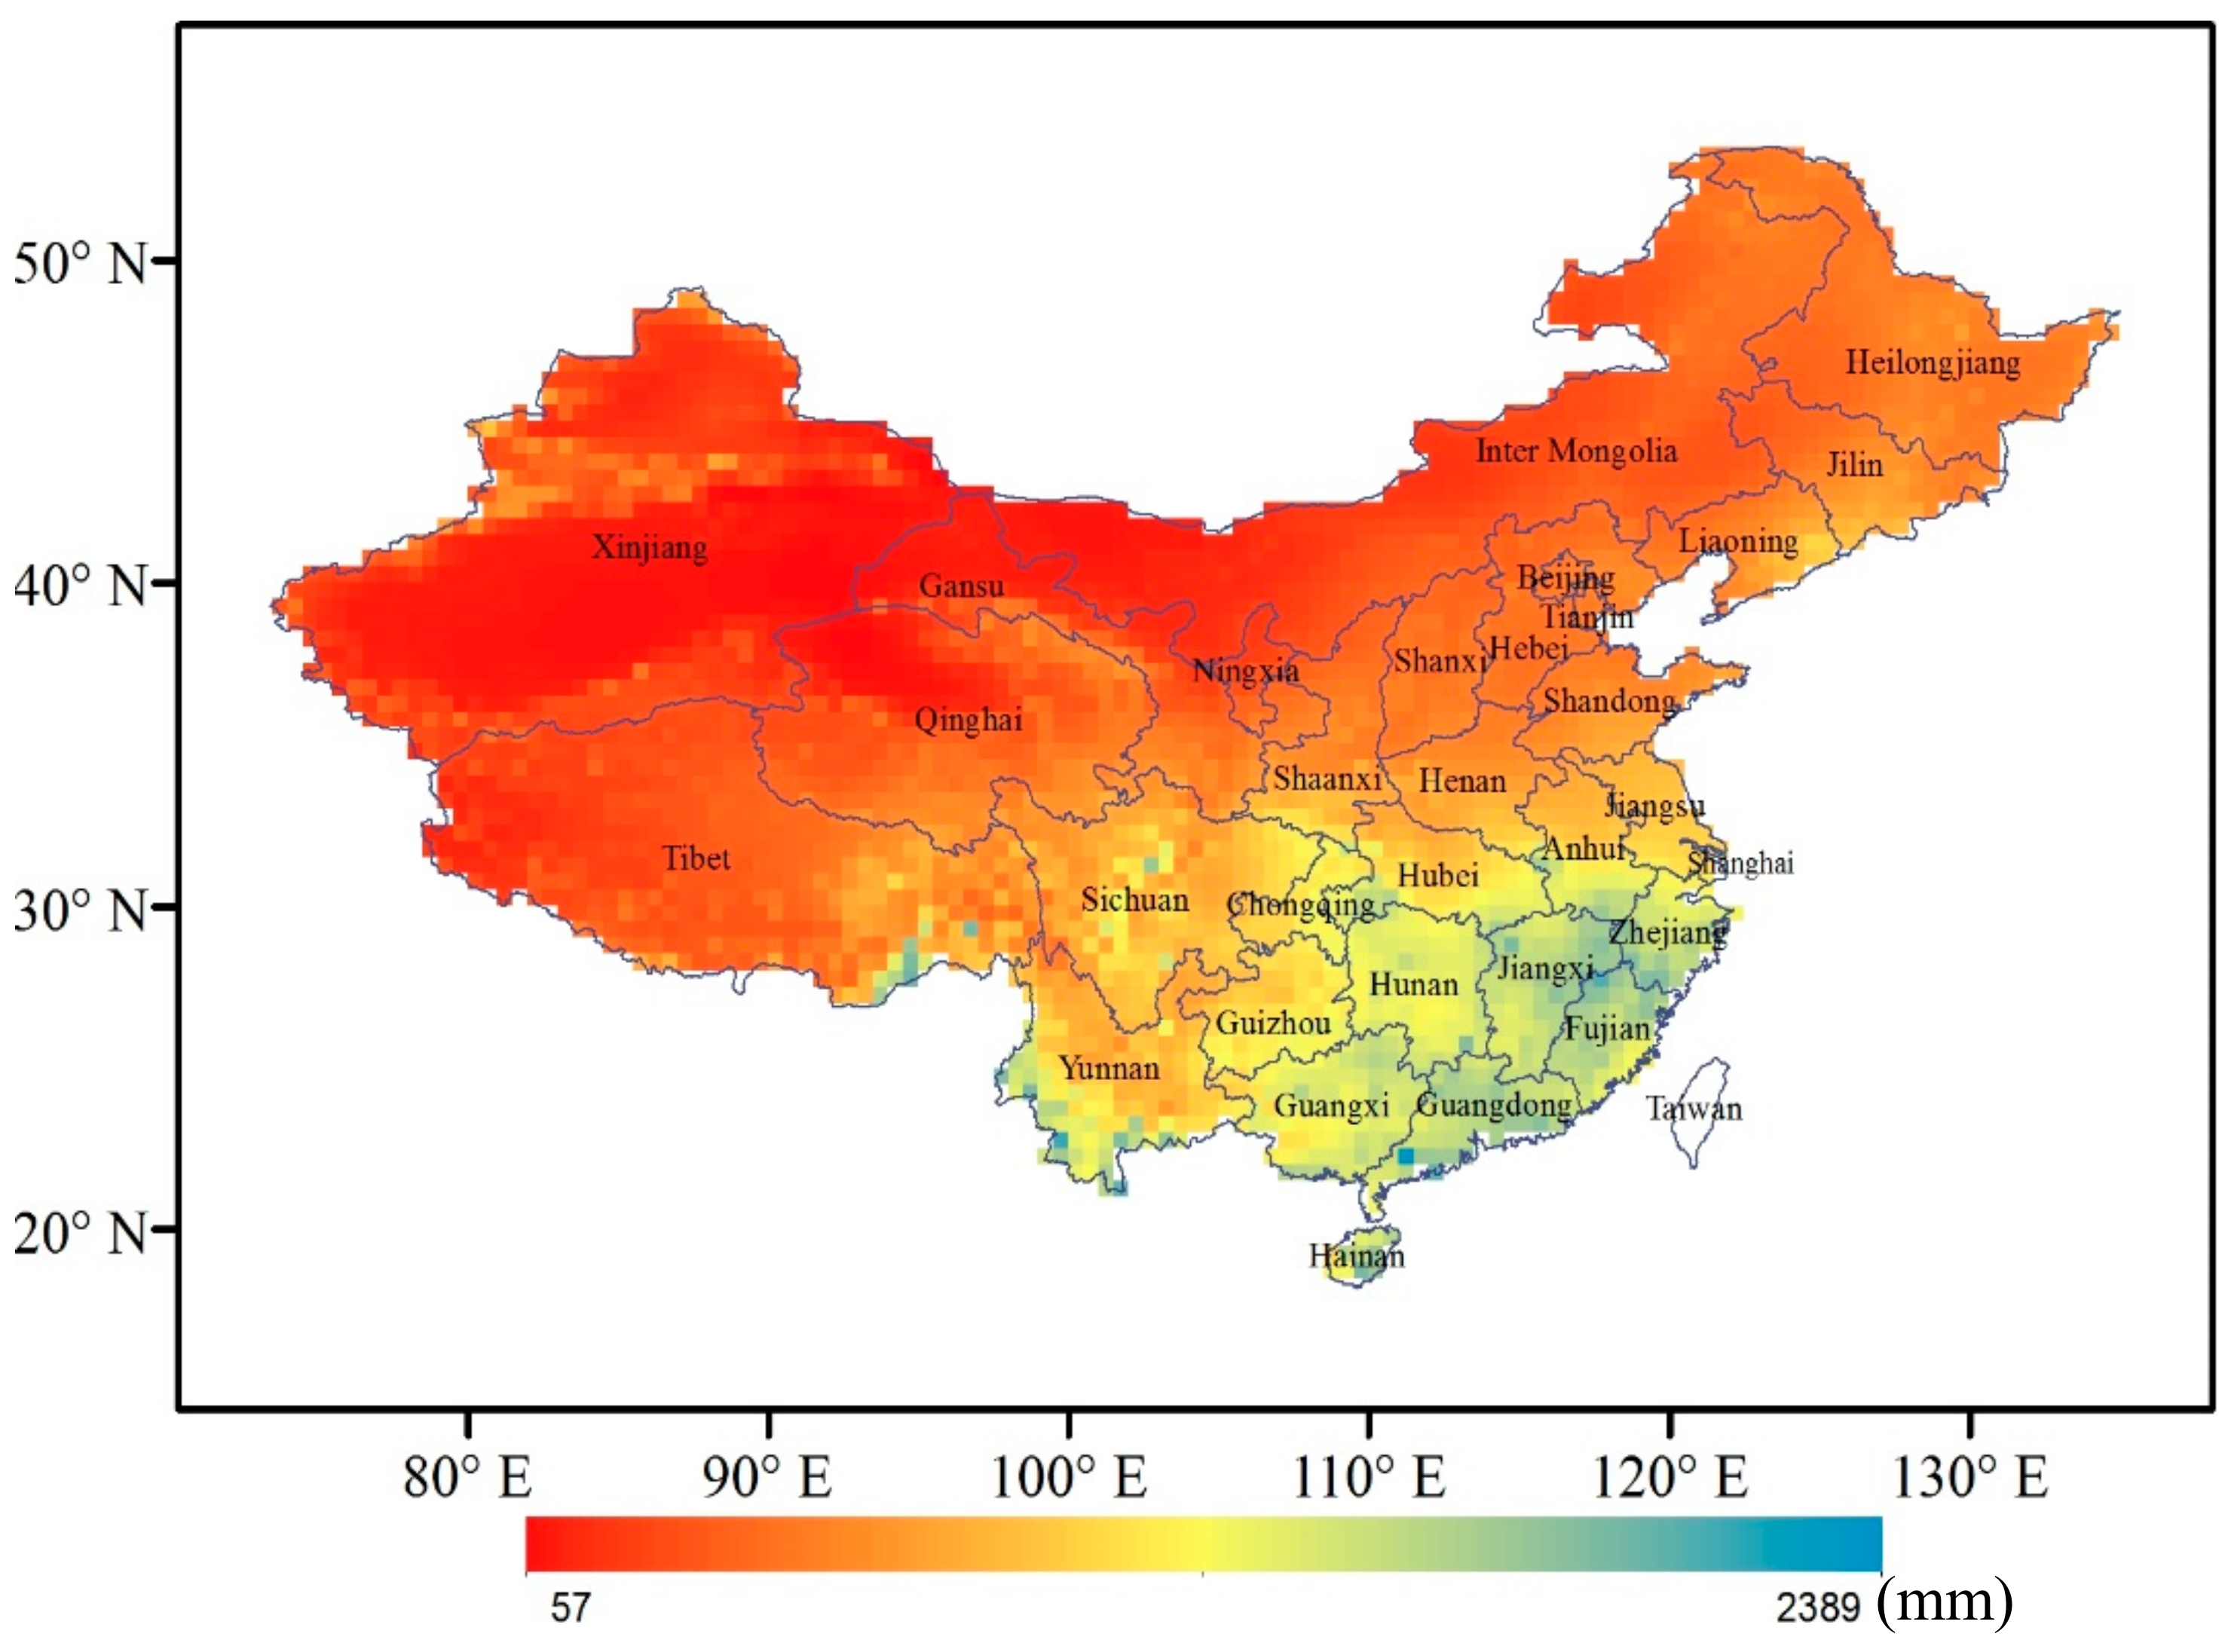
Daily grid-based precipitation data from 1961–2013 over China with a resolution of 0.5° × 0.5°, released by China Meteorological Administration (CMA) [23], are used in the present study. The data are produced based on the interpolation of quality controlled daily precipitation data observed at 2472 gauges over China mainland, with the thin plate smooth spline method. The precipitation data released by CMA cover the period from 1961 to 2017, but the time frame adopt in this study is the period 1961–2013 because daily precipitation data in more than 30 days (between February 25 and March 31) in 2014 are missing. The average annual precipitation from 1961–2013 over mainland China is shown in Figure 1.
2.2. Methodology
2.2.1. Precipitation Indices
The precipitation indices used in the study include two types, namely, the extreme precipitation indices that measure the extreme precipitation events, and the precipitation seasonal heterogeneity indices that measure the seasonality of precipitation through the year.
Extreme Precipitation Indices
The Expert Team on Climate Change Detection, Monitoring and Indices (ETCCDMI) recommends 27 core indices for representing the extreme aspects of climate, among which 11 are related to precipitation [24]. To save space, 4 precipitation extreme indices defined by ETCCDMI are used in the present study, listed in Table 1. CDD and CWD can measure extreme dry and wet conditions, respectively. RX1day measures the heaviest precipitation of a year, and R95pTOT measures the amount of total annual heavy precipitation. The selected indices are calculated on an annual basis. The annual maximum number of consecutive dry days (CDD) is not calculated according to the calendar year as defined by ETCCDMI because the dry season always spans two years in the context of the monsoon climate in China. Instead, we calculate CDD for each year starting from 1 July and ending on 30 June of the following in this study.
Precipitation Heterogeneity Indexes
The indices used to identify precipitation heterogeneity include the concentration index (CI), seasonality index of precipitation (SI), the start day-of-year of rainy season (RS) and the end day-of-year of rainy season (RE).
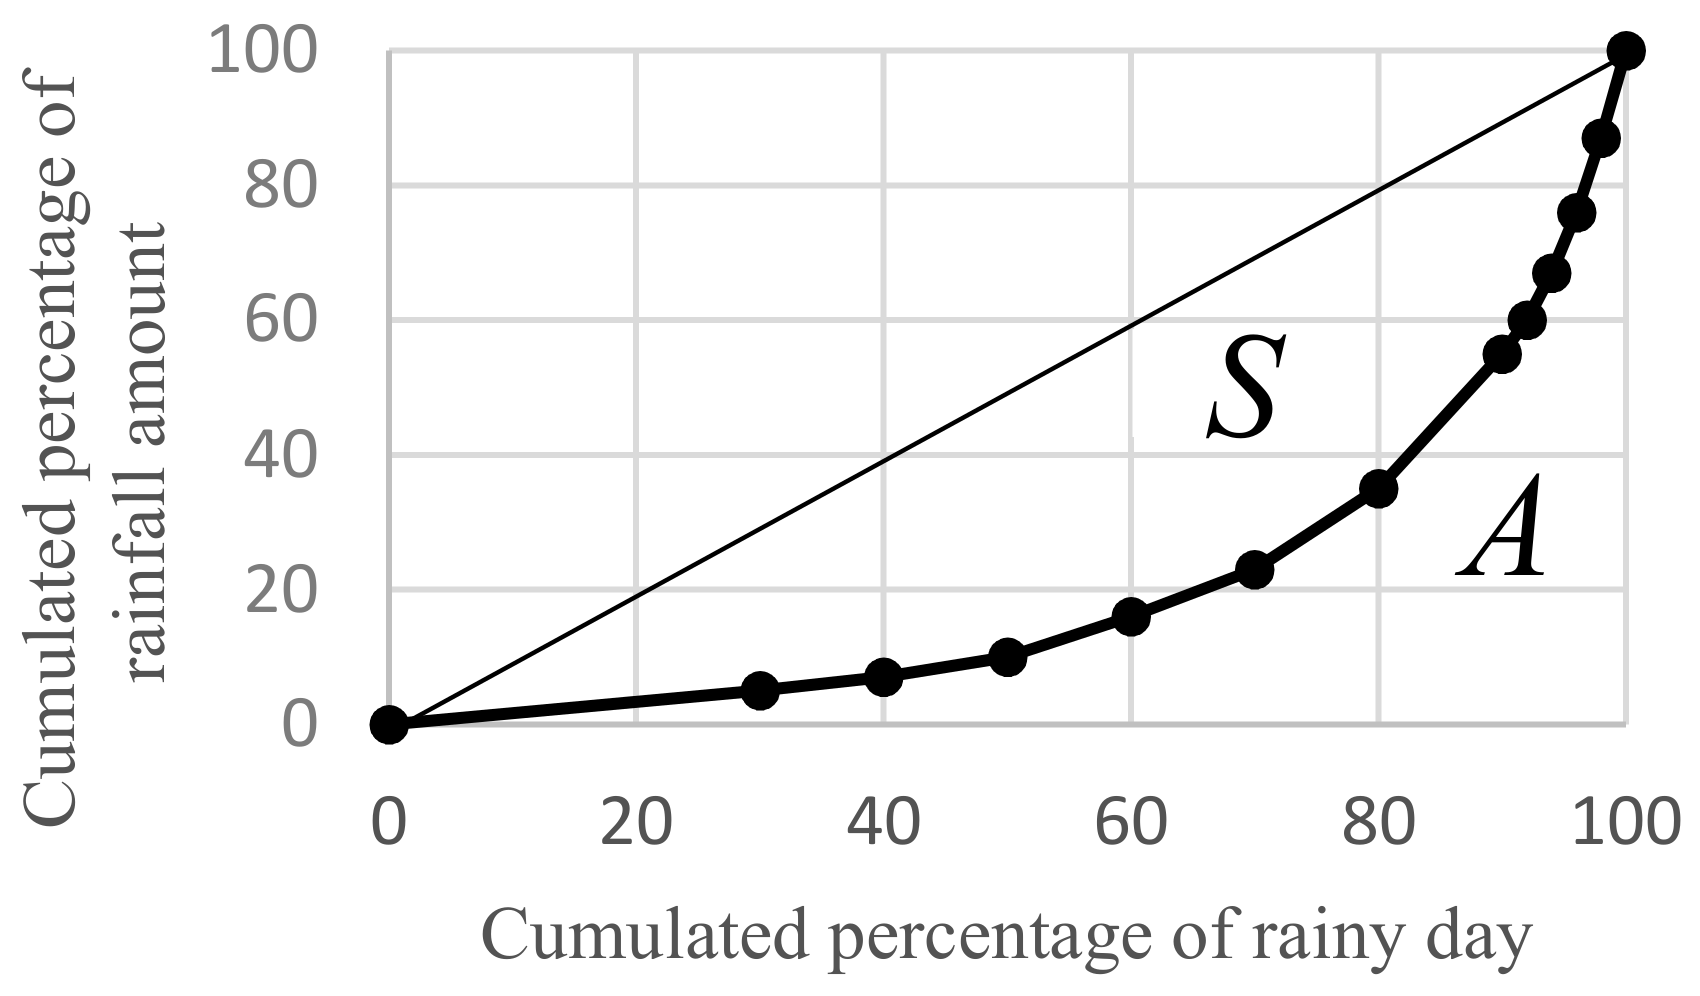
The definition of precipitation concentration index (CI) was first proposed by Martin Vide to evaluate the varying weight of daily precipitation, i.e., the contribution of the precipitation on the rainiest days to the total amount [25]. The specific steps are as follows: First, rainy days of the year are recorded with amounts and then the amount of daily precipitation at n intervals of 1 mm is classified. The second step is listing the number of recorded precipitation days in each class or absolute frequency labelled Ni (i = 1, … n). The third step is calculating the cumulative frequencies, obtained by adding the absolute frequencies of all the classes up to the one under consideration, labelled ΣNi. The fourth step is obtaining the amount of precipitation in each class, labelled Pi. The fifth step is calculating the cumulative amount of precipitation, labelled ΣPi. Finally, the percentages of ΣNi and ΣPi to the total number of rainy days and total amount of precipitation are calculated, labelled X and Y. If the cumulative percentage of rainy days X is plotted against the cumulative percentage of rainfall amounts Y, the following exponential curve expressing X versus Y is obtained:
Equation (1) is the so-called concentration curve or Lorenz curve, as shown in Figure 2.
The area A (shown in Figure 2) enclosed by the quadrant and the Lorenz curve by Equation (1) is obtained by integrals as follows:
Then, the concentration index of precipitation (CI) is given by:
CI ranges from 0–1. CI = 0 means the complete uniformity of precipitation. On the contrary, CI = 1 means the complete concentration of all rainfall on a single day.
The seasonality index of precipitation (SI) is designed to assess the degree of variability in monthly rainfall throughout the year [26]. It is defined as follows:
where is the annual total precipitation of year i, is the monthly total precipitation in the month j of the year i. In general, a small value of SI means a uniform monthly rainfall distribution thorough the year, whereas a large value of SI indicates a substantial degree of variability in monthly rainfall through the year.
The rainy season, or the monsoon season, is a relatively rainy period with heavy and persistent precipitation. There are three rainy seasons in China from spring to autumn, including the spring rainy season, summer rainy season and autumn rainy season [27]. There are many ways to define the start of the rainy season; Lau et al. [28] used 5 mm average pentad rainfall as the standard of rainy season. Zhang and Lin [29] classified the rainy season as the period in which the ten-day accumulated precipitation exceeded 3% of annual total precipitation. Samel [30] proposed a semi-objective analysis to determine the start and end of the rainy season. Wang et al. [27] standardized the pentad precipitation data and classified the rainy season as the period in which the standardized pentad rainfall consistently exceeded 0.5. Due to the heterogeneity of precipitation distribution in China, it is difficult to make a quantitative standard applicable to all places and different seasons. In the present study, we assume RS occurs after 1 March, and to avoid the false detection of the rainy season due to short wet episodes before the start of the rainy season, we define RS as the first day of a year that meets the following two criteria: (1) 10-day precipitation is greater than 3% of the annual total precipitation and (2) 30-day precipitation is greater than 9% of the annual total precipitation, i.e.,
where R is the annual total precipitation in the year, and are the respective 10-day and 30-day accumulated precipitation ending on the day j of the year, and are the respective 10-day and 30-day accumulated precipitation ending on the day j − 1 of the year.
The end day-of-year of the rainy season RE is the last day k of a year that meets the two criteria, i.e., the 10-day precipitation exceeds 3% of the annual total precipitation and 30-day precipitation exceeds 9% of annual total precipitation before day k, given by:
where and are the respective 10-day and 30-day accumulated precipitation ending on the day k of the year, and and are the respective 10-day and 30-day accumulated precipitation ending on the day k + 1 of the year.
2.2.2. Methods for Detecting Changes
Trend Test
The Mann-Kendall trend test, referred to as MK test hereafter, is a rank-based nonparametric method [31,32] which is less sensitive to outliers than other parametric statistics. The MK method can test trends in a time series without specifying whether the trend is linear or nonlinear. We identify the type of temporal changes according to Kendall’s τ, which measures the strength of the monotonic trend, jointly with the p-value, which measures the level of significance, shown in Table 2.
Change-Point Test
A test of abrupt changes in a time series is viewed as complementary to the analysis of gradual trends [33]. The non-parametric Pettitt test is used to examine whether a change-point exists and to locate the change point with no assumptions made about the distribution of the variable [34]; this has been widely applied to examine the occurrence of abrupt change in climatic records.
Let n be the length of the time series and t be the time of the change point. A time series of n years of annual extreme precipitation indices can be divided by the time t into two sample groups, and . Define the test statistic index as
in which for , for and for .
To determine whether the change point is statistically significant, the test statistic is defined as
Equations (7)–(10) yield the change point with an estimated probability of p. If the value of p is less than 0.05, then the change point is statistically significant at the 0.05 significance level.
3. Spatial-Temporal Characteristics of Precipitation Extremes
3.1. Trends in Extreme Precipitation Indices
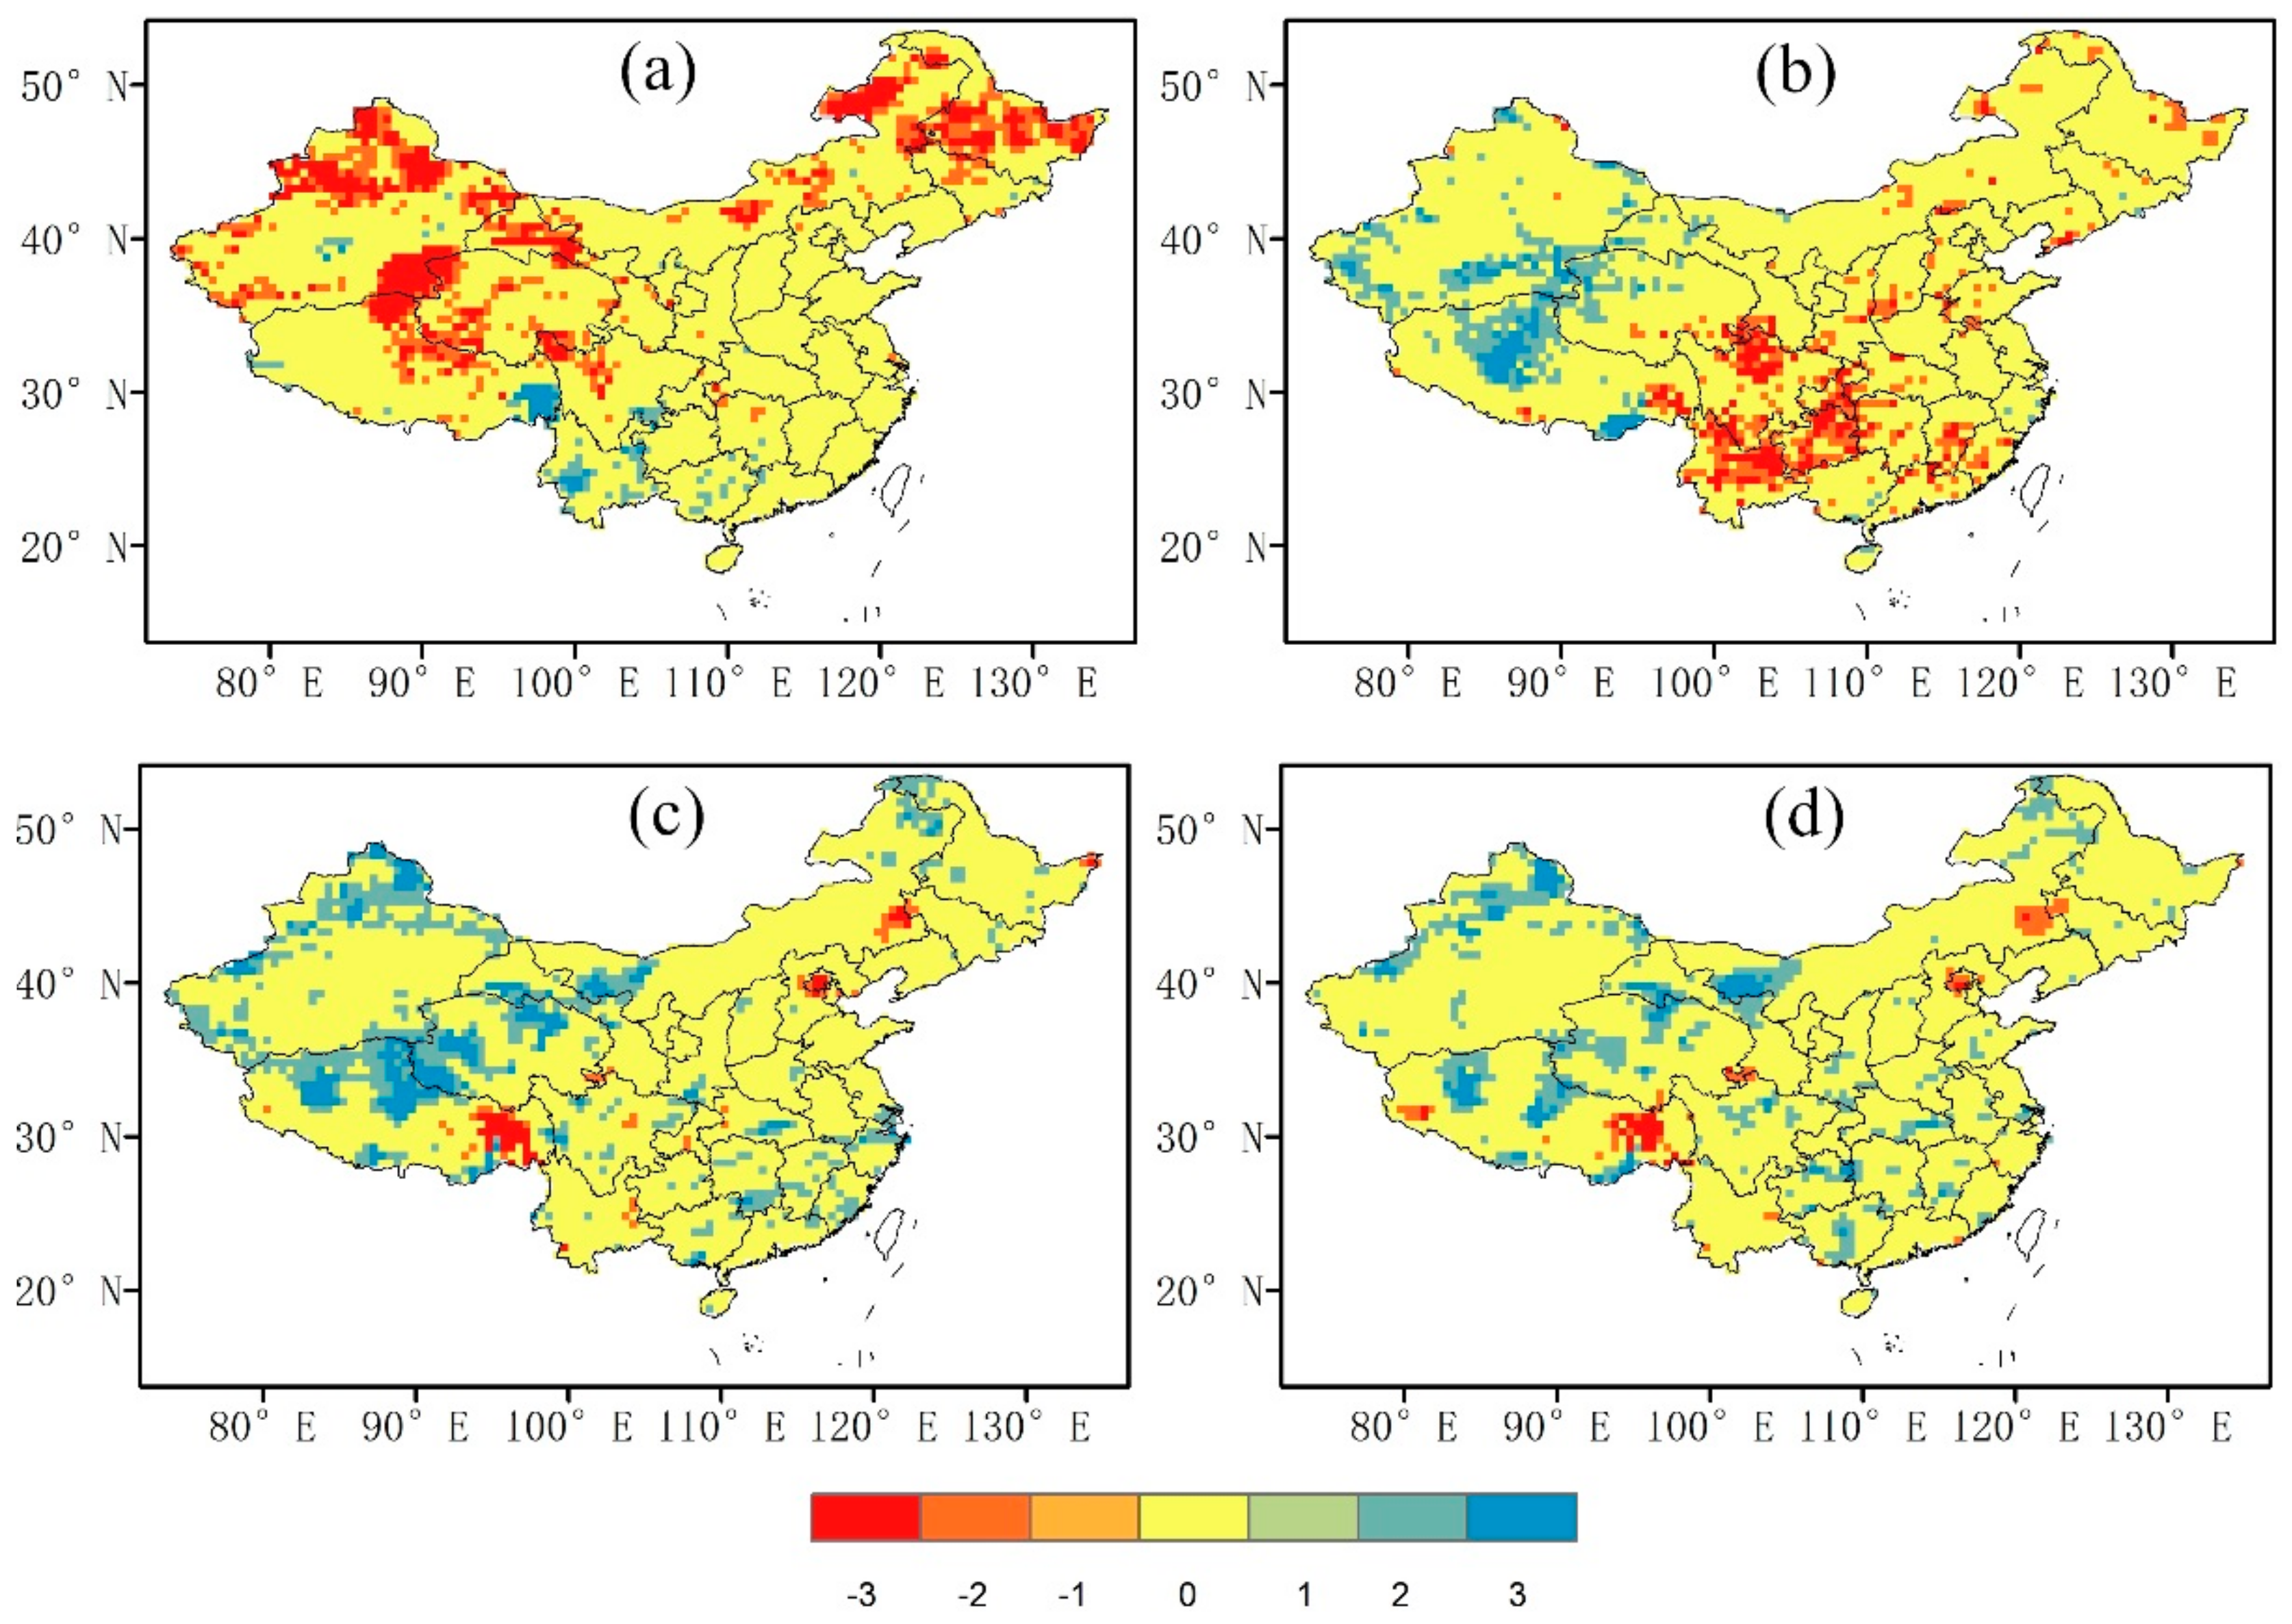
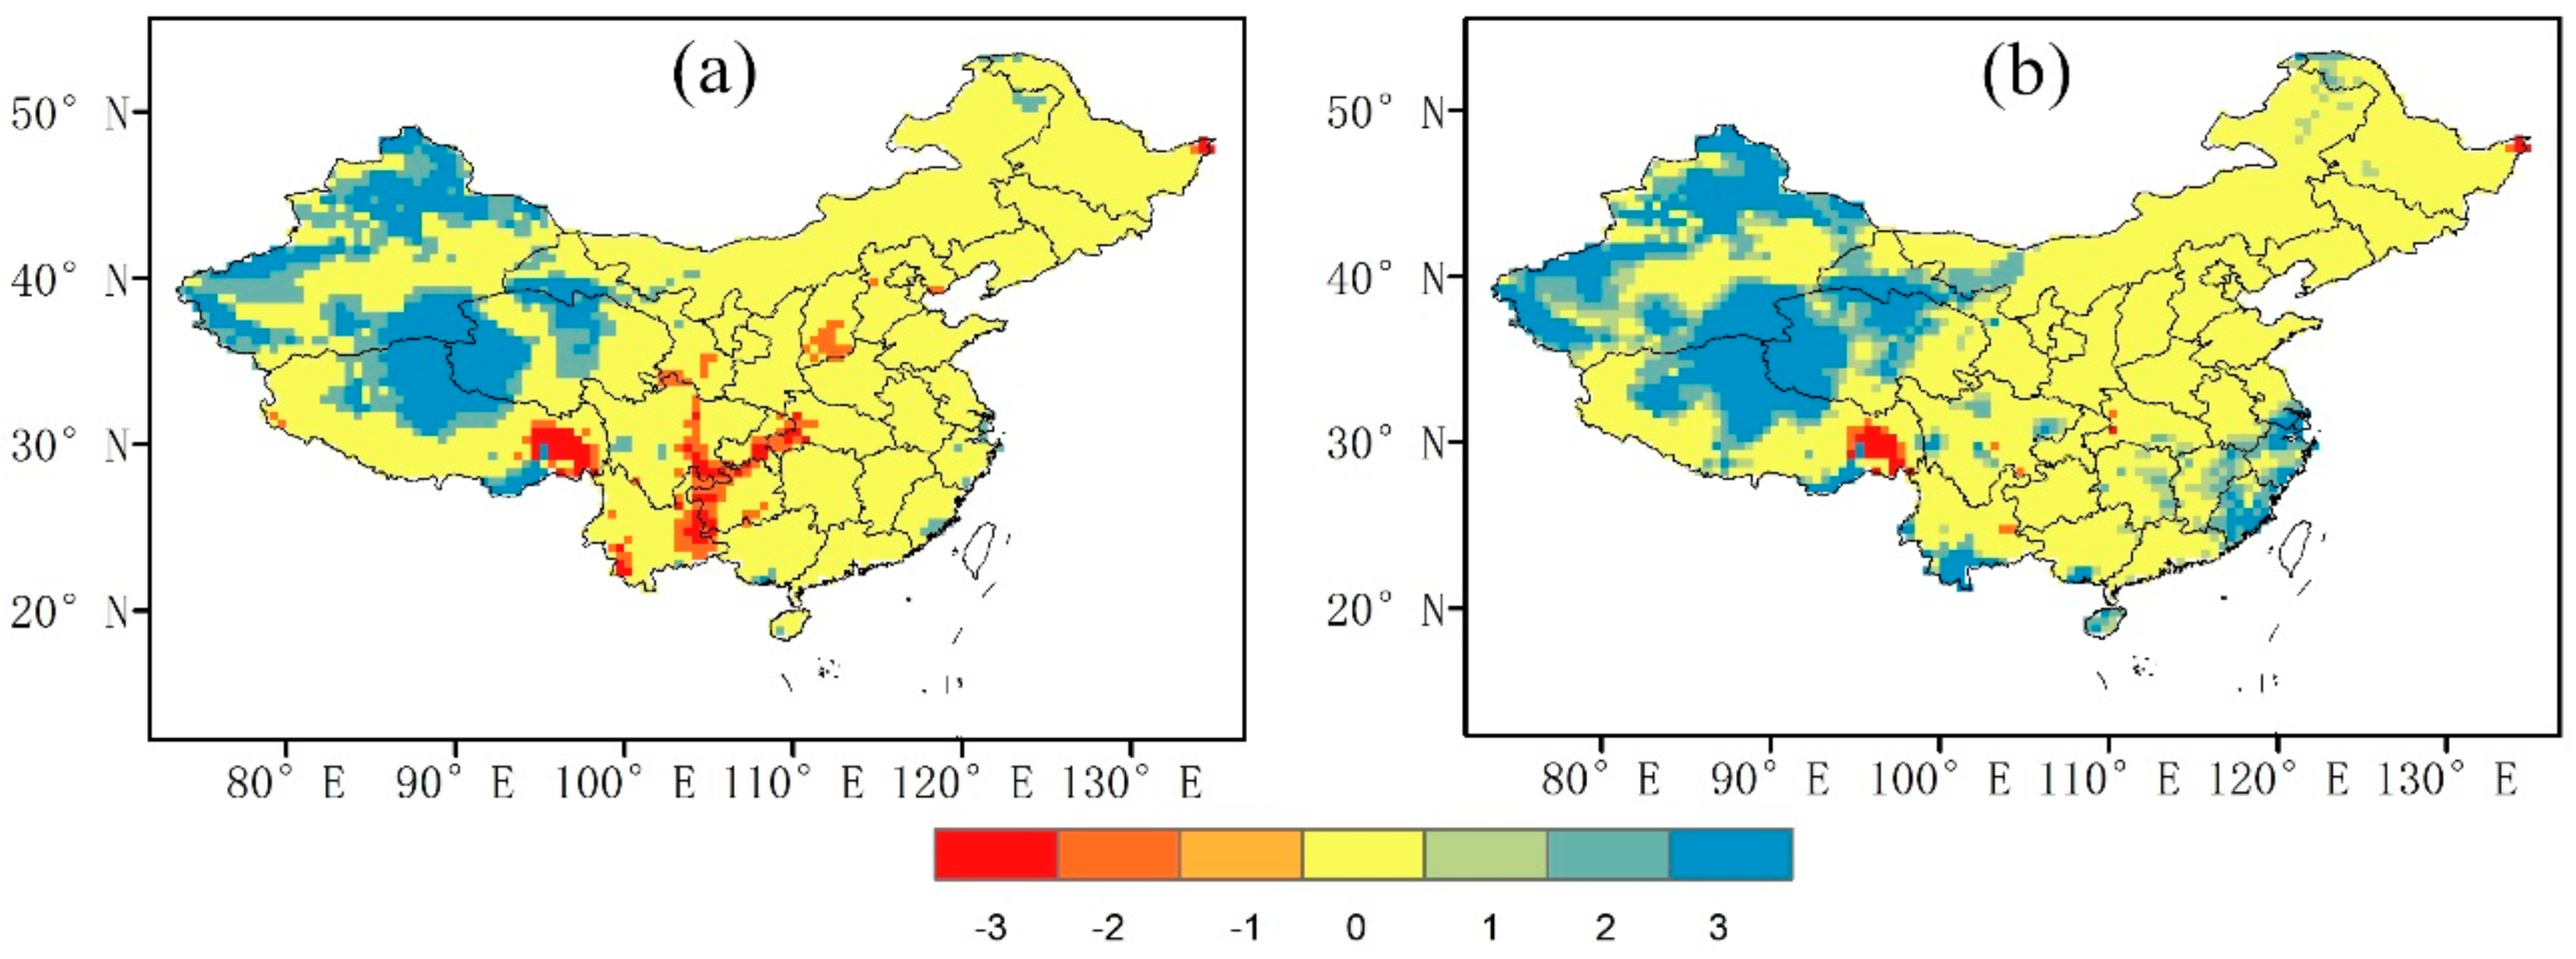
The spatial distribution of trends for extreme precipitation indices series by the MK trend test is shown in Figure 3. Figure 3a shows that CDD displayed a significant negative trend over most parts of northwestern China (including northern Xinjiang, southern Xinjiang, northern Tibet and western Qinghai), most parts of Heilongjiang and eastern Inner Mongolia. Significant positive trends were observed over many parts of Yunnan, Jiangxi and Guangxi together with a part of southeastern Tibet. The trend of CWD shown in Figure 3b was generally opposite to that of CDD. Significant increases in CWD were observed over most parts of northwestern China, especially northern Xinjiang, southern Xinjiang, northern Tibet and western Qinghai. At the same time, significant negative trends in CWD were observed mainly for a considerable part of southwestern China (including Sichuan, Chongqing, Yunnan and Guizhou). The observed changes in CDD and CWD are generally consistent with the changes of 12-month SPI over China [35], which indicates that northwestern China (especially northern Tibet Plateau and northern Xinjiang) is getting wetter while Yunnan-Guizhou Plateau is getting drier.
R95pTOT and RX1day have very similar spatial patterns of trends. They increased significantly in northern Xinjiang, northern Tibet, Qinghai and western Inn Mongolia, together with scattered parts of southeastern China. They decreased only in a part of southeastern Tibet and small parts of northern China (including Beijing and eastern corner of Inner Mongolia).
The above analyses show that extreme precipitation indices mainly increased in northwestern China, especially Xinjiang, Tibet and Qinghai (CWD, R95pTOT and RX1day), and parts of southeastern China (R95pTOT and RX1day), but decreased over considerable parts of southwestern China (CWD) and some small parts of northern China (CWD, R95pTOT and RX1day). While our results confirm the earlier findings that heavy precipitation increased in northwestern China (e.g., [11,13]) the significant decreasing trends of R95pTOT and RX1day over northern China observed by Wu et al. [11] is not found in this study probably due to the difference in the data used. Using a daily precipitation dataset of 740 stations for the period 1951–2000, Zhai et al. [7] found significant increases in extreme precipitation over western China, the mid–lower reaches of the Yangtze River, parts of the southwest and southeastern China coastal areas. However, in our study, with the new gridded dataset of a longer period, significant increases in heavy precipitation mostly occurred in northwestern China whereas areas exhibiting significant changes in the mid–lower reaches of the Yangtze River and southeastern China coastal regions were very small.
3.2. Abrupt Changes in Extreme Precipitation Indices
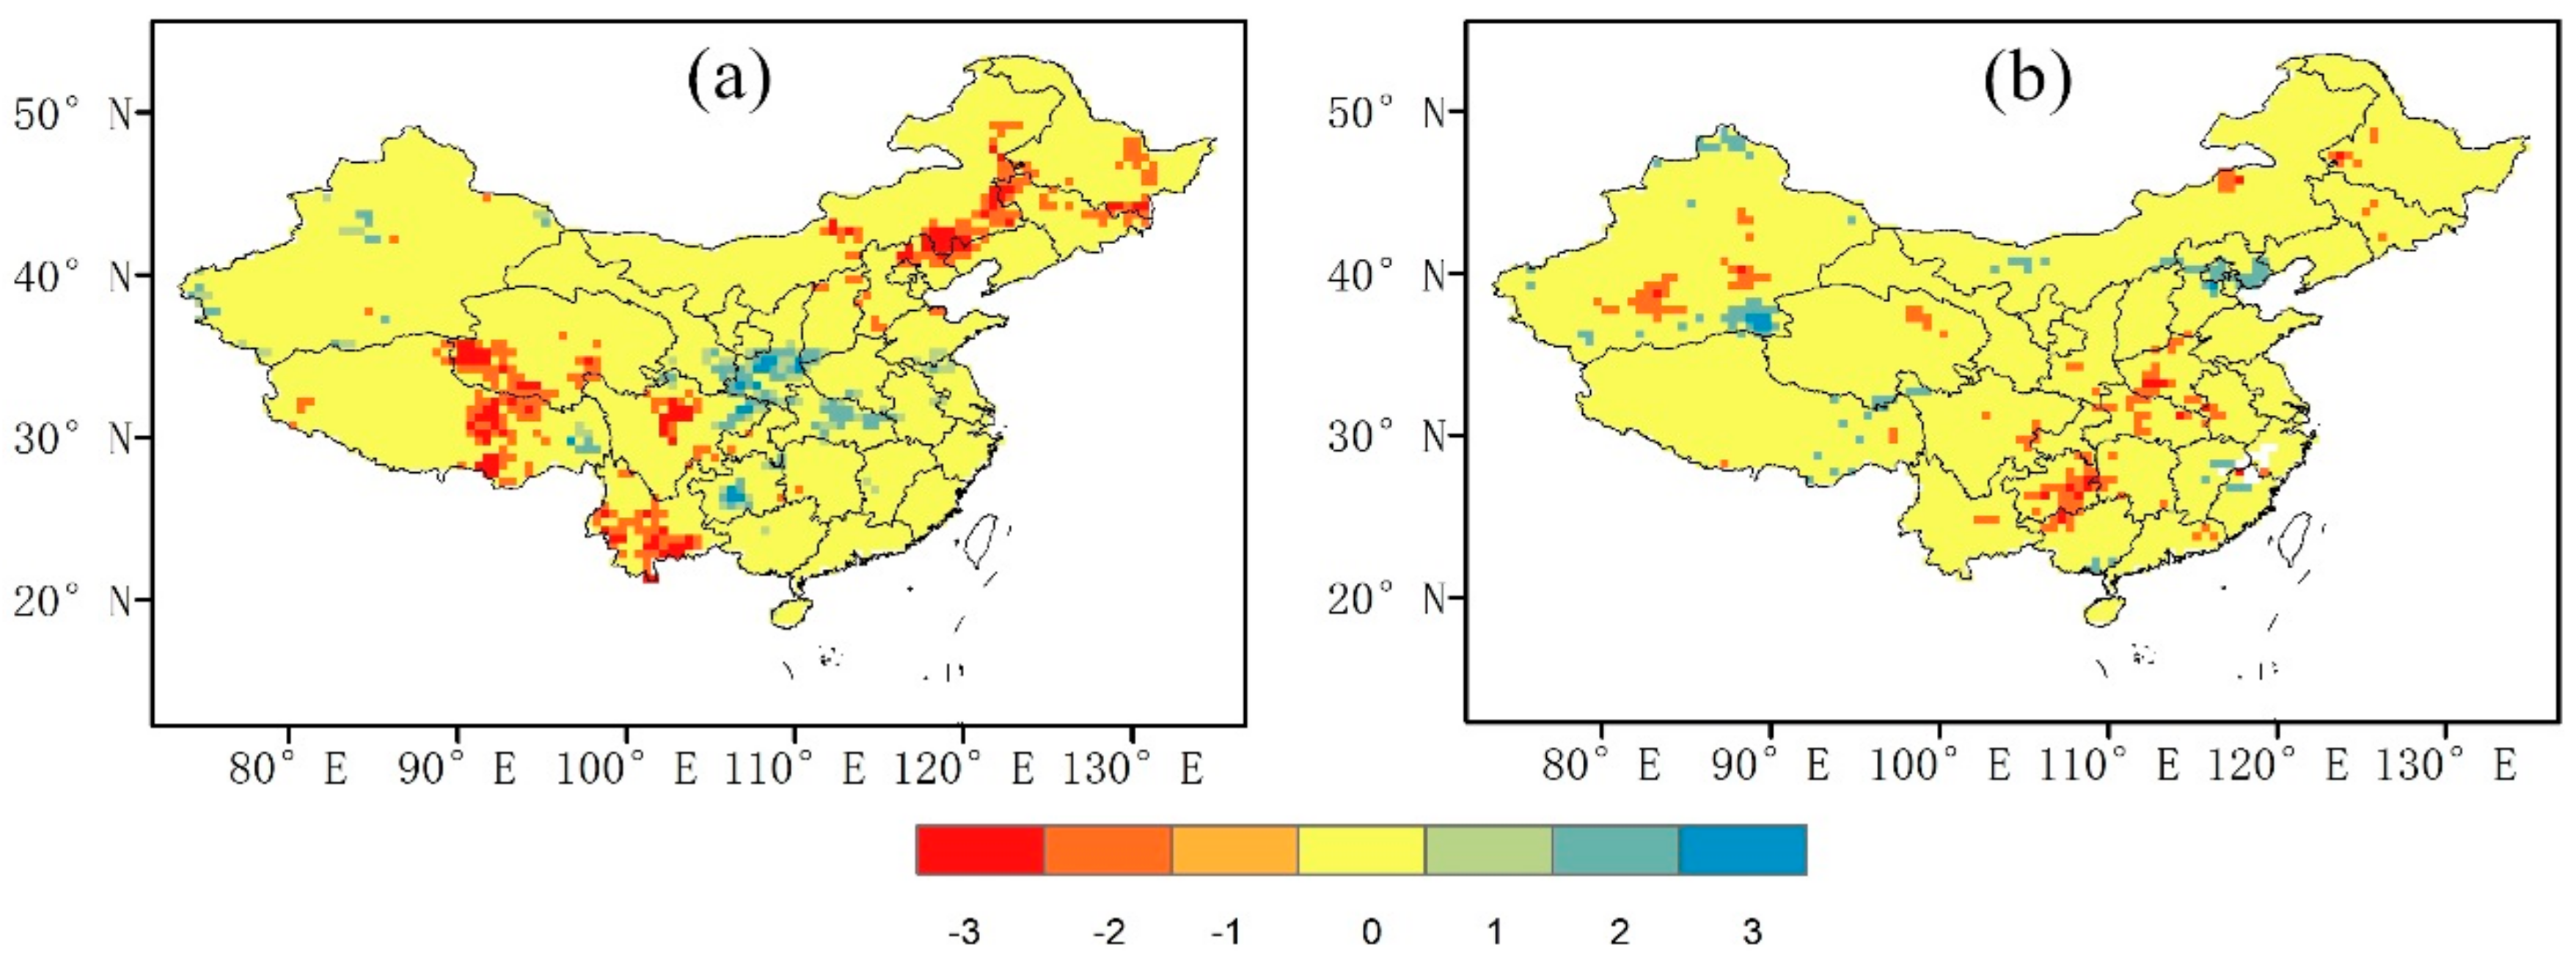
The spatial distribution of change points of CDD, CWD, R95pTOT and RX1day detected by the Pettitt test at the 0.05 significance level is shown in Figure 4. By visual inspection of Figure 3 and Figure 4 we know that the spatial patterns of places with change points for CDD, CWD, R95pTOT and RX1day are similar to those of places with significant trends, but overall there are much fewer places exhibiting significant abrupt changes than places exhibiting significant trends. The regions where abrupt changes presented in CDD at the 0.05 significance level (shown in Figure 4a) were mainly located in northwestern China and northeastern China. Abrupt changes occurred mostly in mid-1970s to mid-1980s in northern Xinjiang, southern Xinjiang, Tibet, Qinghai and Heilongjiang, whereas mainly in mid-1980s to late 1990s in northeastern Xinjiang and eastern Inner Mongolia. For CWD (Figure 4b), the regions that exhibited abrupt changes at the 0.05 significance level were scattered over southern Xinjiang (in approximately late 1980s to late 1990s), central and southeastern Tibet (approximately in late 1970s to middle 1980s), southern China (approximately in late 1980s to late 1990s). Tibet exhibited significant abrupt changes in R95pTOT during the late 1990s to early 2000s in its northern parts, and late 1970s over its eastern parts. In the north of Xinjiang, the abrupt change occurred in the early 1980s to late 1980s. In eastern Tibet, significant abrupt changes in RX1day also occurred during the late 1970s to early 1980s. Except for Tibet and some scattered spots, most regions of China did not exhibit significant abrupt changes in both R95pTOT and RX1day.
A further comparison of the characteristics of abrupt changes and trends demonstrates that the abrupt changes before and after the change points are in agreement with the type of gradual trends, that is, the drop of extreme precipitation indices after change points coincide with negative trends, and the increase of extreme precipitation indices after change points coincide with positive trends. That means the presence of abrupt changes may be due to the existence of strong trends, or significant abrupt changes lead to the detection of the existence of trends.
3.3. Trends in Extreme Precipitation Events over Seasons
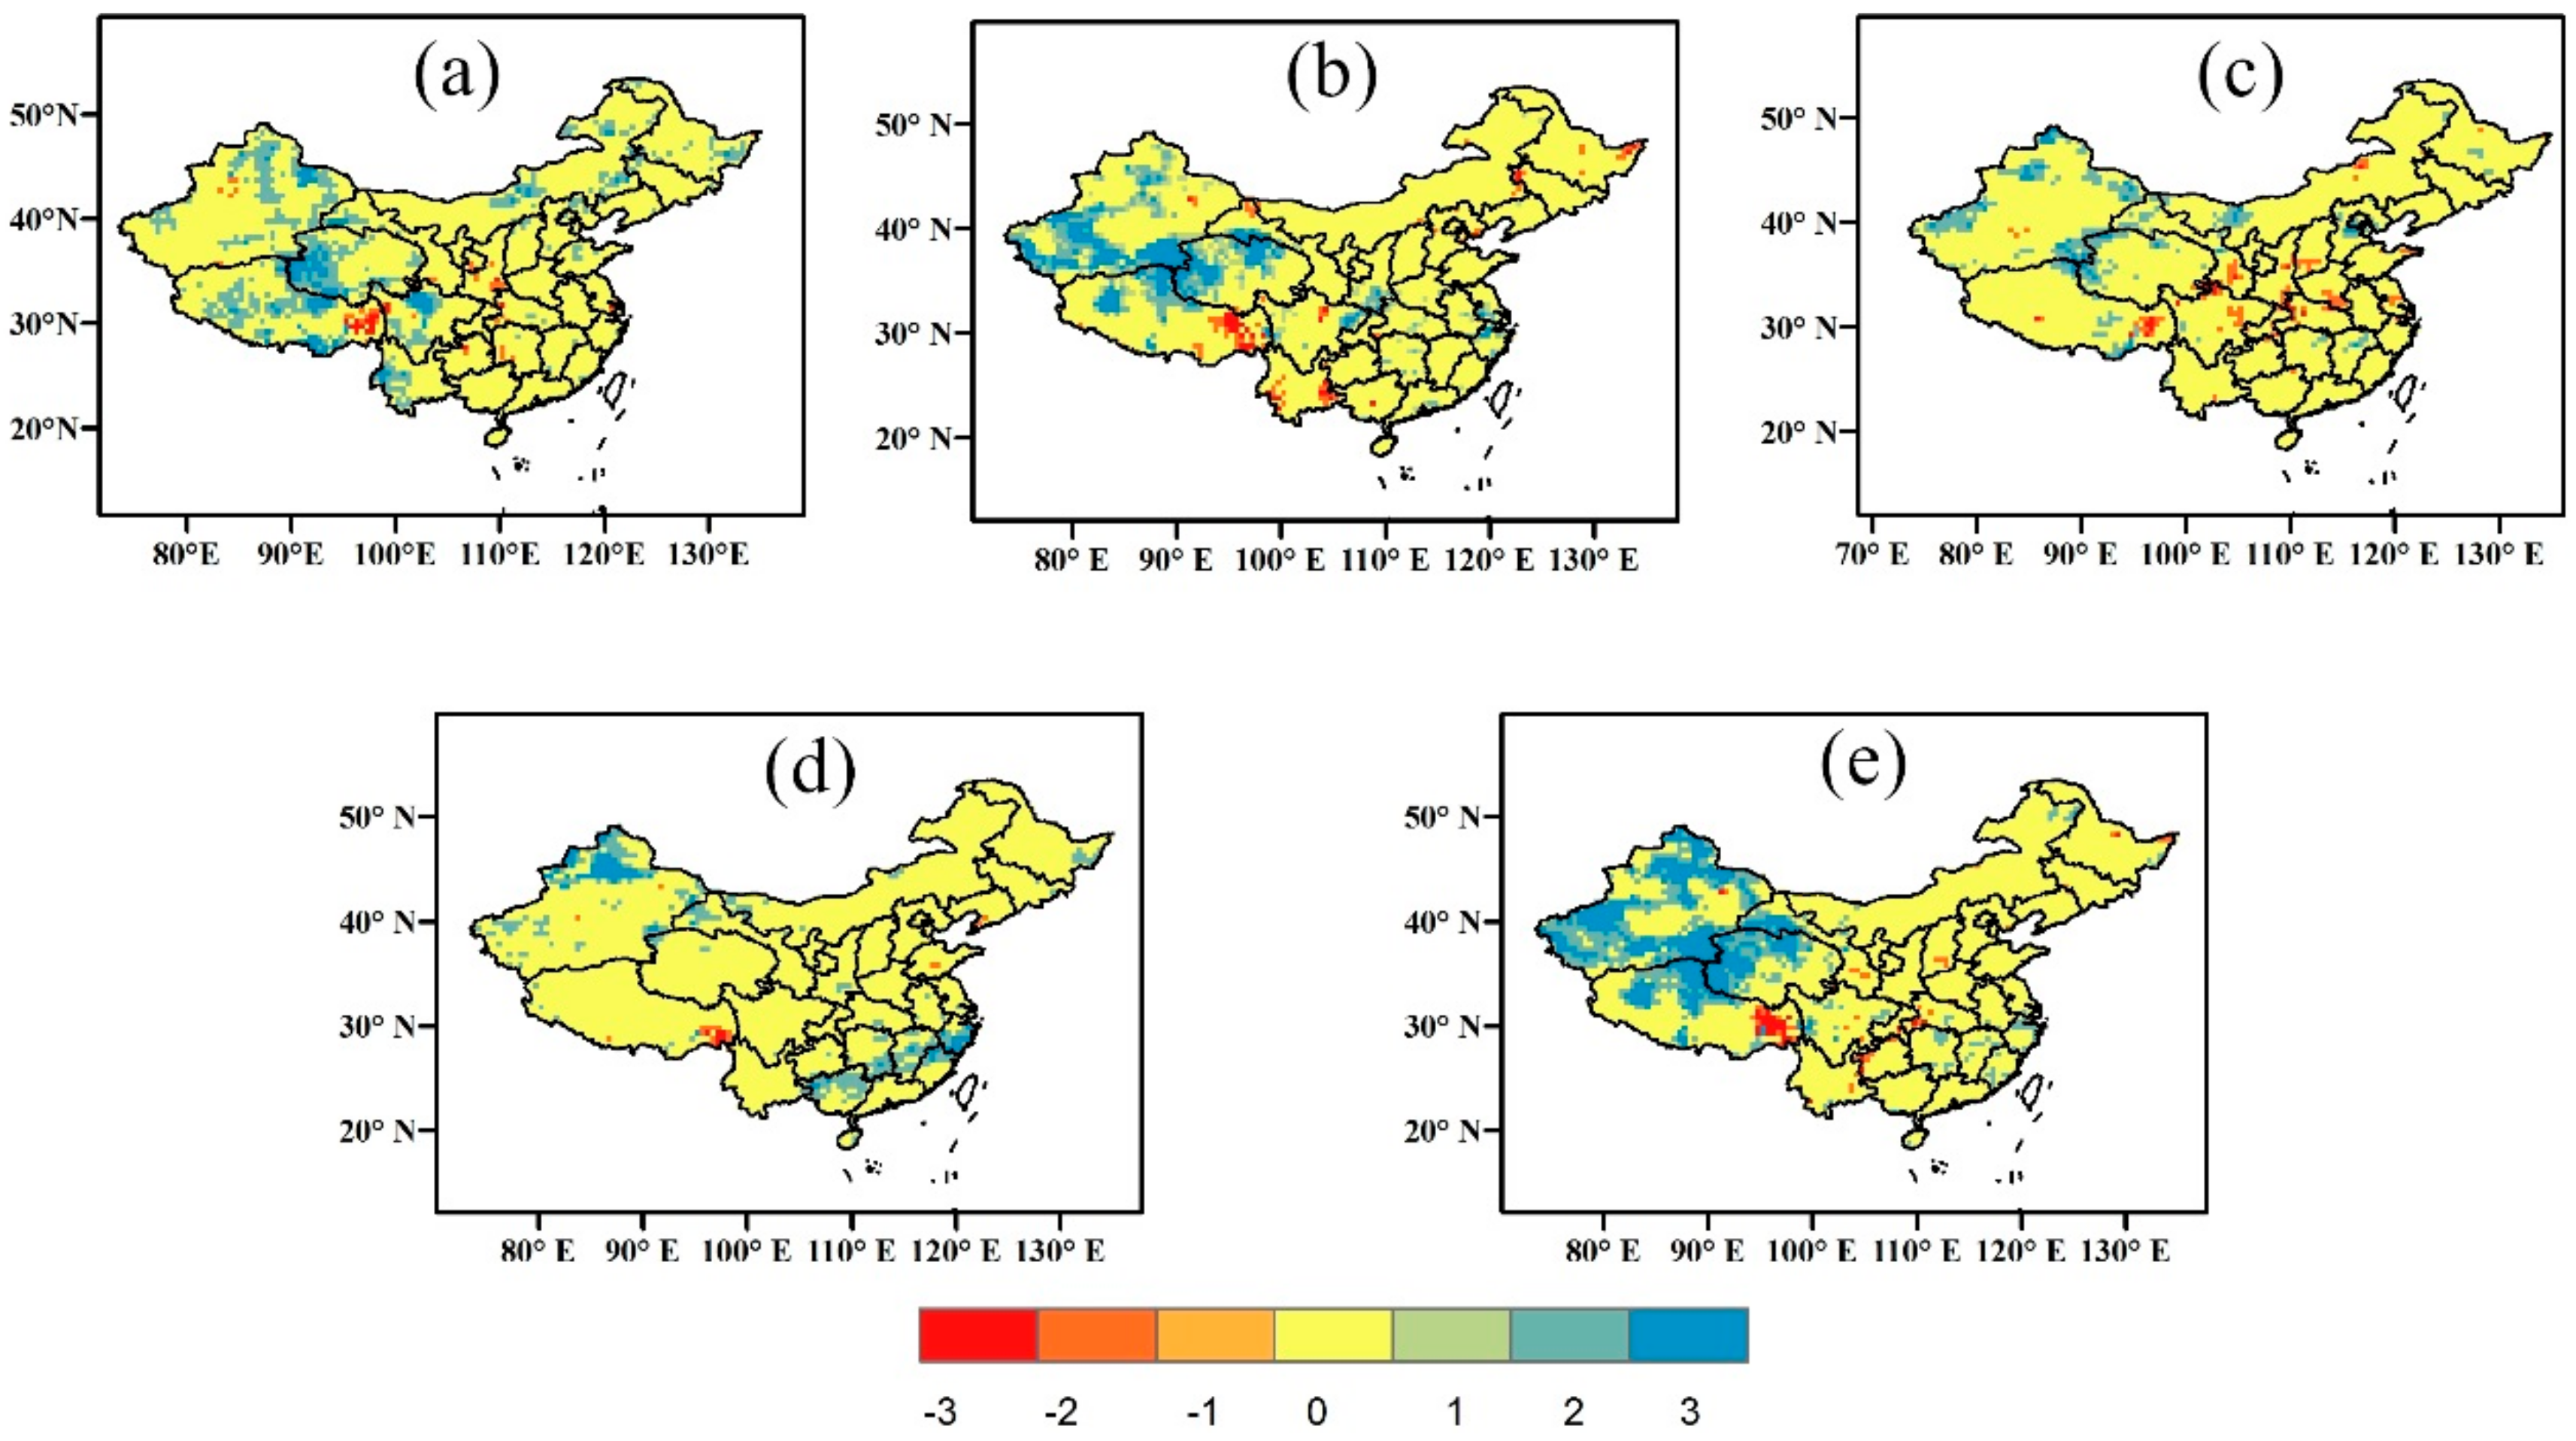
We define the 95th percentile of daily precipitation on all the rainy days (i.e., daily precipitation ≥ 0.1 mm) from 1986–2005 as the threshold for extreme precipitation days. The number of times that daily precipitation exceeds the threshold is considered as the frequency of extreme precipitation events for the whole year or a certain season. The trends in the frequencies of extreme precipitation events in annual and seasonal precipitation for the period 1961–2013 by MK test are shown in Figure 5.
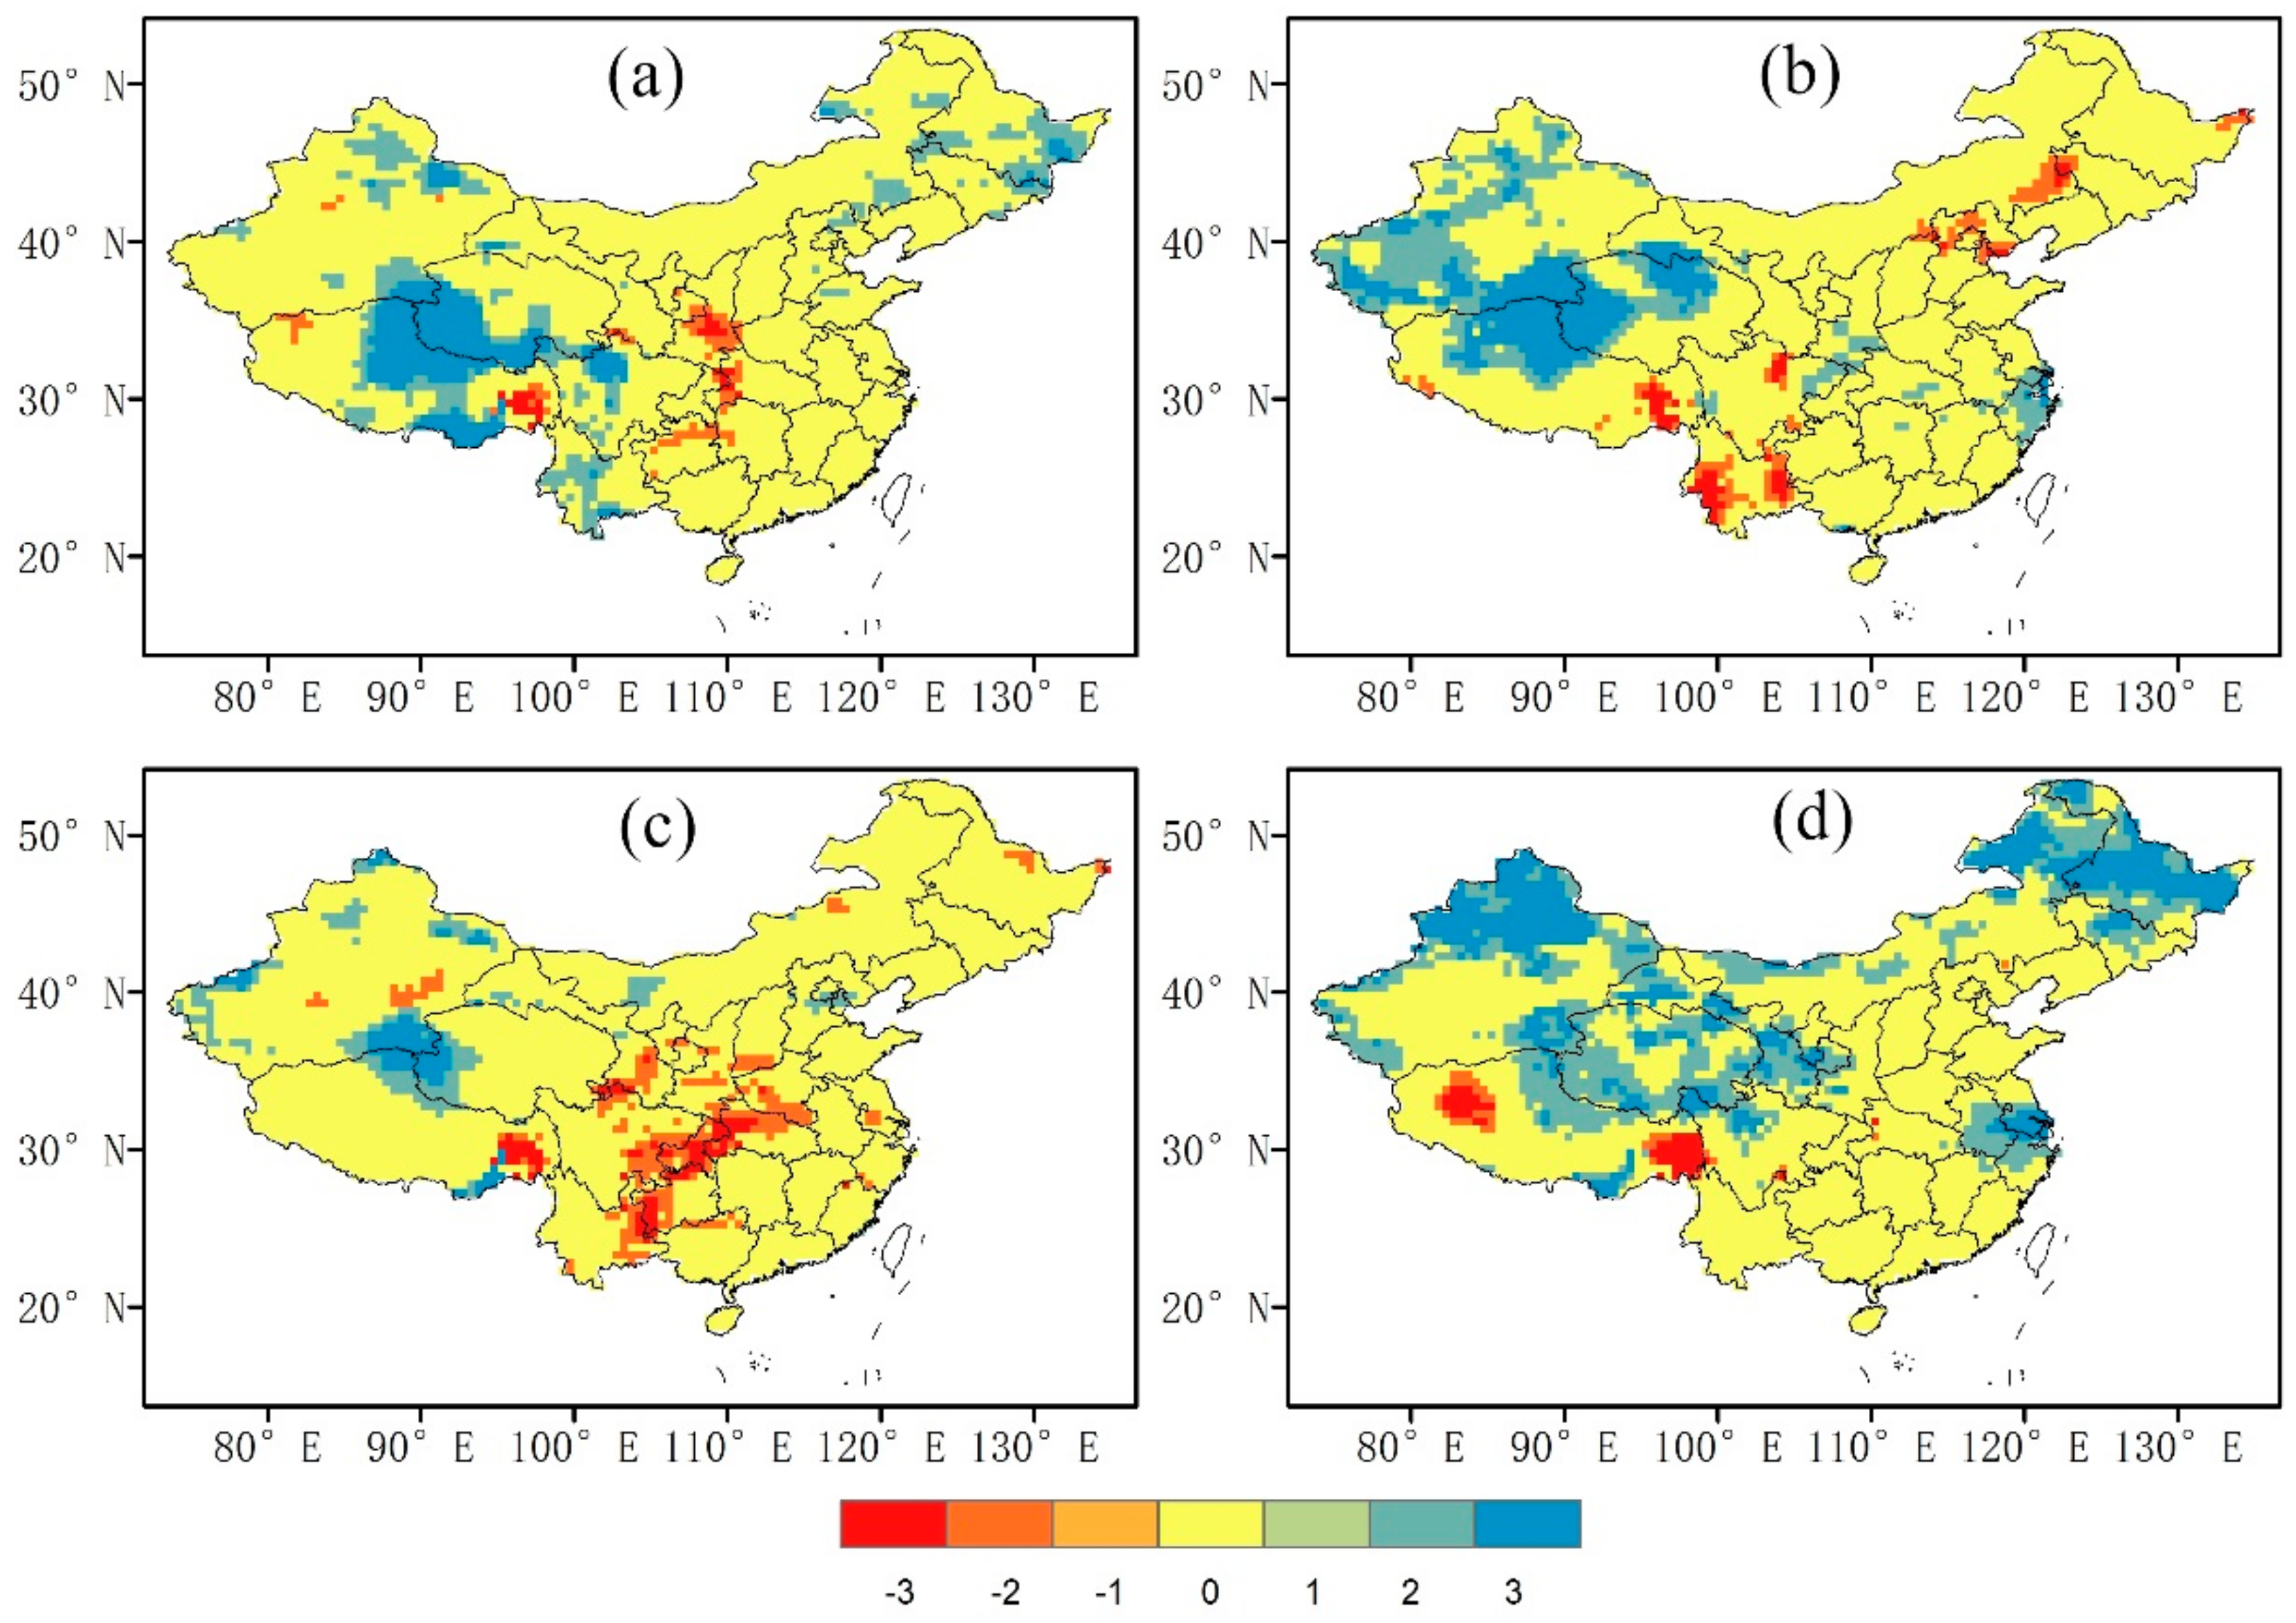
Figure 5e shows that the trends in the frequencies of extreme precipitation events are mostly not significant for the whole country on the annual basis except for northwestern China (including northern Tibet, most part of Xinjiang and Qinghai) where a significant increasing trend were observed, and a small part of southeastern Tibet where a significant decreasing trend were observed. A further comparison of the annual pattern in Figure 5e with seasonal patterns in Figure 5a–d shows that Figure 5e has the most similarity with Figure 5b, which means the increase of the frequency of extreme precipitation events in northwestern China is dominated by its increase in summer. Besides the significant increasing trend in northwestern China, the frequency of extreme precipitation events in summer also significantly increased in southern Shaanxi, northeastern Sichuan, southern Jiangsu and Shanghai, but decreased in Yunnan. In autumn, there were many parts scattered in central China exhibiting a significant decrease in the frequency of extreme precipitation events.
4. Spatial-Temporal Characteristics of Total and Seasonal Precipitation
4.1. Trends in Annual Total Precipitation and Rainfall Intensity
Figure 6 displays the spatial distribution of trends for annual total precipitation and rainfall intensity (the average amount of precipitation in rainy days with RR ≥ 0.1 mm). Annual total precipitation increased mainly in most parts of northwestern China (including Xinjiang, western Qinghai and northern Tibet), and decreased mainly in Yunnan, Guizhou and southeastern Tibet (Figure 6a). The trends of the rainfall intensity (Figure 6b) exhibited considerable similarity with the trends of total precipitation in the western half of China where significant positive trends were observed over most areas. Another region exhibiting positive trends but to a lower extent was southeastern China, where CWD and R95pTOT also increased as mentioned earlier in Section 3.1. This is in agreement with previous findings of Liu et al. [9], who noticed significant decreases in light precipitation and increases in heavy precipitation in eastern China.
4.2. Trends of Total Precipitation over Seasons
The spatial distribution of trends for seasonal precipitation during the period 1961–2013 detected by the MK test is shown in Figure 7. In prior studies with different datasets, Zhai et al. [7] found that spring precipitation increased in southern Northeast China and northern China, whereas the summer precipitation significantly decreased over those regions; He et al. [20] found that for northeastern China, precipitation in spring and winter showed an increasing trend, but the summer precipitation showed a decreasing trend; Ren et al. [12] suggested that for northern China, precipitation in summer decreased while spring and autumn precipitation increased obviously. What we see in Figure 7 generally agrees with prior results, but Figure 7d shows that the most extensive increase in precipitation over northeastern China occurred in winter. However, because winter is the season with the lowest amount of precipitation, such an extensive and significant increase in winter precipitation was not present in the trend in annual precipitation over northeastern China (Figure 6a).
Comparing Figure 6 and Figure 7 we know that the spatial pattern of the trend in total precipitation (Figure 6a) in northwestern China has the strongest match with the trend in summer precipitation (Figure 7b) followed by the trend in winter precipitation (Figure 7d), which means that the increase in total precipitation in northwestern China is mainly contributed by the precipitation increase in summer and winter. Although winter precipitation over lower reaches of the Yangtze River (around Anhui, southern Jiangsu northern Zhejiang and Shanghai) also increased significantly (Figure 7d), such an increase has little effect on the trend in total precipitation there (Figure 6a) indicating that the amount of increase is small. Another phenomenon is the significant decrease in autumn precipitation over the border area among Yunnan, Guizhou, Sichuan and Chongqing (Figure 7c), which is probably the main contributor to the decrease in total precipitation in that region (Figure 6a).
5. Characteristics of Precipitation Seasonality and Heterogeneity
5.1. Concentration Index and Seasonality Index of Precipitation
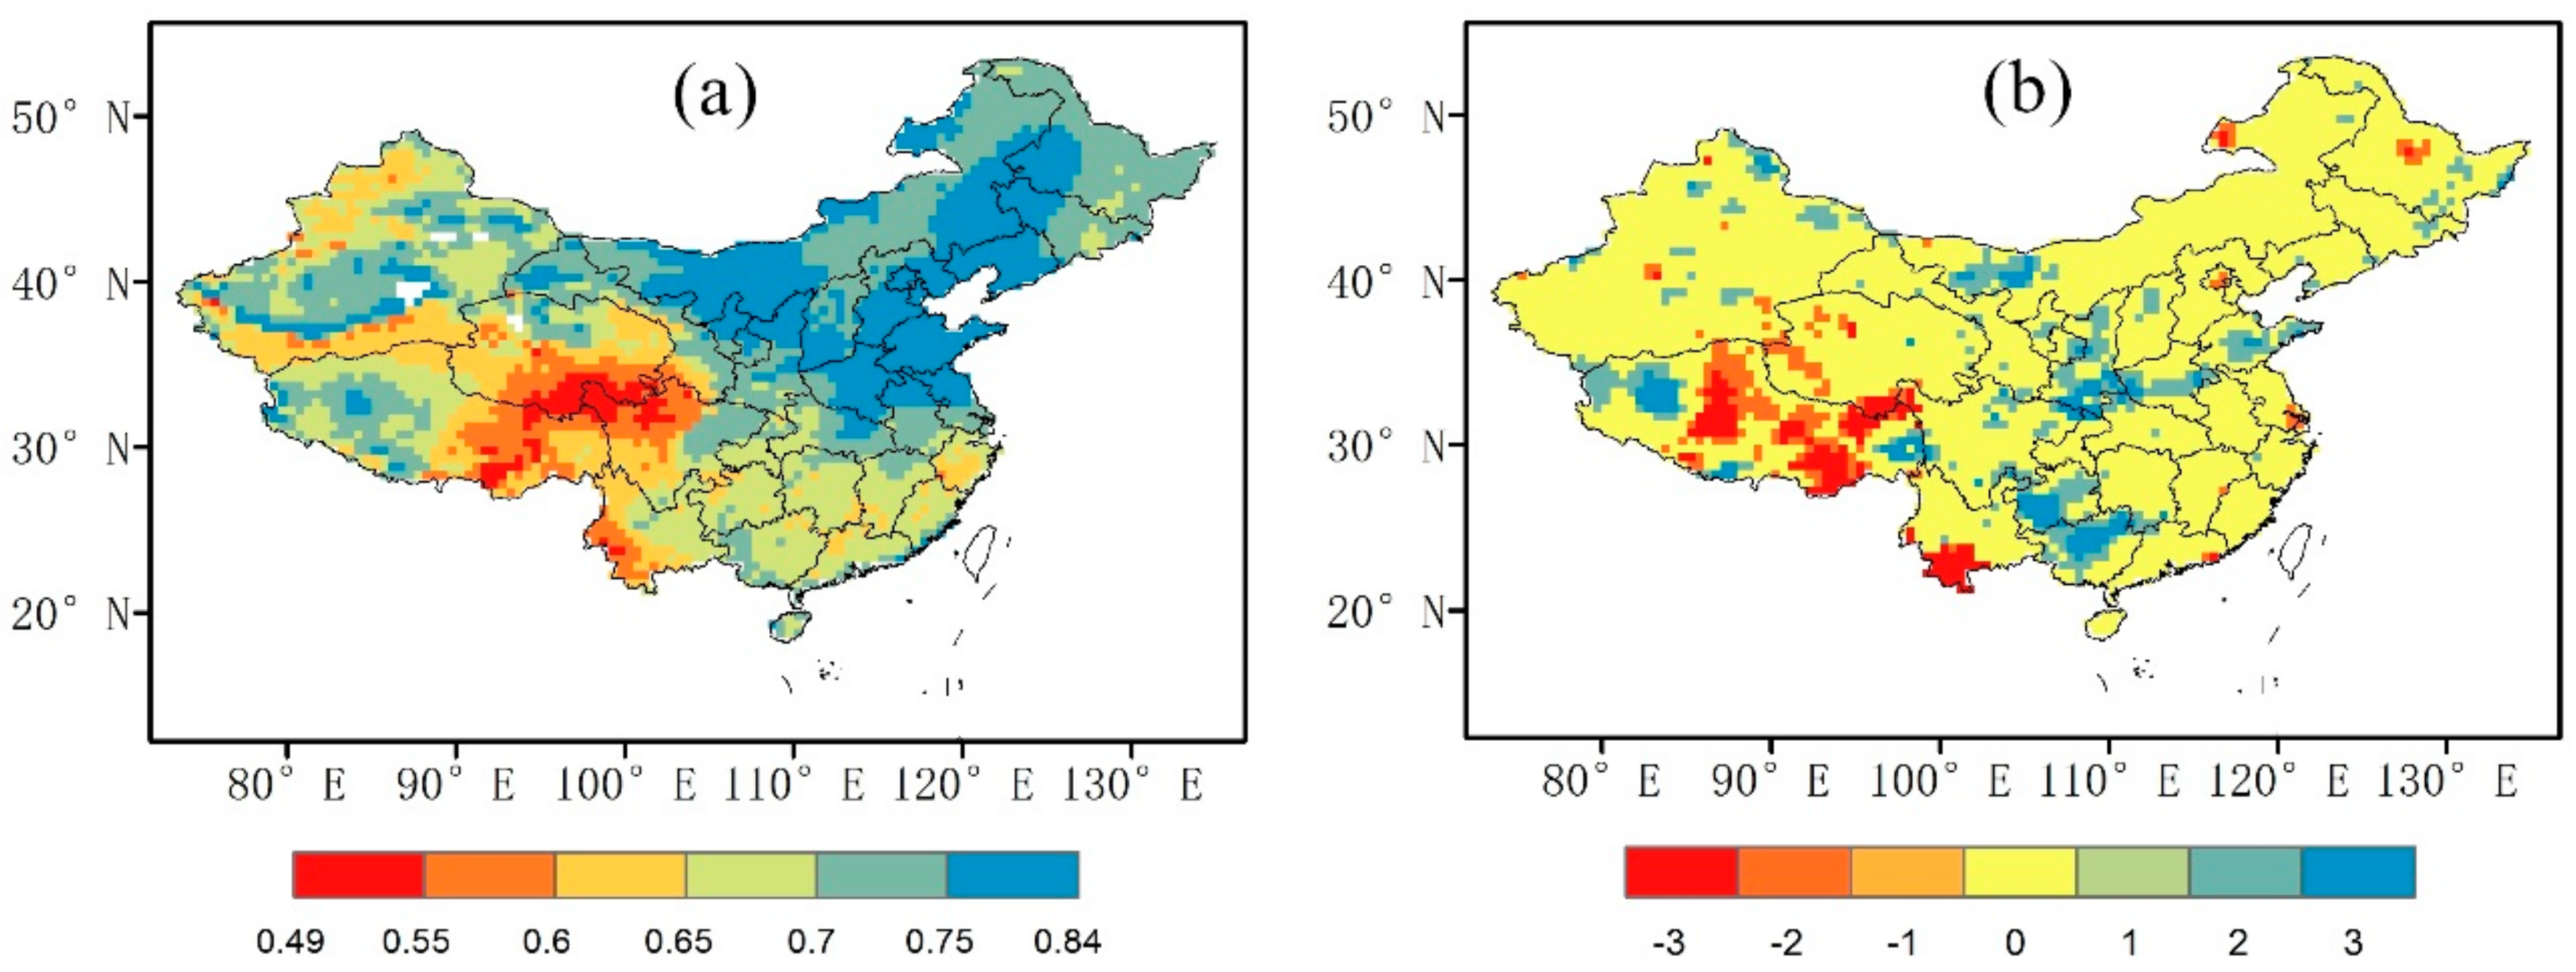
The annual average precipitation concentration index (CI) for the period 1961–2013 is shown in Figure 8a. The results indicate that the eastern Tibet Plateau (including eastern Tibet, southern Qinghai and northern Sichuan) and southwestern Yunnan have the smallest CI values over China, ranging from 0.49 to 0.6. Moreover, Figure 8b shows that these areas mostly exhibit a decreasing trend in CI, indicating that the contribution of heavy precipitation to total precipitation is decreasing compared with the past. The possible reason for the low CI in eastern Tibet Plateau is that the Tibet Plateau is affected by three major atmospheric circulation systems, i.e., South Asia monsoon, East Asian moon and western circulation [36], and the three systems may contribute to the total precipitation in the eastern Tibet Plateau at different periods over the year, resulting in a low CI.
Northern China generally has higher CI values than other regions, ranging from 0.7 to 0.84, indicating that heavy precipitation accounts for the majority of annual total precipitation. In addition, Figure 9b shows that Shaanxi, Henan and Shandong exhibit a significant increasing trend in terms of CI, indicating the increases in the contribution of heavy precipitation to total precipitation.
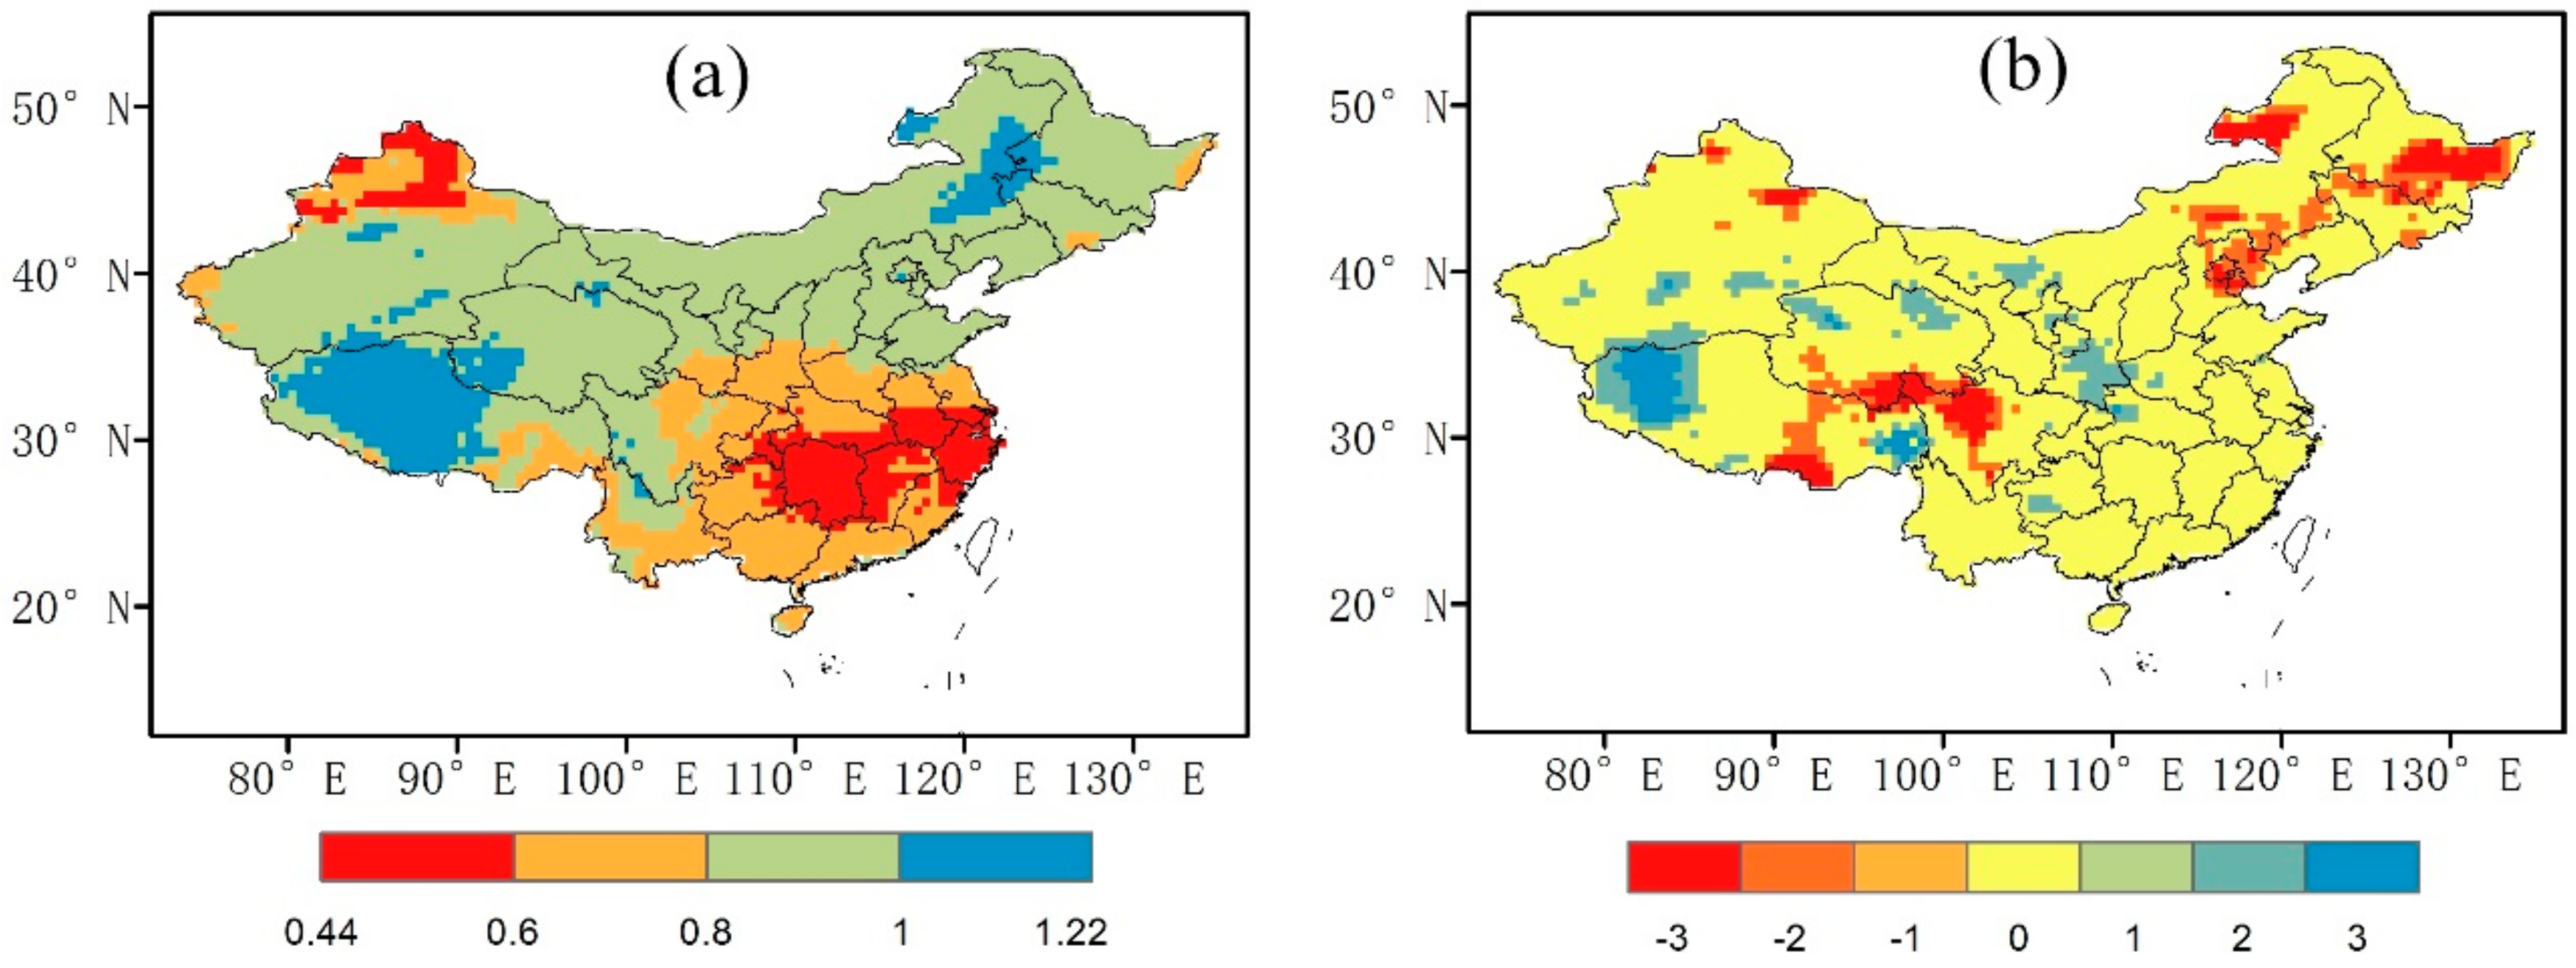
The annual average seasonality index of precipitation (SI) for the period 1961–2013 is shown in Figure 9a. SI generally increases from the southeast to the northwest of China, generally showing a zonal distribution as a result of the eastern Asian monsoon system. The closer to the source of the eastern Asian monsoon, the higher the SI value. However, the precipitation in northern Xinjiang is mainly controlled by the westerly [36]. Therefore, northern Xinjiang has an SI as high as southeastern China
SI significantly increased in central China (i.e., Shaanxi) and the northern Tibetan Plateau (i.e., northern Qinghai), probably due to the increase in summer precipitation (Figure 7b), as well as western Tibet, probably due to the decrease in winter precipitation (Figure 7d). At the same time, significant negative trends in SI are found over northeastern China as a result of the significant increase in winter precipitation (Figure 7d) and slight decrease in summer precipitation (Figure 7b). The border between Qinghai, Tibet and Sichuan also exhibits a significant negative trend because of the increase in winter precipitation (Figure 7d) and spring precipitation (Figure 7a). Such decreases in SI imply that precipitation is becoming more uniformly distributed throughout the year.
5.2. Characteristics of Rainy Seasons
Figure 10 shows the spatial distribution of multi-year average start dates (RS) and end dates (RE) of the rainy season in China. It indicates that for eastern China, the rainy season starts the earliest in southeastern China in early March and then advances from the south to the north and the northeast of China. Southeastern China has not only the earliest RS but also the earliest RE which occurs as early as in late August (i.e., RE < 243). The rainy season in eastern China ends generally from the south (i.e., mid-September) to central China (i.e., mid-November) successively after its end in southeastern China. The regions with late RE include southern Shaanxi, western Henan, Chongqing, Guizhou, Yunnan and Hainan.
In northwestern China, because the rainy season is mainly affected by westerly circulation rather than the Asian monsoon system, the rainy season starts the earliest in early April, later than the start of the rainy season in eastern China. Western Tibet is the region with the latest RS in China, starting in early June. The rainy season in northwestern China ends from western Tibet (i.e., mid-September) to northern Xinjiang (i.e., mid-November) successively.
Figure 11 indicates that significant negative trends in RS are observed over eastern Tibet, parts of northern and northeastern China together with parts of Qinghai, Sichuan and Yunnan, indicating the rainy seasons started earlier in those regions. At the same time, significant positive trends in RS are found over southern Gansu, Shaanxi, Hubei and Guizhou. Compared with trends in RS, trends in RE are less significant for China as a whole. Downward trends are found in parts of Shaanxi, Henan, Hubei, Sichuan, and Guizhou.
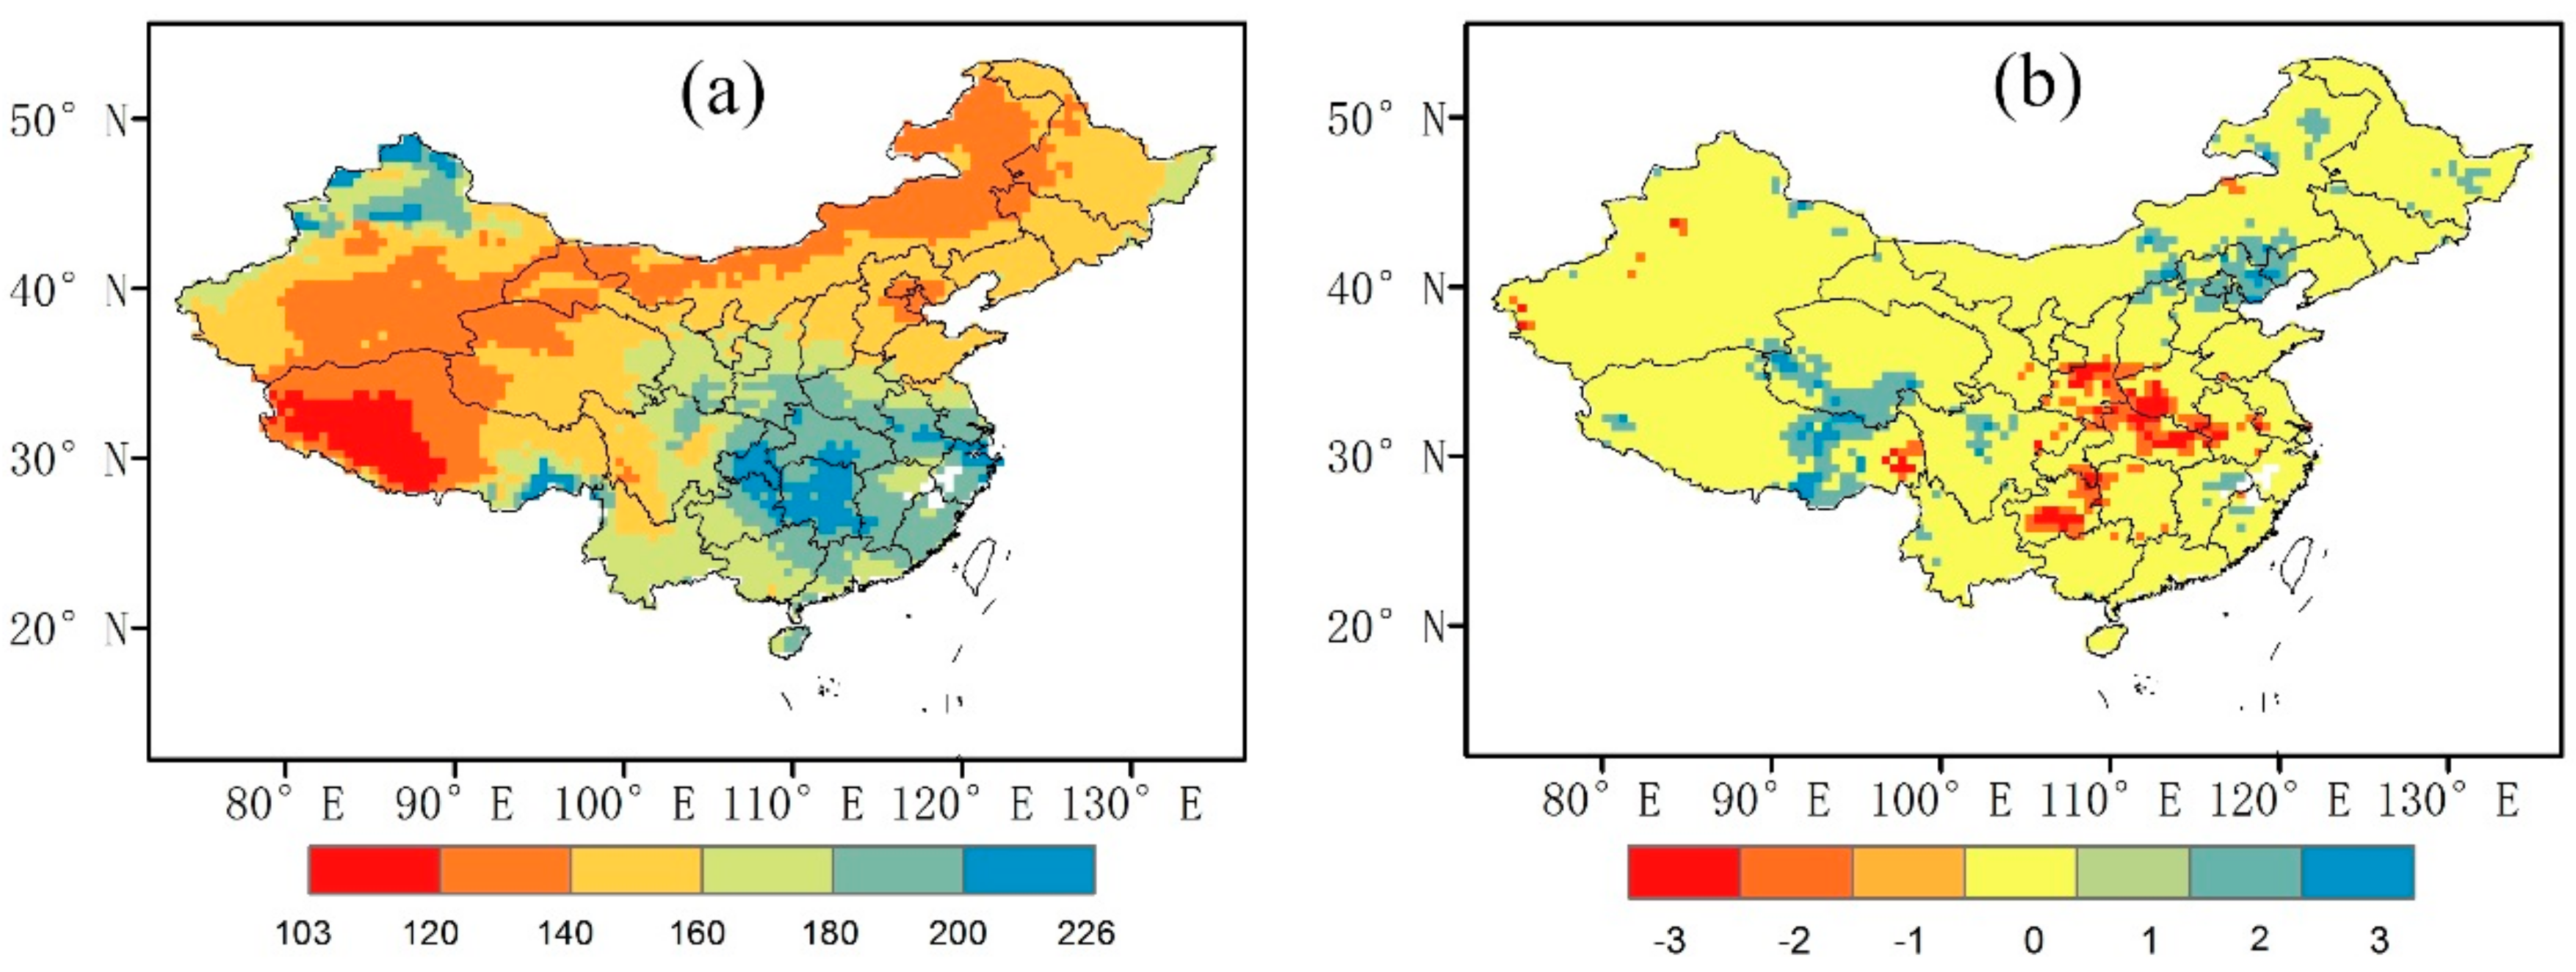
Figure 12 shows the spatial distribution of multi-year average lengths of the rainy season and trends in the lengths of the rainy season. The lengths of the rainy season vary greatly over China, ranging from 103 days to 226 days. Central parts of China (including southern Shaanxi, western Hubei, Chongqing, northern Sichuan and Guizhou) have the longest rainy season, whereas western Tibet has the shortest rainy season.
By visual inspection of Figure 11 and Figure 12b we know that the length of the rainy season in the central parts of China significantly decreased due to the joint effects of the increase in RS (Figure 11a) and the decrease in RE (Figure 11b) in those regions; the length of the rainy season in northern China (including Beijing, Tianjin and Hebei) increased because of the decrease in RS and the increase in RE; the length of the rainy season in eastern Tibet and southern Qinghai increased because of the decrease in RS. In other words, the length of the rainy season decreased in central China due to the later start and earlier end of the rainy season; the rainy season lengthened in northern China (including Beijing, Tianjin and Hebei) due to its earlier start and later end; and the rainy season lengthened in eastern Tibet Plateau due to its earlier start.
6. Linkage between Change in Precipitation Extremes and Precipitation Seasonal Heterogeneity
6.1. Relationship between Extreme and Total Precipitation
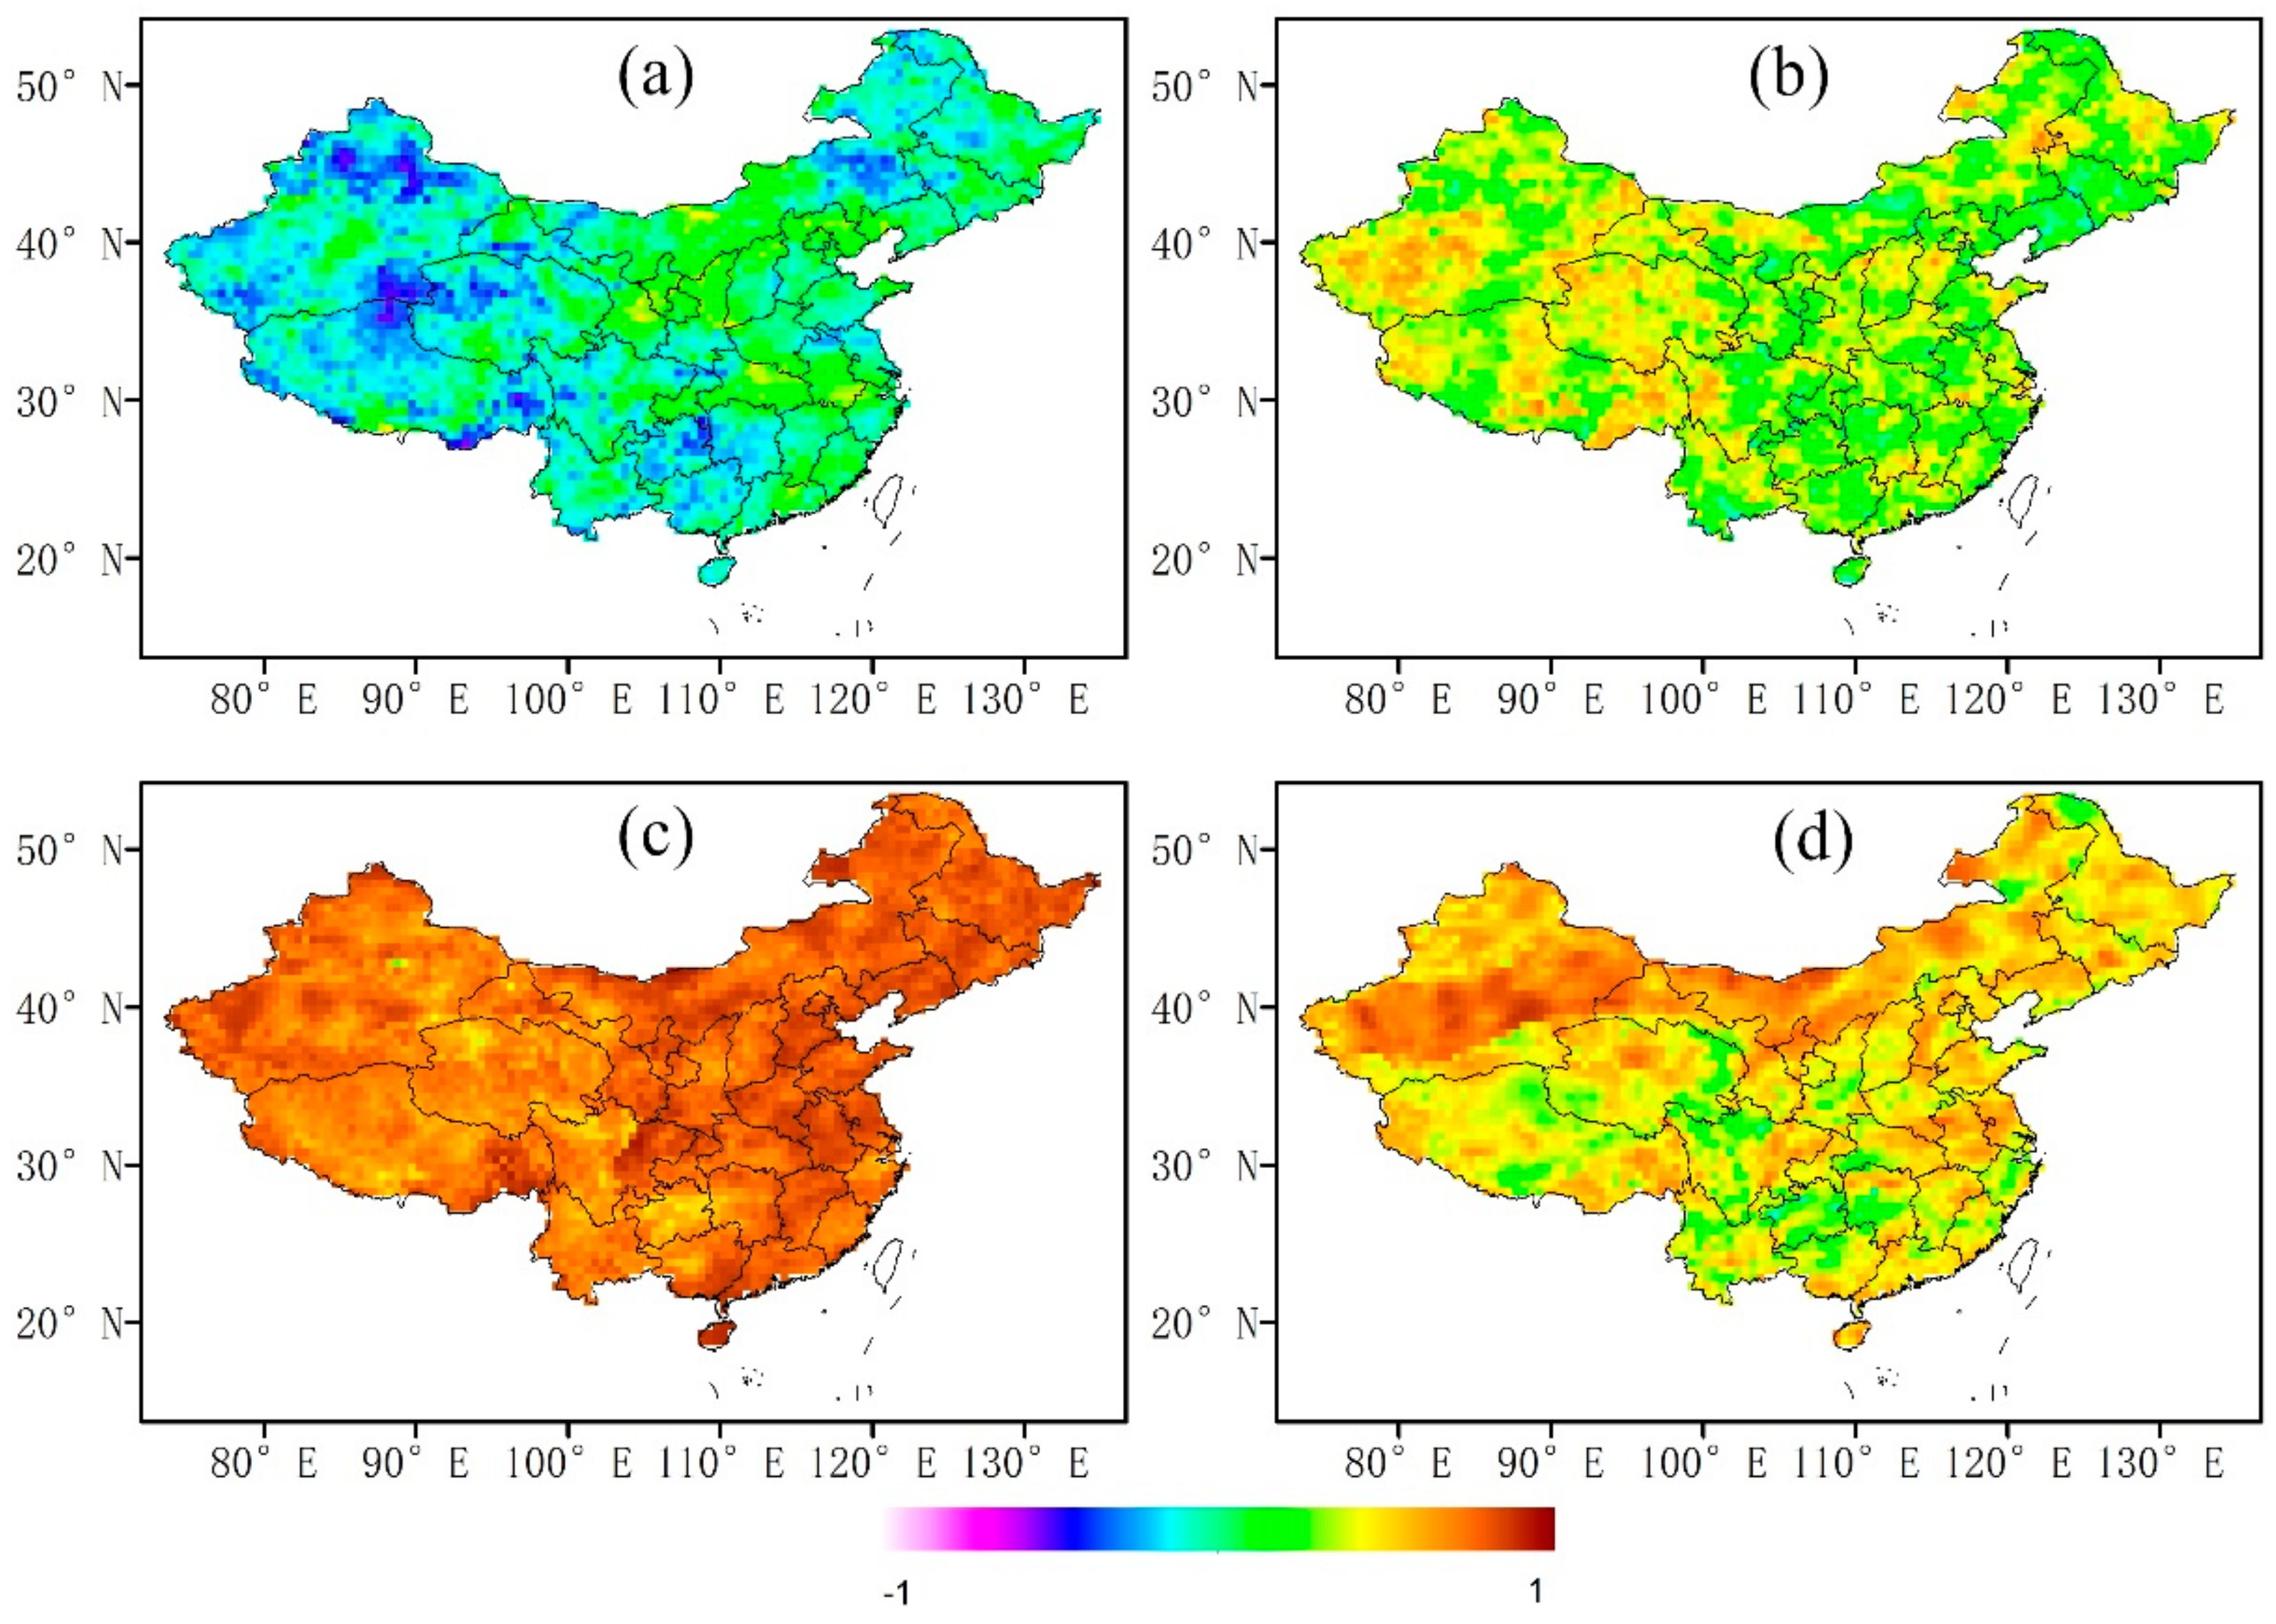
Previous studies have indicated that precipitation extremes and total precipitation are closely related (e.g., [7,37,38,39]). The correlation coefficients between extreme precipitation indices and total precipitation over China are shown in Figure 13. It is shown that the correlation between CDD and total precipitation is generally weak, especially in the eastern half of China, but in the western half of China, CDD is negatively related to total precipitation (Figure 13a). Meanwhile, CWD, R95pTOT and RX1day are positively correlated with the total precipitation in most parts of China, indicating the significant contribution of heavy precipitation to the total precipitation. R95pTOT has the strongest correlation with total precipitation, and the correlation coefficients are larger in the eastern half of China than in the western half of China (Figure 13c).
The above correlation analyses indicate a close linkage between precipitation extremes and total precipitation. Such a linkage can be found by visual inspection of the spatial distribution of trends in seasonal precipitation (Figure 7) with trends in seasonal frequencies of extreme precipitation events (Figure 5) as well. Similarities occur between the spatial patterns of trends in total precipitation and frequencies of extreme precipitation events over the four seasons, which indicates that the precipitation is becoming more extreme in regions with upwards trends of total precipitation not only at annual but also at seasonal scales. In fact, the similarity between the spatial patterns of trends in extreme and total precipitation may be explained by the number of rainy days and the rainfall intensity. Changes in the number of rainy days and the rainfall intensity jointly lead to changes in total precipitation. For instance, the increasing trends in total precipitation in northwestern China are due to an increase in both the rainfall intensity (Figure 6) and the number of rainy days [40]. Furthermore, a higher intensity would result in more precipitation extremes if the total number of rainy days does not decrease [7], which may explain the increasing trends for the amount of heavy precipitation R95pTOT over northwestern China (Figure 3c).
At the same time, it is shown that not all extreme precipitation indices are correlated with total precipitation. The IPCC Third Assessment Report [41] indicated that increasing trends of precipitation extremes occurred not only in regions where total precipitation increased but also in regions where total precipitation decreased or remained constant. Comparing the trend in annual total precipitation (Figure 6a) with trend in the amount of heavy precipitation R95pTOT (Figure 3c), annual total precipitation has no significant trend in southeastern coast of China, but R95pTOT exhibits significant upward trends along the southeastern coast. Similarly, for seasonal characteristics of precipitation, as mentioned in Section 4.2, a significant decreasing trend of autumn precipitation is observed over southwestern China, including Chongqing, Guizhou and Yunnan (Figure 7c), but for the frequencies of extreme precipitation events in autumn, there is a small negative trend over southwestern China (Figure 5c). This indicates that in regions where the total precipitation increases, the precipitation extremes are likely to increase, while in regions where the total precipitation decreases or remains constant, the precipitation extremes may not decrease or remain constant at annual and seasonal scales. That is in agreement with the results of Klein Tank & Können [6], who confirmed that at stations where the amount of annual precipitation increased, the extreme indices had similar changes, but for stations with a decreasing annual amount, there was no such amplified response of the precipitation extremes. The reason for inconsistency in the trends for total precipitation and precipitation extremes could also be associated with the number of rainy days and the rainfall intensity. For the southern coast of China, there is a small trend for total precipitation because the number of rainy days and the rainfall intensity cancel each other out. The effect of enhanced intensity overwhelms that of reduced rainy days [7], resulting in the increase in extreme events over the southern coast of China.
6.2. Relationship between Precipitation Extremes and Seasonality of Precipitation
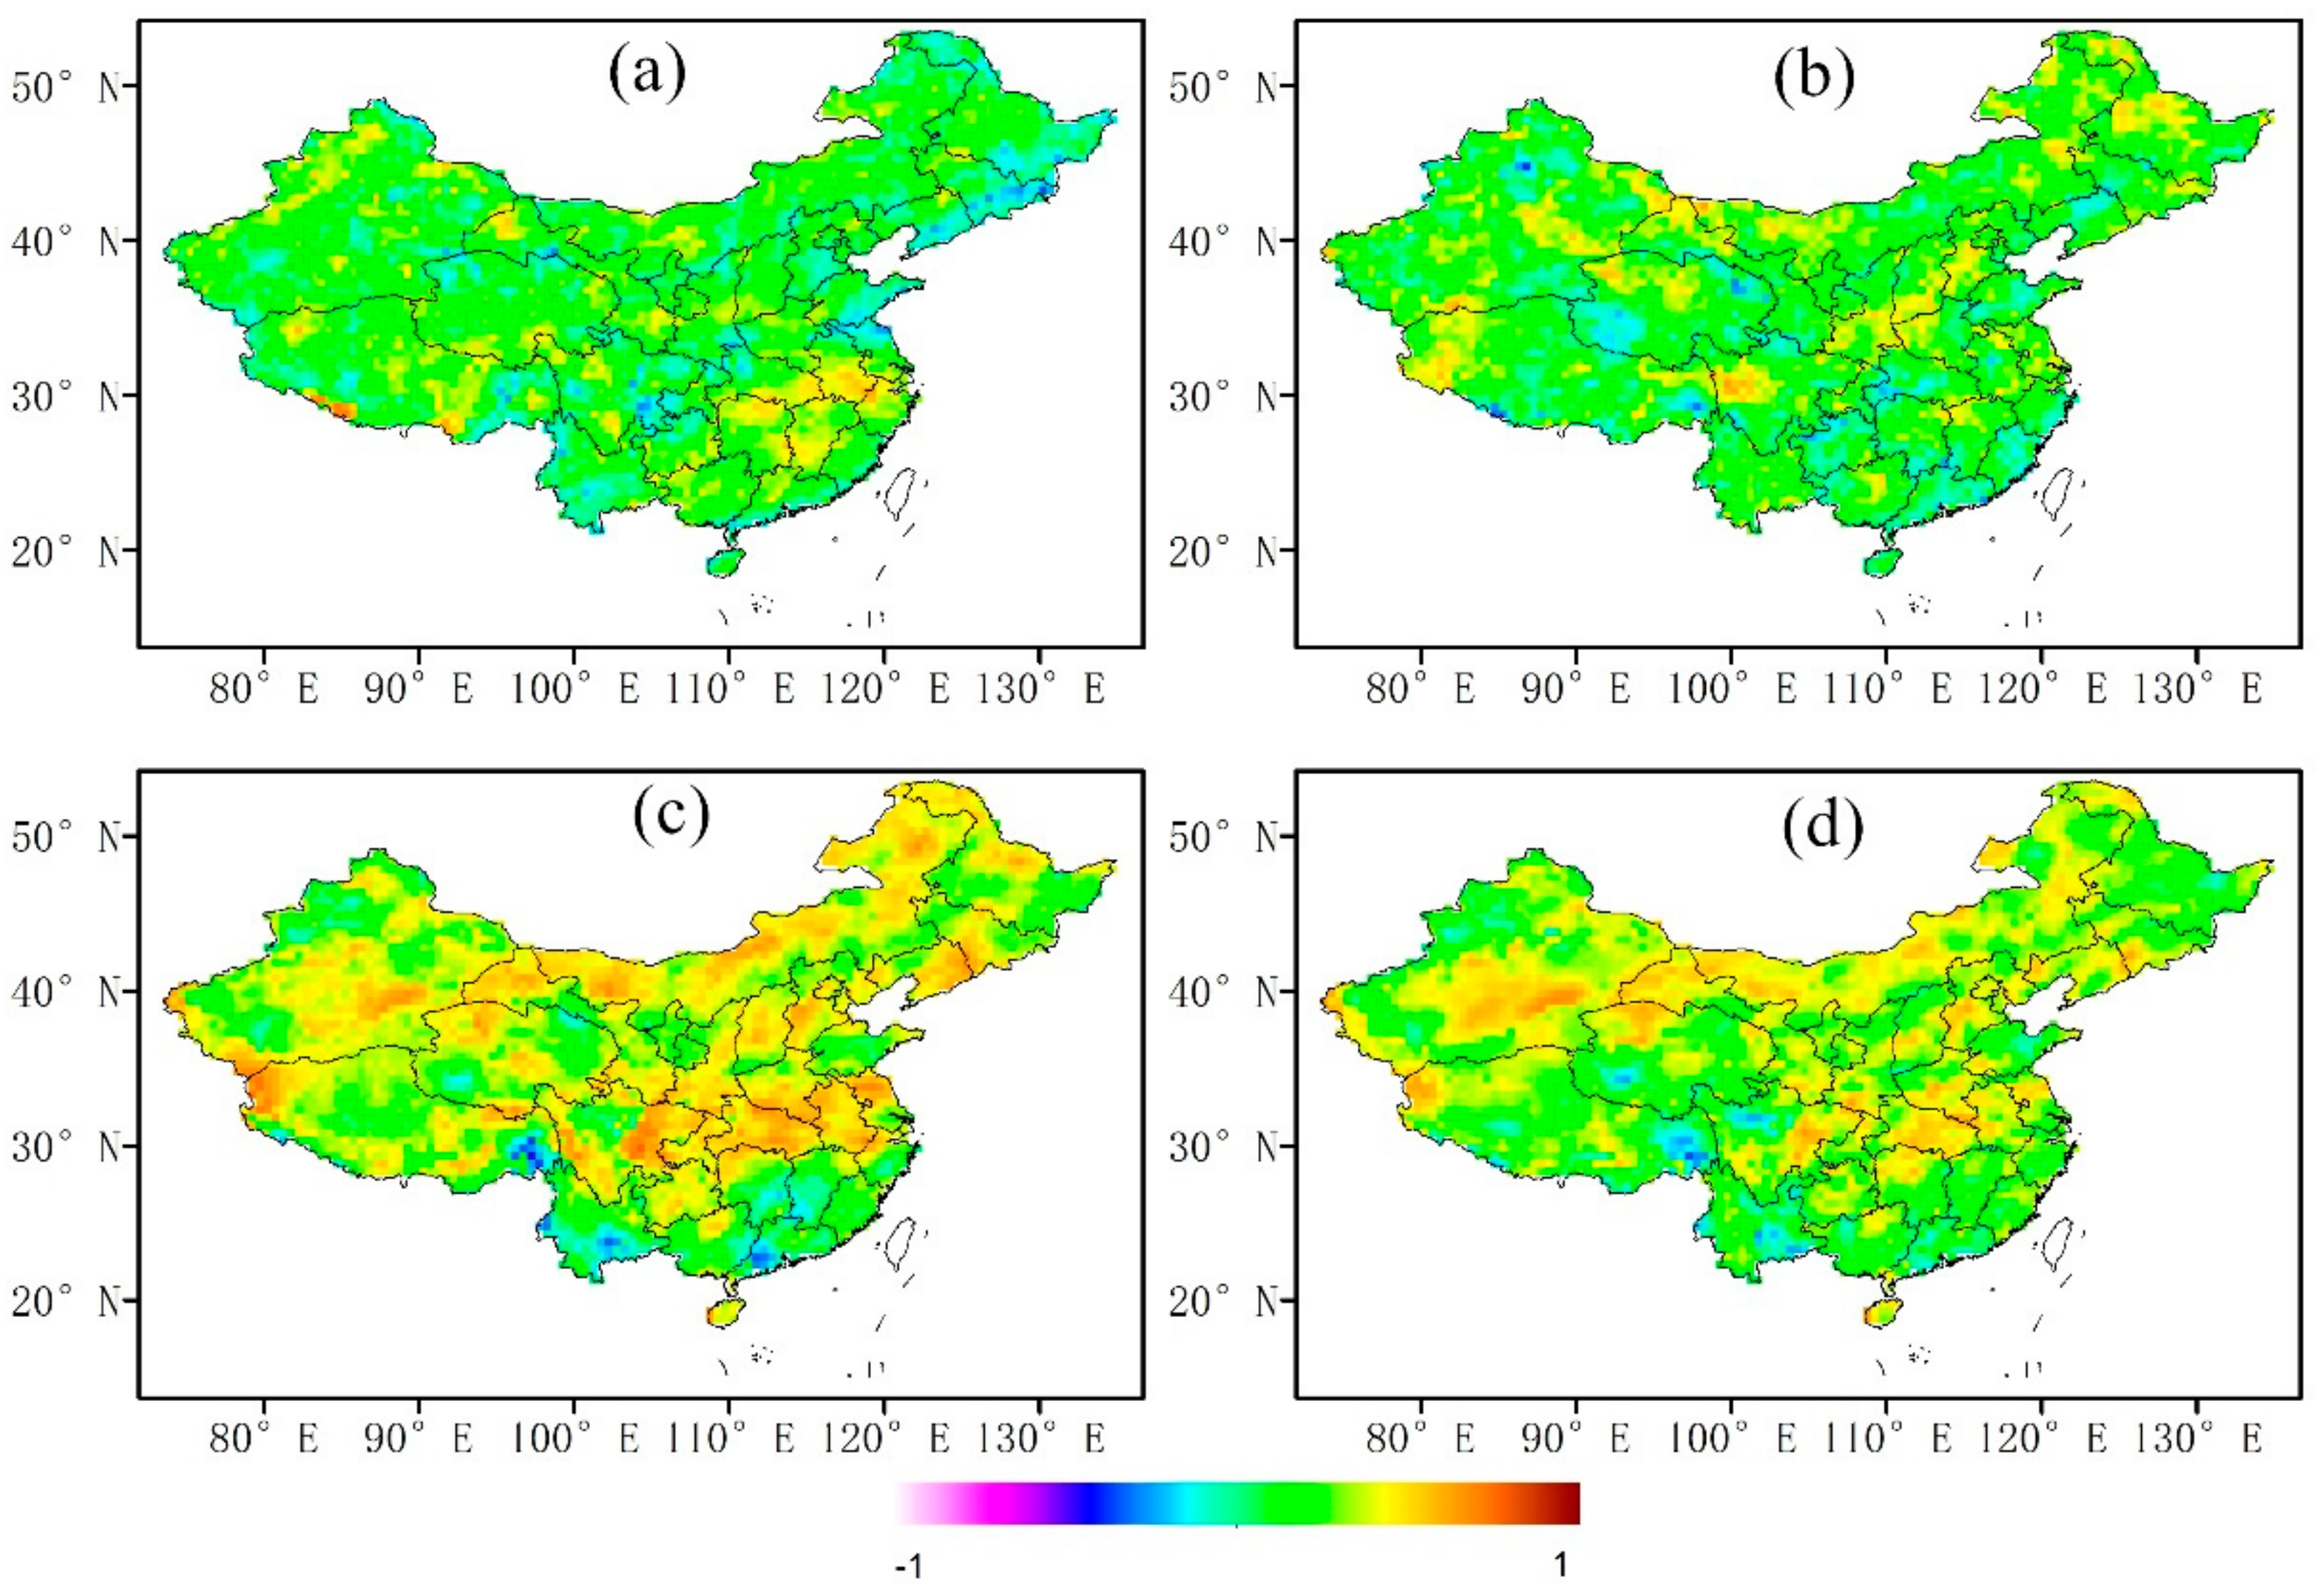
The correlation analysis between CI and four precipitation extreme indices and the spatial distributions of the correlation coefficients are shown in Figure 14. There is no clear spatial pattern between CI and CDD or CWD, but CDD tends to be very weakly positively related to CI whereas CWD tends to be slightly negatively related to CI. CI is strongly positively correlated with R95pTOT and RX1day in most areas in northern China (from the northeast to the northwest) and southwestern China (including Sichuan, Chongqing Guizhou and Guangxi), which means for these regions the temporal heterogeneity of daily precipitation over a year is dominated by the amount of heavy rainfall.
The spatial distributions of the correlation coefficients between SI and the four extreme precipitation indices over China are shown in Figure 15. The results indicate that SI has weak positive correlation with both CDD and CWD. Meanwhile, SI is positively related with R95pTOT and RX1day over most areas above 30° N, indicating that heavy precipitation events have a better chance to occur in the places with strong seasonal variation of annual precipitation for these areas. However, for most areas below 30° N, the positive relationship between SI and R95pTOT or RX1day is insignificant at the 0.05 significance level, and in some places the correlation is even slightly negative.
Strong seasonality of precipitation is often closely related to the heavy precipitation during the flood season, such as in the upper reaches of the Huai River in China [42]. However, as shown in Figure 15, SI is not always consistent with R95pTOT over entire China, which could also be observed by the differences in the spatial patterns of their changes (Figure 3c and Figure 9b). The significant decreasing trend in SI over eastern Heilongjiang is not observed in R95pTOT, while the increasing trend in R95pTOT over northern Xinjiang, northern Tibet, Qinghai and many places in southeastern China shown in Figure 3c does not present in SI or has a much smaller extent, shown in Figure 9b. SI and R95pTOT even exhibit opposite trends over some places, such as the southeastern corner of Tibet and small parts of northern Xinjiang.
7. Conclusions
Using the gridded Chinese ground precipitation dataset from 1961–2013, spatial and temporal variations in precipitation extremes, total precipitation, the seasonality of precipitation and their linkages in the context of climate change are investigated using the Mann-Kendall trend test, Pettitt change-point test and the correlation analysis.
Significant positive trends in extreme precipitation indices are observed mainly in northwestern China, especially Xinjiang, Tibet and Qinghai (CWD, R95pTOT, and RX1day), and scattered parts of southeastern China (R95pTOT, and RX1day), but decreases are observed over considerable parts of southwestern China (CWD) and some small parts of northern China (CWD, R95pTOT, and RX1day). The spatial patterns of trends in total precipitation are similar to those of precipitation extremes. Correlation analysis between extreme precipitation indices and total precipitation shows positive correlations over most parts of China except for CDD, which indicates that the precipitation is more extreme in regions with upward trends of total precipitation. The step changes in the extreme precipitation index series are not significant for China as a whole, and the change points occurred in different periods for different regions and extreme precipitation indices, ranging from the early 1970s to early 2000s.
Analyses of seasonal extreme precipitation events frequencies show that for northwestern China and Tibet, significant positive trends are observed in spring and summer, while the trends in autumn and winter are insignificant except for northern Xinjiang. For northern China, negative trends are observed in summer and winter. For southern and southeastern China, upwards trends are found mainly in winter. For southwestern China, positive trends are observed mainly in spring.
The concentration index (CI) is strongly and positively correlated with R95pTOT and RX1day in most areas in northern China (from the northeast to the northwest) and southwestern China (including Sichuan, Chongqing Guizhou and Guangxi), which means for these regions, the temporal heterogeneity of daily precipitation over a year is dominated by the amount of heavy rainfall. The seasonality index of precipitation (SI) is positively related to R95pTOT and RX1day over most areas above 30° N, indicating that heavy precipitation events have a better chance of occurring in the places with strong seasonal variation in annual precipitation for these areas, whereas for most areas below 30° N, the positive relationship between SI and R95pTOT or RX1day is insignificant at the 0.05 significance level, and in some places the correlation is even slightly negative.
Author Contributions
Conceptualization W.W.; Methodology, W.W. and Y.T.; Software, W.W. and Y.T.; Validation, Y.T., S.S. and J.M.; Formal Analysis, Y.T.; Investigation, Y.T. and S.S.; Resources, J.M.; Data Curation, Y.T. and J.M.; Writing-Original Draft Preparation, Y.T.; Writing-Review & Editing, W.W.
Funding
This research was fund by the National Science Foundation of China projects (Grant No. 41571130071, 41371050), and the 111 Project (Grant No. B08048).
Conflicts of Interest
The authors declare no conflict of interest.
References
- Stocker, T.F.; Qin, D.; Plattner, G.K.; Tignor, M.; Allen, S.K.; Boschung, J.; Nauels, A.; Xia, Y.; Bex, V.; Midgley, P.M. Climate Change 2013: The Physical Science Basis. Contribution of Working Group I to the Fifth Assessment Report of the Intergovernmental Panel on Climate Change. Comput. Geom. 2013, 18, 95–123. [Google Scholar]
- Katz, R.W.; Brown, B.G. Extreme events in a changing climate: Variability is more important than averages. Clim. Chang. 1992, 21, 289–302. [Google Scholar] [CrossRef]
- Karl, T.R.; Knight, R.W. Secular trends of precipitation amount, frequency, and intensity in the United States. Bull. Am. Meteorol. Soc. 1998, 79, 231–241. [Google Scholar] [CrossRef]
- Suppiah, R.; Hennessy, K.J. Trends in total rainfall, heavy rain events and number of dry days in Australia, 1910–1990. Int. J. Climatol. 1998, 18, 1141–1164. [Google Scholar] [CrossRef] [Green Version]
- Vincent, L.A.; Aguilar, E.; Saindou, M.; Hassane, A.F.; Jumaux, G.; Roy, D.; Booneeady, P.; Virasami, R.; Randriamarolaza, L.Y.A.; Faniriantsoa, F.R.; et al. Observed trends in indices of daily and extreme temperature and precipitation for the countries of the western Indian Ocean, 1961–2008. J. Geophys. Res. Atmos. 2011, 116, 521–541. [Google Scholar] [CrossRef]
- Klein Tank, A.M.G.; Können, G.P. Trends in indices of daily temperature and precipitation extremes in Europe, 1946–1999. J. Clim. 2002, 16, 3665–3680. [Google Scholar] [CrossRef]
- Zhai, P.; Zhang, X.; Wan, H.; Pan, X. Trends in total precipitation and frequency of daily precipitation extremes over China. J. Clim. 2005, 18, 1096–1108. [Google Scholar] [CrossRef]
- Xiao, C.; Wu, P.; Zhang, L.; Song, L. Robust increase in extreme summer rainfall intensity during the past four decades observed in China. Sci. Rep. 2016, 6, 38506. [Google Scholar] [CrossRef] [PubMed] [Green Version]
- Liu, R.; Liu, S.C.; Cicerone, R.J.; Shiu, C.J.; Li, J.; Wang, J.; Zhang, Y. Trends of extreme precipitation in eastern China and their possible causes. Adv. Atmos. Sci. 2015, 32, 1027–1037. [Google Scholar] [CrossRef] [Green Version]
- Yang, J.H.; Jiang, Z.H.; Wang, P.X. Temporal and spatial characteristic of extreme precipitation event in China. Clim. Environ. Res. 2008, 13, 75–83. (In Chinese) [Google Scholar]
- Wu, W.-B.; You, Q.L.; Wang, D. Characteristics of extreme precipitation in China based on homogenized precipitation data. J. Nat. Resour. 2016, 31, 1015–1026. (In Chinese) [Google Scholar] [CrossRef]
- Ren, G.; Ren, Y.; Zhan, Y.; Sun, X.; Liu, Y.; Chen, Y.; Wang, T. Spatial and temporal patterns of precipitation variability over mainland China: II: Recent trends. Adv. Water Sci. 2015, 26, 299–310. (In Chinese) [Google Scholar]
- Zhou, B.; Xu, Y.; Wu, J.; Dong, S.; Shi, Y. Changes in temperature and precipitation extreme indices over china: Analysis of a high-resolution grid dataset. Int. J. Climatol. 2016, 36, 1051–1066. [Google Scholar] [CrossRef]
- Hare, S.R.; Mantua, N.J. Empirical evidence for north pacific regime shifts in 1977 and 1989. Prog. Oceanogr. 2000, 47, 103–145. [Google Scholar] [CrossRef]
- Graham, N.E. Decadal scale variability in the 1970s and 1980s: Observations and model results. Clim. Dyn. 1994, 10, 135–162. [Google Scholar] [CrossRef]
- Trenberth, K.E.; Hurrell, J.W. Decadal atmosphere-ocean variations in the pacific. Clim. Dyn. 1994, 9, 303–319. [Google Scholar] [CrossRef]
- Wang, Z.; Luo, Y.; Liu, C.; Xia, J.; Zhang, M. Spatial and temporal variations of precipitation in Haihe River Basin, China: Six decades of measurements. Hydrol. Process. 2011, 25, 2916–2923. [Google Scholar] [CrossRef]
- Zhao, F.F.; Xu, Z.X.; Huang, J.X.; Li, J.Y. Monotonic trend and abrupt changes for major climate variables in the headwater catchment of the Yellow River Basin. Hydrol. Process. 2008, 22, 4587–4599. [Google Scholar] [CrossRef]
- Pryor, S.C.; Schoof, J.T. Changes in the seasonality of precipitation over the contiguous USA. J. Geophys. Res. Atmos. 2008, 113. [Google Scholar] [CrossRef] [Green Version]
- He, W.; Bu, R.; Xiong, Z.; Hu, Y. Characteristics of temperature and precipitation in Northeastern China from 1961 to 2005. Acta Ecol. Sin. 2013, 33, 519–531. (In Chinese) [Google Scholar] [CrossRef]
- Yao, S.; Jiang, D.; Fan, G. Seasonality of precipitation over China. Chin. J. Atmos. Sci. 2017, 6, 1191–1203. (In Chinese) [Google Scholar]
- Pei, F.; Wu, C.; Qu, A.; Xia, Y.; Wang, K.; Zhou, Y. Changes in extreme precipitation: A case study in the Middle and Lower Reaches of the Yangtze River in China. Water 2017, 9, 943. [Google Scholar] [CrossRef]
- China Meteorological Data Service Center. Available online: http://data.cma.cn/en (accessed on 20 March 2017).
- CLIMDEX: Climate Extremes Indices. Available online: https://climdex.org/indices.html (accessed on 12 April 2017).
- Martin-Vide, J. Spatial distribution of a daily precipitation concentration index in peninsular Spain. Int. J. Climatol. 2004, 24, 959–971. [Google Scholar] [CrossRef] [Green Version]
- Walsh, R.P.D.; Lawler, D.M. Rainfall seasonality: Description, spatial patterns and change through time. Weather 1981, 36, 201–208. [Google Scholar] [CrossRef]
- Wang, Z.Y. Climatic characteristics of rainy seasons in China. Chin. J. Atmos. Sci. 2008, 32, 1–13. (In Chinese) [Google Scholar] [CrossRef]
- Lau, K.M.; Yang, S. Climatology and interannual variability of the Southeast Asian summer monsoon. Adv. Atmos. Sci. 1997, 14, 141–162. [Google Scholar] [CrossRef]
- Zhang, J.C.; Lin, Z.G. Climate in China; Shanghai Scientific and Technological Press: Shanghai, China, 1985. (In Chinese) [Google Scholar]
- Samel, A.N. The monsoon rain band over China and relationships with Eurasian circulation. J. Clim. 1999, 12, 115–131. [Google Scholar] [CrossRef]
- Kendall, M.G. Rank Correlation Methods; Hafner Publishiing Company: New York, NY, USA, 1962. [Google Scholar]
- Mann, H.B. Nonparametric test against trend. Econometrica 1945, 13, 245–259. [Google Scholar] [CrossRef]
- Tarhule, A.; Woo, M. Changes in rainfall characteristics in northern Nigeria. Int. J. Climatol. 2015, 18, 1261–1271. [Google Scholar] [CrossRef]
- Pettitt, A.N. A Non-Parametric approach to the change-point problem. J. R. Stat. Soc. 1979, 28, 126–135. [Google Scholar] [CrossRef]
- Wang, W.; Zhu, Y.; Xu, R.G.; Liu, J.T. Drought Severity Change in China during 1961–2012 indicated by SPI and SPEI. Nat. Hazards 2015, 75, 2437–2451. [Google Scholar] [CrossRef]
- Dai, X.G.; Wang, P. A new classification of large-scale climate regimes around the Tibetan Plateau based on seasonal circulation patterns. Adv. Clim. Chang. Res. 2017, 8, 26–36. [Google Scholar] [CrossRef]
- Haylock, M.; Nicholls, N. Trends in extreme rainfall indices for an updated high quality data set for Australia, 1910–1998. Int. J. Climatol. 2015, 20, 1533–1541. [Google Scholar] [CrossRef]
- Stone, D.; Weaver, A.; Zwiers, F. Trends in Canadian precipitation intensity. Atmosphere 2000, 38, 321–347. [Google Scholar] [CrossRef] [Green Version]
- Yamamoto, R.; Sakurai, Y. Long-term intensification of extremely heavy rainfall intensity in recent 100 years. World Resour. Rev. 1999, 11, 271–281. [Google Scholar]
- Zhai, P.M.; Wang, C.C.; Li, W. A review on study of change in precipitation extremes. Adv. Clim. Chang. Res. 2007, 3, 144–148. (In Chinese) [Google Scholar]
- Peterson, T.; Folland, C.; Gruza, G.; Hogg, W.; Mokssit, A.; Plummer, N. Report on the Activities of the Working Group on Climate Change Detection and Related Rapporteurs; World Meteorological Organization: Geneva, Switzerland, 2001; p. 143. [Google Scholar]
- Shi, P.; Qiao, X.; Chen, X.; Zhou, M.; Qu, S.; Ma, X.; Zhang, Z. Spatial distribution and temporal trends in daily and monthly precipitation concentration indices in the upper reaches of the Huai River, China. Stoch. Environ. Res. Risk Assess. 2012, 28, 201–212. [Google Scholar] [CrossRef]
Figure 1.
Average annual precipitation in China during the period 1961–2013.

Figure 2.
The concentration curve (or Lorenz curve) (Note: A is enclosed by the quadrant and the Lorenz curve, S is enclosed by the Lorenz curve and bisector of the quadrant).
Figure 2.
The concentration curve (or Lorenz curve) (Note: A is enclosed by the quadrant and the Lorenz curve, S is enclosed by the Lorenz curve and bisector of the quadrant).

Figure 3.
Spatial distribution of trends for (a) CDD, (b) CWD, (c) R95pTOT, and (d) RX1day by MK test.
Figure 3.
Spatial distribution of trends for (a) CDD, (b) CWD, (c) R95pTOT, and (d) RX1day by MK test.

Figure 4.
Spatial distribution of change points of (a) CDD, (b) CWD, (c) R95pTOT, (d) RX1day.

Figure 5.
Trends in the frequencies of extreme precipitation events in different seasons for the period 1961–2013 by MK test: (a) spring, (b) summer, (c) autumn, (d) winter, (e) annual.
Figure 5.
Trends in the frequencies of extreme precipitation events in different seasons for the period 1961–2013 by MK test: (a) spring, (b) summer, (c) autumn, (d) winter, (e) annual.

Figure 6.
Trends of (a) annual total precipitation and (b) rainfall intensity by MK test.

Figure 7.
The trends for (a) spring, (b) summer, (c) autumn, and (d) winter precipitation during the period 1961–2013 based on the MK test.
Figure 7.
The trends for (a) spring, (b) summer, (c) autumn, and (d) winter precipitation during the period 1961–2013 based on the MK test.

Figure 8.
Spatial distribution of annual average CI (a) and trends of CI based on the MK test (b) from 1961–2013.
Figure 8.
Spatial distribution of annual average CI (a) and trends of CI based on the MK test (b) from 1961–2013.

Figure 9.
Spatial distribution of annual average SI (a) and trends of SI based on the MK test (b) from 1961–2013.
Figure 9.
Spatial distribution of annual average SI (a) and trends of SI based on the MK test (b) from 1961–2013.

Figure 10.
Spatial distribution of multi-year average start dates RS (a) and end dates RE (b) of rainy seasons from 1961–2013.
Figure 10.
Spatial distribution of multi-year average start dates RS (a) and end dates RE (b) of rainy seasons from 1961–2013.

Figure 11.
Spatial distribution of trends for (a) start dates RS, (b) end dates RE of the rainy season over China based on the MK test.
Figure 11.
Spatial distribution of trends for (a) start dates RS, (b) end dates RE of the rainy season over China based on the MK test.

Figure 12.
Spatial distribution of multi-year average lengths of the rainy season (day) (a) and spatial distribution of trends in the lengths of the rainy season based on the MK test (b).
Figure 12.
Spatial distribution of multi-year average lengths of the rainy season (day) (a) and spatial distribution of trends in the lengths of the rainy season based on the MK test (b).

Figure 13.
The correlation coefficients between total precipitation and (a) CDD, (b) CWD, (c) R95pTOT, and (d) RX1day.
Figure 13.
The correlation coefficients between total precipitation and (a) CDD, (b) CWD, (c) R95pTOT, and (d) RX1day.

Figure 14.
Correlation analysis between CI and precipitation extreme indices: (a) CDD, (b) CWD, (c) R95pTOT, and (d) RX1day.
Figure 14.
Correlation analysis between CI and precipitation extreme indices: (a) CDD, (b) CWD, (c) R95pTOT, and (d) RX1day.

Figure 15.
Correlation analysis between SI and precipitation extreme indices: (a) CDD, (b) CWD, (c) R95pTOT, and (d) RX1day.
Figure 15.
Correlation analysis between SI and precipitation extreme indices: (a) CDD, (b) CWD, (c) R95pTOT, and (d) RX1day.


Table 1.
Extreme precipitation indices in this study (Note: RR denotes daily precipitation amount).
| Index | Description | Unit |
|---|---|---|
| CDD | Annual maximum number of consecutive dry days with RR < 1 mm | Days |
| CWD | Annual maximum number of consecutive wet days with RR ≥ 1 mm | Days |
| R95pTOT | Annual total precipitation when RR > 95 p (95th percentile in 1986–2005) | mm |
| RX1day | Annual maximum 1-day precipitation | mm |
Note: RR is the daily precipitation.
Table 2.
Classification of trend in terms of p-value and τ with MK trend test.
| τ | p-Value | Class | Trend Type |
|---|---|---|---|
| τ > 0 | p < 0.01 | 3 | Very significant increase |
| 0.01 ≤ p < 0.05 | 2 | Significant increase | |
| 0.05 < p ≤ 0.1 | 1 | Slight increase | |
| τ = 0 | 0.1 < p | 0 | No trend |
| τ < 0 | 0.05 < p ≤ 0.1 | −1 | Slight decrease |
| 0.01 ≤ p < 0.05 | −2 | Significant decrease | |
| p < 0.01 | −3 | Very significant decrease |
© 2018 by the authors. Licensee MDPI, Basel, Switzerland. This article is an open access article distributed under the terms and conditions of the Creative Commons Attribution (CC BY) license (http://creativecommons.org/licenses/by/4.0/).
Share and Cite
MDPI and ACS Style
Tao, Y.; Wang, W.; Song, S.; Ma, J. Spatial and Temporal Variations of Precipitation Extremes and Seasonality over China from 1961~2013. Water 2018, 10, 719. https://doi.org/10.3390/w10060719
AMA Style
Tao Y, Wang W, Song S, Ma J. Spatial and Temporal Variations of Precipitation Extremes and Seasonality over China from 1961~2013. Water. 2018; 10(6):719. https://doi.org/10.3390/w10060719
Chicago/Turabian StyleTao, Yiyuan, Wen Wang, Shuang Song, and Jun Ma. 2018. "Spatial and Temporal Variations of Precipitation Extremes and Seasonality over China from 1961~2013" Water 10, no. 6: 719. https://doi.org/10.3390/w10060719
Note that from the first issue of 2016, this journal uses article numbers instead of page numbers. See further details here.