Energy-Recovery Pressure-Reducer in District Heating System


Institute of Electromechanical Energy Conversion, Cracow University of Technology, 31-155 Kraków, Poland
*
Author to whom correspondence should be addressed.
Water 2018, 10(6), 787; https://doi.org/10.3390/w10060787
Submission received: 30 May 2018
/
Revised: 8 June 2018
/
Accepted: 11 June 2018
/
Published: 14 June 2018
(This article belongs to the Section Wastewater Treatment and Reuse)
Abstract
:Already existing man-made infrastructures that create water flow and unused pressure are interesting energy sources to which micro-hydropower plants can be applied. Apart from water supply systems (WSSs), which are widely described in the literature, significant hydropower potential can also be found in district heating systems (DHSs). In this paper, a prototype, a so-called energy-recovery pressure-reducer (ERPR), utilized for a DHS, is presented. It consisted of a pump as a turbine coupled to a permanent magnet synchronous generator (PMSG). The latter was connected to the power grid through the power electronic unit (PEU). The variable-speed operation allowed one to modify the turbine characteristics to match the substation’s hydraulic conditions. The proposed ERPR device could be installed in series to the existing classic pressure reducing valve (PRV) as an independent device that reduces costs and simplifies system installation. The test results of the prototype system located in a substation of Cracow’s DHS are presented. The steady-state curves and regulation characteristics show the prototype’s operating range and efficiency. In this study, the pressure-reducer impact on the electrical and hydraulic systems, and on the environment, were analyzed. The operation tests during the annual heating season revealed an average system’s efficiency of 49%.
1. Introduction
Micro-hydropower plants (MHPs), whose power output is typically below 100 kW, have gained increasing attention due to their energy recovery capability in existing infrastructures [1]. A potential energy source can be found in any system that comprises water flow and unused pressure, i.e., water networks dealing with drinking water, wastewater (raw or treated), irrigation water, runoff water (rain or storm water), as well as cooling and heating systems [2,3]. Besides respecting basic water parameters (flow rate and pressure), the MHP can be designed according to water quality (wastewater) and temperature (cooling and heating systems). The generation of electrical energy is a supplementary function of water infrastructures. Therefore, a bypass valve and a secure shutdown system for the turbine are required. MHPs as renewable energy sources provide benefits for both the supplier (reduction of transmission losses) and the customer (reliability and reduced price) [4].
In recent literature, water supply systems (WSSs) are emphasized as the main man-made infrastructure that offers micro-hydropower potential. WSSs that are located in lower topographic areas suffer from excess pressure. This energy surplus, which is commonly dissipated via pressure-reducing valves (PRVs) [5,6], can be recovered by applying MHPs. The excess pressure is mainly present in transmission pipes and between sub-grids, but also inside the network and at the building entrance. Pressure reduction also leads to a decreasing leakage problem because water loss increases with increasing pressure [7]. However, the MHP location that maximizes the energy production may not be optimal regarding leakage reduction [8]. The optimal location of the MHP within urban WSSs is difficult because of the complex network topology (multiple loops) and asymmetric water demand. Therefore, earlier studies have mainly been conducted in particular locations [9,10].
The MHP᾿s efficiency is affected mainly by the water turbine’s characteristics. To obtain high efficiency under a wide range of parameter variations, a traditional turbine can be used. In literature, some dedicated turbine solutions for power generation from water pipelines can be found. For instance, a novel vertical-axis water turbine [11] and an inline five blade tubular propeller turbine [12] were analyzed (through computational fluid dynamic calculations) and successfully tested. However, the available power at a given WSS location is limited. To shorten the payback period of the turbine, costs need to be minimized. Therefore, pumps-as-turbines (PATs) seem to enable a good compromise between efficiency, operating range, and costs [13,14,15,16]. Unfortunately, the prediction of the PAT’s performance is still a troublesome issue, and procedures that select the best solution for given conditions are under development [17]. A specific design procedure, the so-called Variable Operating Strategy, of an MHP is developed in References [18,19,20]. The procedure uses PAT as a production device that maximizes the energy production under variable operating conditions (flow discharge and pressure drop). Two power plant regulation systems are considered. In the hydraulic regulation mode, the system is composed of the dissipation (PRV) and production (PAT) branch bypassed by another dissipation (PRV) branch. The electrical regulation mode employs an inverter ensuring variable rotational speed.
Another system with hydropower potential is presented by a district heating system (DHS). This infrastructure is not well investigated yet regarding energy recovery. The energy production analysis presented in Reference [21] (on the example of the Cracow DHS) has confirmed the system’s high potential. Similar to a WSS, the water parameters (pressure and flow rate) fluctuate in time. This is caused by the daily and seasonal changes in outdoor temperatures. The excessive energy can also result from landform features, but the main cause of the excess pressure is the system’s growth. This situation requires higher pressure at the heat source, which consequently creates points where the pressure needs to be reduced. The values of the reduced pressure and flow rate can be identified in the piezometric graphs that present the pressure distribution in the network at specific locations, considering a geodesic profile. In Reference [21], a calculation of the recoverable surplus energy is presented with two variants that differ in energy recovery location (variant I: substations, variant II: network mains). The advantage of variant I is that the produced energy can be utilized directly for the installation, e.g., by circulating pumps. If the annual heat season lasts 6 months and the MHP’s average efficiency equals 50%, the calculated recovery energy measures 1.7 GWh/year and 2.7 GWh/year for variants I and II, respectively. An economic analysis enabled a calculation of the investment’s return time, which lasted 5 and 7 years for variants I and II, respectively.
The mentioned analysis indicated the DHS’s significant potential for energy recovery. Therefore, a prototype device, a so-called energy recovery pressure reducer (ERPR) applying a centrifugal PAT, was designed [22]. The prototype (2 kW) contains a permanent magnet synchronous generator (PMSG) and a power electronic unit (PEU). The PEU allows for an improvement in the ERPR’s conversion efficiency and enhances the operating range by applying variable speed operation [23,24]. The preliminary tests were performed in a real heating network. The identified steady-state characteristics present the dependence of reduced pressure on the turbine speed, and the maximal system efficiency equals 60%. Further, the tests indicate some issues that need to be improved, such as high water temperature (bearing, generator cooling) and the ERPR’s operating range (turbine type).
This paper presents an improved ERPR prototype that was tested in the Cracow DHS. The ERPR is located in the network’s substation with a heat exchanger where the circulating pumps utilized all recovered energy. The prototype ERPR of 5 kW consisted of a multi-stage vertical PAT combined with a PMSG connected to the grid through a PEU. Besides the steady-state characteristics, the influence of the ERPR on the electrical and hydraulic systems, and on the environment, were analyzed. Therefore, noise, as well as electrical and vibration signals, were investigated in detail. Furthermore, the ERPR operation during the annual heating season is presented and analyzed.
2. Pressure-Reduction System with Energy Recovery
2.1. Energy Potential
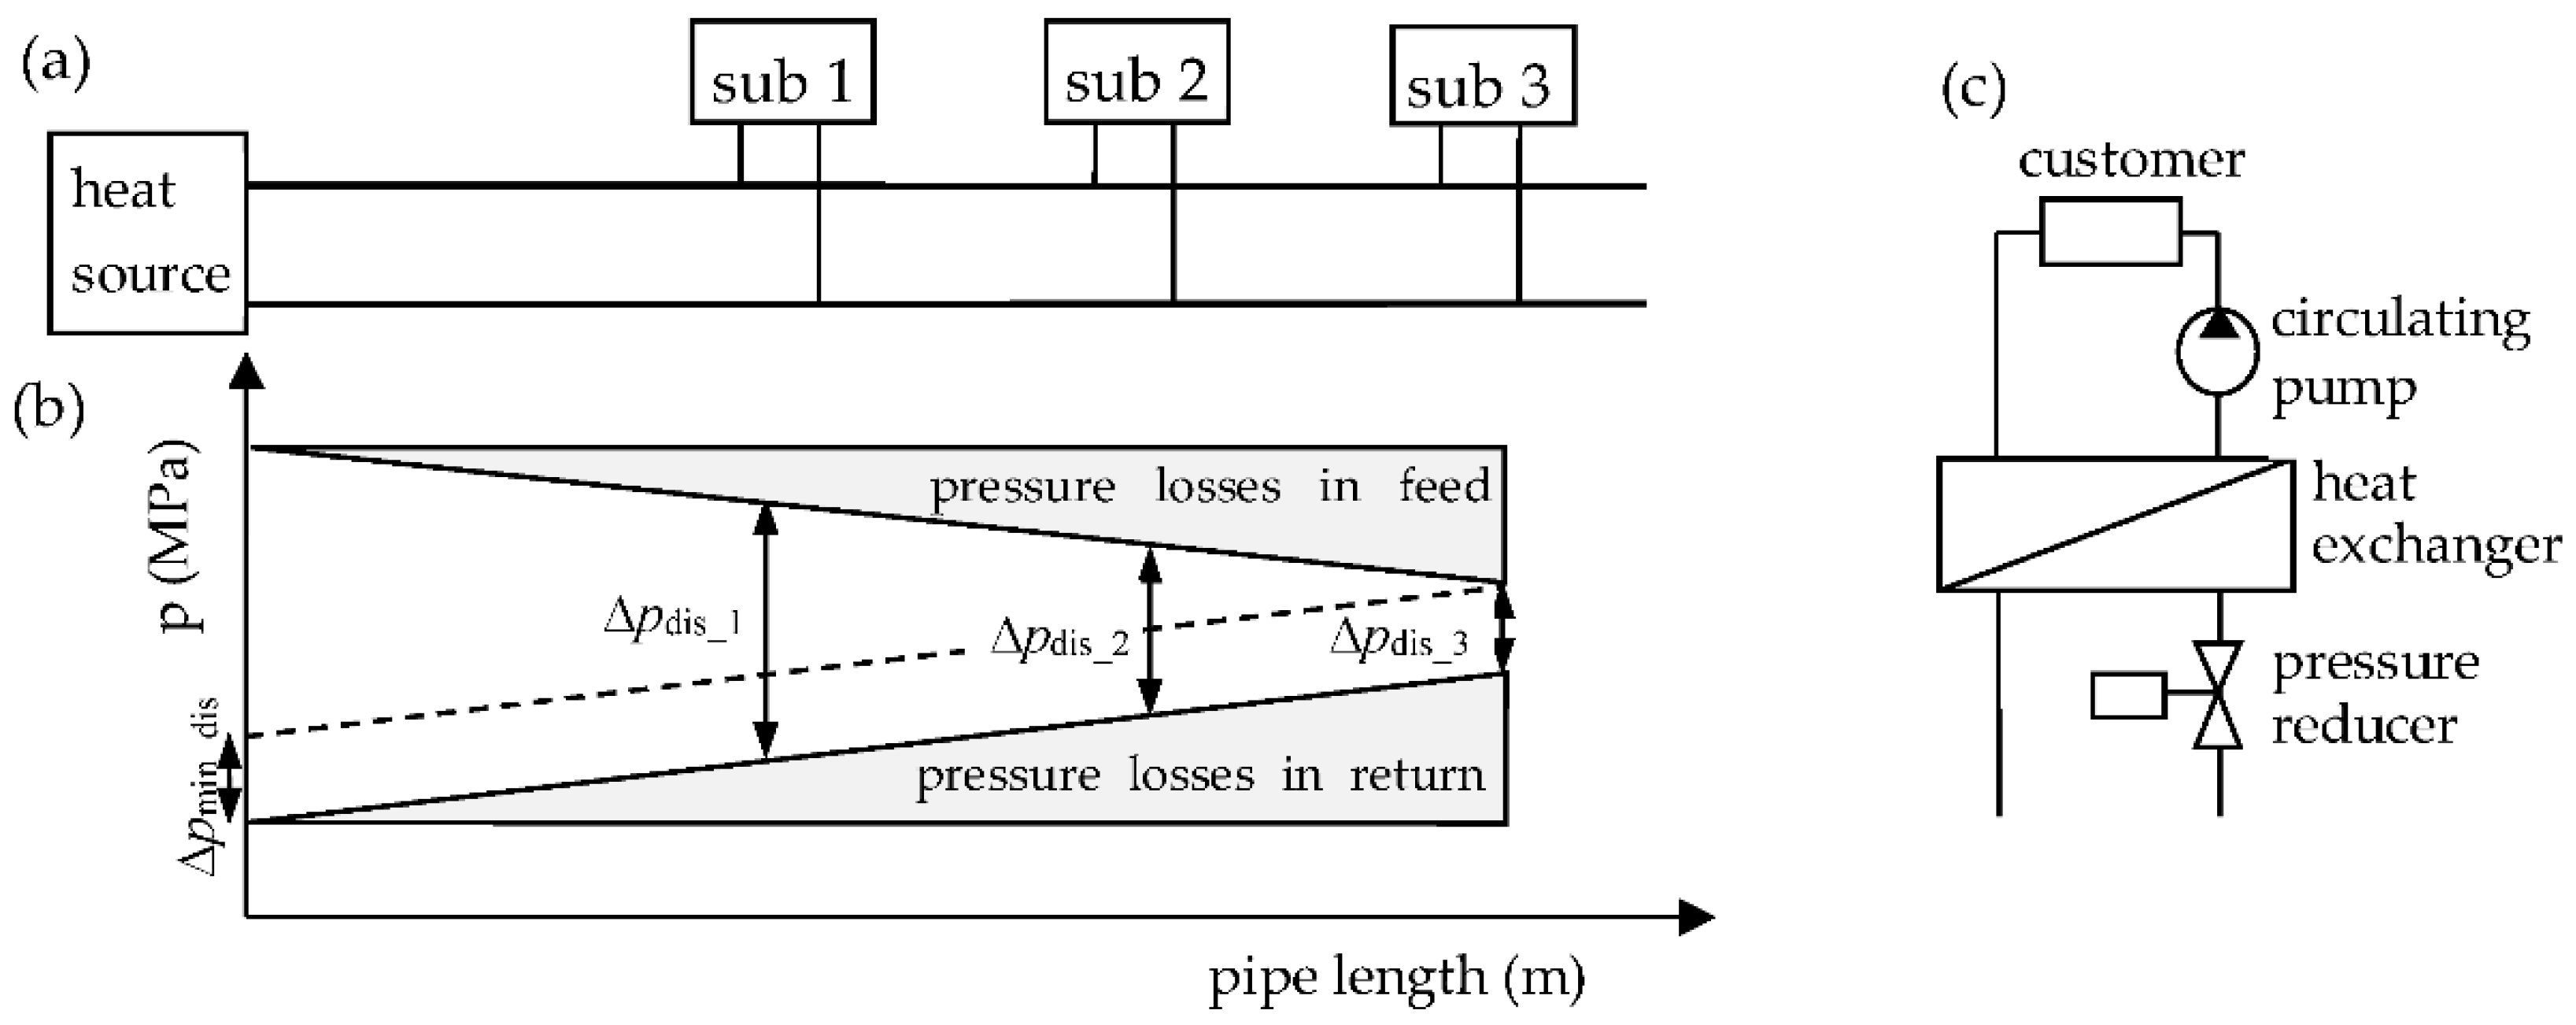
The main function of a DHS is to supply the customer with heating energy. Considering the initial investment, maintenance, and operation costs, the most prevalent solution is a two-pipe system, as presented in Figure 1a. Here, hot water is transported from the heat source to a substation through one pipe and returned by another [25]. In indirect systems, the parameters of the district heating medium (water), which is delivered from the heat source, are converted into suitable parameters (demanded by the customer) by a heat exchanger in the substation (Figure 1c). The heat exchangers transfer heat from the primary loop (district heating) to the secondary loop (customer) without mixing the fluids. This process requires a specific flow rate and water temperature of the primary loop. The supply temperature is changed (from 75 °C up to 120 °C), depending on the outdoor temperature, by the heat source according to a specific profile. The flow rate is adjusted by the substation’s differential pressure (between input and output). The heat source should provide a differential pressure in the last substation (usually the worst-situated) equal to or higher than the minimal disposal pressure ∆pmin_dis (usually 0.15–0.2 MPa). The latter is needed to cover the conduction losses of the heat exchanger and the control valve requirement (Figure 1b). The differential disposal pressure of the remaining substations is higher.
The differential excess pressure of the substation n (∆pn = ∆pdis_n − ∆pmin_dis) can be used by the ERPR to produce the electrical active power P (W) according to the formula:
where γ (N/m3) is the specific weight of water, Q (m3/s) is the volumetric flow rate, H (m) is the head drop, η is the total ERPR efficiency, and ∆pn = γ H (MPa) is the differential hydrostatic excess pressure of substation n, where H = 106.4·∆pn under water temperature equals 100 °C.
The total ERPR efficiency is the product of the turbine efficiency (ηt = 0.5–0.85), which depends on the flow range and rotational speed, generator efficiency (ηg = 0.8–0.97), and efficiency of the PEU (ηp = 0.9–0.98):
The actual ERPR efficiency depends on the operating parameters (flow rate and differential pressure) and applied technical devices (mainly the turbine type). The efficiency variation may be significant (η = 0.35–0.8) [26,27,28,29]. Thus, the ERPR design process has key importance for the system’s profitability.
2.2. Topology of Substation with ERPR
The heat demand of the customer is highly dependent on the outdoor temperature. Usually, the flow rate of the secondary loop remains constant, whereas the temperature is adjusted. The secondary loop’s temperature as a function of the outdoor temperature, the so-called heating curve, is implemented in a substation-control system, which adjusts the PRV (Figure 2). A proper control of the PRV requires minimal disposal pressure. Each excess pressure is recovered by the ERPR in the form of electrical active power (Equation (1)).
To maximize the energy production, two system-regulation modes can be used. As presented in Reference [19], better features (wider range of operating conditions) are obtained using the hydraulic regulation mode, which is realized by a series–parallel combination of PAT and PRV. However, this regulation mode requires two regulated PRVs and a modification to the substation’s control system.
By applying the electrical regulation (ER) mode [20], the ERPR can be added in series to the existing PRV as an independent device without any modifications to the control system (Figure 2). The system modification concerns only the ERPR bypass, which is required for a safe operation. In case of a situation where the differential excess pressure of the substation exceeds the operation range of the ERPR, or the ERPR breaks, the PRV takes over the pressure control. The ER enables the variable speed operation method. Therefore, the characteristic PAT curves are modified by changing the turbine speed to match the load conditions (instant flow rate and differential pressure). The low costs of the electromechanical components and engineering can shorten the payback period of this system. Furthermore, the installation process is simple, and does not require modifications to the existing control system. Therefore, this solution is proposed in this paper.
The ERPR should be carefully designed regarding the variability of the hydraulic conditions of the specific substation to maximize the average efficiency, which corresponds to the system capability [19]. This implies that the ranges of the most frequently occurring flow rates and differential excess pressures have to be covered by the PAT curves of the highest efficiency.
2.3. ERPR Unit
To reduce costs, the ERPR unit was based on the PAT. The turbine was connected to the PMSG, which has a higher and more stable efficiency under load variation than an induction machine. The regulation process (control of turbine speed) was performed by a full-scale PEU. The PEU matches the parameters of the electrical energy generated by the PMSG to the power system requirements. This enabled an on-grid operation [30]. The structure of the proposed ERPR is presented in Figure 3.
The ERPR controller measures the actual inlet and outlet pressure, as well as the flow rate. Different ERPR control targets are possible. It can regulate one of the hydraulic parameters (pressure drop, outlet pressure, or flow rate), maximal electrical power, or maximal efficiency. Furthermore, by integrating the ERPR into the substation control system, the water temperature of the secondary loop can be adjusted. However, it should be noted that the main function of the ERPR is the maximization of the energy recovery. Considering the limited operation range of the PAT, the substation control should be performed by the PRV. Thus, the control mode that provides maximal electrical active power and keeps the differential pressure higher or equal to the minimal disposal value seems to be the most appropriate.
Nowadays, there are many PEU solutions on the market that can be used for the proposed ERPR. The most popular are the two types presented in Figure 4.
The first system presented in Figure 4a consists of a diode bridge rectifier (AC/DC), a circuit that raises the DC voltage (DC/DC booster), and a PWM (pulse width modulation) inverter controlled by the DPC-SVM (direct power control with space vector modulation) algorithm [31,32]. The second type, shown in Figure 4b, employs a PWM rectifier (also called the sinusoidal rectifier) instead of a diode rectifier and a DC/DC booster.
The generator load can be controlled with the current limits and of the PEU. The current limit changes allow for the modification of the regulation curves as a function of rotational speed [33,34]. This is presented in Figure 5.
The current limit of the inverter () corresponds to the electrical active power of the PEU assuming a constant grid voltage and no reactive power. Furthermore, after neglecting the power losses of the PEU, it can be stated that controls the generator’s active power (Figure 5a). The second control parameter is proportional to the generator current, and in the case of a PMSG, it corresponds to the generator torque (Figure 5b).
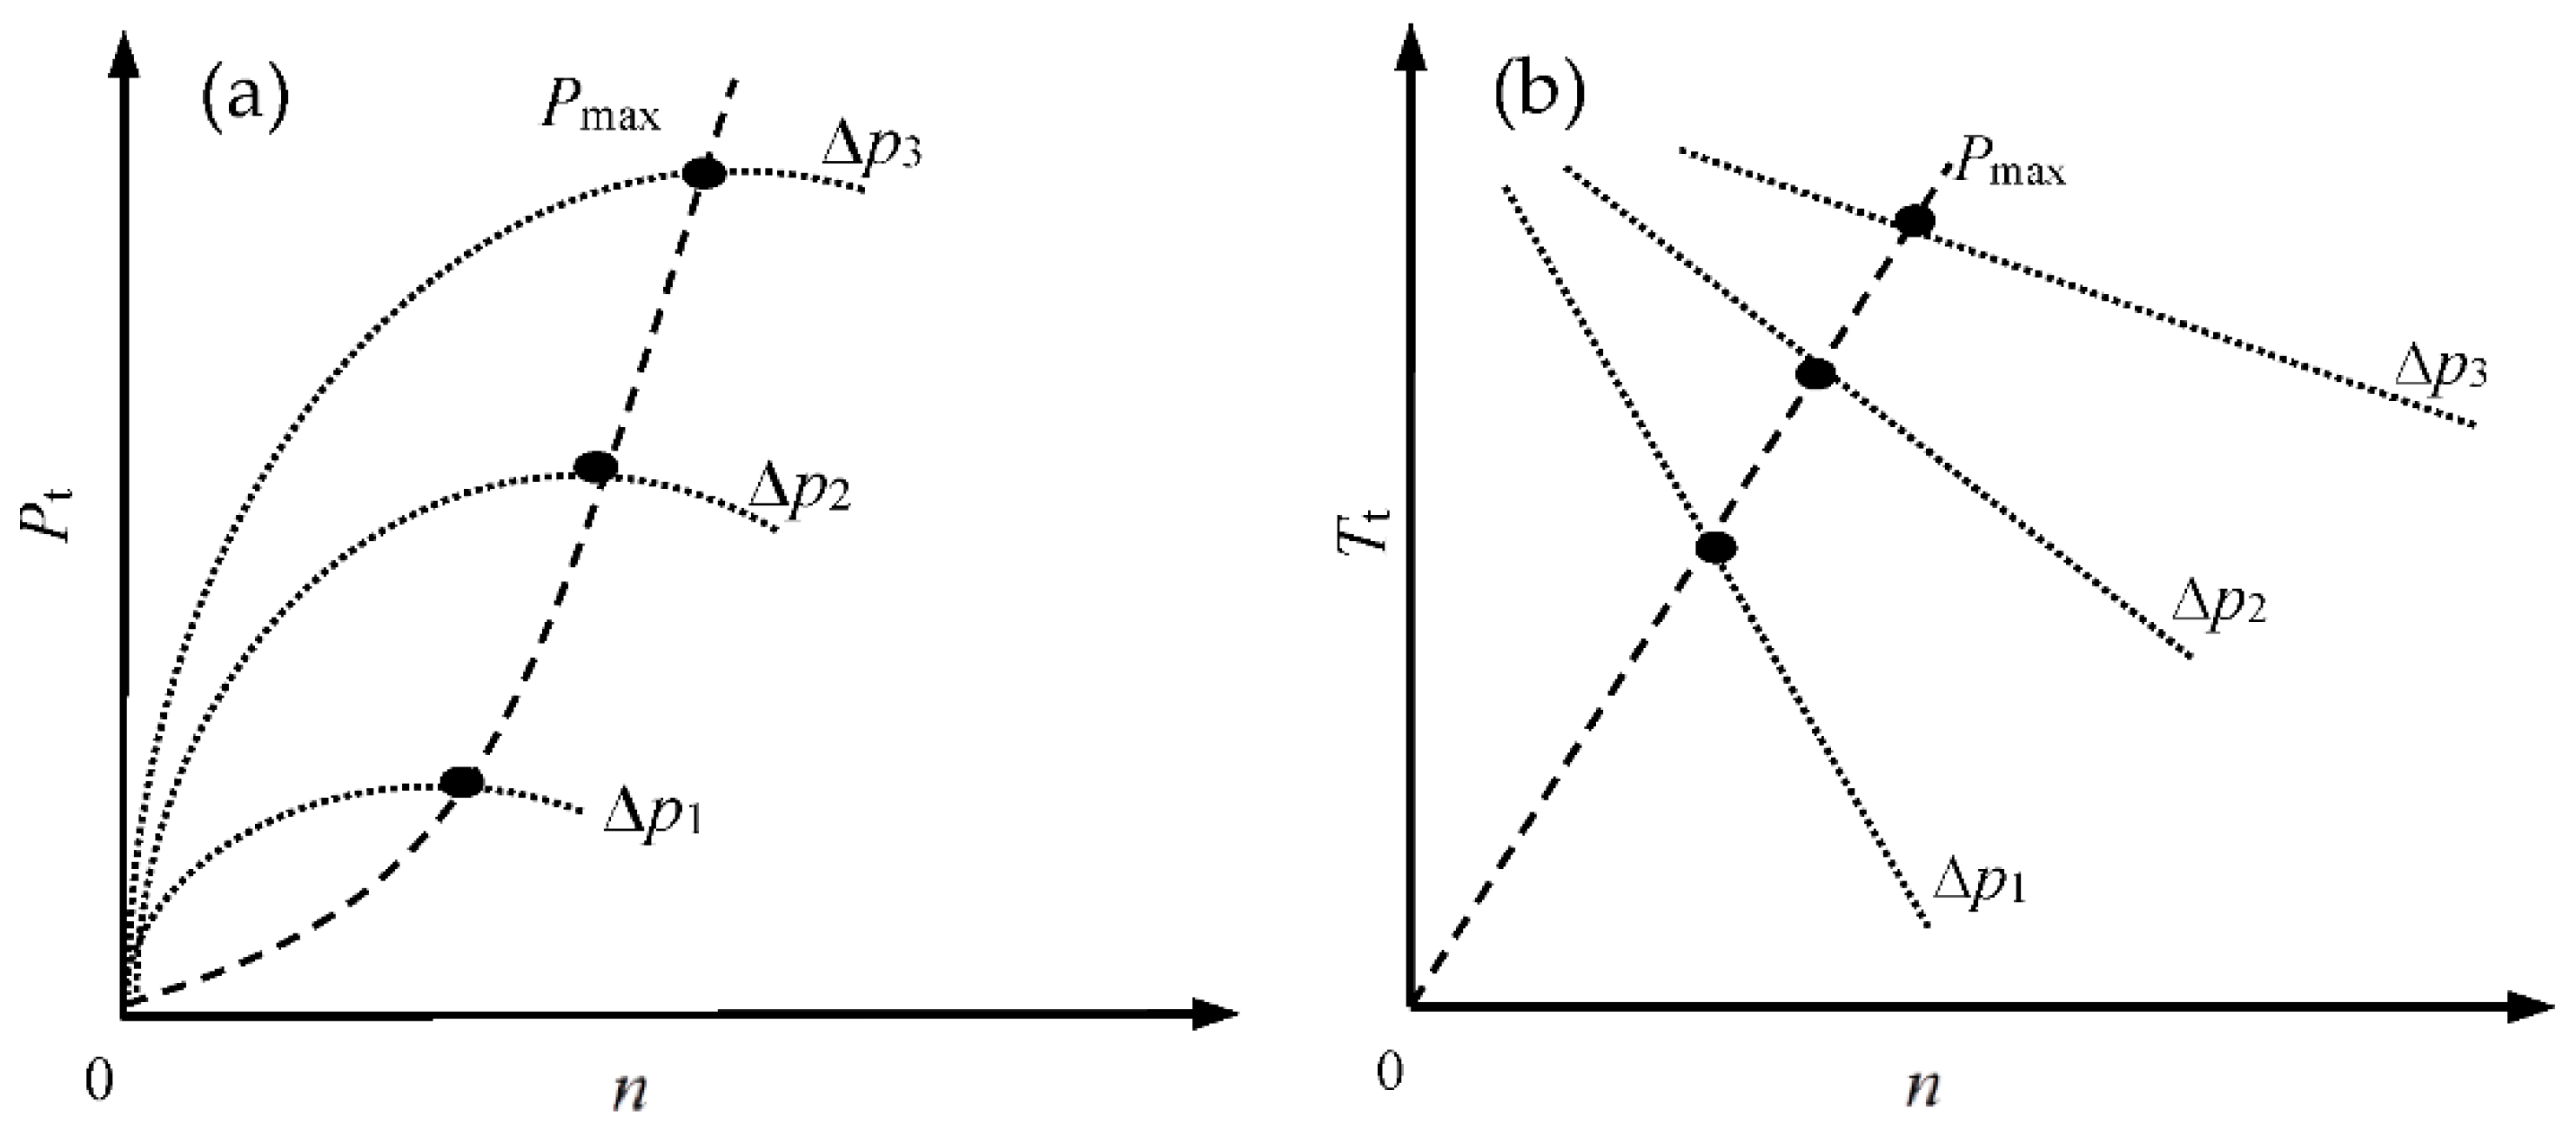
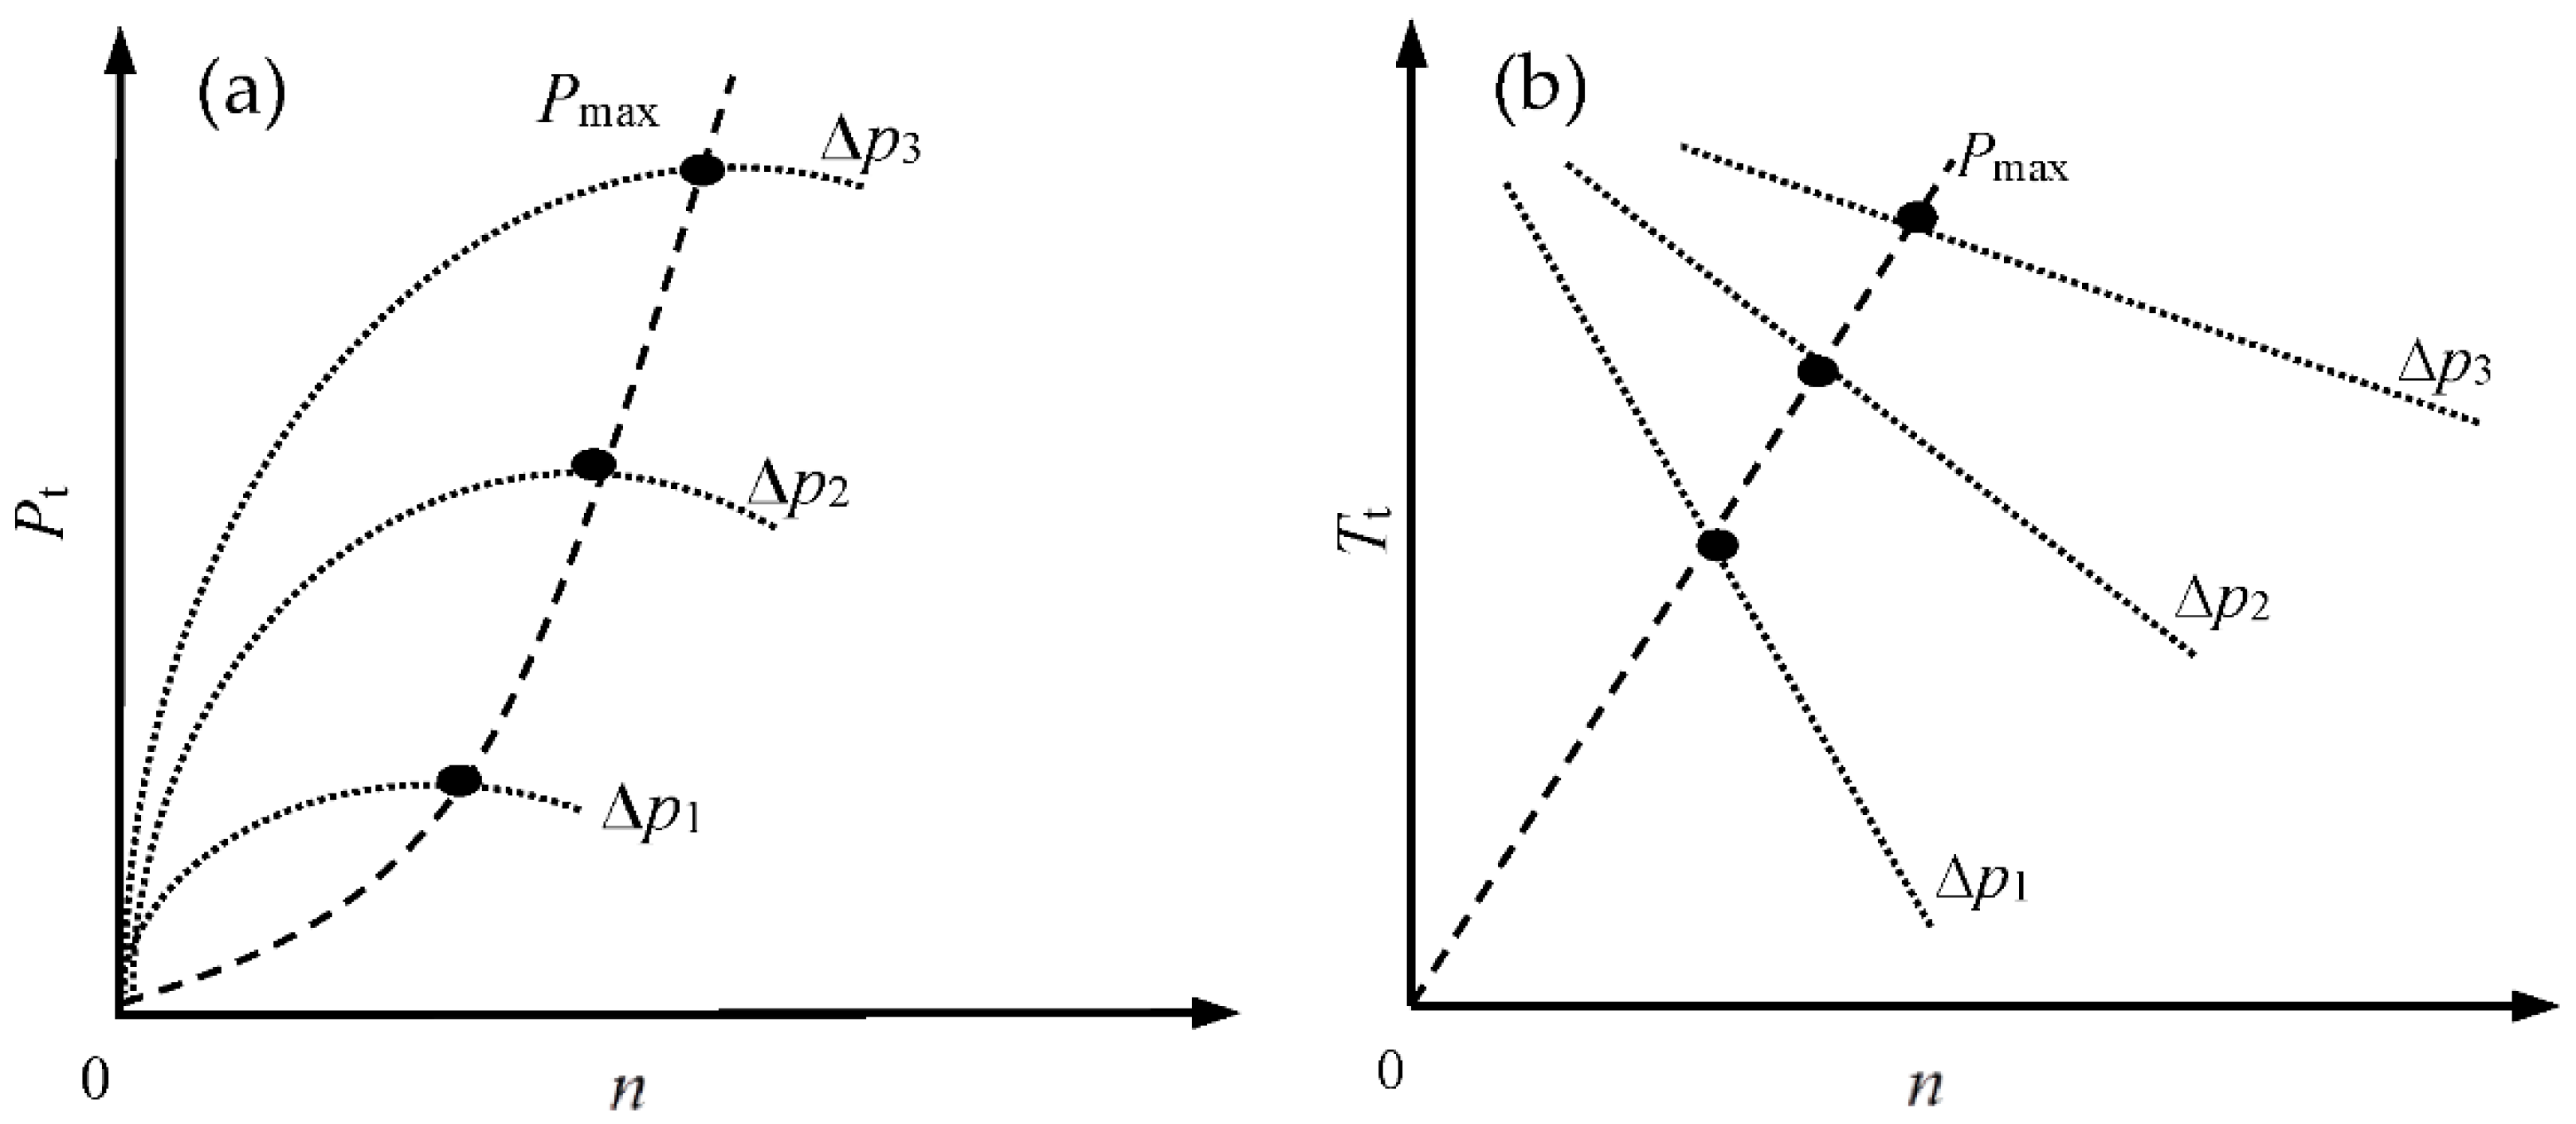
The selection of the control parameter must be done by considering the shape of the turbine curves. Examples of curves for different values of reduced pressure in the speed domain are presented in Figure 6. It can be noticed that under some conditions the PEU and PAT torque curves can be parallel to each other. This situation may result in speed oscillations and even in an unstable control. Therefore, the ERPR control should be performed at the limit. The presented figures also contain the optimal operation curve that provides the maximal turbine power and, therefore, the control target.
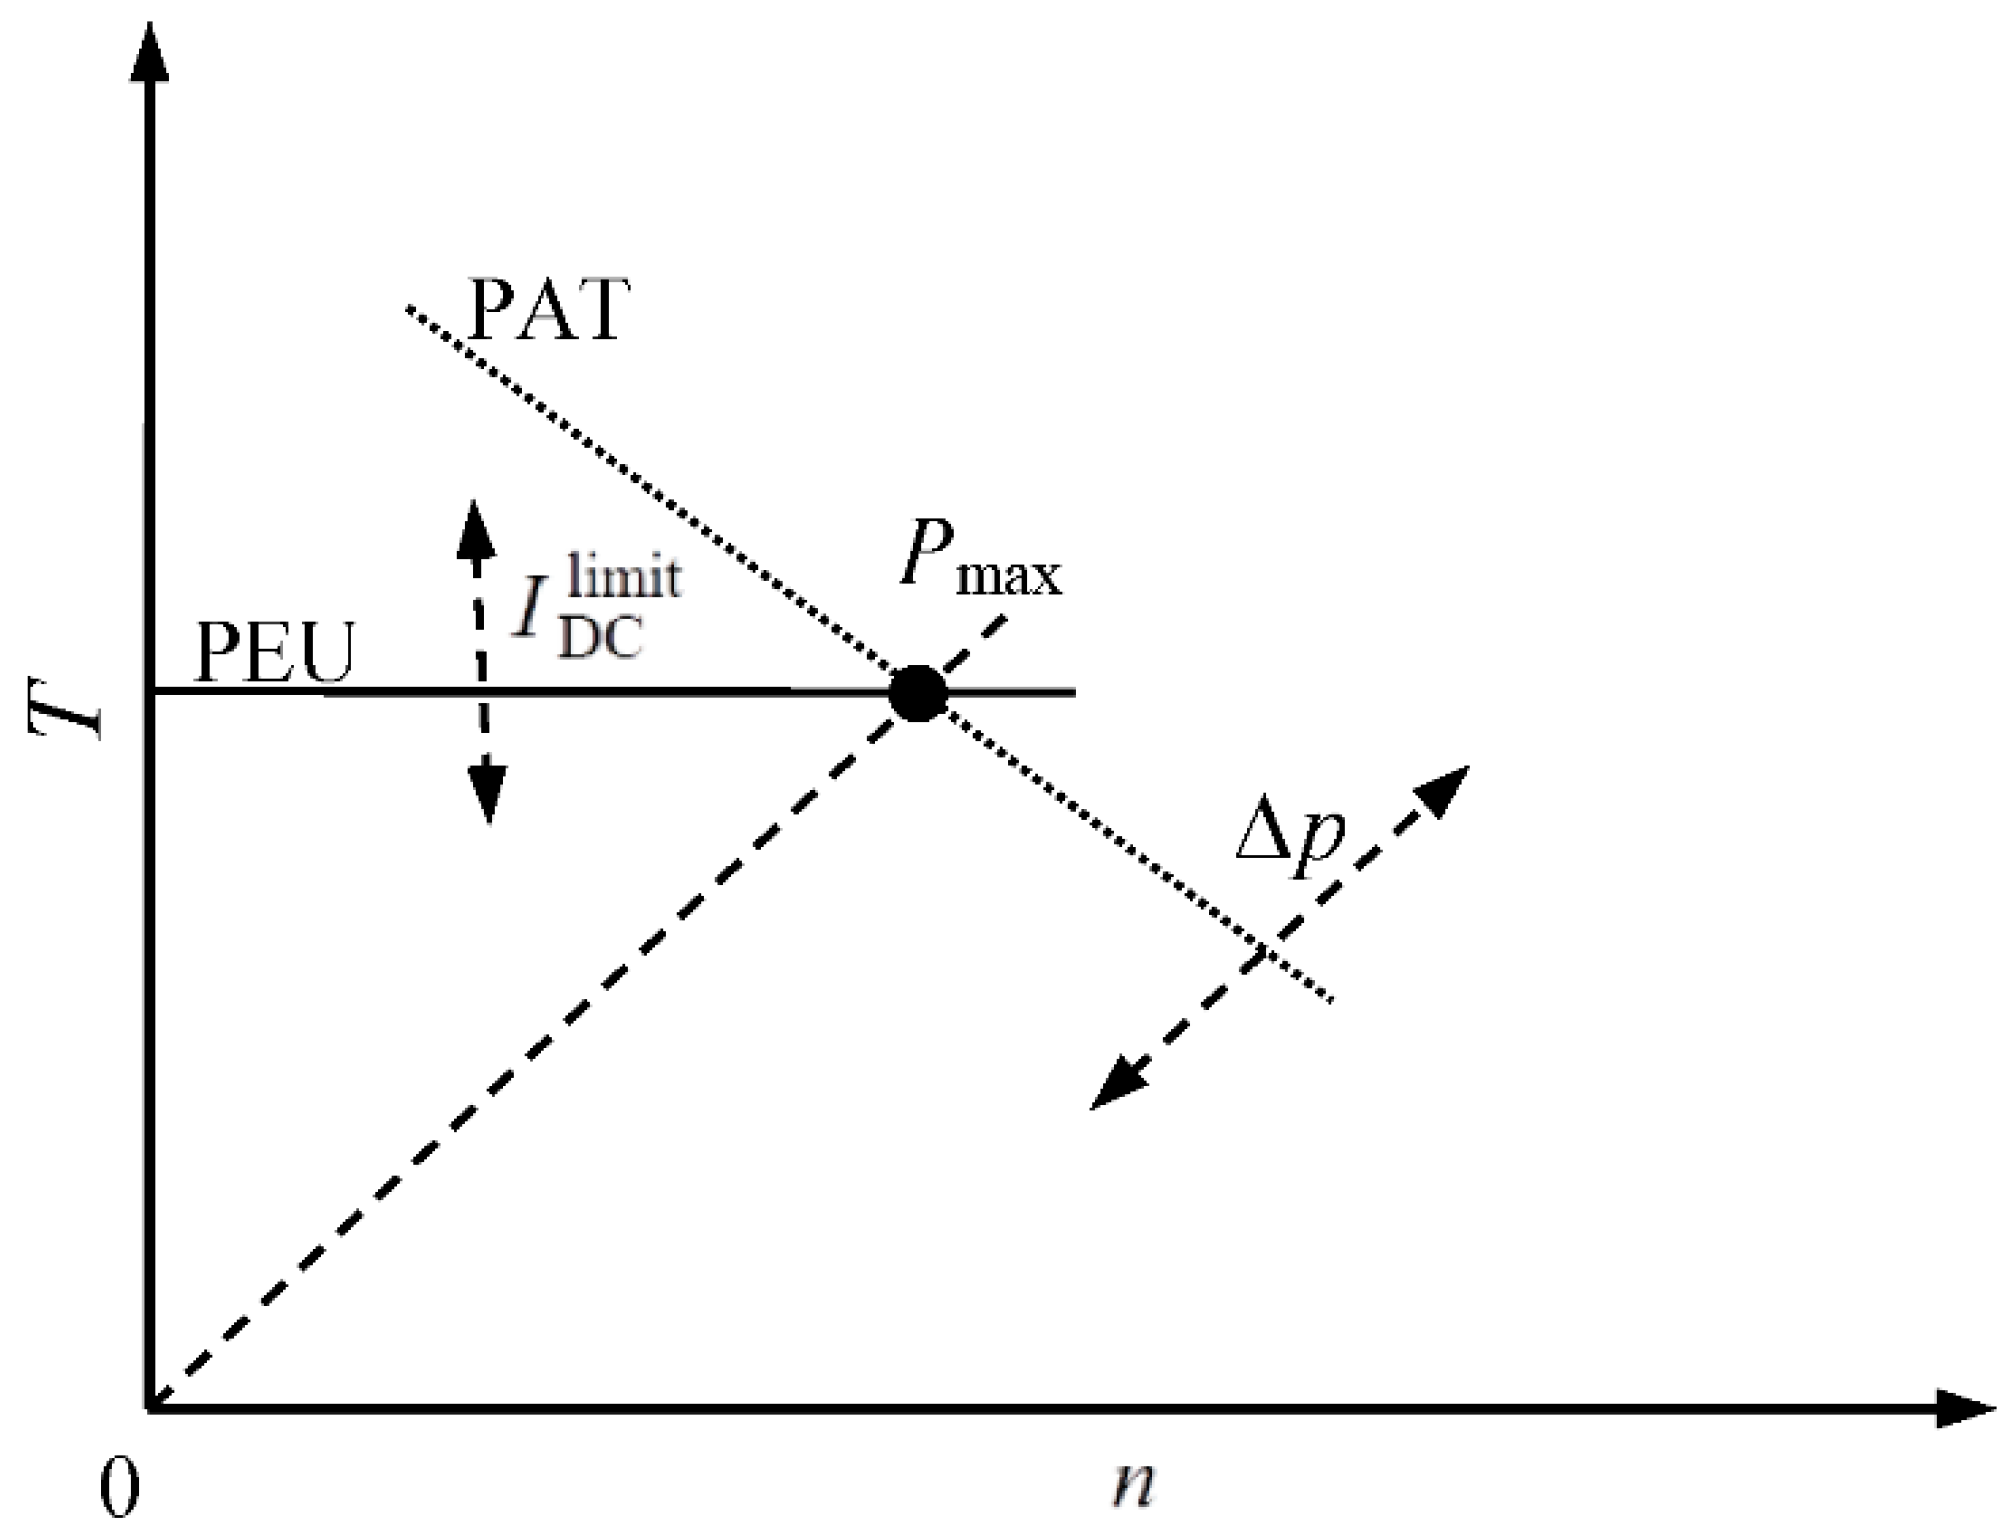
The speed value, located at the cross point of the PEU and PAT torque characteristics, is set by for a specific reduced pressure, as presented in Figure 7. The main function of the ERPR controller is to adjust the turbine speed according to the set reduced pressure to provide the maximal electrical active power of the PEU. According to the chosen control mode, the reduced pressure is equal to the actual differential excess pressure of the substation.
3. ERPR Prototype and Steady-State Characteristics
The ERPR prototype was installed in a DHS substation that contained a heat exchanger of 1.8 MW thermal power, and had a nominal flow rate of 0.0064 m3/s and an available differential disposal pressure of 0.7 MPa. The chosen turbine was a three-stage vertical PAT with a nominal flow rate of 0.0058 m3/s and a reduced pressure of 0.5 MPa (H = 53.2 m). The PAT was connected through box-coupling to the PMSG with a synchronous speed of 3000 rpm. The PEU of 5.5 kW contained the two optional rectifier types (diode bridge rectifier with DC/DC booster and sinusoidal PWM rectifier), as presented in Figure 4. The rated values and nominal parameters are listed in the Appendix A (Table A1). The ERPR prototype installed in the substation of the Cracow DHS is shown in Figure 8. All measurements were performed according to the ISO 9906 standard (grade 2B) [35]. The test installation was equipped with additional valves allowing for the control of the substation input pressure.
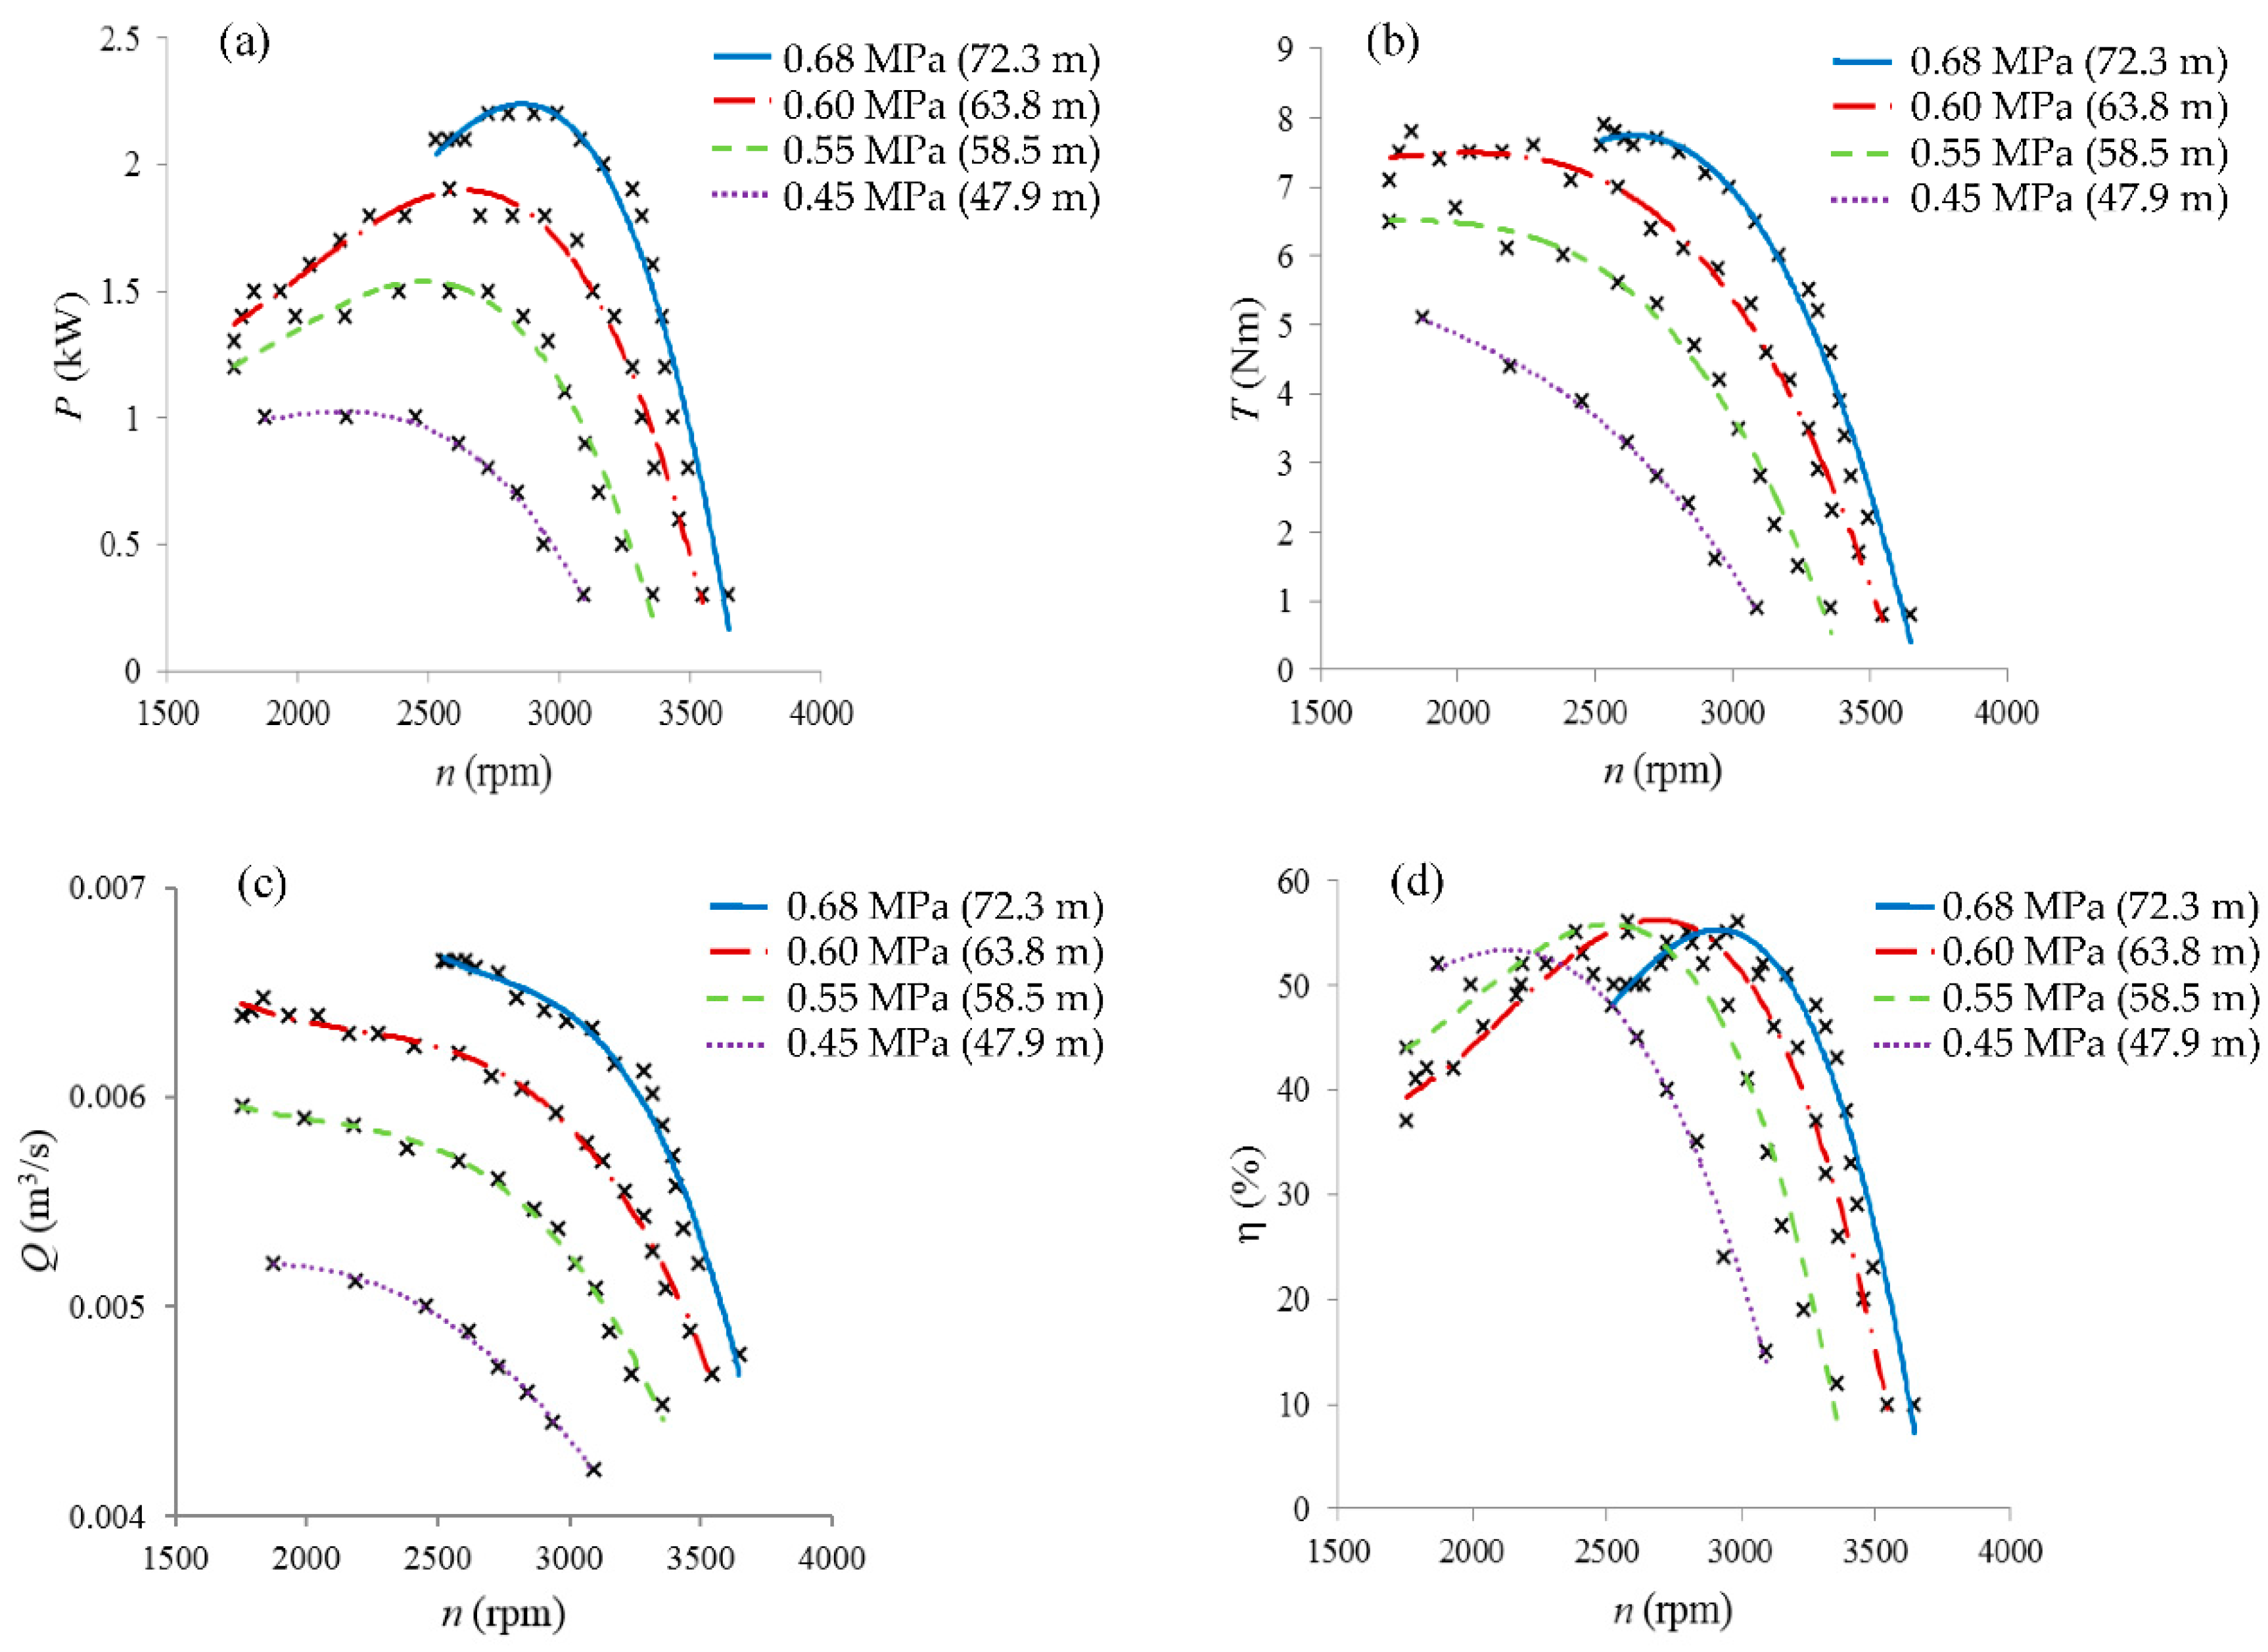
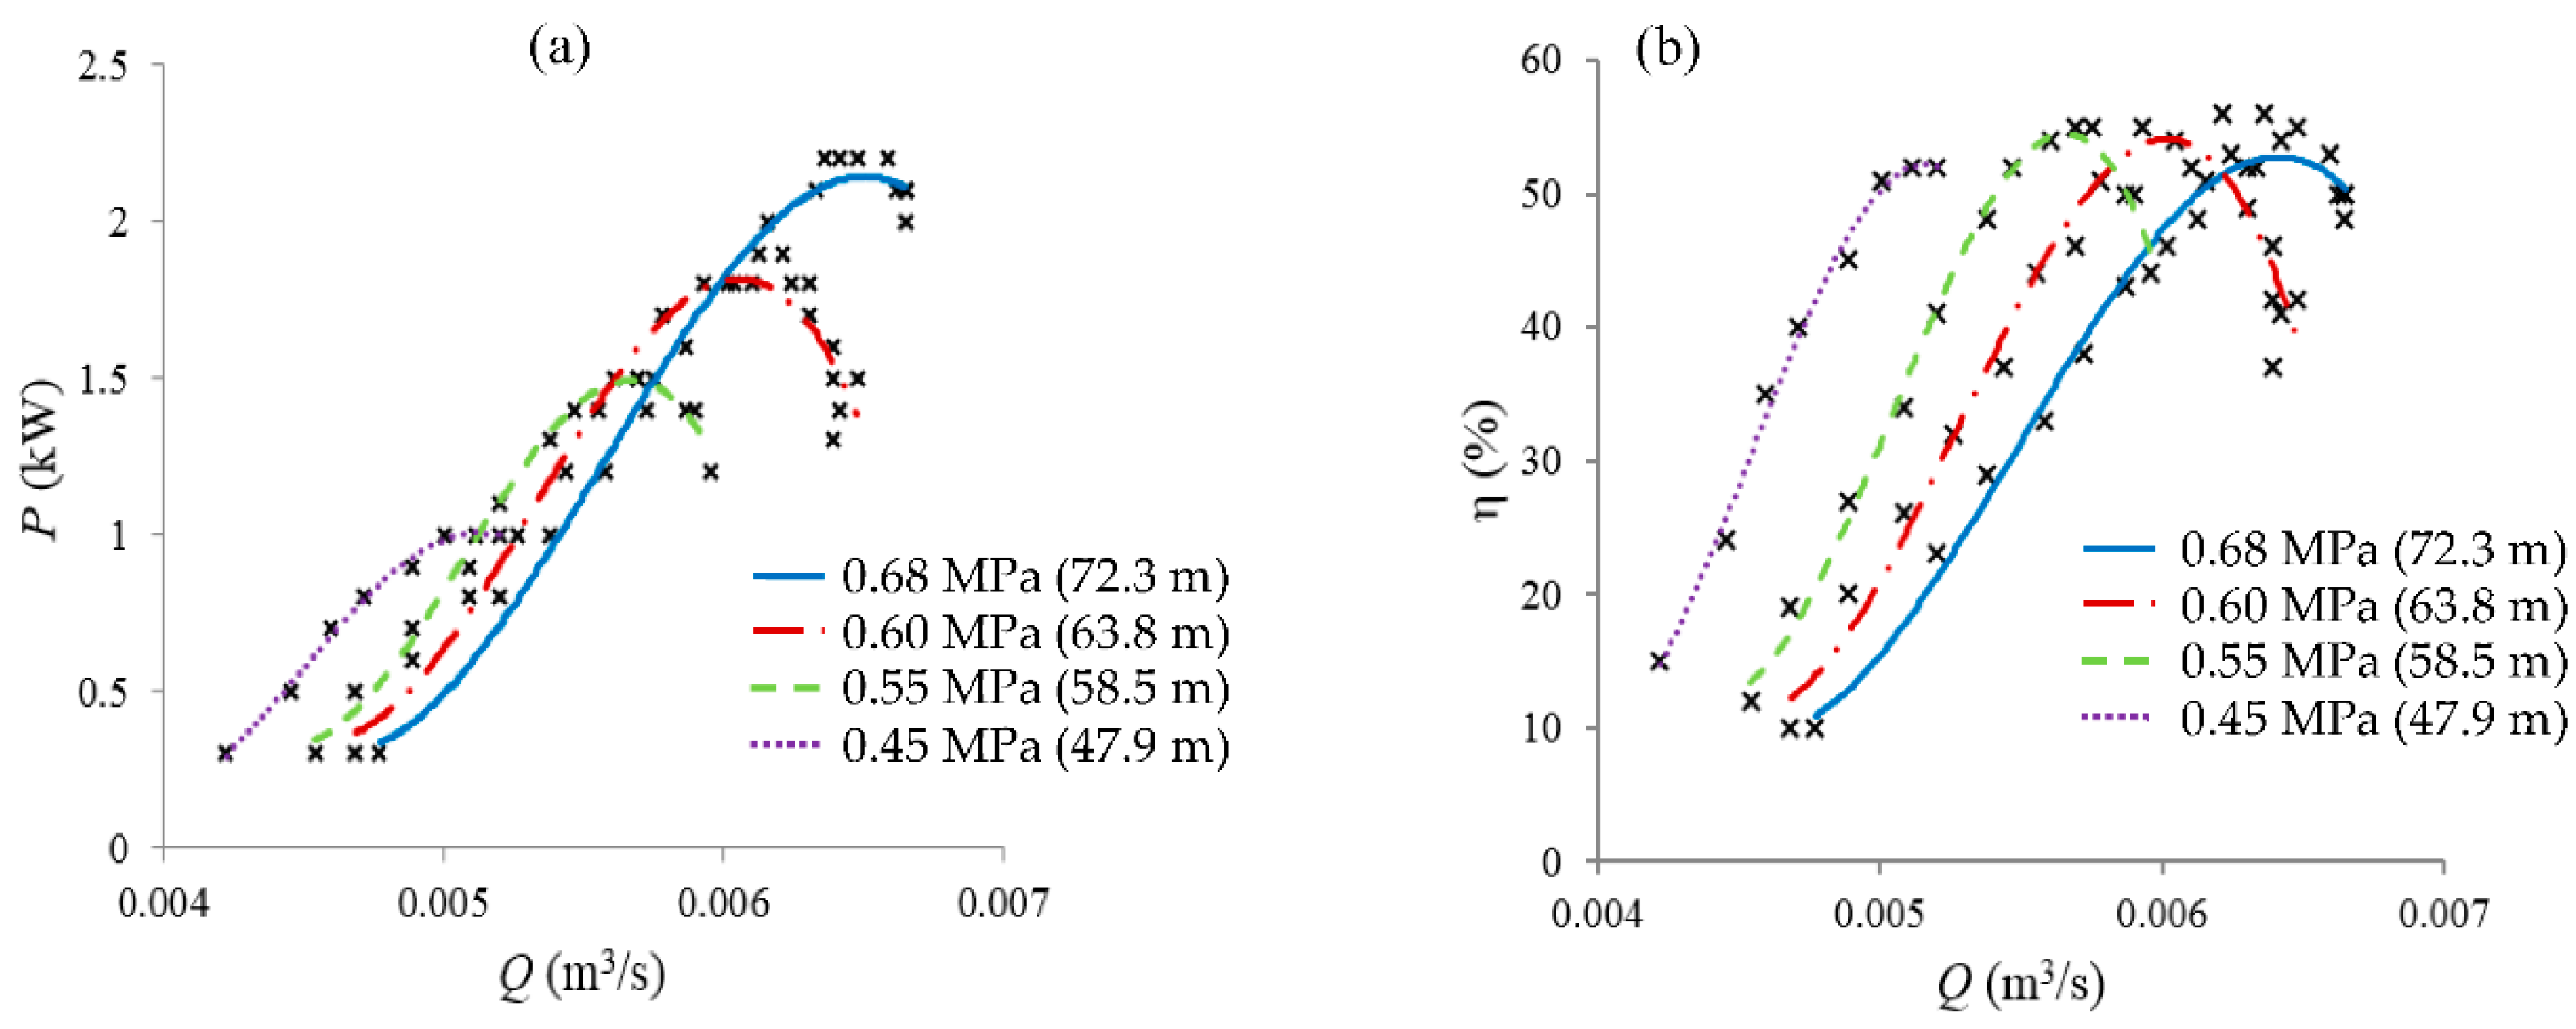
The ERPR performance was identified by the steady-state characteristics of the PEU active power (Figure 9a), estimated turbine torque (neglecting PMSG and PEU efficiency) (Figure 9b), and flow rate (Figure 9c) under four different values of reduced pressure (0.45, 0.55, 0.6, and 0.68 MPa). Additionally, the total ERPR efficiency was calculated (Equation (1)) and shown in Figure 9d. Figure 10 presents the electrical energy production and total efficiency in the flow-rate domain. The measurement points are marked by crosses.
To estimate the ERPR’s operation range under different working conditions of the substation, Figure 11 is presented. It shows the speed-regulation characteristics of the ERPR in the reduced pressure–flow-rate domain with isolines of constant efficiency. The presented measurement results enabled an estimation of the operation range and capability of the ERPR prototype. The useful operation area lies between 80% and 140% of the nominal reduced pressure and between 85% and 120% of the nominal flow rate. Considering the maximal power-control mode, the turbine speed should be adjusted according to the differential excess disposal pressure (equals the reduced pressure) variation (optimal curve marked with black bold line). This operation leads to a total ERPR efficiency of more than 50%.
4. Operation Features
4.1. ERPR Impact Analysis
The ERPR device was installed between a hydraulic system and an electrical power system. Thus, the negative influence of the ERPR on these systems needed to be analyzed. Additionally, the influence on the environment (sound measurements) needed to be estimated.
The prototype PEU contained two optional rectifiers, as described in Section 2.3. These two most popular structures differed in price, control complexity, and signal quality of the generator. The bad quality of electrical signals may have induced additional noise and vibrations of the ERPR during operation. This issue was investigated in this section by analyzing the quality of the generator’s electrical signals, sound, and ERPR vibrations.
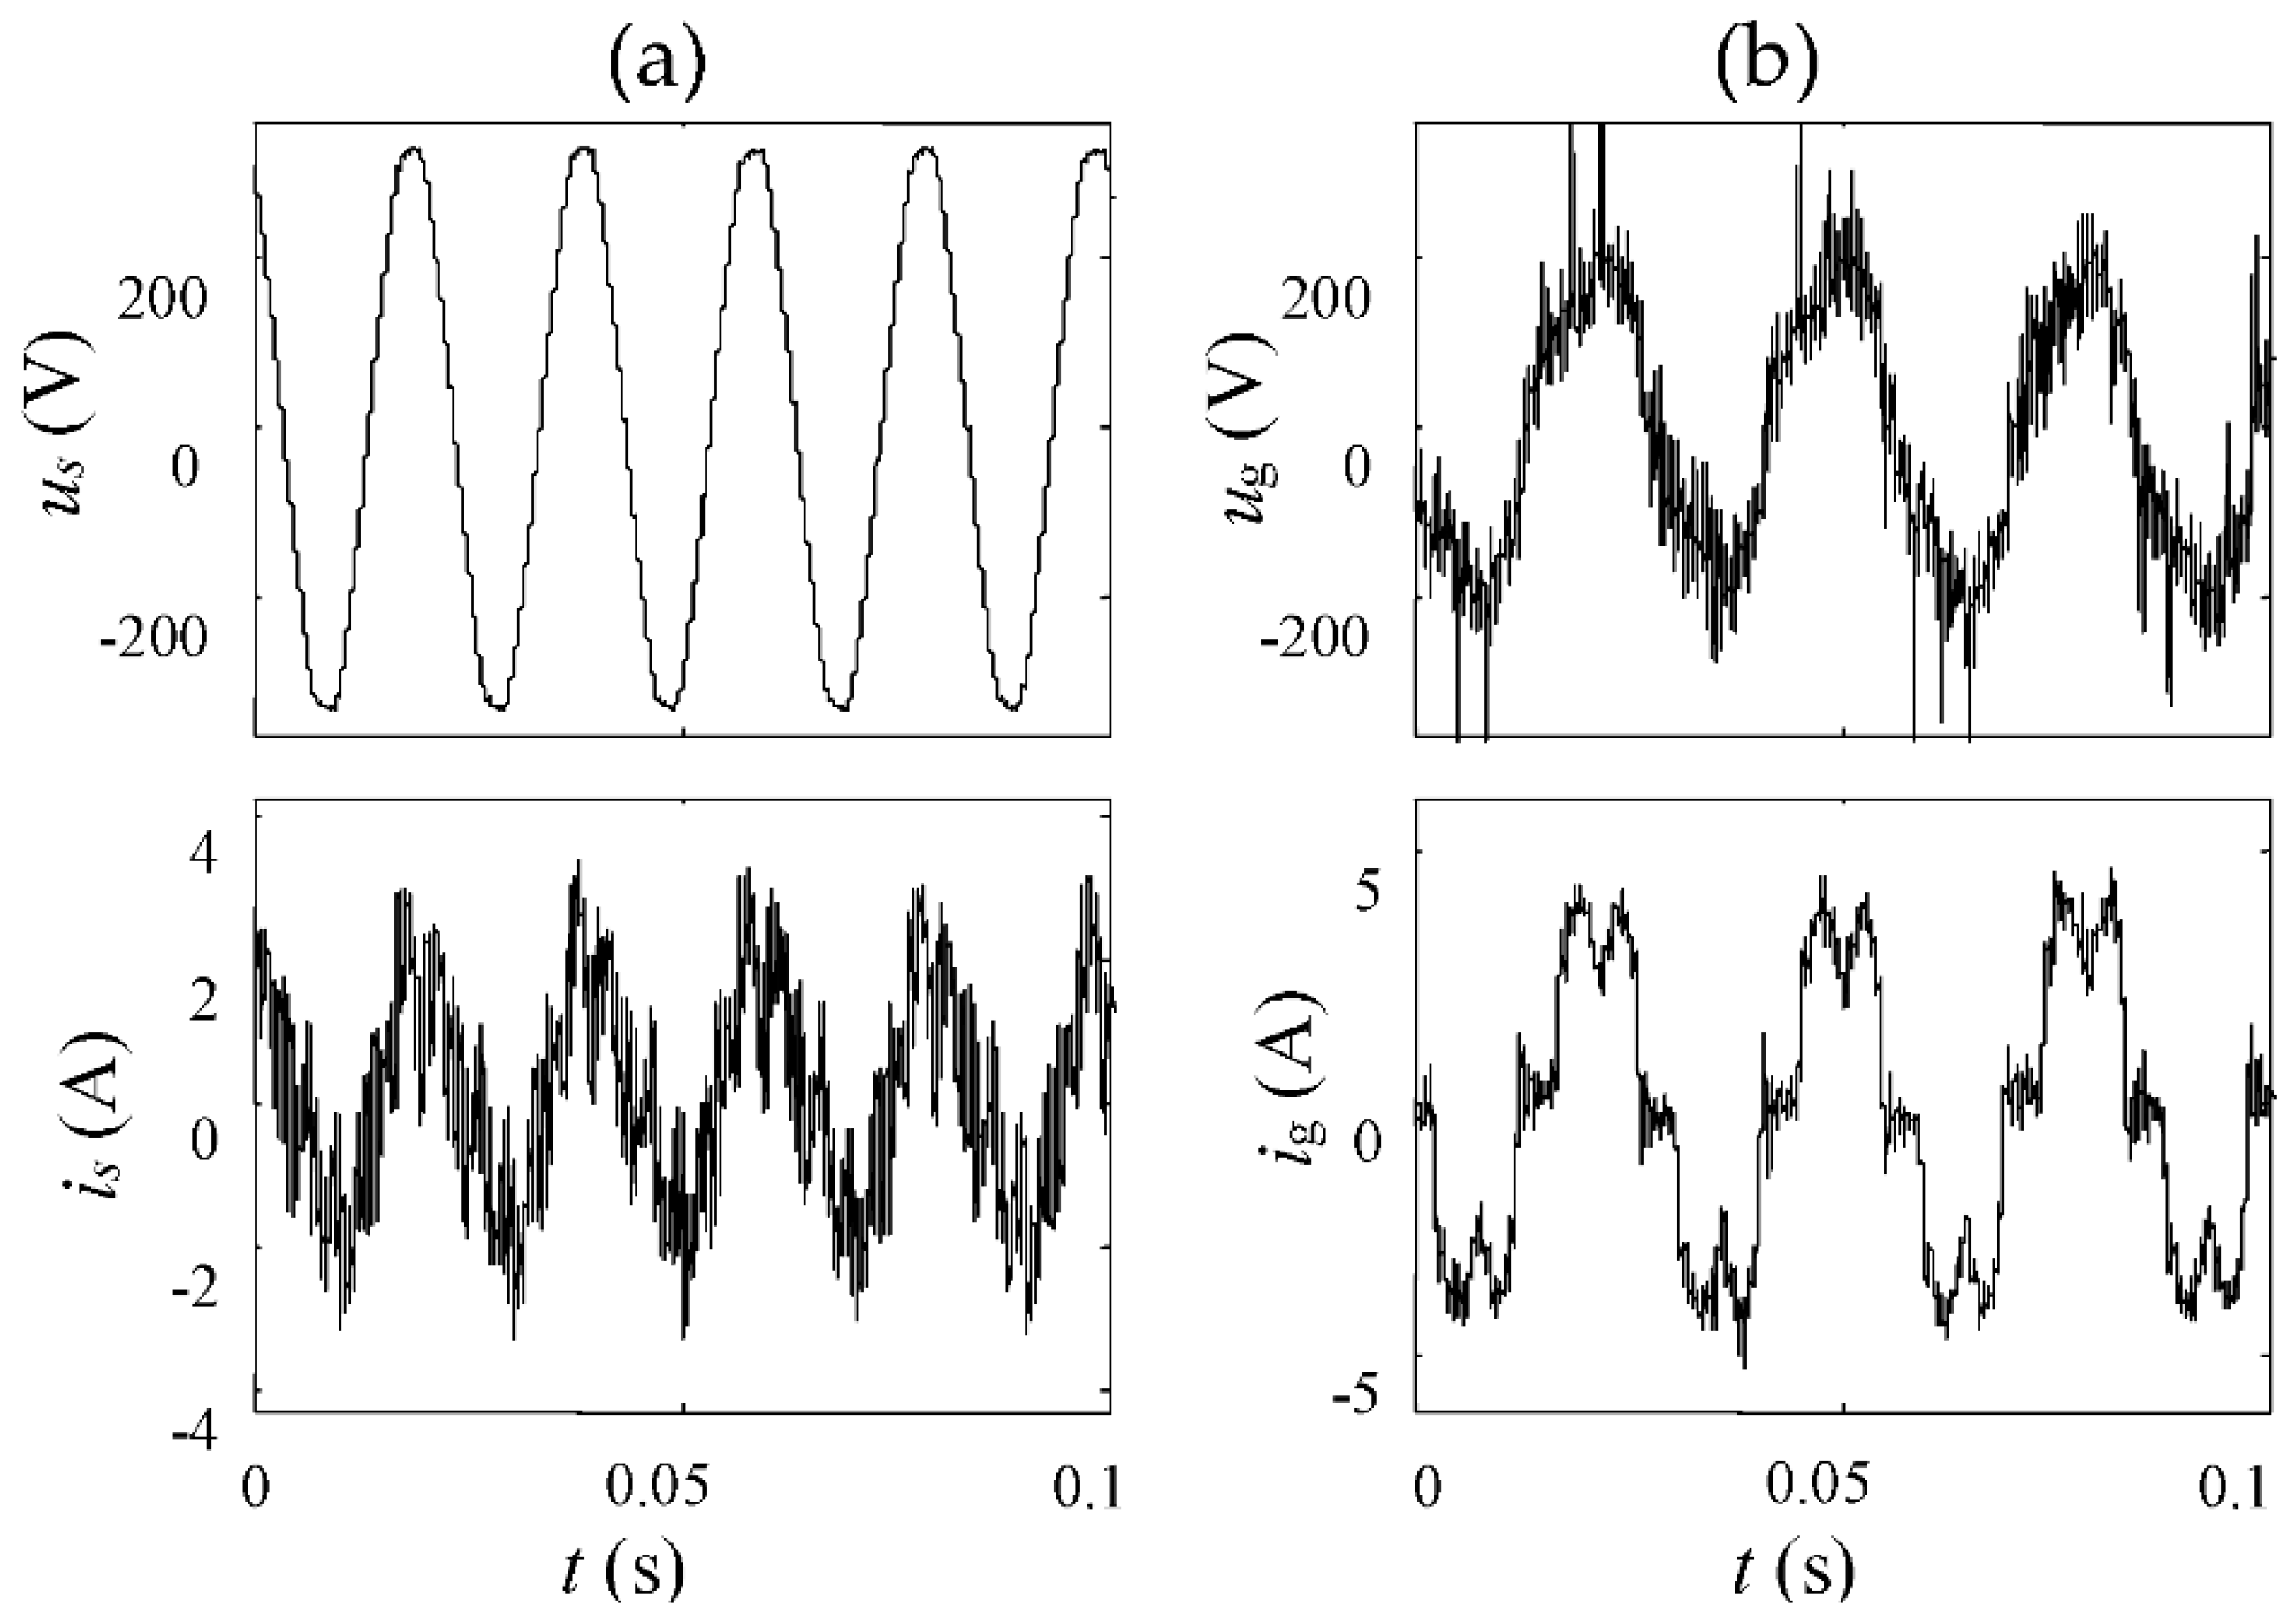
The curves of the generator’s and PEU’s electrical signals (voltage and current) over time are presented below. Figure 12 presents the results of the PEU with a diode bridge rectifier (Figure 4a), whereas Figure 13 presents those of the system with a sinusoidal rectifier (Figure 4b). The presented measurements were performed under similar electrical generator conditions (1 kW power and 2100 rpm). In order to evaluate the higher harmonics, an FFT (Fast Fourier Transform) analysis was performed. As expected, the generator current for the case of the sinusoidal rectifier contained fewer higher harmonics in the range below 1 kHz. Furthermore, the harmonics’ amplitudes were about 10 dB lower (with a reference level of 10−3 A) compared to those of the diode bridge rectifier’s system. The additional drawbacks of the diode rectifier were the voltage spikes during the commutation process and the angle shift between the generator voltage and current that results in reactive power. The latter increased the generator current. Therefore, the active power needed to be limited. To estimate the impact of the PEU on the electrical power system, the total harmonic distortion parameter (THD) of the PEU output voltage needed to be analyzed. For both system types, the voltage quality (THDU ≈ 1.5%) fulfils the standard requirements [36].
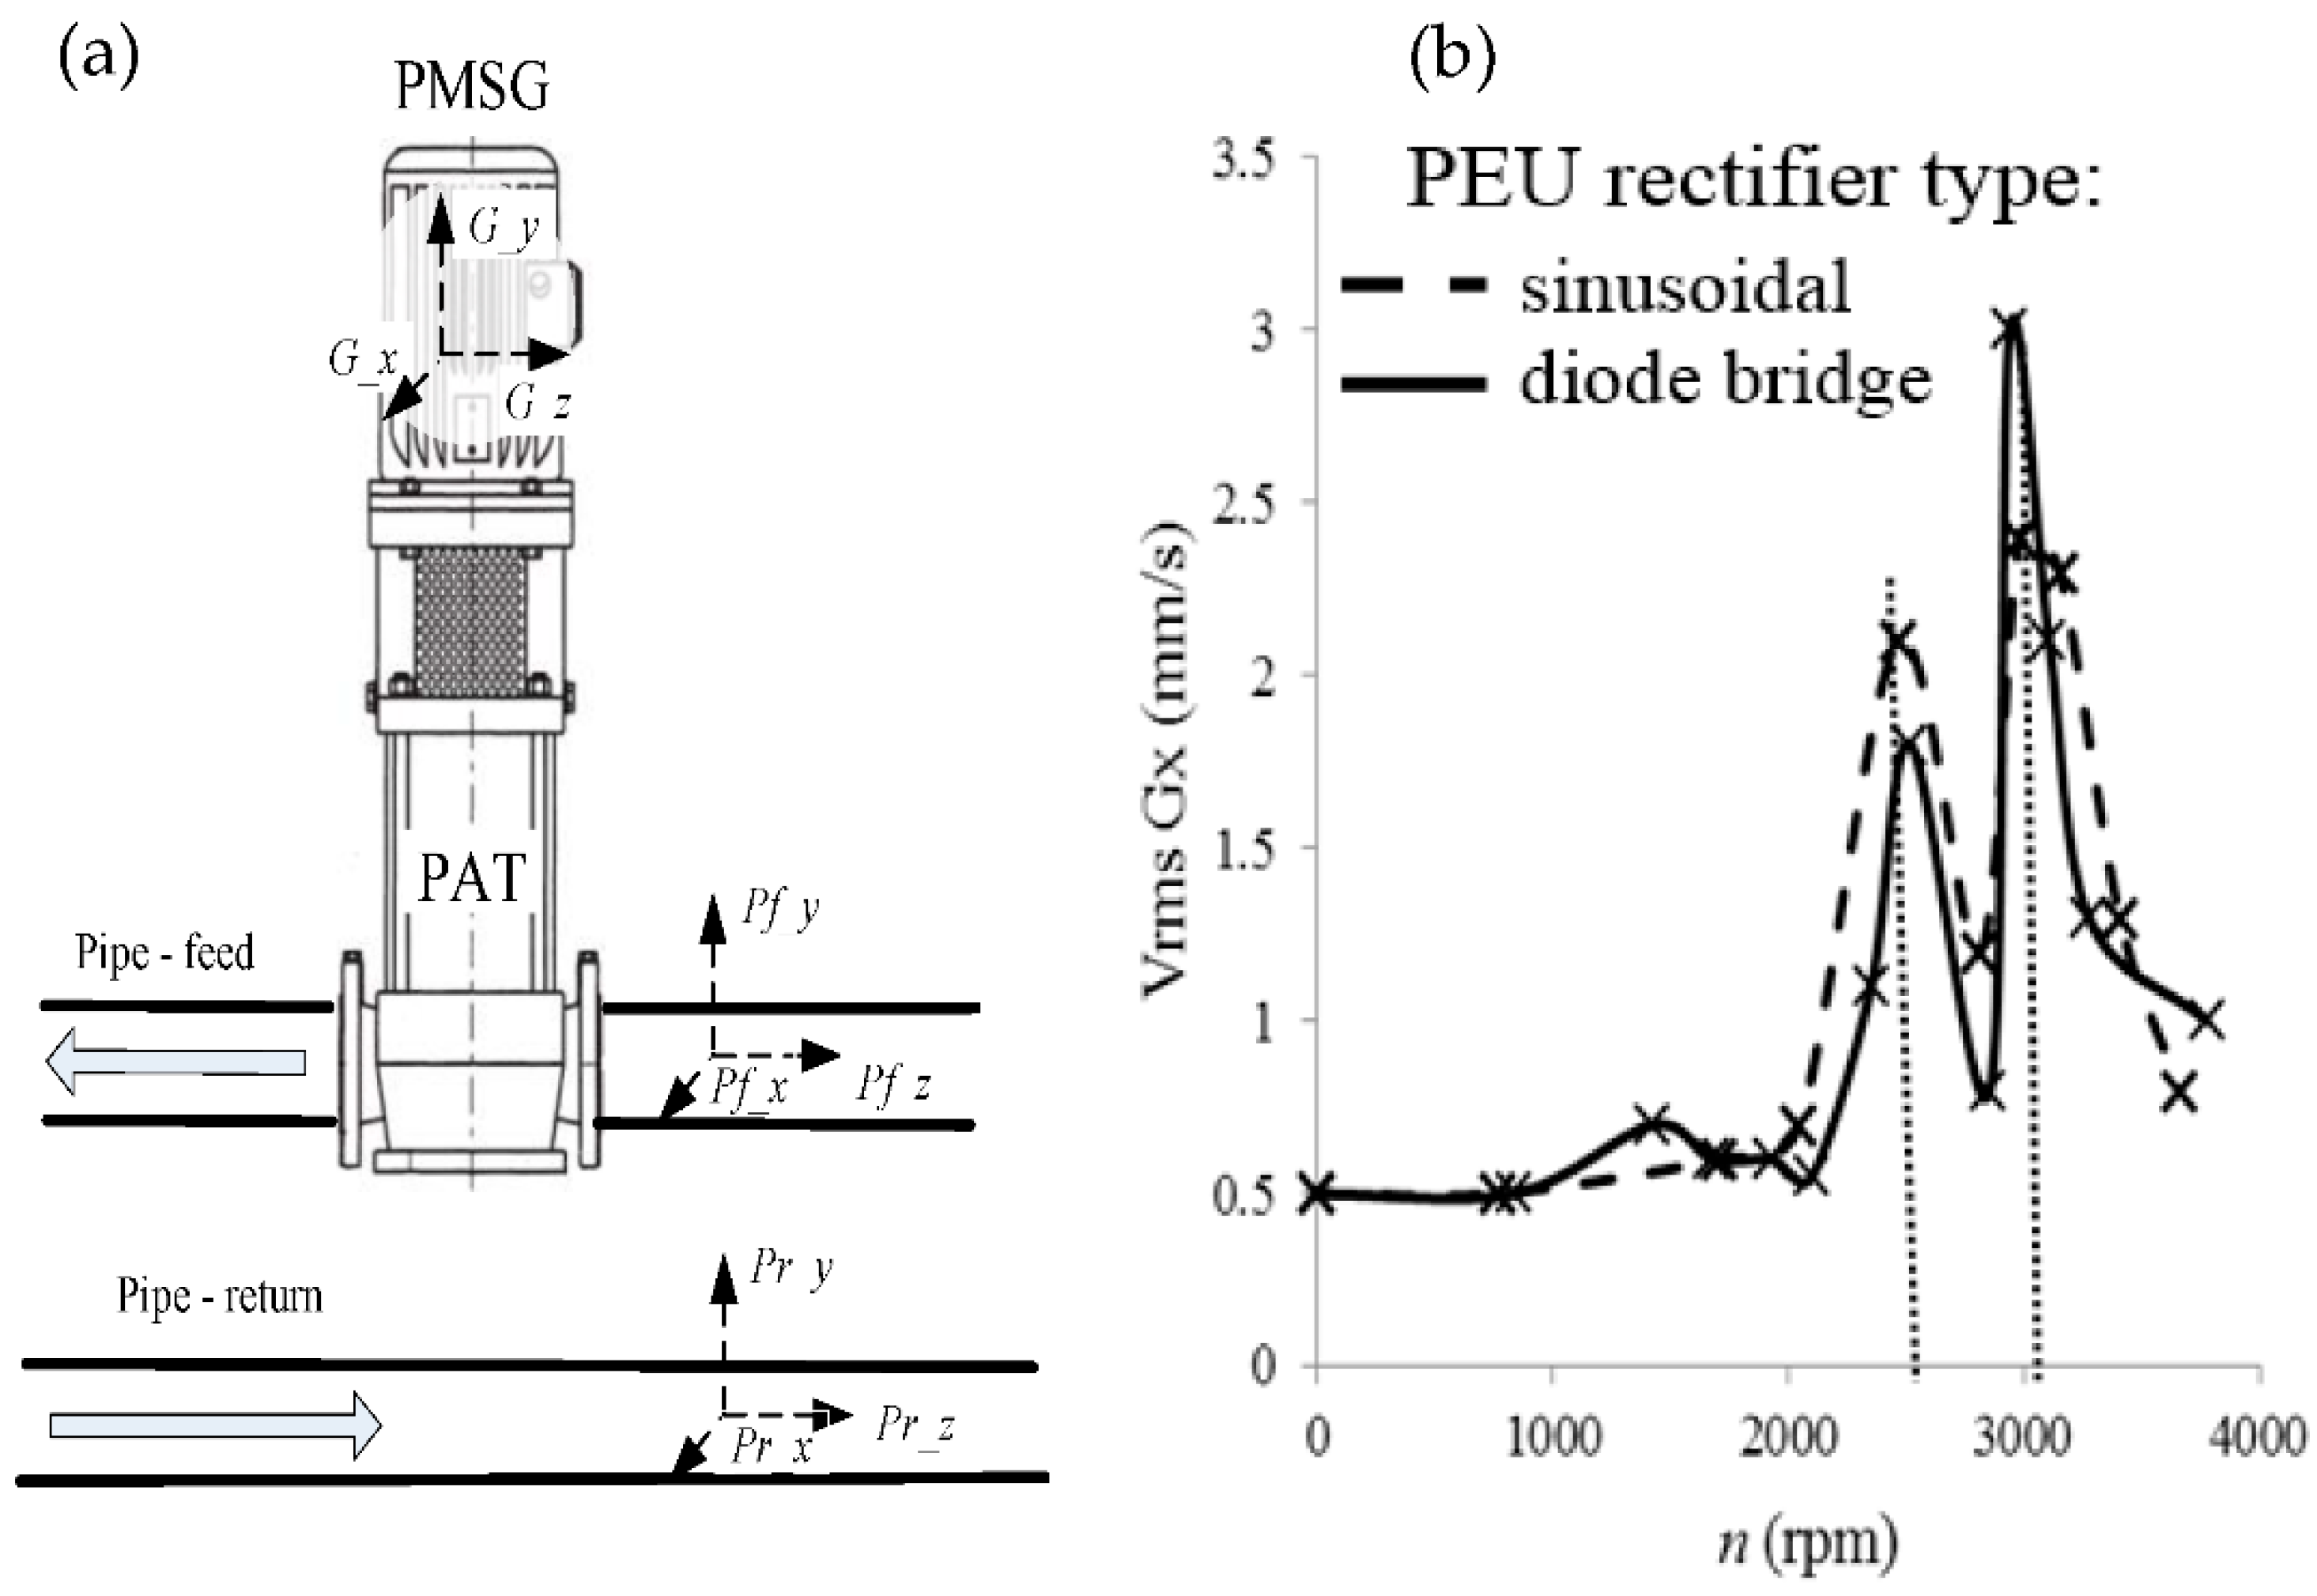
To estimate the influence of the generator current distortion on the vibrations of the ERPR and hydraulic pipes, the measurements of the vibration velocity in three directions were analyzed. Three measurement points located at the ERPR unit, feed, and return pipes, which are presented in Figure 14a, were selected. Three operating points (2200, 2500, and 2800 rpm) with the best efficiency were analyzed. The dominant vibrations occured in the x- and z-directions for the generator and return pipe. To evaluate the vibration severity, the classification introduced by the ISO 10816-1 standard was used [37]. The ERPR belonged to Class I (up to 15 kW), for which the satisfactory condition is defined in the vibration-velocity range below 2.8 mm/s RMS (root mean square). Values that exceed 7.1 mm/s RMS are defined as unacceptable, and are a danger for the machine. All measurements satisfied the conditions, and the difference in vibration results of the diode bridge rectifier and sinusoidal rectifier was small. However, the substantial increase of the vibration values of the return pipe were visible. This shows that the ERPR vibrations were transmitted with a high magnitude through the feed pipe and heat exchanger to the return pipe.
The ERPR worked at variable speed depending on the substation operating conditions. Therefore, the vibration values in the speed domain needed to be analyzed. Figure 14b presents the vibration velocity of the generator in the x-direction as a function of speed. The two resonant speeds (2500 rpm and 3000 rpm) were visible, and both were within the ERPR regulation area (Figure 11). Thus, they are especially dangerous. The vibration values for the sinusoidal rectifier were about 15% lower than those of the diode bridge rectifier in the second resonance area. Moreover, the resonance vibration for the diode bridge rectifier exceeded the satisfactory level. These phenomena must be considered while designing the mounting technique of the ERPR.
In the presented ERPR prototype, two main noise sources existed. Apart from the ERPR and pipes vibrations, the PEU generated sound resulting from the semiconductor-switching elements that caused higher harmonics in the electrical signals. The measurements performed at a 1 m distance from the device, in accordance with the measurement standard in [38], showed similar noise values for both PEU structures. The noise level increased with load from 65 dB (background noise) to 68 dB under 1.1 kW, and further to 72 dB for the nominal ERPR power. These values fulfil European standards regarding device noise limits [39] and international safety standards for workers exposed to noise [40].
The main common noise source in the DHS is the cavitation phenomenon in the PRV. It occurs when pressure decreases immediately below the vapor pressure directly behind the PRV. One of the methods that minimizes the cavitation risk is reducing the differential pressure over the PRV [41]. The proposed ERPR decreased this pressure to the minimal disposal value in the region before the PRV. Thus, it prevented cavitation. An implementation of the ERPR enabled an exact sizing of the PRV, improving control conditions, and prolonging the service life of the control equipment.
4.2. Operation Analysis during Annual Heating Season
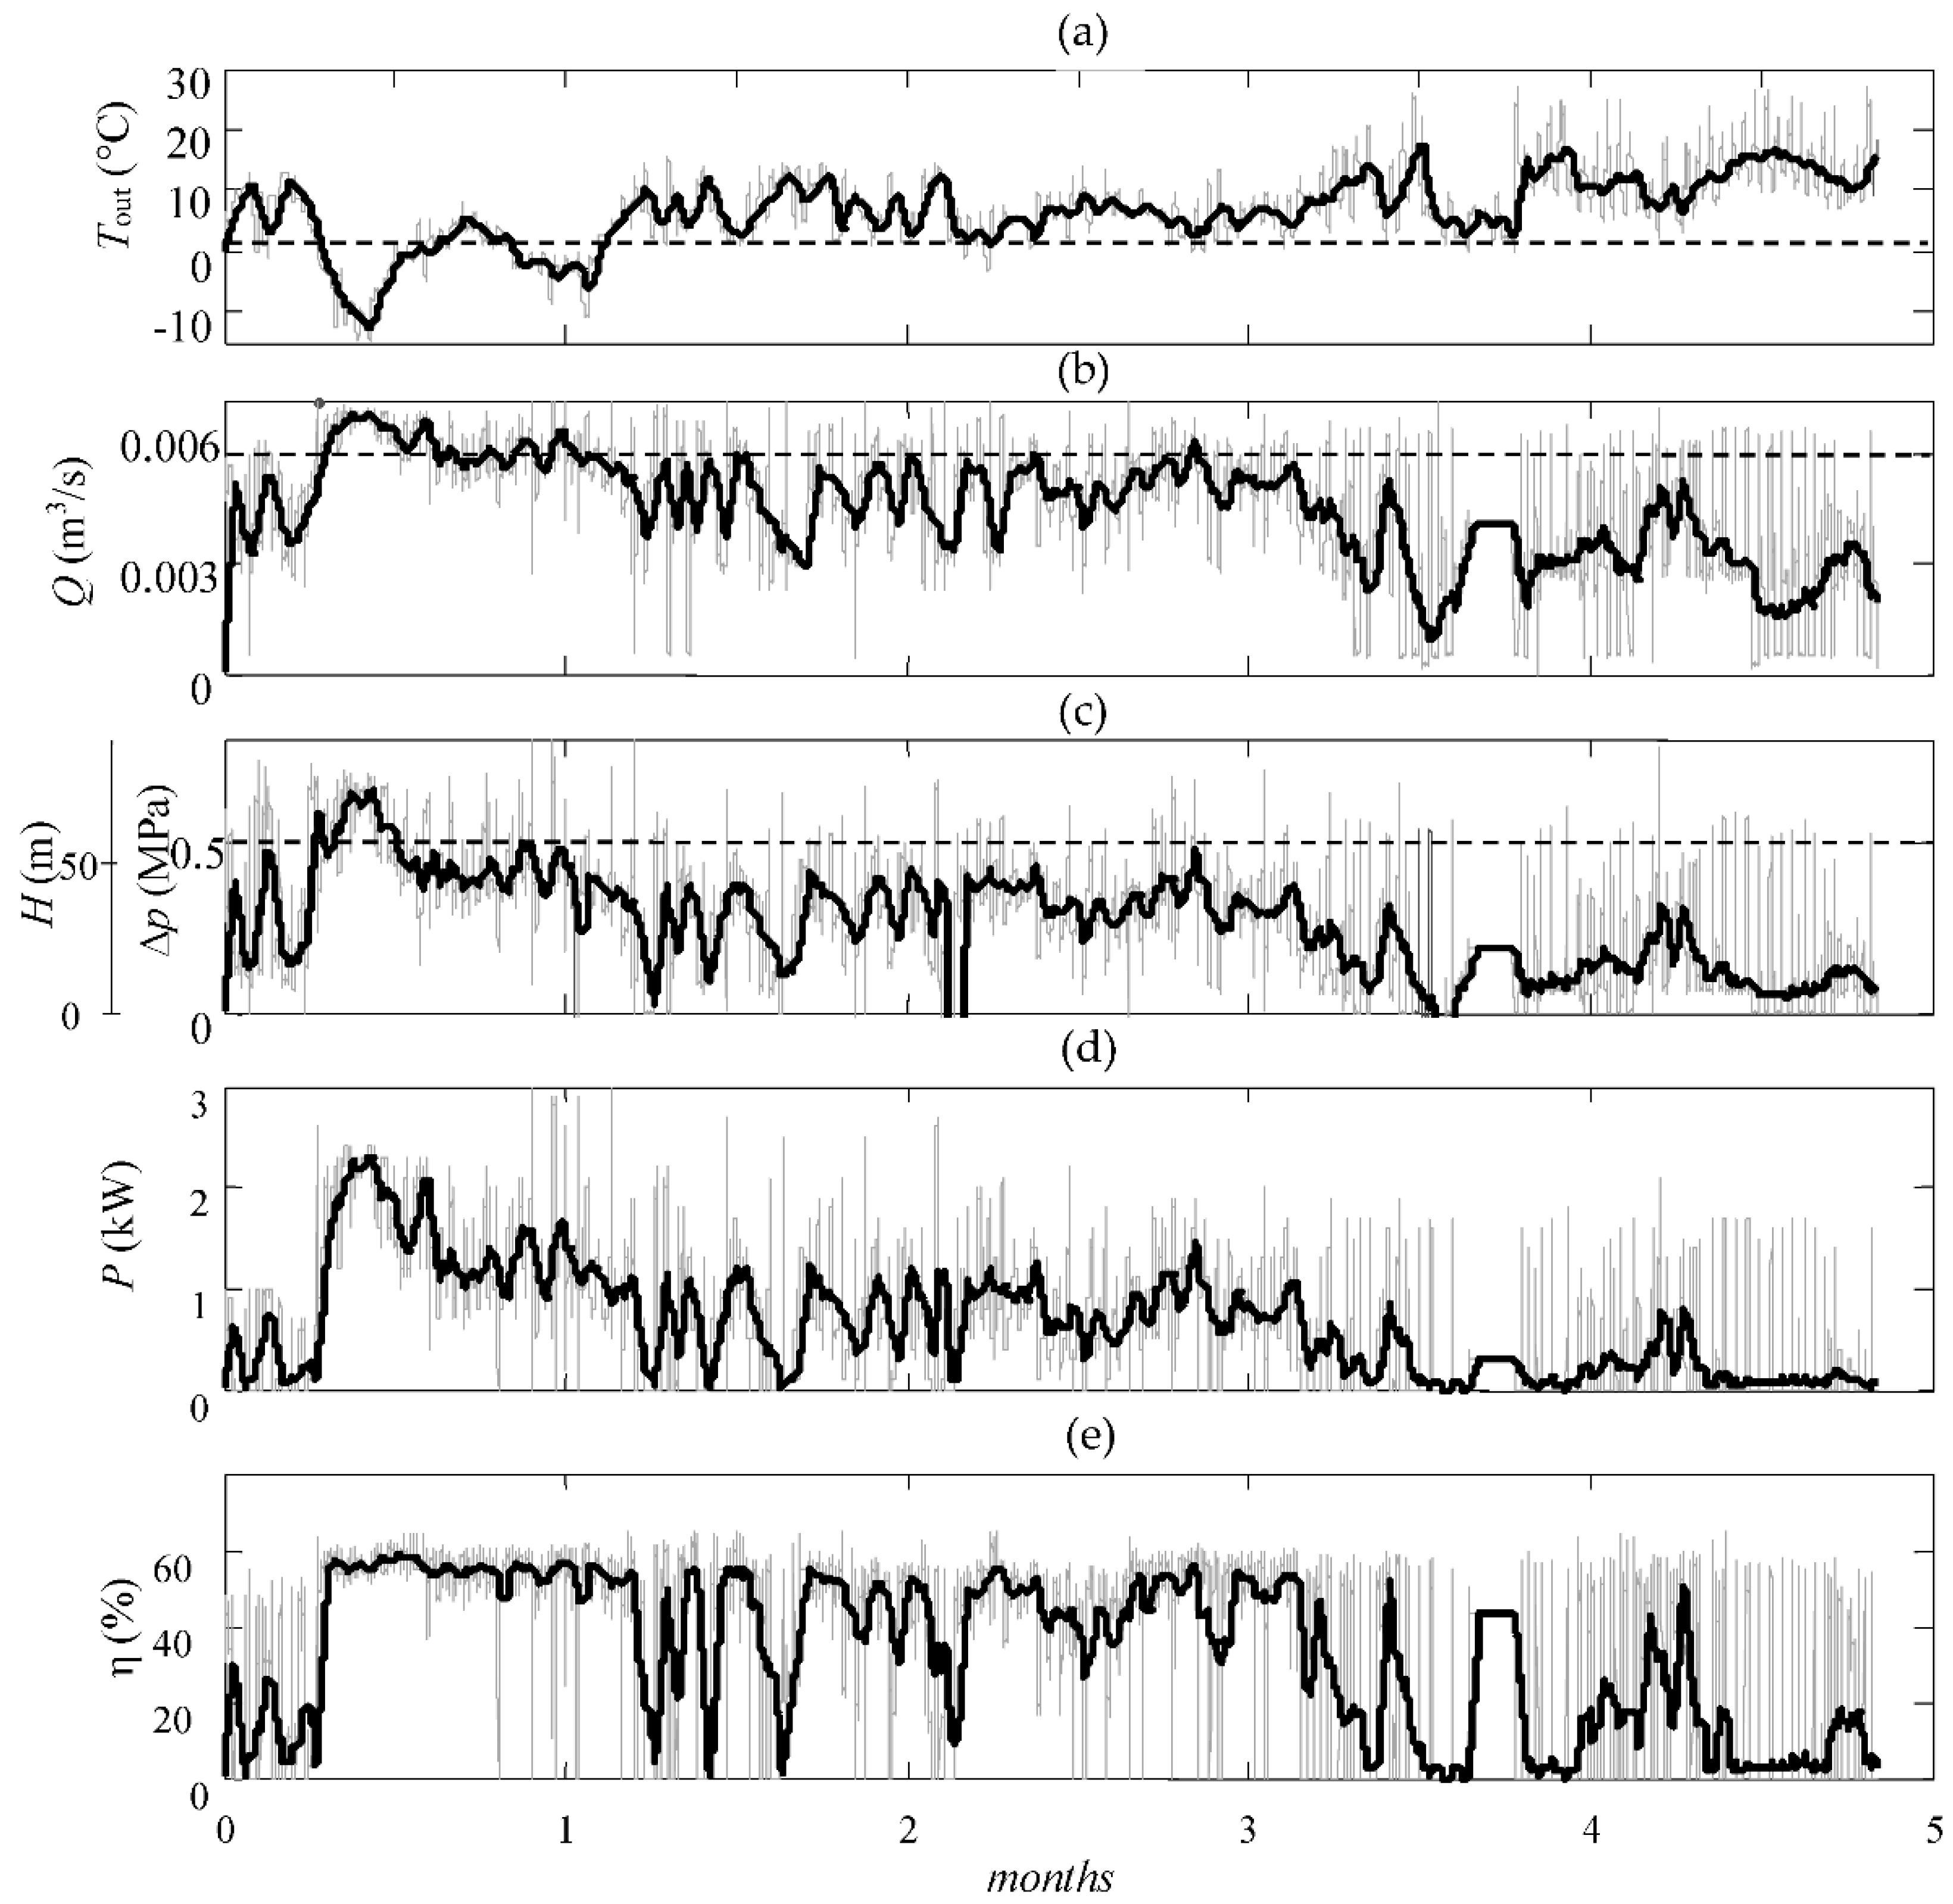
The presented ERPR prototype, which was located in the substation in the Cracow DHS, was tested during five months of the annual heating season (from December to April). Figure 15 shows the curves of the main system parameters (grey line) with a one-day average filter curve (thick line) over time.
The operation of the DHS substation was mainly dependent on outdoor temperatures. The nominal values of the ERPR (∆p = 0.5 MPa, Q = 0.0058 m3/s) were achieved when the outdoor temperature measured approximately 2 °C (dashed line). This is the usual average temperature for this location in the chosen period. The analyzed heating season was characterized by a quite high average temperature of 6.6 °C, which lead to only 2.42 MW of recovered energy. The average flow (Qavg = 0.0045 m3/s) and average reduced pressure (∆pavg = 0.25 MPa) were much below the nominal values. Most of the time the operating conditions were outside the ERPR regulation area (Figure 11). Nevertheless, the average ERPR efficiency (49%) was satisfactory.
5. Conclusions
In this paper, we proposed an ERPR device for a DHS. The chosen system structure, which consisted of an ERPR in series with a PRV, lowered installation costs and simplified system installation. To separate the ERPR control from the substation regulation system, an ERPR operation mode was proposed that provided the highest electrical active power, and kept the differential pressure equal to the minimal disposal value of the substation.
The presented analysis of the ERPR operation showed the low impact on electrical and hydraulic systems, as well as on the environment. The resulting vibration and noise values were similar for both PEU structures. Therefore, the cheaper solution with a diode bridge rectifier can be used. The vibration analysis in the speed domain revealed the resonance phenomenon, which must be considered while designing the mounting technique for the ERPR.
The presented example for energy recovery in a DHS in the city of Cracow indicated significant potential. Energy-recovery profitability depends on the equipment price and system efficiency. The economic analysis presented in Reference [21], resulting in a payback period of 5 to 7 years, assumes costs of approximately 1200 Euro for a standardized ERPR device (1 kW), and 1700 Euro if an extra design process is necessary. The total costs of the presented prototype were 1900 Euro/kW. Considering large ERPR numbers and equipment optimization, these cost levels are achievable. Furthermore, the presented analysis of the ERPR prototype in the substation of the Cracow DHS showed that the average total efficiency in the heating season is 49% despite the unusual operation conditions resulting from unusually high outdoor temperatures. The efficiency value confirmed the assumption made in Reference [21] (average efficiency value of 50%).
In conclusion, the installation of the ERPR in the Cracow DHS was economically feasible. To apply these results to other DHSs, factors such as the specific network structure, local market, and legal nature conditions should be considered.
Author Contributions
D.B. performed the data collection, analysed the data and wrote the paper; T.W. supervised the work and reviewed the final manuscript.
Funding
This work was supported with funds for statutory activity from the Cracow University of Technology (No. E-2/637/2017/DS) under the subsidies on science granted by the Polish Ministry of Science and Higher Education.
Conflicts of Interest
The authors declare no conflict of interest.
Abbreviations
| DHS | district heating system |
| DPC-SVM | direct power control with space vector modulation |
| ER | electrical regulation |
| ERPR | energy-recovery pressure-reducer |
| FFT | fast Fourier transform |
| MHP | micro-hydropower plant |
| PAT | pump as turbine |
| PEU | power electronic unit |
| PMSG | permanent magnet synchronous generator |
| PRV | pressure reducing valve |
| PWM | pulse width modulation |
| RMS | root mean square |
| THD | total harmonic distortion |
| WSS | water supply system |
Appendix A

Table A1.
Rated Values and Nominal Parameters.
| Three-Stage Vertical PAT in Turbine Mode: |
| Max power: Pt_max = 3 kW Max torque: Tt_max = 12 Nm Reduced pressure range: ∆p = 0.20–0.75 MPa Water head: H = 21–80 m Water flow range: Q = 0.004–0.007 m3/s Specific turbine speed: ns = 11 rpm kW1/2 m−4/3 Rotor material: brass |
| PMSG: |
| Apparent power: Sg = 5.5 kVA Voltage: Ug = 360 V Speed: ng = 3000 rpm Current: Ig = 8.8 A Efficiency: ηg = 93% Frequency: fg = 50 Hz |
| PEU: |
| Active power: PP = 5.5 kW Input voltage range: UP_in = 40–460 VAC Max input current: IP_in = 12 A Input frequency range: IP_in = 5–100 Hz Max DC voltage: UP_dc = 710 V Switching frequency: fs = 5 kHz |
References
- European Small Hydropower Association: ‘Energy Recovery in Existing Infrastructures with Small Hydropower Plants’. 2010. Available online: http://www.esha.be (accessed on 8 January 2013).
- McNabola, A.; Coughlan, P.; Williams, A.P. Energy recovery in the water industry: An assessment of the potential of micro hydropower. Water Environ. J. 2014, 28, 294–304. [Google Scholar] [CrossRef]
- Gallagher, J.; Harris, I.M.; Packwood, A.J.; McNabola, A.; Williams, A.P. Strategic assessment of energy recovery sites in the water industry for UK and Ireland: Setting technical and economic constraints through spatial mapping. Renew. Energy 2015, 81, 808–815. [Google Scholar] [CrossRef]
- Kroposki, B.; Pink, C.; DeBlasio, R.; Thomas, H.; Simões, M.; Sen, P.K. Benefits of Power Electronic Interfaces for Distributed Energy Systems. IEEE Trans. Energy Convers. 2010, 25, 901–908. [Google Scholar] [CrossRef] [Green Version]
- Vicente, D.J.; Garrote, L.; Sánchez, R.; Santillán, D. Pressure management in water distribution systems: Current status, proposals, and future trends. J. Water Resour. Plan. Manag. 2016, 142, 1–13. [Google Scholar] [CrossRef]
- Pérez-Sánchez, M.; Sánchez-Romero, F.J.; Ramos, H.M.; López-Jiménez, P.A. Energy recovery in existing water networks: Towards greater sustainability. Water 2017, 9, 97. [Google Scholar] [CrossRef]
- Corcoran, L.; McNabola, A.; Coughlan, P. Optimization of Water Distribution Networks for Combined Hydropower Energy Recovery and Leakage Reduction. J. Water Resour. Plan. Manag. 2015, 142. [Google Scholar] [CrossRef]
- Fontana, N.; Giugni, M.; Portolano, D. Losses reduction and energy production in water-distribution networks. J. Water Resour. Plan. Manag. 2012, 138, 237–244. [Google Scholar] [CrossRef]
- Samora, I.; Manso, P.; Franca, M.J.; Schleiss, A.J.; Ramos, H.M. Energy Recovery Using Micro-Hydropower Technology in Water Supply Systems: The Case Study of the City of Fribourg. Water 2016, 8, 344. [Google Scholar] [CrossRef]
- Samora, I.; Manso, P.; Franca, M.J.; Schleiss, A.J.; Ramos, H.M. Opportunity and economic feasibility of inline micro-hydropower units in water supply networks. J. Water Resour. Plan. Manag. 2016, 142. [Google Scholar] [CrossRef]
- Chen, J.; Yang, H.X.; Liu, C.P.; Lau, C.H.; Lo, M. A Novel Vertical Axis Water Turbine for Power Generation from Water Pipelines. Energy 2013, 54, 184–193. [Google Scholar] [CrossRef]
- Samora, I.; Hasmatuchi, V.; Münch-Alligné, C.; Franca, M.J.; Schleiss, A.J.; Ramos, H.M. Experimental characterization of a five blade tubular propeller turbine for pipe inline installation. Renew. Energy 2016, 95, 356–366. [Google Scholar] [CrossRef]
- Williams, A. Pumps as Turbines—User’s Guide; Russel Pres LTD: London, UK, 1997. [Google Scholar]
- Ramos, H.; Borga, A. Pumps as turbines: An unconventional solution to energy production. Urban Water 1999, 1, 261–263. [Google Scholar] [CrossRef]
- Carravetta, A.; Houreh, S.D.; Ramos, H.M. Pumps as Turbines: Fundamentals and Applications; Springer: Berlin, Germany, 2017. [Google Scholar]
- Jain, S.; Swarnkar, A.; Motwani, K.; Patel, R. Effects of impeller diameter and rotational speed on performance of pump running in turbine mode. Energy Convers. Manag. 2015, 89, 808–824. [Google Scholar] [CrossRef]
- Barbarelli, S.; Amelio, M.; Florio, G. Experimental activity at test rig validating correlations to select pumps running as turbines in microhydro plants. Energy Convers. Manag. 2017, 149, 781–797. [Google Scholar] [CrossRef]
- Carravetta, A.; Del Giudice, G.; Fecarotta, O.; Ramos, H.M. Energy Production in Water Distribution Networks: A PAT Design Strategy. Water Resour. Manag. 2012, 26, 3947–3959. [Google Scholar] [CrossRef]
- Carravetta, A.; Del Giudice, G.; Fecarotta, O.; Ramos, H.M. Pump as Turbine (PAT) Design in Water Distribution Network by System Effectiveness. Water 2013, 5, 1211–1225. [Google Scholar] [CrossRef] [Green Version]
- Carravetta, A.; del Giudice, G.; Fecarotta, O.; Ramos, H.M. PAT design strategy for energy recovery in water distribution networks by electrical regulation. Energies 2013, 6, 411–424. [Google Scholar] [CrossRef]
- Borkowski, D.; Węgiel, T. Analysis of energy recovery from surplus water pressure of municipal heat distribution network. In Proceedings of the 2nd International Conference SEED, Cracow, Poland, 14–17 November 2016. [Google Scholar]
- Węgiel, T.; Borkowski, D.; Sułowicz, M.; Liszka, D. Electrical Energy Recovery from Network Water Pressure. In Proceedings of the 12th Conference on Selected Problems of Electrical Engineering and Electronics, Kielce, Poland, 17–19 September 2015; pp. 55–60. [Google Scholar]
- Fraile-Ardanuy, J.; Wilhelmi, J.R.; Fraile-Mora, J.J.; Pérez, J.I. Variable-Speed Hydro Generation: Operational Aspects and Control. IEEE Trans. Energy Convers. 2006, 21, 569–573. [Google Scholar] [CrossRef]
- Fecarotta, O.; Carravetta, A.; Ramos, H.M.; Martino, R. An improved affinity model to enhance variable operating strategy for pumps used as turbines. J. Hydrol. Res. 2016, 54, 332–341. [Google Scholar] [CrossRef]
- Lauenburg, P.; Johansson, P.O.; Wollerstrand, J. District heating in case of power failure. Appl. Energy 2010, 87, 1176–1186. [Google Scholar] [CrossRef]
- Derakhshan, S.; Nourbakhsh, A. Experimental Study of Characteristic Curves of Centrifugal Pumps Working As Turbines in Different Specific Speeds. Exp. Therm. Fluid Sci. 2008, 32, 800–807. [Google Scholar] [CrossRef]
- Derakhshan, S.; Kasaeian, N. Optimization, Numerical and Experimental Study of a Propeller Pump as Turbine. J. Energy Resour. 2014, 136, 1–11. [Google Scholar] [CrossRef]
- Yang, G.S.; Derakhshan, S.; Kong, F. Theoretical, Numerical and Experimental Prediction of Pump as Turbine Performance. Renew. Energy 2012, 48, 507–513. [Google Scholar] [CrossRef]
- Derakhshan, S.; Nourbakhsh, A. Theoretical, Numerical and Experimental Investigation of Centrifugal Pumps in Reverse Operation. Exp. Therm. Fluid Sci. 2008, 32, 1620–1627. [Google Scholar] [CrossRef]
- Blaabjerg, F.; Chen, Z.; Kjaer, S.B. Power Electronics as Efficient Interface in Dispersed Power Generation Systems. IEEE Trans. Power Electron. 2004, 19, 1184–1194. [Google Scholar] [CrossRef]
- Kaźmierkowski, M.; Krishnan, M.; Blaabjerg; Irwin, F.J. Control in Power Electronics; Academic Press: Cambridge, MA, USA, 2003; ISBN 0-12-402772-5. [Google Scholar]
- Malinowski, M.; Jasinski, M.; Kazmierkowski, M.P. Simple Direct Power Control of Three-Phase PWM Rectifier Using Space-Vector Modulation (DPC-SVM). IEEE Trans. Ind. Electron. 2004, 51, 447–454. [Google Scholar] [CrossRef]
- Borkowski, D.; Węgiel, T. Small hydropower plant with integrated turbine-generators working at variable speed. IEEE Trans. Energy Convers. 2013, 28, 452–459. [Google Scholar] [CrossRef]
- Borkowski, D. Average-value model of energy conversion system consisting of PMSG, diode bridge rectifier and DPC-SVM controlled inverter. In Proceedings of the International Symposium on Electrical Machines (SME), Naleczow, Poland, 18–21 June 2017; pp. 1–6. [Google Scholar] [CrossRef]
- ISO Standard 9906:2018. Rotodynamic Pumps—Hydraulic Performance Acceptance Tests—Grades 1, 2 and 3; AI Global Limited: Sydney, Australia, 2018. [Google Scholar]
- EN Standard 50160:11-1999. Voltage Characteristics of Electricity Supplied by Public Distribution Systems; ORGALIME: Brussels, Belgium, 2003. [Google Scholar]
- ISO 10816-1:1995+A1:2009. Mechanical Vibration—Evaluation of Machine Vibration by Measurement of on non-Rotating Parts—Part 1: General Guidelines; British Standards Institution (BSI): London, UK, 1995. [Google Scholar]
- ISO Standard 11201:2010. Acoustics—Noise Emitted by Machinery and Equipment—Determination of Emission Sound Pressure Levels at a Work Station and at Other Specified Positions in an Essentially Free Field over a Reflecting Plane with Negligible Environmental Corrections; British Standards Institution (BSI): London, UK, 2010. [Google Scholar]
- Directive 2000/14/EC of The European Parliament and of the Council of 8 May 2000 on the Approximation of the Laws of the Member States Relating to the Noise Emission in the Environment by Equipment for Use Outdoors. Available online: https://eur-lex.europa.eu (accessed on 13 June 2018).
- ISO Standard 1999:2013. Preview Acoustics—Estimation of Noise-Induced Hearing Loss; BSI: London, UK, 2013. [Google Scholar]
- Johansson, P.; Wollerstrand, J. Kavitation i Styrventiler—Laboratorieundersökning; Report 2009:45; Swedish District Heating Association: Uppsala, Sweden, 2009. [Google Scholar]
Figure 1.
Pressure distribution in DHS: (a) two-pipe heating network; (b) pressure distribution along the heating pipe; (c) substation with heat exchanger.
Figure 1.
Pressure distribution in DHS: (a) two-pipe heating network; (b) pressure distribution along the heating pipe; (c) substation with heat exchanger.

Figure 2.
Block diagram of the district heating substation with ERPR.

Figure 3.
Main elements of an ERPR.
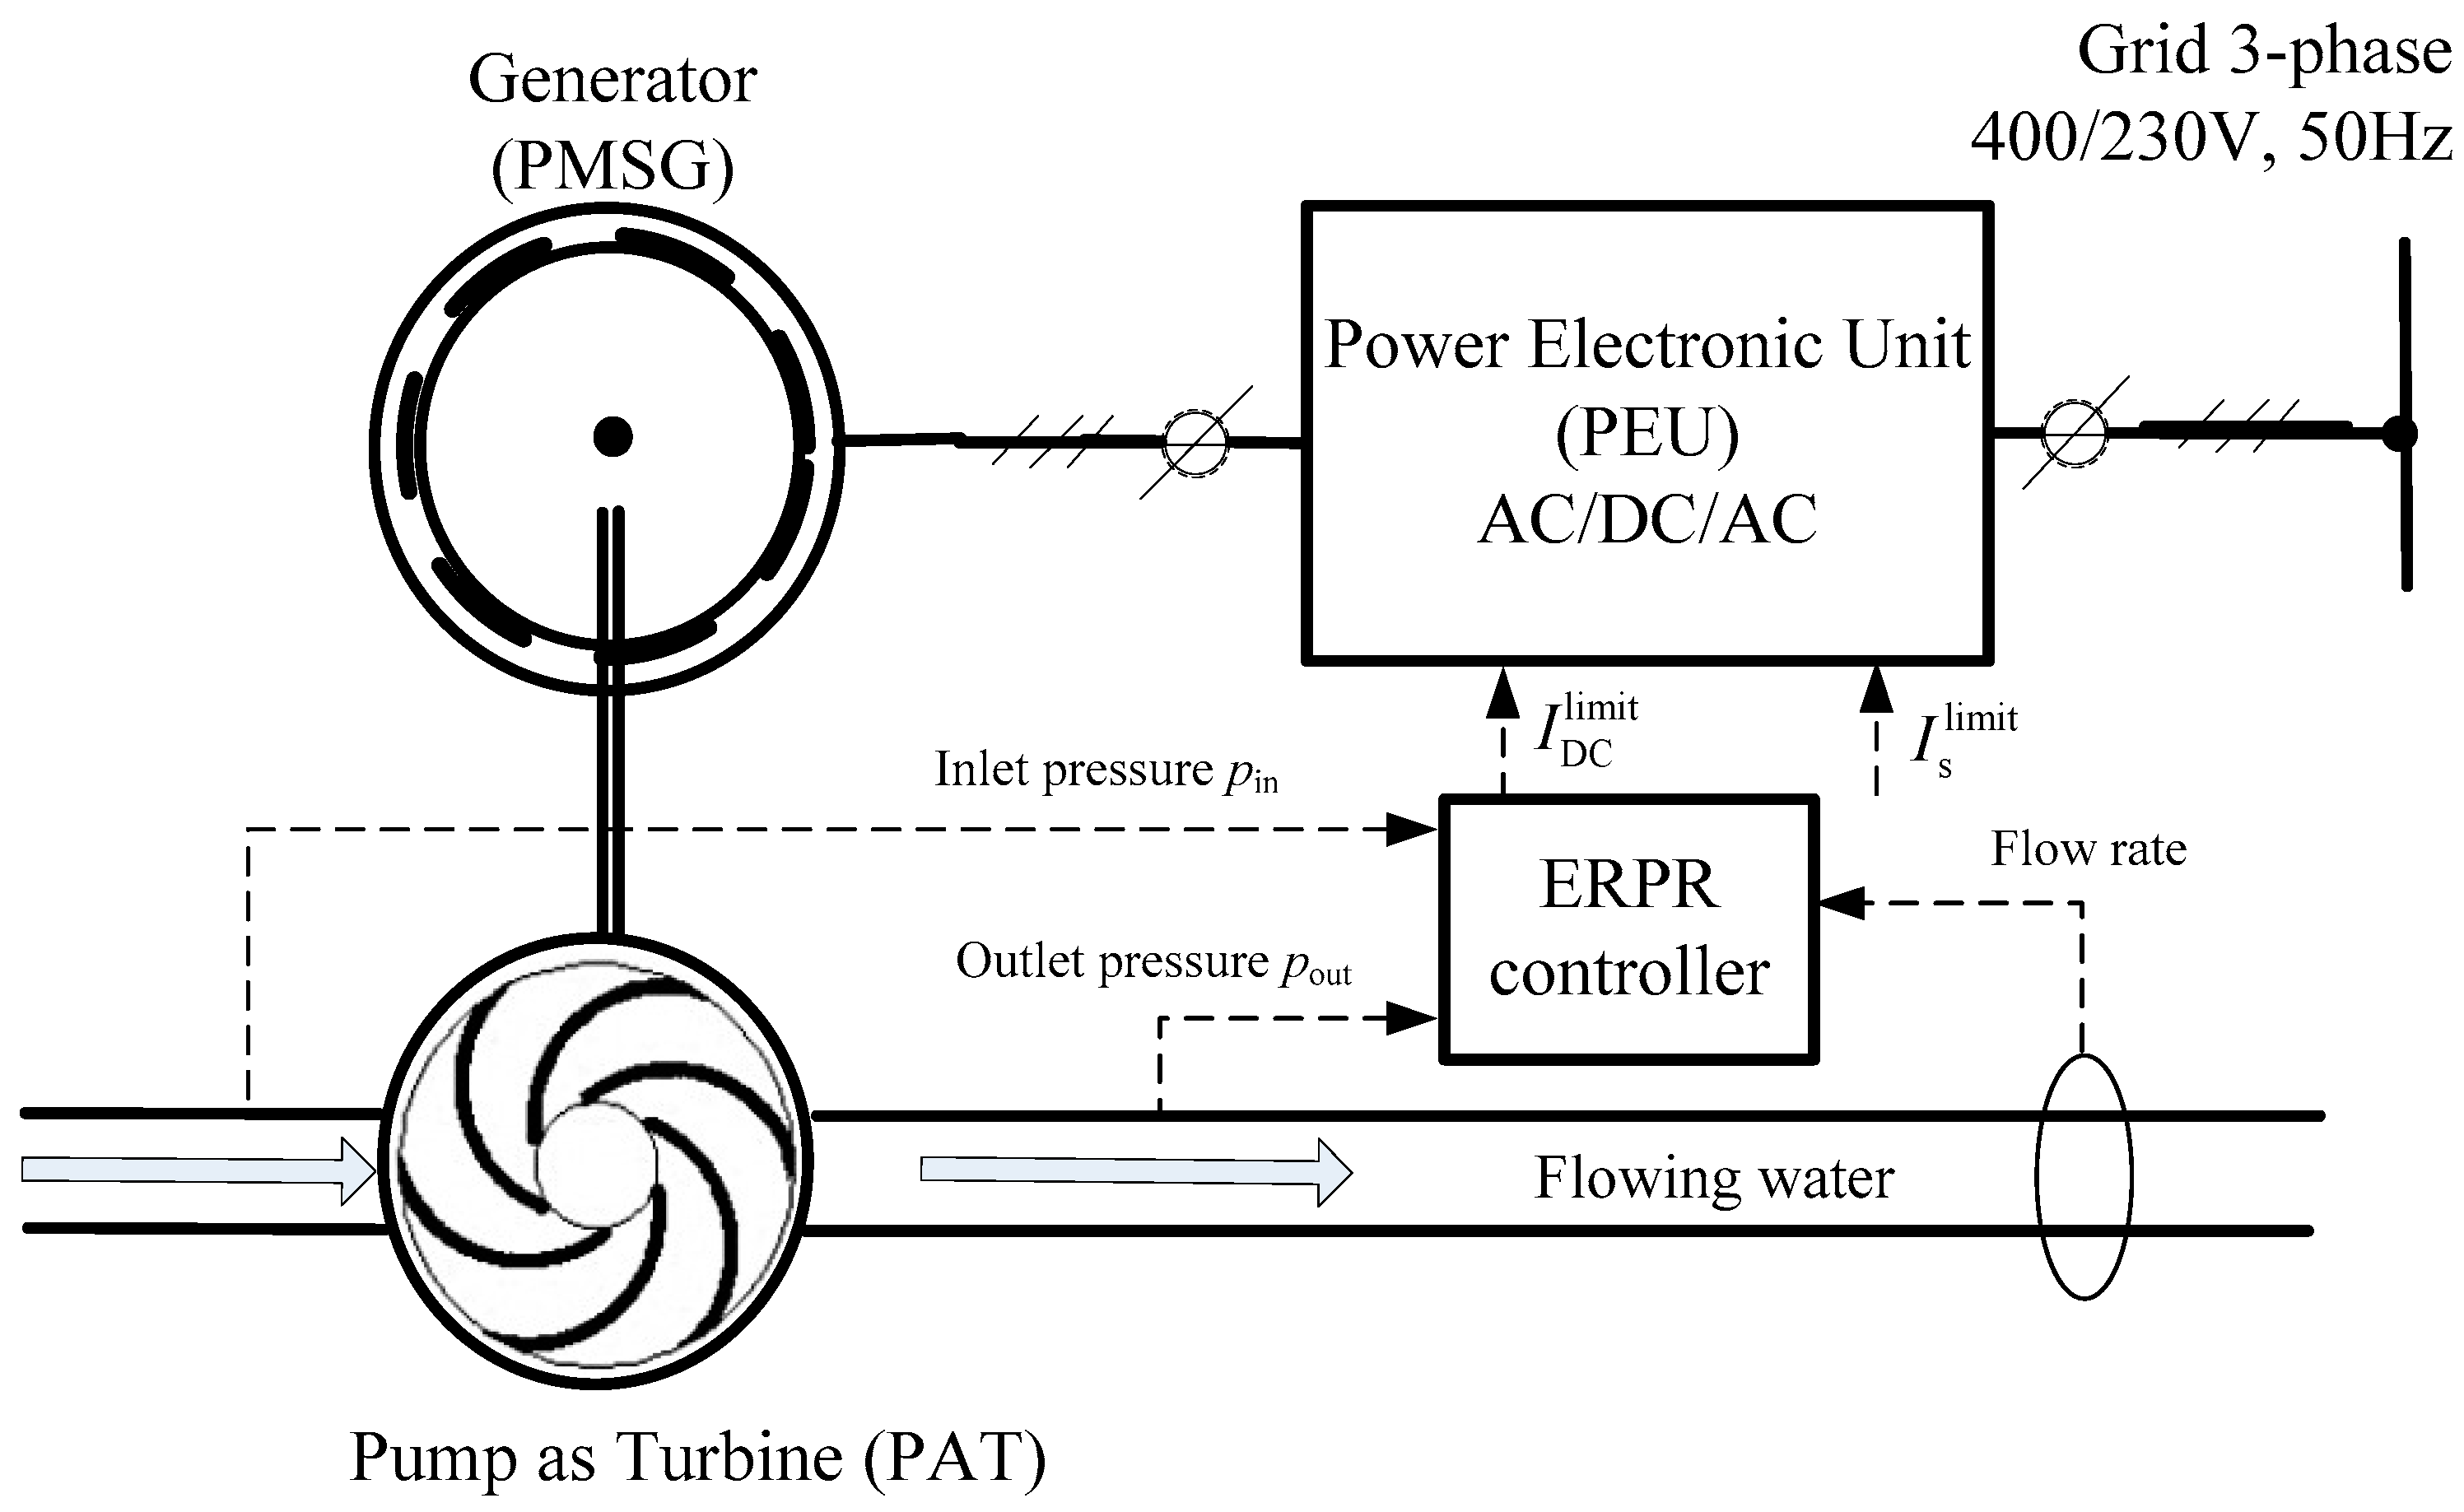
Figure 4.
Block diagram of a Power Electronic Unit (PEU) with: (a) a diode rectifier and DC/DC booster; and (b) a PWM rectifier.
Figure 4.
Block diagram of a Power Electronic Unit (PEU) with: (a) a diode rectifier and DC/DC booster; and (b) a PWM rectifier.
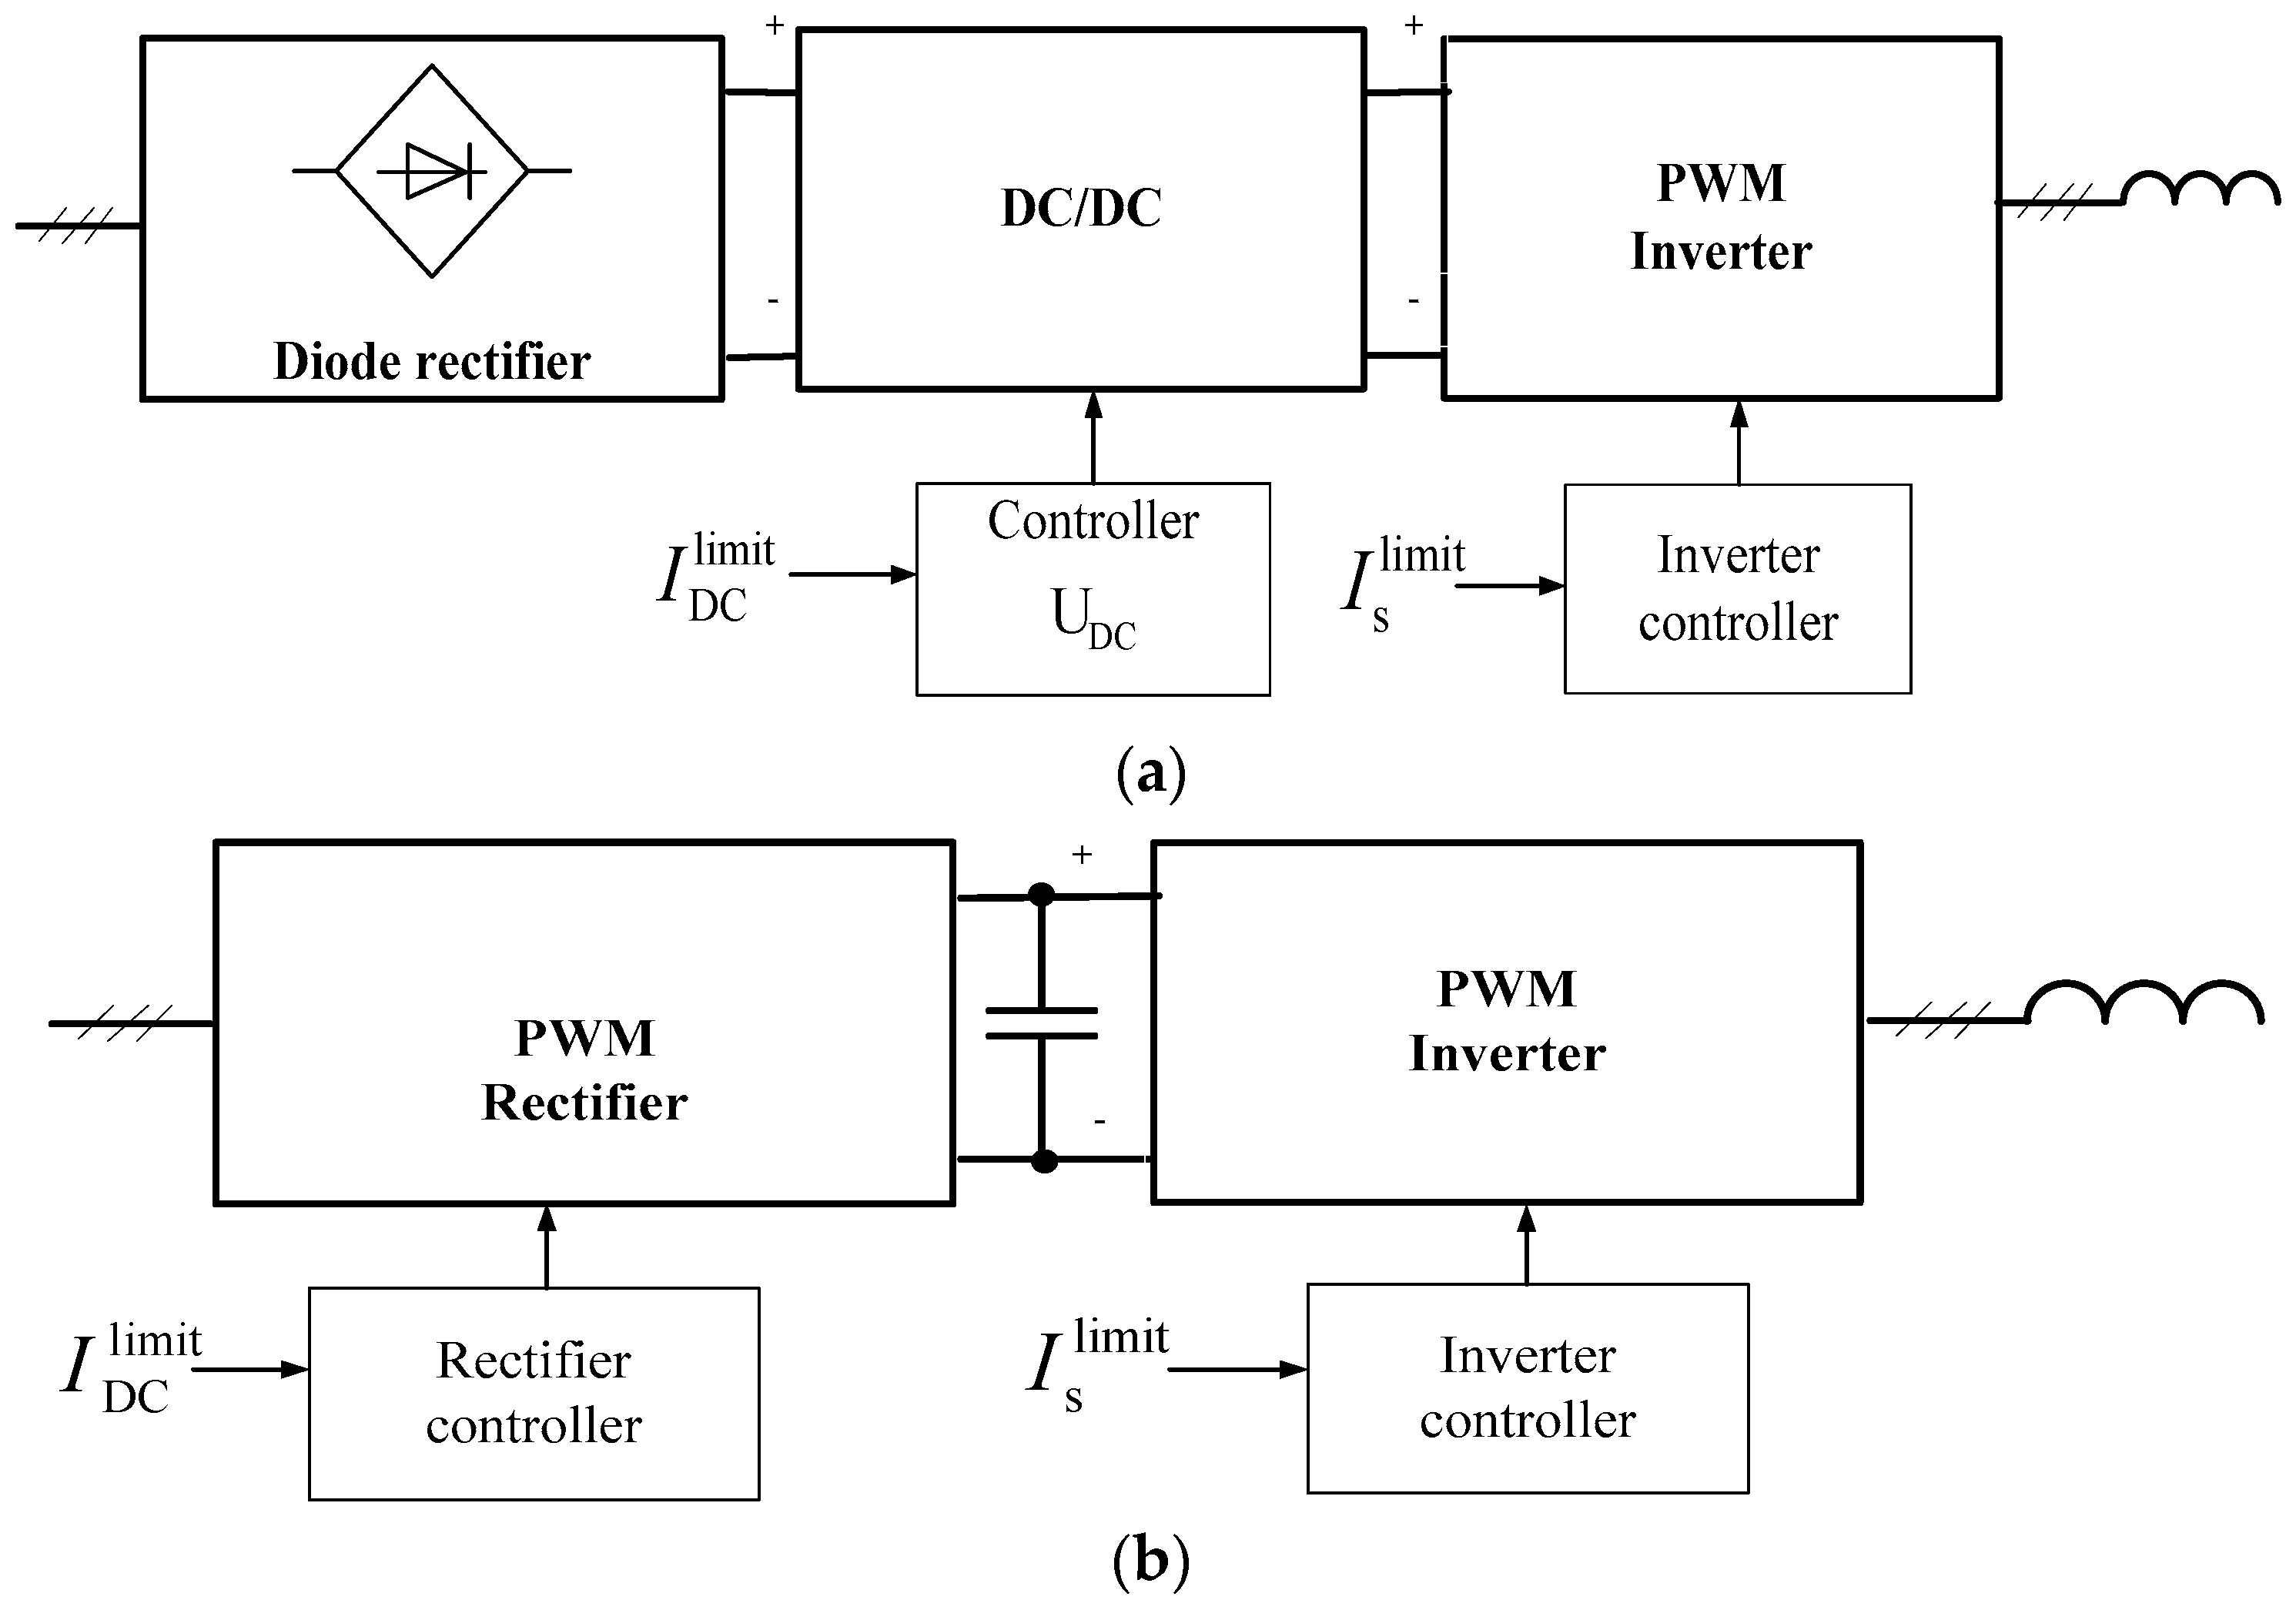
Figure 5.
PEU control curves showing characteristics of: (a) power P(n) and (b) PMSG torque T(n) for different values of and .
Figure 5.
PEU control curves showing characteristics of: (a) power P(n) and (b) PMSG torque T(n) for different values of and .

Figure 6.
PAT curves showing characteristics of: (a) power ; and (b) torque for different values of reduced pressure ∆p.
Figure 6.
PAT curves showing characteristics of: (a) power ; and (b) torque for different values of reduced pressure ∆p.

Figure 7.
Location of optimal operation point according to torque characteristic (PEU and PAT).

Figure 8.
ERPR prototype installed in the substation of the Cracow DHS.
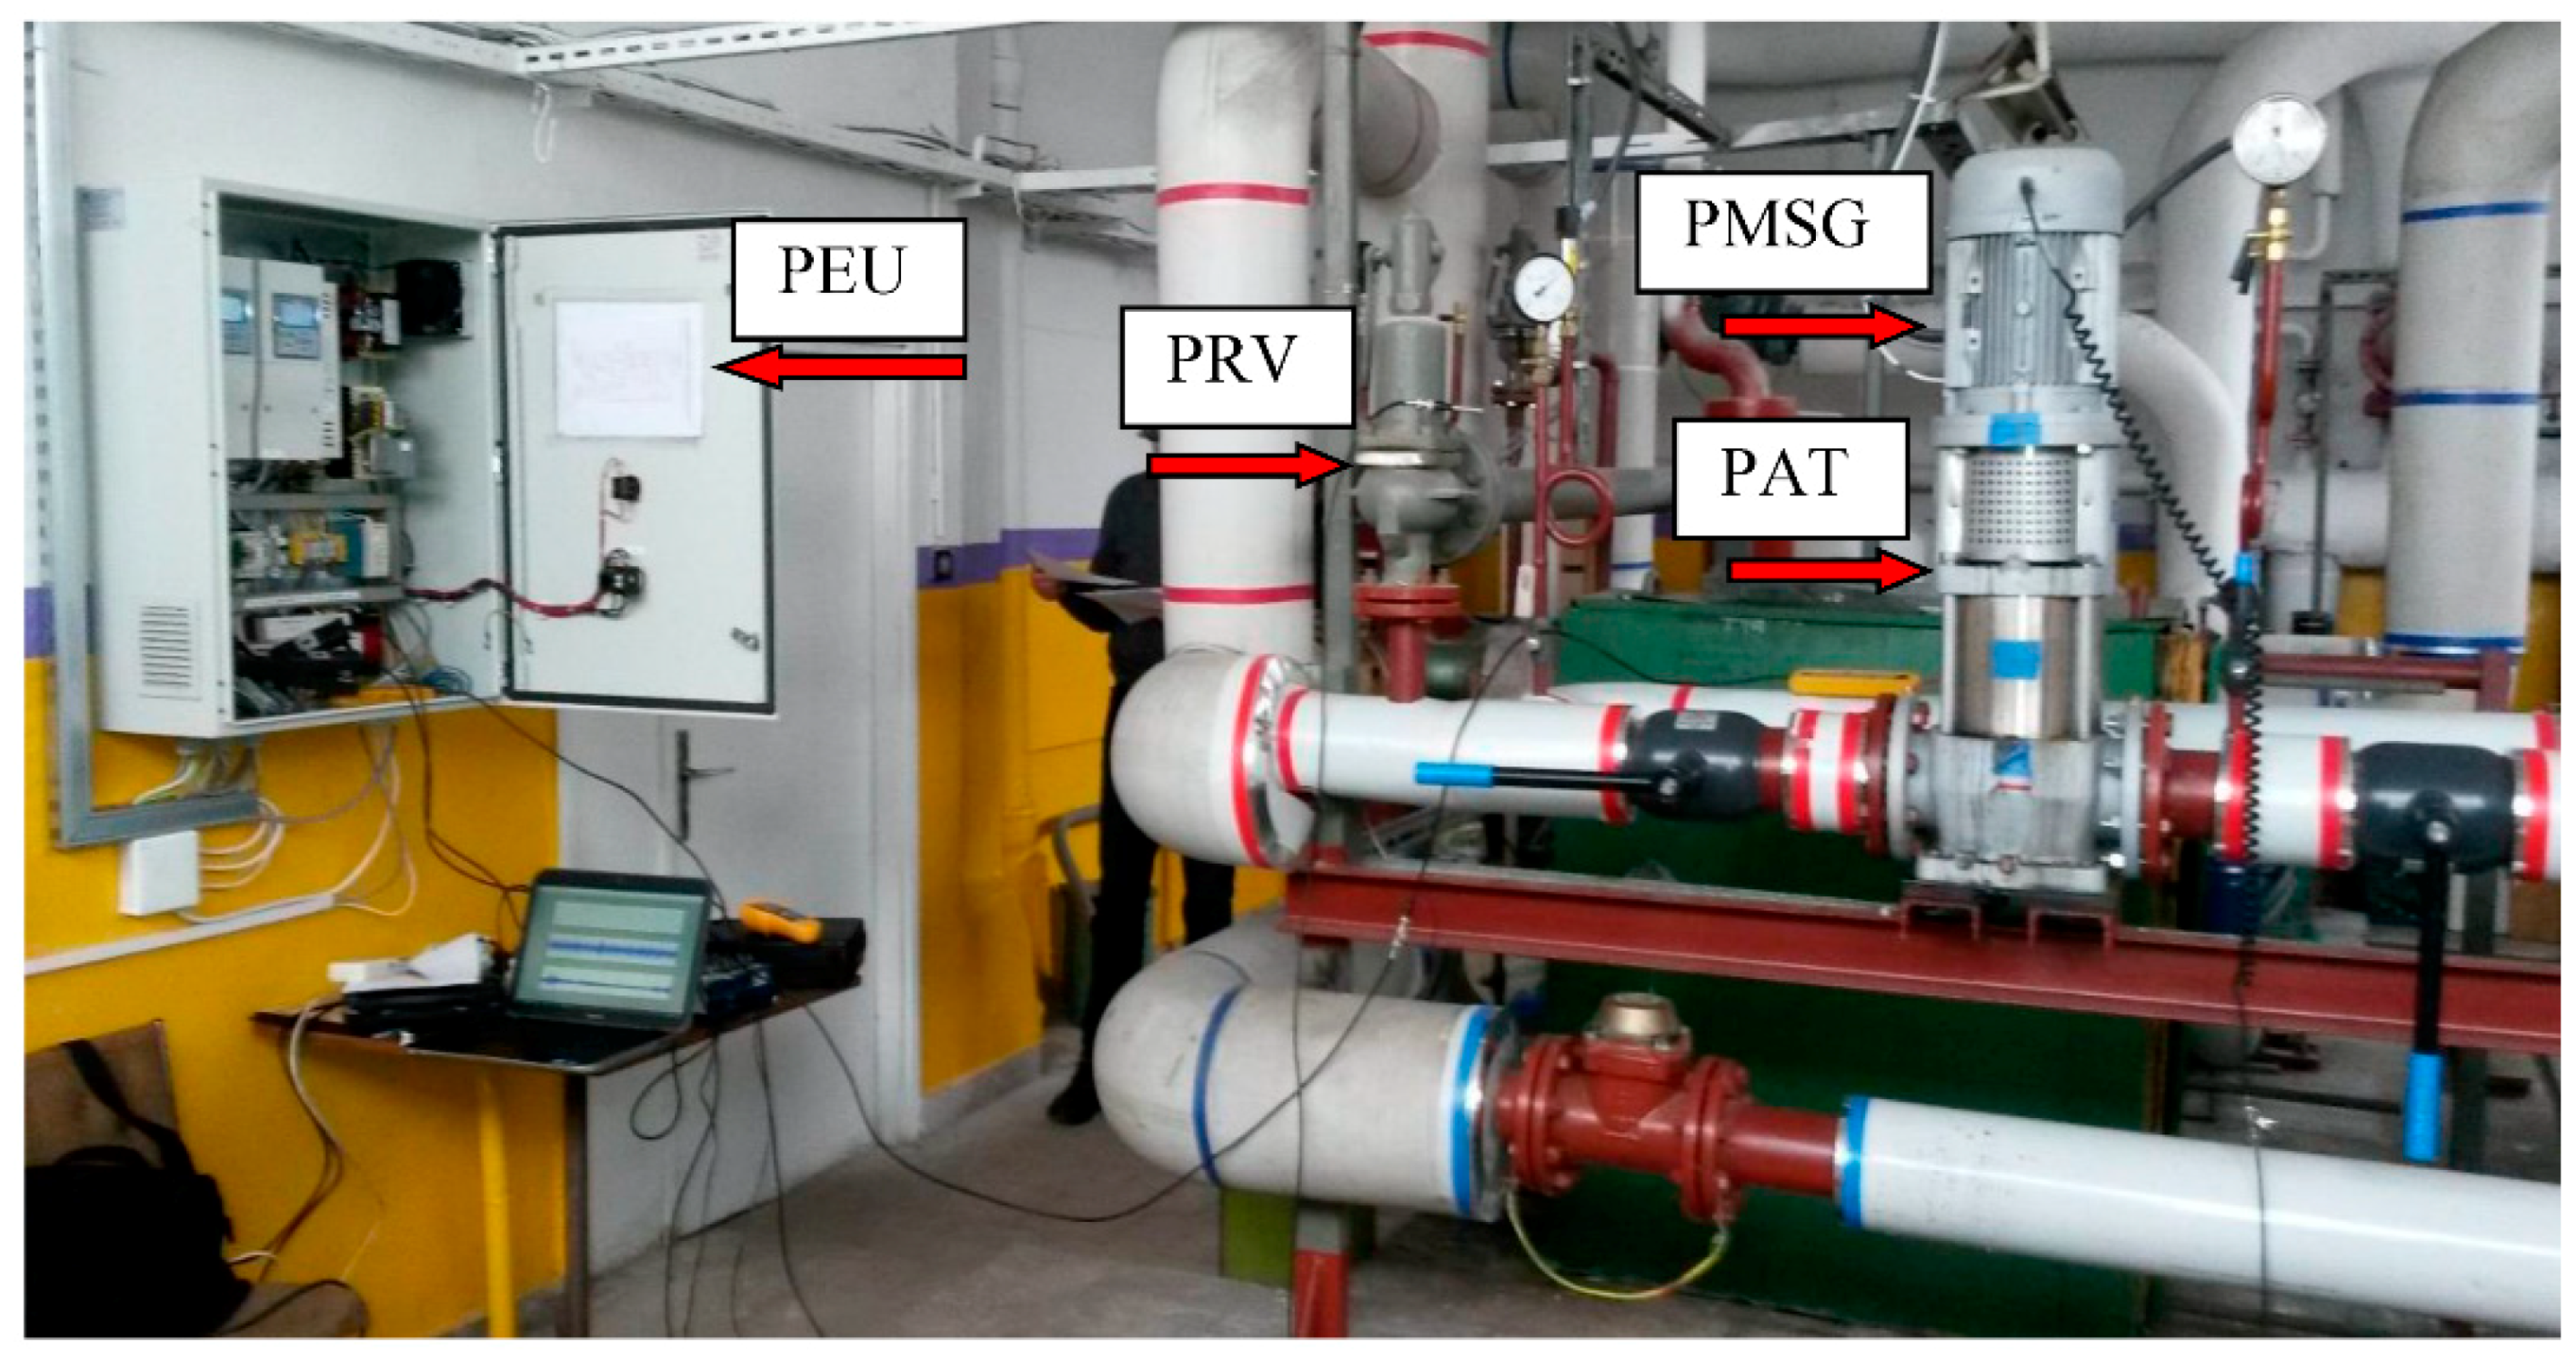
Figure 9.
Characteristic ERPR curves of: (a) PEU active power; (b) calculated turbine torque; (c) flow rate; and (d) total efficiency in turbine speed domain under four reduced pressure values.
Figure 9.
Characteristic ERPR curves of: (a) PEU active power; (b) calculated turbine torque; (c) flow rate; and (d) total efficiency in turbine speed domain under four reduced pressure values.

Figure 10.
Characteristic ERPR curves of: (a) PEU active power; and (b) total efficiency in flow-rate domain under four reduced pressure values.
Figure 10.
Characteristic ERPR curves of: (a) PEU active power; and (b) total efficiency in flow-rate domain under four reduced pressure values.

Figure 11.
Speed regulation characteristics of ERPR in reduced pressure–flow-rate domain with isolines of constant efficiency.
Figure 11.
Speed regulation characteristics of ERPR in reduced pressure–flow-rate domain with isolines of constant efficiency.
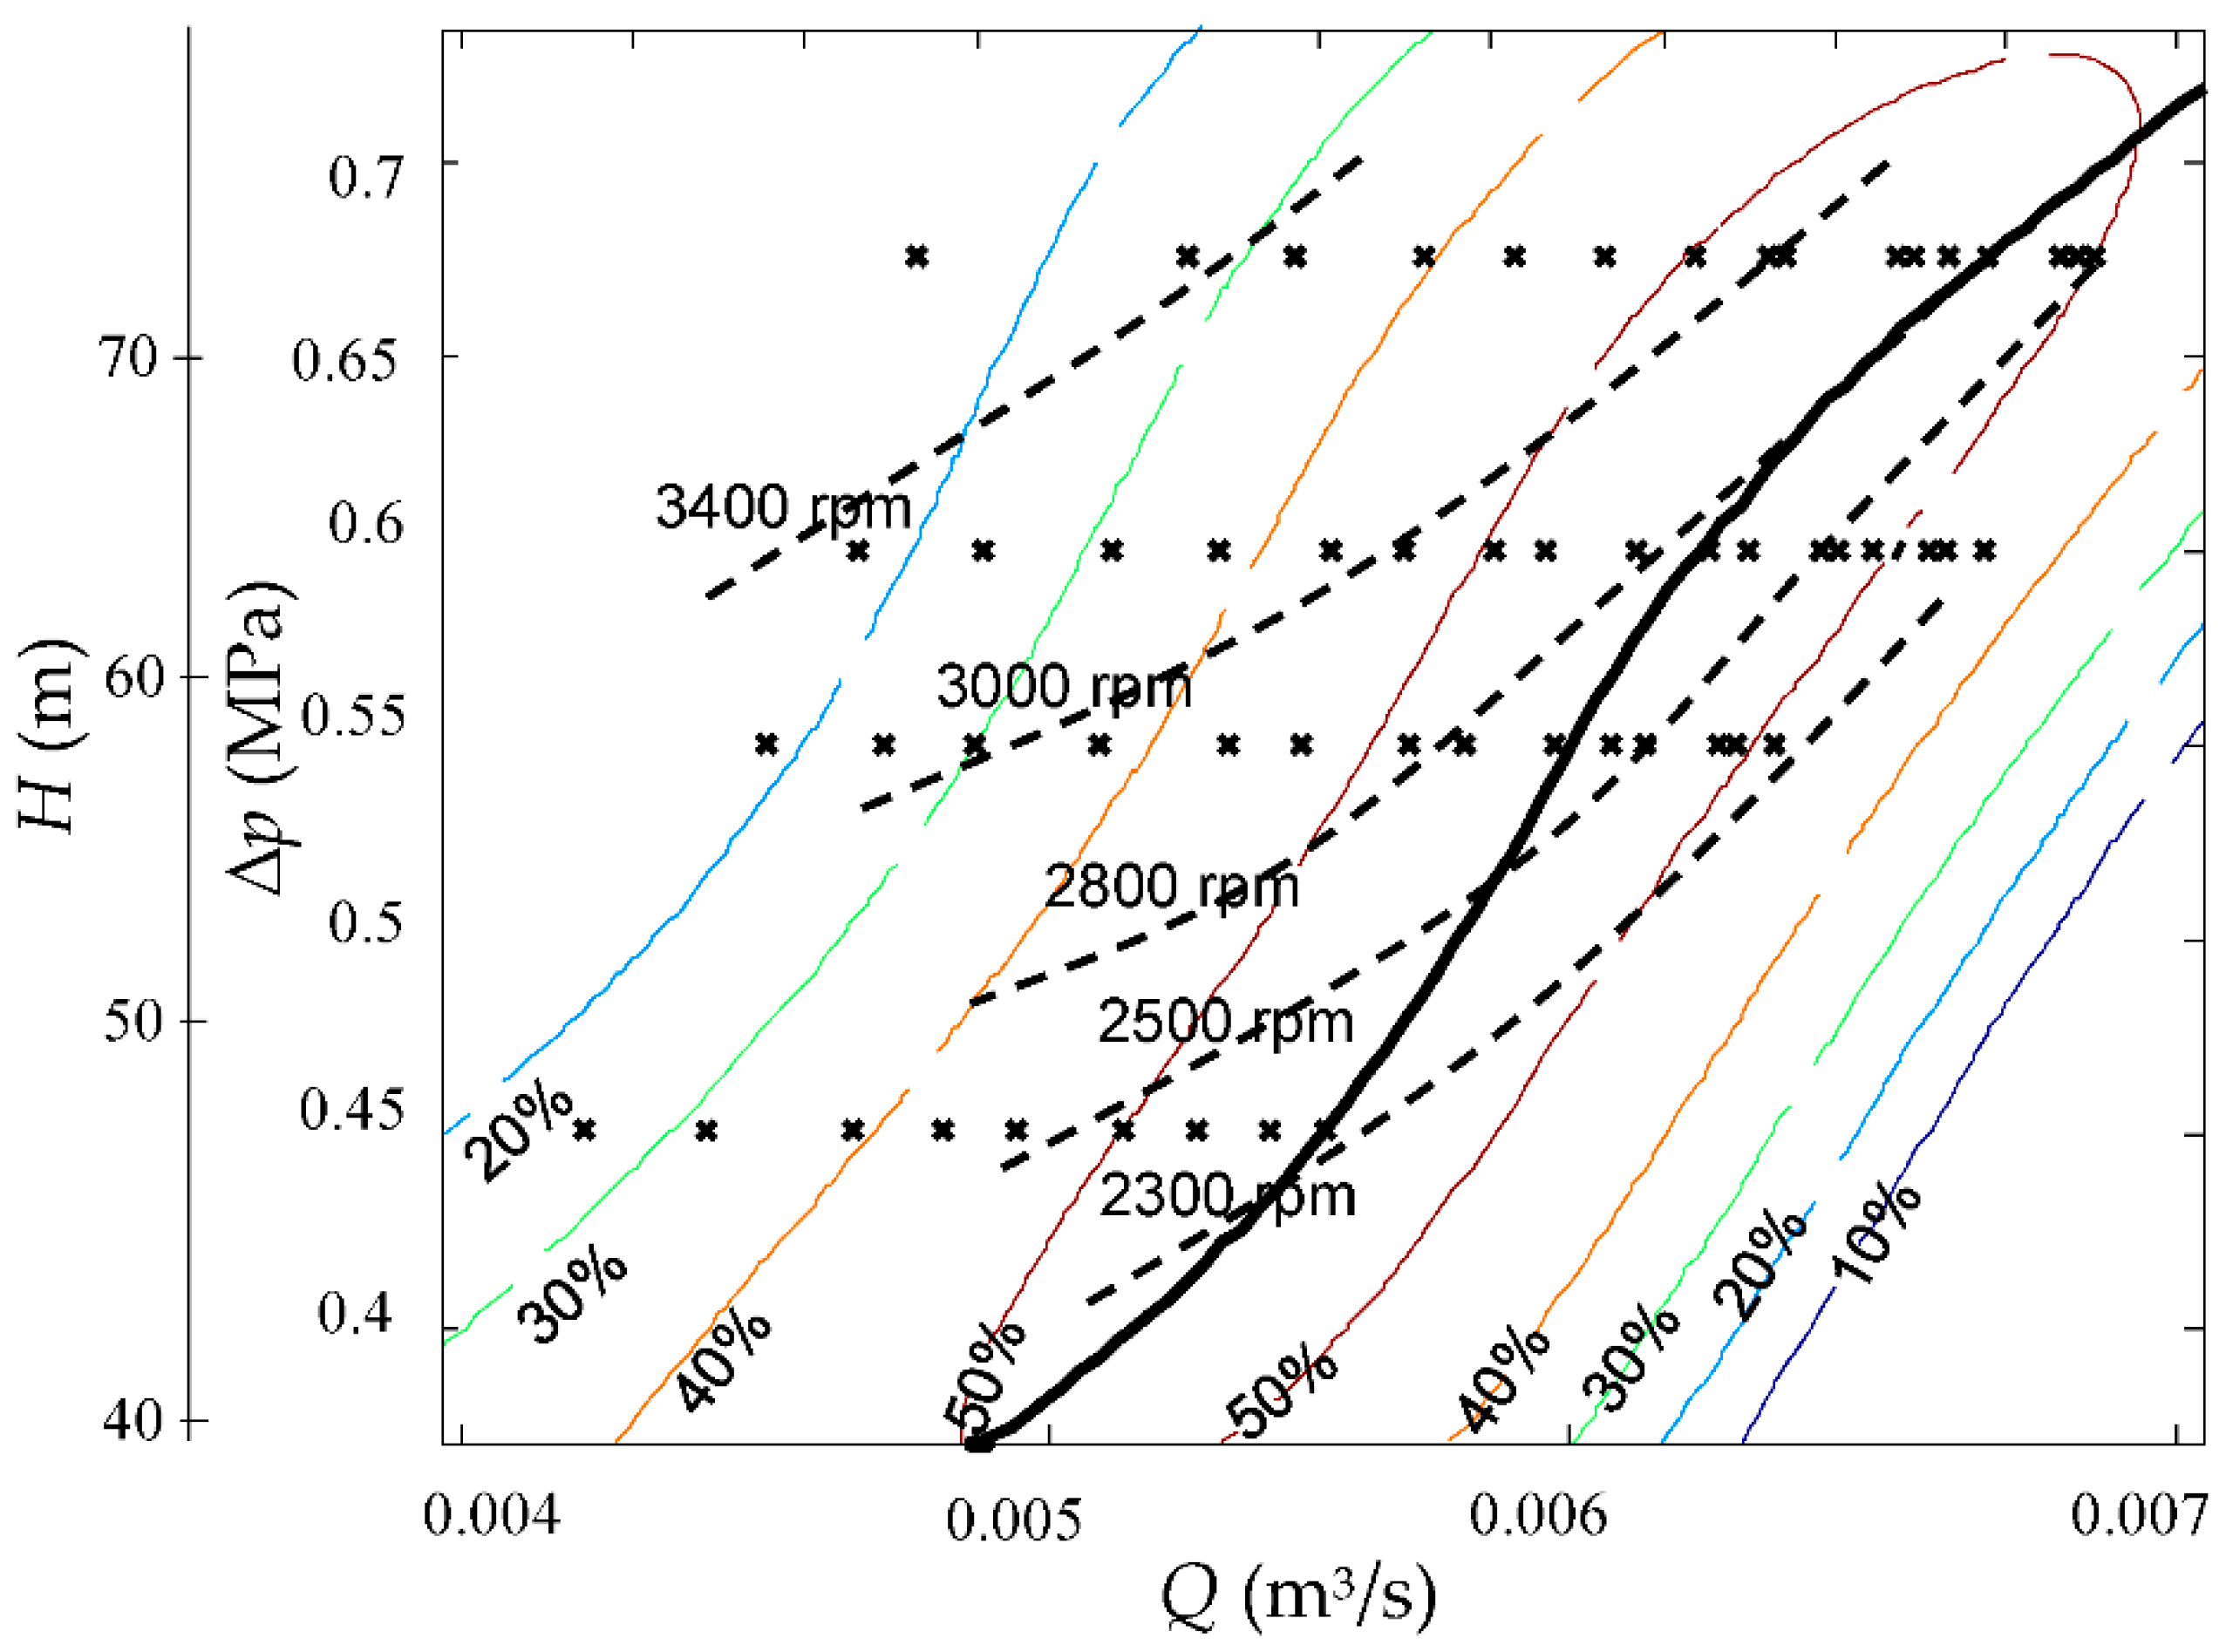
Figure 12.
Electrical signal (voltage and current) analysis of the PEU with diode bridge rectifier: (a) PEU output signal; and (b) PMSG signal.
Figure 12.
Electrical signal (voltage and current) analysis of the PEU with diode bridge rectifier: (a) PEU output signal; and (b) PMSG signal.

Figure 13.
Electrical signal (voltage and current) analysis of the PEU with sinusoidal rectifier: (a) PEU output signal; and (b) PMSG signal.
Figure 13.
Electrical signal (voltage and current) analysis of the PEU with sinusoidal rectifier: (a) PEU output signal; and (b) PMSG signal.
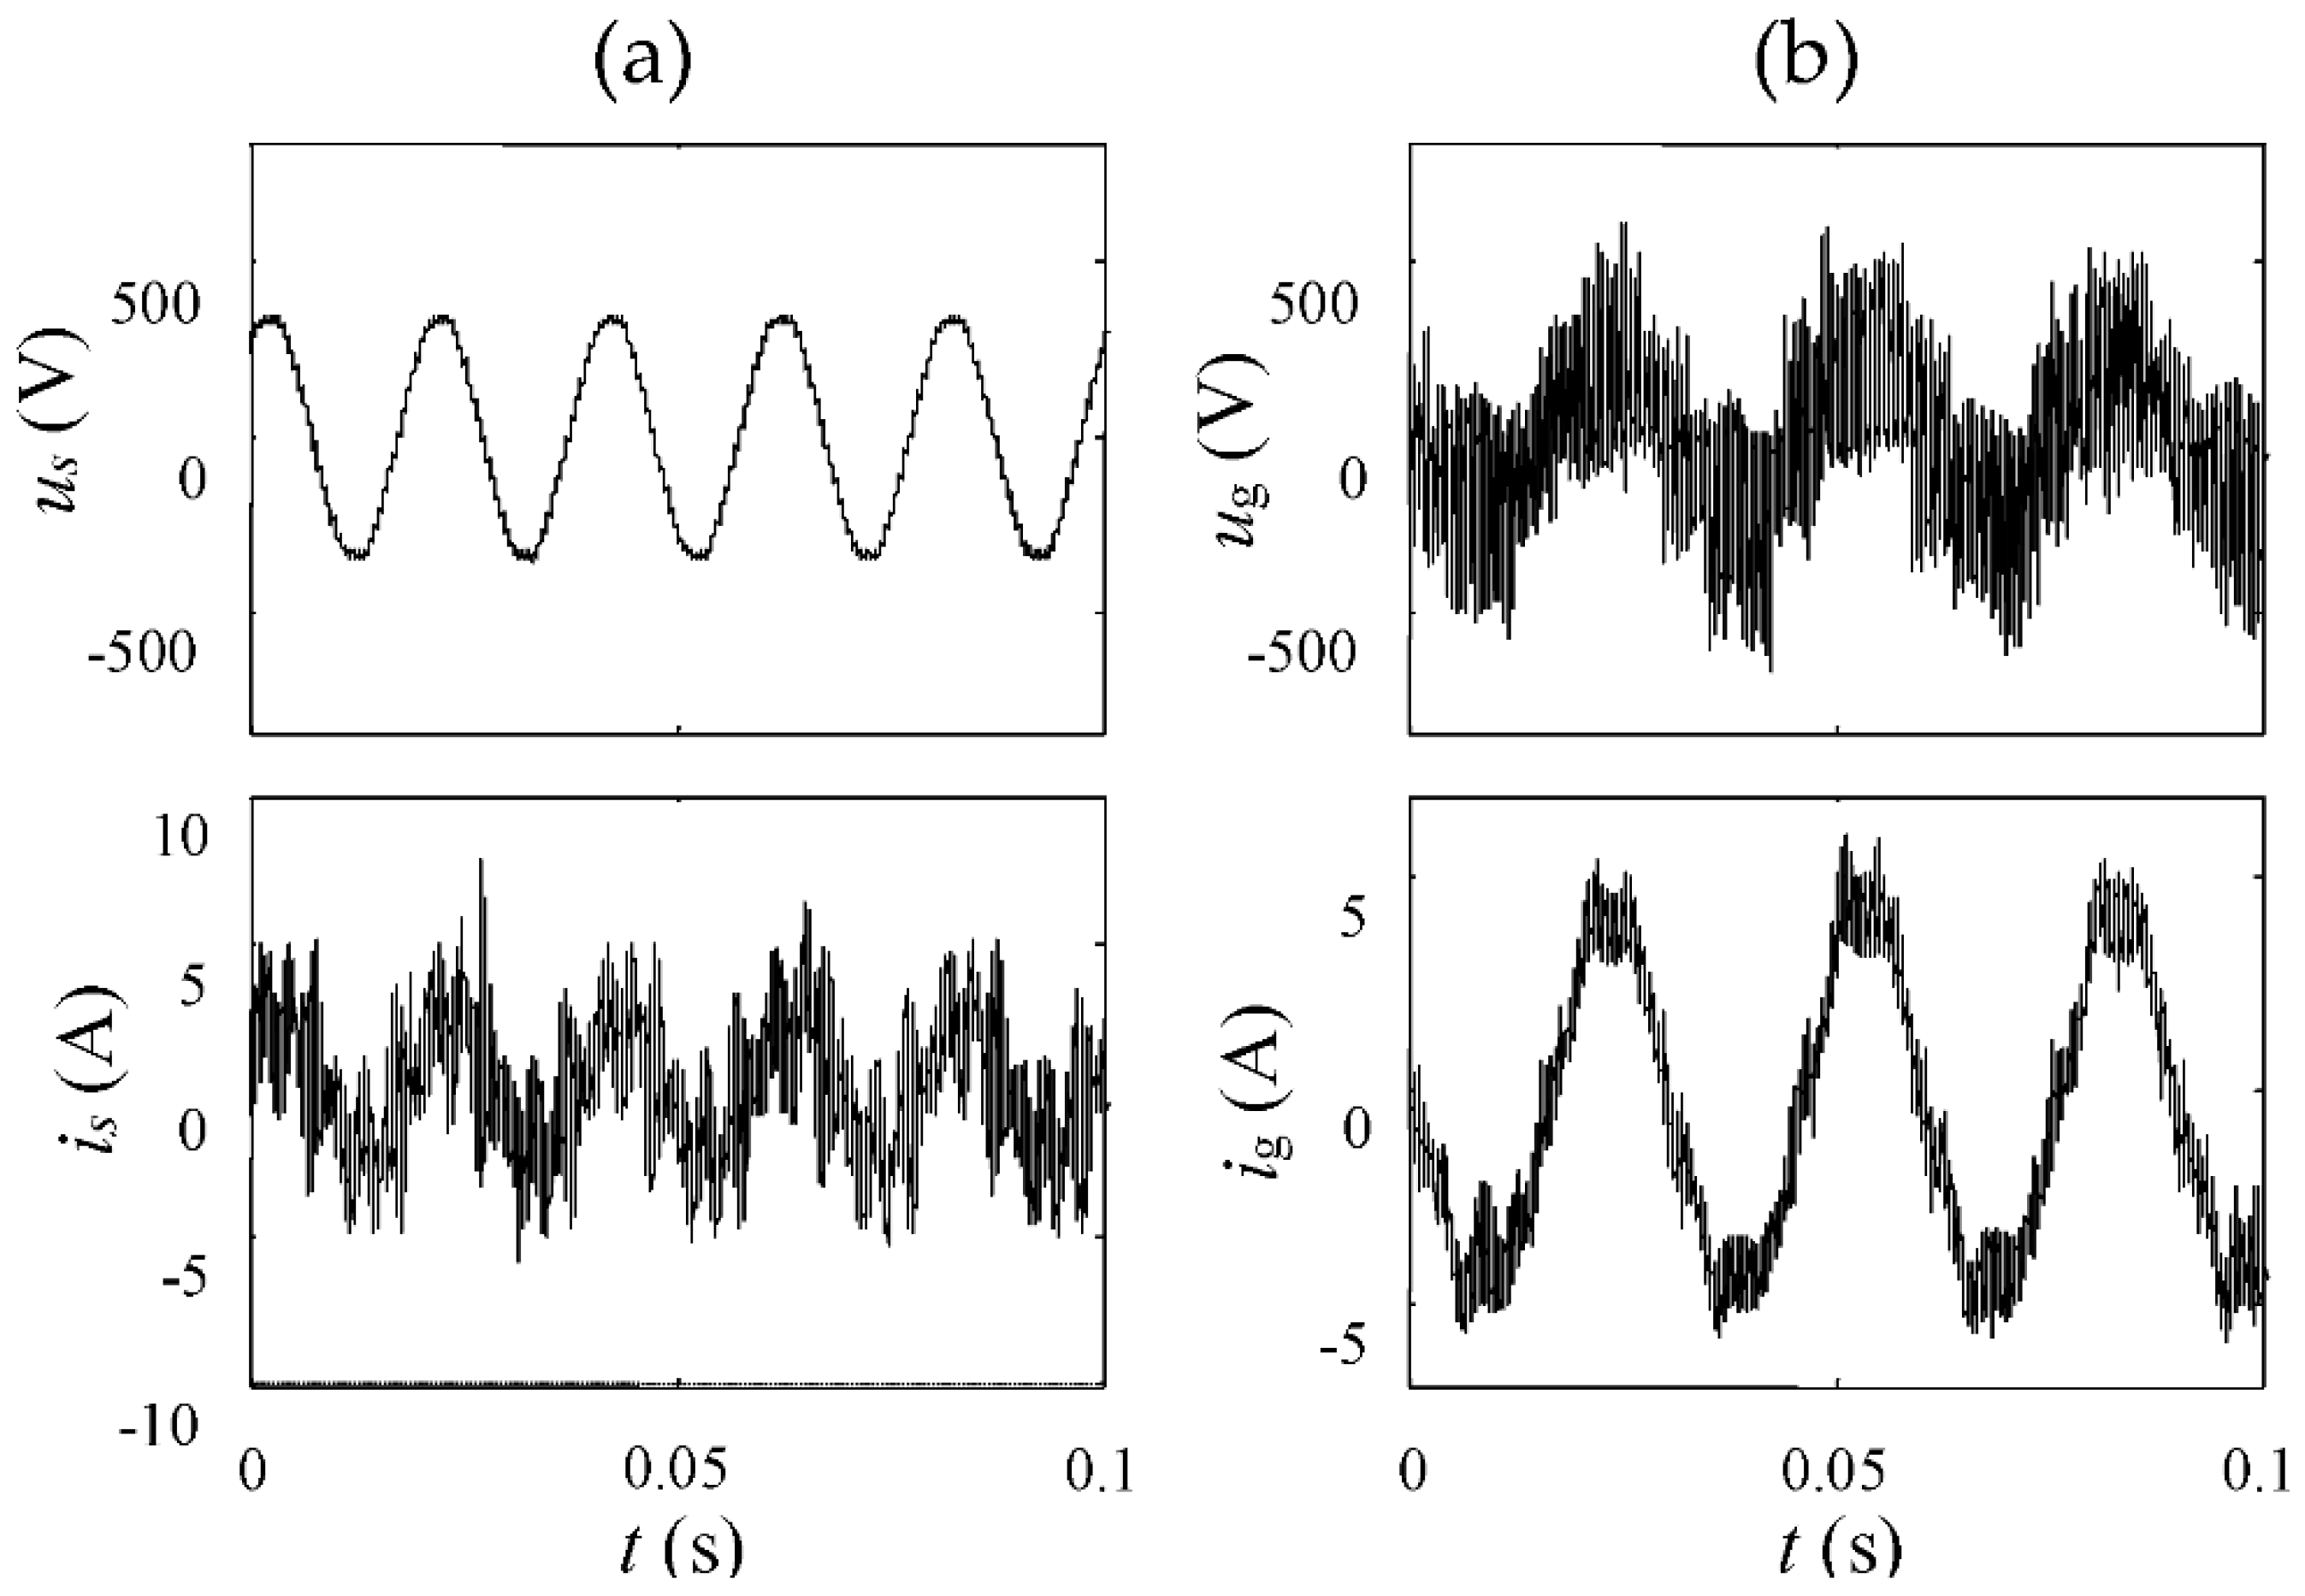
Figure 14.
Vibration analysis: (a) location of measurement points; and (b) RMS-vibration velocity in speed domain for two types of PEU rectifier.
Figure 14.
Vibration analysis: (a) location of measurement points; and (b) RMS-vibration velocity in speed domain for two types of PEU rectifier.

Figure 15.
Curves of: (a) outside temperature; (b) flow rate; (c) reduced pressure; (d) electrical active power; and (e) total ERPR efficiency during the 5 months of heating season (from December to April) in the Cracow DHS substation.
Figure 15.
Curves of: (a) outside temperature; (b) flow rate; (c) reduced pressure; (d) electrical active power; and (e) total ERPR efficiency during the 5 months of heating season (from December to April) in the Cracow DHS substation.

© 2018 by the authors. Licensee MDPI, Basel, Switzerland. This article is an open access article distributed under the terms and conditions of the Creative Commons Attribution (CC BY) license (http://creativecommons.org/licenses/by/4.0/).
Share and Cite
MDPI and ACS Style
Borkowski, D.; Węgiel, T. Energy-Recovery Pressure-Reducer in District Heating System. Water 2018, 10, 787. https://doi.org/10.3390/w10060787
AMA Style
Borkowski D, Węgiel T. Energy-Recovery Pressure-Reducer in District Heating System. Water. 2018; 10(6):787. https://doi.org/10.3390/w10060787
Chicago/Turabian StyleBorkowski, Dariusz, and Tomasz Węgiel. 2018. "Energy-Recovery Pressure-Reducer in District Heating System" Water 10, no. 6: 787. https://doi.org/10.3390/w10060787
Note that from the first issue of 2016, this journal uses article numbers instead of page numbers. See further details here.