Article

Navigating the Water-Energy Governance Landscape and Climate Change Adaptation Strategies in the Northern Patagonia Region of Argentina

1
Stockholm Environment Institute, Davis, CA 95616, USA
2
Facultad de Ingeniería y Ciencias Hídricas, Universidad Nacional del Litoral, Santa Fe 3000, Argentina
3
Facultad de Ingeniería, Universidad Nacional del Comahue, Neuquén 8300, Argentina
4
Fundación Bariloche, San Carlos, de Bariloche R8402AGP, Río Negro, Argentina
5
Consejo Nacional de Investigaciones Científicas y Técnicas (CONICET), Buenos Aires C1425FQB CABA, Argentina
6
Autoridad Interjurisdiccional de las Cuencas de los ríos Limay, Neuquén y Negro (AIC), Cipolletti 8324, Río Negro, Argentina
*
Author to whom correspondence should be addressed.
Water 2018, 10(6), 794; https://doi.org/10.3390/w10060794
Submission received: 8 May 2018 / Revised: 5 June 2018 / Accepted: 11 June 2018 / Published: 15 June 2018
(This article belongs to the Collection Water Policy Collection)

Abstract

:
Water scientists often find themselves interacting with decision-makers with varying levels of technical background. The sustainable management of water resources is complex by nature, and future conditions are highly uncertain, requiring modeling approaches capable of accommodating a variety of parameters and scenarios. Technical findings from these analyses need to be positioned and conducted within the governance institutions to ensure decision-makers utilize them. This paper examines the water resource challenges for a large basin in northern Patagonia, Argentina and utilizes the Robust Decision Support (RDS) framework to evaluate trade-offs and strategies in a participatory process that included researchers and decision-makers. Integrated water resources models using simulation modeling and decision space visualization show significant climate change impacts, which are augmented with irrigated agriculture expansion and increasing hydropower production.

1. Introduction

In the realm of water planning, the complexity of watershed management is characterized by the interaction of natural, human, and economic components in a system. These various components have competing water demands and operate at different scales. Places with thriving economic development, such as the Patagonia region of Argentina, require sophisticated tools and informed processes to ensure the sustainable management of water resources in a changing climate.
Addressing the natural complexity of watersheds requires modeling tools that represent the relevant physical processes of the hydrological cycle within a watershed. A robust simulation model for water resources planning can adequately describe the complexity of the different activities within a basin [1,2,3,4,5,6,7]. This type of simulation model can capture interacting subsystems such as agriculture, urban areas, and politically-imposed environmental constraints (such as instream flow requirements and the hydrological implications of conservation areas). Multi-component simulation models can represent the non-linearity of key variable changes in a system and the non-separable spatial and temporal dependencies [8,9]. The Water Evaluation and Planning (WEAP) system simulation model [3] has been used to capture the aforementioned aspects in different watersheds around the world [10,11,12,13,14].
This study uses the WEAP system to capture the complexity of Argentina’s Patagonia basin and evaluate how various strategies could mitigate climate impacts on agriculture, canal capacity and environmental flows. It finds that agricultural expansion in the region could increase the severity of climate impacts and identifies broad strategies to help meet both development and environmental goals.
It also demonstrates the use of the Robust Decision Support framework to inform policy-making in a decentralized system, with multiple jurisdictions and decision-making bodies. RDS uses a participatory process for the identification of plausible futures [15,16], the evaluation of trade-offs between multiple scenarios, the identification of robust strategies, and an iterative analysis of vulnerability adaptation. The RDS framework requires the development of new and sophisticated tools to effectively transform complex ensemble data into key scientific insights and effectively analyze and communicate the information to policymakers [17,18,19,20,21].
Scientists need to respond to policymakers’ challenges within their institutional framework to effectively link scientific information and policy-making mechanisms [22,23,24,25,26]. The deep uncertainty of future conditions adds to modeling and decision-making complexities. Stakeholders and water managers are facing new challenges as environmental conditions shift under climate change, as water requirements increase for cities, and as irrigated agriculture intensifies [12,19,22,23,24]. Deep uncertainty is defined as situations “where analysts do not know, or the parties to a decision cannot agree on, (1) the appropriate conceptual models that describe the relationships among the key driving forces that will shape the long-term future, (2) the probability distributions used to represent uncertainty about key variables and parameters in the mathematical representations of these conceptual models, and/or (3) how to value the desirability of alternative outcomes.” Therefore, the decision-making process requires a shift from a deterministic future to robust adaptation decisions that could be evaluated within a wide range of plausible options about future conditions [27].
Visualization tools for the communication of multifaceted simulation modeling output under a participatory setting provide a common frame and facilitate the discussion of potential actions (Forni et al., 2016). The development of comprehensive institutional frameworks that support integrated robust decision-making processes must accompany advances in scientific modeling and large output data visualizations [28,29,30,31,32].
The purpose of this study was to work with local and regional agencies to understand climate change impacts in the region, as well as help formulate integrated water resources options for long-term planning in the Limay, Neuquén, and Negro River basins in northern Patagonia, Argentina. Watershed management modeling is technically complex and must account for future uncertainties and changing environmental conditions. The RDS framework supported this process and helped develop complex technical results concerning water governance in the region.

2. Materials and Methods

This section provides an overview of the Limay, Neuquén, and Negro River basins and the government-evaluated water management strategies adopted in the region. A discussion of the methodologies chosen for this research follows.

2.1. General Description of the Basin

The Limay, Neuquén, and Negro River basins are in the northern section of the Argentinian Patagonia, covering an area of 140,000 km2 that is primarily the territory of the Province of Neuquén. The river basins extend into both the Provinces of Río Negro, and Buenos Aires (Figure 1). The Neuquén River, with an average flow of 280 m3/s, drains an area of 30,000 km2. The Limay River has an average flow of 650 m3/s and drains an area of 56,000 km². Both form the Negro River that drains a basin of 116,000 km2, with an average flow of 930 m3/s.
The runoff regime of the Limay and Neuquén Rivers is pluvio-nival, with floods in winter from rainfall and floods in the spring and summer from snowmelt. Most of the precipitation, or 3500 mm annually, occurs in the eastern foothills of the Andes, but decreases drastically to less than 200 mm annually, on the eastern side. The vegetation cover of the Neuquén basin is sparse, with no relevant natural forest areas, and with scattered shrubland and low-lying pastures. In contrast, the Limay River basin is characterized by dense forests in the western sector with decreasing vegetation towards the east due to the reduction in rainfall. The Negro River moves through arid plateaus with a valley of variable width where the vegetation is of a shrub type, and where there is little development characteristic of semi-arid regions.
Along these rivers are located several hydroelectric plants, five on the Limay River and one on the Neuquén River. The hydroelectric system totals approximately 5000 MW of installed capacity, representing 15% of the national electricity supply. Fruit and vegetable farming covers more than 10 million hectares of irrigated valleys and is one of the pillars of the region s economy. The Neuquén hydrocarbon basin has the highest proven oil reserves in Argentina, currently contributing 55% of the country’s production of oil and 42.5% of its production of natural gas. The area also holds 40% of the country’s untapped natural gas.
In the last 20 years, there has been a marked negative trend in river flows, with a mean annual flow reduction of up to 30%. Recently developed climatic scenarios point to a potential future increase in water stress in the Comahue region and a substantial change in the pluvio-nival regime.

2.2. Water Resources Governance in the Comahue Region, Argentina

Each provincial state in Argentina is responsible for the planning and management of its own water resources; it must coordinate management with other jurisdictions for shared water resources. In the Comahue region, this function is exercised by the Interjurisdictional Authority of the Limay, Neuquén and Negro River basins (AIC), in which representatives of the provinces of Neuquén, Río Negro, Buenos Aires and the national state participate. In the Comahue region, municipalities and water users are encouraged to participate in decision-making. AIC seeks to promote the effective participation of the water community and society in general in defining the objectives of water planning and management control.

2.3. Description of Robust Decision Support Framework

In the Comahue region, an adapted version of the RDS process was employed as shown in the shaded areas of Table 1, where only the shaded boxes were implemented covering Steps 3–7 of the RDS methodology. The duration of the project lasted four years (2012–2016) and included WEAP training and a series of participatory workshops. It started with a WEAP training attended by more than 30 people from water governance institutions, universities and various agencies. After the training these group of stakeholders participated to a problem formulation workshop. Data input and model validation tasks were consulted with a subset of those local institutions that conformed the focus group: Autoridad Interjurisdiccional de Cuencas de los ríos Limay, Neuquén y Negro (AIC); Departamento Provincial de Aguas de Río Negro (DPA); and Subsecretaría Provincial de Recursos Hídricos de Neuquén (SPRH).
Specifically, the methodology included: (1) the formulation of the problem by periodically connecting with decision-makers (Section 2.4); (2) simulation of the different components of the system (hydrology, hydropower, other uses, demand priorities, restrictions, etc.) using the WEAP model on a monthly basis (Section 2.5); and (3) the construction of a decision space visualization for presenting, communicating and facilitating a discussion of model ensemble output (Section 2.6).

2.4. Problem Formulation with XLRM

A problem formulation framework, called the XLRM [33] which abbreviation is derived from the components described below, divides a decision challenge into four components. The first component of XLRM relates to the eXogenous factors (X), or uncertainties, that are outside the control of the decision-makers but could greatly impact the system’s performance outcomes. One example of uncertainty about future conditions are the impacts of climate change on the hydrology. The second component relates to the management Levers (L), or strategies that decision-makers can adopt in pursuing their management objectives. An example is the construction of reservoirs for hydropower production and canals to improve the distribution of water. The third component comprises the analytical tools used to represent the often-complex Relationships (R) between uncertainties and strategies (X and L); in this case, the WEAP model was used to simulate responses within a hydrological water management system. The final component of the XLRM is Management outcomes (M), used to measure the success of decision-makers’ policy options or investments.

2.5. Water Resources Systems Planning Using WEAP

The WEAP modeling platform provides an integrated approach to water resources planning by linking hydrologic processes, system operations and end-use representations within a single analytical platform [3]. It includes the multiple dimensions critical to water resources management, such as surface water and groundwater hydrology, water quality, stream-aquifer and stream-floodplain interactions, as well as ecosystem function. WEAP can be executed at various time steps including monthly and annually, making WEAP a suitable choice for use in the case study.

2.6. Decision Space Visualization

Effectively communicated model output is critical to effective decision-making. WEAP model outputs correspond to the performance metrics (M) from the XLRM framework. Stakeholders can explore and interact with the visualization in three progressive steps that transform the model output to meaningful information. Forni et al. (2016) describes three steps for Decision Space Visualizations (DSVs) that account for knowledge exchange and help construct a shared mental model of a region’s water resources system regarding its current state, future challenges, and opportunities. The three steps as shown in Figure 2 are: (1) analysis of modeling output time series; (2) data fusion to a single value form; and (3) decision space visualization. In the case study, this visualization methodology was implemented to present ensemble model output results in a participatory and interactive process.

3. Results

WEAP Model

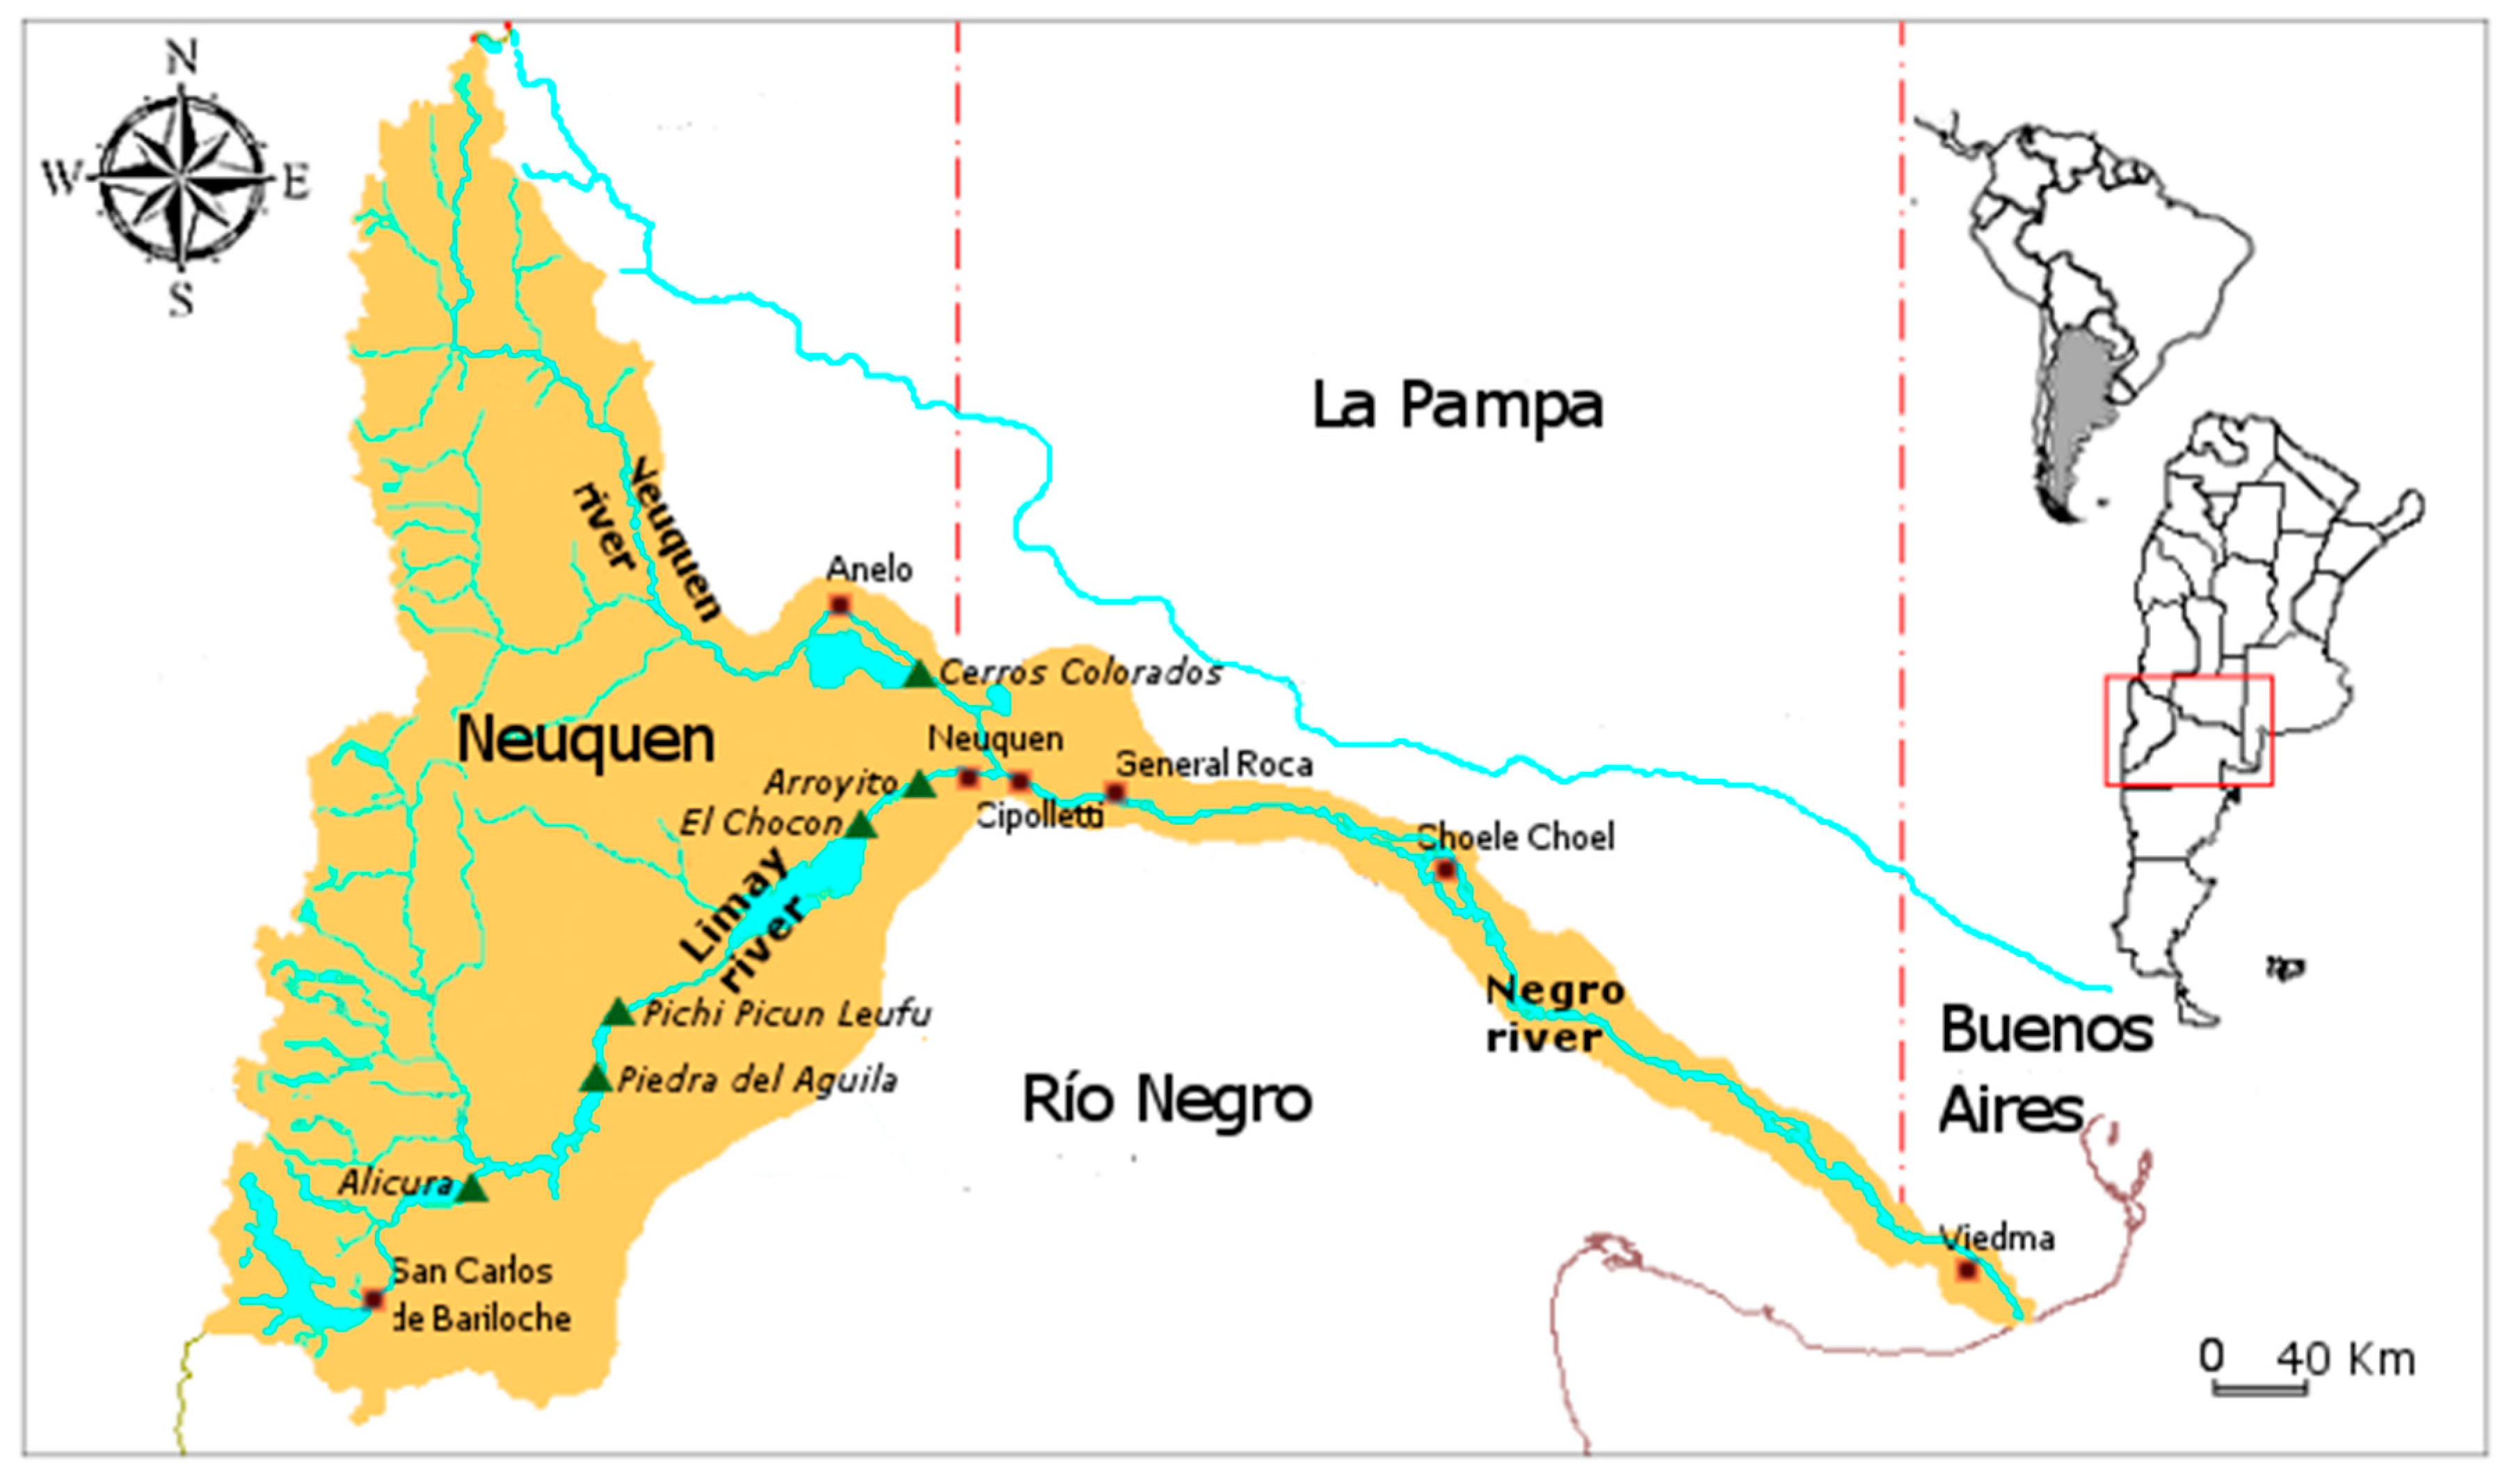
The WEAP model was used to simulate the Limay–Neuquén–Negro system. The construction of the model had two components: (1) a supply component represented by the WEAP hydrological module to estimate the runoff as a function of precipitation and other hydrological processes that occur in the upper-river basin; and (2) a requirement component representing agricultural and urban water demands, as well as artificial reservoirs/hydropower plants located downstream and operated under system restrictions. The supply component uses a set of algorithms to represent rainfall–runoff processes with the objective of simulating the observed river flows at a satisfactory level of approximation. The requirement component is also modeled in WEAP and considers agricultural, industrial, urban, and other uses. Sub-basin delineation was made based on contributions to the main river flows and based on the data availability of hydro meteorological stations supporting an adequate calibration of the model. This resulted in nine sub-basins with a total area of 53,236 km2 (Table 2). Each of the sub-basins was discretized into 400-meter elevation bands constituting the hydrological units—or catchments—in which the WEAP two-layer soil moisture method was applied [3]. This method is based on empirical functions that describe the processes of snow accumulation/melt, infiltration, evapotranspiration, surface and subsurface runoff, deep percolation, and base flow runoff.
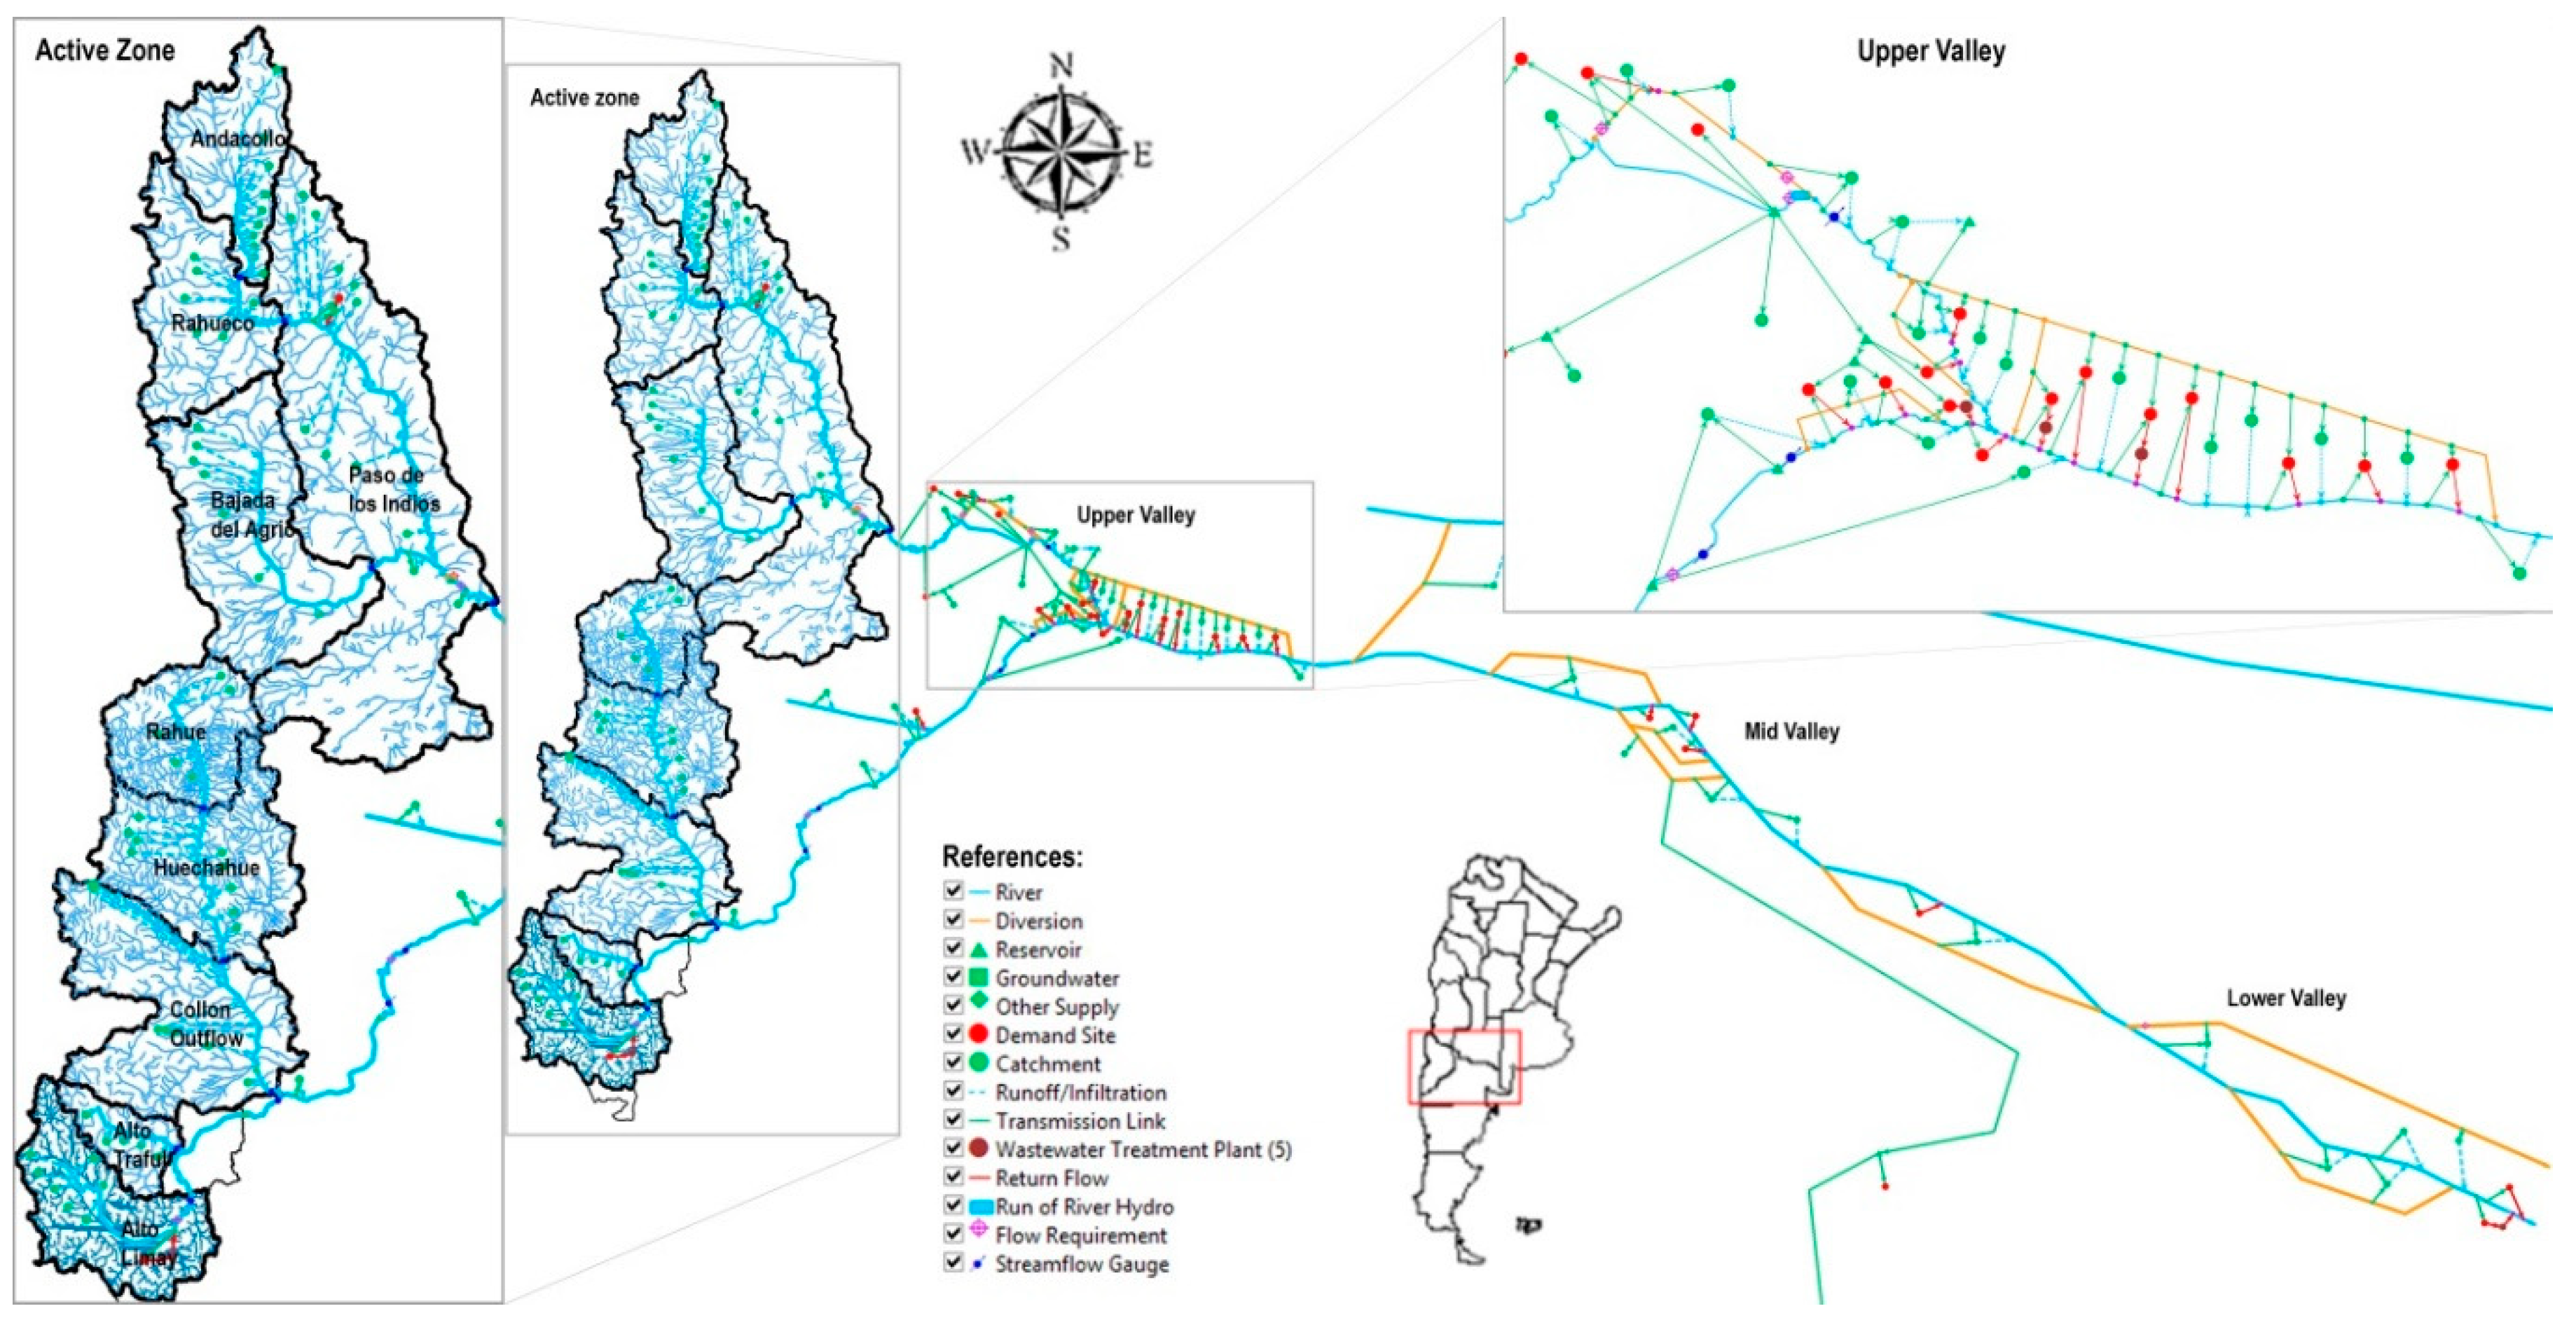
The simulation was performed on a monthly scale covering the period between January 2000 and December 2010. Input data provided by the AIC corresponded to precipitation, temperature, relative humidity, wind velocity (available for 27 meteorological stations), snow accumulation, and albedo. Vegetation coverage data were also available for evapotranspiration estimation purposes within the model (forest and meadow/steppe). The model included five hydropower dams located in the Limay River, of which two have seasonal regulation capacity (Piedra del Aguila and Chocón); the model also included the Cerros Colorados Complex, a facility in the Neuquén River that consists of two reservoirs and a hydroelectric power station. The model simulated the demands of urban centers, agricultural areas under irrigation, exploitation of conventional and non-conventional hydrocarbons, transfers, and hydroelectric generation up to the mouth of the Negro River as shown in Figure 3.
Seasonal reservoirs were geometrically represented by a water level–volume curve, and model parameters were related to their capacity of energy generation. The simulation of the reservoir operation assumed the current norms of operation and orders of priority for water storage and hydropower generation. Non-seasonal reservoirs were simply represented as passing power plants with no storage capacity. The goodness of fit of the calibrated model for the 2000–2010 period was evaluated using statistical standards. The comparison of simulated and observed flows ensures the goodness of fit at different control points in the watershed (Table 3).
Once the WEAP model application of the Comahue region was calibrated to accurately represent the basin, a series of scenarios were developed and implemented. These scenarios were identified by local stakeholders in a Problem Formulation activity using the XLRM framework.
Participants included the provincial Water Department of the Rio Negro Province (DPA), the Under Secretary of Water Resources of Neuquén province (SSRH), the AIC, research team members from the local university, and local project partners.
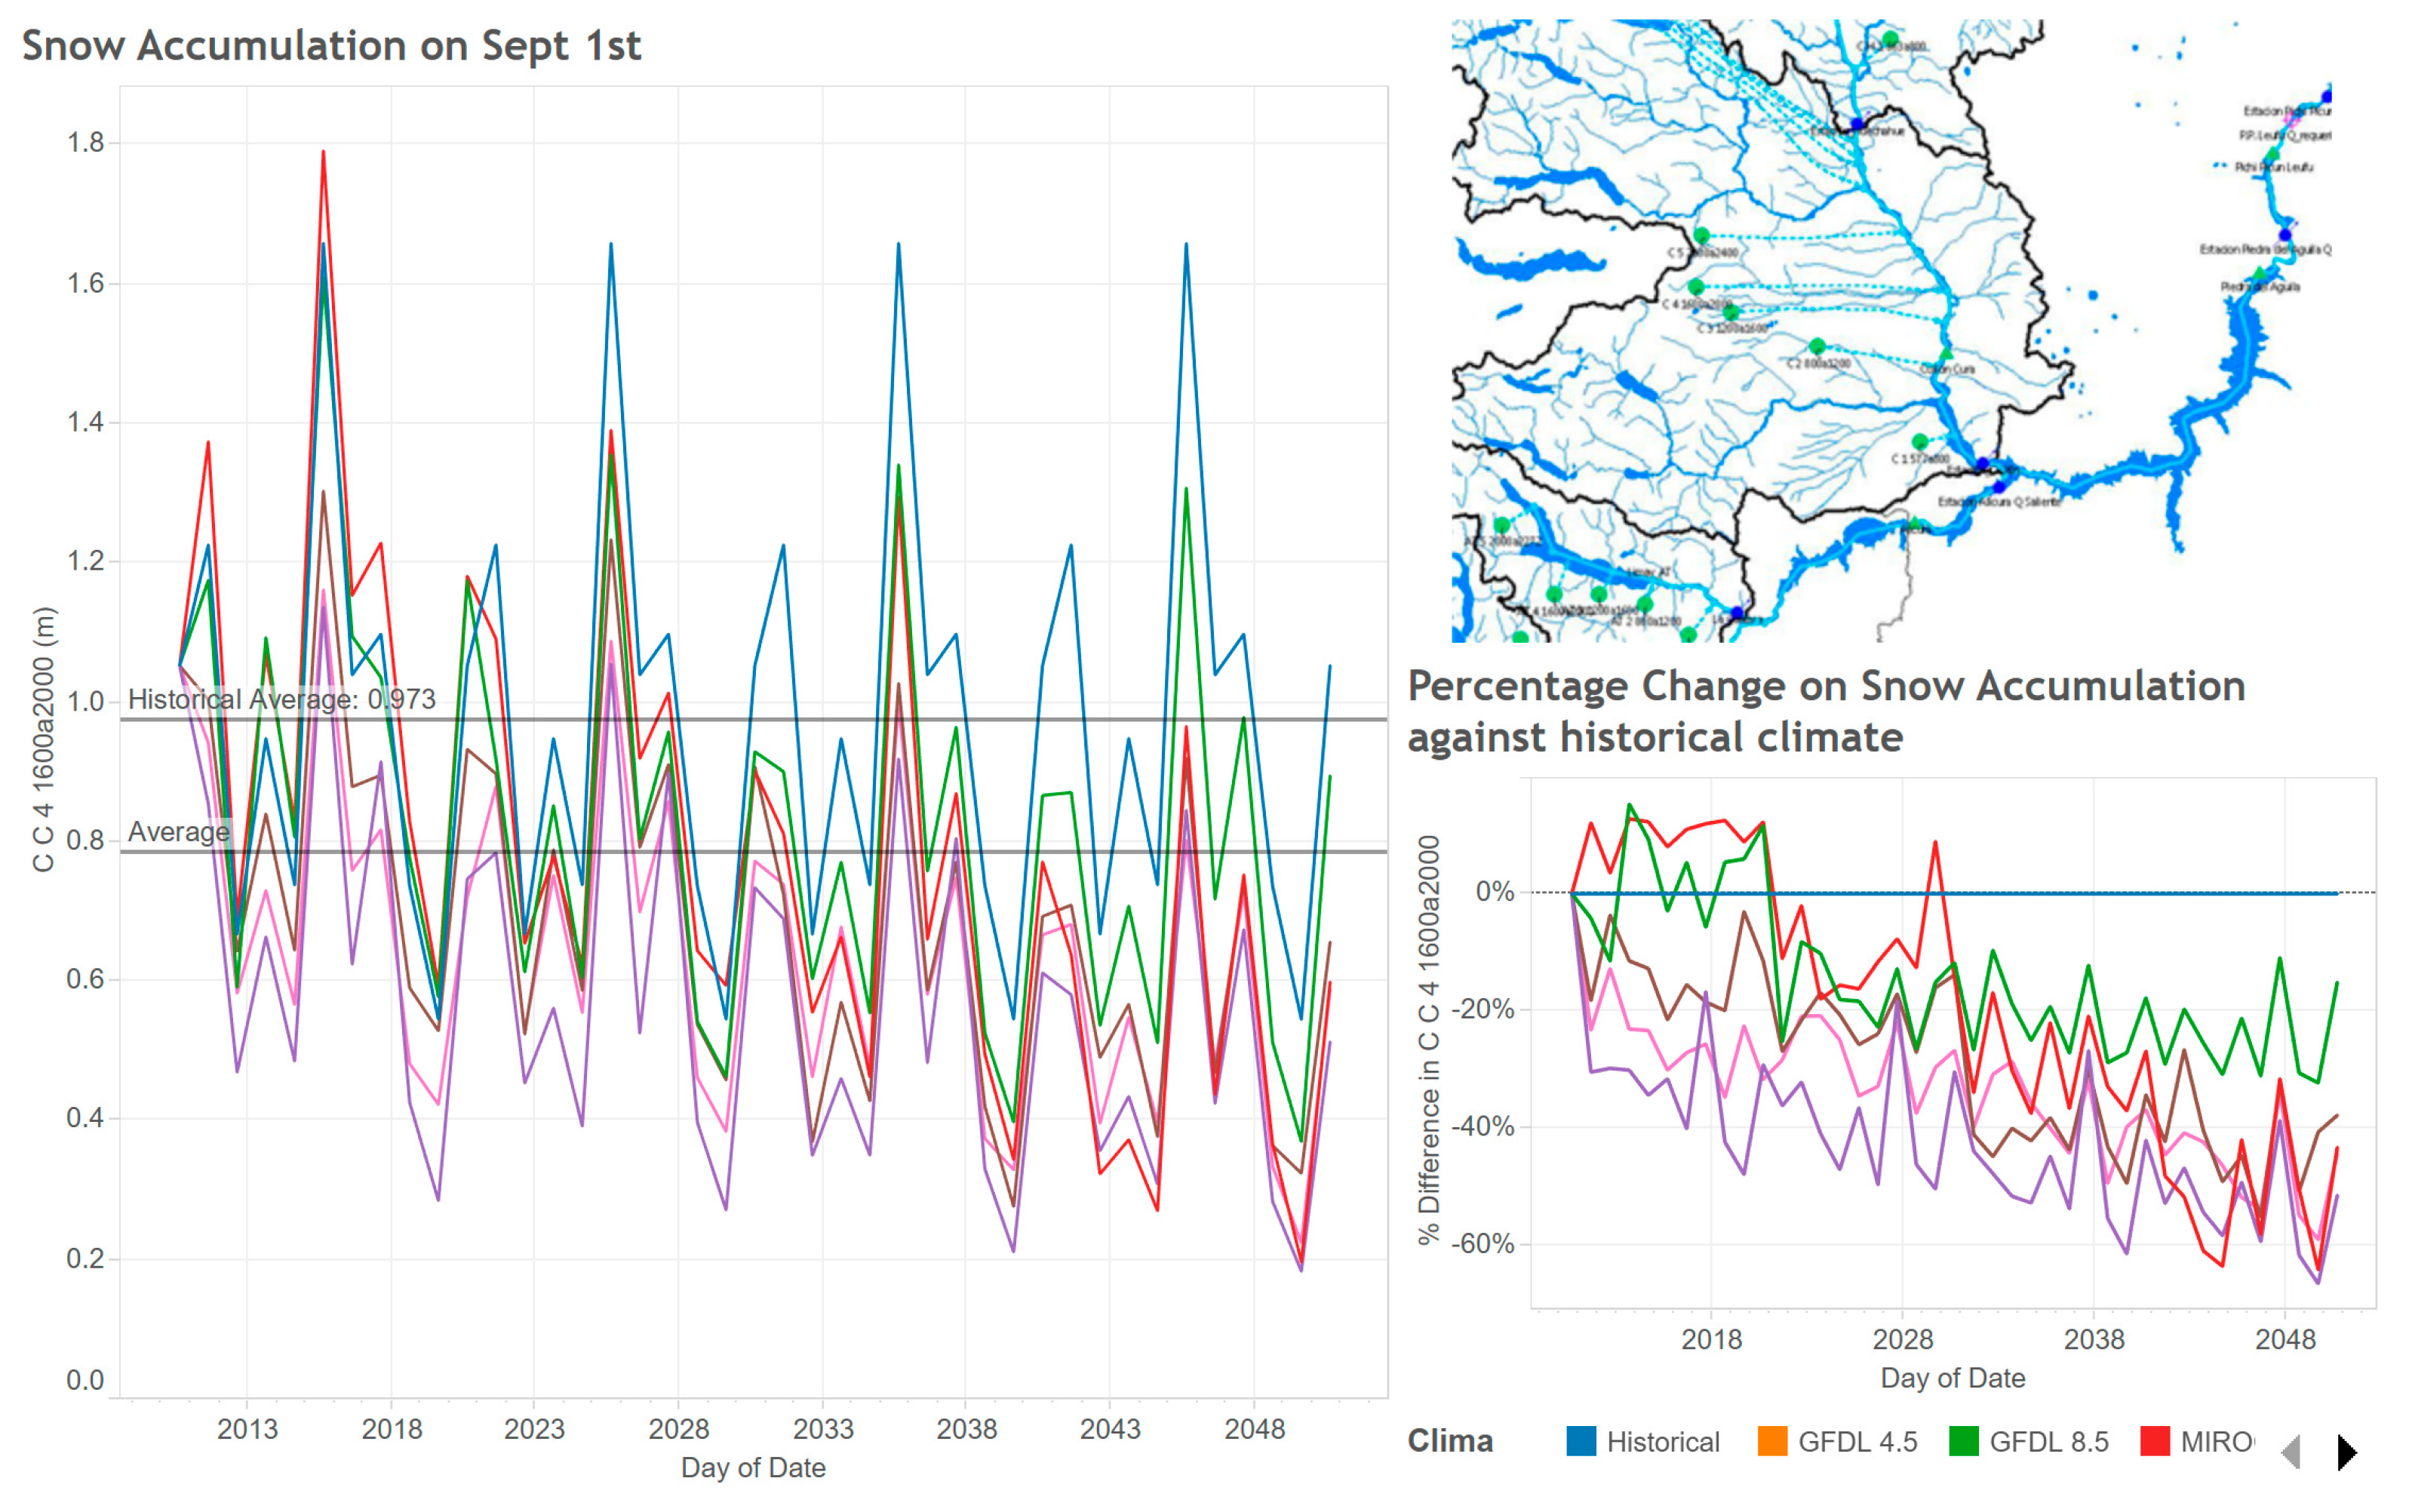
One of the key sources of uncertainty in the system was climate. Working with the Centro de Investigaciones del Mar y la Atmósfera (CIMA), a set of climate projections were developed to represent the likely climate impacts to the system from 2016 to 2050 in WEAP (Figure 4). The selection of the climate model was based on climate similarities with the Comahue region. A second uncertainty was the potential expansion of the agricultural region and the introduction of higher value crops. This was a concern for water managers in charge of supplying irrigation water during the summer months. Table 4 contains a list of the considered uncertainties and the various projections developed for each of those uncertainties.
Strategies were identified as potential actions that decision-makers could take. Because of the increasing agricultural irrigation requirements, these included the reduction in water losses in the canal system, the incorporation of new technologies related to irrigation efficiency, and the development of irrigation canals. While agriculture was considered a large consumptive user, urban conservation strategies were encouraged because of the large losses in the urban water infrastructure system. Multi-purpose reservoir development was considered for increasing water storage, as well as for increasing the production of hydropower. Table 5 contains a list of the strategies evaluated in the study and a brief description each strategy.
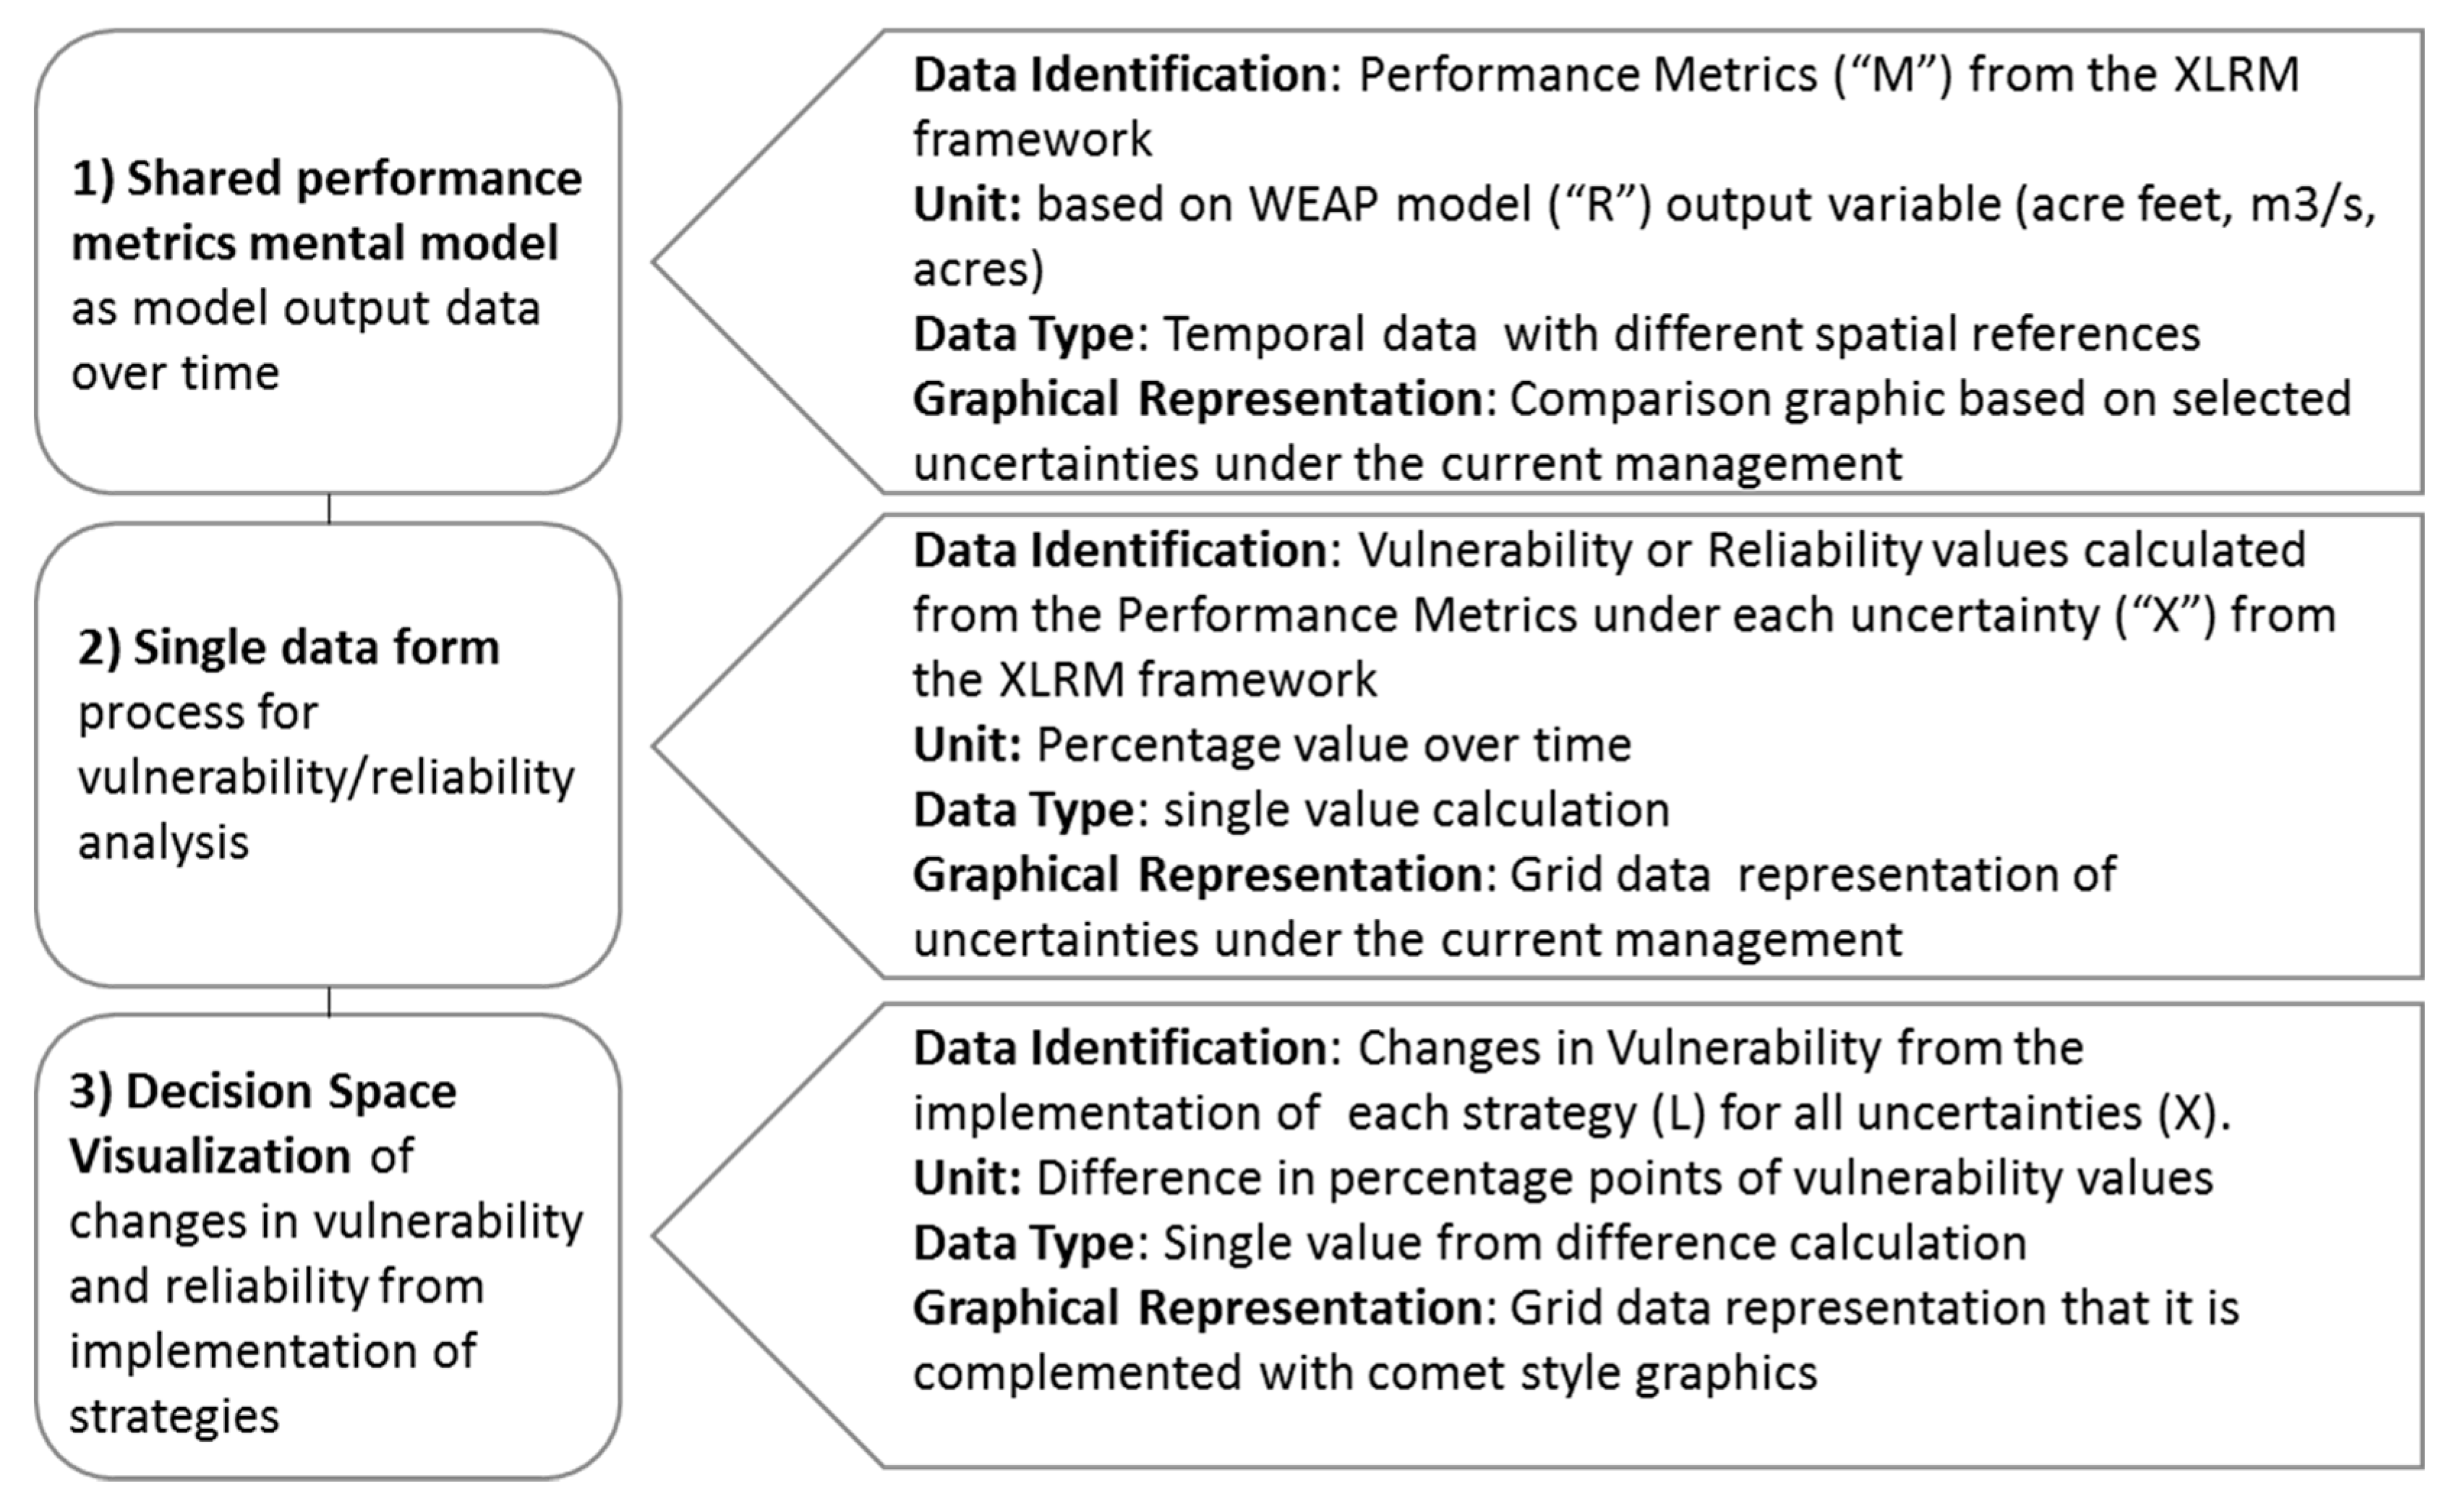
The outcomes of the various management actions were evaluated through performance metrics. These metrics were utilized to assess the impacts of the uncertainties and evaluate the effectiveness of the proposed strategies based on decision-making management objectives. Table 6 contains a list of performance metrics and their corresponding management objectives.
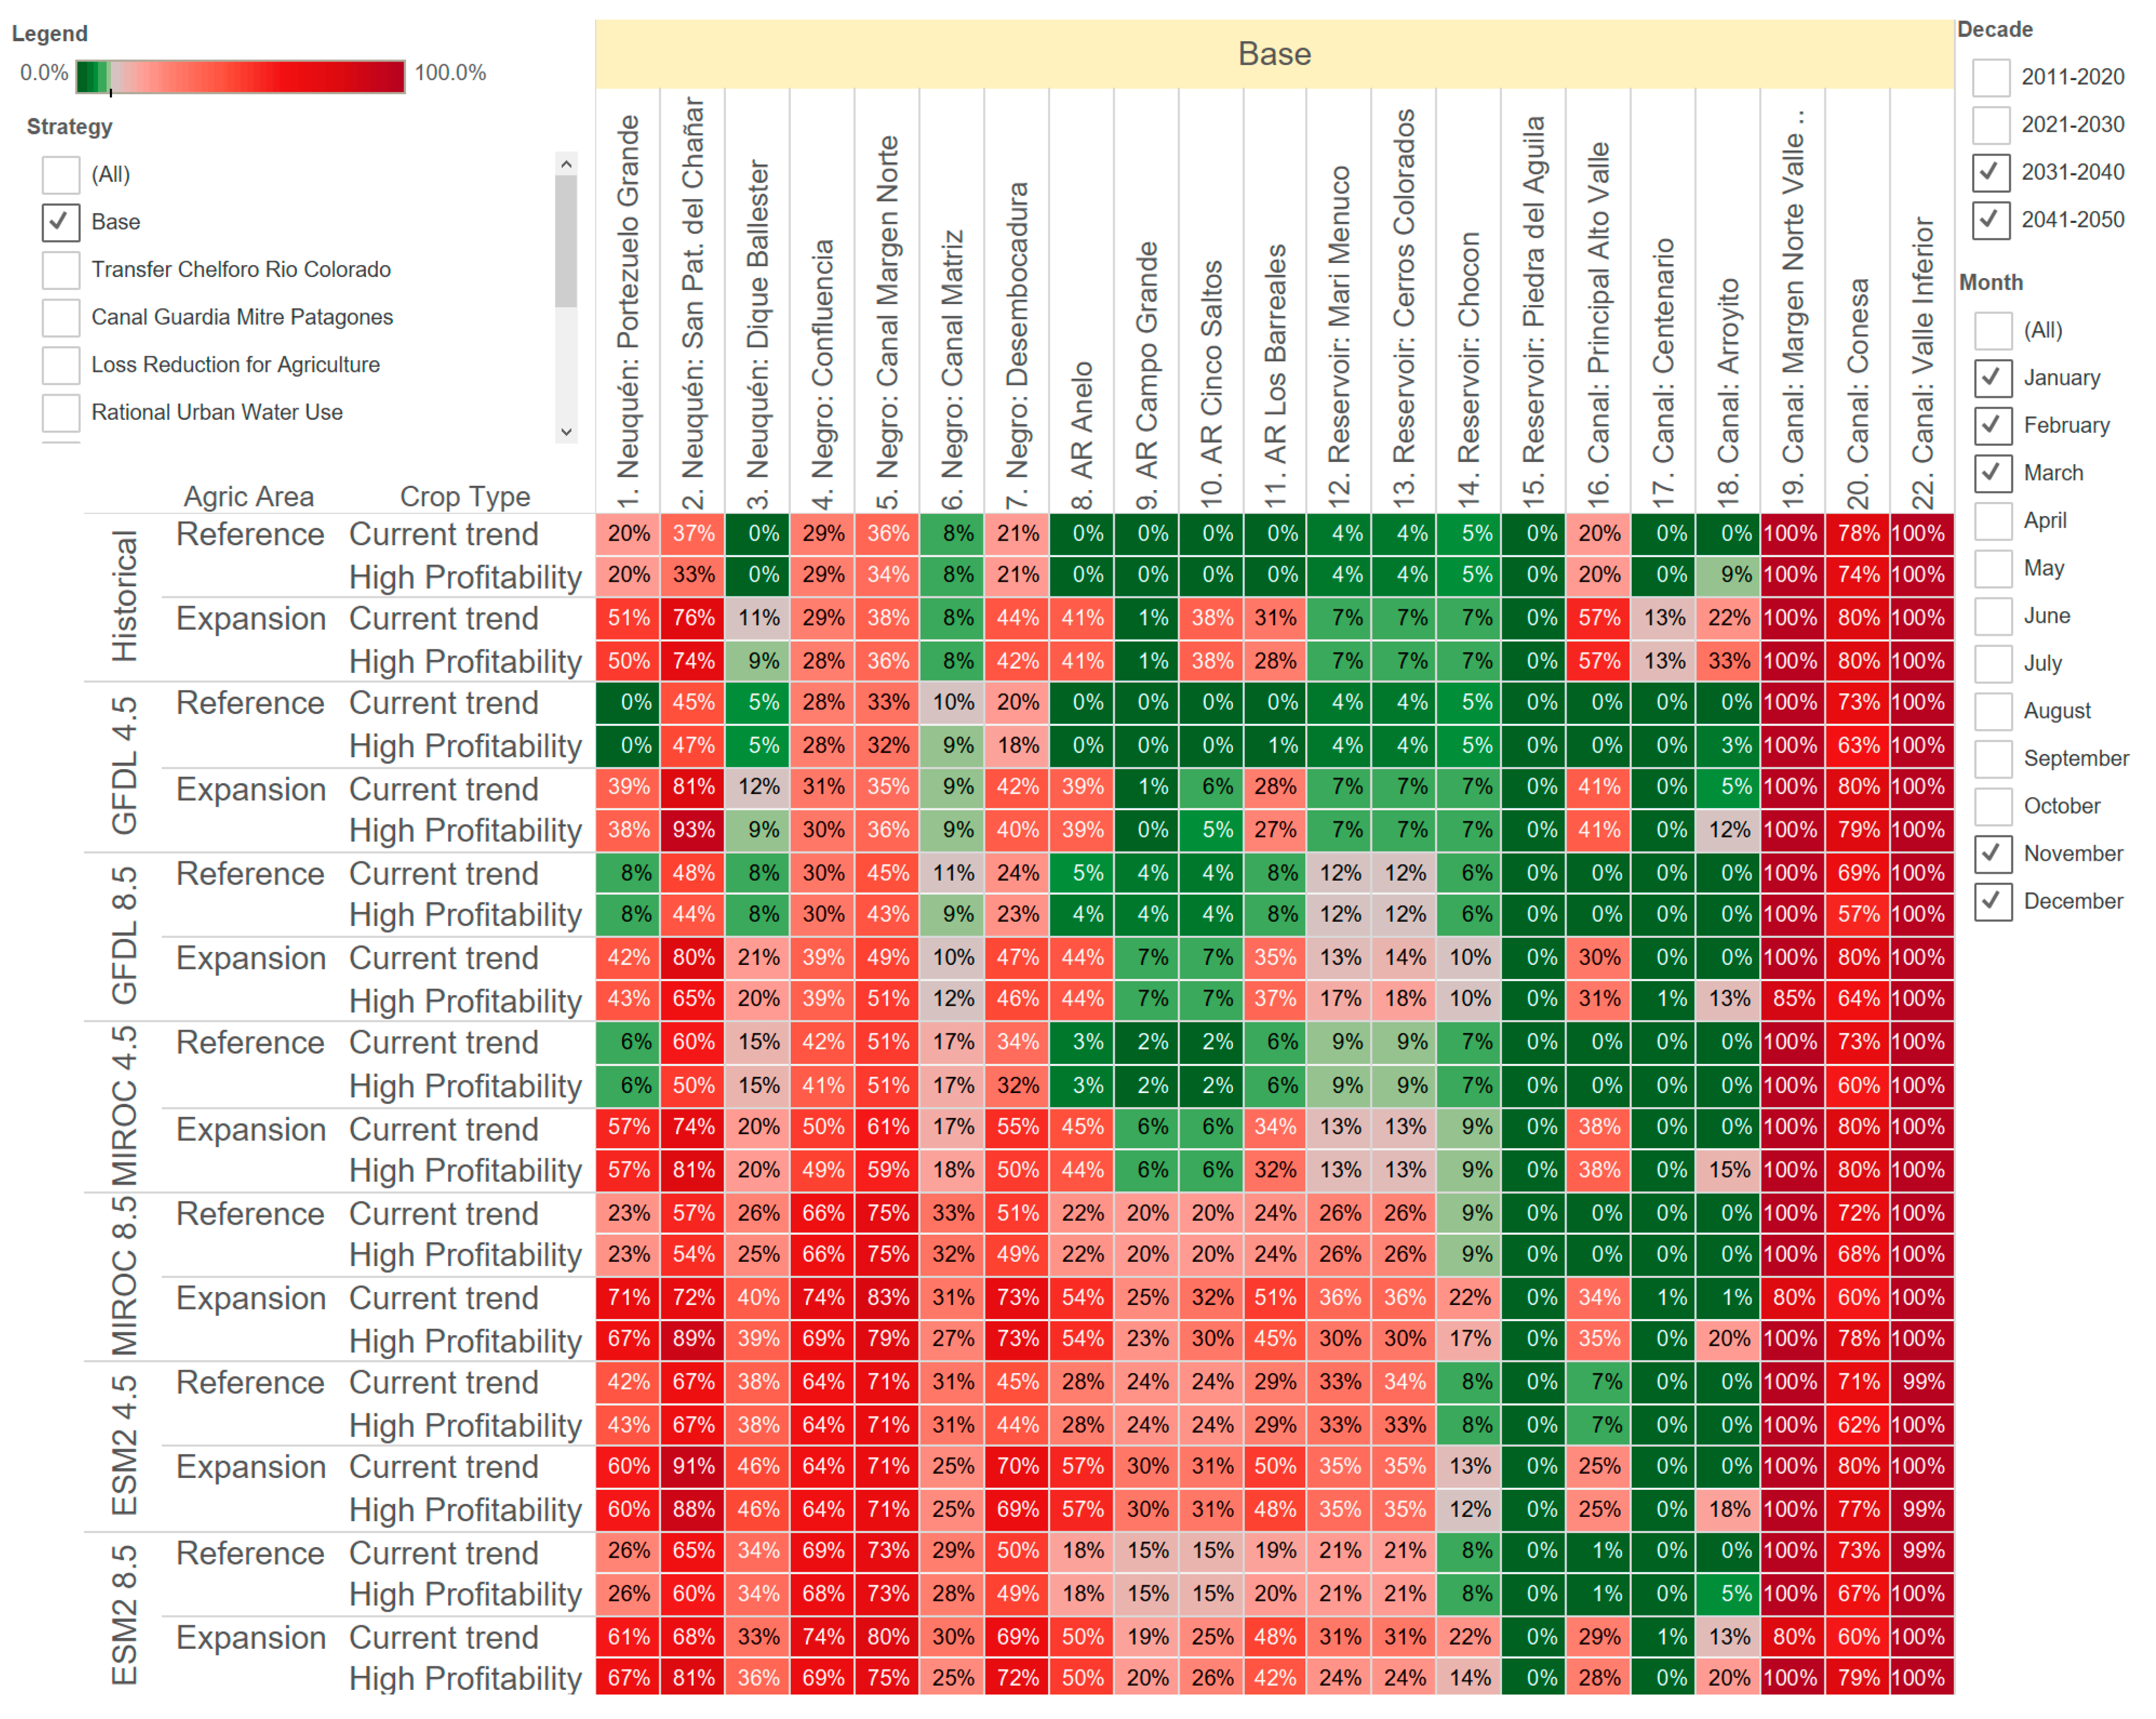
All scenario ensemble results can be accessed via a link to an interactive Tableau Public visualization platform, included in the captions for Figures 6 and 7. 
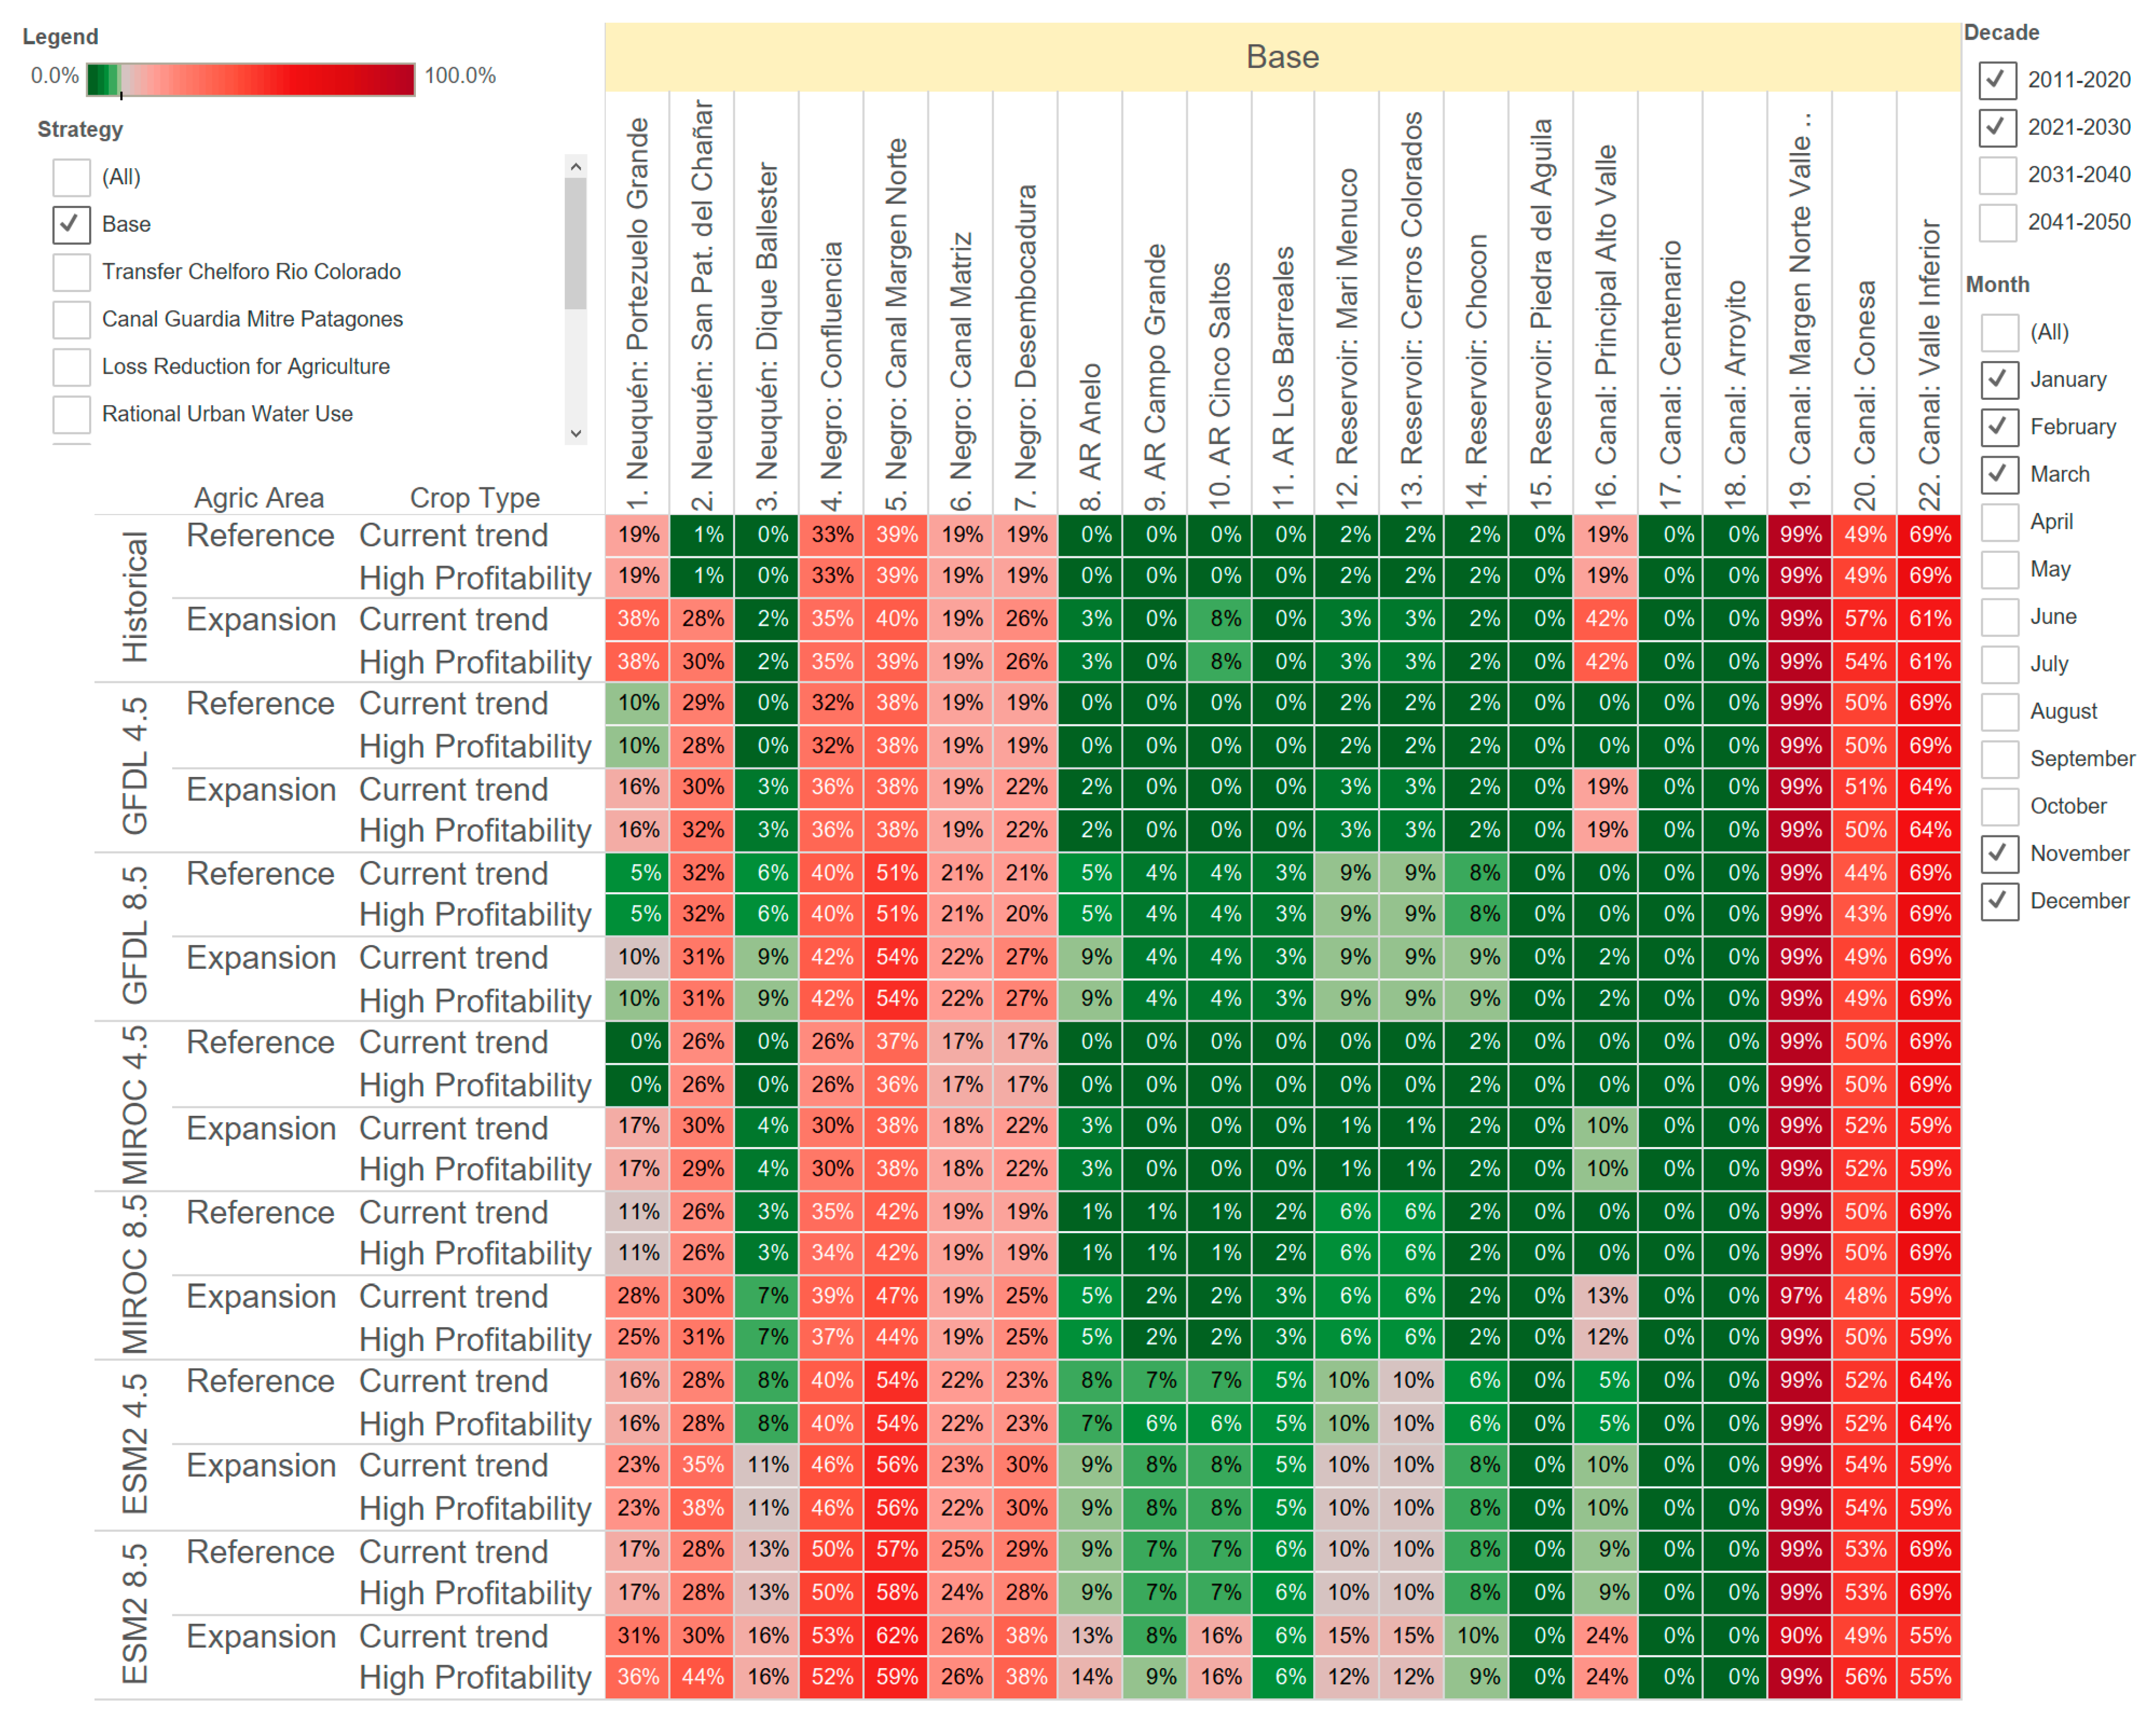
Figure 5 shows the main impacts of the uncertainties under the current management, i.e., if no strategy is considered in the short-term. Figure 6 show those impacts in the long-term. The impacts of the recognized future uncertainties on the performance metrics are represented as the frequency of failure of each of the performance metrics based on the thresholds described in Table 6. The frequency of failure is estimated by calculating the percentage of times that specific metric results are below (or above, depending on the metric) the established threshold. This failure is shown as a value in percentage terms and also by the color dimension in the graphic. The cut-off point between red and green was not set arbitrarily; it was set based on a discussion with stakeholders of what they would consider an undesired percentage value of failures. The visualization is structured to look at the long-term impacts by selecting the data corresponding to specific decades of the time horizon of the results (e.g., 2011–2020, 2021–2030, 2031–2040, and 2041–2050). In addition, users can select the month of the year to analyze impacts in specific times of the year (e.g., summer months vs. winter months).
Under the current management, environmental flows (Metrics 1–7) are below acceptable levels during the summer months (November, December, January, February, and March). These impacts are more evident in the Neuquén River reach at San Patricio del Chañar, Confluencia, Canal Margen Norte and Desembocadura (Metrics 2, 4, 5, and 7). Figure 5 shows the short-term impacts and Figure 6 the long terms impacts. Long-term impacts of climate change are more significant on the ecological flows, primarily in the scenarios that examine the potential expansion of agricultural areas and climate model ESM2. In the long term, all environmental flows are negatively impacted under ESM2 climate projection. Changes in cropping patterns (shown as High Profitability) show no difference from current trends in the impacts on ecological flows.
The ESM2 climate projections for the long-term show that during the irrigation season (summer), water demand for agricultural areas (performance metrics 8 through 11) is not met, specifically in areas that depend on the Neuquén River between Portezuelo Grande and El Chañar. While in the short-term the agricultural expansion seems feasible, the failures are greatly magnified in the long-term. However, there is little difference in the water demand satisfaction between the High Profitability crop scenario and the Current Trend scenario. For the other climate projections, GFDL and MIROC, negative impacts only show up for the potential expansion of agricultural areas for Anelo, Cinco Saltos and Los Barreales in the long-term.
Under the ESM2 climate projections for the long-term, the Mari Menuco and Cerros Colorados reservoirs fail to have the minimum levels required for normal operations. In the scenarios of agricultural expansion, the failures increase slightly. Cropping pattern changes do not affect reservoir storages. Short-term results show no failures for all scenarios except ESM2 climate projections.
For the Canal metrics, the failures of performance are based on reaching the total capacity of the canals because of the higher water demands. The capacity of irrigation canals in Canal Margen Norte Valle Medio, Canal Conesa and Canal Principal Valley Inferior reached their maximum capacity in all scenarios in the short- and long-term.
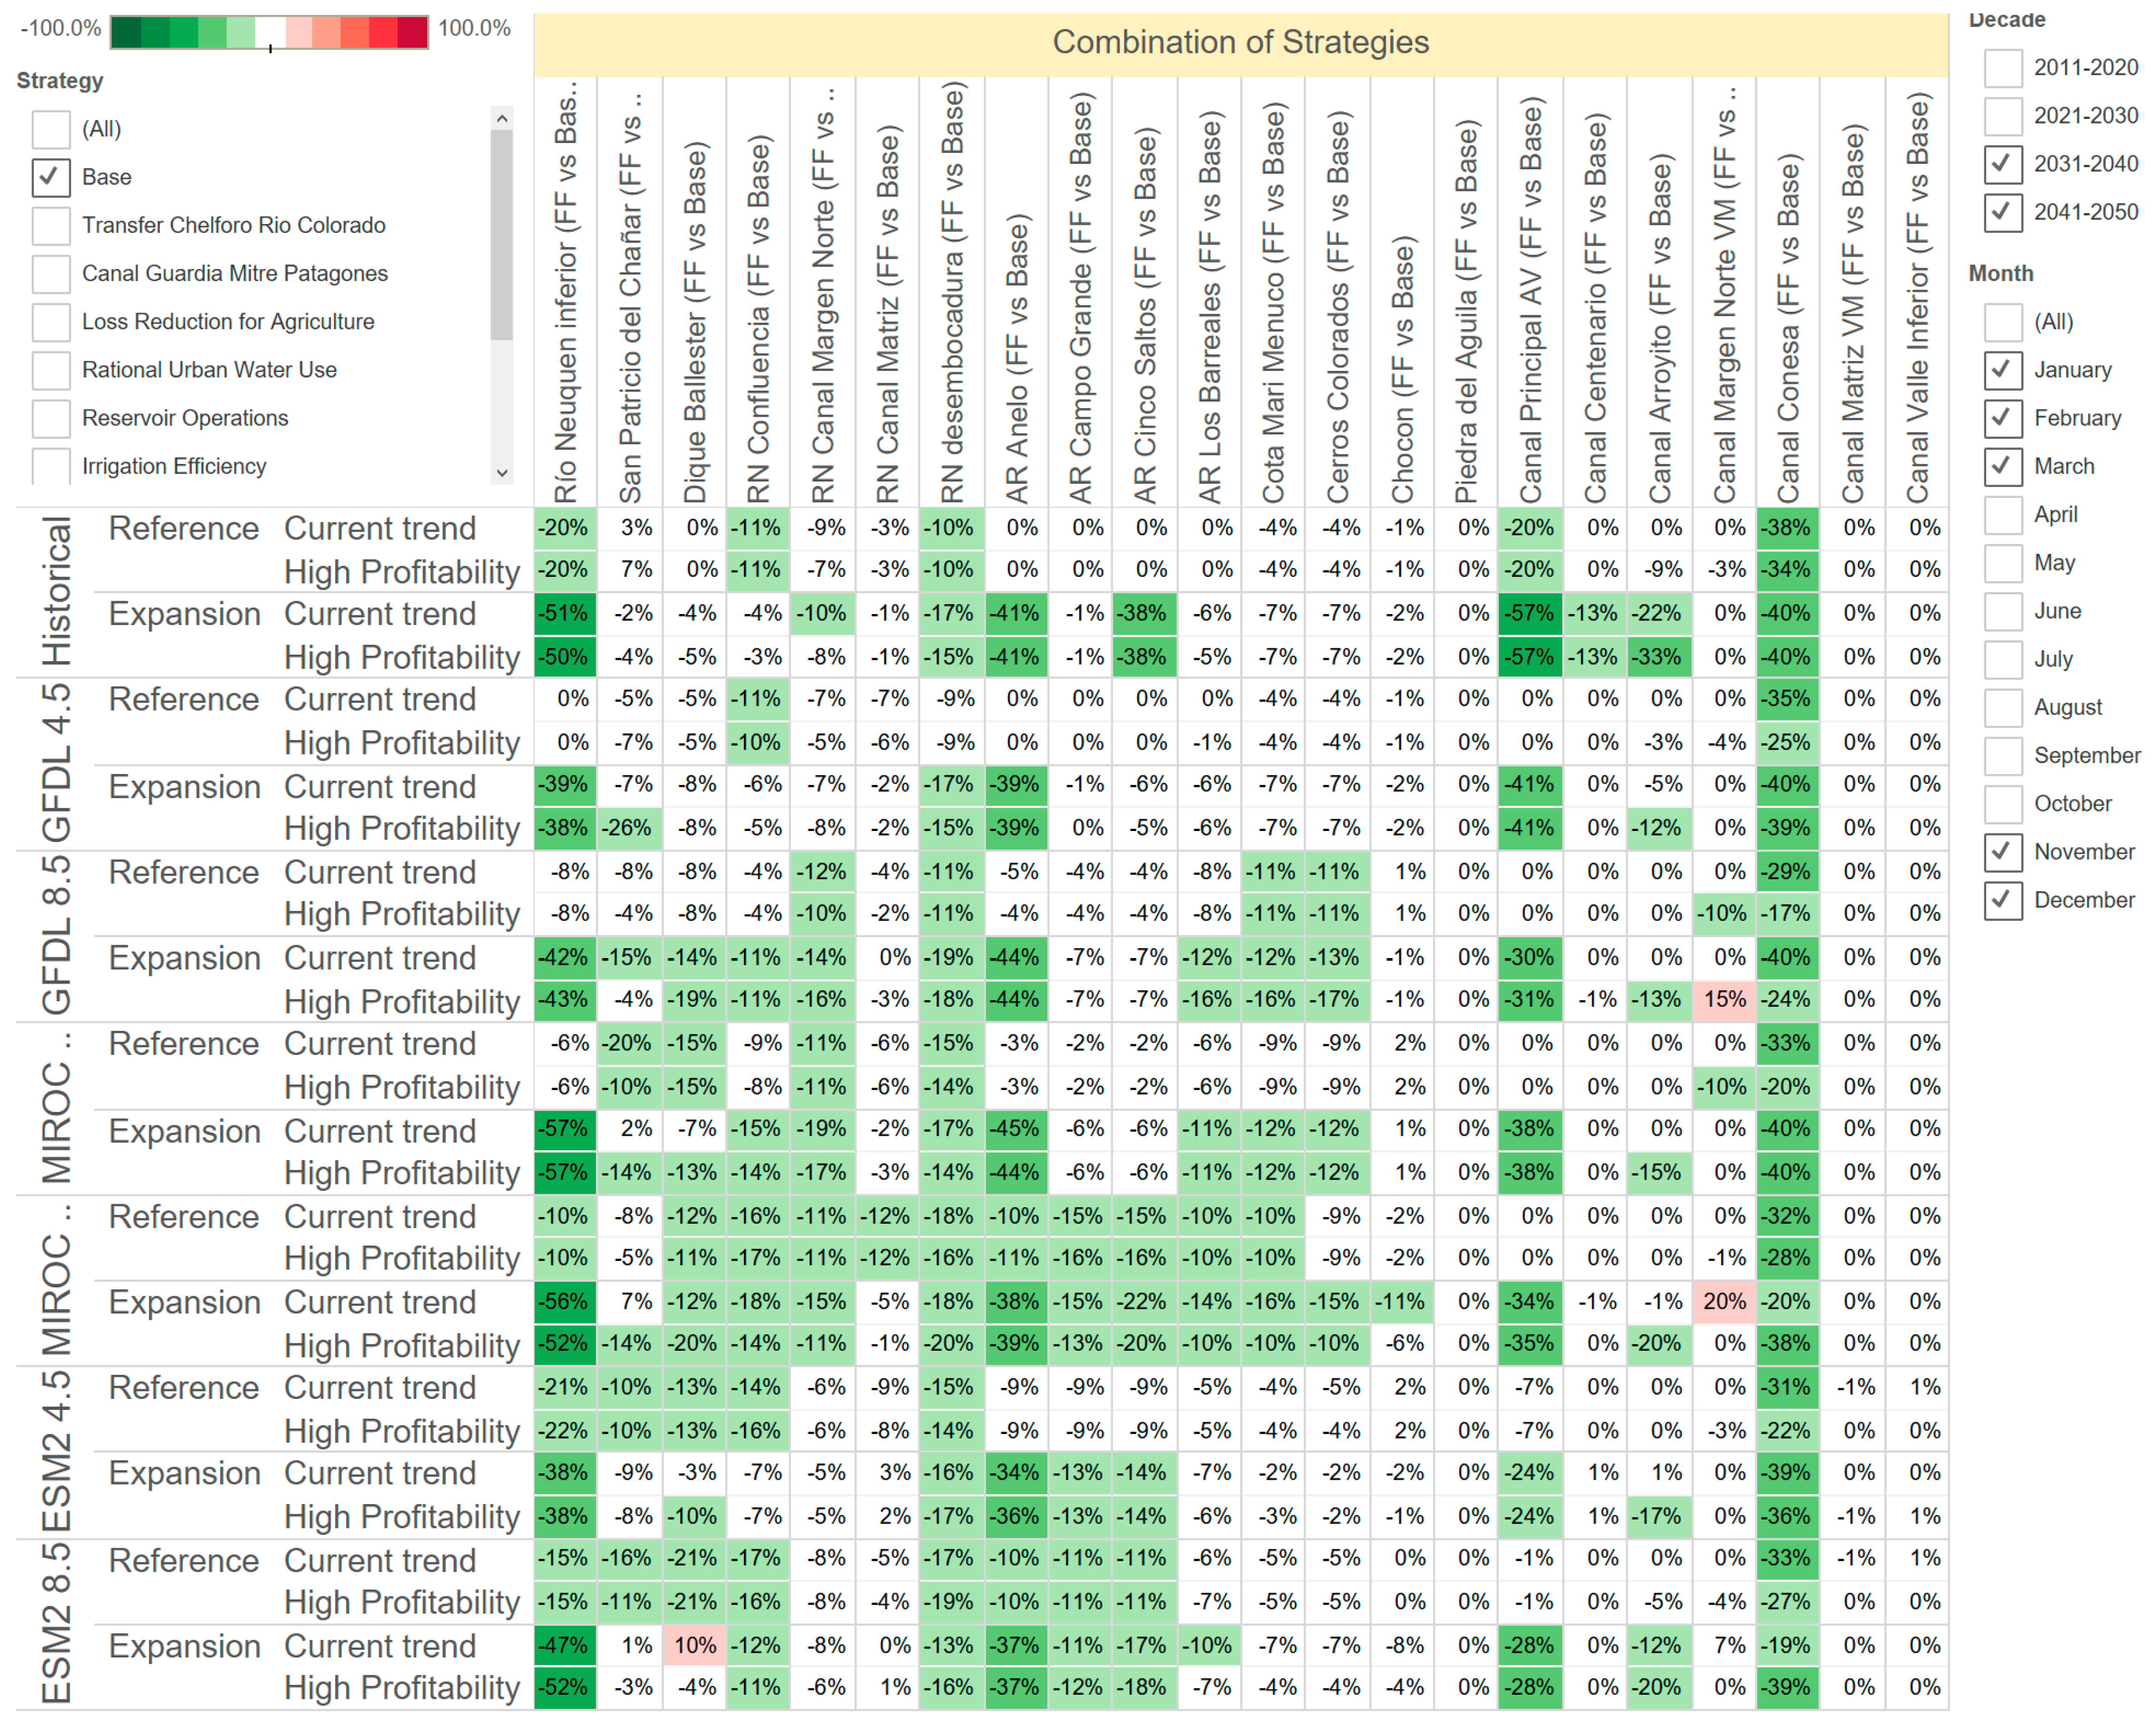
Figure 7 contains an image of the visualization dashboard showing the changes in the frequency of failure when various strategies are implemented. As expected, the strategy that contemplates the combination of all strategies is the one that provides the greater magnitude of impacts. The combination of all strategies includes changes that are more integrated and reduces the failures in all metrics, although in small proportions for some metrics and minimally for Canal Matriz and Canal Valle Inferior. A series of strategies improved the outcome of the region when they were integrated (not evaluated in isolation). Reducing agricultural water losses and implementing irrigation efficiency strategies seem to reduce the negative impacts on environmental flow metrics in the Neuquén River and some of the canal flows, primarily in the scenarios where agricultural production is expanded.
Urban water demand is not shown in the visualization dashboard because it had the highest priority and, therefore, it was always met. Further detail on urban water demands and coverage is needed to assess the extent to which the current system is, and will be, able to meet water demands for domestic use.

4. Discussion

This paper evaluated strategies for climate change adaptation in the northern Patagonia region of Argentina, as a case study to illustrate the use of modeling-based integrated decision support tools.
Connecting with decision-makers and stakeholders is critical to understanding watershed problems in the basin and linking environmental policies to research. Conceptualizing decision-makers’ knowledge of the system builds trust and engages decision-makers in technical and research-based projects.
A key finding of the case study is that the impacts of climate change in the basin will be significant in the long-term, affecting reservoir operations and raising the risk that rivers will not meet environmental flow targets for the protection of the ecology of the basin. The expansion of irrigated agriculture in the region could amplify climate change impacts in the long-term.
This case study presents an interesting analysis of the intersectionality of climate change impacts, sustainable water management, agricultural development, and renewable energy production. The Patagonia region has a thriving agricultural sector and its production of renewable helps cover Argentina’s frequent energy shortages during the summer months. However, the results of this study show that changes in climate could mean trade-offs between preserving natural flows, developing agriculture and supporting renewable energy production. The results also indicate that the capacity of the canals may need to be evaluated; under most climate scenarios, canals reached maximum capacity in the short and long-term. The WEAP model can be a useful tool for water managers to explore strategies related to that.
The strategy that provides the greatest impacts and meets most of the metrics is the combined strategy, i.e. all of them. This is a challenge for decision-makers since that could be very costly. After the combined option, the strategies that perform well are the reduction in agricultural losses and the implementation of irrigation efficiency, mainly for environmental flows and canal flows. Reducing urban water use has no impact at the metrics evaluated, although they could show impacts if the model had a more refined representation of urban water nodes. In addition, urban nodes have the higher priority, and therefore never fail. Changing the reservoir operations strategy shows very little impacts and only on environmental flows. The incorporation of new hydropower plants shows improvements overall. There results can be seen following the Tableau Public link located in the caption of the figures.
Further analysis is needed to evaluate which combination of these strategies could provide optimal levels of performance. Regional water managers are currently receiving capacity-building sessions to use the WEAP model developed; once trained, they will explore potential water management options that were not evaluated in the project.

5. Conclusions

Climate change impacts could be significant in Argentina’s Patagonia basin, especially in the approaching half-century. These impacts could be more severe if agricultural areas expand, and addressing these impacts is essential in meeting reservoir level goals and environmental flow requirements. The project in Argentina ensured the continued use of modeling tools in a decentralized system. The sharing of modeling platforms enabled regional water management institutions to be able to use the WEAP model to evaluate local strategies. A full implementation of the RDS workshop with further innovation in the WEAP model is needed to support scientists and stakeholders navigate the physical and the governance complexity of the Comahue system facilitating the permeation of integrated regional policies.

Author Contributions

M.E., P.C., and M.M. contributed with the writing and editing. M.M., Gustavo Nadal, F.L., L.B., P.C., and C.Y. contributed with the investigation and figures. L.G. and G.N. contributed with investigation and logistical tasks. D.P. and M.E. contributed with supervision and methodology.

Acknowledgments

This study was funded by International Development Research Center (IDRC Grant 107097-001) and led and coordinated by Fundación Bariloche. We especially thank the IDRC team that supported these efforts. We also thank these groups, who contributed their staff time, enthusiasm and knowledge: Universidad Nacional del Comahue; CURE-CNEA (Centro de Conversióny Uso Racional de la Energía de la Comisión Nacional de Energía Atómica); CIMA/UBA-CONICET (Centro de Investigaciones del Mar y la Atmósfera, Universidad de Buenos Aires y Consejo Nacional de Investigaciones Científicas y Tecnológicas); CENEHA/UNL (Centro de Estudios Hidroambientales de la Universidad Nacional del Litoral); Stockholm Environmental Institute-Davis (SEI-Davis); Cooperativa Surgente de Ing. Jacobacci; and PIRNA/FFyL-UBA (Programa en Investigación en Recursos Naturales y Ambiente de la Facultad de Filososfía y Letras de la Universidad de Buenos Aires). We are especially grateful to Carlos Merg (Director de Recursos Hídricos y Ambiente de Río Negro—DPA), [ingeniero Civil] Anibal Asensio (Secretario Operativo—AIC), and (ingeniera en Recursos Hídricos) Marcela Gonzalez (Asesora del Ministerio de Obras Públicas de Neuquén) for their valuable input, time, and enthusiasm during the interview process. We offer also a special thanks to Ingeniero Daniel Lima, Ingeniera Ana Martínez, Ingeniero Martín Nini, and Ingeniero Juan Galeazzi for their valuable contribution in the process.

Conflicts of Interest

The authors declare no conflict of interest. The founding sponsors had no role in the design of the study; in the collection, analyses, or interpretation of data; in the writing of the manuscript, and in the decision to publish the results.

References

  1. Kasprzyk, J.R.; Nataraj, S.; Reed, P.M.; Lempert, R.J. Many objective robust decision making for complex environmental systems undergoing change. Environ. Model. Softw. 2013, 42, 55–71. [Google Scholar] [CrossRef]
  2. Dale, L.L.; Karali, N.; Millstein, D.; Carnall, M.; Vicuna, S.; Borchers, N.; Bustos, E.; O’Hagan, J.; Purkey, D.; Heaps, C.; et al. An integrated assessment of water-energy and climate change in Sacramento, California: How strong is the nexus? Clim. Chang. 2015, 132, 223–235. [Google Scholar] [CrossRef]
  3. Yates, D.; Sieber, J.; Purkey, D.; Huber-Lee, A. WEAP21-A Demand-, Priority-, and Preference-Driven Water Planning Model. Water Int. 2005, 30, 487–500. [Google Scholar] [CrossRef]
  4. Girard, C.; Rinaudo, J.-D.; Pulido-Velazquez, M.; Caballero, Y. An interdisciplinary modelling framework for selecting adaptation measures at the river basin scale in a global change scenario. Environ. Model. Softw. 2015, 69, 42–54. [Google Scholar] [CrossRef] [Green Version]
  5. Reed, M.S.; Kenter, J.; Bonn, A.; Broad, K.; Burf, T.P.; Fazey, I.R.; Fraser, E.D.G.; Hubacek, K.; Nainggolan, D.; Quinn, C.H.; et al. Participatory scenario development for environmental management: A methodological framework illustrated with experience from the UK uplands. J. Environ. Manag. 2013, 128, 345–362. [Google Scholar] [CrossRef] [PubMed]
  6. Lund, J.R.; Cai, X.; Characklis, W. Economic Engineering of Environmental and Water Resource Systems. J. Water Resour. Plan. Manag. 2006, 132, 399–402. [Google Scholar] [CrossRef]
  7. Lund, J.R. Approaches to Planning Water Resources; California State Water Resources Board: Sacramento, CA, USA, 2006. [Google Scholar]
  8. Reed, P.M.; Kollat, J.B. Save now, pay later? Multi-period many-objective groundwater monitoring design given systematic model errors and uncertainty. Adv. Water Resour. 2012, 35, 55–68. [Google Scholar] [CrossRef]
  9. Forni, L.G.; Medellín-Azuara, J.; Tansey, M.; Young, C.; Purkey, D.; Howitt, R. Integrating complex economic and hydrologic planning models: An application for drought under climate change analysis. Water Resour. Econ. 2016, 16, 15–27. [Google Scholar] [CrossRef]
  10. Sulis, A.; Sechi, G.M. Comparison of generic simulation models for water resource systems. Environ. Model. Softw. 2013, 40, 214–225. [Google Scholar] [CrossRef]
  11. Bhave, A.G.; Mishra, A.; Raghuwanshi, N.S. A combined bottom-up and top-down approach for assessment of climate change adaptation options. J. Hydrol. 2014, 518, 150–161. [Google Scholar] [CrossRef]
  12. Thompson, L.C.; Escobar, M.I.; Mosser, C.M.; Purkey, D.R.; Yates, D.; Moyle, P.B. Water Management Adaptations to Prevent Loss of Spring-Run Chinook Salmon in California under Climate Change. J. Water Resour. Plan. Manag. 2012, 138, 465–478. [Google Scholar] [CrossRef]
  13. Condom, T.; Escobar, M.; Purkey, D.; Pouget, C.J.; Suarez, W.; Ramos, C.; Apaestegui, J.; Tasci, A.; Gomez, J. Simulating the implications of glaciers’ retreat for water management: A case study in the Rio Santa basin, Peru. Water Int. 2012, 37, 442–459. [Google Scholar] [CrossRef]
  14. Hoff, H.; Bonzi, C.; Joyce, B.; Tielbörger, K.A. Water Resources Planning Tool for the Jordan River Basin. Water 2011, 3, 718–736. [Google Scholar] [CrossRef]
  15. Bresney, S.; Escobar, M.I. How Governance Affects Participation: Insights from Water Resources Planning Projects in Colombia and Peru; Stockholm Environment Institute (SEI): Davis, CA, USA, 2017. [Google Scholar]
  16. Forni, L.; Galaitsi, S. Getting the Picture: Using Data Visualization to Make Complex Models More Accessible to Policy-Makers; Stockholm Environment Institute (SEI): Davis, CA, USA, 2015. [Google Scholar]
  17. Johnson, C.; Rhyne, T.M. Top Scientific Visualization Research Problems. IEEE Comput. Graph. Appl. 2004, 24, 13–17. [Google Scholar] [CrossRef] [PubMed]
  18. Tory, M.; Moller, T. Human factors in visualization research. IEEE Trans. Vis. Comput. Graph. 2004, 10, 72–84. [Google Scholar] [CrossRef] [PubMed] [Green Version]
  19. Yi, S.J.; Ah Kang, Y.; Stasko, J.T.; Jacko, J.A. Toward a Deeper Understanding of the Role of Interaction in Information Visualization. IEEE Trans. Vis. Comput. Graph. 2007, 13, 1224–1231. [Google Scholar] [CrossRef] [PubMed]
  20. Rhyne, T.A.; MacEachren, A.; Dykes, J. Guest Editors Introduction: Exploring Geovisualization. IEEE Comput. Graph. Appl. 2006, 26, 20–21. [Google Scholar] [CrossRef]
  21. Andrienko, G.; Andrienko, N.; Demsar, U.; Dransch, D.; Dykes, J.; Fabrikant, S.I.; Jern, M.; Kraak, M.-J.; Schumann, H.; Tominski, C. Space, time and visual analytics. Int. J. Geogr. Inf. Sci. 2010, 24, 1577–1600. [Google Scholar] [CrossRef] [Green Version]
  22. Pahl-Wostl, C.; Hare, M. Processes of social learning in integrated resources management. J. Commun. Appl. Soc. Psychol. 2004, 14, 193–206. [Google Scholar] [CrossRef]
  23. Jakeman, A.; Letcher, R. Integrated assessment and modelling: Features, principles and examples for catchment management. Environ. Model. Softw. 2003, 18, 491–501. [Google Scholar] [CrossRef]
  24. Vogel, R.M.; Lall, U.; Cai, X.; Rajagopalan, B.; Weiskel, K.P.; Hooper, P.R.; Matalas, C.N. Hydrology: The interdisciplinary science of water: Hydrology: The interdisciplinary science of water. Water Resour. Res. 2015, 51, 4409–4430. [Google Scholar] [CrossRef]
  25. McNie, E.C. Reconciling the supply of scientific information with user demands: An analysis of the problem and review of the literature. Environ. Sci. Policy 2007, 10, 17–38. [Google Scholar] [CrossRef]
  26. Liu, Y.; Gupta, H.; Springer, E.; Wagener, T. Linking science with environmental decision making: Experiences from an integrated modeling approach to supporting sustainable water resources management. Environ. Model. Softw. 2008, 23, 846–858. [Google Scholar] [CrossRef]
  27. Chandrasekaran, B. From Optimal to Robust COAs: Challenges in Providing Integrated Decision Support for Simulation-Based COA Planning; Ohio State University: Columbus, OH, USA, 2005. [Google Scholar]
  28. Nilsson, M.; Persson, A. Policy note: Lessons from environmental policy integration for the implementation of the 2030 Agenda. Environ. Sci. Policy 2017, 78, 36–39. [Google Scholar] [CrossRef]
  29. Reed, M.S.; Stringer, L.C.; Fazey, I.; Evely, A.C.; Kruijsen, J.H.J. Five principles for the practice of knowledge exchange in environmental management. J. Environ. Manag. 2014, 146, 337–345. [Google Scholar] [CrossRef] [PubMed]
  30. Wiek, A.; Walter, A.I. A transdisciplinary approach for formalized integrated planning and decision-making in complex systems. Eur. J. Oper. Res. 2009, 197, 360–370. [Google Scholar] [CrossRef]
  31. Boelens, R.; Hoogendam, P. Water Rights and Empowerment; Koninklijke Van Gorcum: Assen, The Netherlands, 2002. [Google Scholar]
  32. Forni, L.G.; Galaitsi, S.E.; Mehta, V.K.; Escobar, M.I.; Purkey, D.R.; Depsky, N.J.; Lima, N.A. Exploring Scientific Information for Policy Making under Deep Uncertainty. Environ. Model. Softw. 2016, 86, 232–247. [Google Scholar] [CrossRef]
  33. Lempert, R.J.; Popper, S.W.; Bankes, S.C. Shaping the Next One Hundred Years: New Methods for Quantitative, Long-Term Policy Analysis; RAND: Santa Monica, CA, USA, 2003. [Google Scholar]
  34. Forni, L. Comahue Region Decision Support Visualization. Available online: https://tabsoft.co/2LiuzNg (accessed on 15 June 2018).
Figure 1. The Limay, Neuquén and Negro River basins.
Water 10 00794 g001
Figure 2. Visualization Process from [32].
Water 10 00794 g002
Figure 3. WEAP schematic of the Comahue region basins modeled in this study.
Water 10 00794 g003
Figure 4. Impacts of climate change on snow pack during the first month of the water year.
Water 10 00794 g004
Figure 5. Current management in short term: The color dimension of the visualization is designed so shades of green means the performance metrics fails 10% (or less) of the time. Shades of red show the performance metric fails between 11% and 100% of the time (darker shades of red when close to 100% and lighter shades of red when closer to 11%) [34].
Water 10 00794 g005
Figure 6. Current management in long term: The color dimension of the visualization is designed so shades of green means the performance metrics fails 10% (or less) of the time. Shades of red show the performance metric fails between 11% and 100% of the time (darker shades of red when close to 100% and lighter shades of red when closer to 11%) [34].
Water 10 00794 g006
Figure 7. Impact of strategies on the performance metrics [34].
Water 10 00794 g007
Table 1. Standard Robust Decision Support (RDS) methodology. Source adapted from [15]. The shaded area represents the steps implemented in this project.
PhasePreparation and Formulation Evaluation and Implementation
Modules1. Define decision space 2. Map of kay actors3. Problem formulation4. Tool construction5. Scenario definition 6. Options analysis 7. Results exploration 8. decision support
Level of participation ConsultationInformation extraction Participative research Co-learning Cooperation Cooperation Co-learning Co-learning
Capacity building focusLiterature review Survey Participative workshopTraining in tools use Regular meetingsManual for tools use Visualization training Participative workshop
Decision making productsDecision space definitionActor interaction Key system elements identifiedModel for discussionKey scenarios identified Performance metricsMeetings with decision makersSummary to identify financing
ResultsAdaptation and development connections Participative spaces identified Intersectoral perspective shared Climate and adaptation evaluation Shared vision of the futureEstimated tradeoffsDecision makers informed Adaptation actions financed
Table 2. Sub-basin discretization.
BasinSub-BasinArea (km2)
NeuquénAndacollo3579
NeuquénRahueco4566
NeuquénBajada del Agrio7366
NeuquénPaso de los Indios16,020
Collon CuraRahue3457
Collon CuraHuechahue5480
Collon CuraCollon outlet7154
Alto TrafulAlto Traful1420
LimayLimay4194
Table 3. Calibration performance for monthly flow discharges at the outlets of the watersheds for the period 2000–2010 (supply component).
WatershedNSE *%-BiasGaging Stations
Limay-Alto Traful0.750–7La Cantera
Limay0.75−7Villa LLanquin
Collon Cura0.881.4Collon Outlet
Neuquén0.859Paso de los Indios
* Nash-Sutcliffe Efficiency (NSE).
Table 4. List of Uncertainties (Xs) identified for the study area, corroborated by the local institutions focus group.
UncertaintiesRepresentation in WEAP Model
Future ClimateDevelopment of 5 climate projections: Ciclo histórico, GFDL * 4.5, GFDL 8.5, MIROC ** 4.5, MIROC 8.5, ESM2 *** 4.5, ESM2 8.5
Potential Expansion of agricultural area Development of 2 projections of agricultural land under production: (1) Reference scenario with current tendencies; (2) Potential land expansion
Changes in cropping patterns to higher value cropsEvaluation of 2 potential cropping patterns tendencies: (1) Traditional use of agricultural land; (2) Higher value crops
* Geophysical Fluid Dynamics Laboratory (GFDL). ** Model for Interdisciplinary Research on Climate (MIROC). *** Earth System Models Part II (ESM2).
Table 5. List of Strategies (L) identified for the study area and corroborated by the local institutions.
StrategiesManagement Goal and Description
BaseCurrent management
Reduction in LossesSlow reduction trend of agricultural water distribution losses up to 50% of the current modeled value
Irrigation EfficiencySlow increase in irrigation efficiency for gravity irrigation (35–40%) and technical irrigation (65–80%)
Rational water use in citiesProgressive reduction in urban water demands up to 50% of the current modeled value
Reservoir operation Change in the operating rules for Piedra del Aguila Reservoir (increase in the maximum level of normal operation of the reservoir in determined months
Infrastructure development of hydropower plants (high feasibility) High feasibility of development of the following hydropower plants: Chihuido I (2025), Michihuao (2027), Pantanitos (2035).
Infrastructure development of hydropower plants (low feasibility) Low feasibility of construction of the following hydropower plants: Collón Cura (2030), La invernada (2027), Pini Mahuida (2027), Cerro Rayoso (2027), Huitrin (2027), Chihuido II (2027), Integral Río Negro (2035).
Irrigation Canal 1Guardia Mitre-Patagones irrigation canal (operating in 2025 with 50 cfs capacity)
Irrigation Canal 2Chelforo-Rio Colorado (operating in 2025 with 50 cfs capacity)
CombinedReduction in Losses + Irrigation efficiency + Rational use of urban water + Changes in reservoir operation rules + High and Low feasibility hydropower plants + canal Guardia Mitre Patagones
Table 6. List of Performance Metrics (M) identified for the study area and corroborated by the local institutions.
ObjectivePerformance MetricsDesired Levels of Performance
Ecological (flows)1. Neuquén River:ortezuelo Grande100 m3/s (min.)
2. Neuquén River: San Patricio del Chañar7 m3/s (min.)
3. Neuquén River: before Dique Ballester115 m3/s (min.)
4. Negro River: Confluencia400 m3/s (min.)
5. Negro River: before Canal Norte450/500 m3/s (min.)
6. Negro River, before bocatoma Beltran300 m3/s (min.)
7. Negro River: Desembocadura250 m3/s (min.)
Coverage of agricultural Irrigation RequirementsWater Demand coverages in all Irrigation Districts (Associaciones de Riego—AR)85% (min.) for all
8. Anelo
9. Campo Grande
10. Cinco Saltos
11. Los Barreales
Water Supply and Energy Production (reservoir volumes)12. Mari MenucoStorage level 411.5 h m3 (min.)
13. Cerros Colorados38,000 h m3 (Top of Buffer)
14. Chocón13,000 h m3 (Top of Buffer)
15. Piedra del Aguila7739.9 h m3 (Top of Buffer)
Water Supply (max flows in canals)16. Principal Alto Valle Canal80 m3/s (max.)
17. Centenario Canal7 m3/s (max.)
18. Arroyito Canal15 m3/s (max.)
19. Margen Norte Valle Medio Canal6 m3/s (max.)
20. Conesa Canal28 m3/s (max.)
21. Valle Inferior Canal39 m3/s (max.)
Coverage of urban water requirementsCoverages in all Urban Centers100% (min.)

