Dominant Fish and Macroinvertebrate Response to Flow Changes of the Geum River in Korea

1
Senior Research Fellow, Department of Land and Water Environment Research, Korea Environment Institute, Sejong 30147, Korea
2
Visiting Academic, School of Engineering, The University of Newcastle, Callaghan, NSW 2308, Australia
*
Author to whom correspondence should be addressed.
Water 2018, 10(7), 942; https://doi.org/10.3390/w10070942
Submission received: 31 May 2018
/
Revised: 16 June 2018
/
Accepted: 13 July 2018
/
Published: 15 July 2018
(This article belongs to the Section Hydraulics and Hydrodynamics)
Abstract
:This study presents the impact of natural flow patterns on downstream aquatic species habitats in a reach of the Geum River, Korea. The study reach is a 13.4 km long, located downstream of the Yongdam Dam. To assess such an impact, this study performed physical habitat simulations. The River2D model was used for the computation of the flow field and morphology, and the Habitat Suitability Index (HSI) model for the habitat simulation. Three habitat variables—flow depth, velocity, and substrate were used. The Zacco platypus and Baetis fuscatus were selected as the target fish and benthic macro-invertebrate, respectively. Using the building block approach (BBA), the scenarios for modifying dam operations were constructed in the study reach. Scenario 1, scenario 2, and scenario 3 were proposed by using the magnitude–duration concept, base flow allocation concept, and seasonally adjusted minimum flow allocation concept, respectively. Simulation results indicated that the scenarios’ effects significantly increased by about 14.3% for the weighted usable area (WUA). In addition, the morphology change with the restoration of flood events was investigated. It was revealed that the morphology change in the physical habitat simulations further increased by about 13% for the WUA. The change of dam operations through natural flow patterns is more advantageous to aquatic species.
1. Introduction
During the latter half of the 20th century, 47,000 large dams were built worldwide to block the flow of the rivers [1,2,3]. Dams provide substantial benefits, including hydropower, water supply, flood control, and irrigation [3]. However, dam construction can cause the longitudinal connectivity of rivers, affect aquatic species by interrupting migration, and reduce biodiversity [4]. Dams cause changes to flow depth, velocity, and hydrologic processes [5,6].
Regulating a river results in consistent or pulsating flows due to hydropower generation, as well as the cessation of the high flow events, which are significantly different from the natural flow regime. The change of the flow regime due to hydropeaking affected the aquatic ecosystems, in many previous reports, extending with a reach of hundreds of kilometers downstream [1,7,8]. That is, hydropeaking changes physical habitat variables, as well as the intensity, duration, timing, and frequency of the perturbations affect the habitat abundance (or availability) and diversity patterns [9,10,11]. Physical habitat simulations have been successfully used to solve various relevant problems. Using physical habitat simulation has assisted with designing river restorations [12,13], as well as evaluating river health [14,15] and the impact of flow regime change by dam construction
[6,16,17,18]. Similarly, a hydropeaking mitigation project [19,20,21] and the change of dam operation was investigated with respect to the ecological requirements downstream from the dam [8,22,23].
Physical habitat simulations are heavily dependent on the given discharge, especially on a regulated river by an upstream dam. Dams can significantly change the flow regime, including magnitude, timing, frequency, and duration of flow events [8,22,24,25,26]. However, the natural flow regime, including the low-flow events, high-flow events, and flood events, are heavily different from the water releases from the dam. Such various flow events play important roles in the aquatic ecosystem [8,22,24,25,26,27,28]. South Africa formally investigated the restoration of the natural flow regimes of rivers in the 1980s and developed its first methodology for flow assessments during the early 1990s, namely BBA (the building block approach) [8,29]. King and Tharme [30] introduced the BBA as a holistic environmental flow methodology. Specifically, the methodology is based on the concept that various flows within the natural flow regime of a river are more important than others for the maintenance of the aquatic ecosystem. Additionally, these various flows can be identified, and described in terms of their magnitude, duration, timing, and frequency.
The goal of this study was to investigate the impact of the modification of dam operation through the natural flow patterns in downstream habitats. For this, a 13.4 km long reach in the Geum River, Korea was selected. For the physical habitat simulation, Zacco platypus and Baetis fuscatus were selected as the target fish and benthic macroinvertebrate, respectively. The River2D model (two-dimensional depth-averaged model of river hydrodynamics) [31] and the HSI (habitat suitability index) model [32] were used for hydraulic simulation and habitat simulation, respectively. Using the method of Gosse [33], the HSCs (habitat suitability curves) of target species were constructed for each habitat variable. The scenarios for the modification of dam operations were proposed using the BBA. First, the impact of modifying dam operation through the natural flow pattern in physical habitat simulations was examined. Then, the bed elevation change with the restoration of flood events was presented. The CSI (composite suitability index), which is an aggregation of habitat suitability indices of individual physical habitat variables, was predicted, and change of the WUA (weighted usable area) for the target species was compared.
2. Study Area and Target Fish
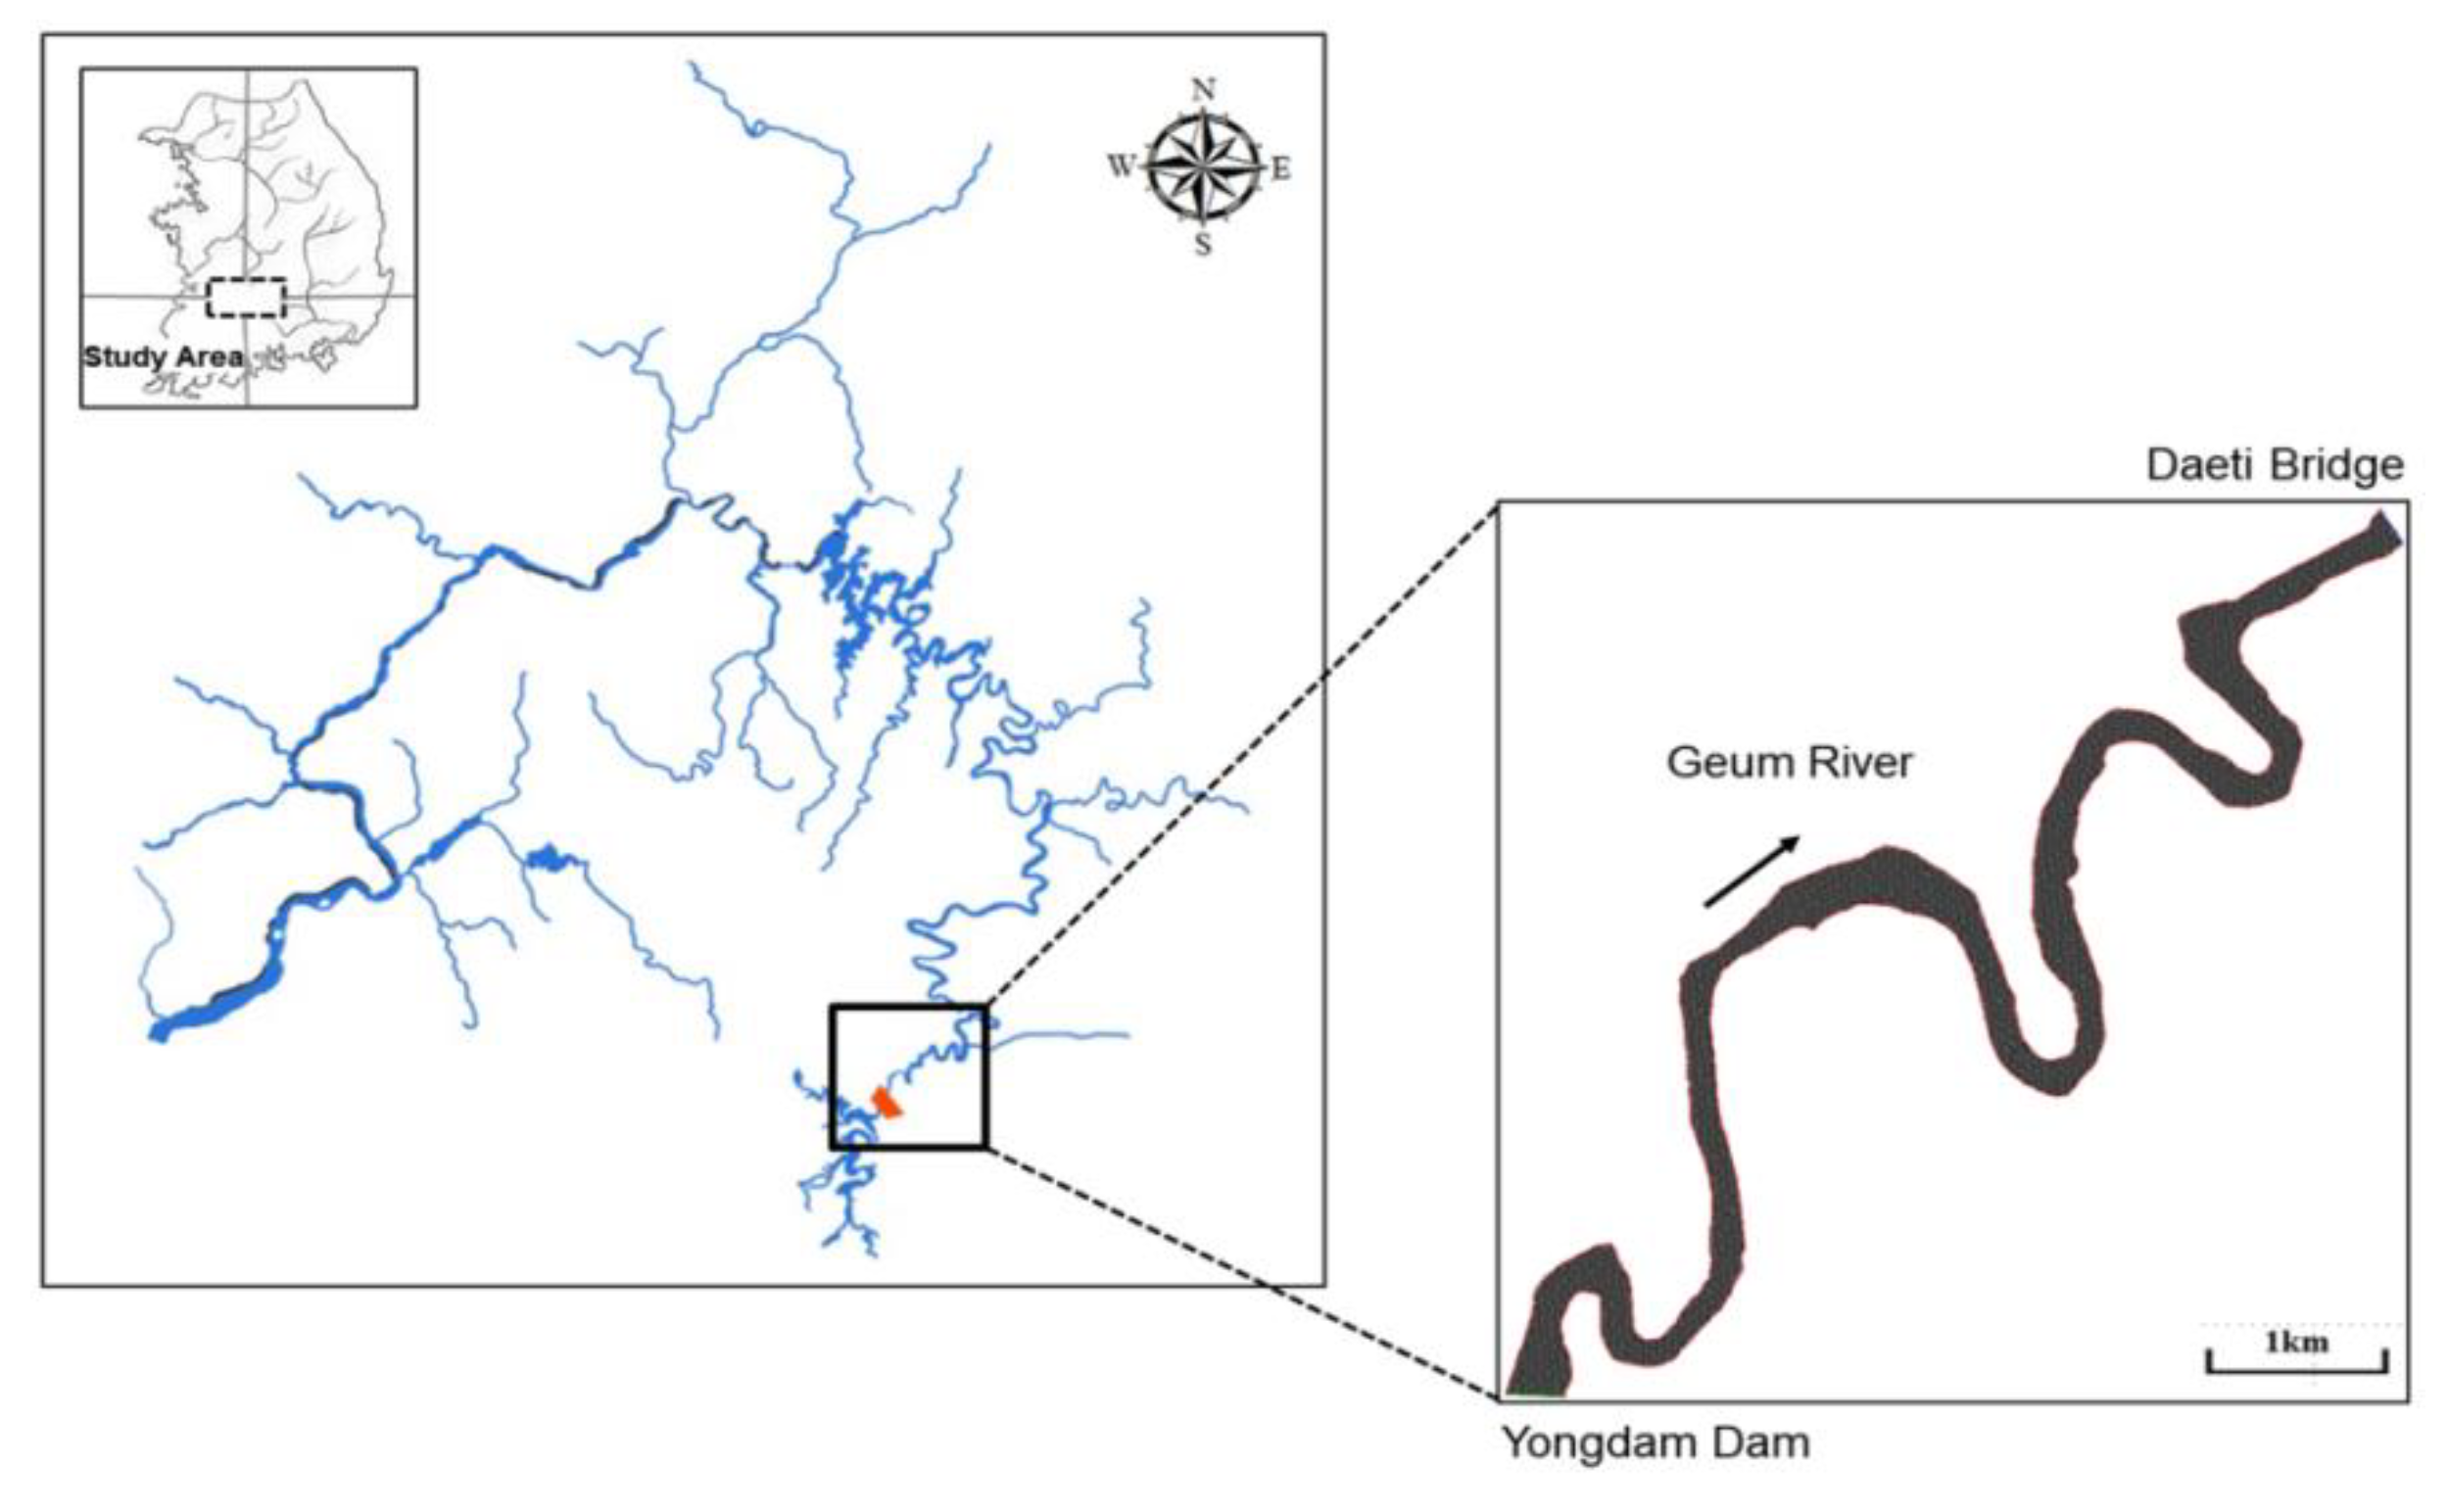
Figure 1 shows the area of the study in the Geum River, Korea. The study reach is 13.4 km long, from the Yongdam Dam to the Daeti Bridge, and the average bed slope of the reach is about 0.011. The flow in the study reach is regulated by the Yongdam Dam. The dam discharges water almost constantly for one year, for both water demands and hydropower generation. That is, the Geum River maintains a constant flow. For the study reach, the discharge for drought flow (Q355), low flow (Q275), normal flow (Q185), and averaged wet flow (Q95) was 2.87, 5.73, 9.51, and 17.13 m3/s, respectively [34]. Here, Qn denotes the average discharge exceeded on n days of the year.
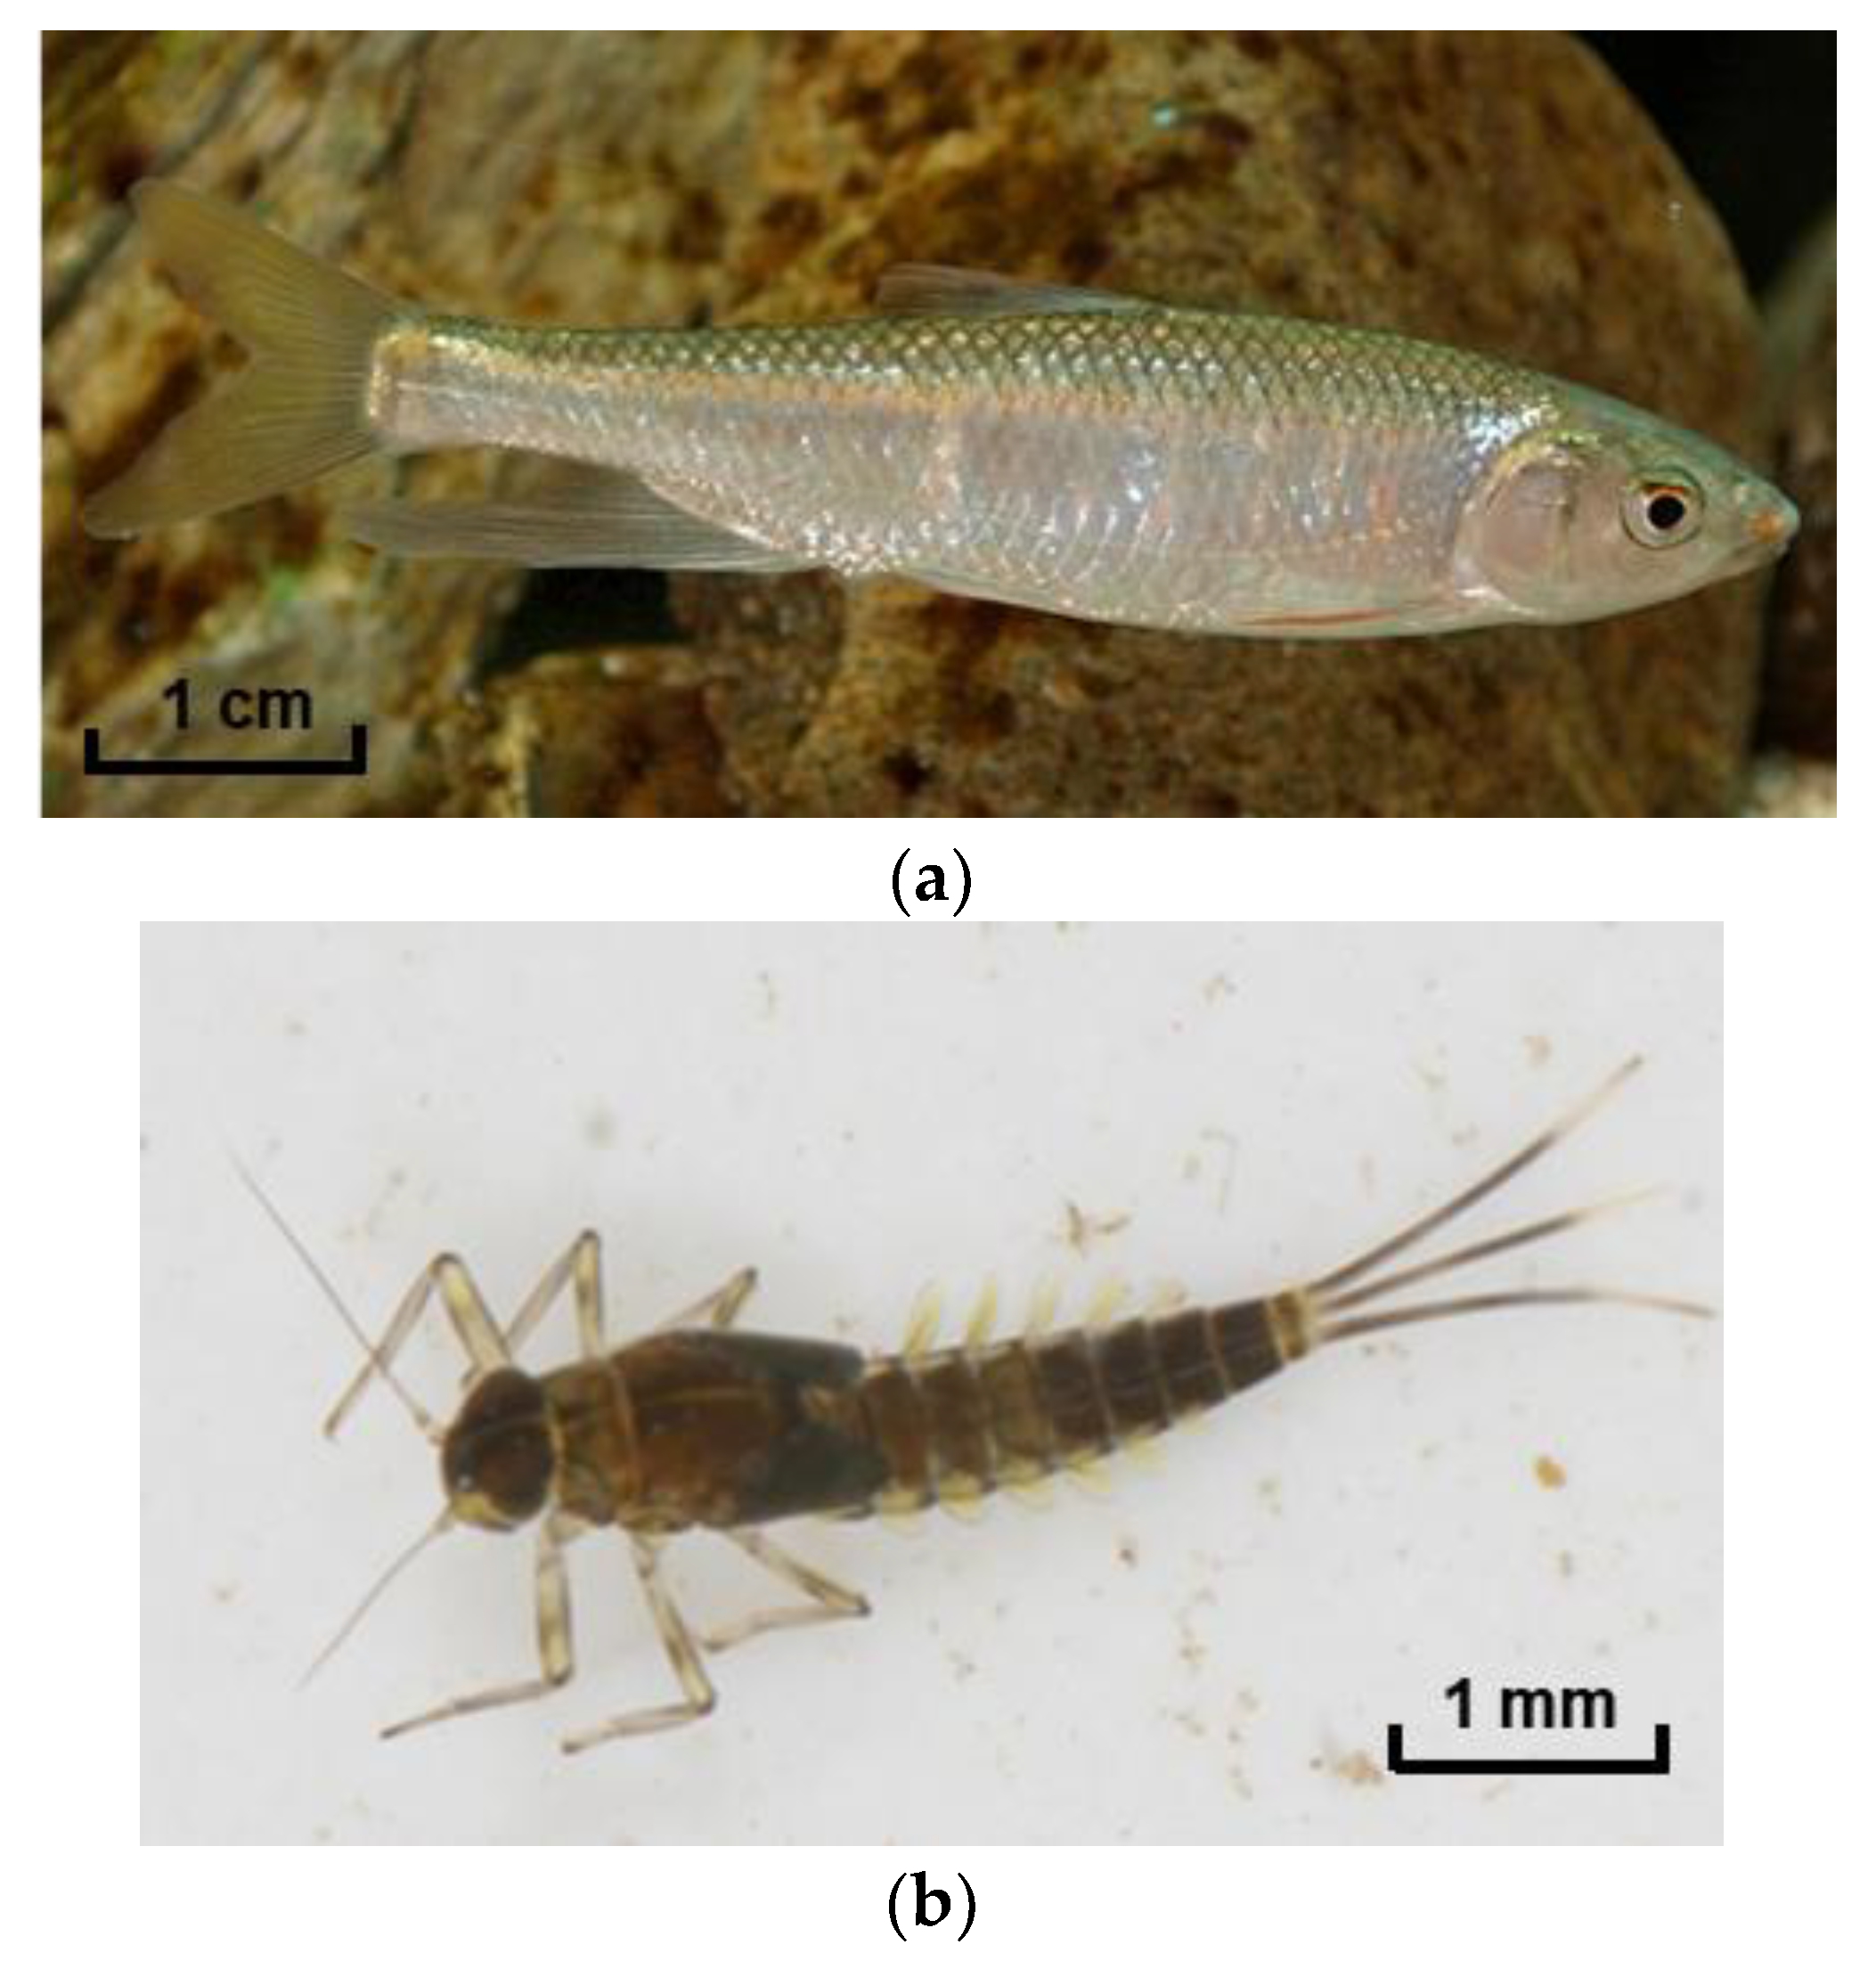
The hydrologic data and monitoring data were collected for the study reach through government R&D projects for the 2007–2010 period [34,35]. The field monitoring data include the date, flow depth, velocity, substrate, water temperature, concentration of suspended solids, pH, and population of the individual fish species. Various devices, such as float-type, sonar, and radar water gauges were installed to measure the water level. Velocity was measured by means of a Price current meter. Fish monitoring was carried out using cast nets and kick nets, revealing Zacco platypus as a dominant species in the study reach, followed by Zacco koreanus and Coreoleuciscus splendidus. These species account for 29%, 28%, and 22%, respectively, of the total fish population [34]. In this study, not only the dominant species, but also a benthic macroinvertebrate was selected as a target species. The benthic macroinvertebrate has become an important food resource for most aquatic fishes [36,37,38,39,40,41,42]. In the Geum River, Choi et al. [43] carried out field investigations on benthic macroinvertebrates. They found that the dominant species are Baetis fuscatus (25%), Epeorus pellucidus (22%), Hydropsyche kozhantschikovi (19%), Hydropsyche valvata (18%), and Cheum atopsyche brevilineata (16%), respectively. In the present study, the adult Zacco platypus and Baetis fuscatus, as shown in Figure 2, were selected as the target species in the evaluation of the physical habitat.
3. Physical Habitat Simulation
3.1. Hydraulic and Bed Elevation Simulation
In the present study, the River2D model was used for the hydraulic and bed elevation simulation. The model was developed by Steffler and Blackburn [31]. The River2D model is capable of computing transient turbulent flows in an open channel. Additionally, the River2D model offers both wet and dry solutions, by changing the surface flow equations to groundwater flow equations in dry areas. The River2D model solves two-dimensional depth-averaged shallow water equations using the finite element method. The continuity and longitudinal (x) and lateral (y) components of momentum equations are given by the following, respectively,
where is the time; and are the streamwise and transverse directions, respectively; is the flow depth; and are the depth-averaged velocities in the x- and y-directions, respectively; and are respective discharges per unit width (, ); is the gravitational acceleration; is the water density; and are the river bed slope and friction slope in the i-direction; and is the horizontal turbulent stress tensor. The x- and y-components of the friction slope in Equations (2) and (3) are expressed respectively by
where n is the Manning’s roughness coefficient. The two-dimensional bedload sediment continuity equation for the bed elevation change is given by
where and are the components of volumetric rate of bedload transport per unit length in the x- and y-directions, respectively. is the porosity of the bed material, is time, and is the bed elevation. In the present study, the formula by Meyer-Peter-Müller [44] is used to estimate the transport rate and for a uni-size sediment in Equation (6).
Validation of the 2D flow model was carried out, and the result is given in Figure 3. Figure 3 shows the longitudinal distribution in the elevation of the water surface in the downstream direction for a constant discharge rate of 55.0 m3/s. In the study reach, for the stage measurements, six stations were located at 0.15, 2.95, 6.15, 9.15, 12.5, and 13.0 km downstream from the Yongdam Dam. The predicted water surface elevation was averaged over the width, and the measured value was the arithmetic mean of the measured data at three locations over the width. In the present computation, the values of the roughness coefficient in the range of 0.035–0.062 for Manning’s n, which was obtained through calibration by three different field data, were used. It can be seen that the predicted water surface elevation was in good agreement with the measured data, and that the difference between the predicted and measured data lay in the range of 0.02–0.15 m, resulting in relative errors of less than 0.3%.
3.2. Habitat Simulation
In order to characterize the habitat conditions for the target fish species, HSCs were developed using the methodology outlined by the U.S. Fish and Wildlife Service [45] and Gosse [33]. The HSCs provide values for a suitability index as a function of physical habitat variables. The HSI ranges from zero to unity, representing the most unsuitable and optimal habitats, respectively. The HSI model is assumed to have a positive linear relationship with the potential carrying capacity of the habitat [45]. In the present study, to construct the HSCs, the method proposed by Gosse [33] was used. This method gives suitability index values of 1.0, 0.5, 0.1, and 0.05 for the range of the variable that encompasses 50%, 75%, 90%, and 95% of the populations, respectively.
The WUA is computed by
where , , and are the suitability indices of flow depth, velocity, and substrate, respectively (here, ). F is the function that makes the composite suitability index, and is the area of the -th computation cell. For calculating the CSI, the multiplicative aggregation method was used.
For the habitat variables, the HSCs for the target species constructed using Gosse’s method [33] are given in Figure 4. With these HSCs, the CSIs were later predicted using the multiplicative aggregation method. The total number of the monitored population is plotted in the equally-divided range for the physical habitat variable in Figure 4. Adult Zacco platypus normally live in riffles and runs in the midstream or downstream reach of rivers. For the target fishes, the preferred ranges were 0.25–0.50 m, 0.00–0.60 m/s, and 2–5 for flow depth, velocity, and substrate, respectively. Additionally, the respective preferred ranges for the benthic macroinvertebrate were 0.40–0.50 m, 0.40–0.60 m/s, and 5 for flow depth, velocity, and substrate, respectively. It appears that the ranges for flow depth and velocity overlapped significantly, but their substrate ranges were clearly different.
4. Results
4.1. Natural Flow Regime versus Dam Discharge
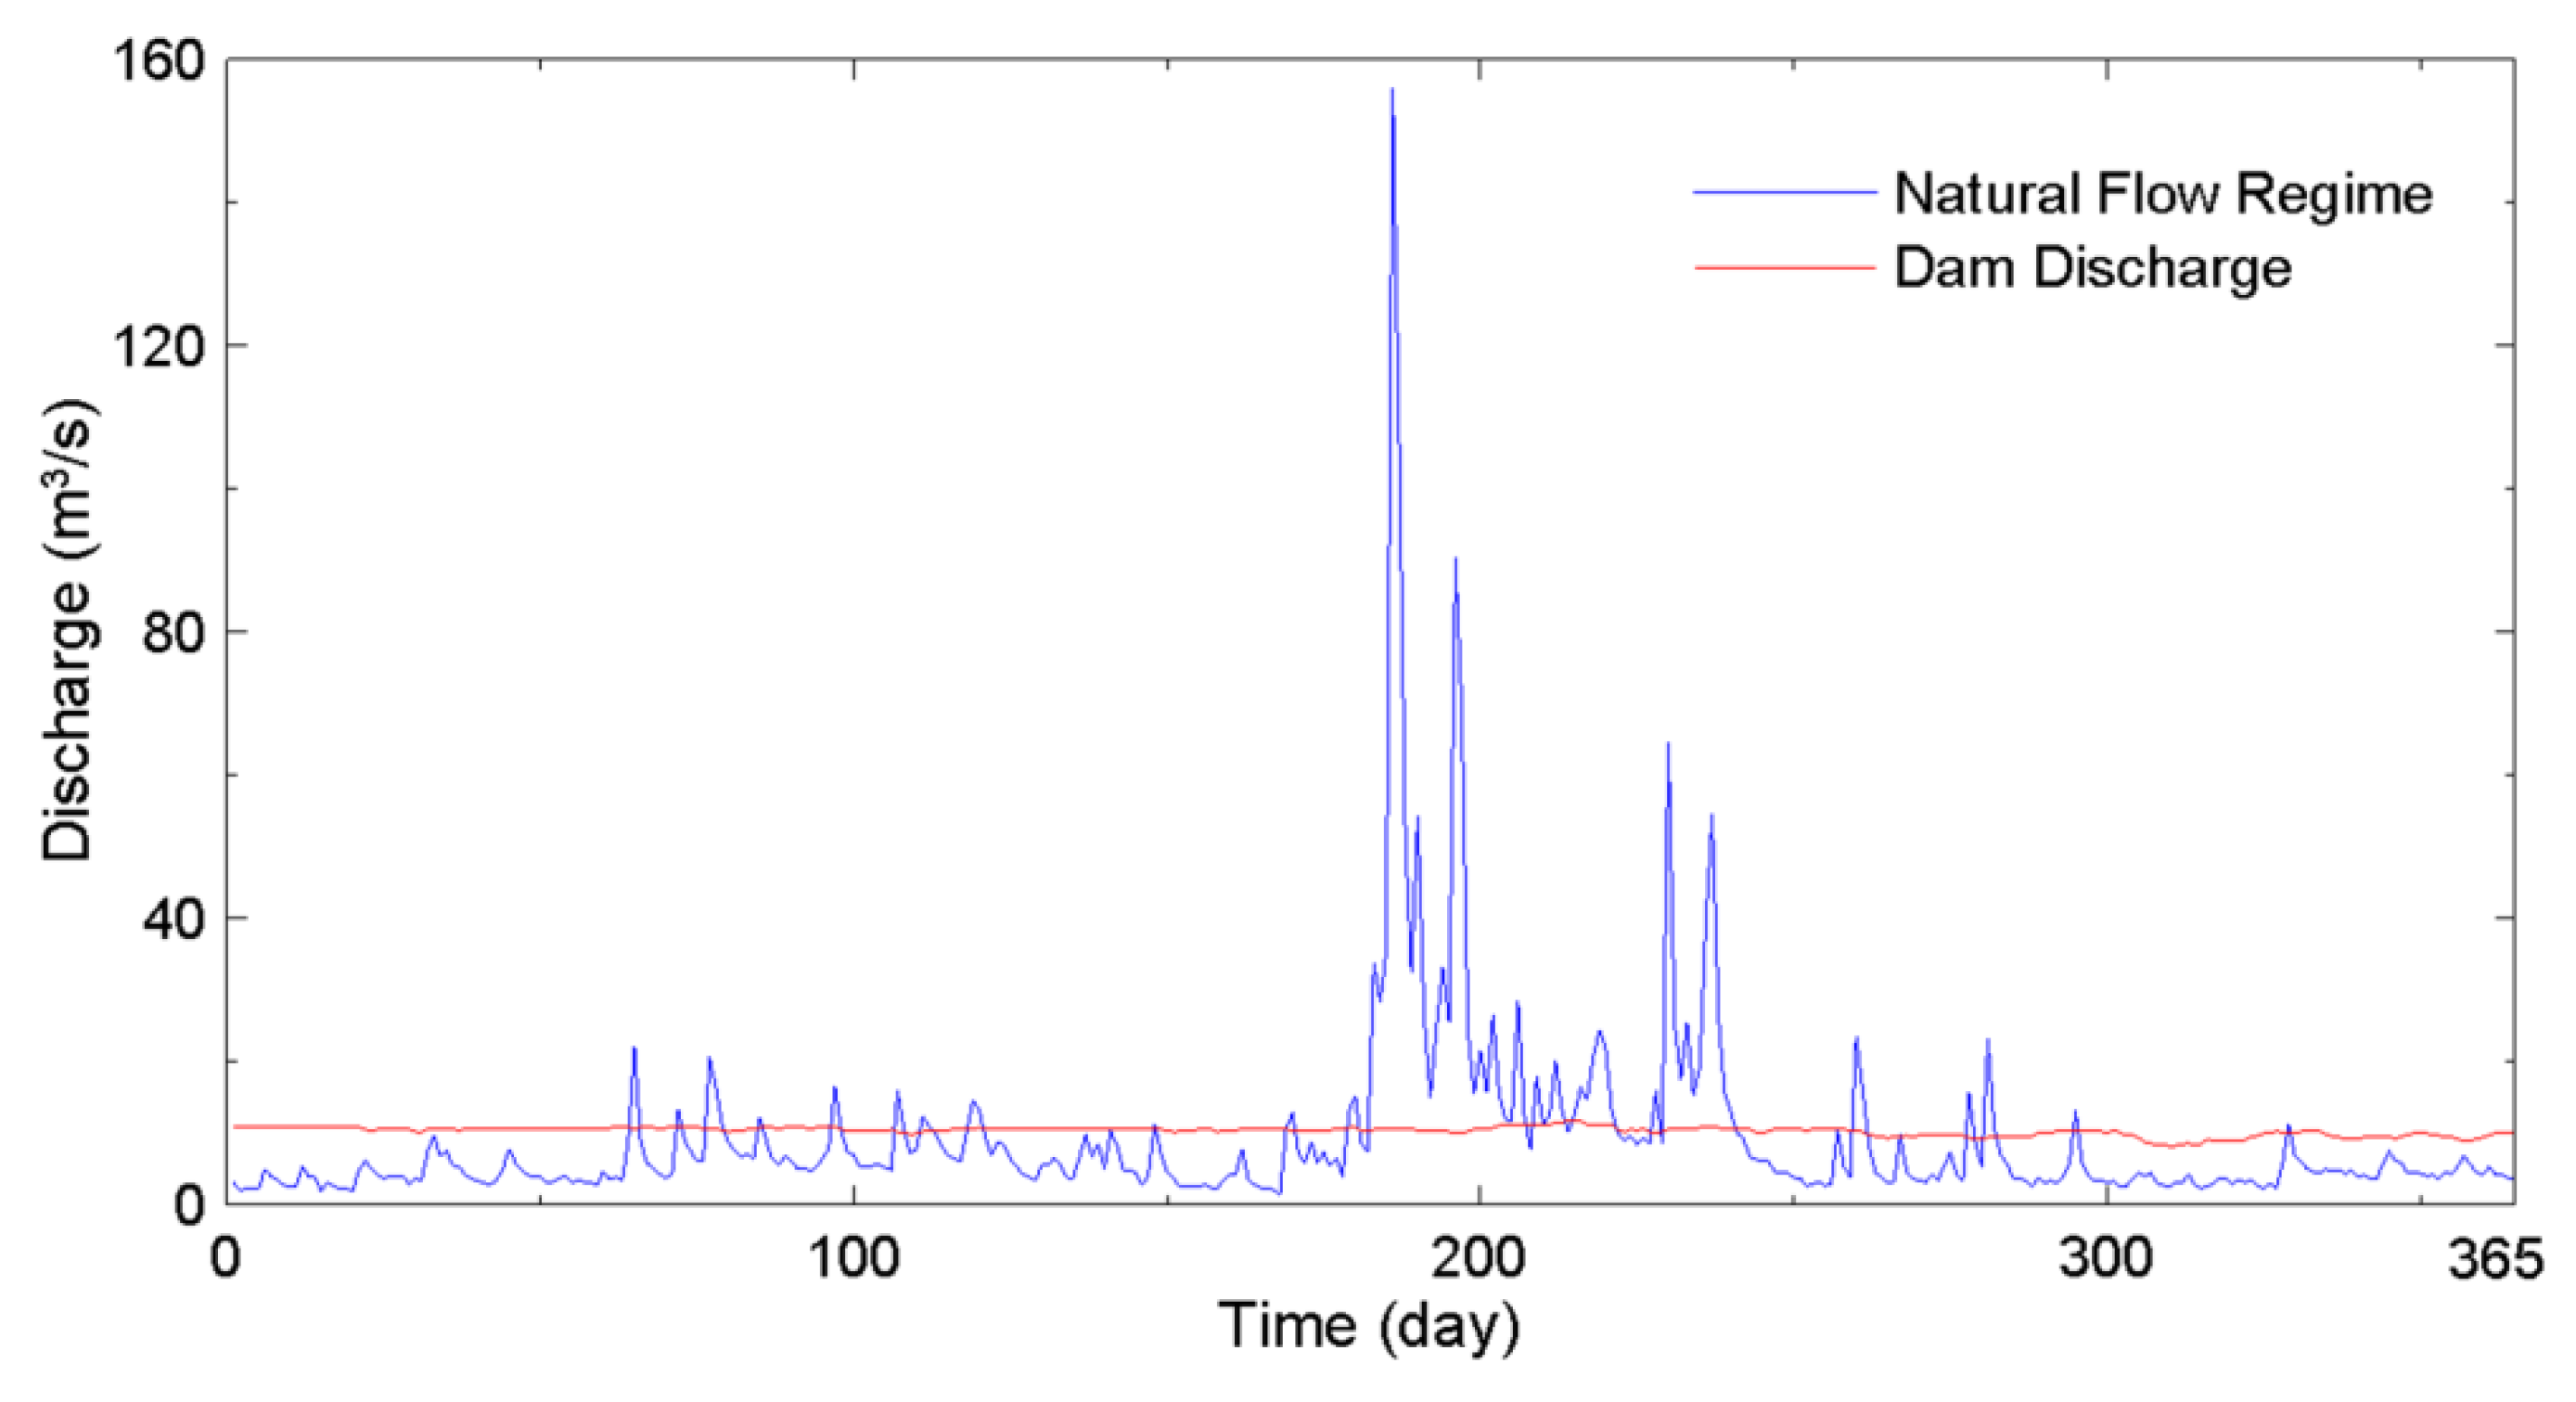
Figure 5 shows the natural flow regime and water releases from the Yongdam Dam. The discharge data in Figure 5 were observed from 2007–2016. It can be seen in Figure 5 that the dam releases about 15 m3/s of water for hydropower generation throughout the year. However, the natural flow regime consists of three flow regimes, namely the low-flows events, high-flows events, and flood events. The natural flow regime plays a critical role in sustaining aquatic biodiversity and ecosystem integrity in rivers [22].
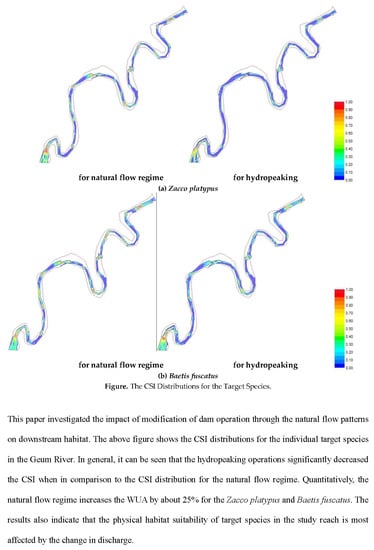
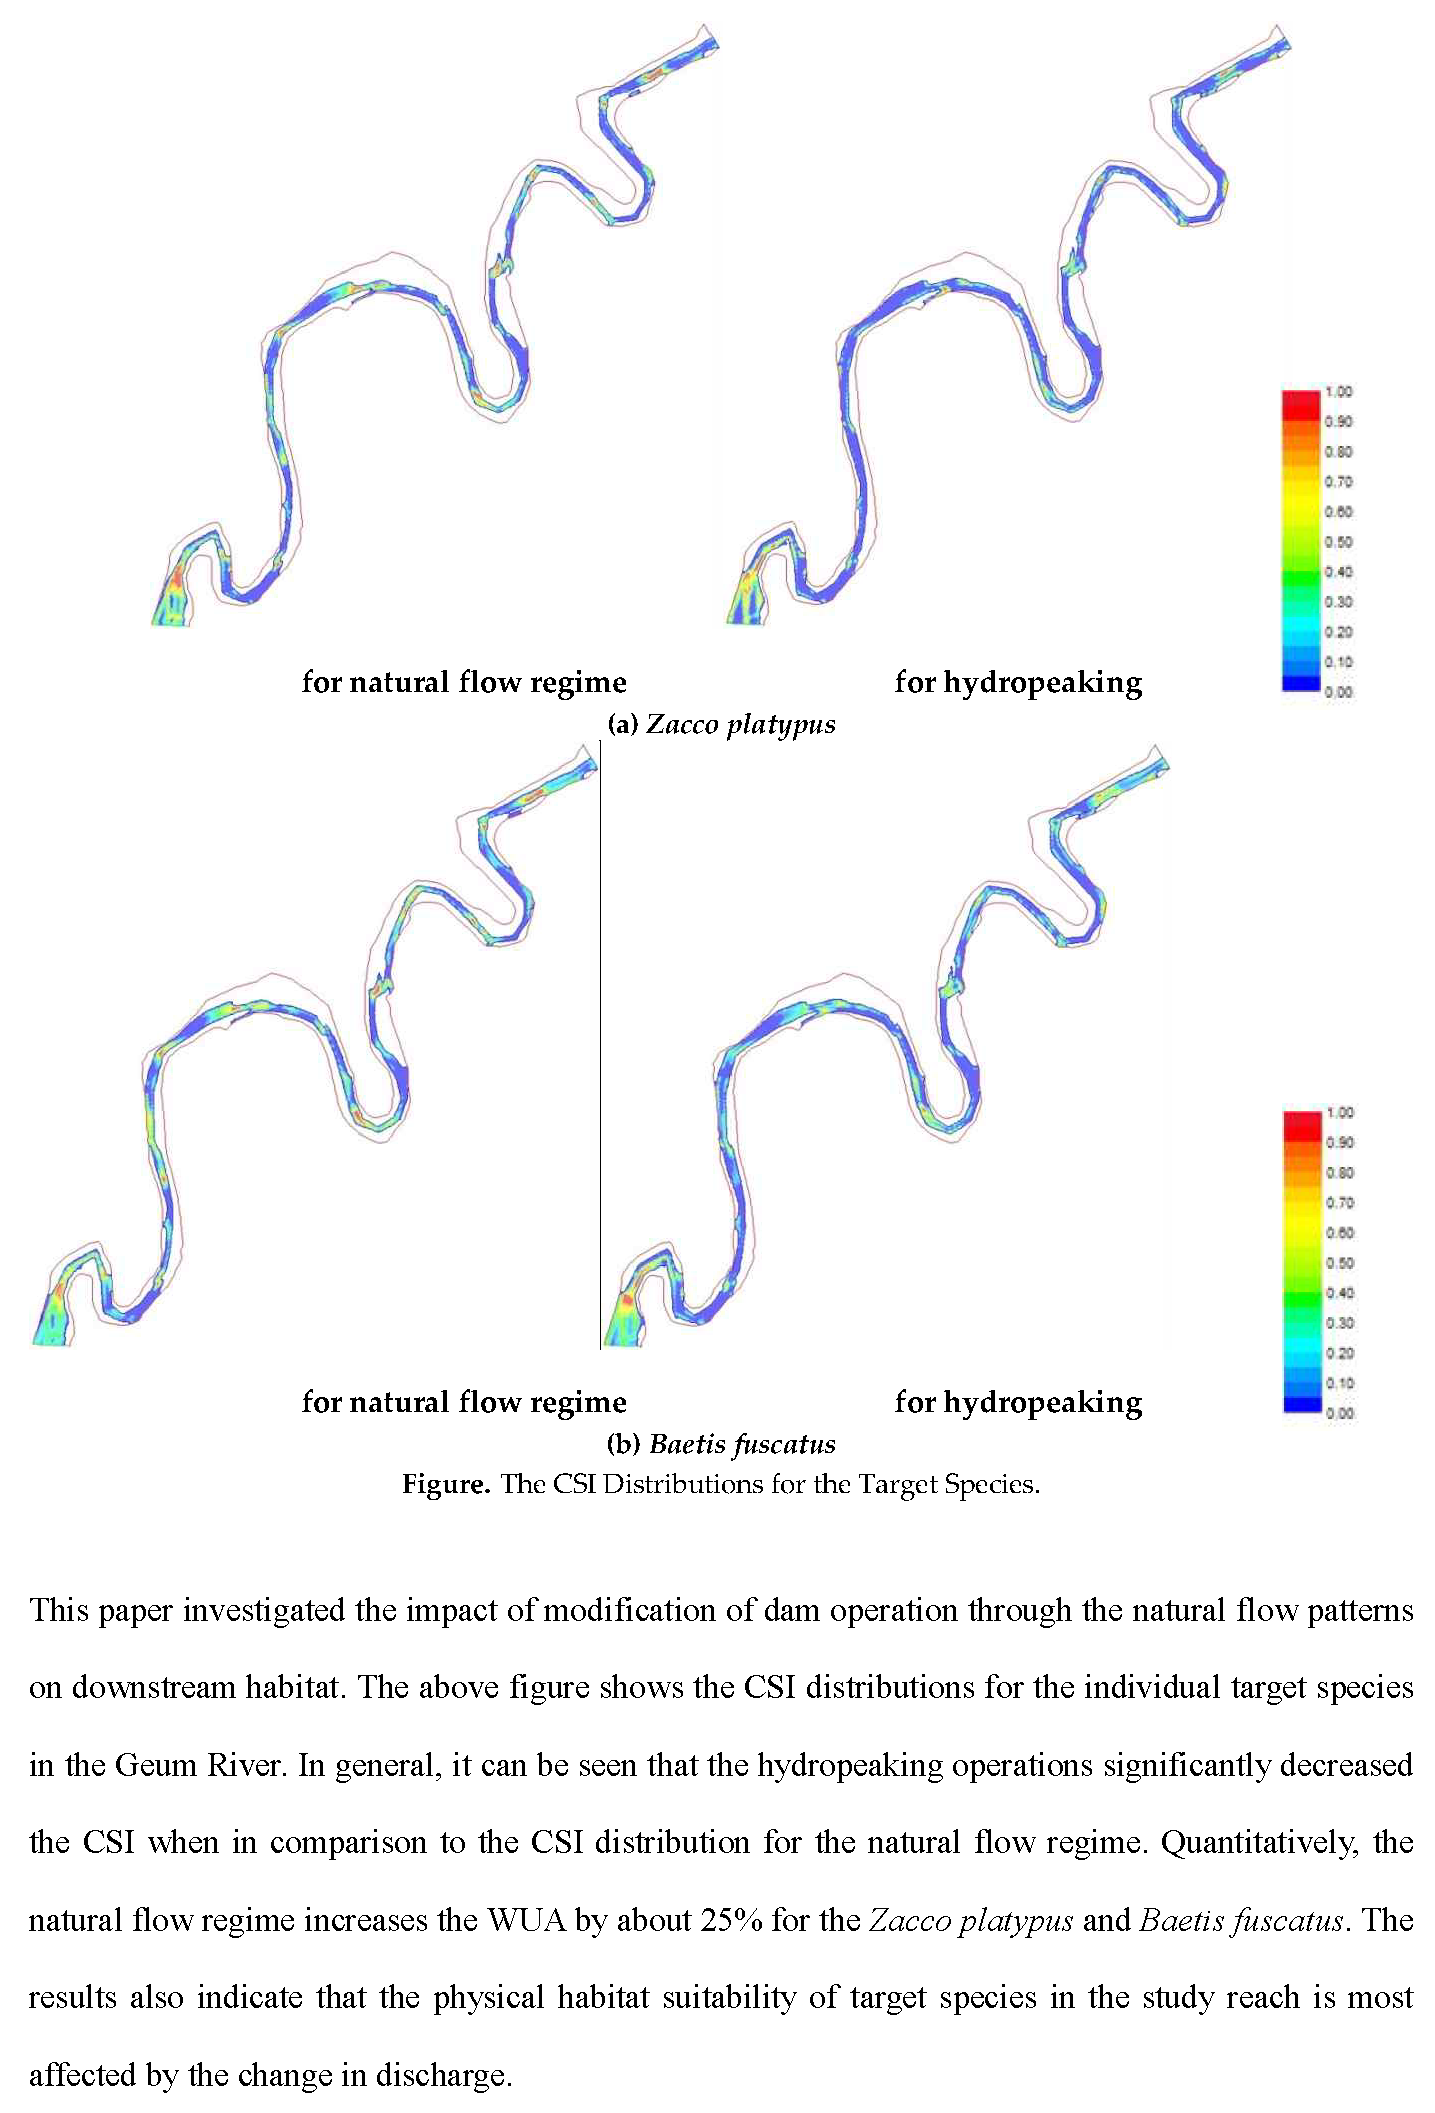
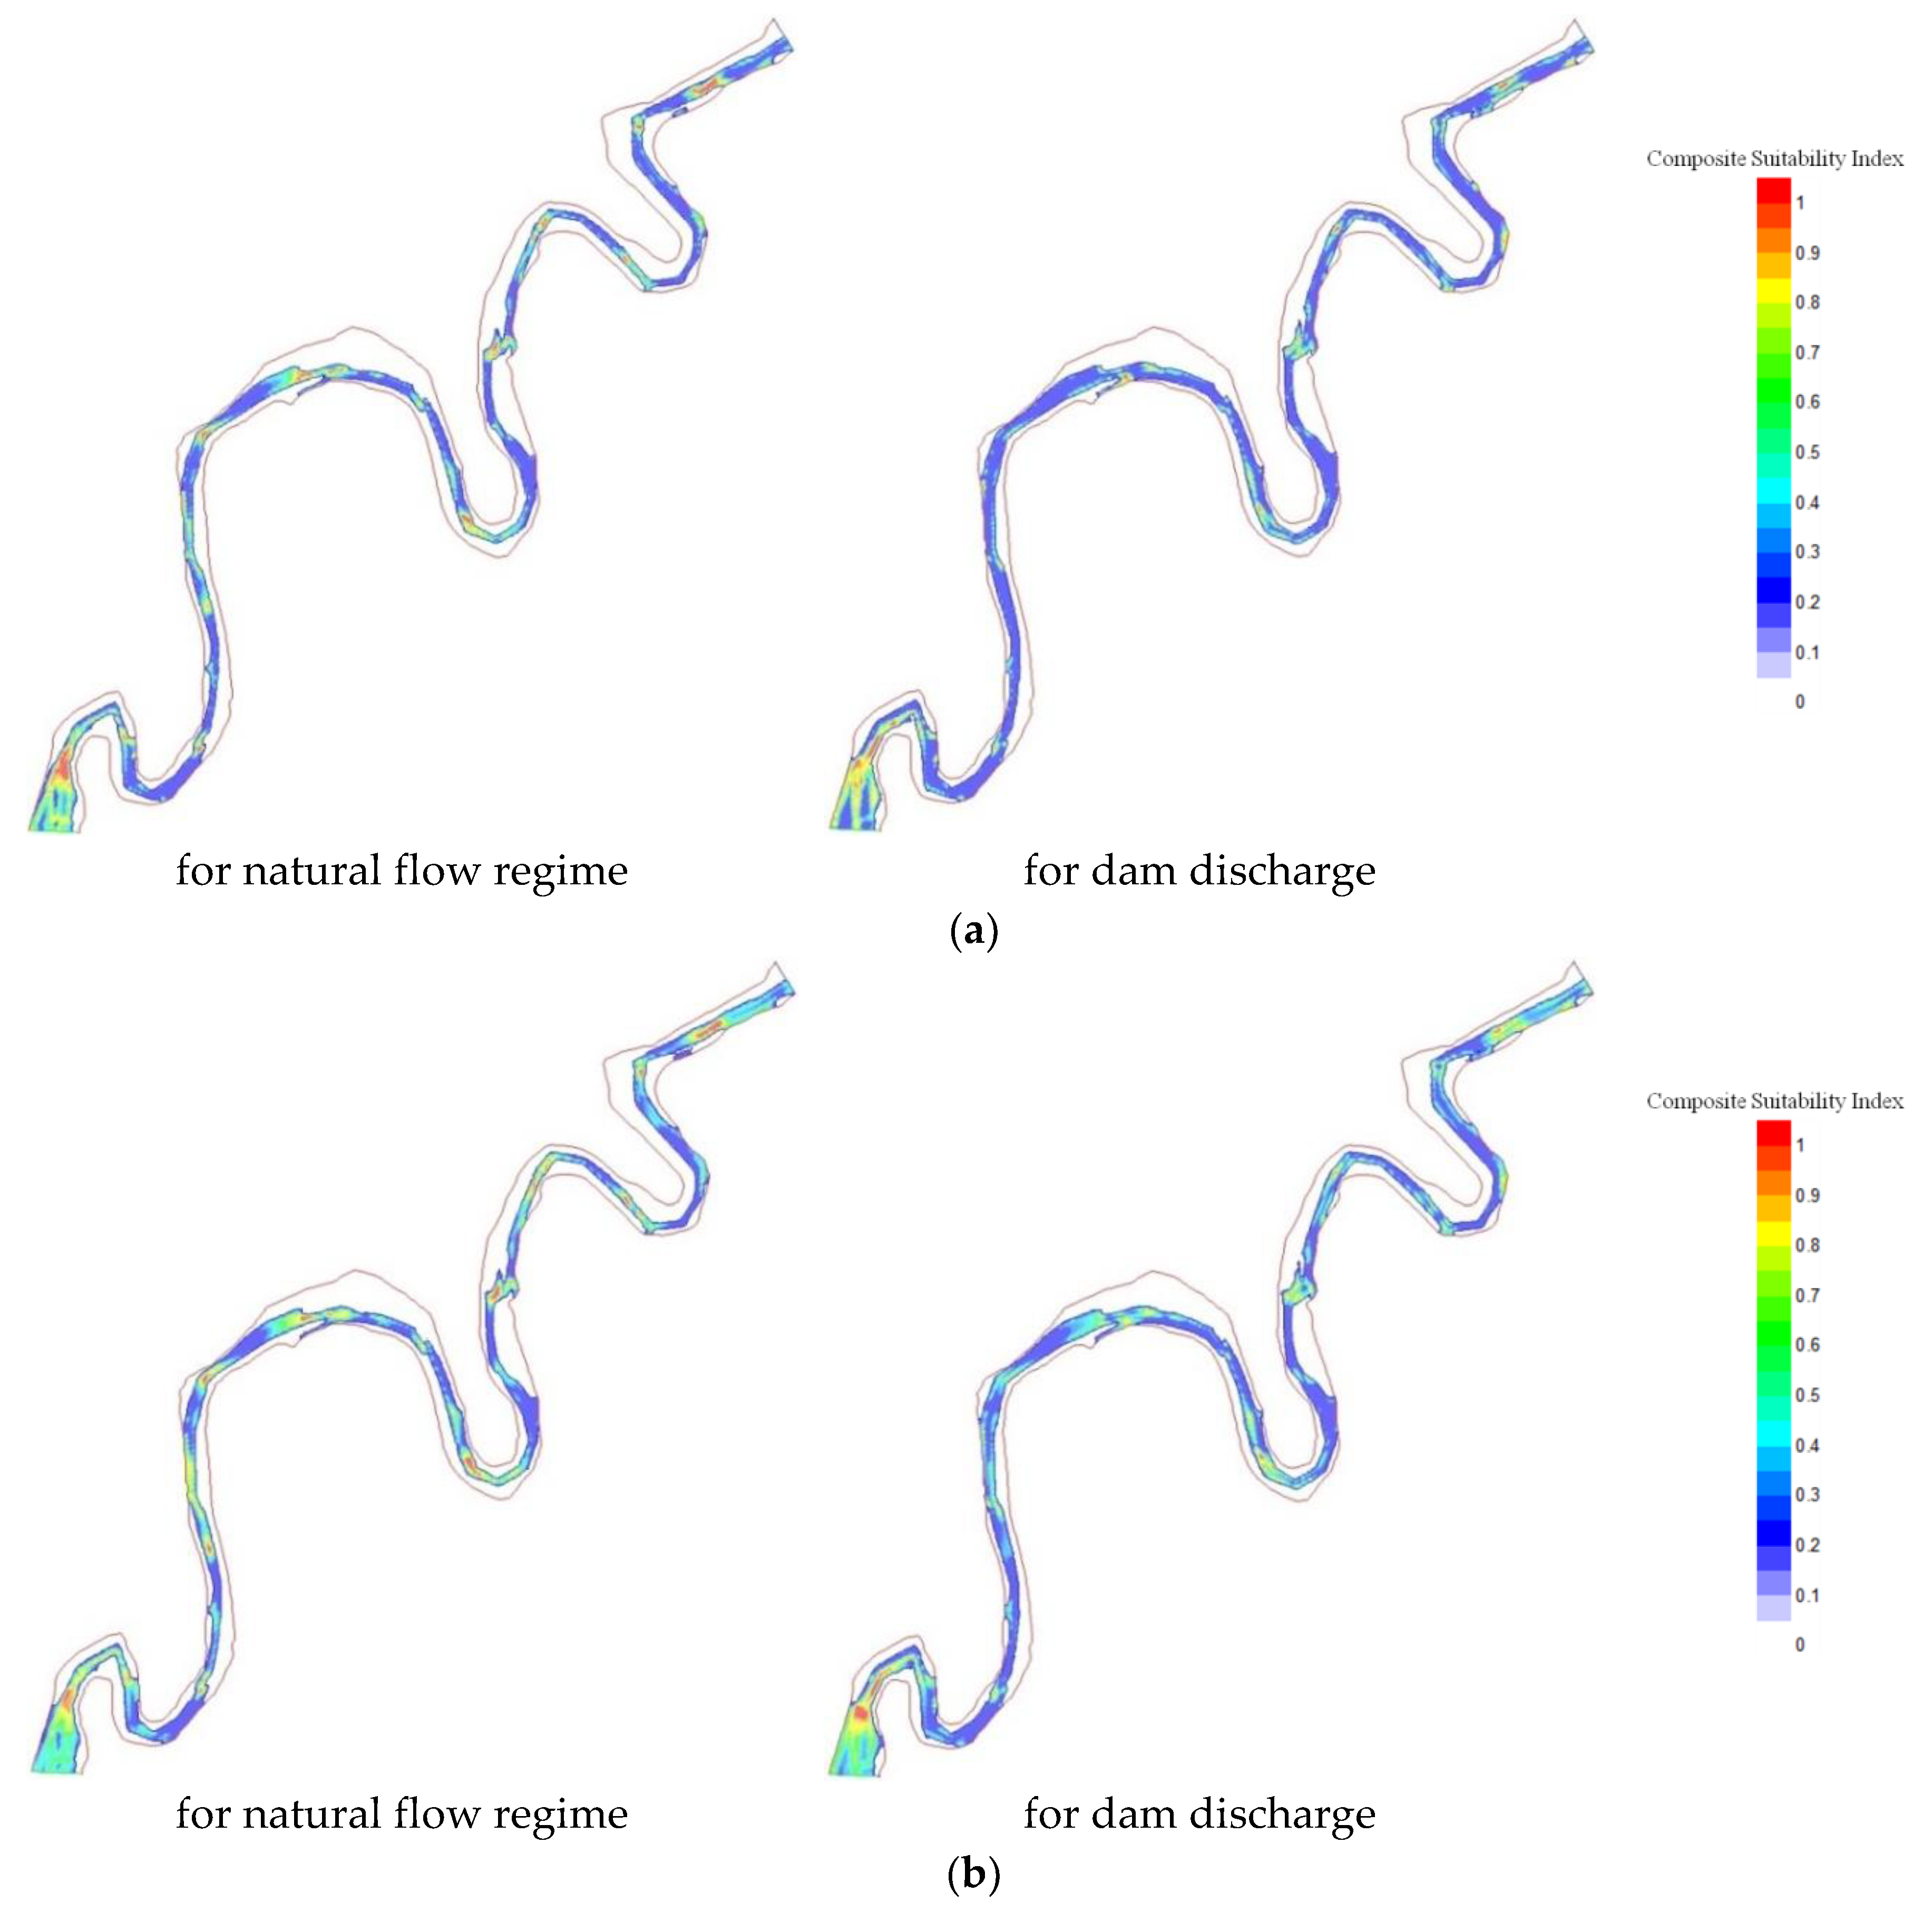
Figure 6 shows the CSI distributions predicted by the HSI model with HSCs by the method of Gosse [33] in Figure 4 for natural flow regime and dam discharge. In the figure, the CSI for the individual target species were predicted by the multiplicative aggregation method. The CSI ranges from zero to unity, indicate the unsuitable and optimal habitat conditions, respectively. The predicted CSI distributions are averaged over the year. In general, it can be seen that the dam discharge significantly decreased the CSI when in comparison to the CSI distribution for the natural flow regime. This is because the CSI increases with discharge up to the normal flow condition and then decreased. That is, the water releases about 15 m3/s, this exceeds the maximum habitat suitability.
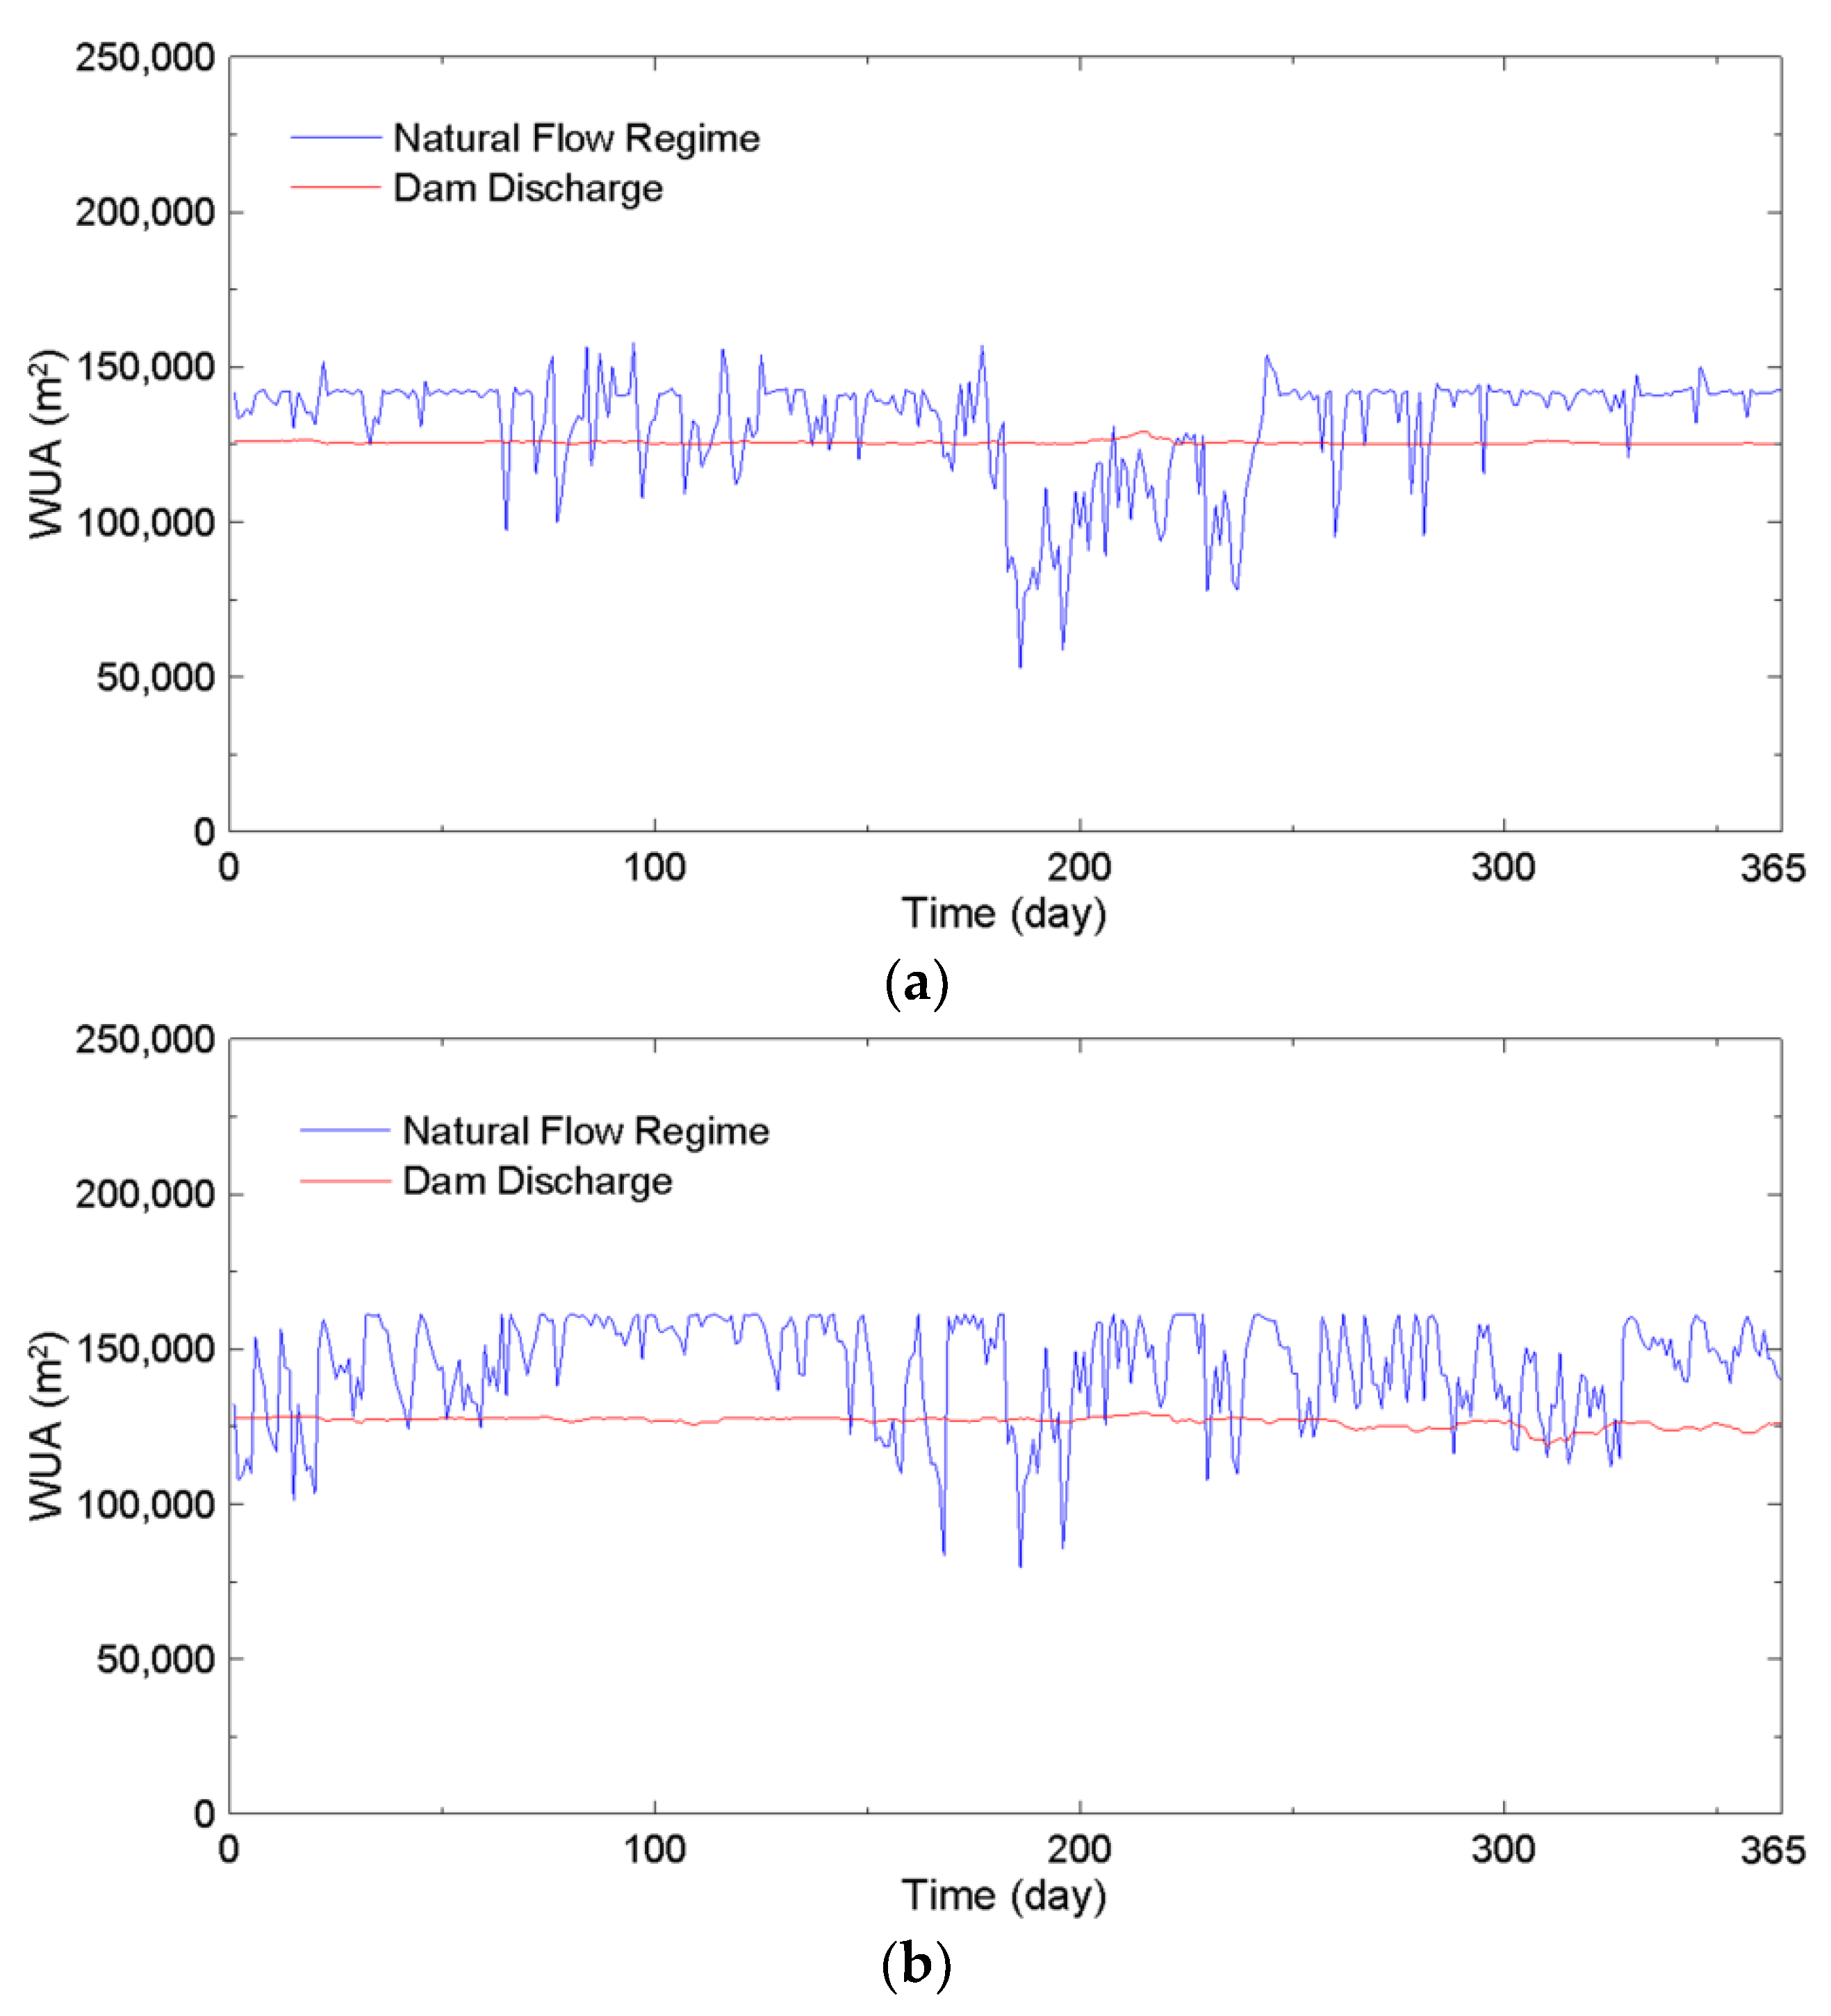
Figure 7 shows the change in the WUA with time for the target species. It can be seen in Figure 7 that the WUA with dam discharge effect is smaller than the WUA for the natural flow regime, except in high-flow events. This indicates that the water release from the dam significantly affects the habitat suitability of the target species. This is consistent with previous findings [16,17,18,46,47]. Quantitatively, the natural flow regime increases the WUA by about 25% for the Zacco platypus and Baetis fuscatus. The results also indicate that the physical habitat suitability of target species in the study reach is most affected by the change in discharge.
4.2. Scenarios Using the Building Block Approach
The BBA was developed for modifying dam operations through mimicry of the natural flow patterns [8,48]. The BBA is one of the holistic methods for estimating environmental flows using the hydrologic and ecological data. The BBA consist of three blocks [49]. The first block is defined as the base flows, using the averaged hydrologic data over each month. The second block is to build the high flows and overbank flows for channel and habitat maintenance. Finally, the third block is to increase the base flow for spawn habitat and migration in the dry season. Additionally, Postel and Richter [8] introduced modified dam operation scenarios based on the natural flow patterns. They proposed four methods, namely static minimum flow allocation, percent flow allocation, seasonally adjusted minimum flow allocation, and seasonally adjusted minimum flow allocation with seasonal flushing flow.
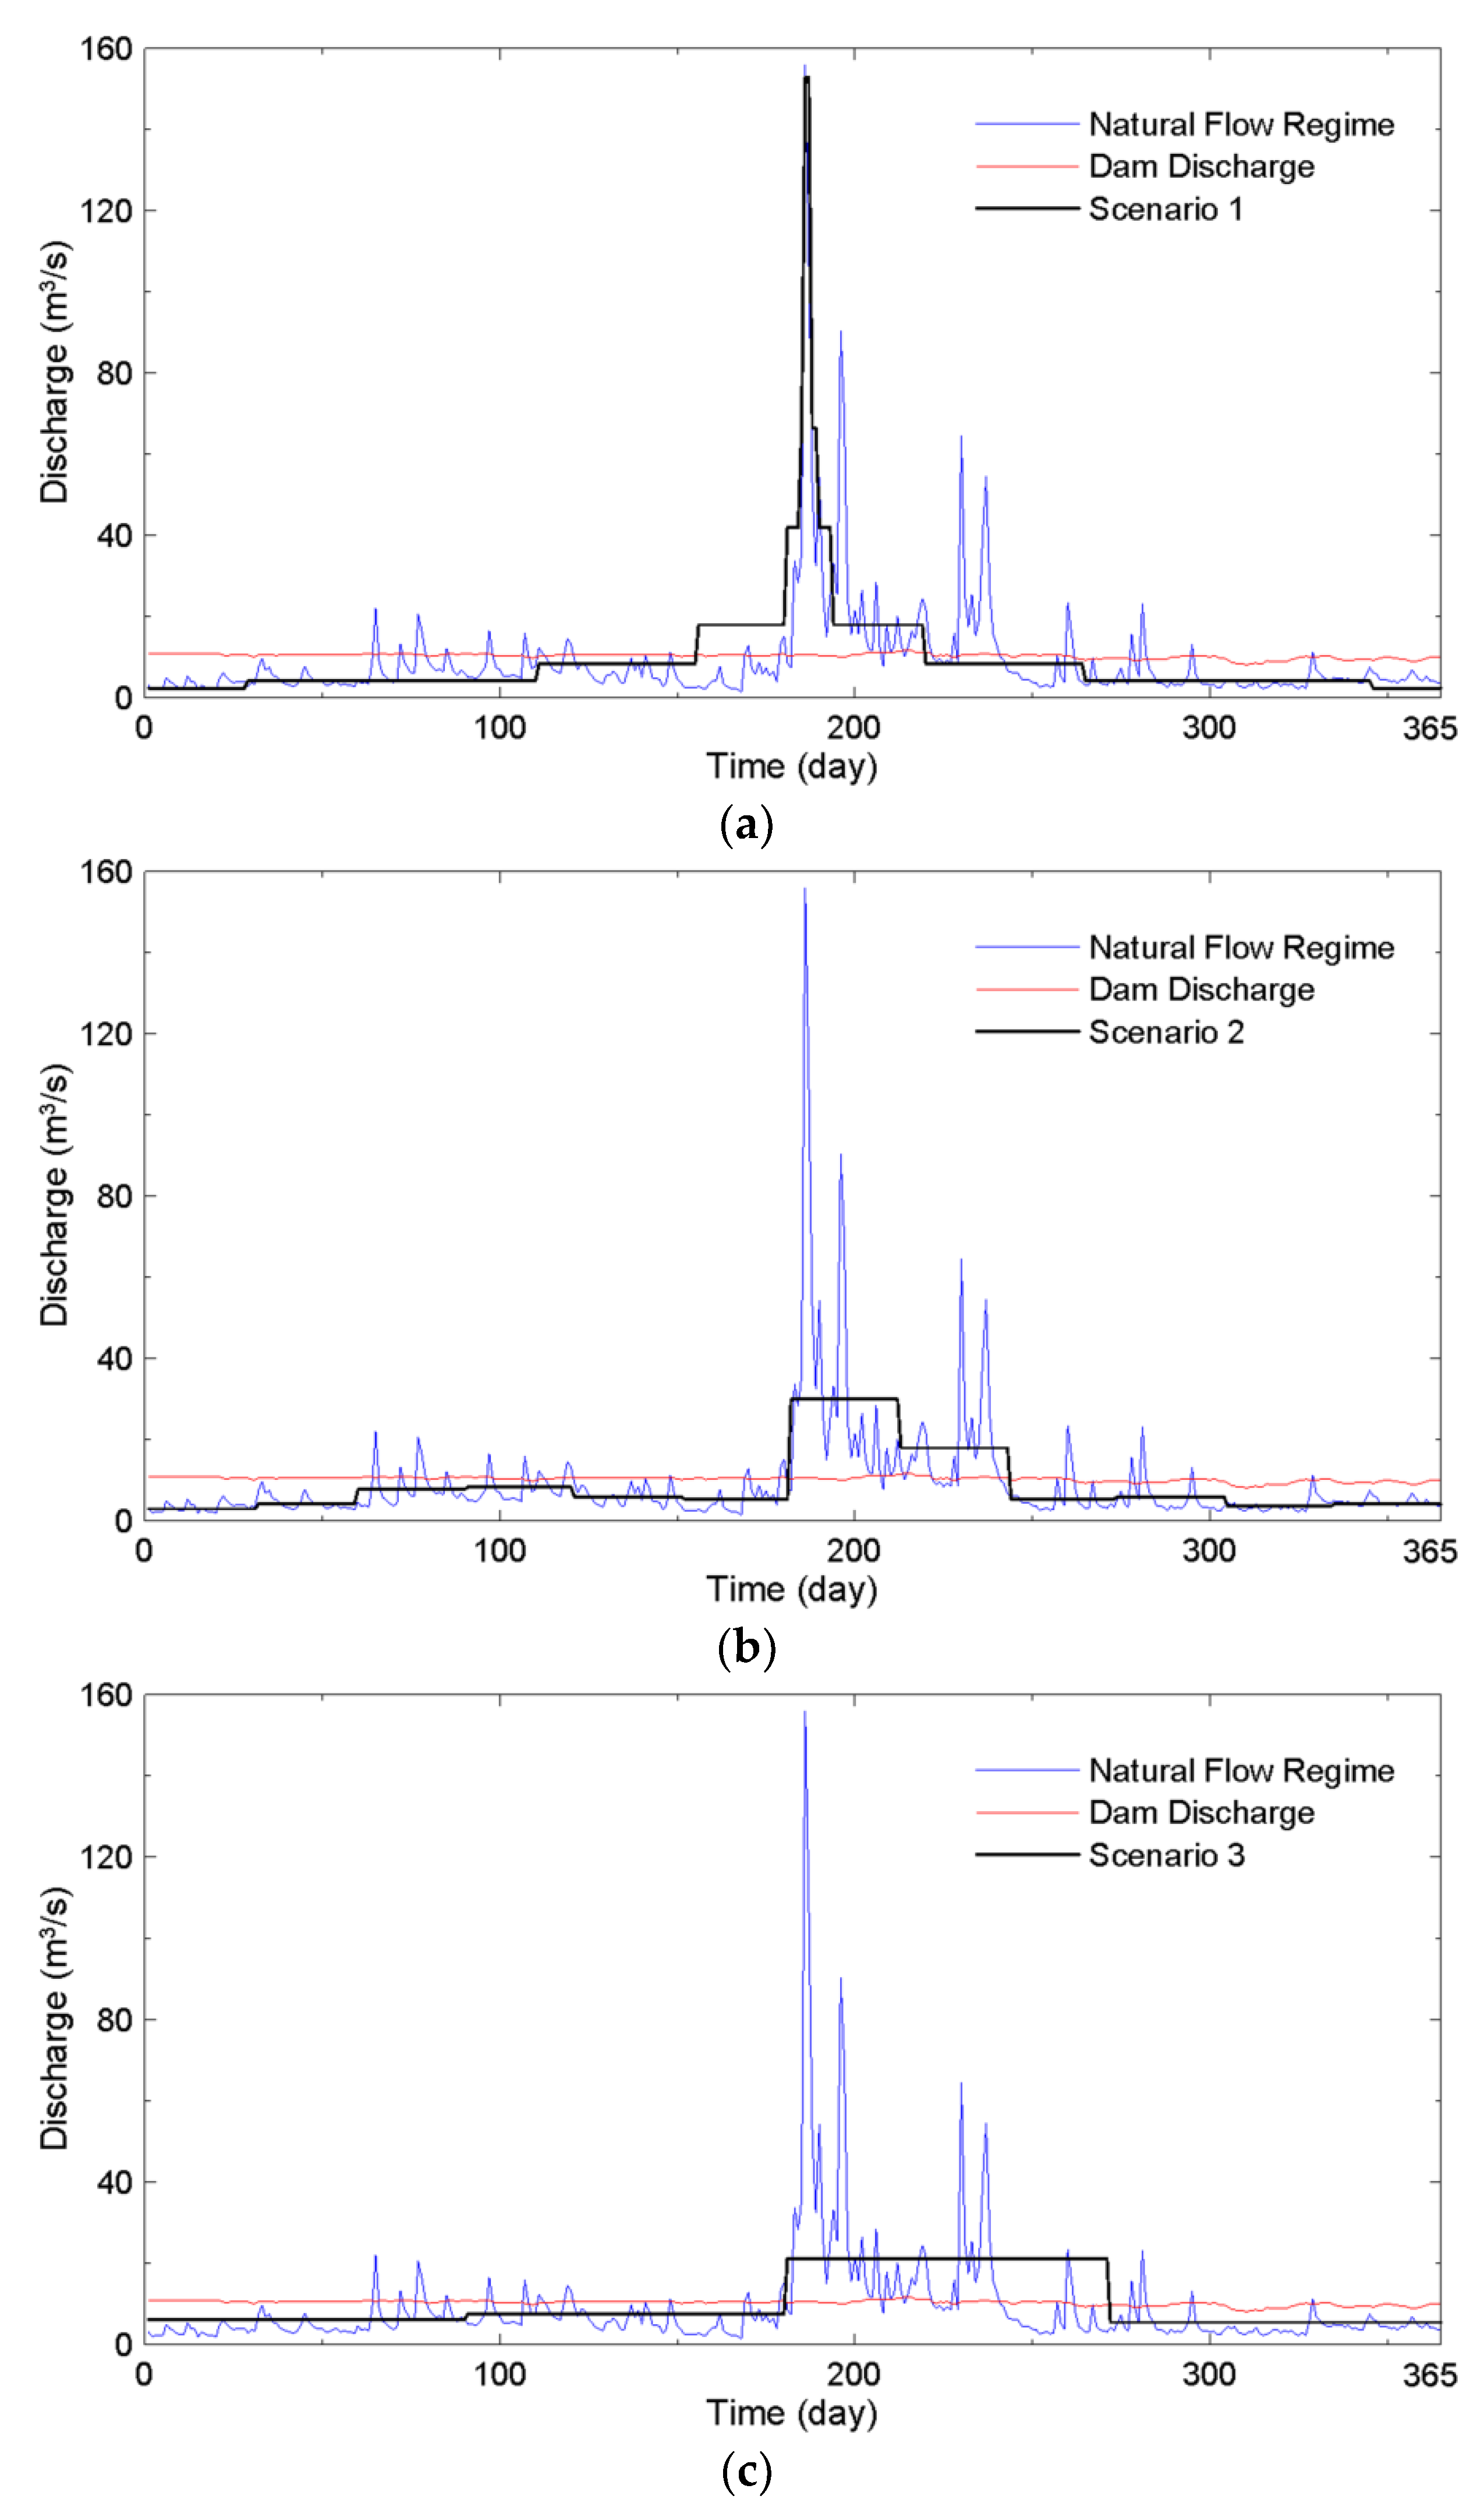
Figure 8 show the scenarios, respectively, which were used in the present study. The methods for constructing scenarios by using the magnitude–duration concept, base flow allocation concept, and seasonally adjusted minimum flow allocation concept are used. For comparisons, the natural flow regime and water releases are provided. Figure 8a shows scenario 1, using the analysis of the magnitude and duration for the hydrologic data. In the figure, scenario 1 is composed of several flow events, namely low-flow events, high-flow events, and flood-flow events. The peak discharge of scenario 1 is 153 m3/s in June. Figure 8b,c show scenarios 2 and 3, using the base flow allocation concept and seasonally adjusted minimum flow allocation concept, respectively. In general, scenario 2 and scenario 3 consist of low-flow and high-flow events. The respective total volumes of scenario 1, scenario 2, and scenario 3 were 692 × 106 m3, 701 × 106 m3, and 703 × 106 m3, which are very close to the volume of 705 × 106 m3 released from the dam.
4.3. Changes in the Composite Suitability Index and Weighted Usable Area
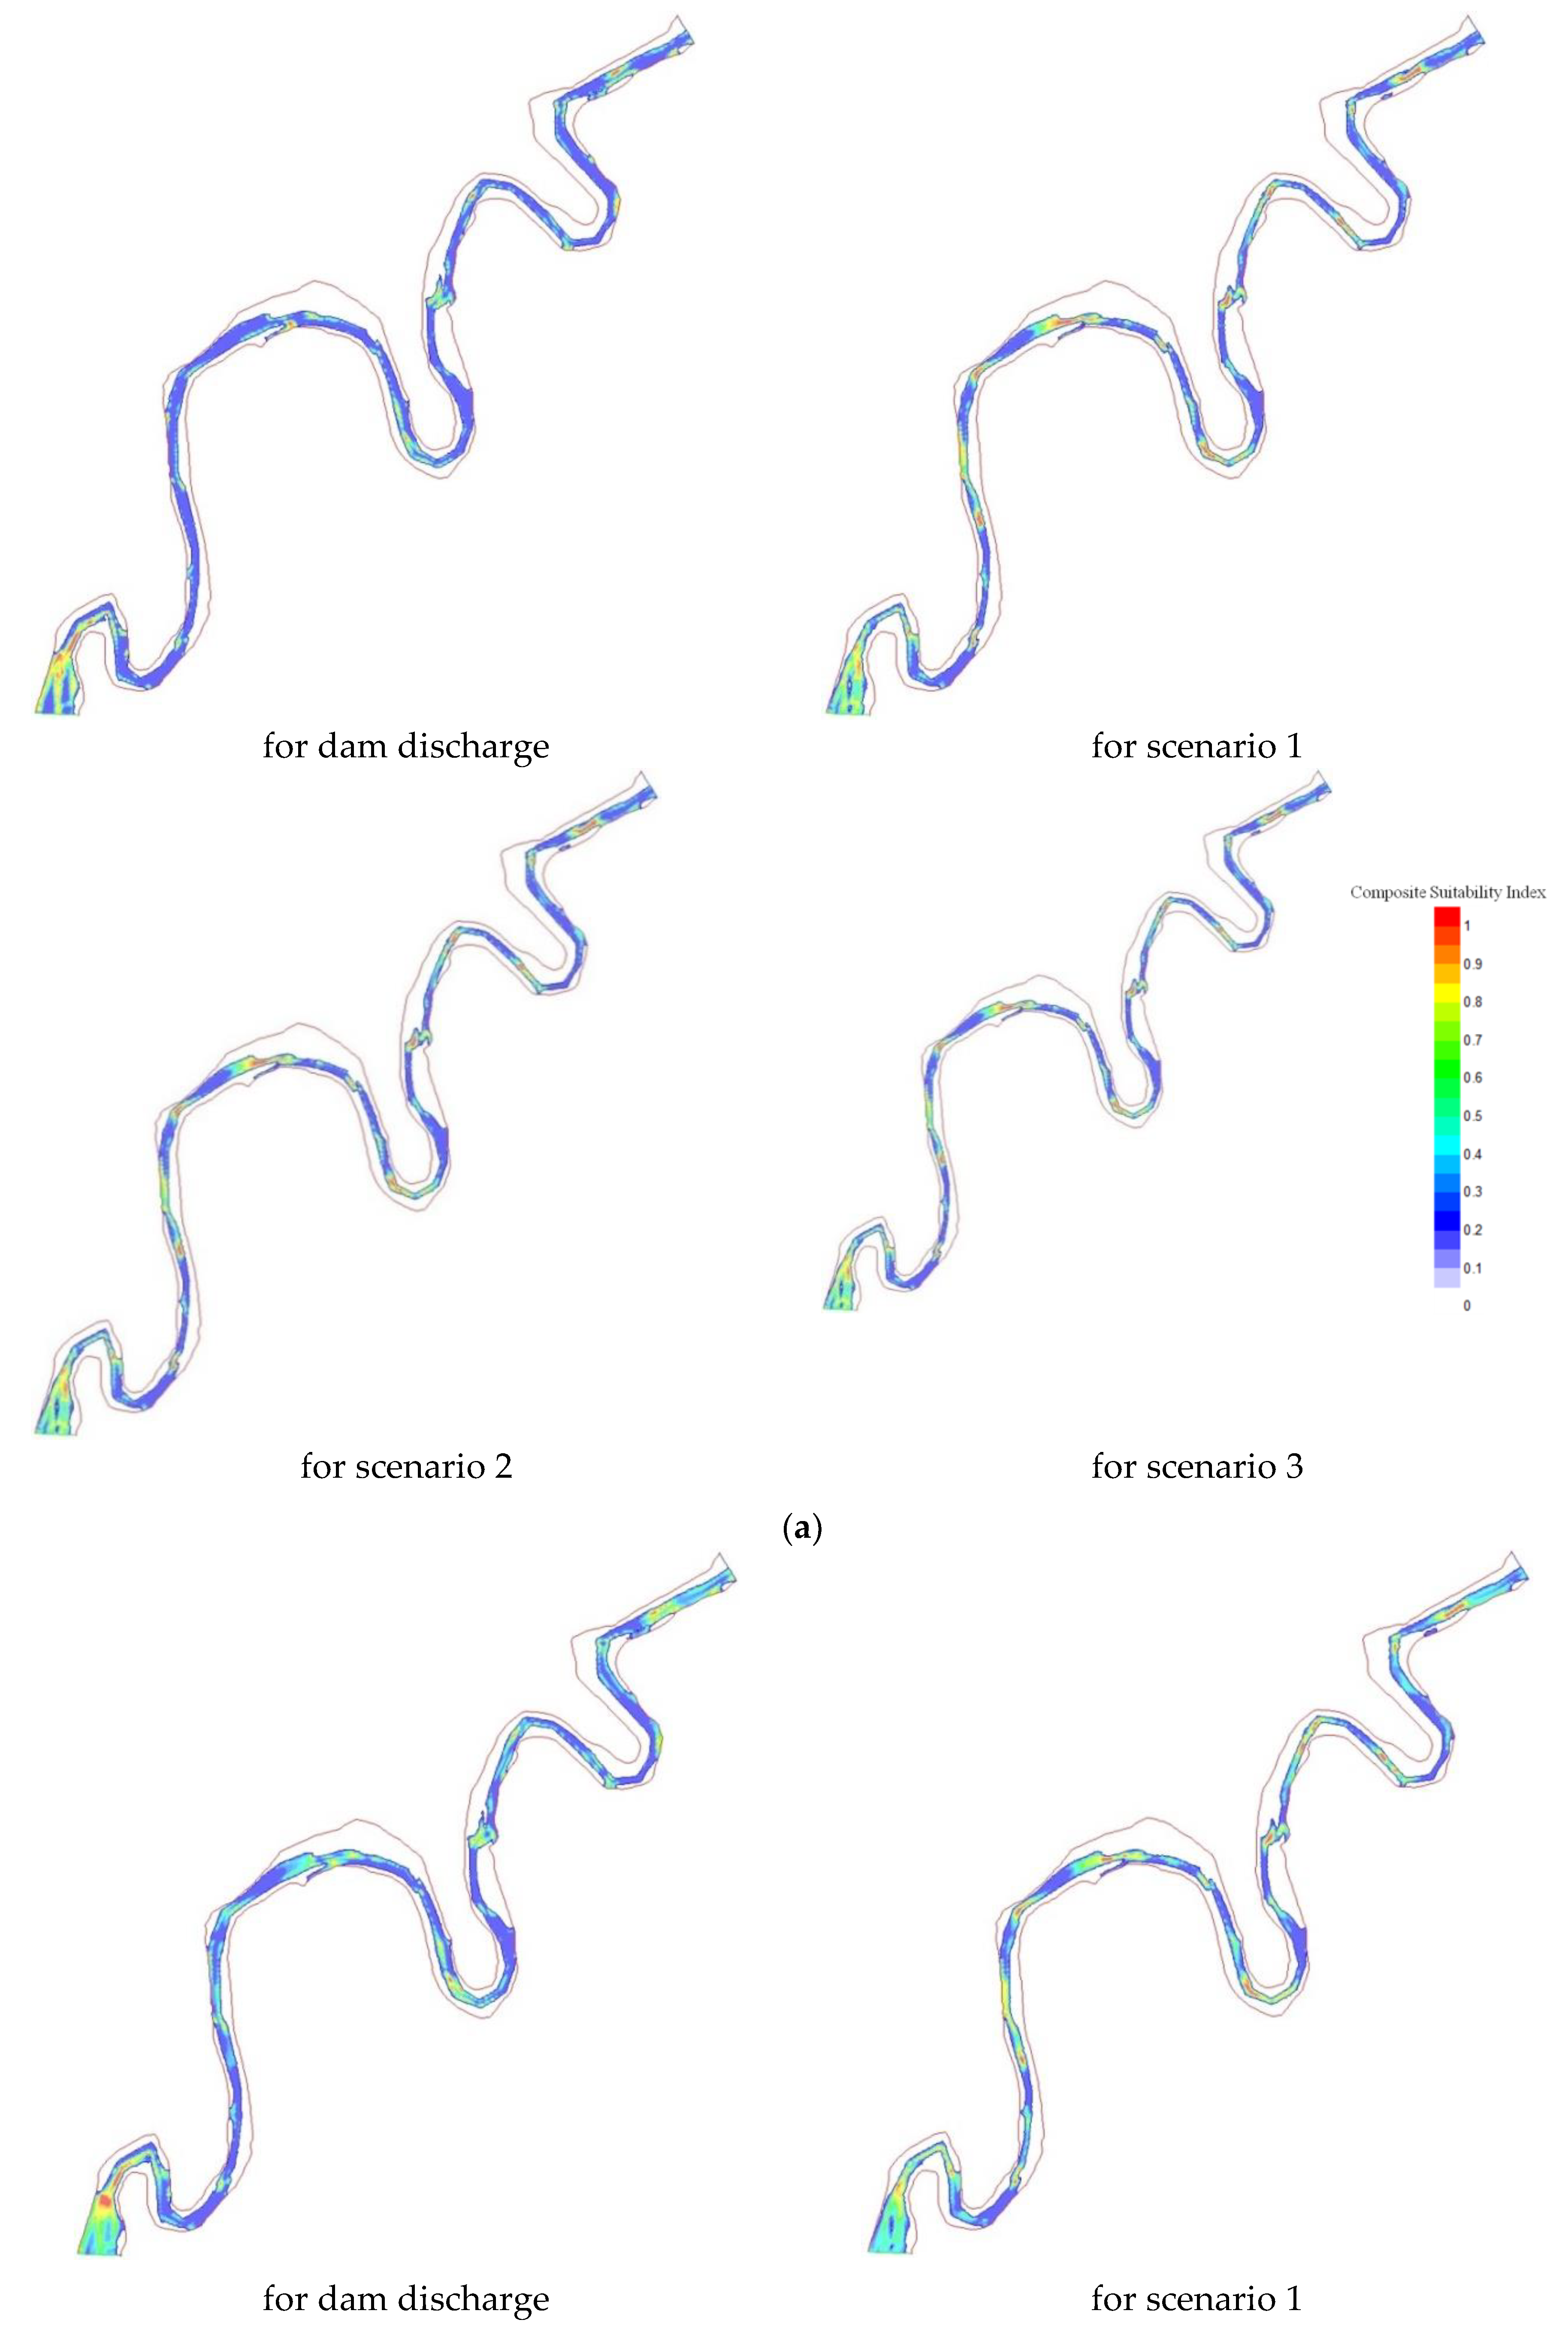
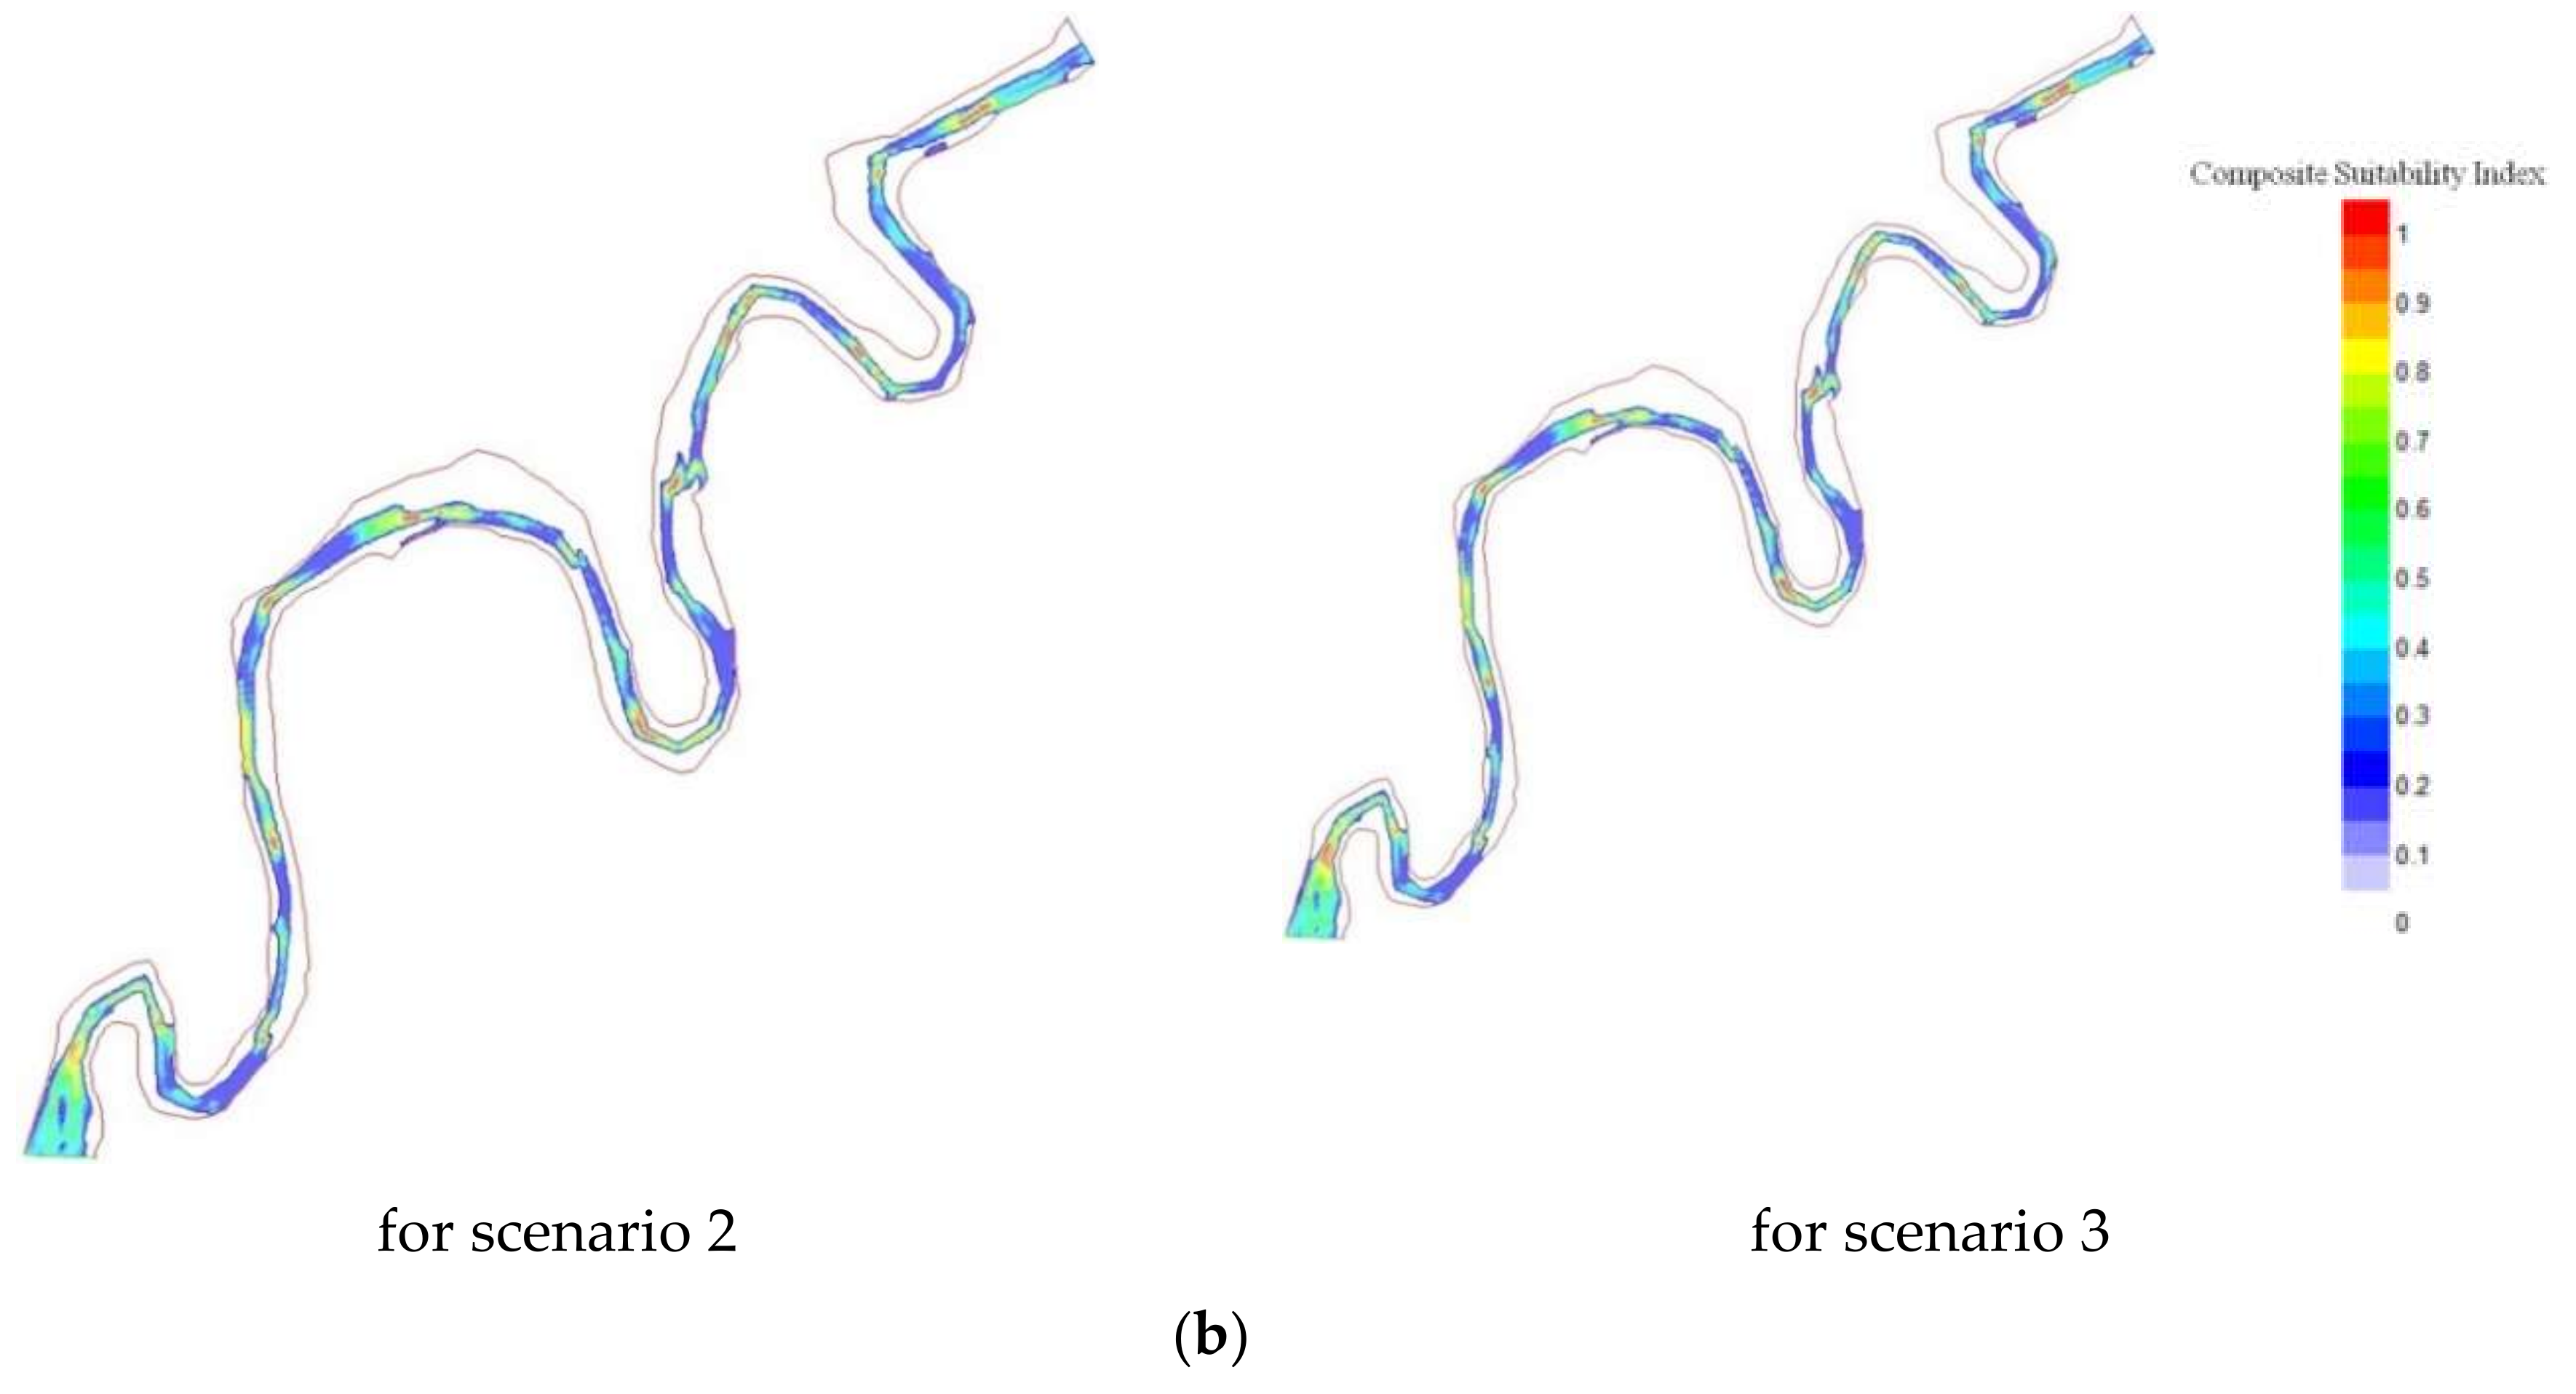
Figure 9 show the CSI distributions for the target species predicted by the HSI model for dam discharge, scenario 1, scenario 2, and scenario 3. The CSI distributions obtained from the physical habitat simulations with HSCs for the target species are shown in Figure 4. The computed CSI distributions are averaged over the year. It can be seen that the scenarios significantly increased the CSI in comparison to the CSI distribution for the water releases from the dam. This is because the habitat suitability for the target species increases with the increasing discharge from the drought flow to the normal flow. However, the averaged water release from the dam is about 15 m3/s, exceeding the normal flow condition through the year. This is due to the physical habitat variables that are not in the preferable range of the target species.
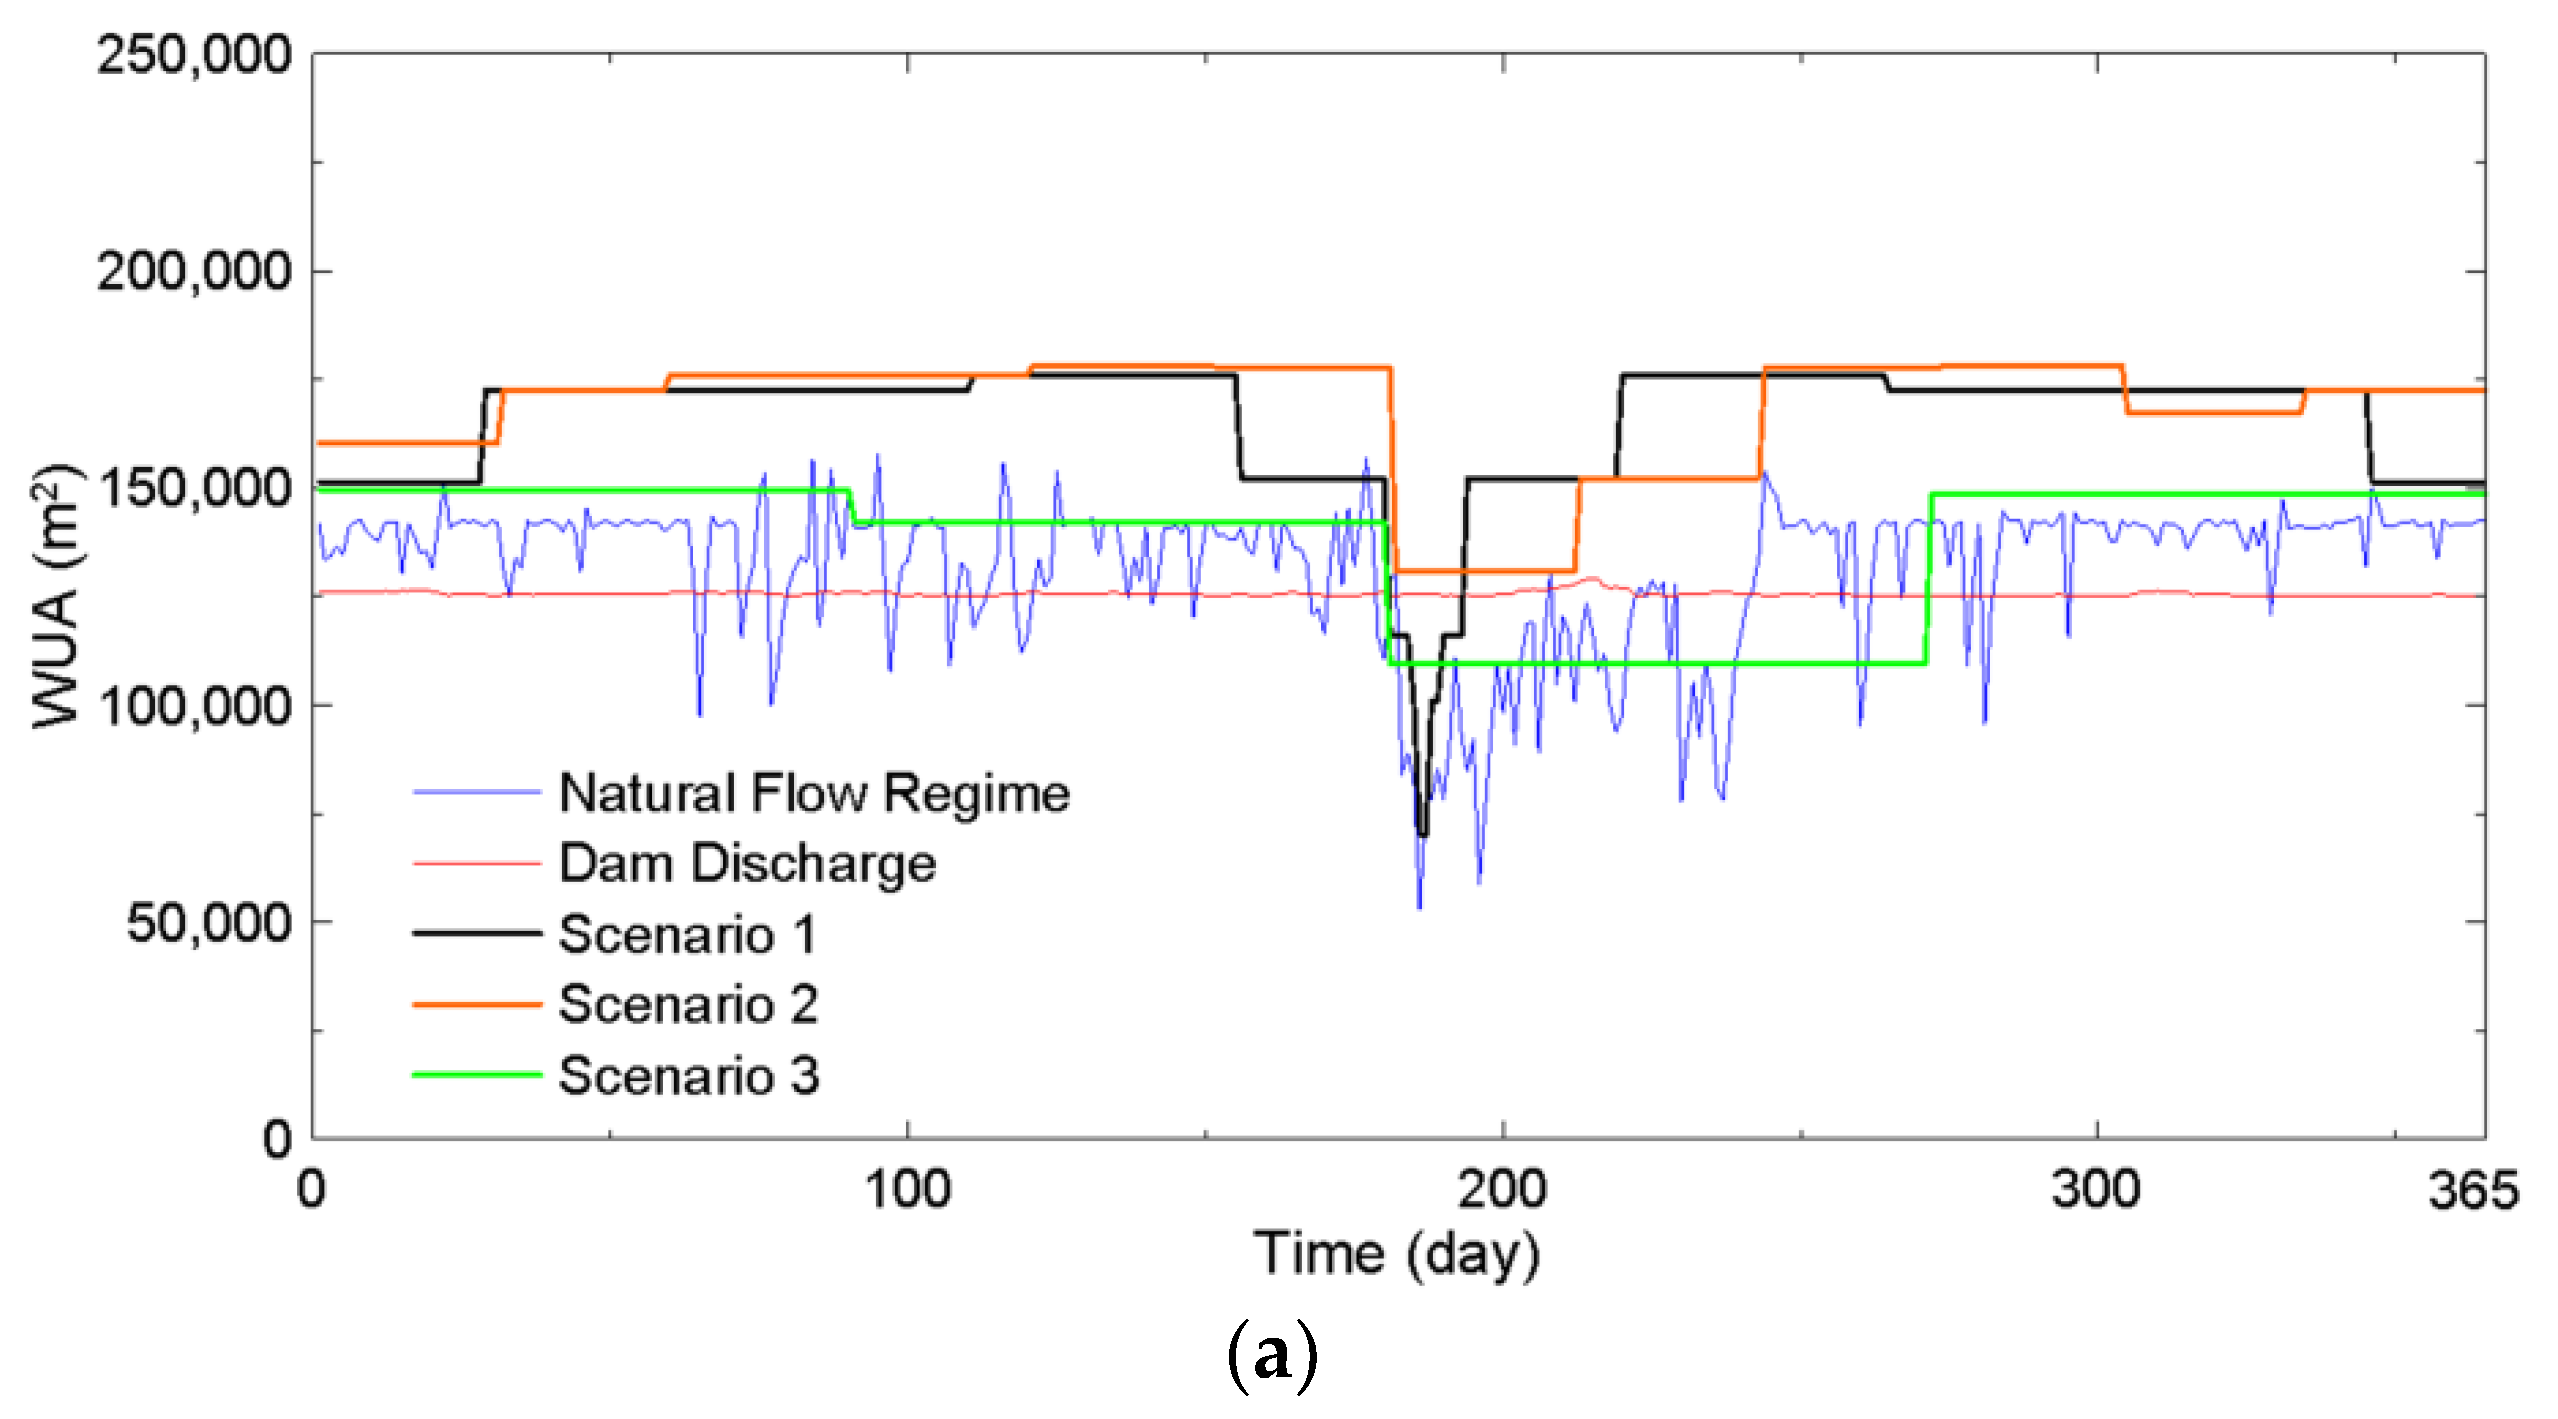
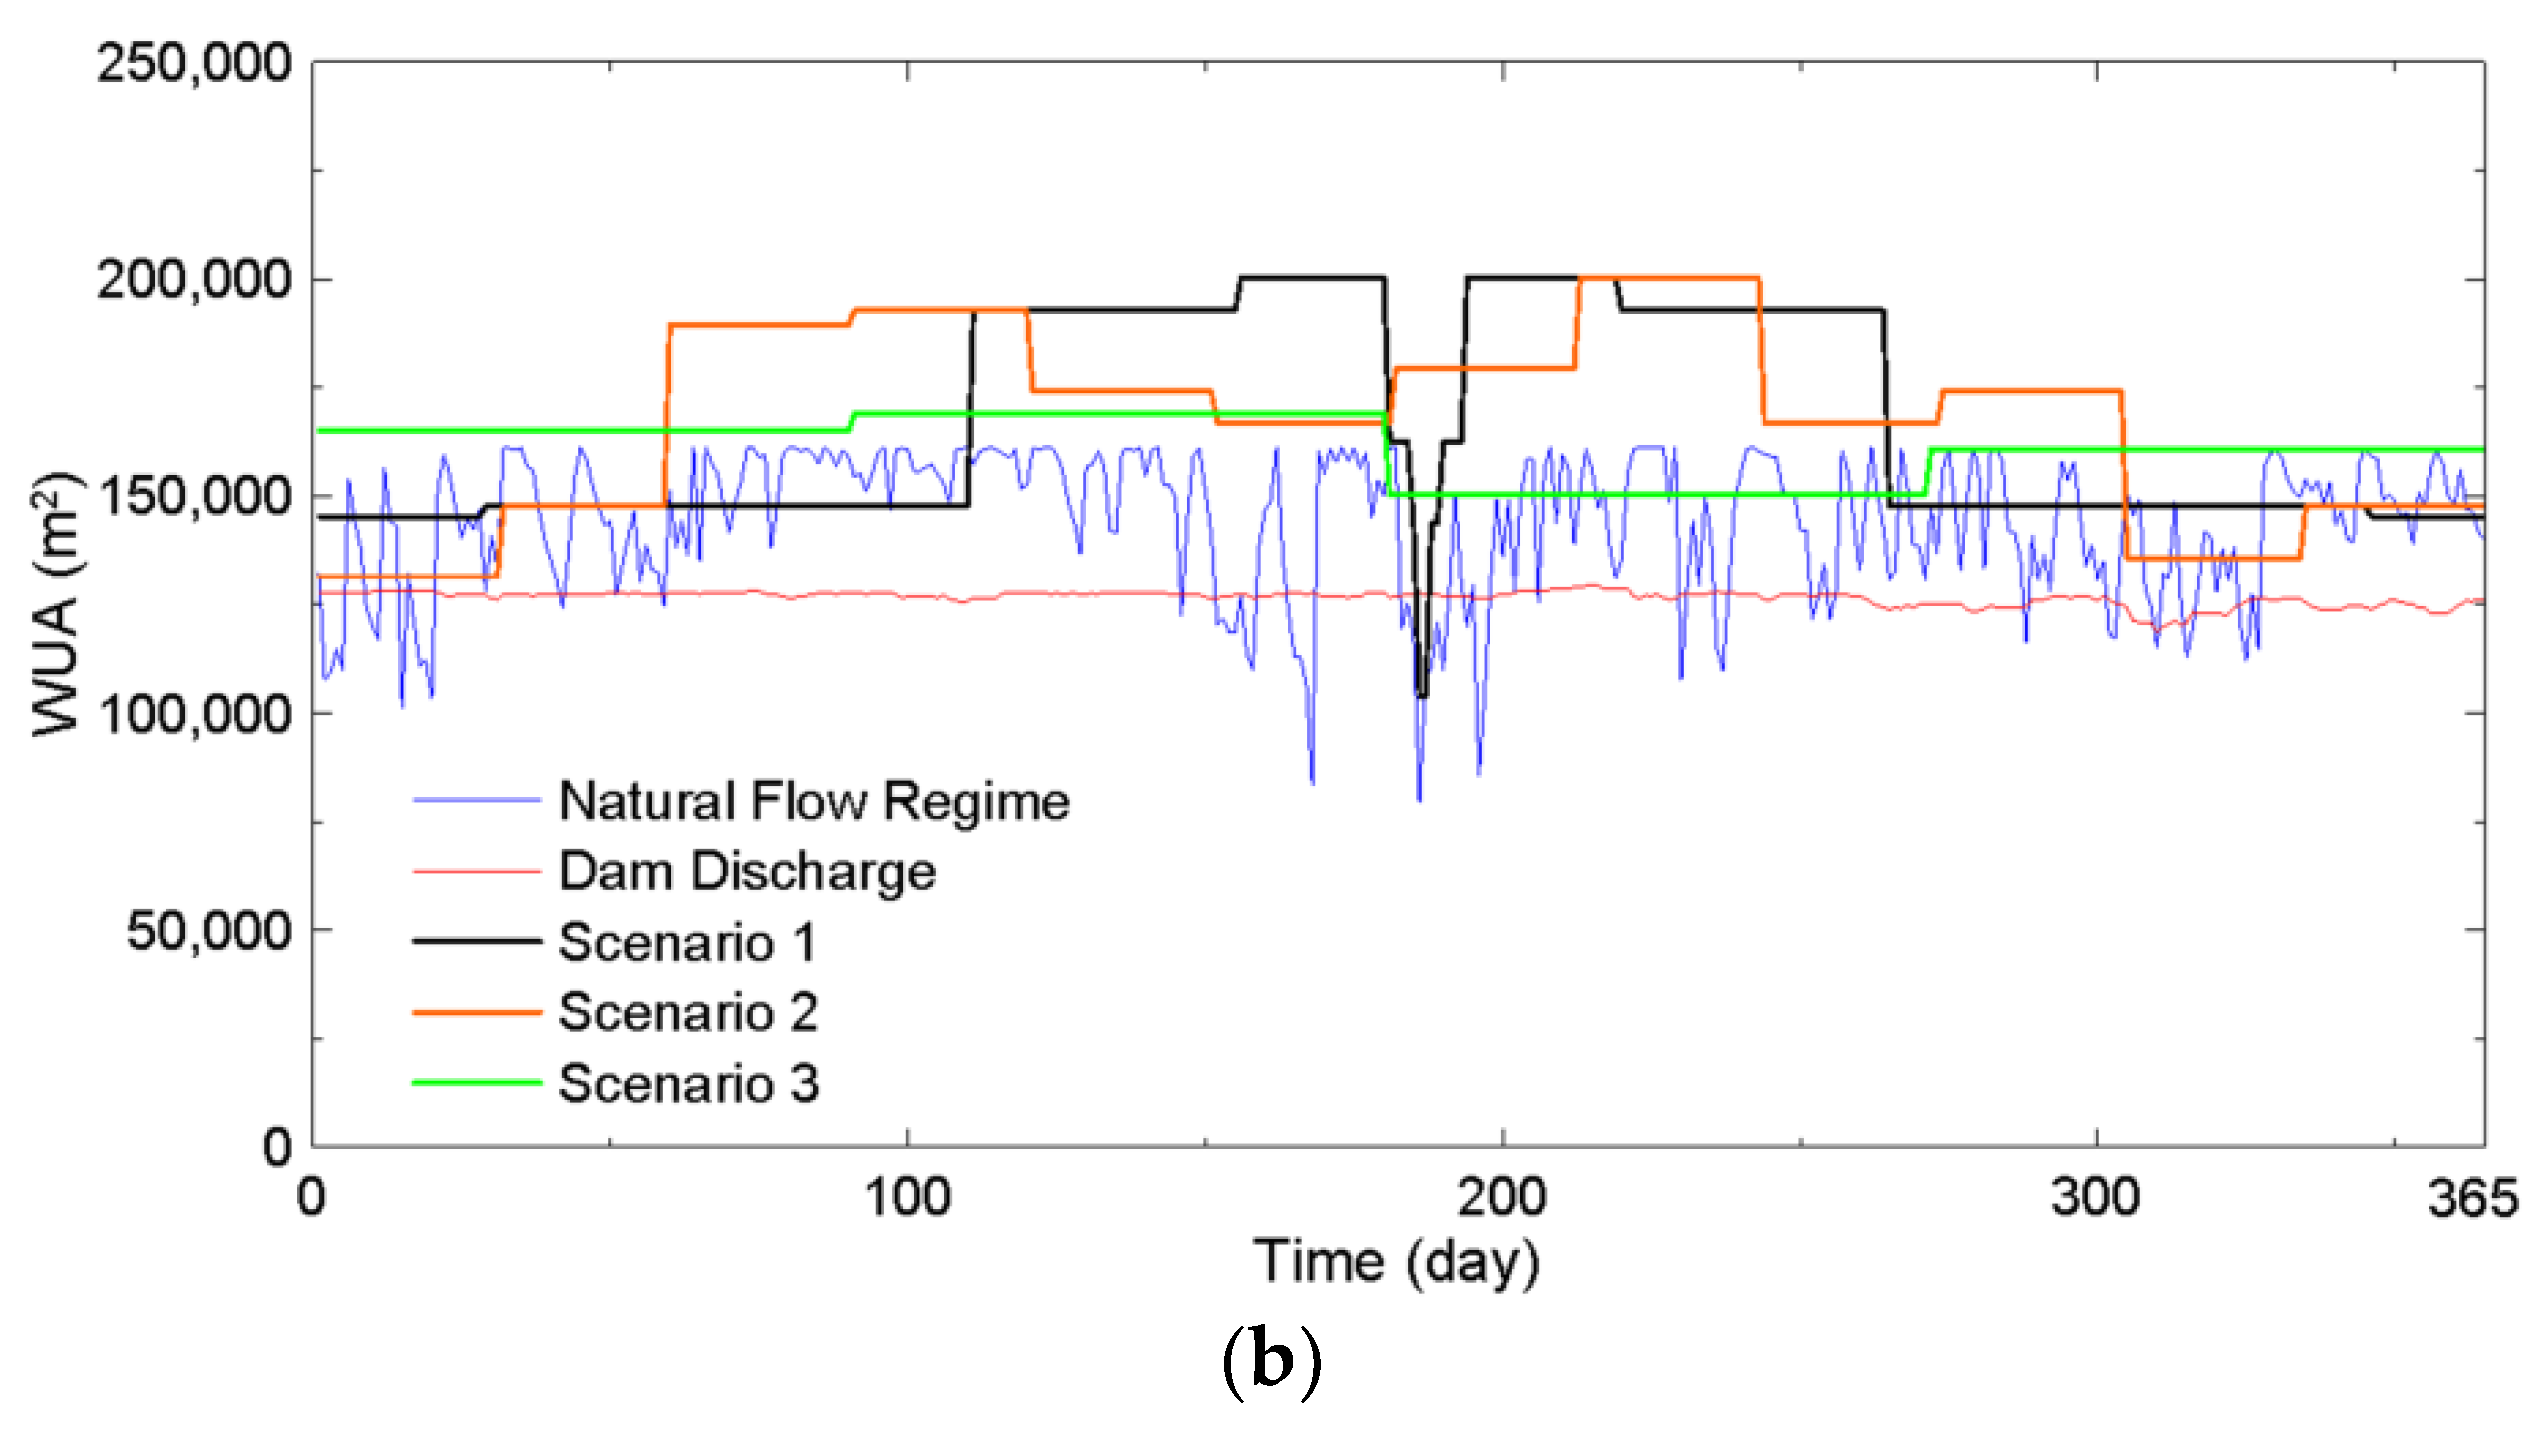
Figure 10 show the change in the WUA over time for the target species. In the figure, for comparison, the WUA with the natural flow regime and water releases from the dam are provided. It can be seen that the effects of the WUA with scenario 1 and scenario 3 are larger than with the WUA for the water releases from the dam, except during the flood season. Quantitatively, scenario 1, scenario 2, and scenario 3 increase the WUA by about 11.40% and 17.25% for the Zacco platypus and Baetis fuscatus, respectively. This indicates that the scenarios adversely affect the habitat suitability of the target species.
4.4. Restoration of Flushing Flood Events
Flow regulated by the dam results in water release due to hydroelectric power generation, as well as the changes in the annual flow regime. That is, the magnitude of discharge is flattened over the year, and the downstream reach no longer experiences flood events. Changes in the natural flow regime due to hydropeaking may affect the aquatic habitat in the downstream reach from the dam [17,18,50,51,52,53,54]. However, the upstream dam often releases large amounts of water during the flood season. A large amount of water plays important roles in the downstream habitat. A certain amount of water is allowed to wash debris away and cause changes in the morphology and the water quality in the downstream reach. Specifically, such morphological change alters aquatic ecosystems, resulting in increases in the habitat suitability and the spawning habitats of the aquatic species.
Figure 11 shows the bed elevation changes for the peak discharge from the upstream dam. The peak discharges were observed from 2007 to 2016. The dam discharge was about 20 m3/s for hydroelectric power generation throughout the year, except for the flood season; the dam sometimes released discharges up to 520 m3/s. The peak discharge of the release from the dam was 511 m3/s in June 2011, which was used in this study. It was assumed that the peak discharge repeated the sequence up to five times. The flow depth and velocity are computed first along the longitudinal direction of the hydraulic model. Then, the bed elevation change is computed. Finally, CSI and WUA are evaluated based on the updated information for the bed elevation and the computed flow field. The time period of three days in June is a flood season, which is important to the fish habitat because the watershed area increases, resulting in the increase in the habitat availability and spawning areas [6,14,55]. The bed elevation changes from −1 to 1, indicating the erosion and deposition, respectively. In general, the bed change is higher in the vicinity of the bend from downstream reaches. Stream morphology affects bed sediment, resulting in fine particles at the downstream reach. The bed elevation change around the bend and downstream reach increases by increasing the number of times up to five times.
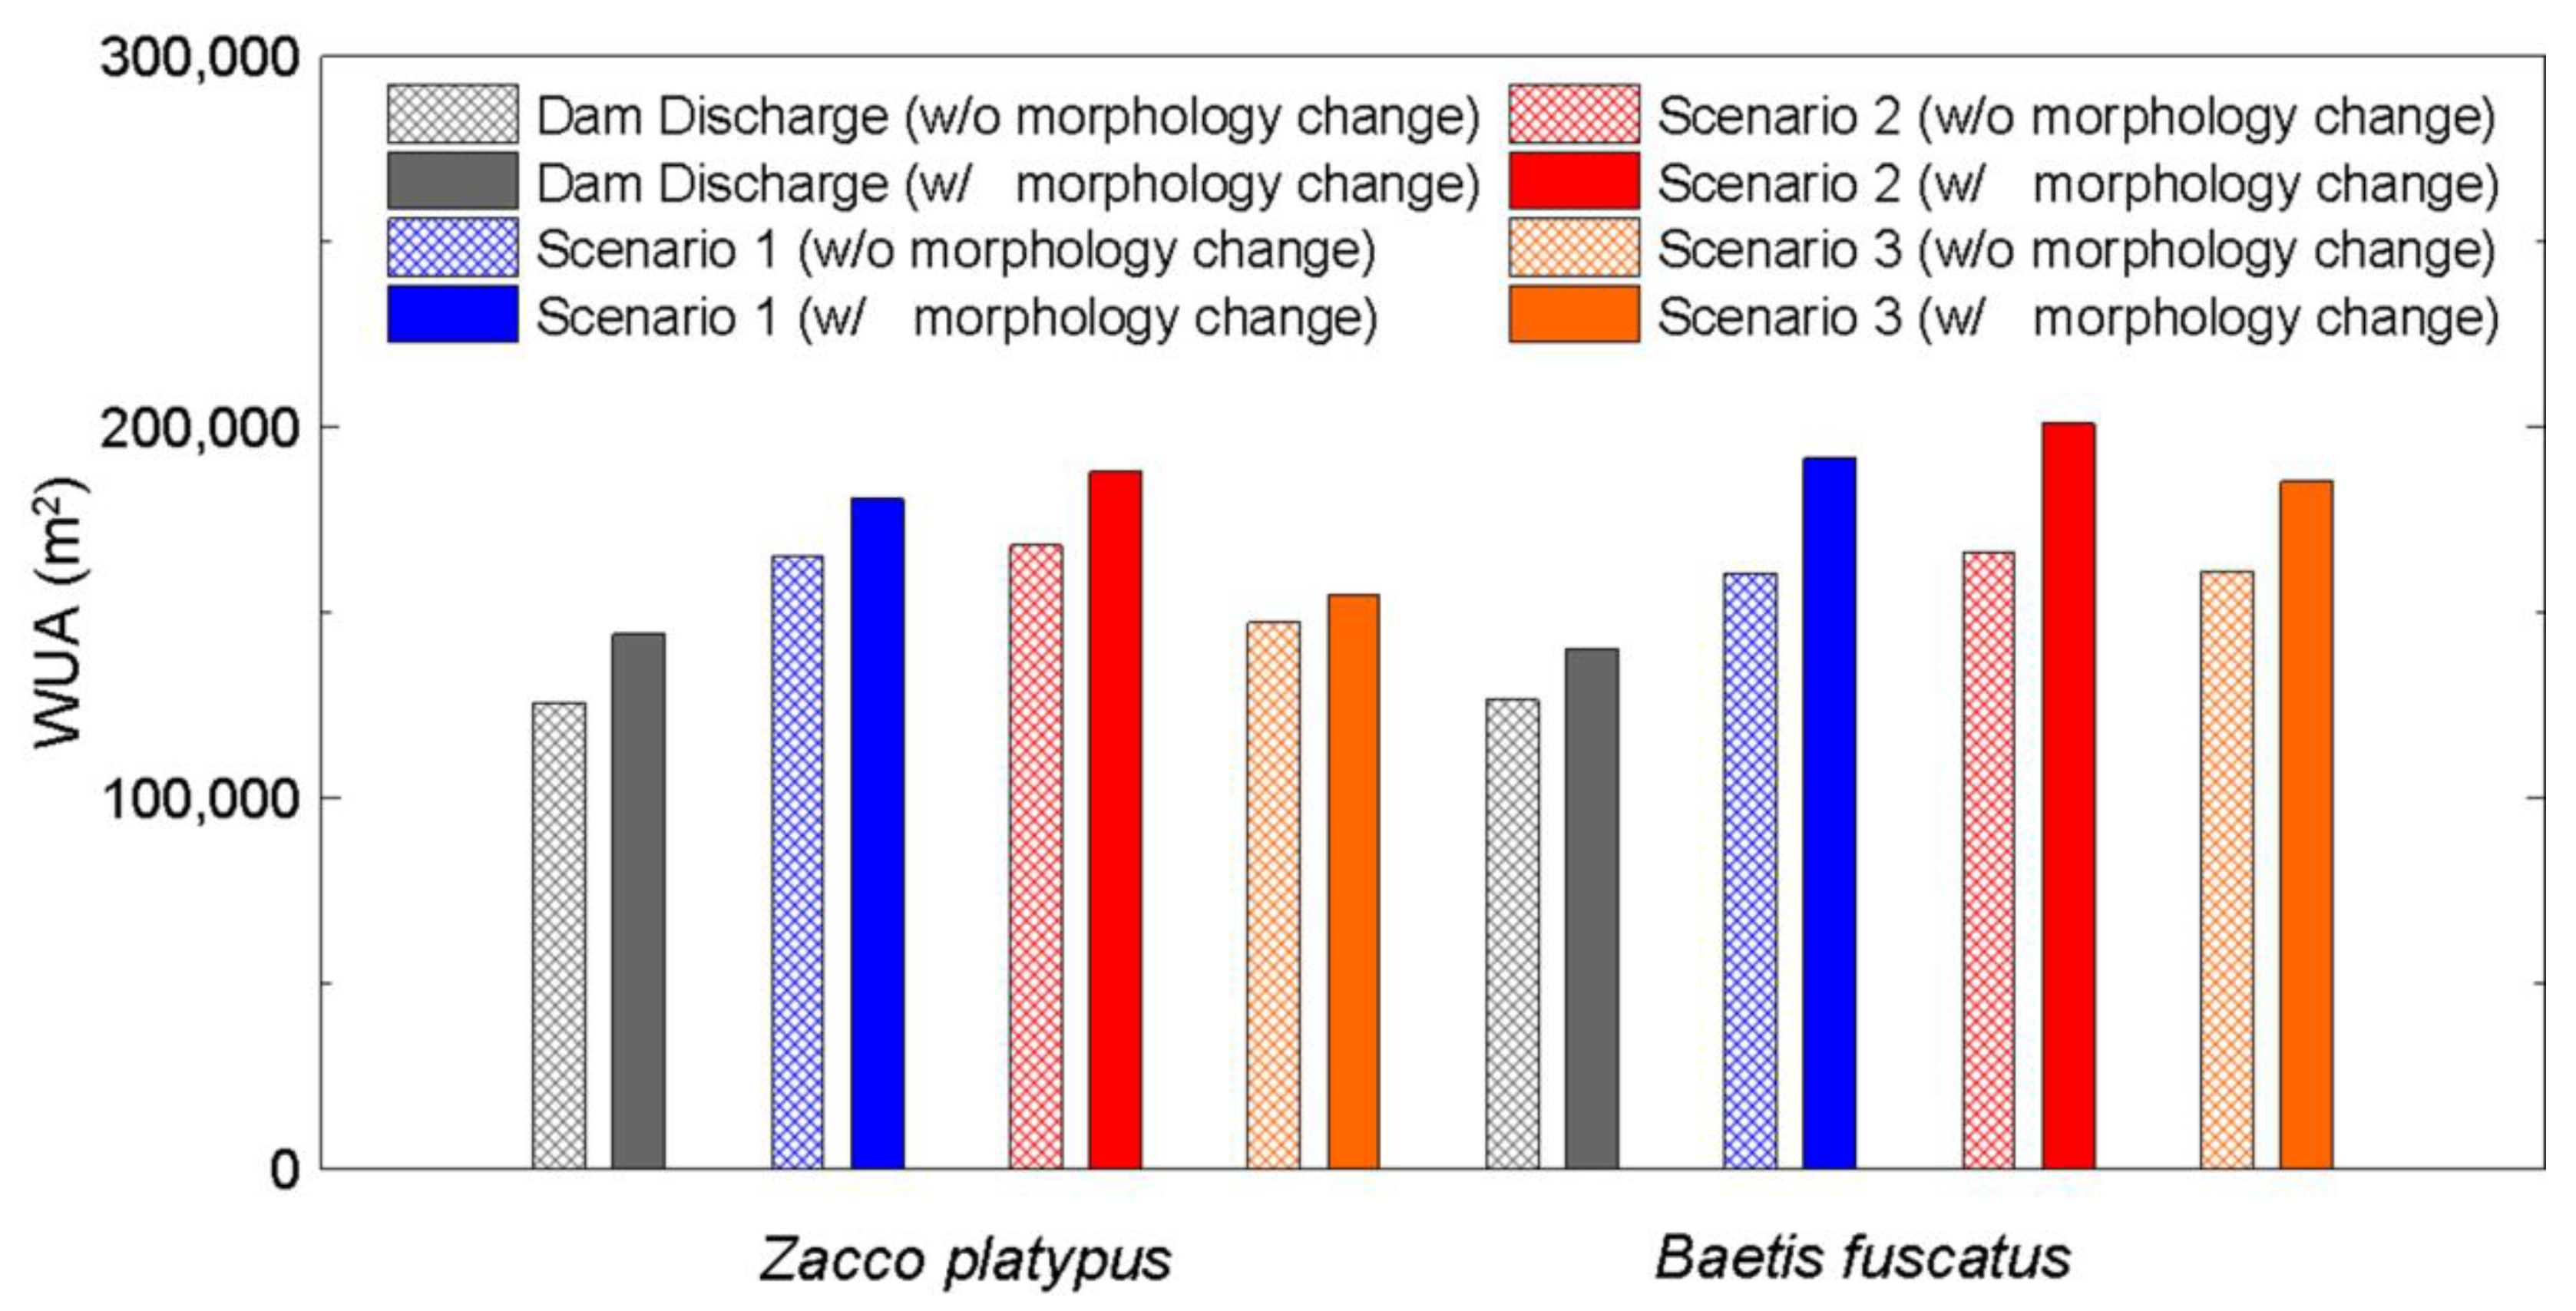
Figure 12 presents the change in the WUA for the target species with the morphology change effect. In the figure, for comparison, the WUA with the water releases from the dam is also provided. It can be seen that the morphology change effect increased the WUA significantly in the study reach, compared to the WUA without morphology change. This is consistent with findings by Moir et al. [56], He et al. [57], Macura et al. [58], and Radinger et al. [59]. Quantitatively, the morphology change increases the WUA by 10.28% and 16.48% for the Zacco platypus and Baetis fuscatus, respectively. This is due to the habitat variables that are in a suitable range to the target species. The results indicate that the inclusion of the flood events in the restoration of natural flow patterns is important for this type of assessment.
5. Conclusions
This study performed physical habitat simulations to investigate the impacts of modifying dam operation through natural flow patterns on the downstream habitat. The study area is a 13.4 km long reach located downstream from the Yongdam Dam in the Geum River, Korea. Field monitoring data revealed that the dominant species in the study reach are the Zacco platypus and Baetis fuscatus, which were selected as the target fish and target benthic macroinvertebrate, respectively. The River2D model was used to predict the river flow, and the HSI model was used for the habitat simulation. Validation of the River2D model was conducted with the water releases, and the predicted water surface elevations were compared with the measured data, showing good agreement. For the target species, the method of Gosse [33] was used to construct HSCs. Three habitat variables—flow depth, velocity, and substrate were used in the physical habitat simulations.
Using the BBA, the scenarios for the modifying dam operations were presented in the study reach. Scenarios 1, 2, and 3 were proposed by using the magnitude–duration concept, base flow allocation concept, and seasonally adjusted minimum flow allocation concept, respectively. The total volume of the three scenarios was close to the volume released from the upstream dam. The CSI for the target species in the study area was predicted for water releases from the dam, scenario 1, scenario 2, and scenario 3 by the HSI model. The results indicate that the three scenarios significantly increased the CSIs in comparison to the CSI distribution for the water releases from the dam. Additionally, the changes in the WUA over time for the target species were investigated. Quantitatively, on average, scenarios 1, 2, and 3 increased the WUA by about 11.40% and 17.25% for the Zacco platypus and Baetis fuscatus, respectively. This indicates that the natural flow pattern has significant effects on the downstream habitat.
Finally, the bed elevation change with the restoration of flood events was presented. In general, the bed change was higher in the vicinity of the bend from downstream reaches. The change in the WUA for the target species with the morphology change effect was also given. It was found that the morphology change effect increased the WUA significantly in the study reach. On average, the morphology change increases the WUA by 13.38% for the target species. It is noteworthy that the impact of the flood events on the habitat suitability changes depending on the morphology. This indicates that modifying the dam operation through the restoration of natural flow patterns is more advantageous for aquatic species. In addition, for a general strategy, the present study proposed scenarios for modifying dam operations using the BBA, which can be used for physical habitat simulation more confidentially with data from a natural flow regime.
Author Contributions
All of the authors contributed extensively to the work. H.K. designed and initiated the idea of this article and analyzed the simulated results. B.C. analyzed the data, performed physical habitat simulation, and wrote the manuscript.
Funding
This paper is a part of KEI research report (Report Name: “Research on Dam Operation Considering Downstream Flow Dynamics”) funded from Korea Water Resources Corporation. We would also like to acknowledge the financial support by the National Research Foundation of Korea (NRF-2017R1A6A3A03005338).
Acknowledgments
The authors appreciate the suggestions and enthusiastic support of editors and reviewers.
Conflicts of Interest
The authors declare no conflicts of interest.
References
- McCully, P. Silenced Rivers: The Ecology and Politics of Large Dams; Zed Books: London, UK, 1996. [Google Scholar]
- Rosenberg, D.M.; McCully, P.; Pringle, C.M. Global-scale environmental effects of hydrological alterations: Introduction. BioScience 2000, 50, 746–751. [Google Scholar] [CrossRef]
- WCD (World Commission on Dams). Dams and Development: A New Framework for Decision-Making; Earthscan: London, UK, 2000. [Google Scholar]
- Tiemann, J.S.; Gillette, D.P.; Wildhaber, M.L.; Edds, D.R. Effects of lowhead dams on riffle-dwelling fishes and macroinvertebrates in a midwestern river. Trans. Am. Fish. Soc. 2004, 133, 705–717. [Google Scholar] [CrossRef]
- Pringle, C. What is hydrologic connectivity and why is it ecologically important? Hydrol. Process. 2003, 17, 2685–2689. [Google Scholar] [CrossRef]
- Yi, Y.; Wang, Z.; Yang, Z. Two-dimensional habitat modeling of Chinese sturgeon spawning sites. Ecol. Model. 2010, 221, 864–875. [Google Scholar] [CrossRef]
- Willis, C.M.; Griggs, G.B. Reductions in fluvial sediment discharge by coastal dams in California and implications for beach sustainability. J. Geol. 2003, 111, 167–182. [Google Scholar] [CrossRef]
- Postel, S.; Richter, B.D. Rivers for Life: Managing Water for People and Nature; Island Press: Washington, DC, USA, 2003. [Google Scholar]
- Céréghino, R.; Legalle, M.; Lavandier, P. Drift and benthic population structure of the mayfly Rhithrogena semicolorata (Heptageniidae) under natural and hydropeaking conditions. Hydrobiologia 2004, 519, 127–133. [Google Scholar] [CrossRef]
- Molinos, J.G.; Donohue, I. Interactions among temporal patterns determine the effects of multiple stressors. Ecol. Appl. 2010, 20, 1794–1800. [Google Scholar] [CrossRef] [PubMed] [Green Version]
- Molinos, J.G.; Donohue, I. Temporal variability within disturbance events regulates their effects on natural communities. Oecologia 2011, 166, 795–806. [Google Scholar] [CrossRef] [PubMed]
- Frissell, C.A.; Liss, W.J.; Warren, C.E.; Hurley, M.D. A hierarchical framework for stream habitat classification: Viewing streams in a watershed context. Environ. Manag. 1986, 10, 199–214. [Google Scholar] [CrossRef]
- Im, D.; Kang, H.; Kim, K.H.; Choi, S.-U. Changes of river morphology and physical fish habitat following weir removal. Ecol. Eng. 2011, 37, 883–892. [Google Scholar] [CrossRef]
- Maddock, I. The importance of physical habitat assessment for evaluating river health. Freshw. Biol. 1999, 41, 373–391. [Google Scholar] [CrossRef]
- Mouton, A.M.; De Baets, B.; Goethals, P.L. Knowledge-based versus data-driven fuzzy habitat suitability models for river management. Environ. Model. Softw. 2009, 24, 982–993. [Google Scholar] [CrossRef]
- Valentin, S.; Lauters, F.; Sabaton, C.; Breil, P.; Souchon, Y. Modelling temporal variations of physical habitat for brown trout (Salmo trutta) in hydropeaking conditions. Regul. Rivers 1996, 12, 317–330. [Google Scholar] [CrossRef]
- Choi, S.-U.; Kim, S.K.; Choi, B.; Kim, Y. Impact of hydropeaking on downstream fish habitat at the Goesan Dam in Korea. Ecohydrology 2017, 10, e1861. [Google Scholar] [CrossRef]
- Choi, B.; Choi, S.-U. Impact of hydropeaking and thermopeaking on the downstream habitat in the Dal River, Korea. Ecol. Inform. 2018, 43, 1–11. [Google Scholar] [CrossRef]
- Pinho, P.; Maia, R.; Monterroso, A. The quality of Portuguese Environmental Impact Studies: The case of small hydropower projects. Environ. Impact Assess. Rev. 2007, 27, 189–205. [Google Scholar] [CrossRef]
- Pisaturo, G.R.; Righetti, M.; Dumbser, M.; Noack, M.; Schneider, M.; Cavedon, V. The role of 3D-hydraulics in habitat modelling of hydropeaking events. Sci. Total Environ. 2017, 575, 219–230. [Google Scholar] [CrossRef] [PubMed]
- Premstaller, G.; Cavedon, V.; Pisaturo, G.R.; Schweizer, S.; Adami, V.; Righetti, M. Hydropeaking mitigation project on a multi-purpose hydro-scheme on Valsura River in South Tyrol/Italy. Sci. Total Environ. 2017, 574, 642–653. [Google Scholar] [CrossRef] [PubMed]
- Poff, N.L.; Allan, J.D.; Bain, M.B.; Karr, J.R.; Prestegaard, K.L.; Richter, B.D.; Sparks, R.E.; Stromberg, J.C. The natural flow regime: A paradigm for river conservation and restoration. BioScience 1997, 47, 769–784. [Google Scholar] [CrossRef]
- Zhang, B.; Kula, A.; Mack, K.M.; Zhai, L.; Ryce, A.L.; Ni, W.M.; Van Dyken, J.D. Carrying capacity in a heterogeneous environment with habitat connectivity. Ecol. Lett. 2017, 20, 1118–1128. [Google Scholar] [CrossRef] [PubMed]
- Bunn, S.E.; Arthington, A.H. Basic principles and ecological consequences of altered flow regimes for aquatic biodiversity. Environ. Manag. 2002, 30, 492–507. [Google Scholar] [CrossRef]
- Richter, B.D.; Matthews, R.; Harrison, D.L.; Wigington, R. Ecologically sustainable water management: Managing river flows for river integrity. Ecol. Appl. 2003, 13, 206–224. [Google Scholar] [CrossRef]
- Richter, B.D.; Warner, A.T.; Meyer, J.L.; Lutz, K. A collaborative and adaptive process for developing environmental flow recommendations. River Res. Appl. 2006, 22, 297–318. [Google Scholar] [CrossRef]
- Baldwin, D.S.; Colloff, M.J.; Mitrovic, S.M.; Bond, N.R.; Wolfenden, B. Restoring dissolved organic carbon subsidies from floodplains to lowland river food webs: A role for environmental flows? Mar. Freshw. Res. 2016, 67, 1387–1399. [Google Scholar] [CrossRef]
- Zadereev, E.S.; Gulati, R.D.; Camacho, A. Biological and Ecological Features, Trophic Structure and Energy Flow in Meromictic Lakes. In Ecology of Meromictic Lakes; Springer International Publishing: Cham, Switzerland, 2017; pp. 61–86. [Google Scholar]
- King, A.J.; Ward, K.A.; O’connor, P.; Green, D.; Tonkin, Z.; Mahoney, J. Adaptive management of an environmental watering event to enhance native fish spawning and recruitment. Freshw. Biol. 2010, 55, 17–31. [Google Scholar] [CrossRef]
- King, J.M.; Tharme, R.E. Assessment of the Instream Flow Incremental Methodology and Initial Development of Alternative Instream Flow Methodologies for South Africa; 295/1/94; Water Research Commission: Pretoria, South Africa, 1994. [Google Scholar]
- Steffler, P.; Blackburn, J. River 2D-Two-Dimensional Depth Averaged Model of River Hydrodynamics and Fish Habitat Introduction to Depth Averaged Modeling and User’s; University of Alberta: Edmonton, AB, Canada, 2002. [Google Scholar]
- Thomasma, L.E.; Drummer, T.D.; Peterson, R.O. Testing the habitat suitability index model for the fisher. Wildl. Soc. Bull. 1991, 19, 291–297. [Google Scholar]
- Gosse, J.C. Microhabitat of Rainbow and Cutthroat Trout in the Green River below Flaming Gorge Dam; Final Report, Contract 81-5049; Utah Division of Wildlife Resources Ministry of Science and Technology: Salt Lake City, UT, USA, 1982; p. 114. [Google Scholar]
- Ministry of Land, Transport and Maritime Affairs. Development of Techniques for Creation of Wildlife Habitat Environment; Ministry of Land, Transport and Maritime Affairs: Seoul, Korea, 2011. (In Korean)
- Ministry of Science and Technology. Technology for Surface Water Resources Investigation; Ministry of Science and Technology: Seoul, Korea, 2007. (In Korean) [Google Scholar]
- Furukawa-Tanaka, T. The ecology of salmonid fishes in Japanese mountain streams I: Food condition and feeding habit of Japanese charr, Salvelinus leucomaenis (Pallas). Jpn. J. Ecol. 1985, 35, 481–504. [Google Scholar]
- Katano, O. Social structure of the dark chub, Zacco temmincki, in a small pond in relation to individual differences. Physiol. Ecol. Jpn. 1987, 24, 1–132. [Google Scholar]
- Katano, O. Foraging tactics and home range of dark chub in a Japanese river. Oecologia 1996, 106, 199–205. [Google Scholar] [CrossRef] [PubMed]
- Lillie, R.A.; Budd, J. Habititat architecture of Myriophyllum spicatum L. as an index to habitat quality for fish and macroinvertebrates. J. Freshw. Ecol. 1992, 7, 113–125. [Google Scholar]
- Ponsard, S.; Arditi, R.; Jost, C. Assessing top-down and bottom-up control in a litter-based soil macroinvertebrate food chain. Oikos 2000, 89, 524–540. [Google Scholar] [CrossRef]
- Molina, C.I.; Gibon, F.M.; Duprey, J.L.; Dominguez, E.; Guimarães, J.R.D.; Roulet, M. Transfer of mercury and methylmercury along macroinvertebrate food chains in a floodplain lake of the Beni River, Bolivian Amazonia. Sci. Total Environ. 2010, 408, 3382–3391. [Google Scholar] [CrossRef] [PubMed]
- Jones, L.; Stevens, C.; Rowe, E.C.; Payne, R.; Caporn, S.J.; Evans, C.D.; Field, S.; Dale, S. Can on-site management mitigate nitrogen deposition impacts in non-wooded habitats? Biol. Conserv. 2017, 212, 464–475. [Google Scholar] [CrossRef]
- Choi, J.-K.; Kim, J.-S.; Lee, H.G. An Ecological Comparison of Benthic Macroinvertebrate Community in Downstream Region of Large Dams. Korean J. Environ. Ecol. 2013, 27, 52–63. (In Korean) [Google Scholar]
- Meyer-Peter, E.; Müller, R. Formulas for Bed-Load Transport. In Proceedings of the II Meeting of IAH, Stockolm, Sweden, 7 June 1948. [Google Scholar]
- U.S. Fish and Wildlife Service. Standards for the Development of Habitat Suitability Index Models; 103 ESM; Division of Ecological Services, U.S. Fish and Wildlife Service, Department of the Interior: Washington, DC, USA, 1981.
- Gibbins, C.N.; Acornley, R.M. Salmonid habitat modelling studies and their contribution to the development of an ecologically acceptable release policy for Kielder Reservoir, North-east England. River Res. Appl. 2000, 16, 203–224. [Google Scholar] [CrossRef]
- Garcia, A.; Jorde, K.; Habit, E.; Caamano, D.; Parra, O. Downstream environmental effects of dam operations: Changes in habitat quality for native fish species. River Res. Appl. 2011, 27, 212–327. [Google Scholar] [CrossRef]
- Tharme, R.E.; King, J.M. Development of the Building Block Methodology for Instream Flow Assessments, and Supporting Research on the Effects of Different Magnitude Flows on Riverine Ecosystems; Water Research Commission: Pretoria, South Africa, 1998. [Google Scholar]
- King, J.; Louw, D. Instream flow assessments for regulated rivers in South Africa using the Building Block Methodology. Aquat. Ecosyst. Health Manag. 1998, 1, 109–124. [Google Scholar] [CrossRef]
- Cowx, I.G.; O’Grady, K.T.; Parasiewicz, P.; Schmutz, S.; Moog, O. The effect of managed hydropower peaking on the physical habitat, benthos and fish fauna in the river Bregenzerach in Austria. Fish. Manag. Ecol. 1998, 5, 403–417. [Google Scholar]
- Korman, J.; Campana, S.E. Effects of hydropeaking on nearshore habitat use and growth of age-0 rainbow trout in a large regulated river. Trans. Am. Fish. Soc. 2009, 138, 76–87. [Google Scholar] [CrossRef]
- Li, R.; Chen, Q.; Ye, F. Modelling the impacts of reservoir operations on the downstream riparian vegetation and fish habitats in the Lijiang River. J. Hydroinform. 2011, 13, 229–244. [Google Scholar] [CrossRef]
- Tuhtan, J.A.; Noack, M.; Wieprecht, S. Estimating stranding risk due to hydropeaking for juvenile European grayling considering river morphology. KSCE J. Civ. Eng. 2012, 16, 197–206. [Google Scholar] [CrossRef]
- Boavida, I.; Santos, J.M.; Ferreira, T.; Pinheiro, A. Barbel habitat alterations due to hydropeaking. J. Hydroenviron. Res. 2015, 9, 237–247. [Google Scholar] [CrossRef]
- Almeida, G.A.M.; Rodriguez, J.F. Integrating Sediment Dynamics into Physical Habitat Model. In Proceedings of the 18th World IMACS/MODSIM Congress, Cairns, Australia, 13–17 July 2009. [Google Scholar]
- Moir, H.J.; Gibbins, C.N.; Soulsby, C.; Youngson, A.F. PHABSIM modelling of Atlantic salmon spawning habitat in an upland stream: Testing the influence of habitat suitability indices on model output. River Res. Appl. 2005, 21, 1021–1034. [Google Scholar] [CrossRef]
- He, Z.; Wu, W.; Douglas Shields, F. Numerical analysis of effects of large wood structures on channel morphology and fish habitat suitability in a Southern US sandy creek. Ecohydrology 2009, 2, 370–380. [Google Scholar] [CrossRef]
- Macura, V.; Škrinár, A.; Kaluz, K.; Jalčovíková, M.; Škrovinová, M. Influence of the morphological and hydraulic characteristics of mountain streams on fish habitat suitability curves. River Res. Appl. 2012, 28, 1161–1178. [Google Scholar] [CrossRef]
- Radinger, J.; Essl, F.; Hölker, F.; Horký, P.; Slavík, O.; Wolter, C. The future distribution of river fish: The complex interplay of climate and land use changes, species dispersal and movement barriers. Glob. Chang. Biol. 2017, 23, 4970–4986. [Google Scholar] [CrossRef] [PubMed]
Figure 1.
The study area.

Figure 2.
The target Fish and benthic macroinvertebrate: (a) Zacco platypus and (b) Baetis fuscatus.
Figure 2.
The target Fish and benthic macroinvertebrate: (a) Zacco platypus and (b) Baetis fuscatus.

Figure 3.
The validation of the flow modelling.

Figure 4.
The habitat suitability curves for the target species: (a) Zacco platypus and (b) Baetis fuscatus.
Figure 4.
The habitat suitability curves for the target species: (a) Zacco platypus and (b) Baetis fuscatus.

Figure 5.
The natural flow regime and dam discharge.

Figure 6.
The composite suitability index (CSI) distributions for the target species: (a) Zacco platypus and (b) Baetis fuscatus.
Figure 6.
The composite suitability index (CSI) distributions for the target species: (a) Zacco platypus and (b) Baetis fuscatus.

Figure 7.
The change of weighted usable area (WUA) with time: (a) Zacco platypus and (b) Baetis fuscatus.
Figure 7.
The change of weighted usable area (WUA) with time: (a) Zacco platypus and (b) Baetis fuscatus.

Figure 8.
The scenarios using the building block approach (BBA): (a) scenario 1, (b) scenario 2, and (c) scenario 3.
Figure 8.
The scenarios using the building block approach (BBA): (a) scenario 1, (b) scenario 2, and (c) scenario 3.

Figure 9.
The distributions of the CSI for the target species: (a) Zacco platypus and (b) Baetis fuscatus.
Figure 9.
The distributions of the CSI for the target species: (a) Zacco platypus and (b) Baetis fuscatus.


Figure 10.
The change of WUA with time: (a) Zacco platypus and (b) Baetis fuscatus.


Figure 11.
The bed elevation change (a) after first flood, (b) after the third flood, and (c) after the fifth flood.
Figure 11.
The bed elevation change (a) after first flood, (b) after the third flood, and (c) after the fifth flood.

Figure 12.
The change of WUA for the target species (with and without morphology change).

© 2018 by the authors. Licensee MDPI, Basel, Switzerland. This article is an open access article distributed under the terms and conditions of the Creative Commons Attribution (CC BY) license (http://creativecommons.org/licenses/by/4.0/).
Share and Cite
MDPI and ACS Style
Kang, H.; Choi, B. Dominant Fish and Macroinvertebrate Response to Flow Changes of the Geum River in Korea. Water 2018, 10, 942. https://doi.org/10.3390/w10070942
AMA Style
Kang H, Choi B. Dominant Fish and Macroinvertebrate Response to Flow Changes of the Geum River in Korea. Water. 2018; 10(7):942. https://doi.org/10.3390/w10070942
Chicago/Turabian StyleKang, Hyeongsik, and Byungwoong Choi. 2018. "Dominant Fish and Macroinvertebrate Response to Flow Changes of the Geum River in Korea" Water 10, no. 7: 942. https://doi.org/10.3390/w10070942
Note that from the first issue of 2016, this journal uses article numbers instead of page numbers. See further details here.