Forces Driving the Morphological Evolution of a Mud-Capped Dredge Pit, Northern Gulf of Mexico


1
Department of Oceanography and Coastal Sciences, Louisiana State University, Baton Rouge, LA 70803, USA
2
University of Maryland Center for Environmental Science, Horn Point Laboratory, Cambridge, MD 21613, USA
3
Coastal Studies Institute, Louisiana State University, Baton Rouge, LA 70803, USA
4
Naval Research Laboratory, 1005 Balch Boulevard, Stennis Space Center, Mississippi, MS 39529, USA
*
Author to whom correspondence should be addressed.
Water 2018, 10(8), 1001; https://doi.org/10.3390/w10081001
Submission received: 6 June 2018
/
Revised: 20 July 2018
/
Accepted: 25 July 2018
/
Published: 28 July 2018
(This article belongs to the Special Issue Recent Progress in Research on River Deltas)
Abstract
:Sandy sediments preserved as paleo-channel fill on the inner shelf, some of which are overlain by modern muds, have been mined for barrier island restoration along the northern Gulf of Mexico. These mined areas have been termed “mud-capped” dredge pits. The processes governing the morphological evolution of the pits are poorly constrained due to limited observational data. Physical oceanographic (e.g., currents and waves) and sedimentary data were collected at Sandy Point dredge pit offshore Plaquemines Parish, Louisiana in summer 2015. Currents outside the pit flowed southward and/or southeastward at speeds of 8–20 cm/s, while currents inside the pit had speeds less than 2 cm/s with no clear dominant direction. Wave heights detected inside the pit were less than 0.4 m. A high turbidity layer with suspended sediment concentration around 4 g/L was observed above the pit floor, and its thickness was ~0.5 m. With observational data as input, three 2–D numerical models were employed to predict pit morphological responses, including pit infilling, margin erosion and slope change. The model results suggest that resuspension events were rare on the seafloor adjacent to the pit under summer fair weather conditions. Modeled pit margin erosion was very limited. With little resuspension of seafloor sediment locally, weak margin erosion and stable pit walls, the dominant process governing pit evolution was infilling sourced by the deposition of suspended sediments from the Mississippi River plume.
1. Introduction
Due to eustatic sea level rise, local subsidence, and dam construction, coastal lands are diminishing worldwide [1]. In order to restore coastal lands, beaches and barriers, dedicated dredging and river diversions are employed [2,3]. Offshore sand mining provides sand resources to implement coastal restoration projects. Sand has been deposited in paleo-river channels along the Gulf of Mexico inner shelf and is sometimes overlain by a several-meter-thick shelf mud layer. Compared with other methods, the use of offshore sand from paleo-channels to nourish beaches and barriers has greater benefits to the coastal system by supplementing a deficit in the coastal sand budget with ‘out-of-system’ sediment. Despite its high efficiency, it is important to understand its potential effects to local marine ecology and fisheries, borrow area indirect impacts, and risks associated with offshore infrastructure [4,5,6,7,8]. Post-dredging observational data are crucial to address these concerns and whether those borrow areas could be re-dredged in the future. The morphological evolution for dredge pits or trenches in sandy environments has been relatively well studied [9,10,11,12]. However, morphological dynamic processes at excavation sites in muddy environments are much more complicated than their sandy counterparts, due to the overlying cohesive sediment layer. There is a lack of observation and modeling studies on morphological evolution post dredging, particularly for pits in such mixed environments (i.e., sand covered by mud) [13].
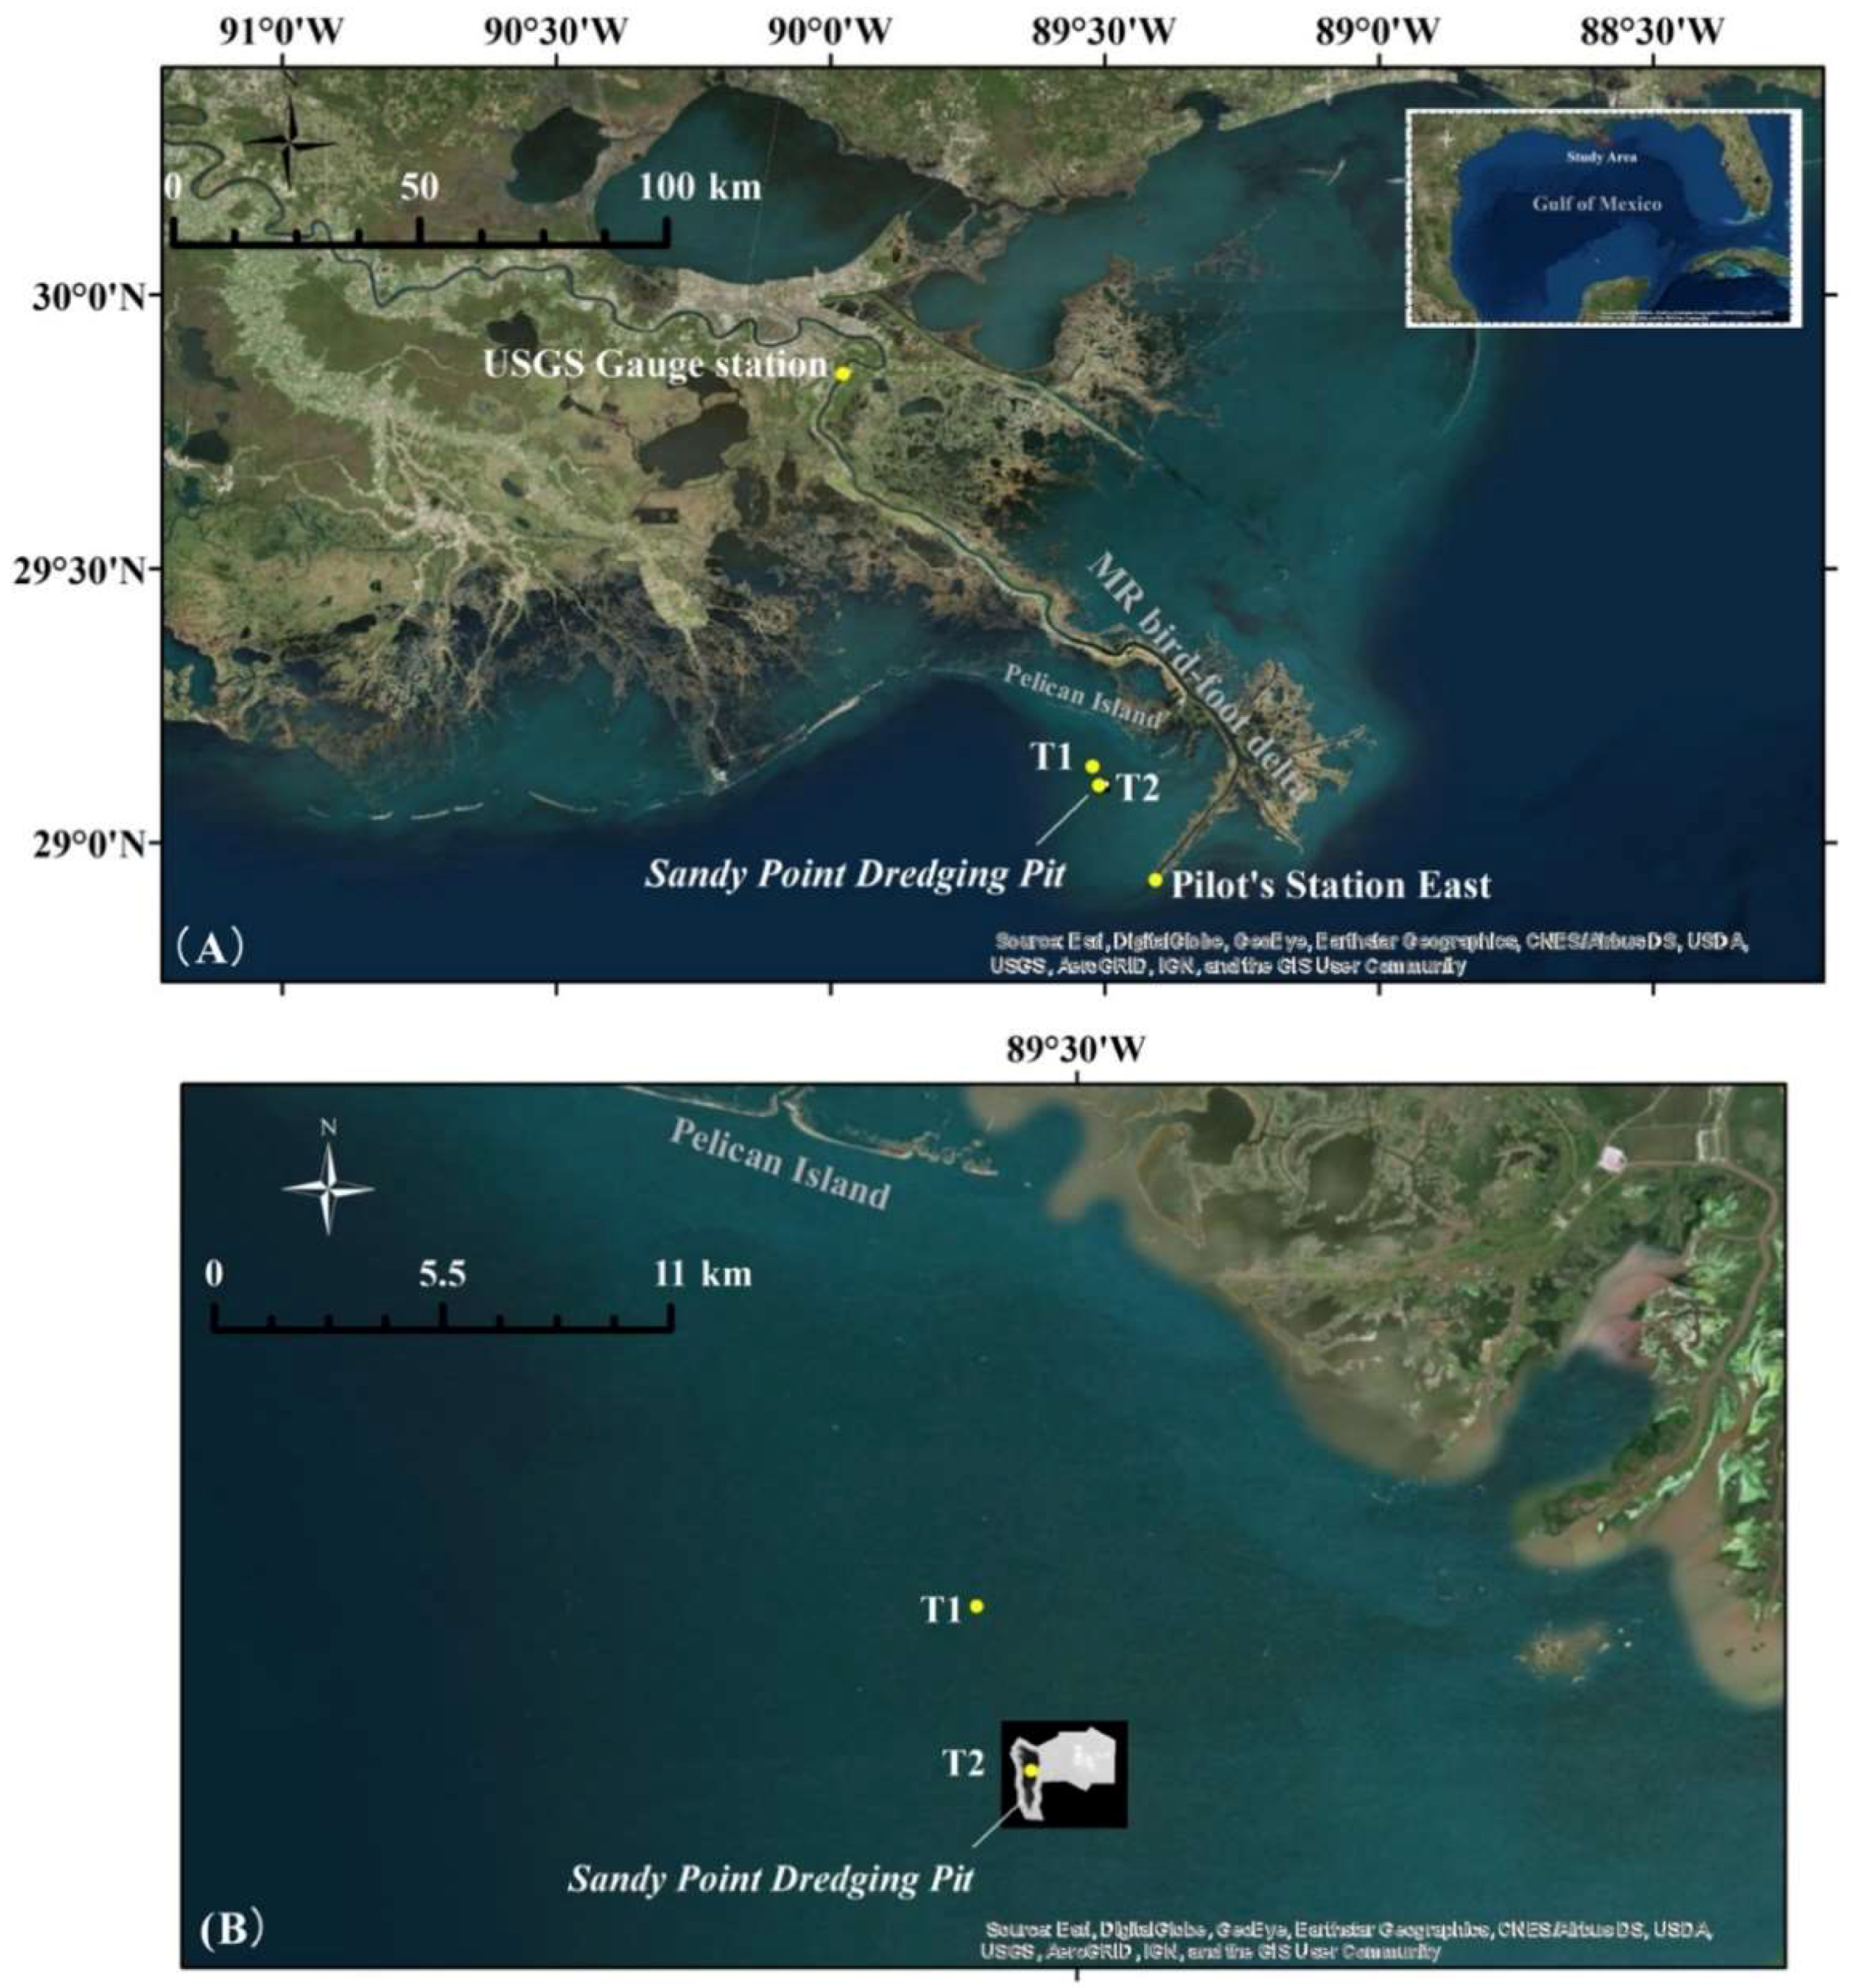
In order to constrain the driving forces and predict the morphological evolution of pits in a muddy environment, a mud-capped dredge pit at Sandy Point, located 20 km west of the Mississippi bird-foot delta, was selected as our study site. Sandy Point pit was excavated in 2012 for barrier island restoration at Pelican Island, Louisiana. Approximately 0.9 million m3 of muddy overburden was removed to access ~2.7 million m3 of sand that was dredged and transported 20 km northward to the island fill site (Figure 1) [14].
In the muddy environment close to Mississippi bird-foot delta, there are three possible sediment sources that may contribute to pit infilling, which are resuspension and subsequent advection outside of the pit, river plume, and pit wall collapse, but it is unclear which source plays a dominant role. Local physical oceanographic conditions are the driving forces for pit infilling and morphological change.
Although prediction has been made on the infilling of Sandy Point pit and its morphological change by Nairn, Lu and Langendyk [13] before the excavation, there have been no direct measurements of suspended sediment concentration and circulation patterns around the pit. The objectives of this study are: (1) To identify the dominant sediment source filling the pit; (2) to quantify the contribution of resuspension to pit infilling from a nearby sea bed in a mixed sediment environment; (3) to evaluate pit wall stability after dredging, and (4) to predict both pit infilling and morphological change. To achieve these objectives, we conducted in situ measurements, analysis, and numerical modeling.
2. Methods
2.1. Data Collection
In summer 2015, two tripods were deployed at stations T1 and T2, outside and inside of the Sandy Point pit, respectively (Figure 1 and Table 1). Water depth at T1 is 9.4 m and is 20.0 m at T2. Distance between T1 and T2 is 4.15 km. Three sensors, including OBS (Optical Backscatter Sensor) 3A made by Campbell Scientific, ADV (Acoustic Doppler Velocimeter) Ocean from SonTek, and one pressure sensor-wave gauge made by Ocean Sensor Systems Inc., were deployed at station T1. An OBS, a wave gauge, and an upward looking ADCP (acoustic Doppler current profiler) from Teledyne RD Instruments were mounted on the tripod at station T2. Unfortunately, no data were recorded by OBS3A. Table 1 lists all sensors and their sampling parameters for the deployment. Vessel-based hydrodynamics survey using a downward looking Teledyne 1200 kHz ADCP were also done at Sandy Point on 20 May 2015 from 10:26 to 20:34 (local time, CDT), covering the dredged pit with repeated 23 and 15 transects in west-east and north-south directions, respectively. An Edgetech 4600 swath bathymetry and sidescan sonar system was used to collect data with a swath width about five times the water depth. An Edgetech 2000 DSS combined sidescan sonar and subbottom profiler system was used to collect CHIRP sonar seismic profiles at a frequency from 2–16 kHz and sidescan data using simultaneous frequencies at both 300 and 600 kHz. Details of geophysical methods can be found at Obelcz et al. [15].
The Mississippi River water discharge data were obtained from the U.S. Geological Survey (USGS) station at Belle Chasse, Louisiana (LA), which is 105 km upstream of the Head Passes of Mississippi bird-foot delta (Figure 1). Hourly wind data were downloaded from the National Oceanic and Atmospheric Administration (NOAA) Data Buoy Center, at East Pilot station, LA.
Laser grain size analysis was performed for surface sediments from both inside and outside the pit. Grain size parameters were calculated from a total of three replicate samples for each site. Organic matter was removed with 30% H2O2 for at least 5 h on a hot plate at 60 °C. Pretreated samples were analyzed on LS 13 320 Laser Diffraction Particle Size Analyzer (detecting range of 0.04–2000 μm). A total of three replicate sediment samples were conducted for each site using the loss-on-ignition (LOI) method. Samples were dried at 60 °C and ground to powder. A total of 1.00 gram of sample was weighed in a crucible and heated for 2 hours at 550 °C in a muffle furnace [16]. Four water samples were collected at sea surface from stations T1 and T2, when the tripods were deployed on 15 July 2015 and retrieved on 22 August 2015, respectively. These water samples were filtered with a 0.7–μm glass fiber filter to calculate the suspended sediment concentration (SSC).
2.2. Analysis Methods
The ADV current data were de-spiked before further analysis [17,18]. The toolbox developed by Karimpour and Chen [19] was used to process pressure data for the calculations of wave parameters, with correction of water depth effect. Wave-current combined shear stress near sea bed was calculated by the Turbulence Kinetic Energy method Equations (1)–(3) (Equation (1), u′2, v′2 and w′2 are the mean square of the velocity fluctuations); Equation (2), τ is the bed shear stress, and C = 0.2, which is a proportionality constant; Equation (3), ρ is the water density) [20,21]. OBS turbidity data were calibrated in a mixing chamber to calculate suspended sediment concentration (Figure A1). A Butterworth low-pass filter was applied to the upward looking ADCP data with a cut-off frequency of 0.6 cycle per day (equivalent to a 40–h). This filter was implemented with a convolution in time domain which was applied twice (forward and backward) to eliminate phase shift.
To better predict pit infilling and margin erosion (or collapse) processes at the study site, three models were applied to predict long term morphology evolution of the pit. (1) 1–D sediment transport model from Styles and Glenn [22]. The model computes bed shear stress using currents and waves, and critical shear stress from median grain size of sediments on sea bed, through which resuspended sediment concentration on sea bed was simulated. (2) Wave-induced sea bed failure model from Henkel [23], which estimates the pressure difference around the pit caused by waves, and evaluates its contribution to pit wall collapse. (3) Pit infilling model from Lu and Nairn [24], predicts pit infilling as well as evaluates margin erosion caused by currents.
3. Results
Surface sediments at station T1 outside of the pit were coarser, with ~26% more sand component than that at station T2 inside the pit (Table 2). Organic matter at T1 was lower than that at T2. SSC for sea surface water was higher at T1, and a slight decrease was captured when river discharge dropped from July to August 2015 (Table 2 and Figure 2A).
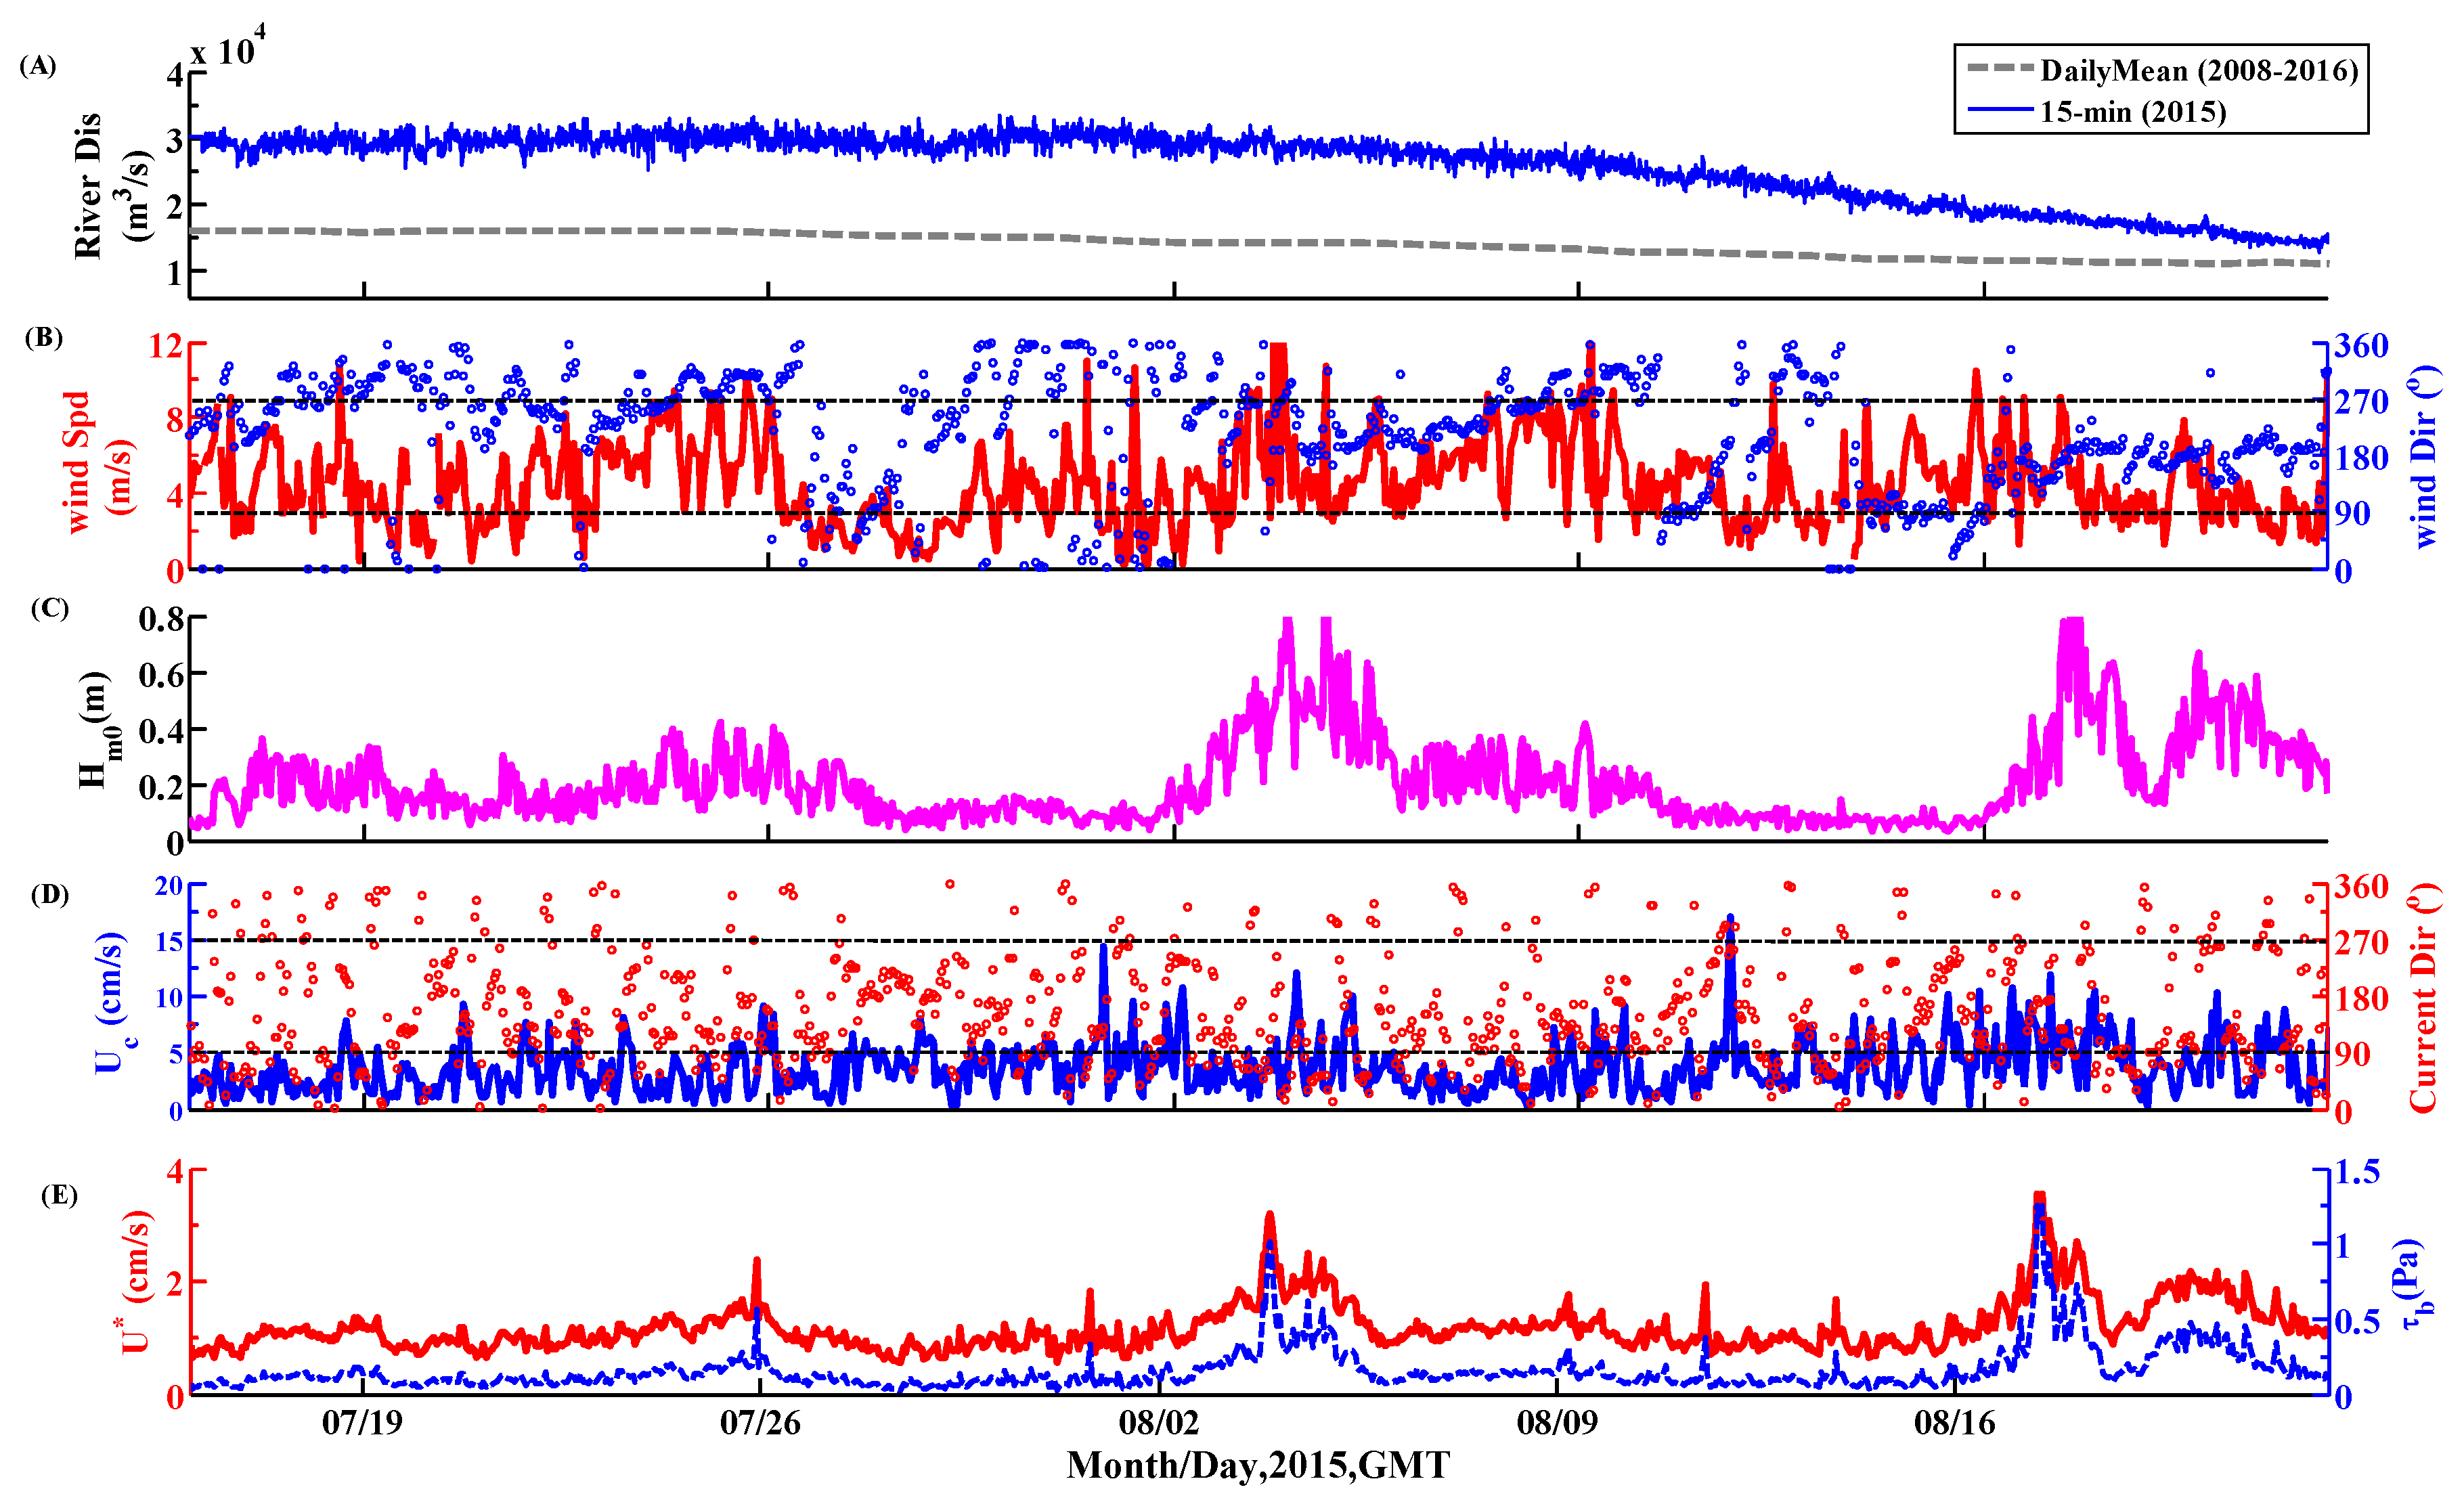
Mississippi River discharge was about two times greater than the 9–year daily mean from 15 July to 9 August 2015, and dropped slowly to the mean level after that period (Figure 2A). Wind speeds were greater than 3 m/s during most of the observation period, and wind directions varied from northwesterly to southwesterly (Figure 2B). Wave heights at T1 station occasionally reached 0.8 m, which were related to wind speed, fetch (related to wind direction), and duration. Southwesterly winds generally have the longest fetch at the study site, whereas northwesterly winds usually have a short fetch. Low-speed (1–16 cm/s) currents flowed to southwest or southeast during the observation period (Figure 2D). Near bed shear velocities caused by both waves and currents were around 1 cm/s, and went up to 3 cm/s when wave heights increased to 0.8 m on 5 August 2015 and 18 August 2015 (Figure 2E). The corresponding bed shear stresses were below 0.13 Pa, and increased to 1.25 Pa when wave heights reached 0.8 m.
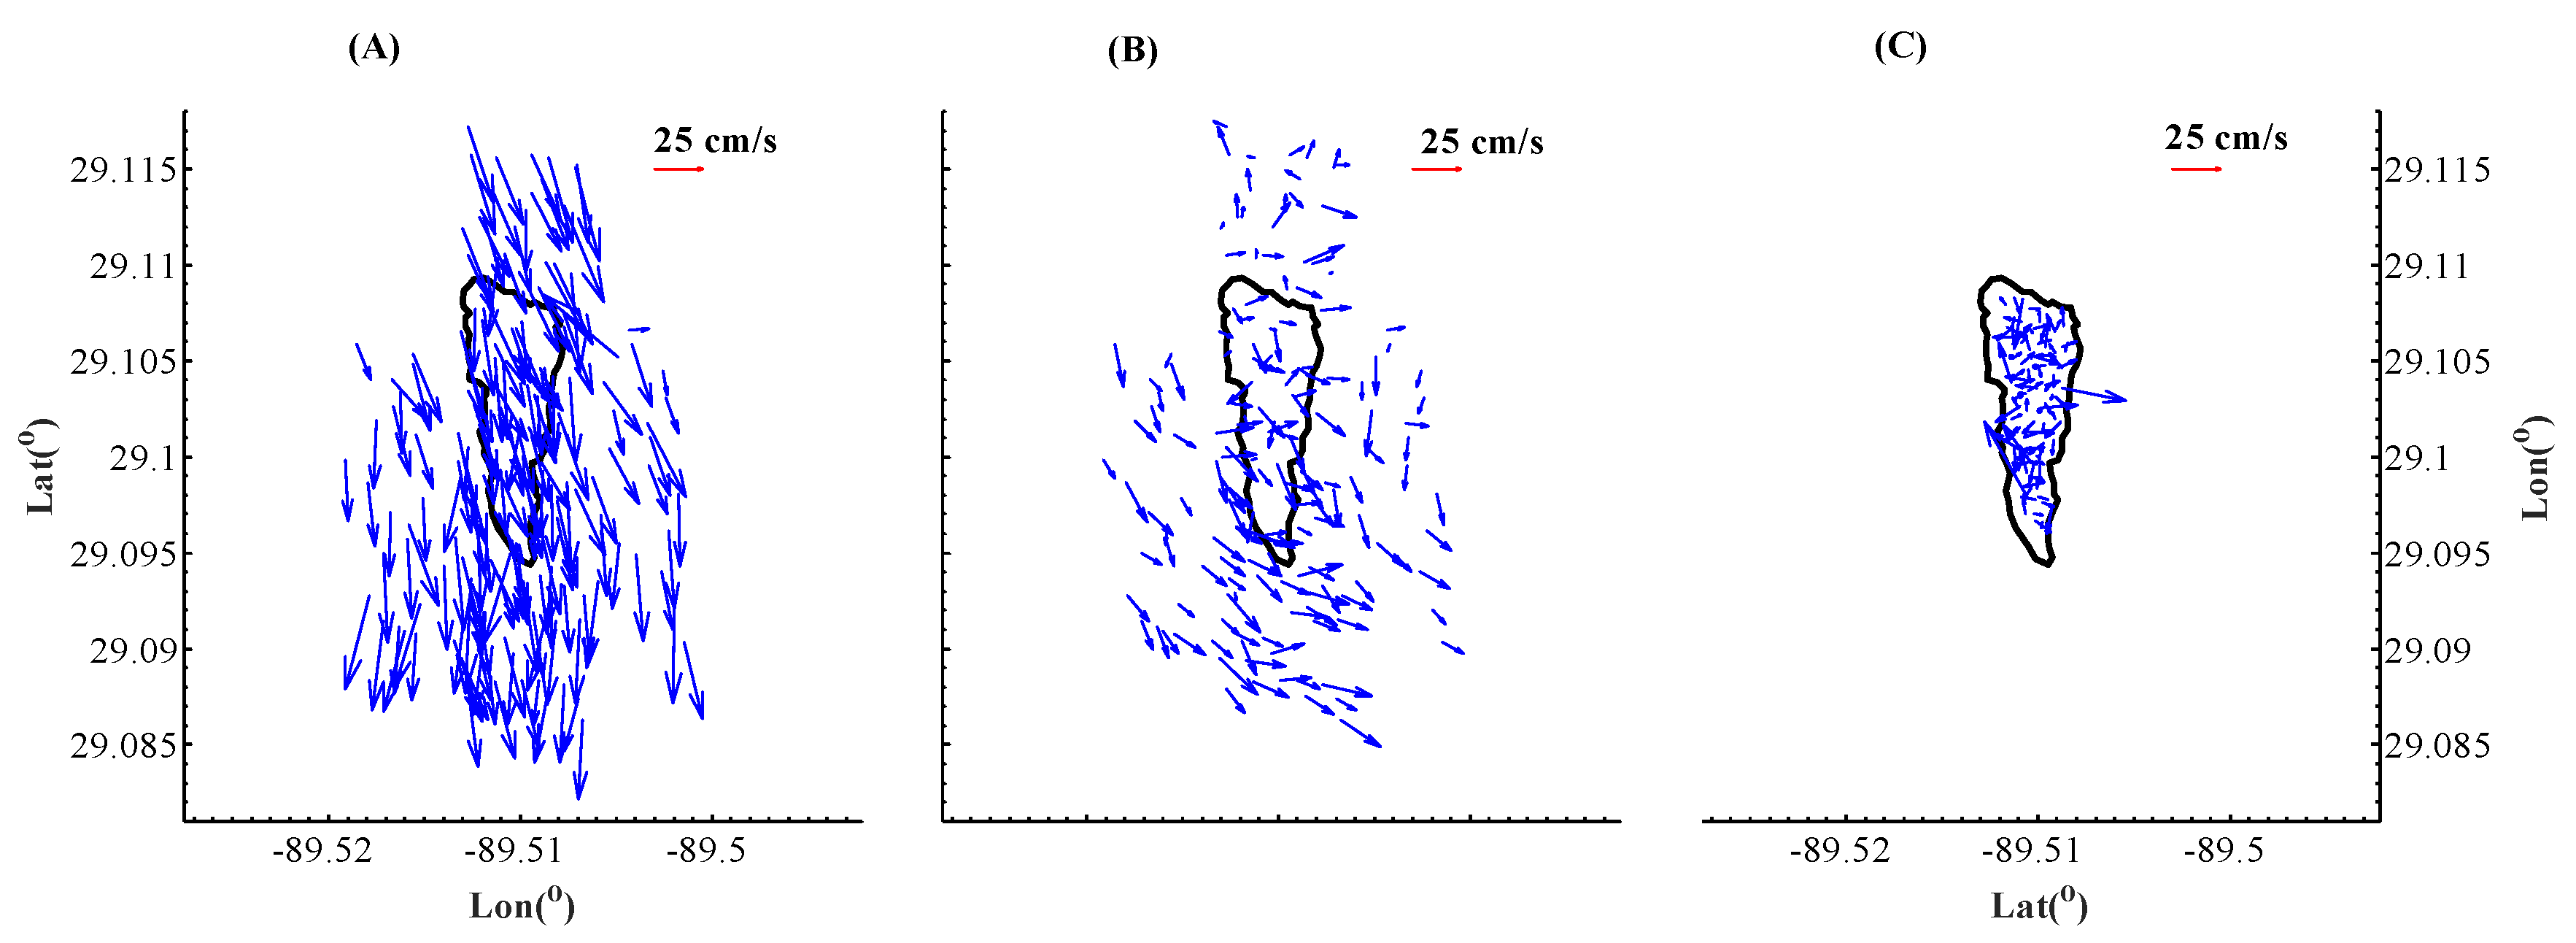
The spatial variations of currents were measured by the downward-looking ADCP 2 months before the tripod deployment. The surface currents were mainly southeastward and/or southward at Sandy Point dredge pit. These currents decreased with water depth. Figure 3A–C shows current velocities in a horizontally sliced view at 2.75 m, 7.75 m and 16.50 m below sea surface, respectively. It is obvious that current velocities at 2.75 m subsurface were fastest, and velocities at 7.75 m below the surface were slower but essentially shared the same direction with the overlying layer (Figure 3A,B). Currents at 16.50 m below sea surface, which is about 3.5 m above the pit bottom, were dramatically different from the overlying layers with the slowest speeds and random directions (Figure 3C).
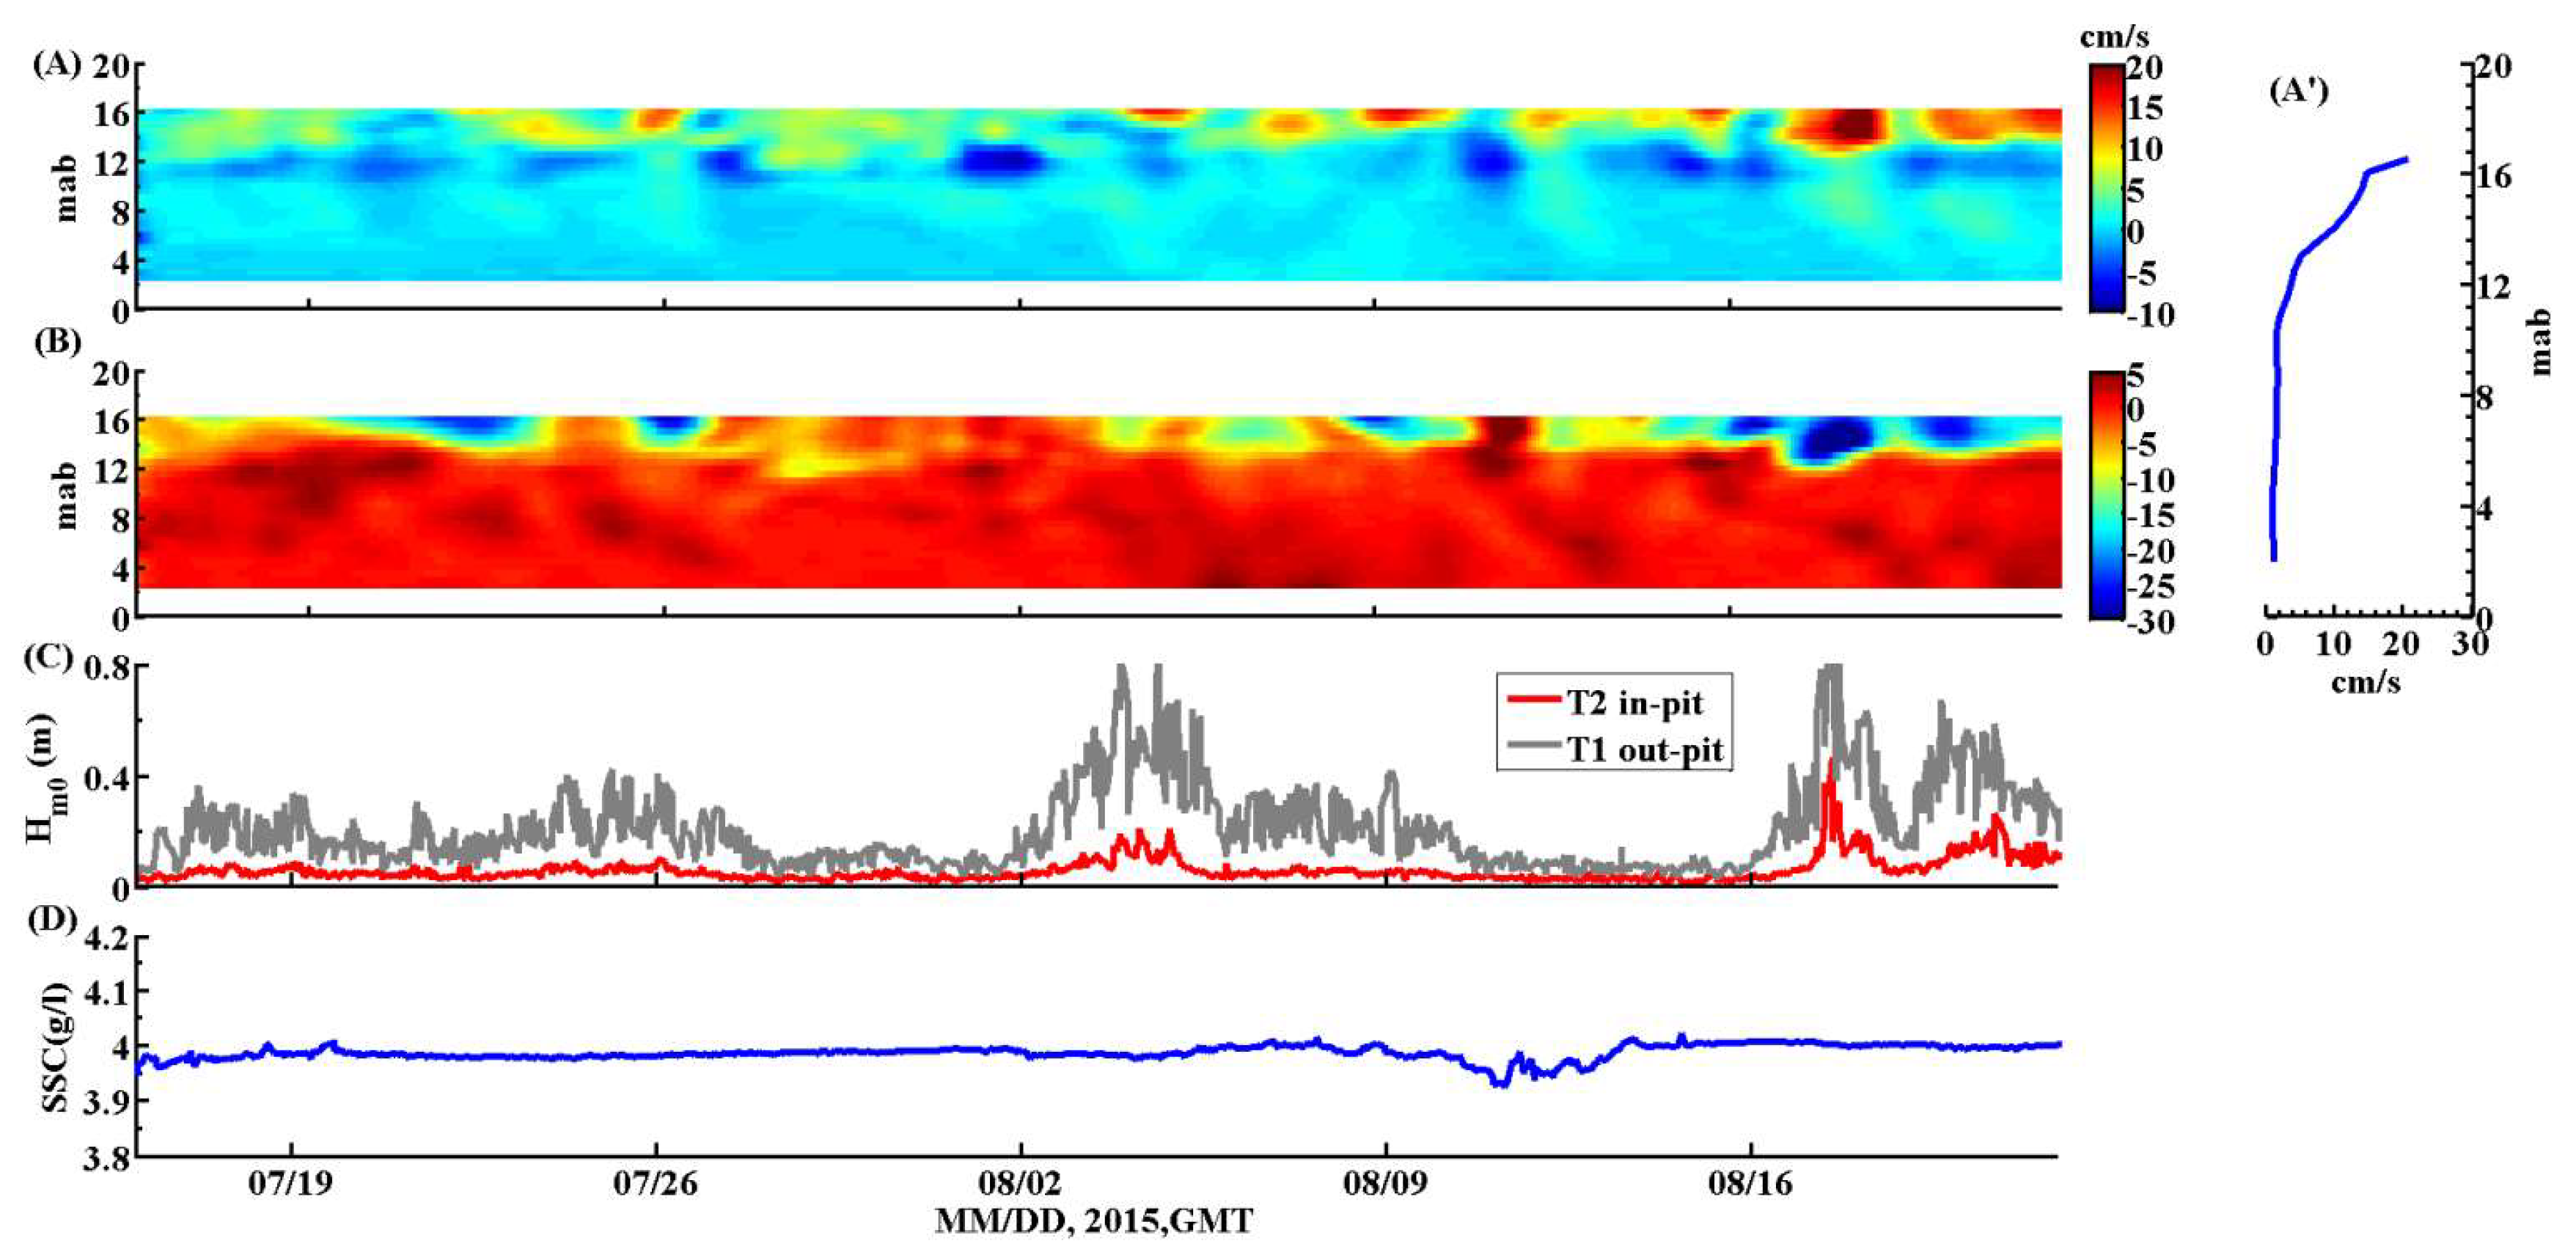
The temporal variations of currents were measured by the upward-looking ADCP deployed at station T2. Vertical current structure at pit site showed an obvious two layered structure with a strong upper layer and a stagnant bottom layer (Figure 4A,B,A’). Current speeds at the stagnant bottom layer were about 0–5 cm/s at 8–9 m below sea surface, with no dominant direction (Figure 4A,B). The current speeds overlying on the bottom layer (from sea surface to water depth of 9 m) were much greater, with speeds of 10–20 cm/s, and the dominant direction was southeastward and/or southward (Figure 4A,B).
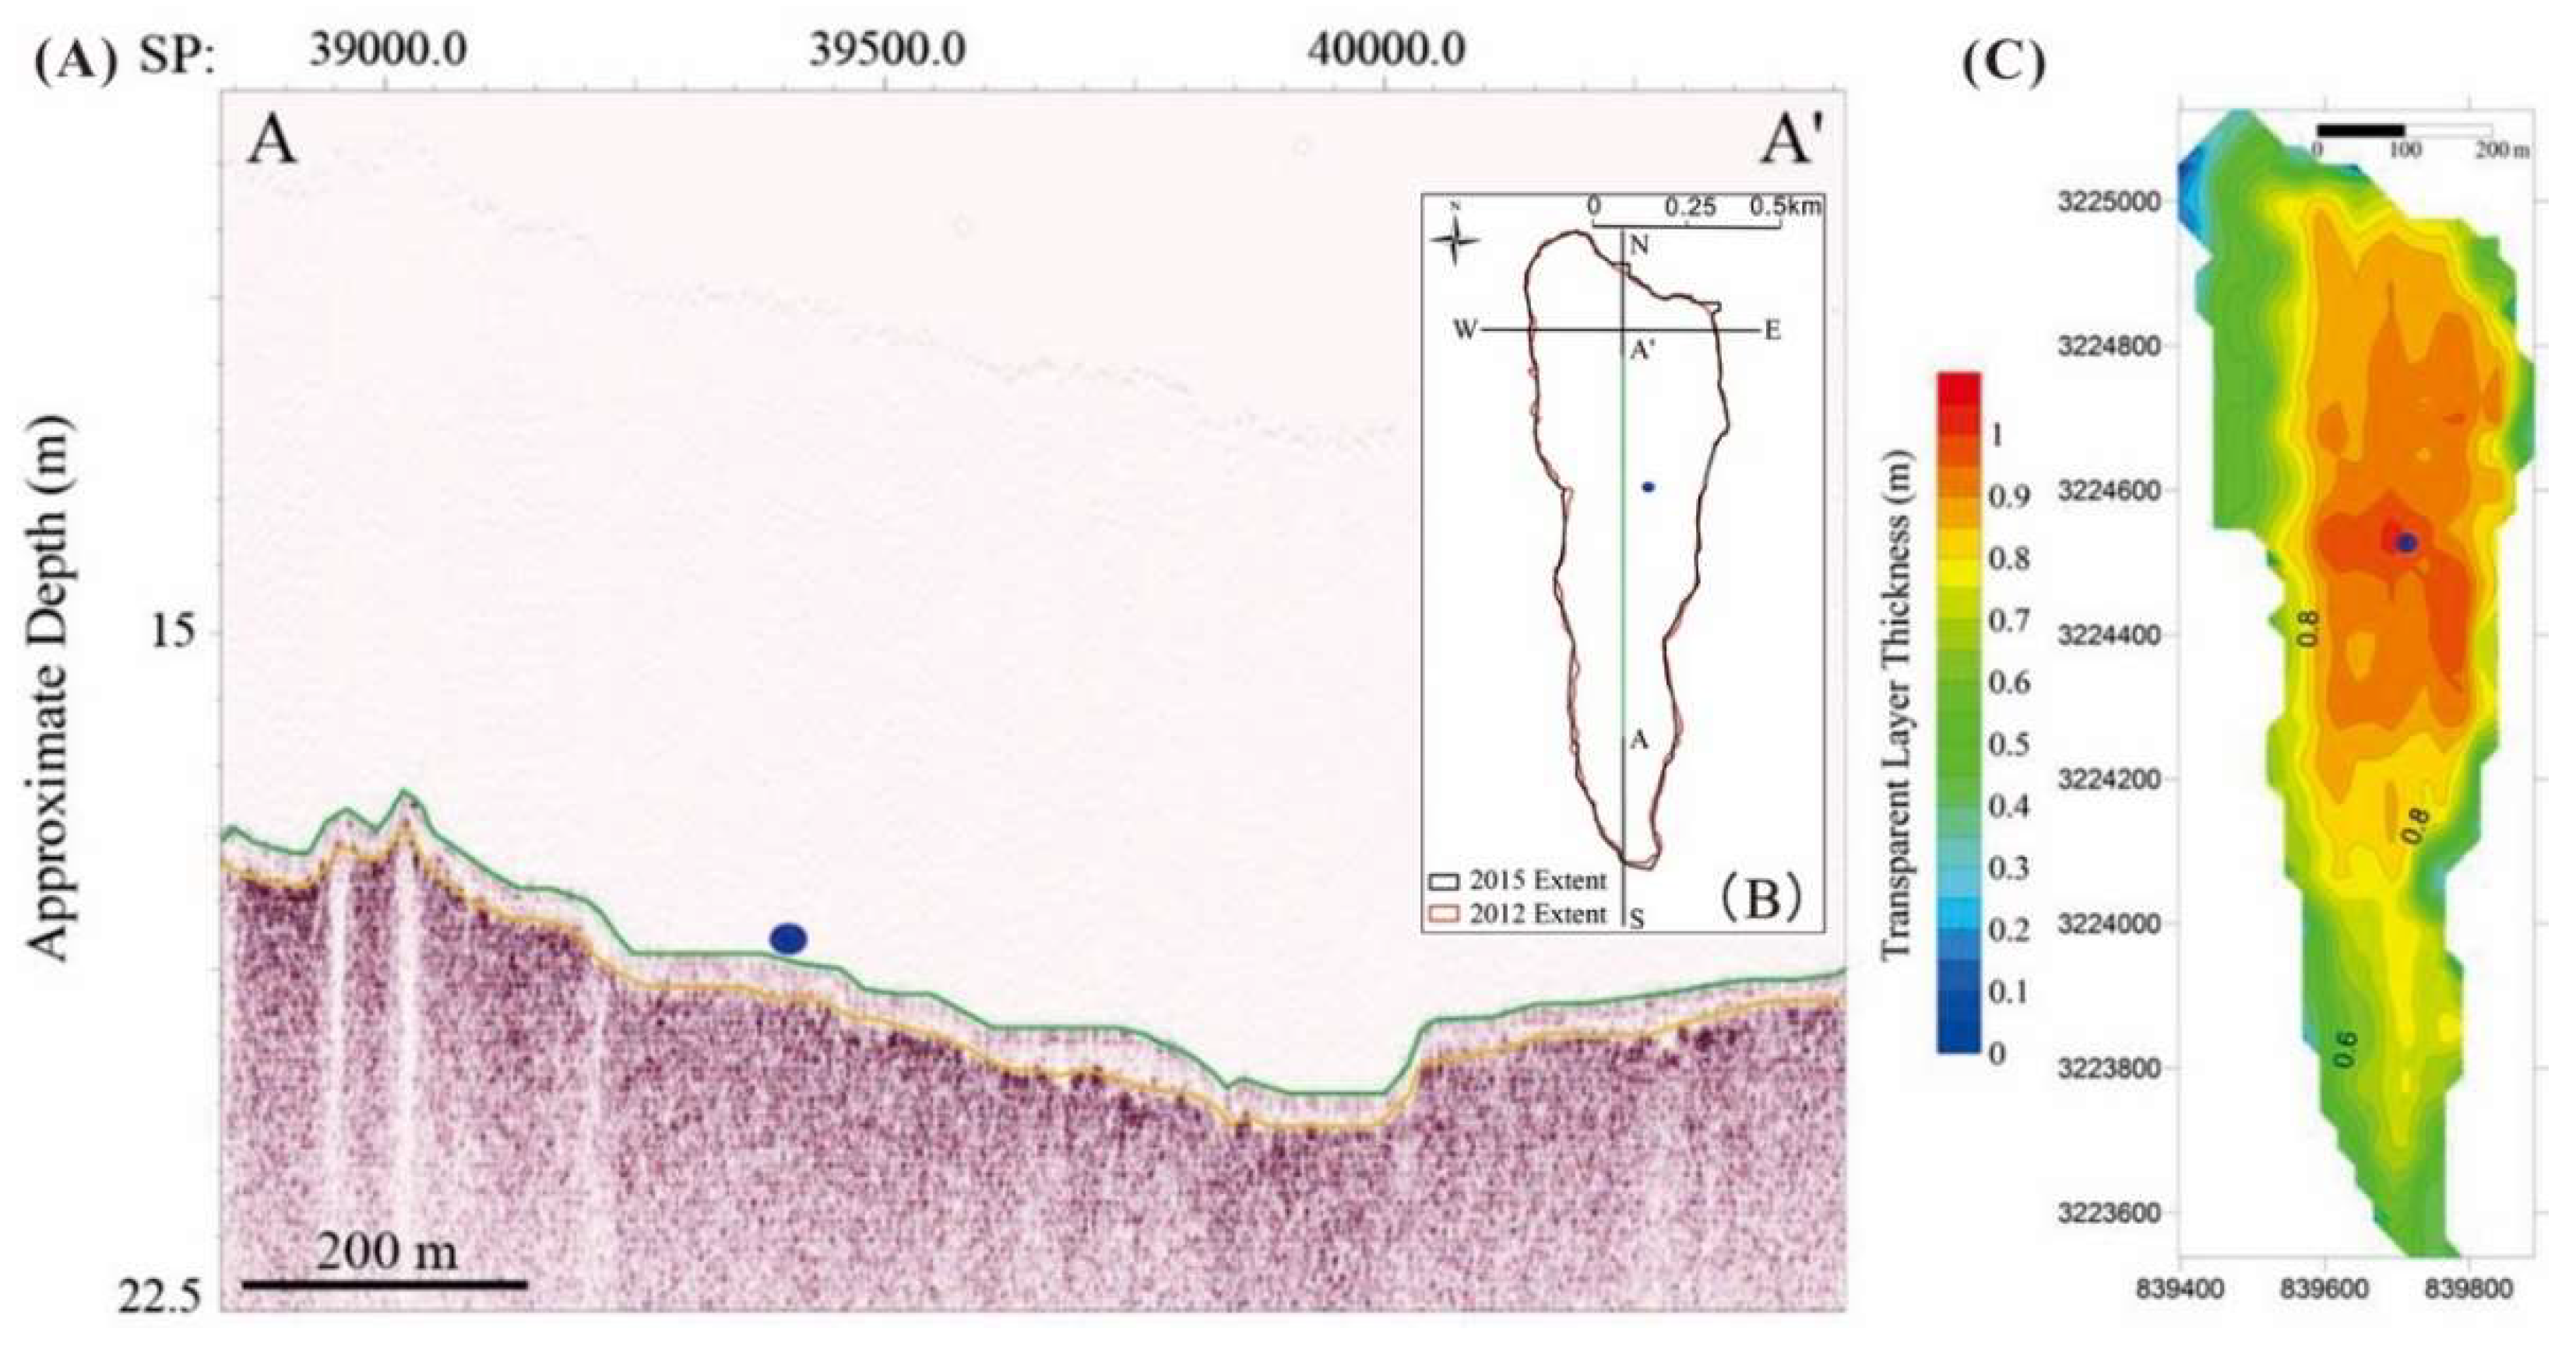
Wave heights calculated at T2 were much smaller than those at T1 (Figure 4C). The SSC detected by the turbidity sensor near the pit bottom was around 4 g/L, with little variation (Figure 4D). In addition, the sub-bottom seismic data also displayed a 0.5–1 m thick acoustically transparent layer on top of the entire pit floor, which is interpreted as a high turbidity layer (Figure 5).
4. Discussion
Previous studies reported that the morphological change around Sand-Dominated Dredge Pits (SDDPS) is closely related to: (1) pit migration caused by net sand transport in one direction and associated slope changes upstream and downstream of the pit; (2) deposition of suspended sediment in water column caused by the reduction of current speeds over pit [13,24]. However, the impact of these processes on pit morphology in a muddy environment is unclear.
Grain size and LOI data of the two stations indicate that T1 is located at a sandy-silty environment (Table 2), and T2 is in a muddy environment. The currents near seafloor mainly flow southeastward at T1, with speeds around 10 cm/s (Figure 2D, Figure 3 and Figure 4A,B). Based on the dominant southward flow direction in the summer of 2015, T1 is defined as the upstream station, and T2 is defined as the downstream station (Figure 2D and Figure 3). Speed reduction from upstream (T1) to downstream (T2) at a depth of 9.40 m below sea surface is negligible (Figure 6). Wave heights detected at T2 on the pit floor were much smaller than those at T1 station. One explanation is that the bases of short waves could not reach the depth of T2, which was about 11 m deeper than T1. Another possible reason is that the high turbidity layer causes wave damping at the pit bottom [25].
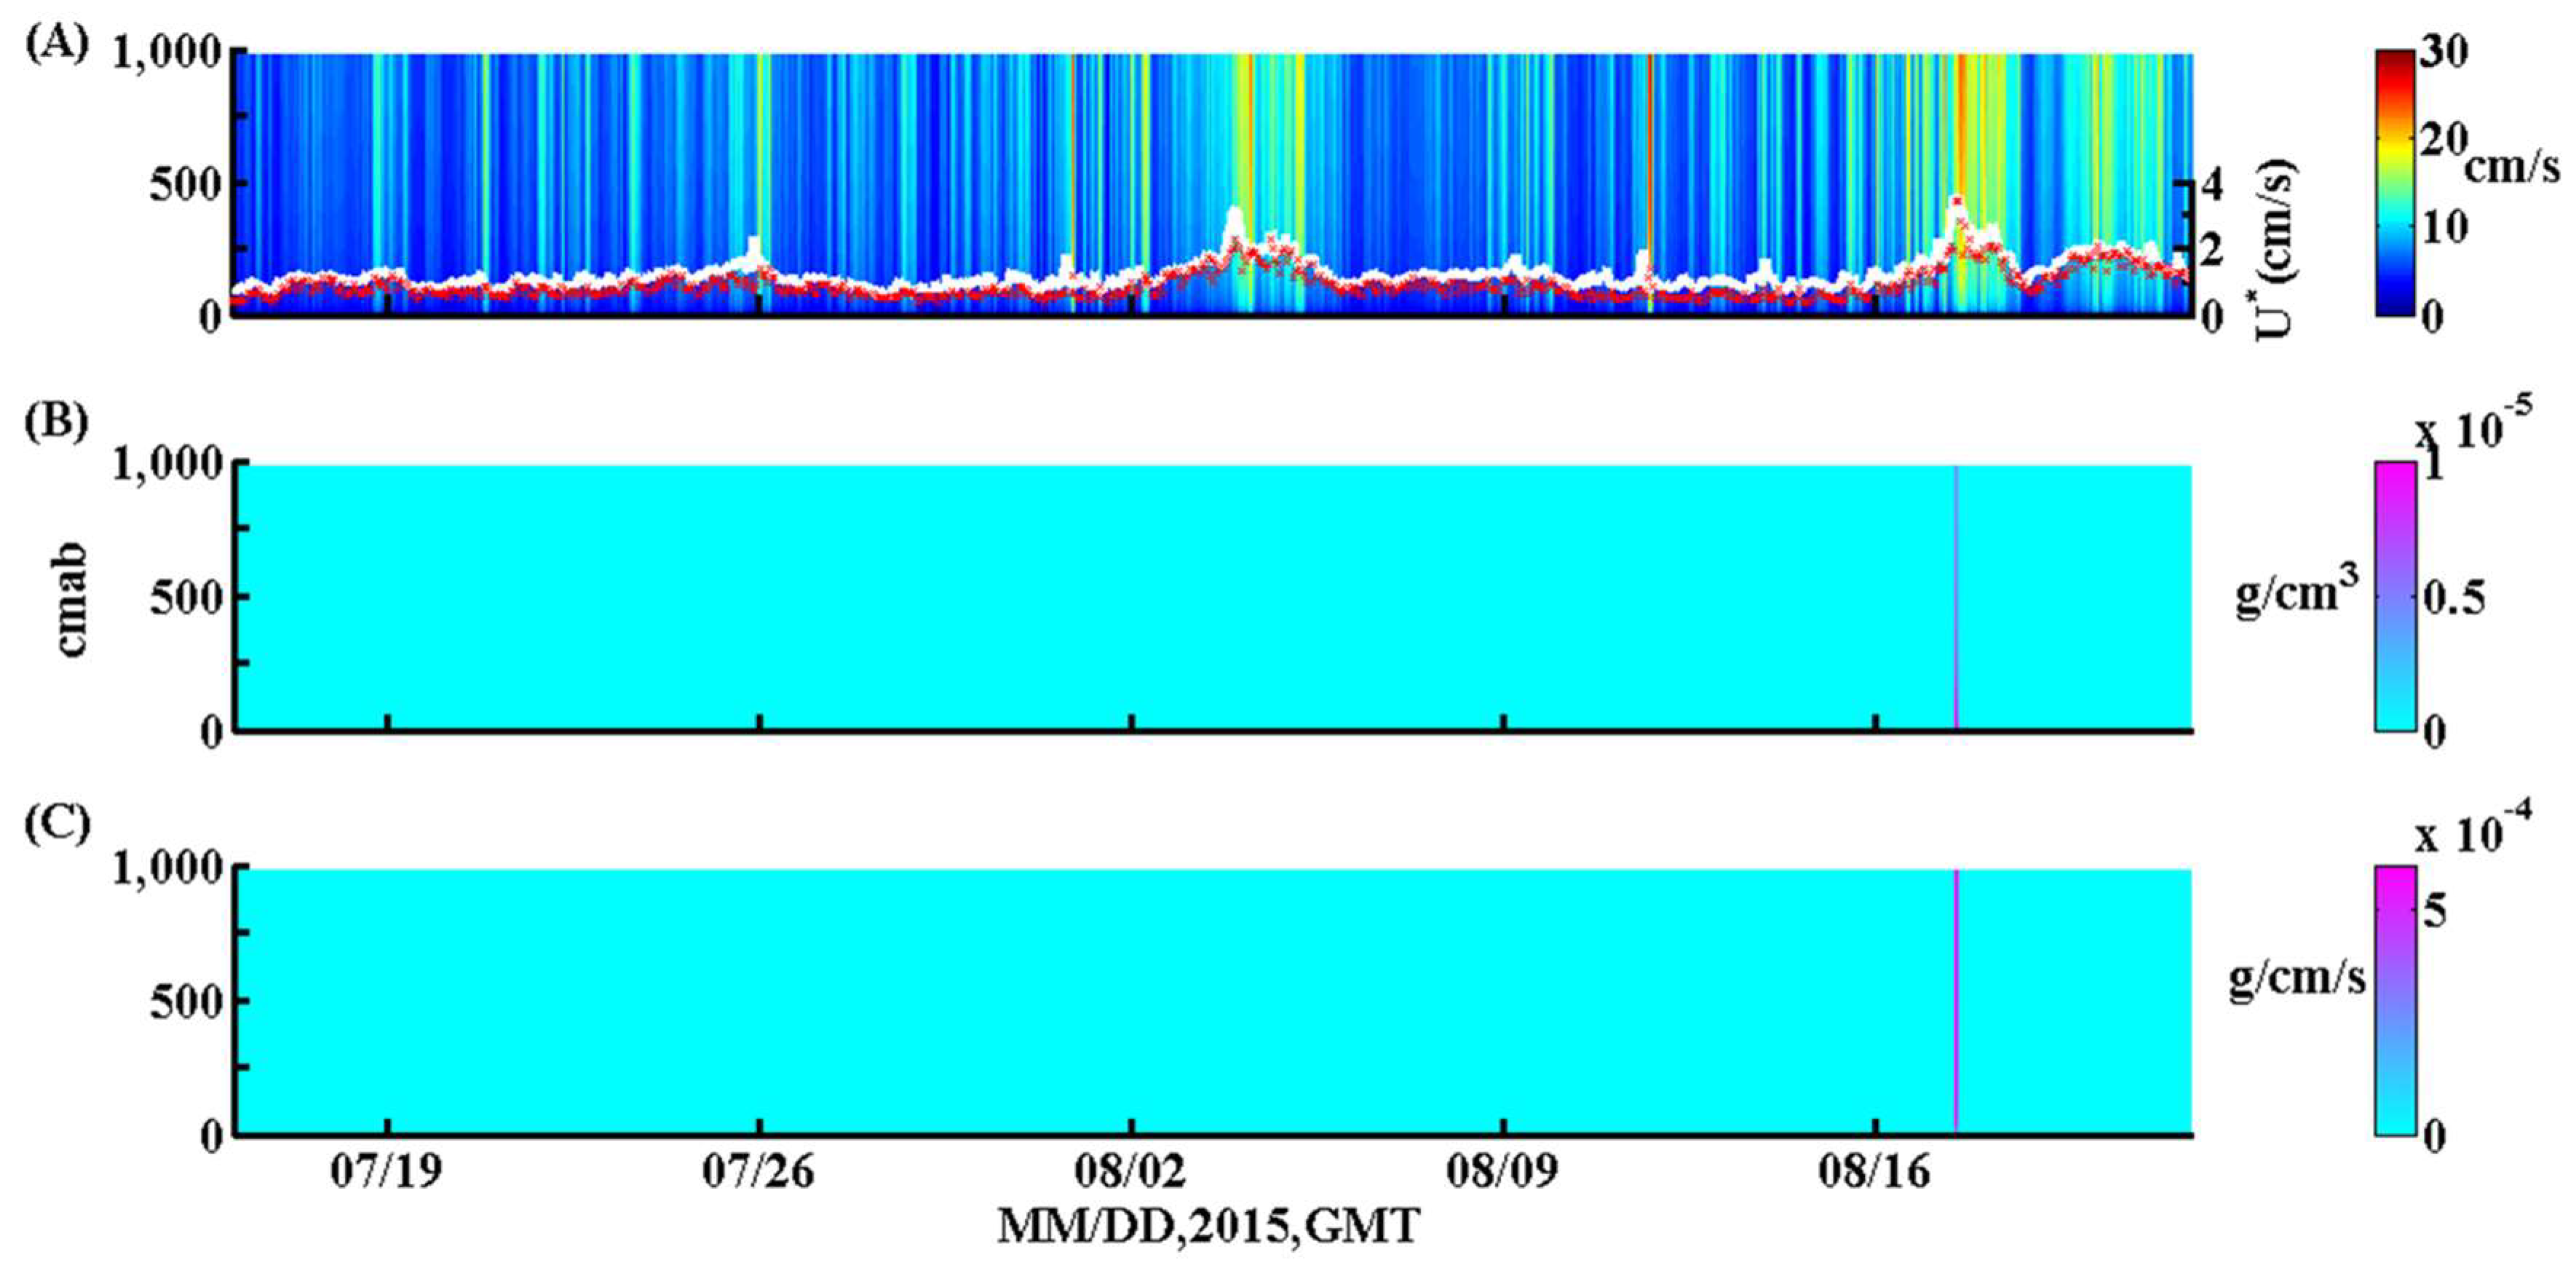
An assumption was made that the wave heights and currents at the ambient seafloor of the pit were similar to those at T1. So the resuspension activity at ambient seafloor of the pit was considered to be the same at T1. Measured wave and current data at T1 were used to run the 1–D vertical Styles and Glenn model for grain size groups of 0.0005 mm, 0.005 mm, 0.01 mm, 0.0125 mm, 0.025 mm, and these groups represent the fractions of our grain size data. The modeled wave-current bed shear velocities were close to the measured data, and the bed shear stresses were normally below 0.125 Pa (Figure 2E and Figure 7A). Wright et al. [26] reported that the bed shear stress threshold for resuspension on the inner shelf of Louisiana is around 0.11 Pa. The model results also showed no strong resuspension activities near the seafloor, and SSC in water column for grain size group of 0.005 mm was around zero most of the time (Figure 7B). These are consistent with the observed result of Wright, Sherwood and Sternberg [26]. Resuspension barely happened under fair-weather from July 15th to August 21st of 2015. However, fine sediments from Mississippi River plume freshly deposited on the seafloor are not included in Style and Glenn model. They may be easily resuspended by waves and currents under fair-weather, due to their fine grain size and unconsolidated mobile nature, which needs more observational data to quantify this process.
It is deduced that little resuspension exists on ambient seafloor of the pit during fair-weather, due to little change of current velocities at 9.4 m below sea surface from T2 and T1 (Figure 6). The resuspension model results imply that related pit margin erosion and sediment contribution to pit infilling are limited under fair-weather condition. Apart from the impacts of resuspension activity on pit morphology change, wave-induced pit wall collapse could be another important process driving the change of pit morphology.
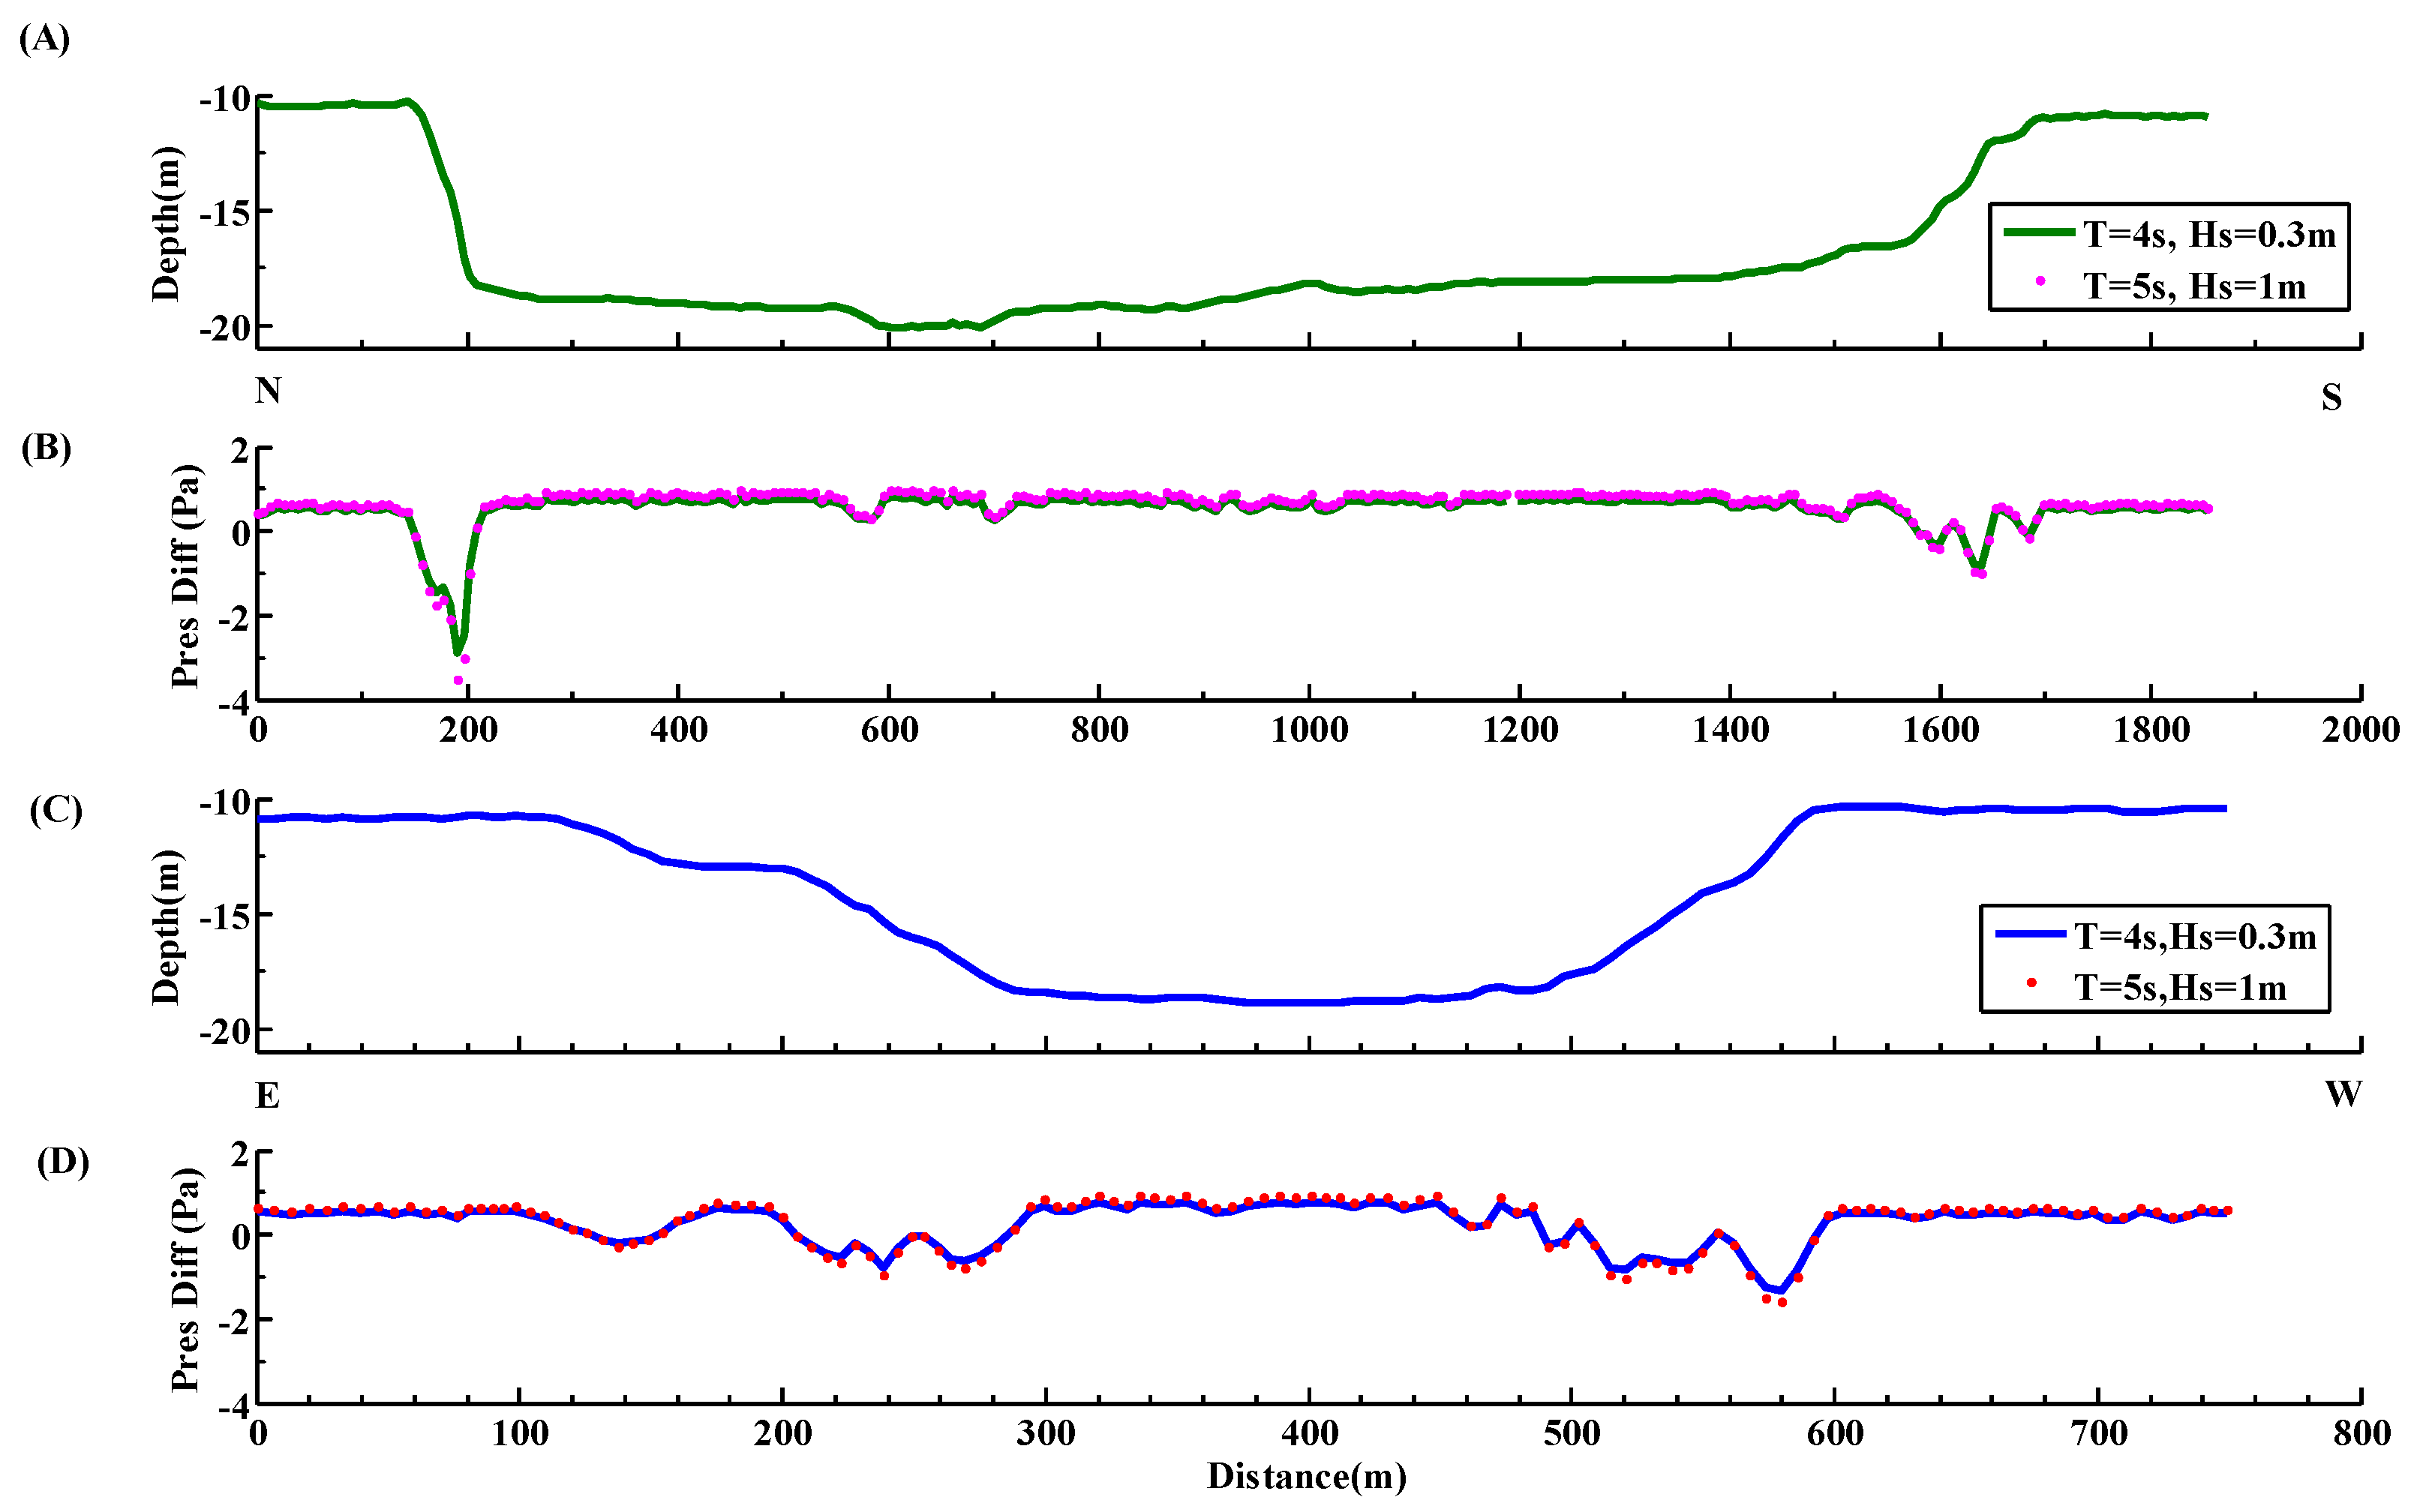
The oceanic wave passage produces pressure changes in water between the crest and trough. These pressure changes may mobilize soft unconsolidated delta sediments on the seafloor up to 100 m depth [23]. To evaluate the role of wall collapse on pit edge erosion, slope modification, and pit infilling, pressure differences along two bathymetric profiles were calculated using the model from Henkel [23]. The pressure differences at the steep pit wall are around 1–3 Pa, much greater than adjacent seafloor and pit floor (Figure 8).
The pressure differences between pit wall and its ambient seafloor could make the pit wall the most likely place to collapse. The bathymetry data show that the horizontal changes of pit edge were in meter scale between 2012 and 2015 (Figure 5B). The meter-scale horizontal change at pit edge indicated that pit wall failure was not frequent even with 1–3 Pa pressure differences along the edge. Threshold of pressure difference for the collapse of consolidated cohesive mud cap is probably greater than 1–3 Pa (Figure 8). Mass failure process induced by waves is complicated in this situation, and more data about the sediments’ rigidity, in situ pressure difference and mass failure are needed.
Based on the observational and modeling results, pit edge erosion and sediment contribution from both seafloor resuspension and wall collapse are limited. Sandy Point dredge pit is mainly in a depositional condition with weak hydrodynamic activities (e.g., slow current speeds and small wave heights), and the organic matter content at the pit floor is higher than that on adjacent seafloor (Table 2 and Figure 2, Figure 3 and Figure 4). It has been found that river-borne sediments can be transported less than ~30 km from the Mississippi River mouth before their initial deposition under fair-weather conditions [27]. Because the pit is under the influence of river plume during both high and low river discharge periods (Table 2), suspended sediments from the Mississippi River plume are thus the major contribution to the pit infilling [15,28].
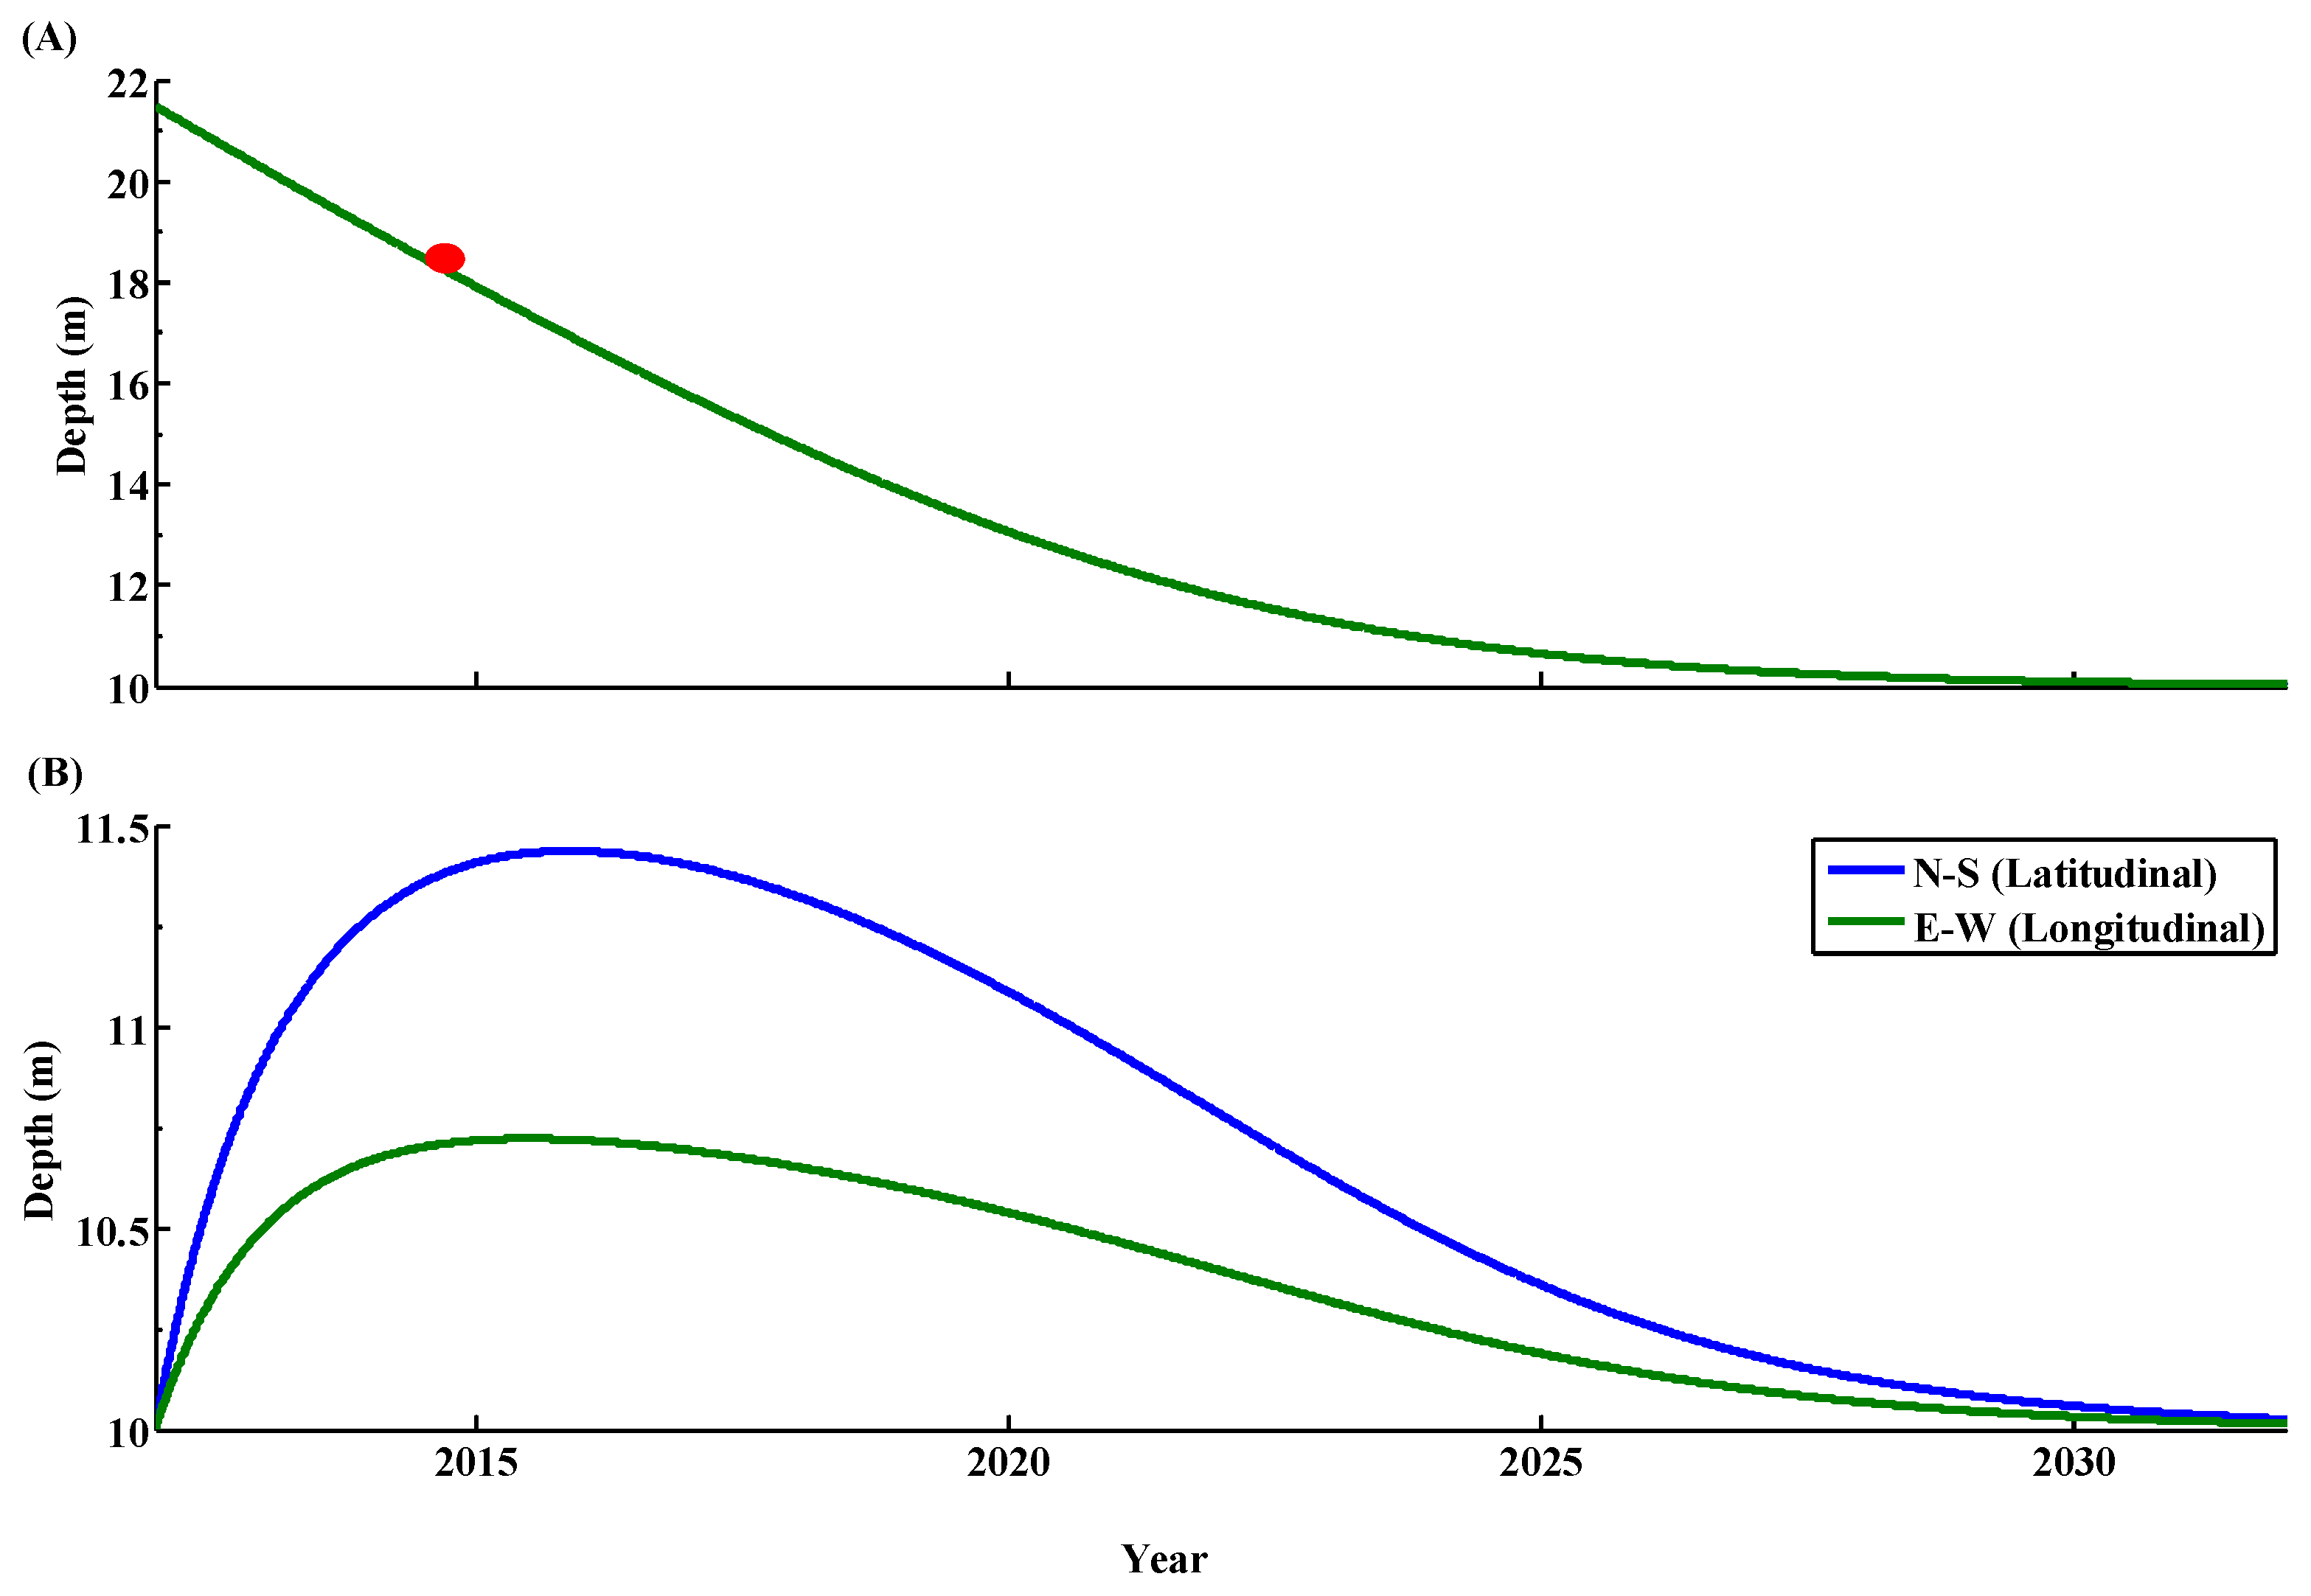
In order to predict the long-term status of pit infilling and edge erosion, the infilling model was applied at the pit (Figure 9). An average of the in situ SSC data (23 mg/L) was used as the depth-averaged sediment concentration in the model. Settling velocity is impacted by many factors including grain size, temperature, salinity, flocculation, etc. Xu et al. [29] have used values of 0.001 m/s, 0.0001 m/s, and 0.00001 m/s to model sediment transport along Louisiana coast. Here, the settling velocity of 0.0015 m/s from Nairn, Lu and Langendyk [13] was used in the infilling model, which is slightly larger than the velocity of 0.001 m/s from Xu, Harris, Hetland and Kaihatu [29].
As shown in Figure 9A, the predicted infilling status is close to the measured infilling depth. It would probably take about 10 years to fill in the entire pit under a conservative estimation, assuming that the SSC, current and wave conditions are similar to the summer condition for a whole year. The modeling result for pit infilling only included sediments settling from the water column over the pit, which are probably mainly from the Mississippi River plume [15,28]. However, extreme weather conditions, including cold fronts, tropical storms, and hurricanes, would probably cause frequent resuspension on adjacent seafloor and wall collapse, which could also contribute sediments to pit infilling.
The model also predicted the edge erosion status caused by current adjustment along two profiles. The erosion along N–S profile was stronger than that along E–W profile. Because the erosion prediction from the model was based on the assumption of current speed adjustment around the pit, the differential erosion status along two profiles was probably related to the N–S pit orientation. However, model results for edge erosion might be over predicted, because little current speed adjustment was observed between the currents inside and outside of the pit, and there was limited resuspension on ambient seafloor under the fair-weather conditions (Figure 2D, Figure 3, Figure 6 and Figure 7). One reason why there is little speed adjustment could be that the reduction of silt-clay-sized suspended sediments in water over the mud-capped pits has little impact on current speeds, which is unlike the situation at SDDPs, where adjustment is mainly caused by sediment load reduction (especially bed load) over the pits [11,12].
5. Conclusions
Our study focuses on driving factors for the morphological change of a mud-capped dredge pit in the northern Gulf of Mexico. Combined with the observational data in summer 2015, model results show that resuspension on the seafloor was weak under fair-weather conditions, and the related edge erosion and sediments contribution to pit infilling were limited. Wave passages induced pressure differences of 1–3 Pa along the pit edge, which might cause limited pit wall collapse, and contribute to a small horizontal migration (less than a few meters) of the pit edge within 3 years after dredging. With little impacts from resuspension and limited wall collapse under fair weather, Sandy Point dredge pit is mainly in a depositional condition, and the infilling status is most likely controlled by the suspended sediment concentration of Mississippi River plume and the settling velocity. Our results also provide knowledge on evaluating the potential effects of dredged pit on local marine ecology and fisheries, and the risks associated with offshore infrastructure.
Author Contributions
J.W. participated in all field data collection, analyzed all observational data from sensors, and prepared the draft manuscript. K.X. served as PI of the funded project and provided all lab and field resources. C.L. provided ADCP data and helped on data analysis. J.B.O. provided the geophysical data. All authors contributed to the revisions of this manuscript.
Funding
Funding for this study was provided by the U.S. Department of the Interior, Bureau of Ocean Energy Management, Coastal Marine Institute, Washington DC under Cooperative Agreement Number M14AC00023.
Acknowledgments
We thank the Field Support Group of the Coastal Studies Institute, Louisiana State University. Tripod observation, vessel-based ADCP survey and geophysical data acquisition were made possible with their help. We are grateful to the valuable comments and suggestions from two anonymous reviewers.
Conflicts of Interest
The authors declare no conflict of interest. There is no personal circumstances or interest from authors that may be perceived as inappropriately influencing the representation or interpretation of reported research results. The funders had no role in the design of the study; in the collection, analyses, or interpretation of data; in the writing of the manuscript, and in the decision to publish the results.
Appendix A
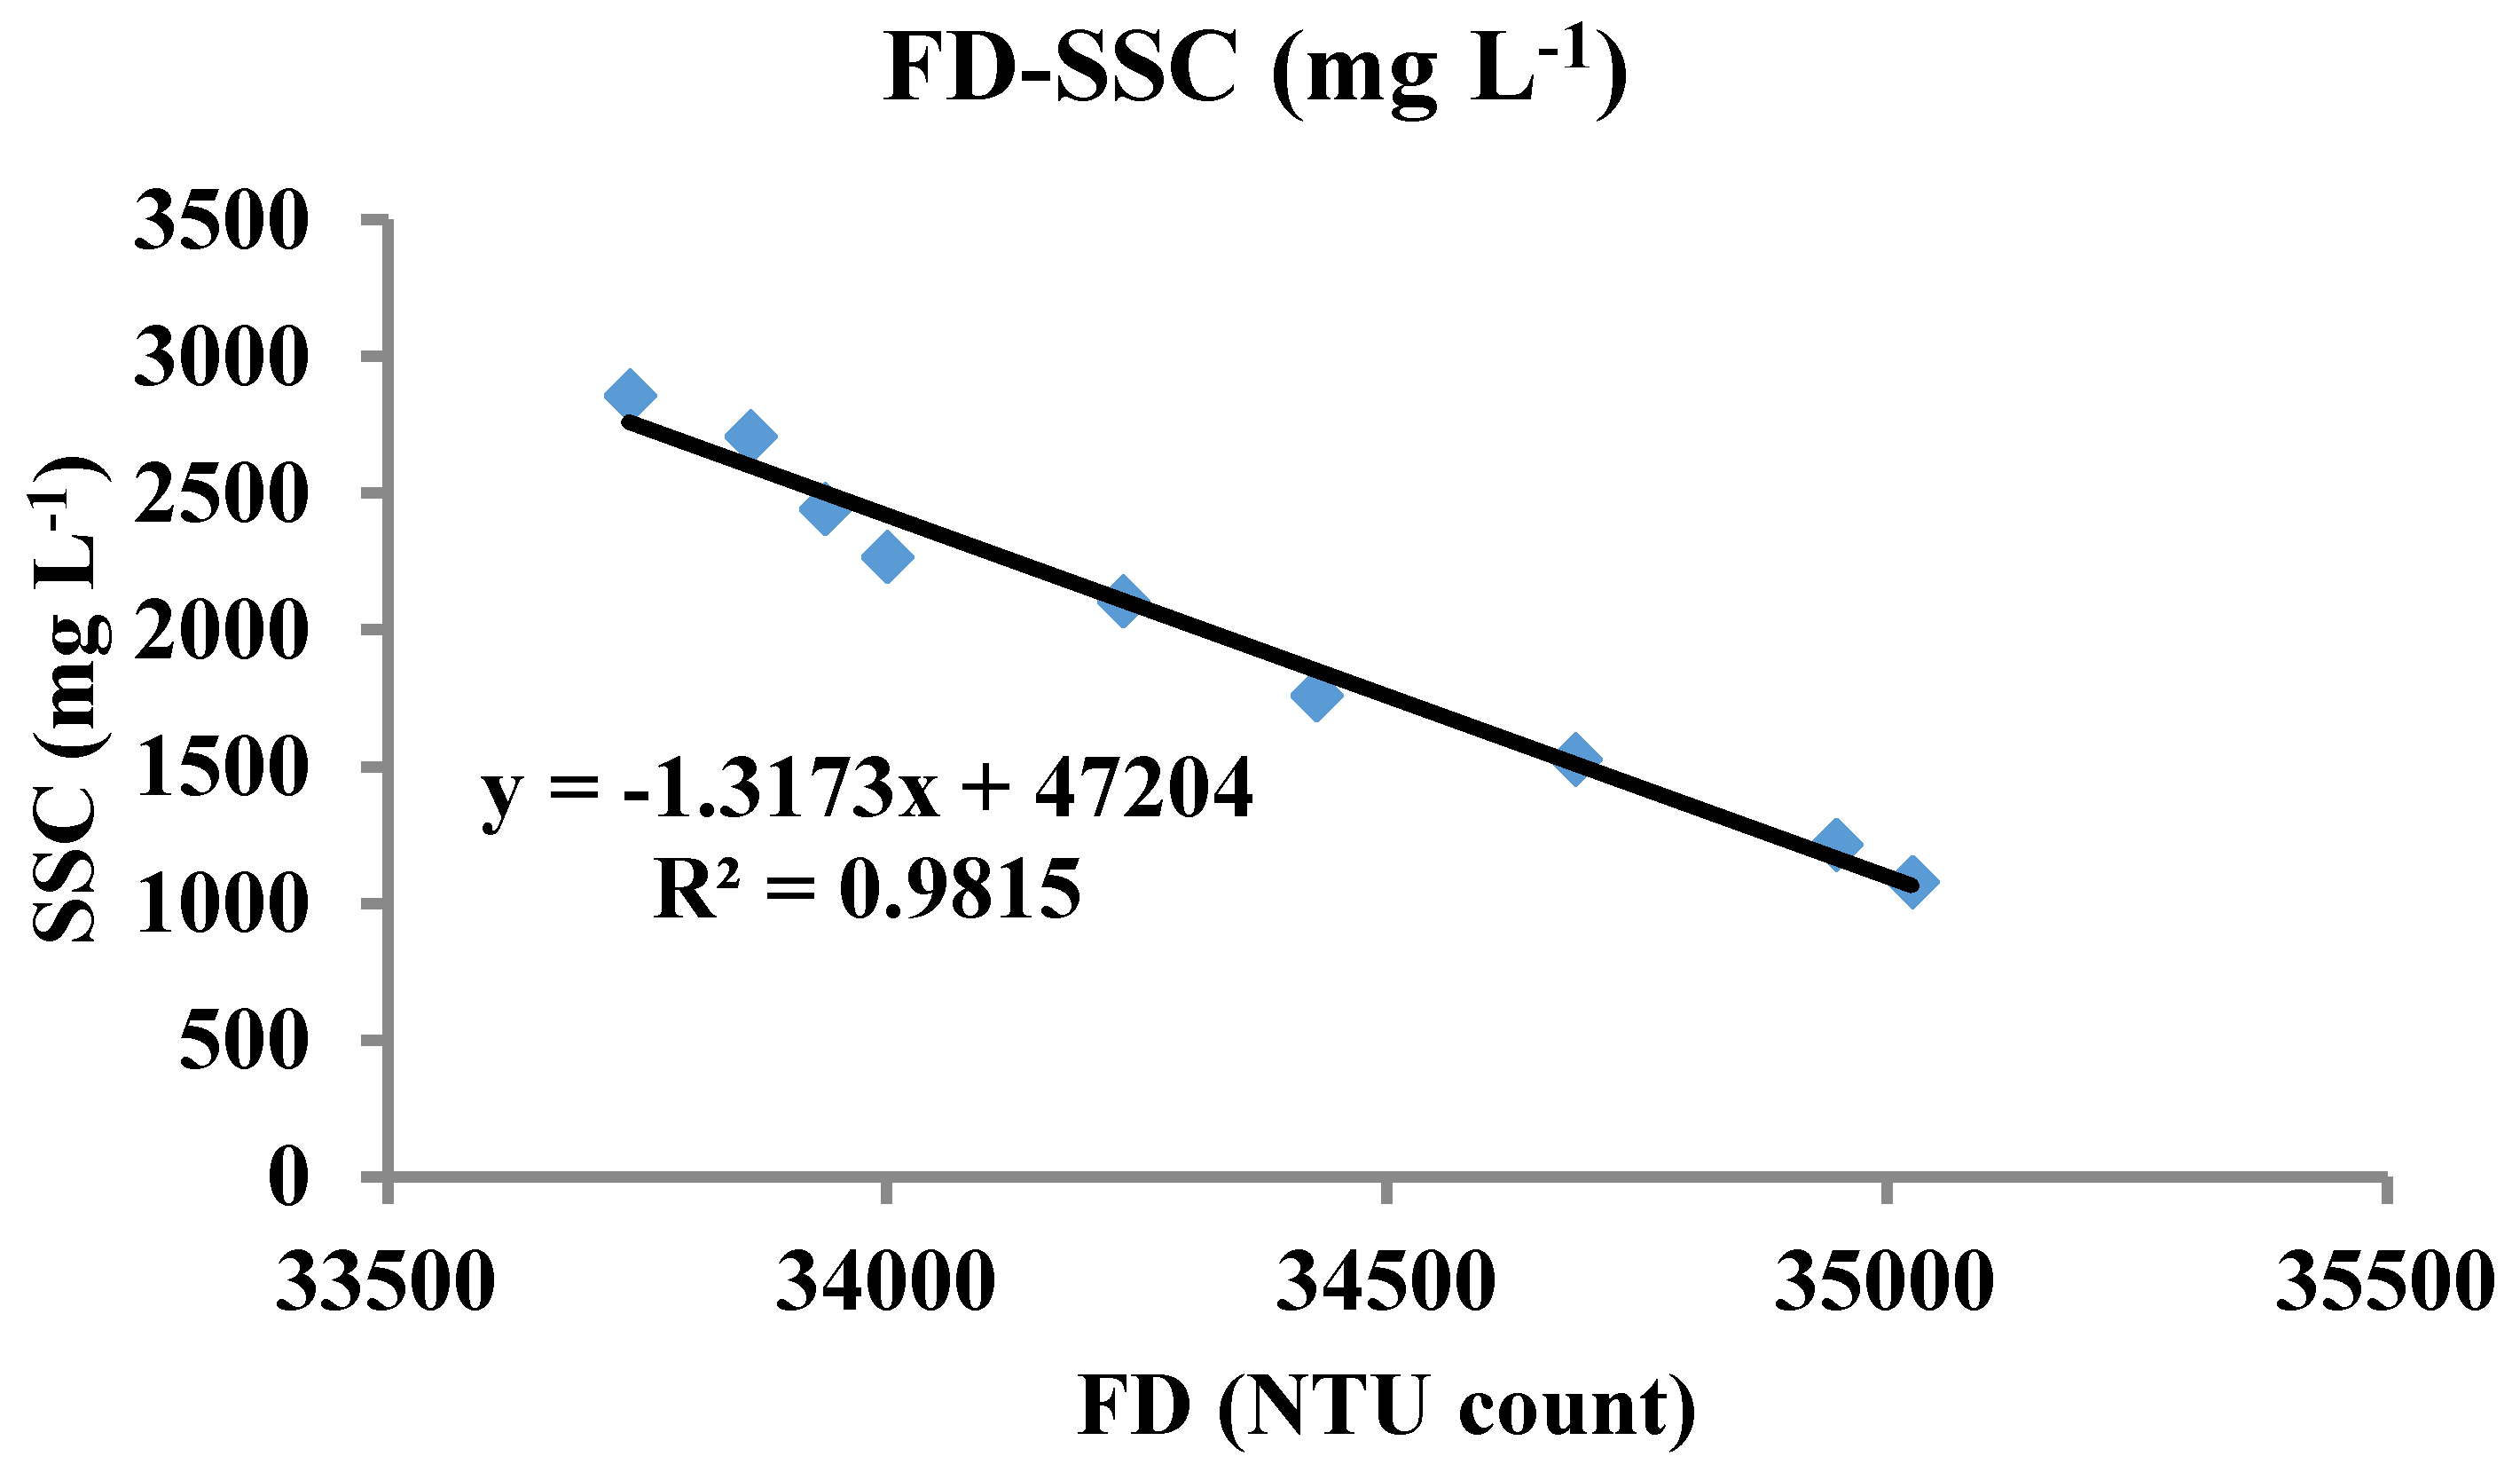
Figure A1.
The relationship of FD Nephelometric Turbidity Unit (NTU) count with suspend sediment concentration for the OBS sensor used in tripod station T2.
Figure A1.
The relationship of FD Nephelometric Turbidity Unit (NTU) count with suspend sediment concentration for the OBS sensor used in tripod station T2.

References
- Syvitski, J.P.M.; Kettner, A.J.; Overeem, I.; Hutton, E.W.H.; Hannon, M.T.; Brakenridge, G.R.; Day, J.W.; Vorosmarty, C.J.; Saito, Y.; Giosan, L.; et al. Sinking deltas due to human activities/sinking deltas. Nat. Geosci. 2009, 2, 681–686. [Google Scholar] [CrossRef]
- Day, J.W.; Lane, R.R.; D’Elia, C.F.; Wiegman, A.R.H.; Rutherford, J.S.; Shaffer, G.P.; Brantley, C.G.; Kemp, G.P. Large infrequently operated river diversions for Mississippi delta restoration. Estuar. Coast. Shelf Sci. 2016, 183, 292–303. [Google Scholar] [CrossRef]
- Snedden, G.A.; Cretini, K.; Patton, B. Inundation and salinity impacts to above- and belowground productivity in spartina patens and spartina alterniflora in the Mississippi river deltaic plain: Implications for using river diversions as restoration tools. Ecol. Eng. 2015, 81, 133–139. [Google Scholar] [CrossRef]
- Szymelfenig, M.; Kotwicki, L.; Graca, B. Benthic re-colonization in post-dredging pits in the puck bay (Southern Baltic Sea). Estuar. Coast. Shelf Sci. 2006, 68, 489–498. [Google Scholar] [CrossRef]
- Van Der Veer, H.W.; Bergman, M.J.N.; Beukema, J.J. Dredging activities in the dutch wadden sea: Effects on macrobenthic infauna. Neth. J. Sea Res. 1985, 19, 183–190. [Google Scholar] [CrossRef]
- Van Rijn, L.C. Eastuary and coastal sedimentation problems. Int. J. Sediment Res. 2016, 20, 39–51. [Google Scholar]
- Waye-Barker, G.A.; McIlwaine, P.; Lozach, S.; Cooper, K.M. The effects of marine sand and gravel extraction on the sediment composition and macrofaunal community of a commercial dredging site (15 years post-dredging). Mar. Pollut. Bull. 2015, 99, 207–215. [Google Scholar] [CrossRef] [PubMed]
- Xu, K.; Sanger, D.; Riekerk, G.; Crowe, S.; Van Dolah, R.F.; Wren, P.A.; Ma, Y. Seabed texture and composition changes offshore of port royal sound, south carolina before and after the dredging for beach nourishment. Estuar. Coast. Shelf Sci. 2014, 149, 57–67. [Google Scholar] [CrossRef]
- González, M.; Medina, R.; Espejo, A.; Tintoré, J.; Martin, D.; Orfila, A. Morphodynamic evolution of dredged sandpits. J. Coast. Res. 2010, 263, 485–502. [Google Scholar] [CrossRef] [Green Version]
- Kubicki, A.; Manso, F.; Diesing, M. Morphological evolution of gravel and sand extraction pits, Tromper Wiek, Baltic Sea. Estuar. Coast. Shelf Sci. 2007, 71, 647–656. [Google Scholar] [CrossRef]
- Van Rijn, L.C. Sedimentation of dredged channels by current and waves. J. Waterw. Port Coast. Oceans Eng. 1986, 112, 541–559. [Google Scholar] [CrossRef]
- Walstra, D.J.R.; Van Rijn, L.C.; Hoogewoning, S.E.; Aarninkhof, S.G.J. Modelling of Sedimentation of Dredged Trenches and Channels Under the Combined Action of Tidal Currents and Waves. In Proceedings of the Fourth International Symposium on Coastal Engineering and Science of Coastal Sediment, Long Island, NY, USA, 21–23 June 1999. [Google Scholar]
- Nairn, R.; Lu, Q.; Langendyk, S. A Study to Address the Issue of Seafloor Stability and the Impact on Oil and Gas Infrastructure in the Gulf of Mexico; U.S. Department of the Interior Minerals Management Service: Washington, DC, USA, 2005.
- Pelican Island Restoration (BA-38-1) CWPPRA Project: Project Completion Report; Coastal Planning & Engineering, Inc.: Boca Raton, FL, USA, 2013.
- Obelcz, J.; Xu, K.; Bentley, S.J.; O’Connor, M.; Miner, M.D. Mud-capped dredge pits: An experiment of opportunity for characterizing cohesive sediment transport and slope stability in the Northern Gulf of Mexico. Estuar. Coast. Shelf Sci. 2018, 208, 161–169. [Google Scholar] [CrossRef]
- Heiri, O.; Lotter, A.F.; Lemcke, G. Loss on ignition as a method for estimating organic and carbonate content in sediments: Reproducibility and comparability of results. J. Paleolimnol. 2001, 25, 101–110. [Google Scholar] [CrossRef]
- Goring, D.G.; Nikora, V. Despiking acoustic doppler velocimeter data. J. Hydraul. Eng. 2002, 128, 117–126. [Google Scholar] [CrossRef]
- Wahl, T.L. Discussion of "Despiking Acoustic Doppler Velocimeter Data" by Derek G. Goring and Vladimir I. Nikora. J. Hydraul. Eng. 2002, 129, 484–487. [Google Scholar] [CrossRef]
- Karimpour, A.; Chen, Q. Wind wave analysis in depth limited water using oceanlyz, a matlab toolbox. Comput. Geosci. 2017, 106, 181–189. [Google Scholar] [CrossRef]
- Kim, S.C.; Friedrichs, C.T.; ASCE, M.; Maa, J.P.-Y.; Wright, L.D. Estimating bottom stress in tidal boundary layer from acoustic doppler velocimeter data. Hydraul. Eng. 2000, 126, 399–406. [Google Scholar] [CrossRef]
- Soulsby, R.L.; Dyer, K.R. The form of the near-bed velocity profile in a tidally accelerating flow. J. Geophys. Res. 1981, 20, 8067–8074. [Google Scholar] [CrossRef]
- Styles, R.; Glenn, S.M. Modeling stratified wave and current bottom boundary layers on the continental shelf. J. Geophys. Res. Oceans 2000, 105, 24119–24139. [Google Scholar] [CrossRef] [Green Version]
- Henkel, D.J. The role of waves in causing submarine landslides. Geotechnique 1970, 20, 75–80. [Google Scholar] [CrossRef]
- Lu, Q.; Nairn, R.B. Prediction on morphological response of dredged sand-borrow pits. Coast. Eng. 2010, 32, 1–9. [Google Scholar] [CrossRef]
- Kranenburg, W. Modelling Wave Damping by Fluid Mud. Master’s Thesis, Delft University of Technology, Delft, The Netherslands, February 2008. [Google Scholar]
- Wright, L.D.; Sherwood, C.R.; Sternberg, R.W. Field measurements of fairweather bottom boundary layer processes and sediment suspension on the Louisiana Inner Continental Shelf. Mar. Geol. 1997, 140, 329–345. [Google Scholar] [CrossRef]
- Corbett, D.R.; McKee, B.; Duncan, D. An evaluation of mobile mud dynamics in the Mississippi river deltaic region. Mar. Geol. 2004, 209, 91–112. [Google Scholar] [CrossRef]
- O’Connor, M.C. Sediment Infilling of Louisiana Continental-sShelf Dredge Pits: A Record of Sedimentary Processes in the Northern Gulf of Mexico. Master’s Thesis, Louisiana State University, Baton Rouge, LA, USA, 2017. [Google Scholar]
- Xu, K.; Harris, C.K.; Hetland, R.D.; Kaihatu, J.M. Dispersal of Mississippi and Atchafalaya sediment on the Texas–Louisiana shelf: Model estimates for the year 1993. Cont. Shelf. Res. 2011, 31, 1558–1575. [Google Scholar] [CrossRef]
Figure 1.
(A) Locations of Sandy Point dredge pit, observation sites T1 (north) and T2 (south), Mississippi River National Data Buoy Center Station PSTL1–8760922–Pilot’s Station East, Southwest Pass, LA, and USGS 07374525 Mississippi River at Belle Chasse, LA; (B) zoom in map for Sandy Point dredge pit and observation station T1 and T2.

Figure 2.
Time series results outside of the pit: (A) River discharge (measured every 15 min) at USGS station 07374525 Mississippi River in Belle Chasse, LA: daily mean is from 2008 to 2016; (B) hourly wind data from Mississippi River National Data Buoy Center Station PSTL1–8760922-Pilot’s Station East, Southwest Pass, LA: dashed light grey lines separate northerly and southerly winds; (C) zero moment wave heights; (D) current speeds and directions: dashed light grey lines indicate the northern and southern directions; (E) near-bed wave-current combined shear velocity (red line), and bed shear stress (blue dashed line).

Figure 3.
Subsurface current velocity (A) 2.75 m below the surface; (B) 7.75 m subsurface; (C) 16.50 m subsurface at Sandy Point Dredge Pit, and the black line is the edge of the pit in 2015.
Figure 3.
Subsurface current velocity (A) 2.75 m below the surface; (B) 7.75 m subsurface; (C) 16.50 m subsurface at Sandy Point Dredge Pit, and the black line is the edge of the pit in 2015.

Figure 4.
Time series results inside the pit: (A) low pass filtered east (+)/west (−) velocities’ vertical structure; mab is meter above bed; (B) Low pass filtered north (+)/south (−) velocities’ vertical structure; (A’) vertical structure of low pass filtered mean horizontal current speed; (C) Zero moment wave height at T2 (red) and T1 (grey); (D) near-bed suspended sediments concentration, calibrated from turbidity counts data.

Figure 5.
(A) Sub-bottom seismic profile of A–A’ (see inset (B)): inspective ‘high turbidity’ layer between green and orange lines; (B) the edge of Sandy Point dredging pit in 2012 and 2015, and station T2 (blue dot); (C) thickness isopach of the ‘high turbidity’ layer on the pit bottom, with UTM x–y coordinate of zone 16 (in meters), and T2 station (blue dot on both panels).

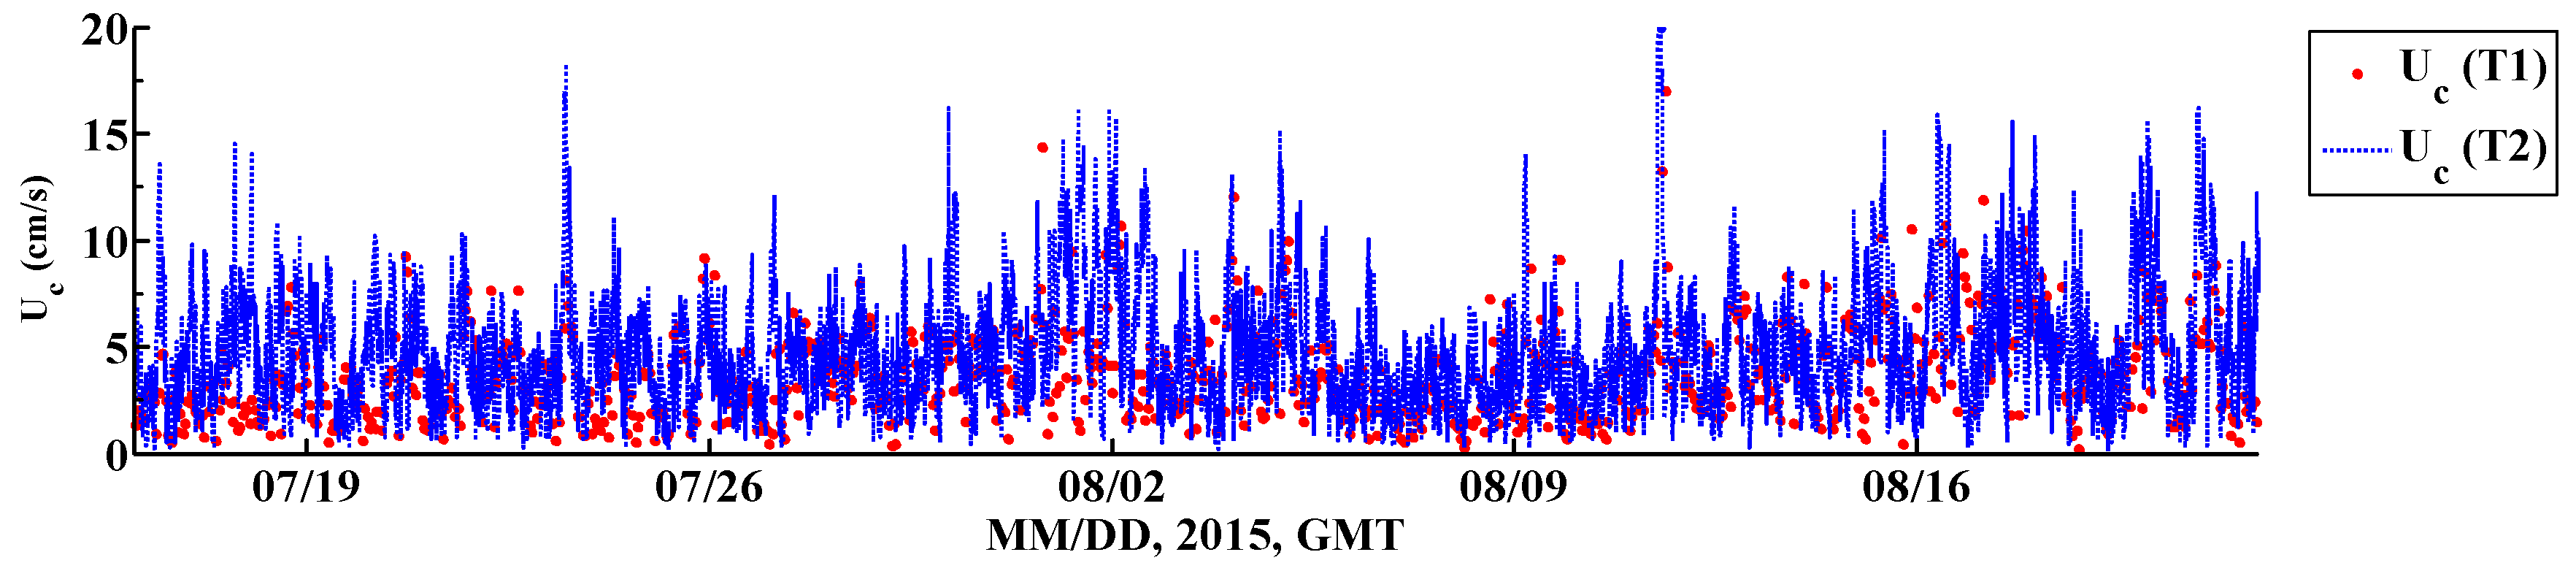
Figure 6.
Current speeds in a water depth of 9.40 m below sea surface at T2 (from upward-looking ADCP) and T1 (from ADVOcean).
Figure 6.
Current speeds in a water depth of 9.40 m below sea surface at T2 (from upward-looking ADCP) and T1 (from ADVOcean).

Figure 7.
The model results of resuspended sediments concentration within the water column at station T1. (A) Current speed within the water: observed wave-current combined shear velocity (white line), and modeled wave-current shear velocity (red dot); (B) resuspended sediment concentration of grain size 0.005 mm within water column; (C) sediment transport flux within the water column (grain size 0.005 mm).
Figure 8.
Wave-induced pressure difference around the pit. (A) North-South bathymetric profile of the pit; (B) pressure difference along the North-South profile; (C) East-West bathymetric profile of the pit; (D) pressure difference along the East-West profile. See Figure 5B for profile locations.
Figure 8.
Wave-induced pressure difference around the pit. (A) North-South bathymetric profile of the pit; (B) pressure difference along the North-South profile; (C) East-West bathymetric profile of the pit; (D) pressure difference along the East-West profile. See Figure 5B for profile locations.

Figure 9.
Model results of pit infilling. (A) Depth change in the pit with sediments infilling: the red dot is the measured pit depth at 2015; (B) depth changes of the western (green) and southern pit edge (blue).
Figure 9.
Model results of pit infilling. (A) Depth change in the pit with sediments infilling: the red dot is the measured pit depth at 2015; (B) depth changes of the western (green) and southern pit edge (blue).


Table 1.
Sensor sampling parameters and observational dates.
| Station | Location | Sensor | Sample Frequency (Burst Duration/Interval) | Sensor Height above Bed (cm) | Observational Period |
|---|---|---|---|---|---|
| T1 (Outside pit) | Latitude 29°8′21.48″ N | Wave Gauge | 10 Hz (1200 s/60 min) | 69 | 15 July–21 August 2015 |
| Longitude 89°31′18.24″ W | ADVOcean | 1 Hz (1024 s/60 min) | 48 | ||
| T2 (Inside pit) | Latitude 29°6′13.02″ N | OBS 5+ | 1 Hz (60 s/60 min) | 97 | |
| Wave Gauge | 10 Hz (1200 s/60 min) | 90 | |||
| Longitude 89°30′35.46″ W | Upward looking ADCP | Sentinel 1200 kHz 20 min/60 min 0.5 m bin size | 120 | ||
| Downward Looking ADCP | Sentinel 1200 kHz 20 min/60 min 0.25 m bin size | 0.53 m below sea surface | 20 May 2015 |
Table 2.
Grain Size, Organic Matter and Total Suspended Sediment at Stations T1 and T2.
| Stations | T1 (Outside Pit) | T2 (Inside Pit) | |
|---|---|---|---|
| Grain Size | Clay | 26.21% | 49.85% |
| Silt | 43.14% | 45.84% | |
| Sand | 30.65% | 4.31% | |
| Mean Grain Size (Φ/mm) | 6.00/0.016 | 7.93/0.004 | |
| Median Grain Size (Φ/mm) | 5.77/0.018 | 8.01/0.004 | |
| Organic Matter Percentage | 5.5% | 9.2% | |
| SSC (g/L and collection date) | 0.0262 (15 July 2015) | 0.0146 (15 July 2015) | |
| 0.0205 (22 August 2015) | 0.0163 (22 August 2015) | ||
© 2018 by the authors. Licensee MDPI, Basel, Switzerland. This article is an open access article distributed under the terms and conditions of the Creative Commons Attribution (CC BY) license (http://creativecommons.org/licenses/by/4.0/).
Share and Cite
MDPI and ACS Style
Wang, J.; Xu, K.; Li, C.; Obelcz, J.B. Forces Driving the Morphological Evolution of a Mud-Capped Dredge Pit, Northern Gulf of Mexico. Water 2018, 10, 1001. https://doi.org/10.3390/w10081001
AMA Style
Wang J, Xu K, Li C, Obelcz JB. Forces Driving the Morphological Evolution of a Mud-Capped Dredge Pit, Northern Gulf of Mexico. Water. 2018; 10(8):1001. https://doi.org/10.3390/w10081001
Chicago/Turabian StyleWang, Jiaze, Kehui Xu, Chunyan Li, and Jeffrey B. Obelcz. 2018. "Forces Driving the Morphological Evolution of a Mud-Capped Dredge Pit, Northern Gulf of Mexico" Water 10, no. 8: 1001. https://doi.org/10.3390/w10081001
Note that from the first issue of 2016, this journal uses article numbers instead of page numbers. See further details here.